Loganville borough, PA Map & Demographics
Loganville borough Overview
$41,088
PER CAPITA INCOME
$104,167
AVG FAMILY INCOME
$92,050
AVG HOUSEHOLD INCOME
38.7%
WAGE / INCOME GAP [ % ]
61.3¢/ $1
WAGE / INCOME GAP [ $ ]
0.35
INEQUALITY / GINI INDEX
1,563
TOTAL POPULATION
814
MALE POPULATION
749
FEMALE POPULATION
108.68
MALES / 100 FEMALES
92.01
FEMALES / 100 MALES
35.6
MEDIAN AGE
3.3
AVG FAMILY SIZE
2.9
AVG HOUSEHOLD SIZE
990
LABOR FORCE [ PEOPLE ]
77.5%
PERCENT IN LABOR FORCE
4.7%
UNEMPLOYMENT RATE
Income in Loganville borough
Income Overview in Loganville borough
Per Capita Income in Loganville borough is $41,088, while median incomes of families and households are $104,167 and $92,050 respectively.
| Characteristic | Number | Measure |
| Per Capita Income | 1,563 | $41,088 |
| Median Family Income | 388 | $104,167 |
| Mean Family Income | 388 | $132,593 |
| Median Household Income | 545 | $92,050 |
| Mean Household Income | 545 | $116,682 |
| Income Deficit | 388 | $0 |
| Wage / Income Gap (%) | 1,563 | 38.69% |
| Wage / Income Gap ($) | 1,563 | 61.31¢ per $1 |
| Gini / Inequality Index | 1,563 | 0.35 |
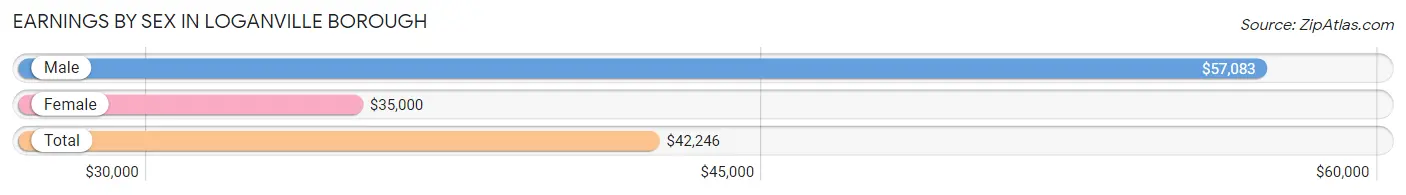
Earnings by Sex in Loganville borough
Average Earnings in Loganville borough are $42,246, $57,083 for men and $35,000 for women, a difference of 38.7%.
| Sex | Number | Average Earnings |
| Male | 504 (49.1%) | $57,083 |
| Female | 522 (50.9%) | $35,000 |
| Total | 1,026 (100.0%) | $42,246 |
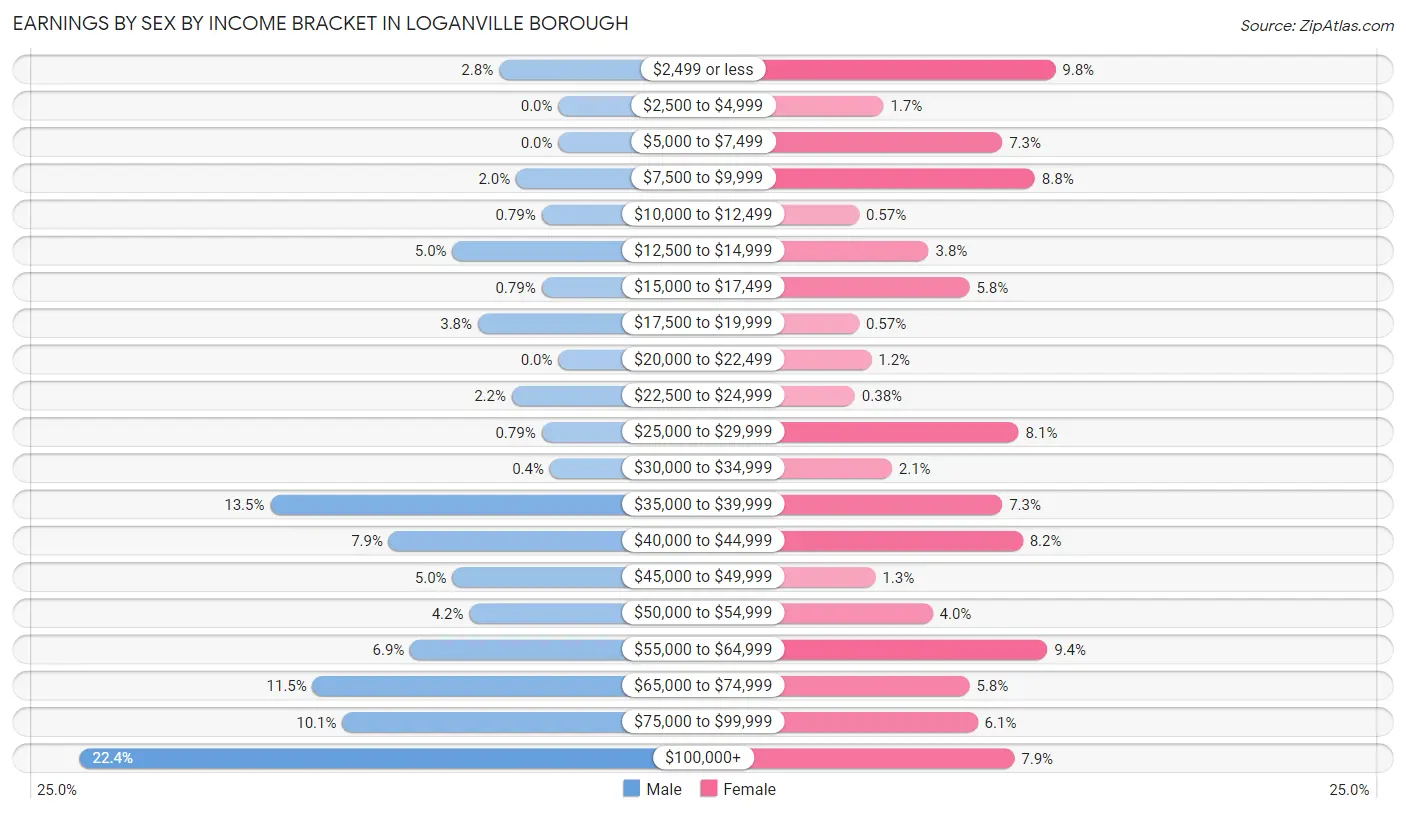
Earnings by Sex by Income Bracket in Loganville borough
The most common earnings brackets in Loganville borough are $100,000+ for men (113 | 22.4%) and $2,499 or less for women (51 | 9.8%).
| Income | Male | Female |
| $2,499 or less | 14 (2.8%) | 51 (9.8%) |
| $2,500 to $4,999 | 0 (0.0%) | 9 (1.7%) |
| $5,000 to $7,499 | 0 (0.0%) | 38 (7.3%) |
| $7,500 to $9,999 | 10 (2.0%) | 46 (8.8%) |
| $10,000 to $12,499 | 4 (0.8%) | 3 (0.6%) |
| $12,500 to $14,999 | 25 (5.0%) | 20 (3.8%) |
| $15,000 to $17,499 | 4 (0.8%) | 30 (5.8%) |
| $17,500 to $19,999 | 19 (3.8%) | 3 (0.6%) |
| $20,000 to $22,499 | 0 (0.0%) | 6 (1.1%) |
| $22,500 to $24,999 | 11 (2.2%) | 2 (0.4%) |
| $25,000 to $29,999 | 4 (0.8%) | 42 (8.1%) |
| $30,000 to $34,999 | 2 (0.4%) | 11 (2.1%) |
| $35,000 to $39,999 | 68 (13.5%) | 38 (7.3%) |
| $40,000 to $44,999 | 40 (7.9%) | 43 (8.2%) |
| $45,000 to $49,999 | 25 (5.0%) | 7 (1.3%) |
| $50,000 to $54,999 | 21 (4.2%) | 21 (4.0%) |
| $55,000 to $64,999 | 35 (6.9%) | 49 (9.4%) |
| $65,000 to $74,999 | 58 (11.5%) | 30 (5.8%) |
| $75,000 to $99,999 | 51 (10.1%) | 32 (6.1%) |
| $100,000+ | 113 (22.4%) | 41 (7.9%) |
| Total | 504 (100.0%) | 522 (100.0%) |
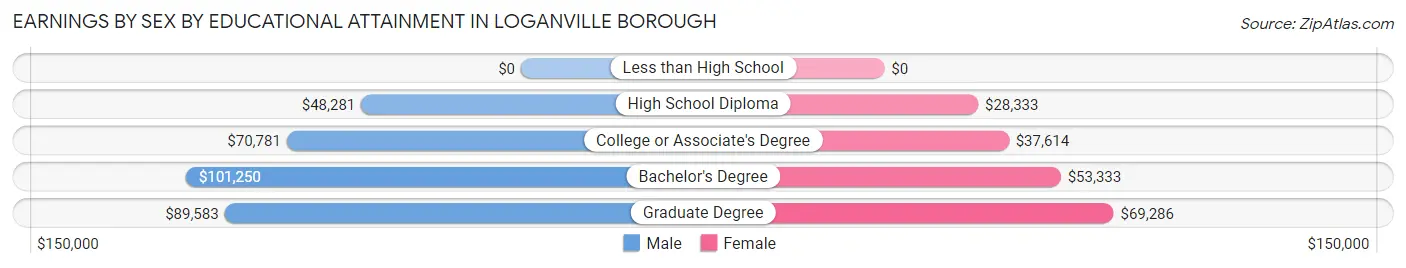
Earnings by Sex by Educational Attainment in Loganville borough
Average earnings in Loganville borough are $67,014 for men and $39,483 for women, a difference of 41.1%. Men with an educational attainment of bachelor's degree enjoy the highest average annual earnings of $101,250, while those with high school diploma education earn the least with $48,281. Women with an educational attainment of graduate degree earn the most with the average annual earnings of $69,286, while those with high school diploma education have the smallest earnings of $28,333.
| Educational Attainment | Male Income | Female Income |
| Less than High School | - | - |
| High School Diploma | $48,281 | $28,333 |
| College or Associate's Degree | $70,781 | $37,614 |
| Bachelor's Degree | $101,250 | $53,333 |
| Graduate Degree | $89,583 | $69,286 |
| Total | $67,014 | $39,483 |
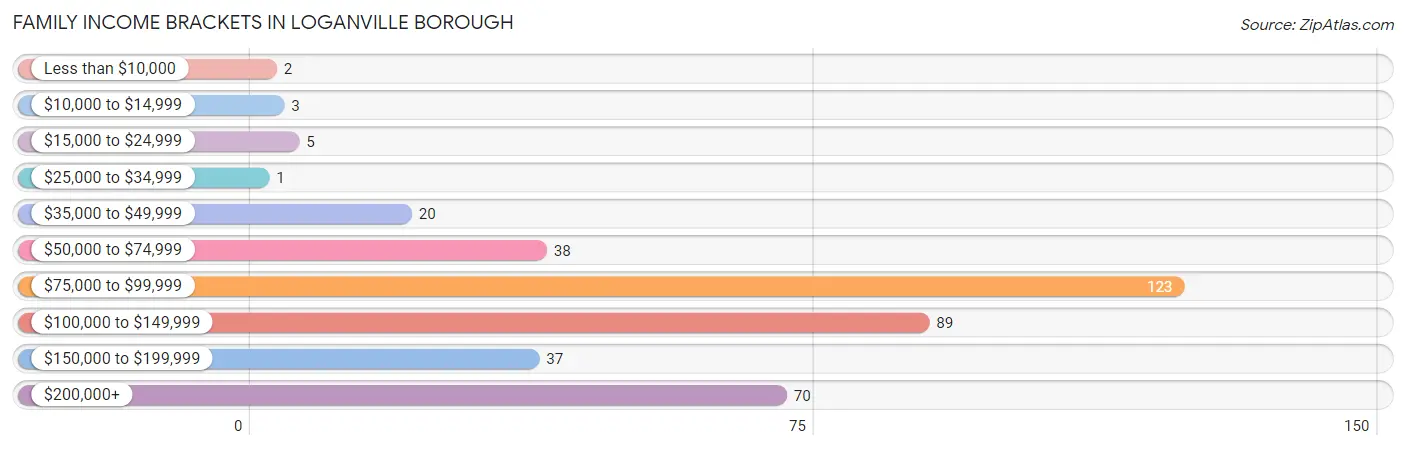
Family Income in Loganville borough
Family Income Brackets in Loganville borough
According to the Loganville borough family income data, there are 123 families falling into the $75,000 to $99,999 income range, which is the most common income bracket and makes up 31.7% of all families. Conversely, the $25,000 to $34,999 income bracket is the least frequent group with only 1 families (0.3%) belonging to this category.
| Income Bracket | # Families | % Families |
| Less than $10,000 | 2 | 0.5% |
| $10,000 to $14,999 | 3 | 0.8% |
| $15,000 to $24,999 | 5 | 1.3% |
| $25,000 to $34,999 | 1 | 0.3% |
| $35,000 to $49,999 | 20 | 5.2% |
| $50,000 to $74,999 | 38 | 9.8% |
| $75,000 to $99,999 | 123 | 31.7% |
| $100,000 to $149,999 | 89 | 22.9% |
| $150,000 to $199,999 | 37 | 9.5% |
| $200,000+ | 70 | 18.0% |
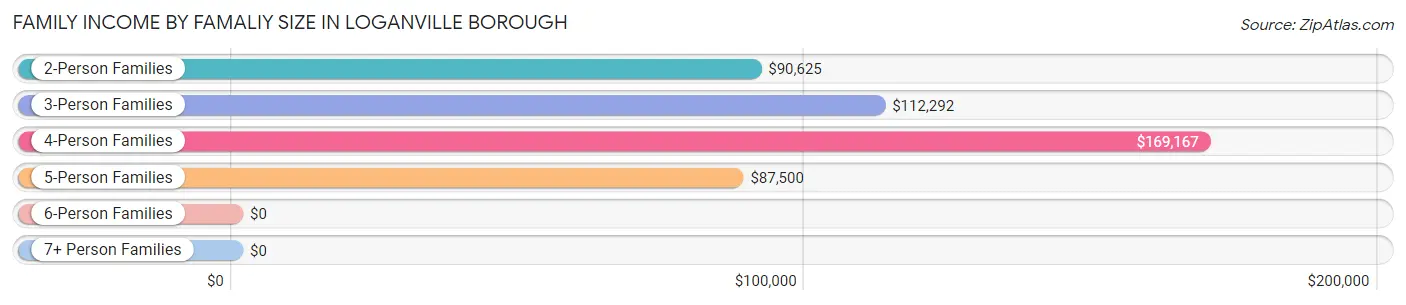
Family Income by Famaliy Size in Loganville borough
4-person families (82 | 21.1%) account for the highest median family income in Loganville borough with $169,167 per family, while 2-person families (153 | 39.4%) have the highest median income of $45,312 per family member.
| Income Bracket | # Families | Median Income |
| 2-Person Families | 153 (39.4%) | $90,625 |
| 3-Person Families | 61 (15.7%) | $112,292 |
| 4-Person Families | 82 (21.1%) | $169,167 |
| 5-Person Families | 82 (21.1%) | $87,500 |
| 6-Person Families | 4 (1.0%) | $0 |
| 7+ Person Families | 6 (1.5%) | $0 |
| Total | 388 (100.0%) | $104,167 |
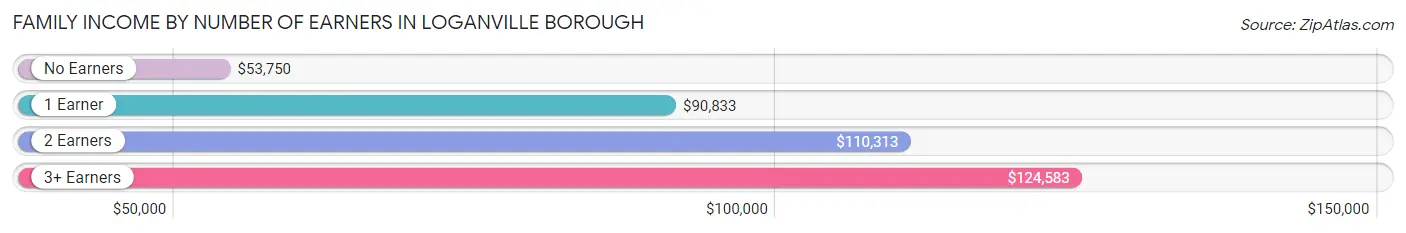
Family Income by Number of Earners in Loganville borough
The median family income in Loganville borough is $104,167, with families comprising 3+ earners (115) having the highest median family income of $124,583, while families with no earners (13) have the lowest median family income of $53,750, accounting for 29.6% and 3.4% of families, respectively.
| Number of Earners | # Families | Median Income |
| No Earners | 13 (3.4%) | $53,750 |
| 1 Earner | 90 (23.2%) | $90,833 |
| 2 Earners | 170 (43.8%) | $110,313 |
| 3+ Earners | 115 (29.6%) | $124,583 |
| Total | 388 (100.0%) | $104,167 |
Household Income in Loganville borough
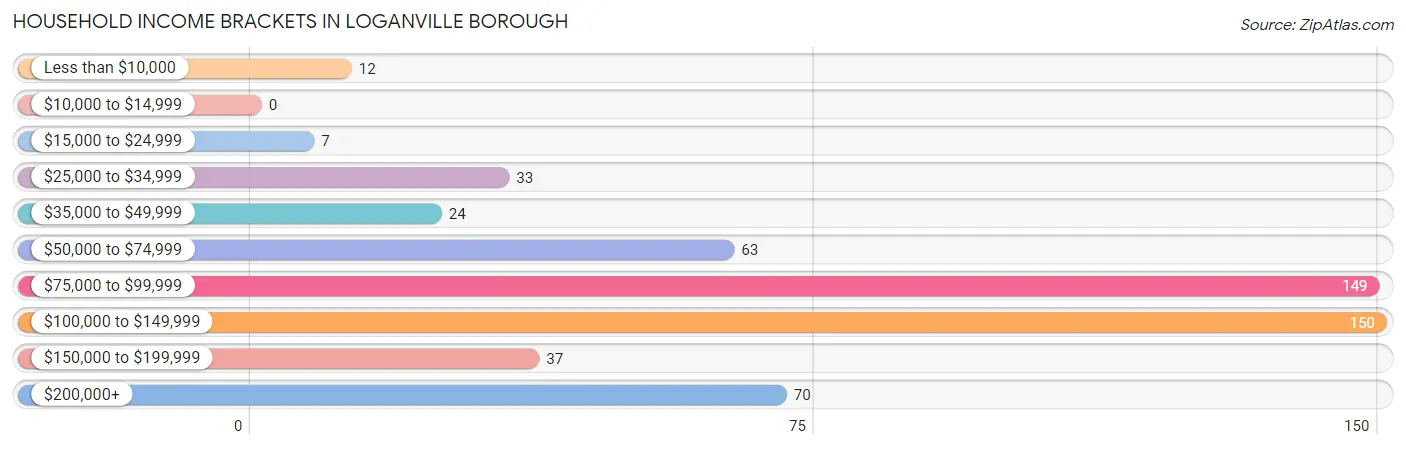
Household Income Brackets in Loganville borough
With 150 households falling in the category, the $100,000 to $149,999 income range is the most frequent in Loganville borough, accounting for 27.5% of all households.
| Income Bracket | # Households | % Households |
| Less than $10,000 | 12 | 2.2% |
| $10,000 to $14,999 | 0 | 0.0% |
| $15,000 to $24,999 | 7 | 1.3% |
| $25,000 to $34,999 | 33 | 6.1% |
| $35,000 to $49,999 | 24 | 4.4% |
| $50,000 to $74,999 | 63 | 11.6% |
| $75,000 to $99,999 | 149 | 27.3% |
| $100,000 to $149,999 | 150 | 27.5% |
| $150,000 to $199,999 | 37 | 6.8% |
| $200,000+ | 70 | 12.8% |
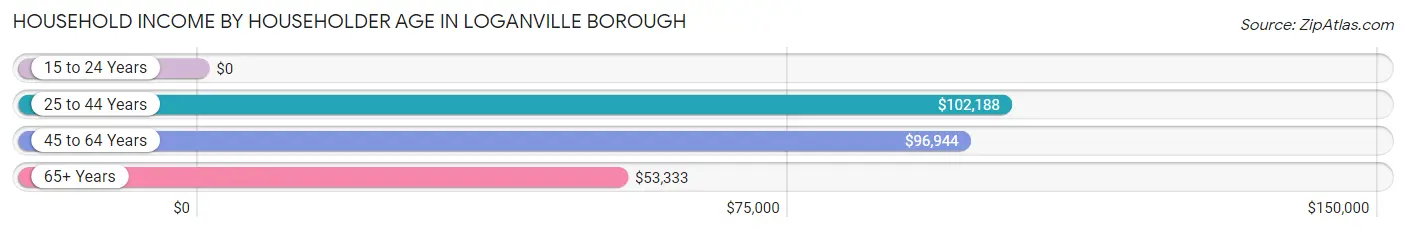
Household Income by Householder Age in Loganville borough
The median household income in Loganville borough is $92,050, with the highest median household income of $102,188 found in the 25 to 44 years age bracket for the primary householder. A total of 176 households (32.3%) fall into this category. Meanwhile, the 15 to 24 years age bracket for the primary householder has the lowest median household income of $0, with 5 households (0.9%) in this group.
| Income Bracket | # Households | Median Income |
| 15 to 24 Years | 5 (0.9%) | $0 |
| 25 to 44 Years | 176 (32.3%) | $102,188 |
| 45 to 64 Years | 300 (55.0%) | $96,944 |
| 65+ Years | 64 (11.7%) | $53,333 |
| Total | 545 (100.0%) | $92,050 |
Poverty in Loganville borough
Income Below Poverty by Sex and Age in Loganville borough
With 2.8% poverty level for males and 4.1% for females among the residents of Loganville borough, 65 to 74 year old males and 12 to 14 year old females are the most vulnerable to poverty, with 4 males (21.0%) and 3 females (16.7%) in their respective age groups living below the poverty level.
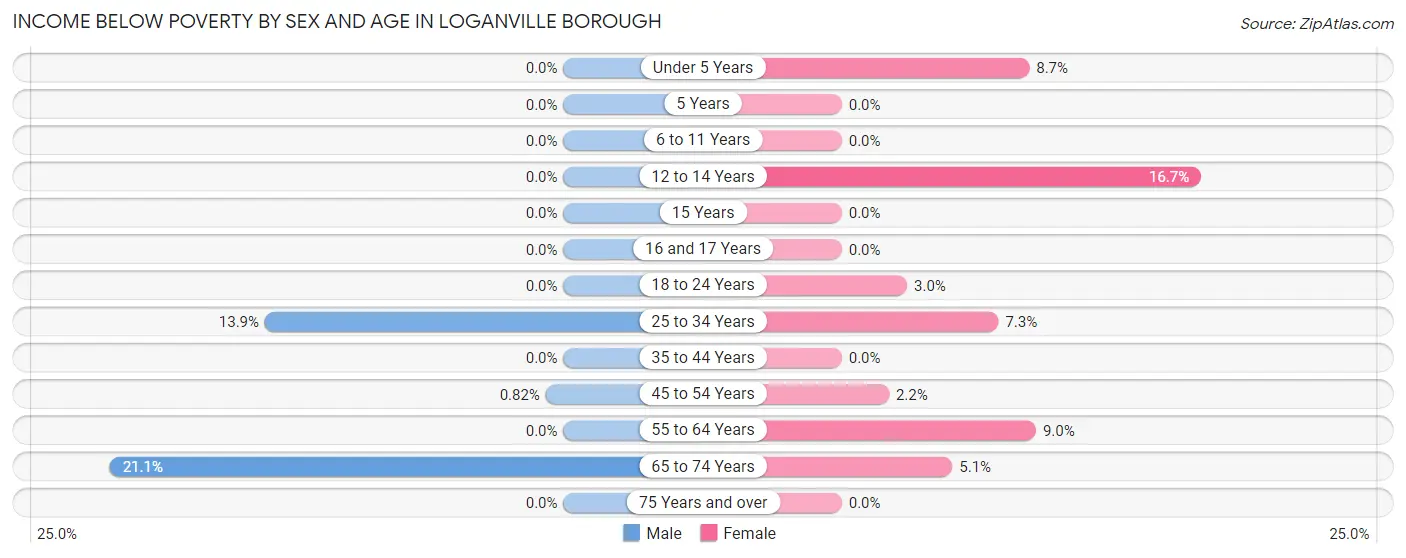
| Age Bracket | Male | Female |
| Under 5 Years | 0 (0.0%) | 2 (8.7%) |
| 5 Years | 0 (0.0%) | 0 (0.0%) |
| 6 to 11 Years | 0 (0.0%) | 0 (0.0%) |
| 12 to 14 Years | 0 (0.0%) | 3 (16.7%) |
| 15 Years | 0 (0.0%) | 0 (0.0%) |
| 16 and 17 Years | 0 (0.0%) | 0 (0.0%) |
| 18 to 24 Years | 0 (0.0%) | 2 (3.0%) |
| 25 to 34 Years | 18 (13.9%) | 8 (7.3%) |
| 35 to 44 Years | 0 (0.0%) | 0 (0.0%) |
| 45 to 54 Years | 1 (0.8%) | 4 (2.2%) |
| 55 to 64 Years | 0 (0.0%) | 10 (9.0%) |
| 65 to 74 Years | 4 (21.0%) | 2 (5.1%) |
| 75 Years and over | 0 (0.0%) | 0 (0.0%) |
| Total | 23 (2.8%) | 31 (4.1%) |
Income Above Poverty by Sex and Age in Loganville borough
According to the poverty statistics in Loganville borough, males aged under 5 years and females aged 5 years are the age groups that are most secure financially, with 100.0% of males and 100.0% of females in these age groups living above the poverty line.
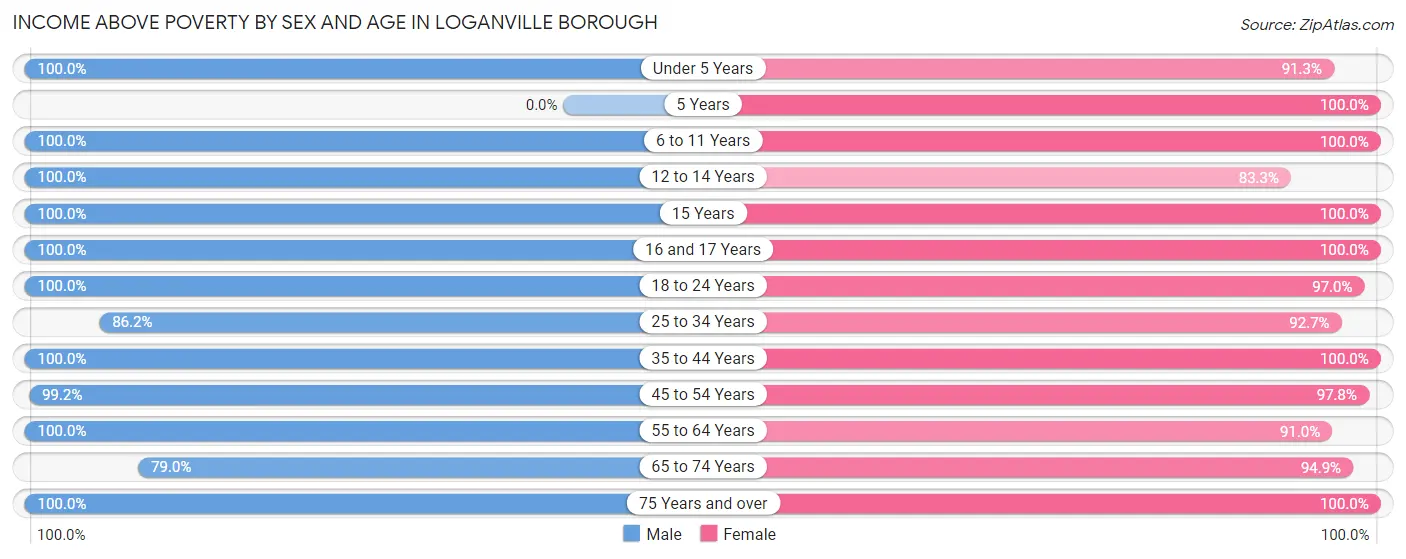
| Age Bracket | Male | Female |
| Under 5 Years | 28 (100.0%) | 21 (91.3%) |
| 5 Years | 0 (0.0%) | 19 (100.0%) |
| 6 to 11 Years | 20 (100.0%) | 27 (100.0%) |
| 12 to 14 Years | 111 (100.0%) | 15 (83.3%) |
| 15 Years | 36 (100.0%) | 3 (100.0%) |
| 16 and 17 Years | 54 (100.0%) | 39 (100.0%) |
| 18 to 24 Years | 84 (100.0%) | 64 (97.0%) |
| 25 to 34 Years | 112 (86.2%) | 102 (92.7%) |
| 35 to 44 Years | 77 (100.0%) | 86 (100.0%) |
| 45 to 54 Years | 121 (99.2%) | 179 (97.8%) |
| 55 to 64 Years | 105 (100.0%) | 101 (91.0%) |
| 65 to 74 Years | 15 (78.9%) | 37 (94.9%) |
| 75 Years and over | 28 (100.0%) | 25 (100.0%) |
| Total | 791 (97.2%) | 718 (95.9%) |
Income Below Poverty Among Married-Couple Families in Loganville borough
The poverty statistics for married-couple families in Loganville borough show that 0.9% or 3 of the total 332 families live below the poverty line. Families with no children have the highest poverty rate of 1.1%, comprising of 2 families. On the other hand, families with 3 or 4 children have the lowest poverty rate of 0.0%, which includes 0 families.
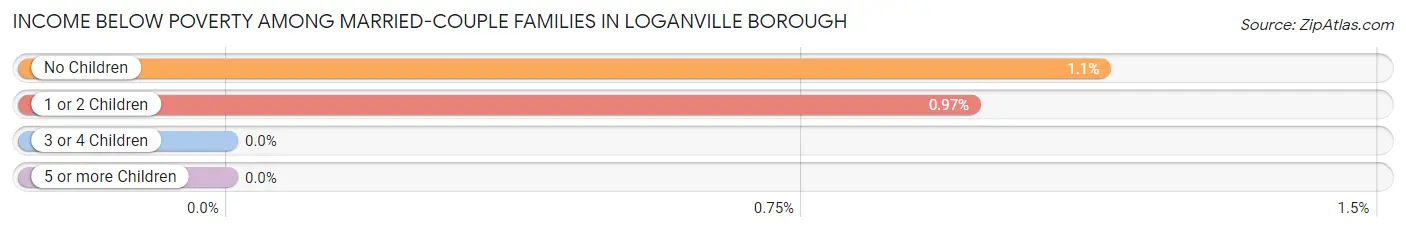
| Children | Above Poverty | Below Poverty |
| No Children | 174 (98.9%) | 2 (1.1%) |
| 1 or 2 Children | 102 (99.0%) | 1 (1.0%) |
| 3 or 4 Children | 47 (100.0%) | 0 (0.0%) |
| 5 or more Children | 6 (100.0%) | 0 (0.0%) |
| Total | 329 (99.1%) | 3 (0.9%) |
Income Below Poverty Among Single-Parent Households in Loganville borough
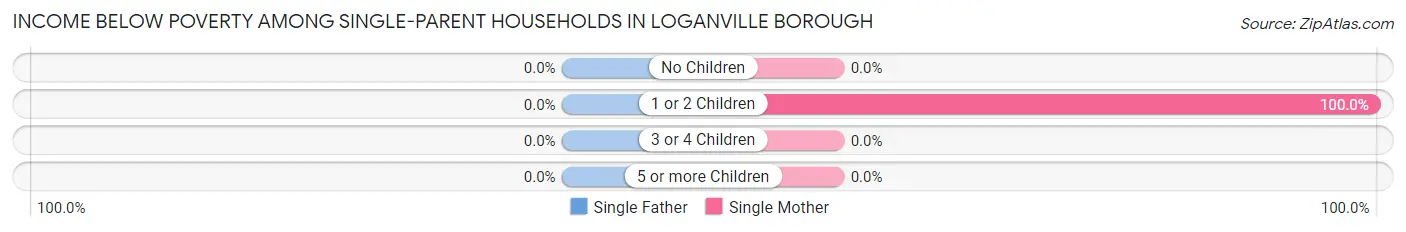
| Children | Single Father | Single Mother |
| No Children | 0 (0.0%) | 0 (0.0%) |
| 1 or 2 Children | 0 (0.0%) | 3 (100.0%) |
| 3 or 4 Children | 0 (0.0%) | 0 (0.0%) |
| 5 or more Children | 0 (0.0%) | 0 (0.0%) |
| Total | 0 (0.0%) | 3 (6.4%) |
Income Below Poverty Among Married-Couple vs Single-Parent Households in Loganville borough
The poverty data for Loganville borough shows that 3 of the married-couple family households (0.9%) and 3 of the single-parent households (5.4%) are living below the poverty level. Within the married-couple family households, those with no children have the highest poverty rate, with 2 households (1.1%) falling below the poverty line. Among the single-parent households, those with 1 or 2 children have the highest poverty rate, with 3 household (42.9%) living below poverty.
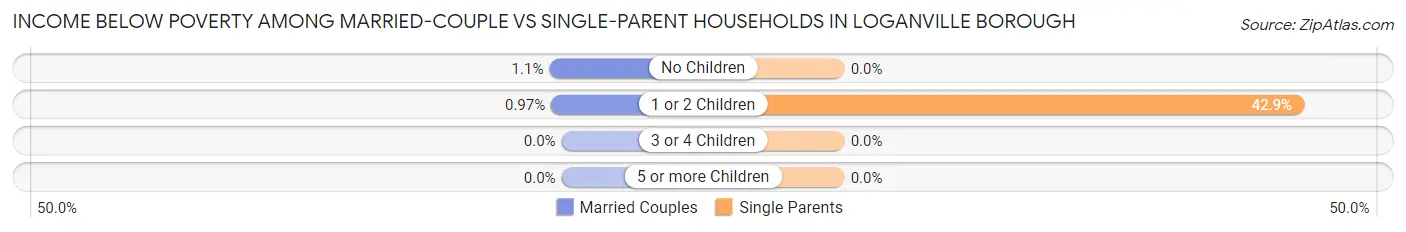
| Children | Married-Couple Families | Single-Parent Households |
| No Children | 2 (1.1%) | 0 (0.0%) |
| 1 or 2 Children | 1 (1.0%) | 3 (42.9%) |
| 3 or 4 Children | 0 (0.0%) | 0 (0.0%) |
| 5 or more Children | 0 (0.0%) | 0 (0.0%) |
| Total | 3 (0.9%) | 3 (5.4%) |
Race in Loganville borough
The most populous races in Loganville borough are White / Caucasian (1,359 | 87.0%), Two or more Races (165 | 10.6%), and Hispanic or Latino (105 | 6.7%).
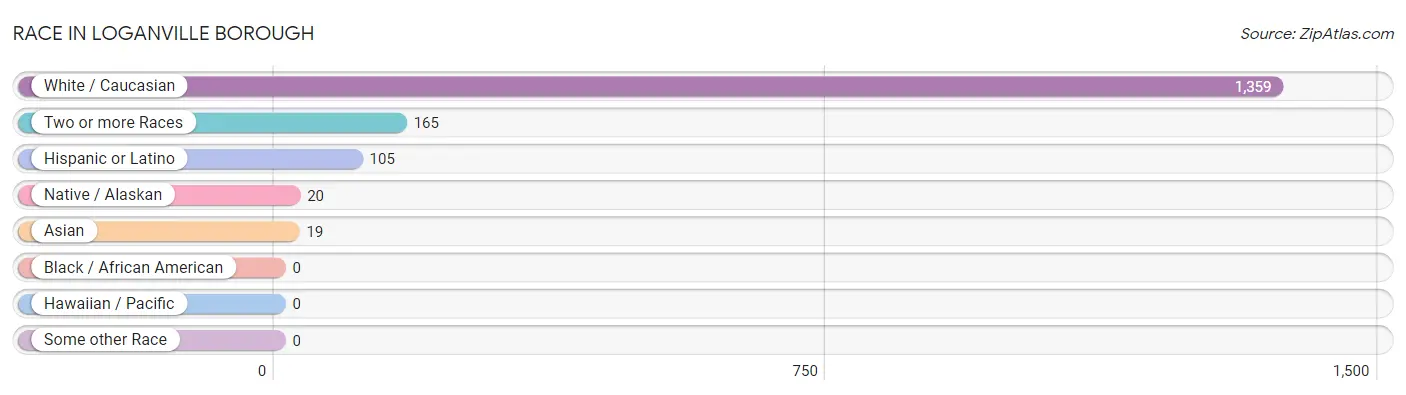
| Race | # Population | % Population |
| Asian | 19 | 1.2% |
| Black / African American | 0 | 0.0% |
| Hawaiian / Pacific | 0 | 0.0% |
| Hispanic or Latino | 105 | 6.7% |
| Native / Alaskan | 20 | 1.3% |
| White / Caucasian | 1,359 | 87.0% |
| Two or more Races | 165 | 10.6% |
| Some other Race | 0 | 0.0% |
| Total | 1,563 | 100.0% |
Ancestry in Loganville borough
The most populous ancestries reported in Loganville borough are German (575 | 36.8%), Irish (223 | 14.3%), English (125 | 8.0%), African (90 | 5.8%), and Subsaharan African (90 | 5.8%), together accounting for 70.6% of all Loganville borough residents.
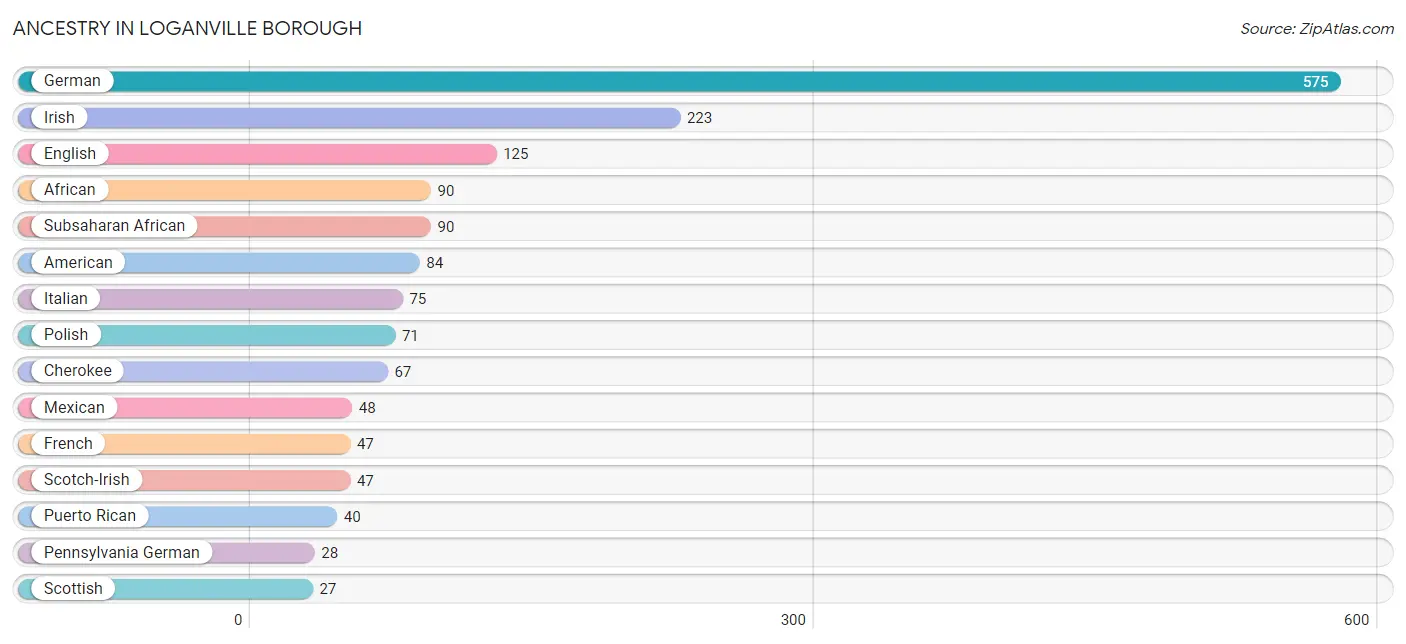
| Ancestry | # Population | % Population |
| African | 90 | 5.8% |
| American | 84 | 5.4% |
| Arab | 5 | 0.3% |
| Bhutanese | 20 | 1.3% |
| Blackfeet | 4 | 0.3% |
| British | 26 | 1.7% |
| Central American | 17 | 1.1% |
| Cherokee | 67 | 4.3% |
| Costa Rican | 17 | 1.1% |
| Croatian | 6 | 0.4% |
| Czech | 12 | 0.8% |
| Czechoslovakian | 5 | 0.3% |
| Dutch | 11 | 0.7% |
| Eastern European | 3 | 0.2% |
| English | 125 | 8.0% |
| European | 8 | 0.5% |
| Finnish | 11 | 0.7% |
| French | 47 | 3.0% |
| French Canadian | 3 | 0.2% |
| German | 575 | 36.8% |
| Greek | 2 | 0.1% |
| Hungarian | 8 | 0.5% |
| Indian (Asian) | 19 | 1.2% |
| Irish | 223 | 14.3% |
| Italian | 75 | 4.8% |
| Lebanese | 5 | 0.3% |
| Mexican | 48 | 3.1% |
| Northern European | 18 | 1.1% |
| Norwegian | 18 | 1.1% |
| Pennsylvania German | 28 | 1.8% |
| Polish | 71 | 4.5% |
| Puerto Rican | 40 | 2.6% |
| Scandinavian | 2 | 0.1% |
| Scotch-Irish | 47 | 3.0% |
| Scottish | 27 | 1.7% |
| Serbian | 2 | 0.1% |
| Subsaharan African | 90 | 5.8% |
| Swedish | 13 | 0.8% |
| Swiss | 3 | 0.2% |
| Thai | 6 | 0.4% |
| Welsh | 8 | 0.5% |
| West Indian | 7 | 0.4% | View All 42 Rows |
Immigrants in Loganville borough
The most numerous immigrant groups reported in Loganville borough came from Asia (19 | 1.2%), Central America (19 | 1.2%), Latin America (19 | 1.2%), China (13 | 0.8%), and Eastern Asia (13 | 0.8%), together accounting for 5.3% of all Loganville borough residents.
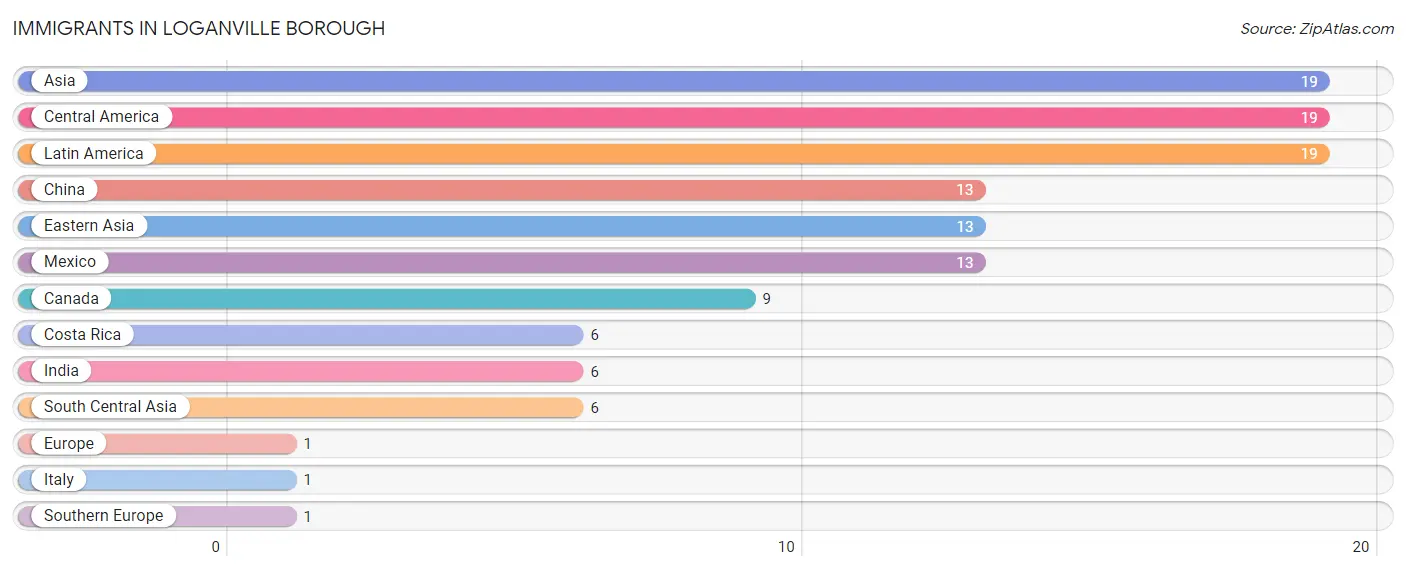
| Immigration Origin | # Population | % Population |
| Asia | 19 | 1.2% |
| Canada | 9 | 0.6% |
| Central America | 19 | 1.2% |
| China | 13 | 0.8% |
| Costa Rica | 6 | 0.4% |
| Eastern Asia | 13 | 0.8% |
| Europe | 1 | 0.1% |
| India | 6 | 0.4% |
| Italy | 1 | 0.1% |
| Latin America | 19 | 1.2% |
| Mexico | 13 | 0.8% |
| South Central Asia | 6 | 0.4% |
| Southern Europe | 1 | 0.1% | View All 13 Rows |
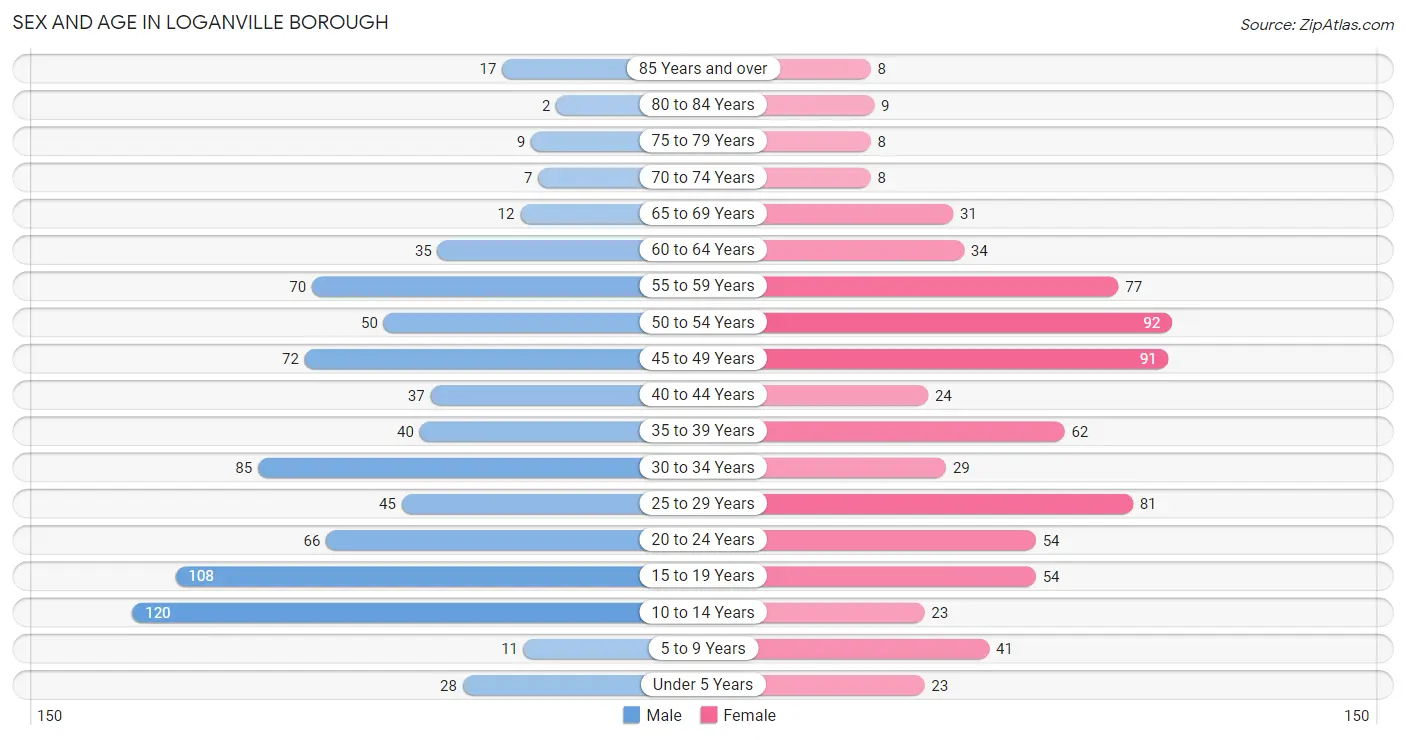
Sex and Age in Loganville borough
Sex and Age in Loganville borough
The most populous age groups in Loganville borough are 10 to 14 Years (120 | 14.7%) for men and 50 to 54 Years (92 | 12.3%) for women.
| Age Bracket | Male | Female |
| Under 5 Years | 28 (3.4%) | 23 (3.1%) |
| 5 to 9 Years | 11 (1.3%) | 41 (5.5%) |
| 10 to 14 Years | 120 (14.7%) | 23 (3.1%) |
| 15 to 19 Years | 108 (13.3%) | 54 (7.2%) |
| 20 to 24 Years | 66 (8.1%) | 54 (7.2%) |
| 25 to 29 Years | 45 (5.5%) | 81 (10.8%) |
| 30 to 34 Years | 85 (10.4%) | 29 (3.9%) |
| 35 to 39 Years | 40 (4.9%) | 62 (8.3%) |
| 40 to 44 Years | 37 (4.5%) | 24 (3.2%) |
| 45 to 49 Years | 72 (8.8%) | 91 (12.1%) |
| 50 to 54 Years | 50 (6.1%) | 92 (12.3%) |
| 55 to 59 Years | 70 (8.6%) | 77 (10.3%) |
| 60 to 64 Years | 35 (4.3%) | 34 (4.5%) |
| 65 to 69 Years | 12 (1.5%) | 31 (4.1%) |
| 70 to 74 Years | 7 (0.9%) | 8 (1.1%) |
| 75 to 79 Years | 9 (1.1%) | 8 (1.1%) |
| 80 to 84 Years | 2 (0.3%) | 9 (1.2%) |
| 85 Years and over | 17 (2.1%) | 8 (1.1%) |
| Total | 814 (100.0%) | 749 (100.0%) |
Families and Households in Loganville borough
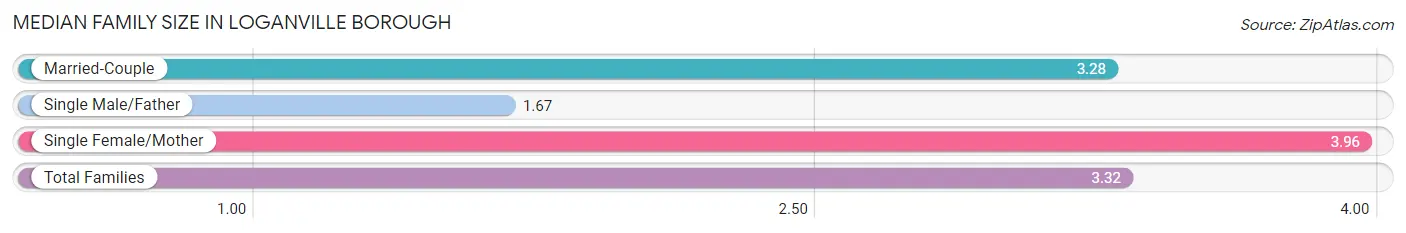
Median Family Size in Loganville borough
The median family size in Loganville borough is 3.32 persons per family, with single female/mother families (47 | 12.1%) accounting for the largest median family size of 3.96 persons per family. On the other hand, single male/father families (9 | 2.3%) represent the smallest median family size with 1.67 persons per family.
| Family Type | # Families | Family Size |
| Married-Couple | 332 (85.6%) | 3.28 |
| Single Male/Father | 9 (2.3%) | 1.67 |
| Single Female/Mother | 47 (12.1%) | 3.96 |
| Total Families | 388 (100.0%) | 3.32 |
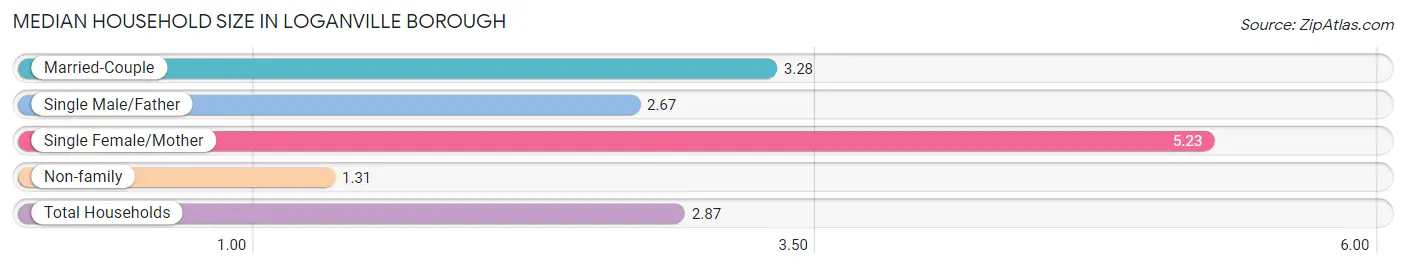
Median Household Size in Loganville borough
The median household size in Loganville borough is 2.87 persons per household, with single female/mother households (47 | 8.6%) accounting for the largest median household size of 5.23 persons per household. non-family households (157 | 28.8%) represent the smallest median household size with 1.31 persons per household.
| Household Type | # Households | Household Size |
| Married-Couple | 332 (60.9%) | 3.28 |
| Single Male/Father | 9 (1.7%) | 2.67 |
| Single Female/Mother | 47 (8.6%) | 5.23 |
| Non-family | 157 (28.8%) | 1.31 |
| Total Households | 545 (100.0%) | 2.87 |
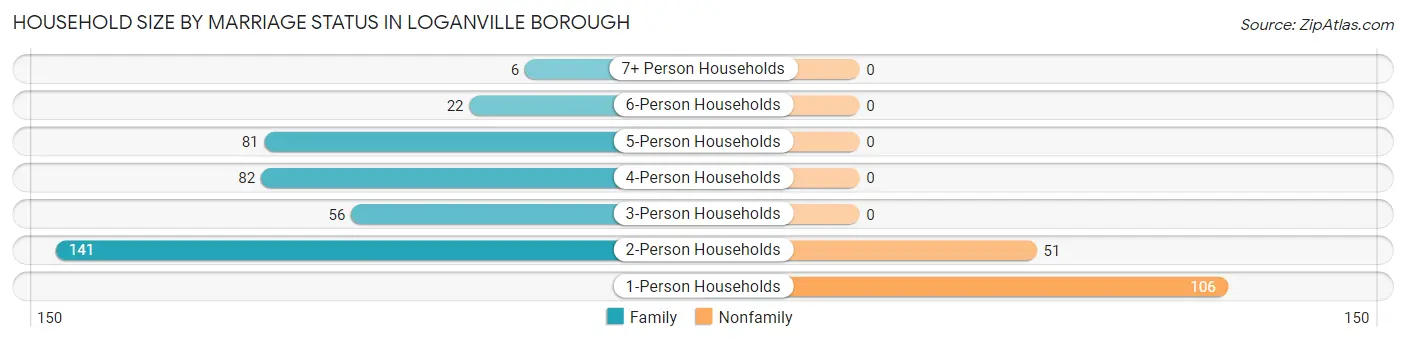
Household Size by Marriage Status in Loganville borough
Out of a total of 545 households in Loganville borough, 388 (71.2%) are family households, while 157 (28.8%) are nonfamily households. The most numerous type of family households are 2-person households, comprising 141, and the most common type of nonfamily households are 1-person households, comprising 106.
| Household Size | Family Households | Nonfamily Households |
| 1-Person Households | - | 106 (19.5%) |
| 2-Person Households | 141 (25.9%) | 51 (9.4%) |
| 3-Person Households | 56 (10.3%) | 0 (0.0%) |
| 4-Person Households | 82 (15.0%) | 0 (0.0%) |
| 5-Person Households | 81 (14.9%) | 0 (0.0%) |
| 6-Person Households | 22 (4.0%) | 0 (0.0%) |
| 7+ Person Households | 6 (1.1%) | 0 (0.0%) |
| Total | 388 (71.2%) | 157 (28.8%) |
Female Fertility in Loganville borough
Fertility by Age in Loganville borough
Average fertility rate in Loganville borough is 49.0 births per 1,000 women. Women in the age bracket of 20 to 34 years have the highest fertility rate with 73.0 births per 1,000 women. Women in the age bracket of 20 to 34 years acount for 60.0% of all women with births.
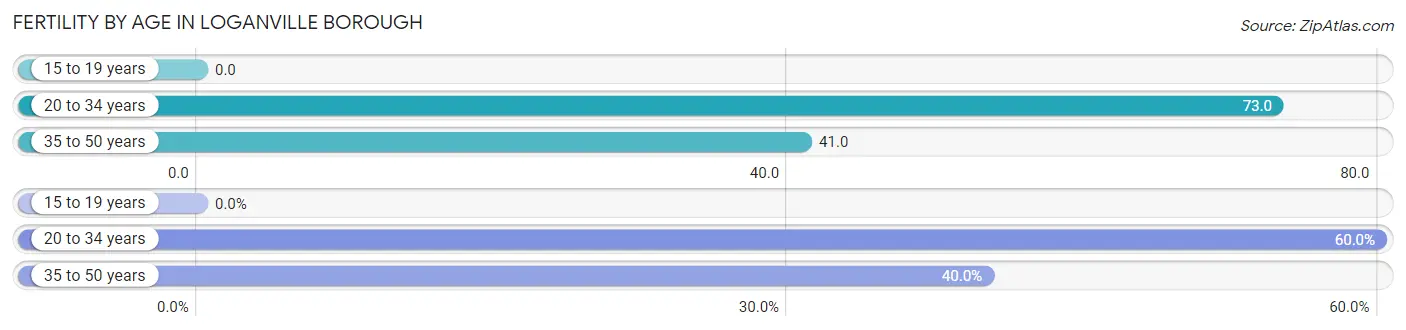
| Age Bracket | Women with Births | Births / 1,000 Women |
| 15 to 19 years | 0 (0.0%) | 0.0 |
| 20 to 34 years | 12 (60.0%) | 73.0 |
| 35 to 50 years | 8 (40.0%) | 41.0 |
| Total | 20 (100.0%) | 49.0 |
Fertility by Age by Marriage Status in Loganville borough
90.0% of women with births (20) in Loganville borough are married. The highest percentage of unmarried women with births falls into 20 to 34 years age bracket with 16.7% of them unmarried at the time of birth, while the lowest percentage of unmarried women with births belong to 35 to 50 years age bracket with 0.0% of them unmarried.
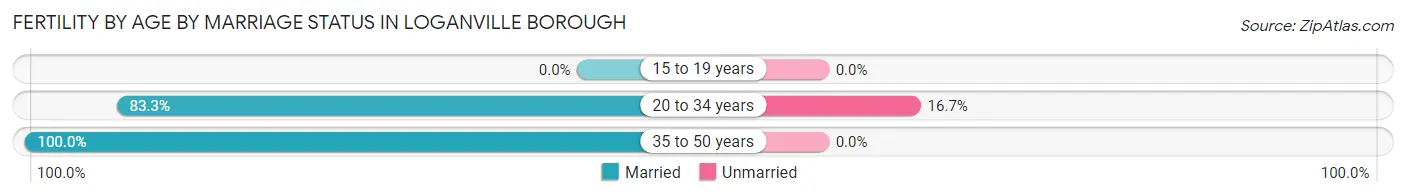
| Age Bracket | Married | Unmarried |
| 15 to 19 years | 0 (0.0%) | 0 (0.0%) |
| 20 to 34 years | 10 (83.3%) | 2 (16.7%) |
| 35 to 50 years | 8 (100.0%) | 0 (0.0%) |
| Total | 18 (90.0%) | 2 (10.0%) |
Fertility by Education in Loganville borough
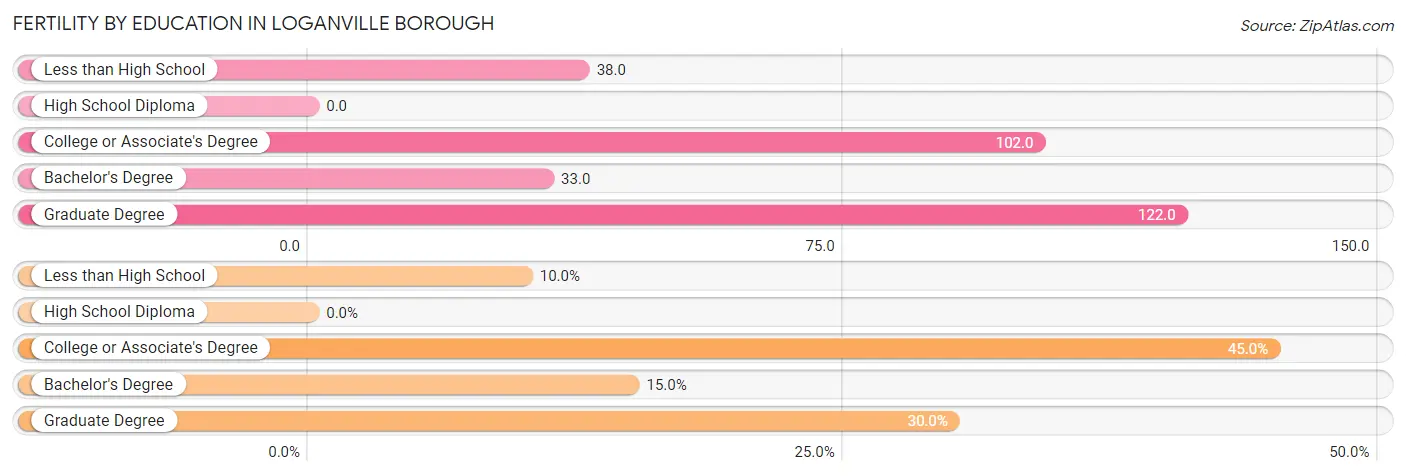
| Educational Attainment | Women with Births | Births / 1,000 Women |
| Less than High School | 2 (10.0%) | 38.0 |
| High School Diploma | 0 (0.0%) | 0.0 |
| College or Associate's Degree | 9 (45.0%) | 102.0 |
| Bachelor's Degree | 3 (15.0%) | 33.0 |
| Graduate Degree | 6 (30.0%) | 122.0 |
| Total | 20 (100.0%) | 49.0 |
Fertility by Education by Marriage Status in Loganville borough
10.0% of women with births in Loganville borough are unmarried. Women with the educational attainment of college or associate's degree are most likely to be married with 100.0% of them married at childbirth, while women with the educational attainment of less than high school are least likely to be married with 100.0% of them unmarried at childbirth.
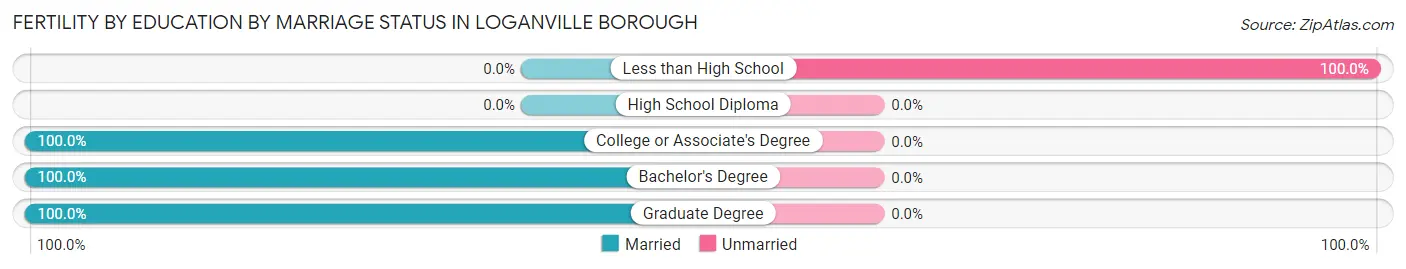
| Educational Attainment | Married | Unmarried |
| Less than High School | 0 (0.0%) | 2 (100.0%) |
| High School Diploma | 0 (0.0%) | 0 (0.0%) |
| College or Associate's Degree | 9 (100.0%) | 0 (0.0%) |
| Bachelor's Degree | 3 (100.0%) | 0 (0.0%) |
| Graduate Degree | 6 (100.0%) | 0 (0.0%) |
| Total | 18 (90.0%) | 2 (10.0%) |
Employment Characteristics in Loganville borough
Employment by Class of Employer in Loganville borough
Among the 903 employed individuals in Loganville borough, private company employees (725 | 80.3%), not-for-profit organizations (56 | 6.2%), and local government employees (44 | 4.9%) make up the most common classes of employment.
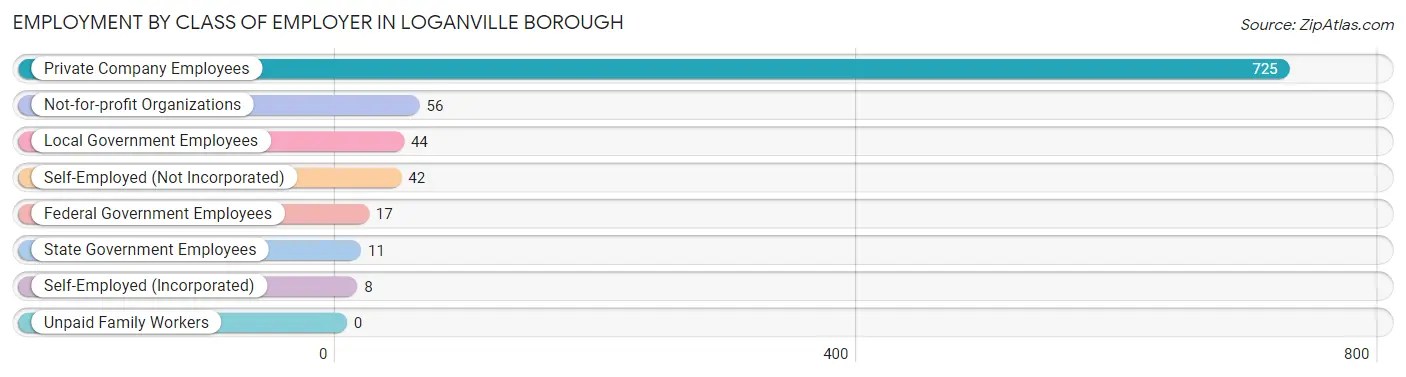
| Employer Class | # Employees | % Employees |
| Private Company Employees | 725 | 80.3% |
| Self-Employed (Incorporated) | 8 | 0.9% |
| Self-Employed (Not Incorporated) | 42 | 4.6% |
| Not-for-profit Organizations | 56 | 6.2% |
| Local Government Employees | 44 | 4.9% |
| State Government Employees | 11 | 1.2% |
| Federal Government Employees | 17 | 1.9% |
| Unpaid Family Workers | 0 | 0.0% |
| Total | 903 | 100.0% |
Employment Status by Age in Loganville borough
According to the labor force statistics for Loganville borough, out of the total population over 16 years of age (1,278), 77.5% or 990 individuals are in the labor force, with 4.7% or 47 of them unemployed. The age group with the highest labor force participation rate is 45 to 54 years, with 94.8% or 289 individuals in the labor force. Within the labor force, the 16 to 19 years age range has the highest percentage of unemployed individuals, with 35.4% or 23 of them being unemployed.
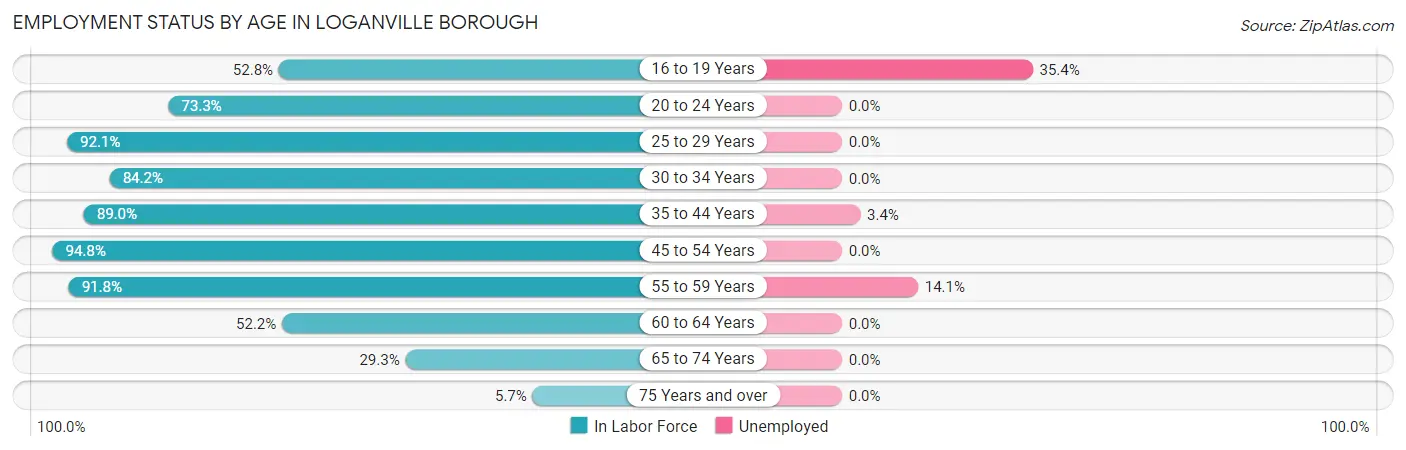
| Age Bracket | In Labor Force | Unemployed |
| 16 to 19 Years | 65 (52.8%) | 23 (35.4%) |
| 20 to 24 Years | 88 (73.3%) | 0 (0.0%) |
| 25 to 29 Years | 116 (92.1%) | 0 (0.0%) |
| 30 to 34 Years | 96 (84.2%) | 0 (0.0%) |
| 35 to 44 Years | 145 (89.0%) | 5 (3.4%) |
| 45 to 54 Years | 289 (94.8%) | 0 (0.0%) |
| 55 to 59 Years | 135 (91.8%) | 19 (14.1%) |
| 60 to 64 Years | 36 (52.2%) | 0 (0.0%) |
| 65 to 74 Years | 17 (29.3%) | 0 (0.0%) |
| 75 Years and over | 3 (5.7%) | 0 (0.0%) |
| Total | 990 (77.5%) | 47 (4.7%) |
Employment Status by Educational Attainment in Loganville borough
According to labor force statistics for Loganville borough, 88.4% of individuals (817) out of the total population between 25 and 64 years of age (924) are in the labor force, with 2.9% or 24 of them being unemployed. The group with the highest labor force participation rate are those with the educational attainment of college / associate degree, with 95.7% or 244 individuals in the labor force. Within the labor force, individuals with high school diploma education have the highest percentage of unemployment, with 9.6% or 24 of them being unemployed.
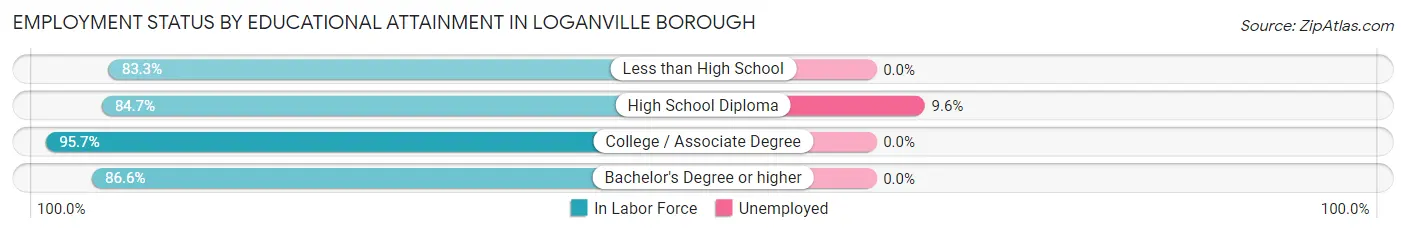
| Educational Attainment | In Labor Force | Unemployed |
| Less than High School | 20 (83.3%) | 0 (0.0%) |
| High School Diploma | 249 (84.7%) | 28 (9.6%) |
| College / Associate Degree | 244 (95.7%) | 0 (0.0%) |
| Bachelor's Degree or higher | 304 (86.6%) | 0 (0.0%) |
| Total | 817 (88.4%) | 27 (2.9%) |
Employment Occupations by Sex in Loganville borough
Management, Business, Science and Arts Occupations
The most common Management, Business, Science and Arts occupations in Loganville borough are Management (121 | 12.8%), Community & Social Service (96 | 10.2%), Business & Financial (94 | 10.0%), Education Instruction & Library (63 | 6.7%), and Health Diagnosing & Treating (63 | 6.7%).
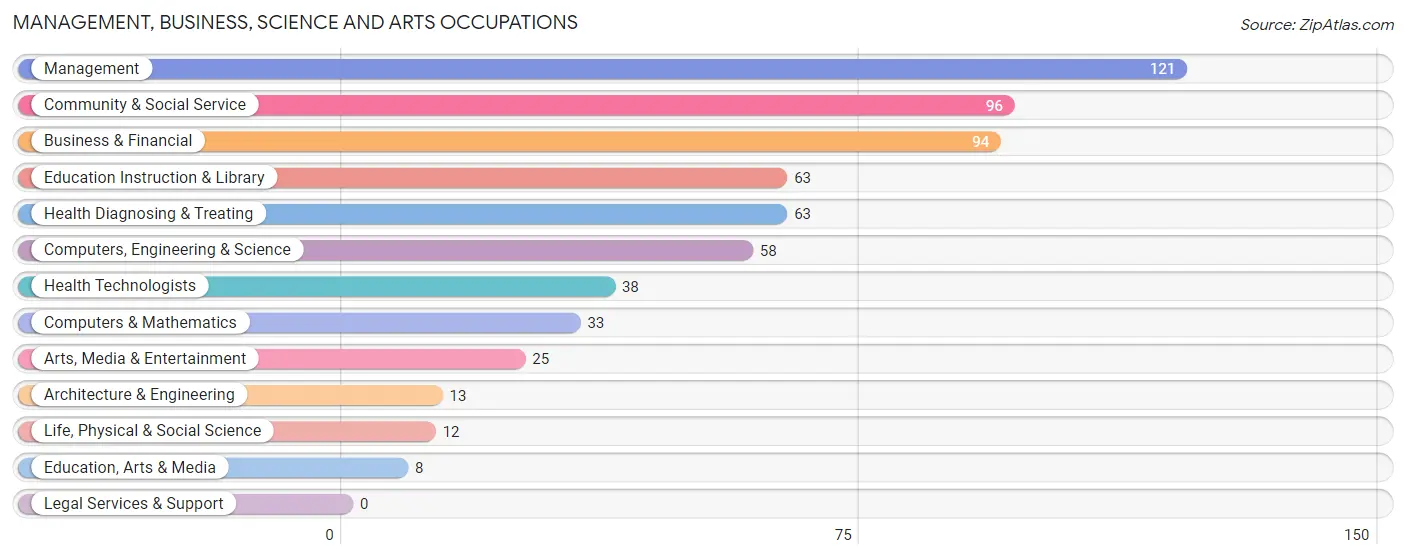
Management, Business, Science and Arts Occupations by Sex
Within the Management, Business, Science and Arts occupations in Loganville borough, the most male-oriented occupations are Computers & Mathematics (100.0%), Computers, Engineering & Science (79.3%), and Arts, Media & Entertainment (76.0%), while the most female-oriented occupations are Education Instruction & Library (100.0%), Health Technologists (100.0%), and Health Diagnosing & Treating (95.2%).
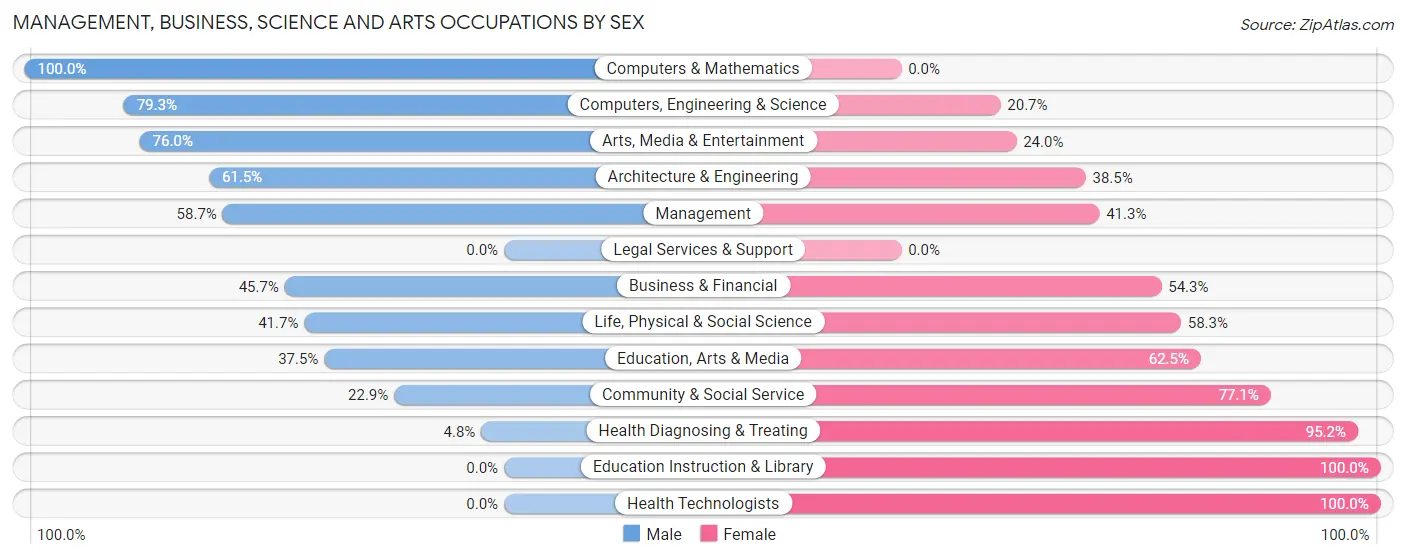
| Occupation | Male | Female |
| Management | 71 (58.7%) | 50 (41.3%) |
| Business & Financial | 43 (45.7%) | 51 (54.3%) |
| Computers, Engineering & Science | 46 (79.3%) | 12 (20.7%) |
| Computers & Mathematics | 33 (100.0%) | 0 (0.0%) |
| Architecture & Engineering | 8 (61.5%) | 5 (38.5%) |
| Life, Physical & Social Science | 5 (41.7%) | 7 (58.3%) |
| Community & Social Service | 22 (22.9%) | 74 (77.1%) |
| Education, Arts & Media | 3 (37.5%) | 5 (62.5%) |
| Legal Services & Support | 0 (0.0%) | 0 (0.0%) |
| Education Instruction & Library | 0 (0.0%) | 63 (100.0%) |
| Arts, Media & Entertainment | 19 (76.0%) | 6 (24.0%) |
| Health Diagnosing & Treating | 3 (4.8%) | 60 (95.2%) |
| Health Technologists | 0 (0.0%) | 38 (100.0%) |
| Total (Category) | 185 (42.8%) | 247 (57.2%) |
| Total (Overall) | 474 (50.3%) | 469 (49.7%) |
Services Occupations
The most common Services occupations in Loganville borough are Food Preparation & Serving (57 | 6.0%), Healthcare Support (36 | 3.8%), Personal Care & Service (31 | 3.3%), Security & Protection (10 | 1.1%), and Law Enforcement (10 | 1.1%).
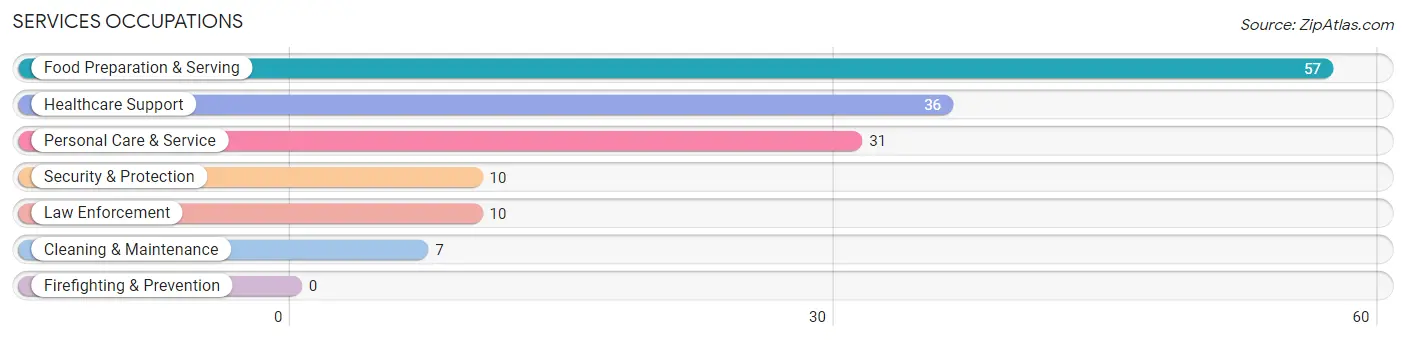
Services Occupations by Sex
Within the Services occupations in Loganville borough, the most male-oriented occupations are Security & Protection (100.0%), Law Enforcement (100.0%), and Food Preparation & Serving (49.1%), while the most female-oriented occupations are Personal Care & Service (100.0%), Cleaning & Maintenance (71.4%), and Healthcare Support (69.4%).
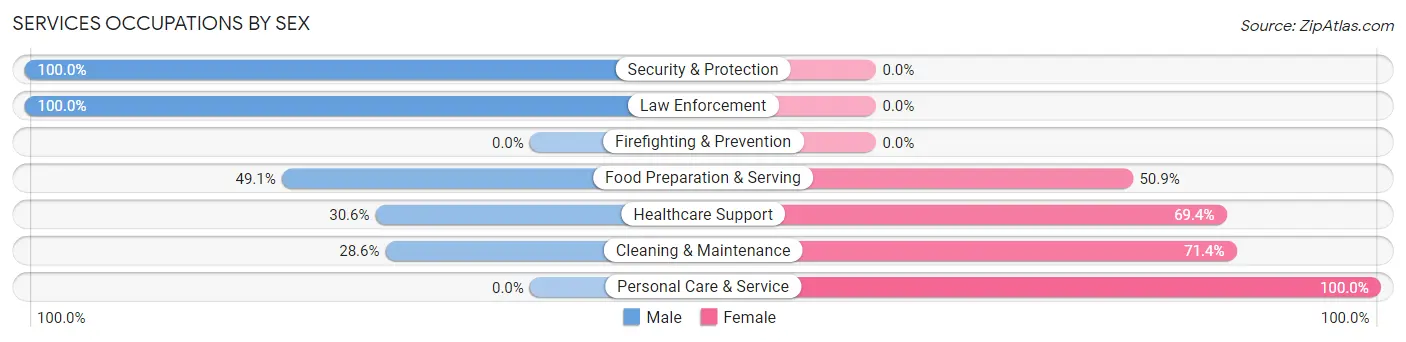
| Occupation | Male | Female |
| Healthcare Support | 11 (30.6%) | 25 (69.4%) |
| Security & Protection | 10 (100.0%) | 0 (0.0%) |
| Firefighting & Prevention | 0 (0.0%) | 0 (0.0%) |
| Law Enforcement | 10 (100.0%) | 0 (0.0%) |
| Food Preparation & Serving | 28 (49.1%) | 29 (50.9%) |
| Cleaning & Maintenance | 2 (28.6%) | 5 (71.4%) |
| Personal Care & Service | 0 (0.0%) | 31 (100.0%) |
| Total (Category) | 51 (36.2%) | 90 (63.8%) |
| Total (Overall) | 474 (50.3%) | 469 (49.7%) |
Sales and Office Occupations
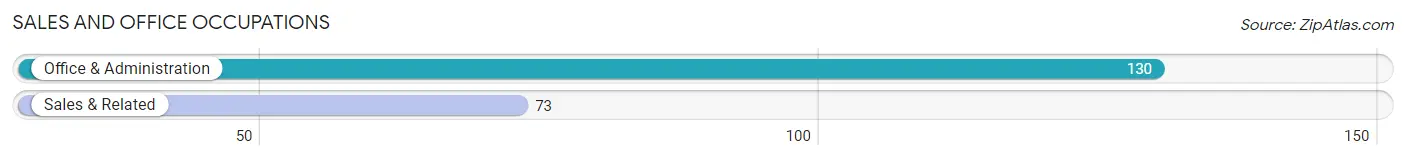
The most common Sales and Office occupations in Loganville borough are Office & Administration (130 | 13.8%), and Sales & Related (73 | 7.7%).
Sales and Office Occupations by Sex
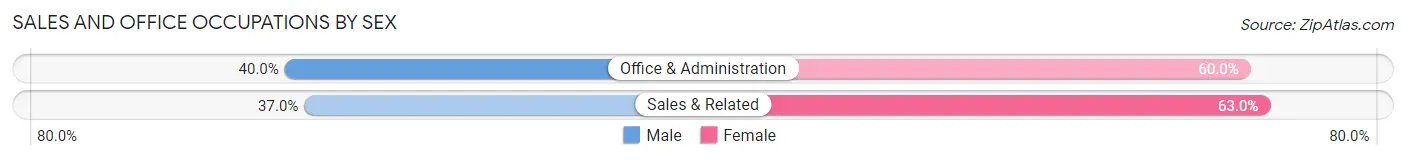
| Occupation | Male | Female |
| Sales & Related | 27 (37.0%) | 46 (63.0%) |
| Office & Administration | 52 (40.0%) | 78 (60.0%) |
| Total (Category) | 79 (38.9%) | 124 (61.1%) |
| Total (Overall) | 474 (50.3%) | 469 (49.7%) |
Natural Resources, Construction and Maintenance Occupations
The most common Natural Resources, Construction and Maintenance occupations in Loganville borough are Installation, Maintenance & Repair (46 | 4.9%), and Construction & Extraction (44 | 4.7%).
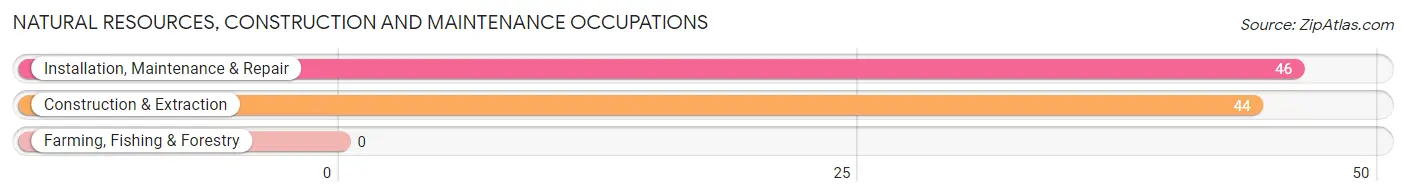
Natural Resources, Construction and Maintenance Occupations by Sex

| Occupation | Male | Female |
| Farming, Fishing & Forestry | 0 (0.0%) | 0 (0.0%) |
| Construction & Extraction | 44 (100.0%) | 0 (0.0%) |
| Installation, Maintenance & Repair | 46 (100.0%) | 0 (0.0%) |
| Total (Category) | 90 (100.0%) | 0 (0.0%) |
| Total (Overall) | 474 (50.3%) | 469 (49.7%) |
Production, Transportation and Moving Occupations
The most common Production, Transportation and Moving occupations in Loganville borough are Material Moving (30 | 3.2%), Production (24 | 2.5%), and Transportation (23 | 2.4%).
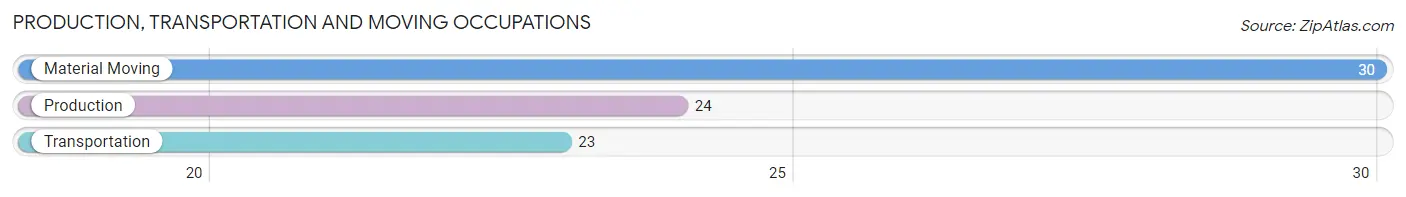
Production, Transportation and Moving Occupations by Sex
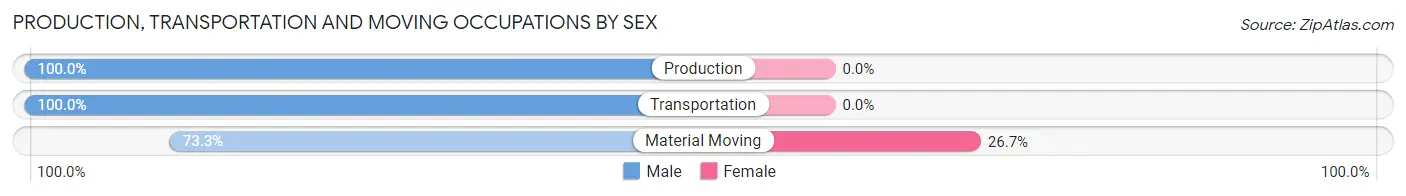
| Occupation | Male | Female |
| Production | 24 (100.0%) | 0 (0.0%) |
| Transportation | 23 (100.0%) | 0 (0.0%) |
| Material Moving | 22 (73.3%) | 8 (26.7%) |
| Total (Category) | 69 (89.6%) | 8 (10.4%) |
| Total (Overall) | 474 (50.3%) | 469 (49.7%) |
Employment Industries by Sex in Loganville borough
Employment Industries in Loganville borough
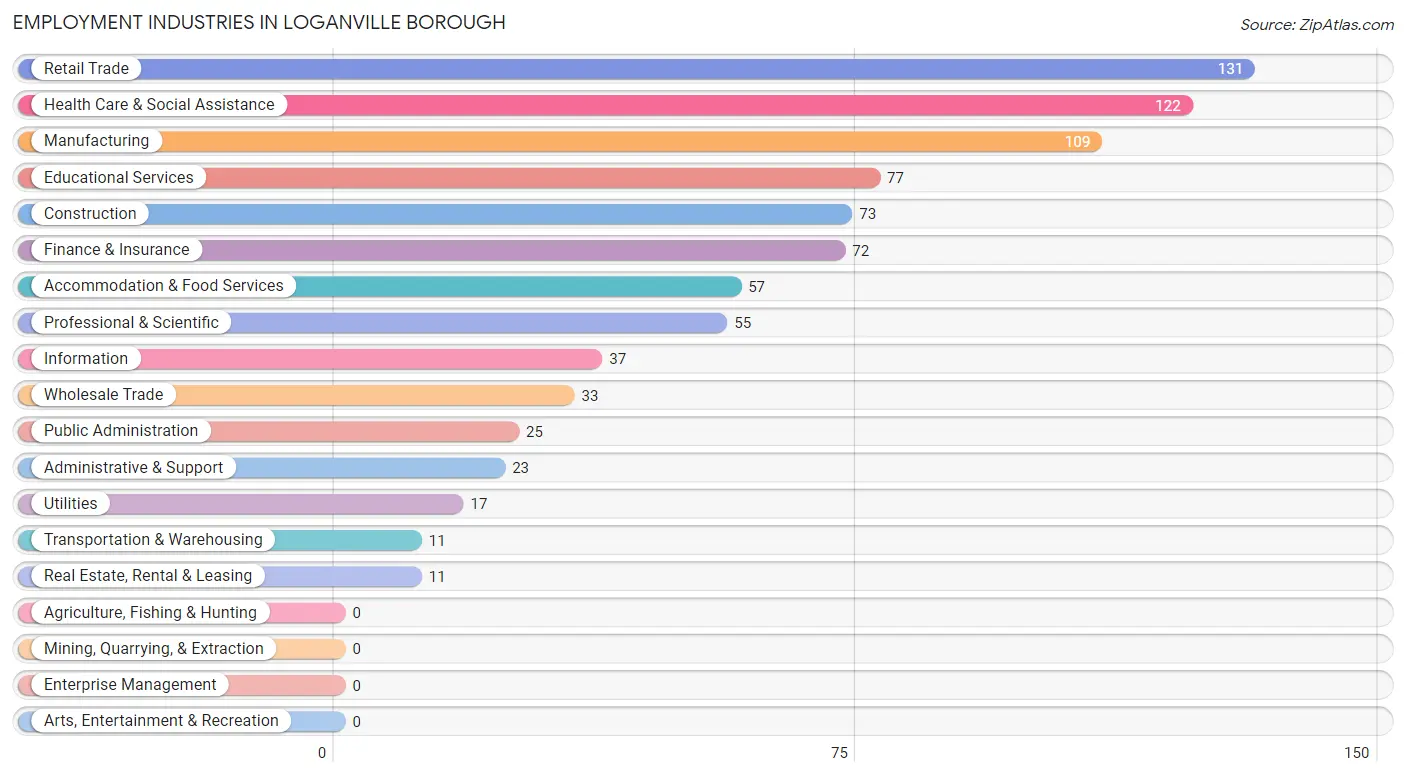
The major employment industries in Loganville borough include Retail Trade (131 | 13.9%), Health Care & Social Assistance (122 | 12.9%), Manufacturing (109 | 11.6%), Educational Services (77 | 8.2%), and Construction (73 | 7.7%).
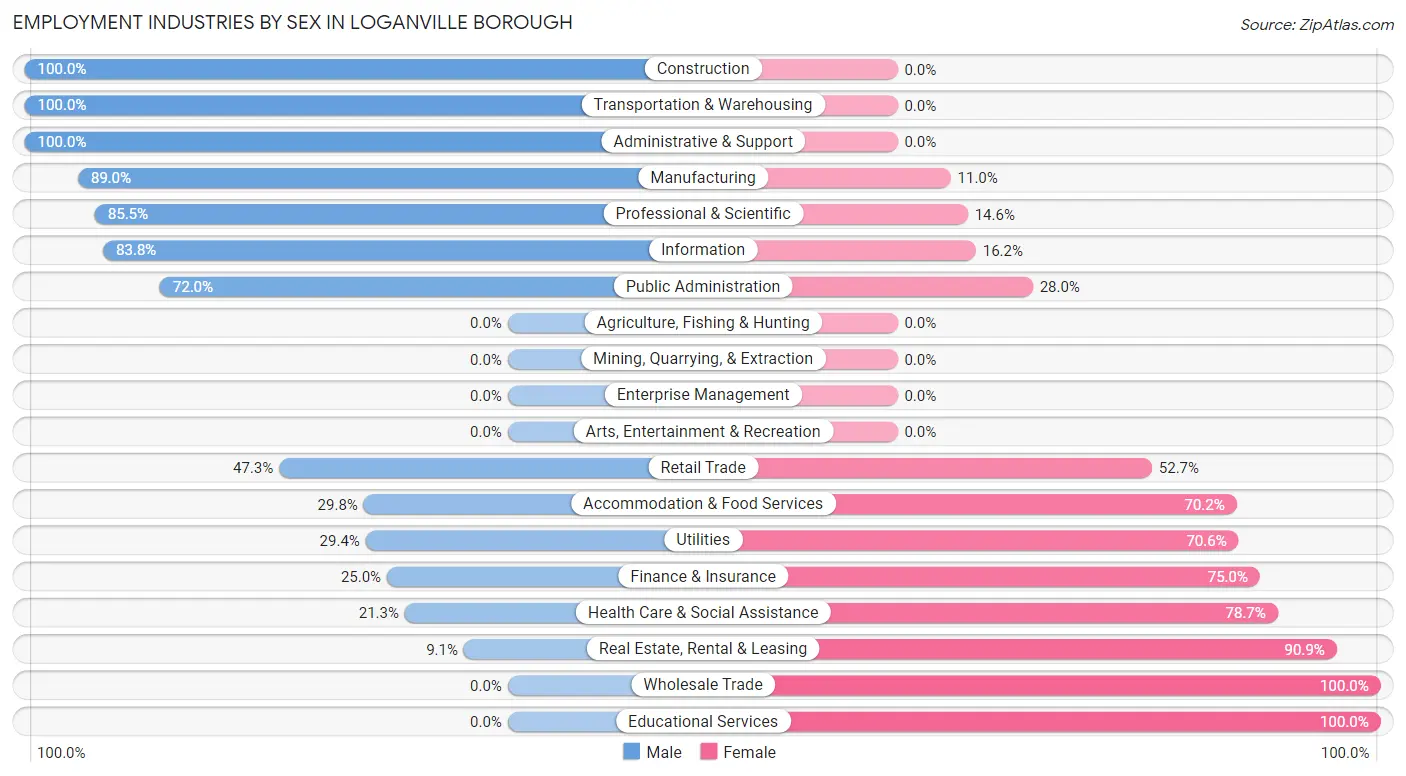
Employment Industries by Sex in Loganville borough
The Loganville borough industries that see more men than women are Construction (100.0%), Transportation & Warehousing (100.0%), and Administrative & Support (100.0%), whereas the industries that tend to have a higher number of women are Wholesale Trade (100.0%), Educational Services (100.0%), and Real Estate, Rental & Leasing (90.9%).
| Industry | Male | Female |
| Agriculture, Fishing & Hunting | 0 (0.0%) | 0 (0.0%) |
| Mining, Quarrying, & Extraction | 0 (0.0%) | 0 (0.0%) |
| Construction | 73 (100.0%) | 0 (0.0%) |
| Manufacturing | 97 (89.0%) | 12 (11.0%) |
| Wholesale Trade | 0 (0.0%) | 33 (100.0%) |
| Retail Trade | 62 (47.3%) | 69 (52.7%) |
| Transportation & Warehousing | 11 (100.0%) | 0 (0.0%) |
| Utilities | 5 (29.4%) | 12 (70.6%) |
| Information | 31 (83.8%) | 6 (16.2%) |
| Finance & Insurance | 18 (25.0%) | 54 (75.0%) |
| Real Estate, Rental & Leasing | 1 (9.1%) | 10 (90.9%) |
| Professional & Scientific | 47 (85.5%) | 8 (14.5%) |
| Enterprise Management | 0 (0.0%) | 0 (0.0%) |
| Administrative & Support | 23 (100.0%) | 0 (0.0%) |
| Educational Services | 0 (0.0%) | 77 (100.0%) |
| Health Care & Social Assistance | 26 (21.3%) | 96 (78.7%) |
| Arts, Entertainment & Recreation | 0 (0.0%) | 0 (0.0%) |
| Accommodation & Food Services | 17 (29.8%) | 40 (70.2%) |
| Public Administration | 18 (72.0%) | 7 (28.0%) |
| Total | 474 (50.3%) | 469 (49.7%) |
Education in Loganville borough
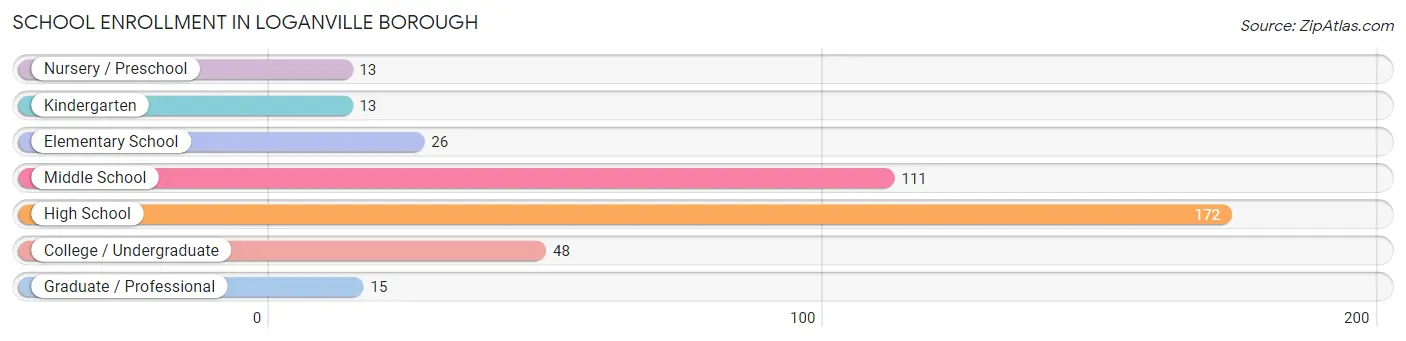
School Enrollment in Loganville borough
The most common levels of schooling among the 398 students in Loganville borough are high school (172 | 43.2%), middle school (111 | 27.9%), and college / undergraduate (48 | 12.1%).
| School Level | # Students | % Students |
| Nursery / Preschool | 13 | 3.3% |
| Kindergarten | 13 | 3.3% |
| Elementary School | 26 | 6.5% |
| Middle School | 111 | 27.9% |
| High School | 172 | 43.2% |
| College / Undergraduate | 48 | 12.1% |
| Graduate / Professional | 15 | 3.8% |
| Total | 398 | 100.0% |
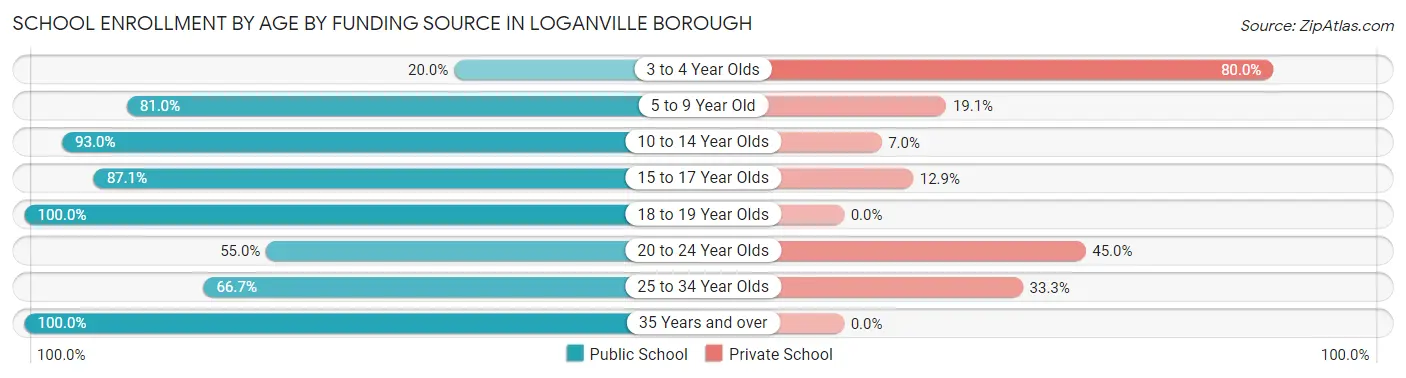
School Enrollment by Age by Funding Source in Loganville borough
Out of a total of 398 students who are enrolled in schools in Loganville borough, 61 (15.3%) attend a private institution, while the remaining 337 (84.7%) are enrolled in public schools. The age group of 3 to 4 year olds has the highest likelihood of being enrolled in private schools, with 8 (80.0% in the age bracket) enrolled. Conversely, the age group of 18 to 19 year olds has the lowest likelihood of being enrolled in a private school, with 16 (100.0% in the age bracket) attending a public institution.
| Age Bracket | Public School | Private School |
| 3 to 4 Year Olds | 2 (20.0%) | 8 (80.0%) |
| 5 to 9 Year Old | 34 (80.9%) | 8 (19.1%) |
| 10 to 14 Year Olds | 133 (93.0%) | 10 (7.0%) |
| 15 to 17 Year Olds | 115 (87.1%) | 17 (12.9%) |
| 18 to 19 Year Olds | 16 (100.0%) | 0 (0.0%) |
| 20 to 24 Year Olds | 11 (55.0%) | 9 (45.0%) |
| 25 to 34 Year Olds | 18 (66.7%) | 9 (33.3%) |
| 35 Years and over | 8 (100.0%) | 0 (0.0%) |
| Total | 337 (84.7%) | 61 (15.3%) |
Educational Attainment by Field of Study in Loganville borough
Engineering (77 | 18.7%), business (76 | 18.5%), science & technology (63 | 15.3%), education (33 | 8.0%), and social sciences (25 | 6.1%) are the most common fields of study among 411 individuals in Loganville borough who have obtained a bachelor's degree or higher.
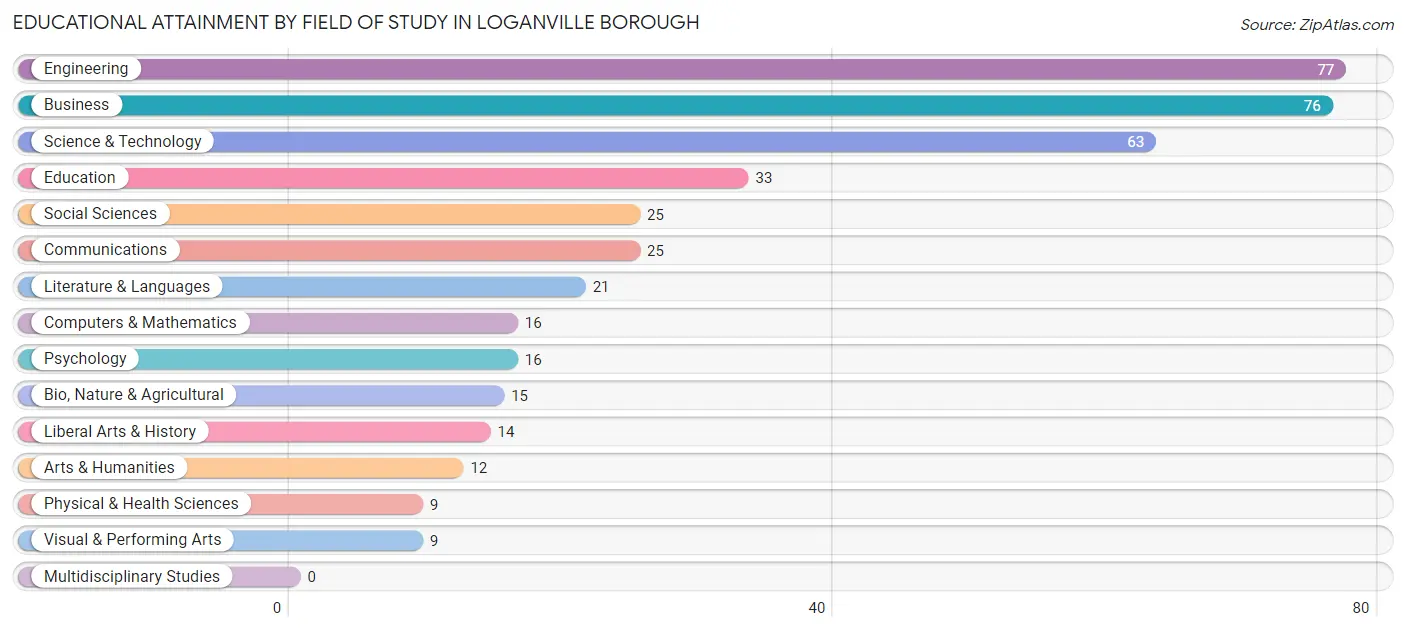
| Field of Study | # Graduates | % Graduates |
| Computers & Mathematics | 16 | 3.9% |
| Bio, Nature & Agricultural | 15 | 3.6% |
| Physical & Health Sciences | 9 | 2.2% |
| Psychology | 16 | 3.9% |
| Social Sciences | 25 | 6.1% |
| Engineering | 77 | 18.7% |
| Multidisciplinary Studies | 0 | 0.0% |
| Science & Technology | 63 | 15.3% |
| Business | 76 | 18.5% |
| Education | 33 | 8.0% |
| Literature & Languages | 21 | 5.1% |
| Liberal Arts & History | 14 | 3.4% |
| Visual & Performing Arts | 9 | 2.2% |
| Communications | 25 | 6.1% |
| Arts & Humanities | 12 | 2.9% |
| Total | 411 | 100.0% |
Transportation & Commute in Loganville borough
Vehicle Availability by Sex in Loganville borough
The most prevalent vehicle ownership categories in Loganville borough are males with 3 vehicles (171, accounting for 36.1%) and females with 3 vehicles (146, making up 39.9%).
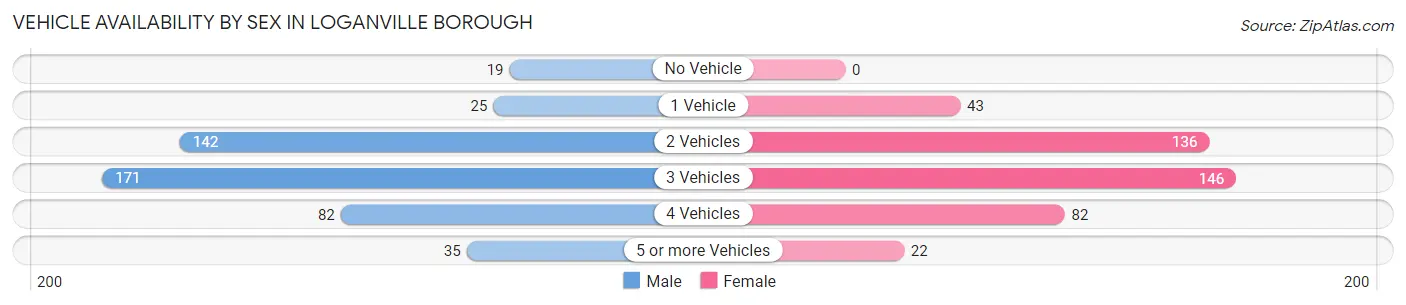
| Vehicles Available | Male | Female |
| No Vehicle | 19 (4.0%) | 0 (0.0%) |
| 1 Vehicle | 25 (5.3%) | 43 (10.0%) |
| 2 Vehicles | 142 (30.0%) | 136 (31.7%) |
| 3 Vehicles | 171 (36.1%) | 146 (34.0%) |
| 4 Vehicles | 82 (17.3%) | 82 (19.1%) |
| 5 or more Vehicles | 35 (7.4%) | 22 (5.1%) |
| Total | 474 (100.0%) | 429 (100.0%) |
Commute Time in Loganville borough
The most frequently occuring commute durations in Loganville borough are 15 to 19 minutes (153 commuters, 18.0%), 45 to 59 minutes (121 commuters, 14.2%), and 30 to 34 minutes (84 commuters, 9.9%).
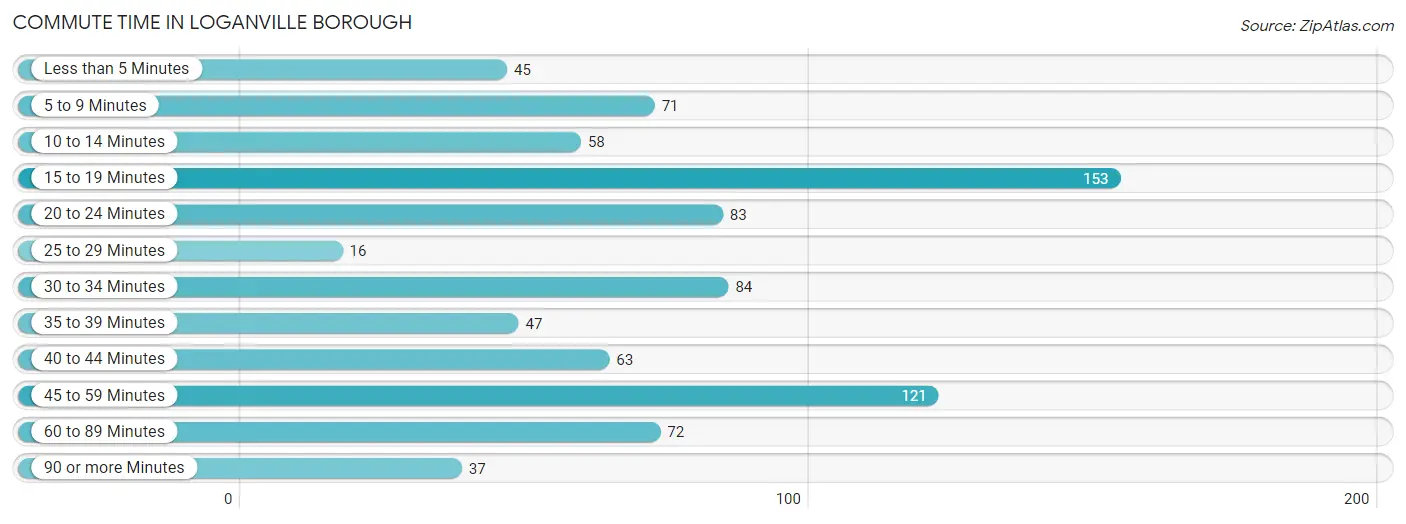
| Commute Time | # Commuters | % Commuters |
| Less than 5 Minutes | 45 | 5.3% |
| 5 to 9 Minutes | 71 | 8.4% |
| 10 to 14 Minutes | 58 | 6.8% |
| 15 to 19 Minutes | 153 | 18.0% |
| 20 to 24 Minutes | 83 | 9.8% |
| 25 to 29 Minutes | 16 | 1.9% |
| 30 to 34 Minutes | 84 | 9.9% |
| 35 to 39 Minutes | 47 | 5.5% |
| 40 to 44 Minutes | 63 | 7.4% |
| 45 to 59 Minutes | 121 | 14.2% |
| 60 to 89 Minutes | 72 | 8.5% |
| 90 or more Minutes | 37 | 4.3% |
Commute Time by Sex in Loganville borough
The most common commute times in Loganville borough are 15 to 19 minutes (78 commuters, 17.8%) for males and 15 to 19 minutes (75 commuters, 18.2%) for females.
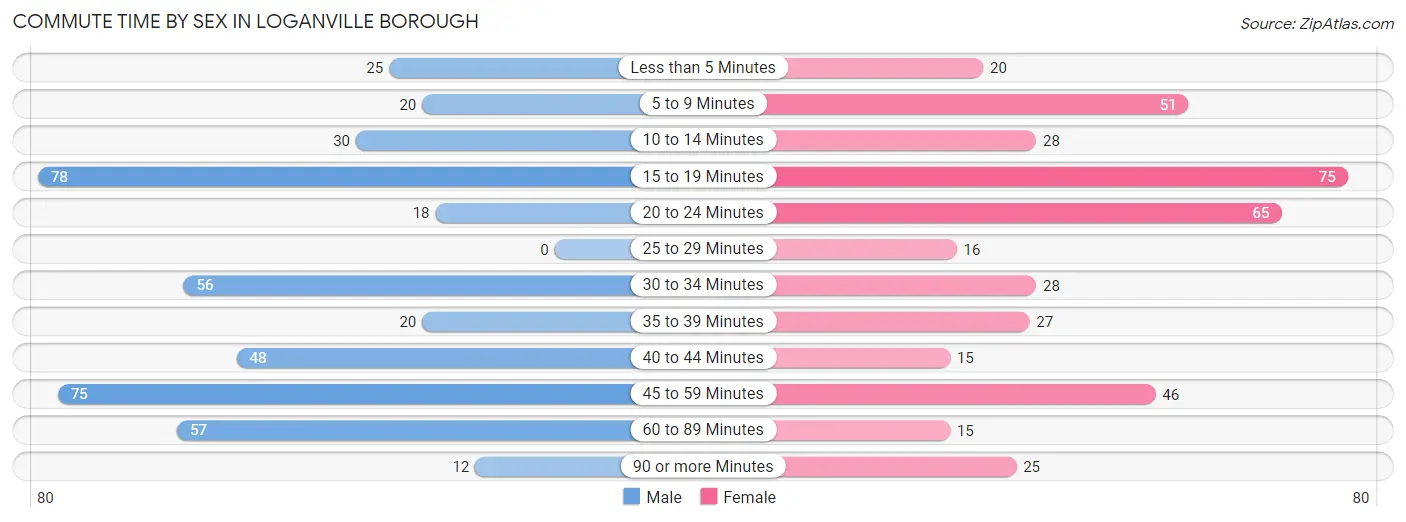
| Commute Time | Male | Female |
| Less than 5 Minutes | 25 (5.7%) | 20 (4.9%) |
| 5 to 9 Minutes | 20 (4.6%) | 51 (12.4%) |
| 10 to 14 Minutes | 30 (6.8%) | 28 (6.8%) |
| 15 to 19 Minutes | 78 (17.8%) | 75 (18.2%) |
| 20 to 24 Minutes | 18 (4.1%) | 65 (15.8%) |
| 25 to 29 Minutes | 0 (0.0%) | 16 (3.9%) |
| 30 to 34 Minutes | 56 (12.8%) | 28 (6.8%) |
| 35 to 39 Minutes | 20 (4.6%) | 27 (6.6%) |
| 40 to 44 Minutes | 48 (10.9%) | 15 (3.6%) |
| 45 to 59 Minutes | 75 (17.1%) | 46 (11.2%) |
| 60 to 89 Minutes | 57 (13.0%) | 15 (3.6%) |
| 90 or more Minutes | 12 (2.7%) | 25 (6.1%) |
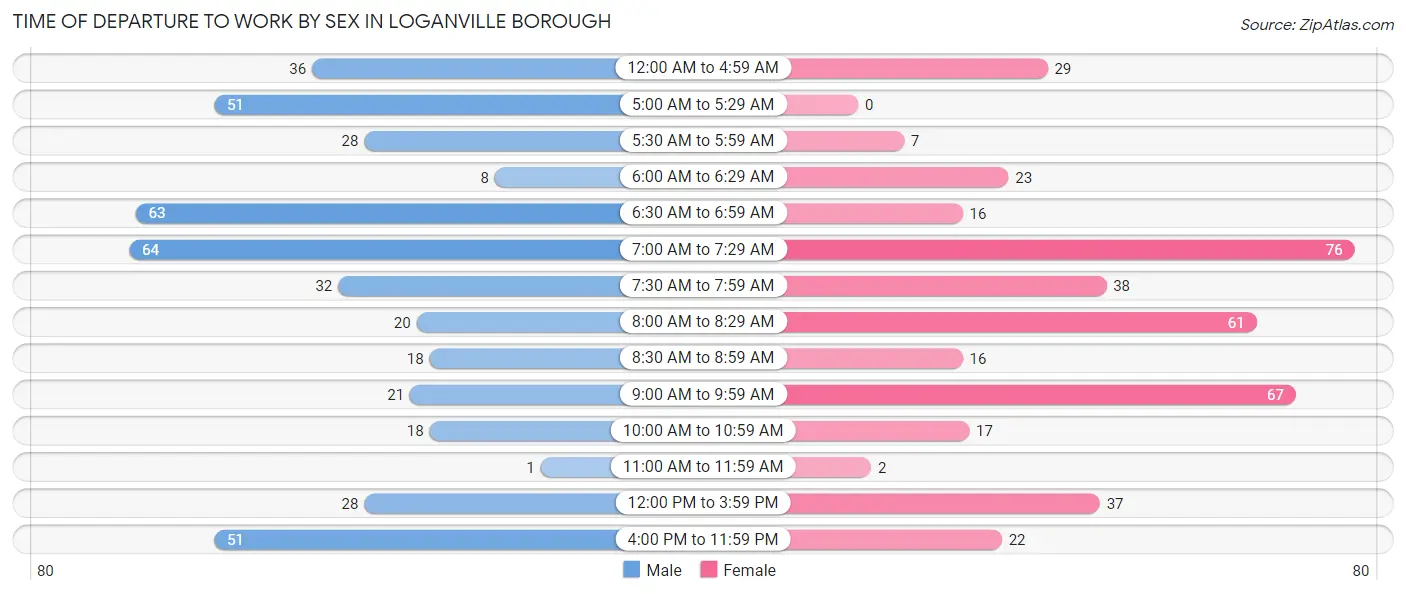
Time of Departure to Work by Sex in Loganville borough
The most frequent times of departure to work in Loganville borough are 7:00 AM to 7:29 AM (64, 14.6%) for males and 7:00 AM to 7:29 AM (76, 18.5%) for females.
| Time of Departure | Male | Female |
| 12:00 AM to 4:59 AM | 36 (8.2%) | 29 (7.1%) |
| 5:00 AM to 5:29 AM | 51 (11.6%) | 0 (0.0%) |
| 5:30 AM to 5:59 AM | 28 (6.4%) | 7 (1.7%) |
| 6:00 AM to 6:29 AM | 8 (1.8%) | 23 (5.6%) |
| 6:30 AM to 6:59 AM | 63 (14.3%) | 16 (3.9%) |
| 7:00 AM to 7:29 AM | 64 (14.6%) | 76 (18.5%) |
| 7:30 AM to 7:59 AM | 32 (7.3%) | 38 (9.2%) |
| 8:00 AM to 8:29 AM | 20 (4.6%) | 61 (14.8%) |
| 8:30 AM to 8:59 AM | 18 (4.1%) | 16 (3.9%) |
| 9:00 AM to 9:59 AM | 21 (4.8%) | 67 (16.3%) |
| 10:00 AM to 10:59 AM | 18 (4.1%) | 17 (4.1%) |
| 11:00 AM to 11:59 AM | 1 (0.2%) | 2 (0.5%) |
| 12:00 PM to 3:59 PM | 28 (6.4%) | 37 (9.0%) |
| 4:00 PM to 11:59 PM | 51 (11.6%) | 22 (5.3%) |
| Total | 439 (100.0%) | 411 (100.0%) |
Housing Occupancy in Loganville borough
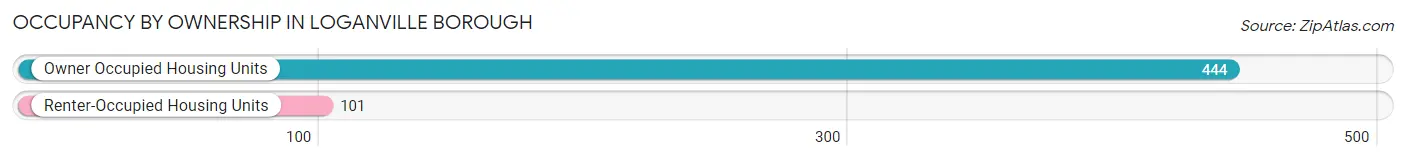
Occupancy by Ownership in Loganville borough
Of the total 545 dwellings in Loganville borough, owner-occupied units account for 444 (81.5%), while renter-occupied units make up 101 (18.5%).
| Occupancy | # Housing Units | % Housing Units |
| Owner Occupied Housing Units | 444 | 81.5% |
| Renter-Occupied Housing Units | 101 | 18.5% |
| Total Occupied Housing Units | 545 | 100.0% |
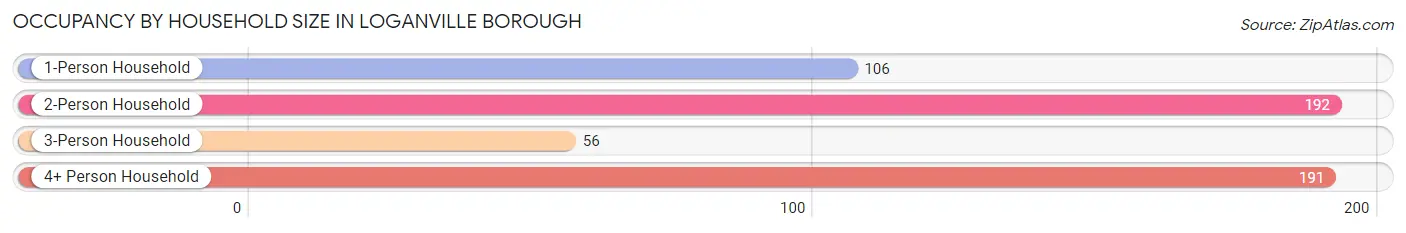
Occupancy by Household Size in Loganville borough
| Household Size | # Housing Units | % Housing Units |
| 1-Person Household | 106 | 19.5% |
| 2-Person Household | 192 | 35.2% |
| 3-Person Household | 56 | 10.3% |
| 4+ Person Household | 191 | 35.0% |
| Total Housing Units | 545 | 100.0% |
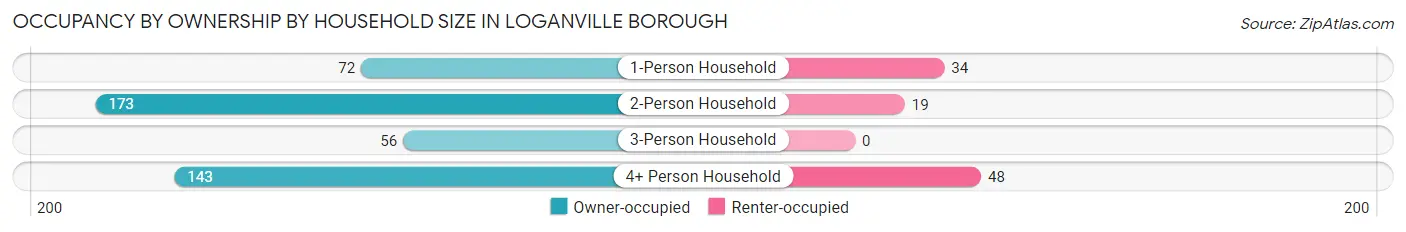
Occupancy by Ownership by Household Size in Loganville borough
| Household Size | Owner-occupied | Renter-occupied |
| 1-Person Household | 72 (67.9%) | 34 (32.1%) |
| 2-Person Household | 173 (90.1%) | 19 (9.9%) |
| 3-Person Household | 56 (100.0%) | 0 (0.0%) |
| 4+ Person Household | 143 (74.9%) | 48 (25.1%) |
| Total Housing Units | 444 (81.5%) | 101 (18.5%) |
Occupancy by Educational Attainment in Loganville borough
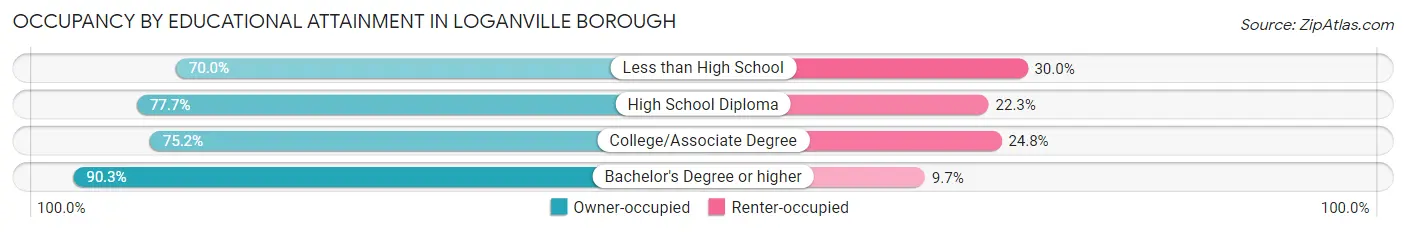
| Household Size | Owner-occupied | Renter-occupied |
| Less than High School | 14 (70.0%) | 6 (30.0%) |
| High School Diploma | 122 (77.7%) | 35 (22.3%) |
| College/Associate Degree | 121 (75.2%) | 40 (24.8%) |
| Bachelor's Degree or higher | 187 (90.3%) | 20 (9.7%) |
Occupancy by Age of Householder in Loganville borough
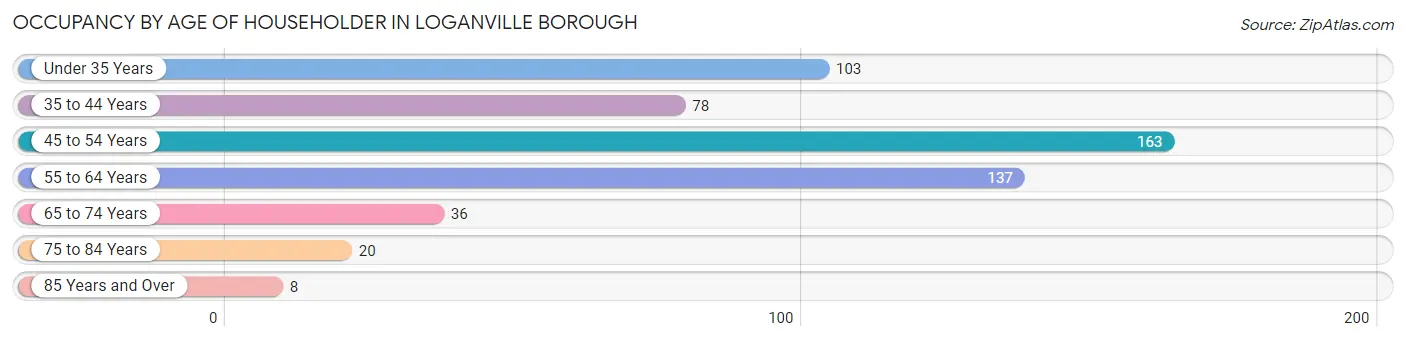
| Age Bracket | # Households | % Households |
| Under 35 Years | 103 | 18.9% |
| 35 to 44 Years | 78 | 14.3% |
| 45 to 54 Years | 163 | 29.9% |
| 55 to 64 Years | 137 | 25.1% |
| 65 to 74 Years | 36 | 6.6% |
| 75 to 84 Years | 20 | 3.7% |
| 85 Years and Over | 8 | 1.5% |
| Total | 545 | 100.0% |
Housing Finances in Loganville borough
Median Income by Occupancy in Loganville borough
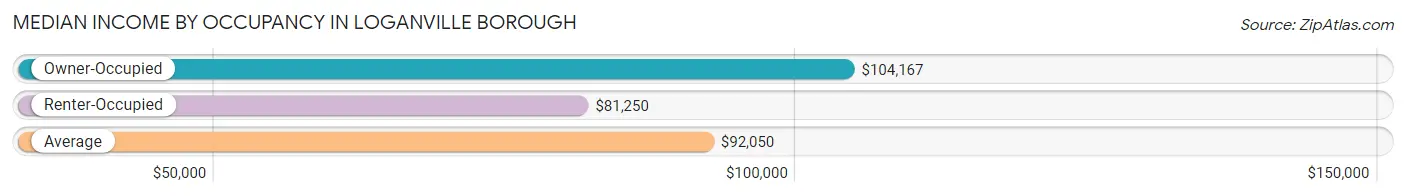
| Occupancy Type | # Households | Median Income |
| Owner-Occupied | 444 (81.5%) | $104,167 |
| Renter-Occupied | 101 (18.5%) | $81,250 |
| Average | 545 (100.0%) | $92,050 |
Occupancy by Householder Income Bracket in Loganville borough
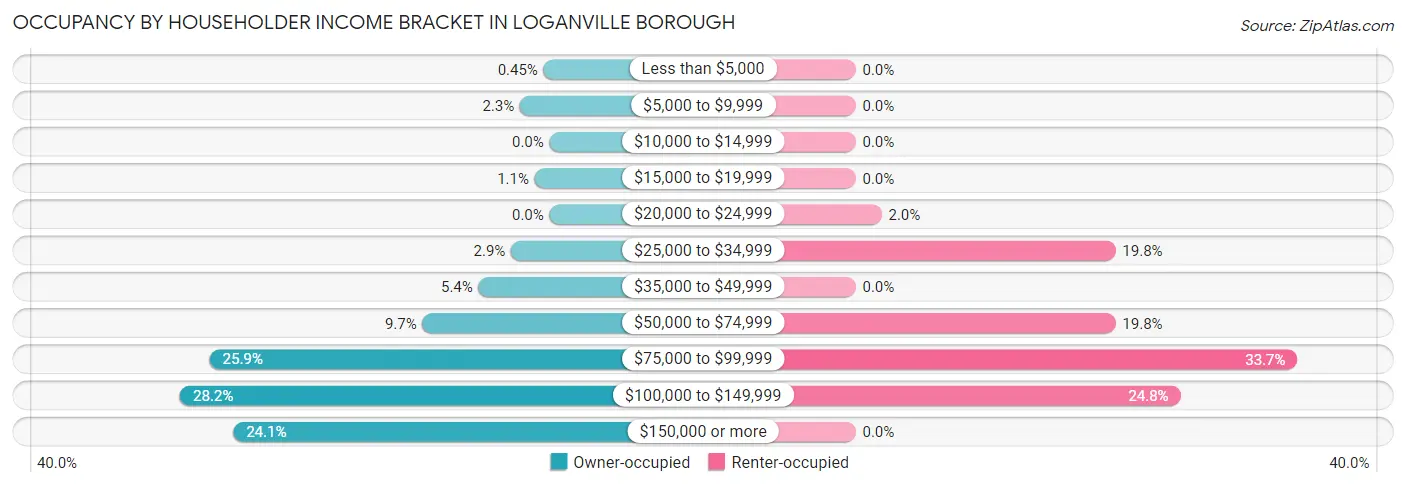
| Income Bracket | Owner-occupied | Renter-occupied |
| Less than $5,000 | 2 (0.4%) | 0 (0.0%) |
| $5,000 to $9,999 | 10 (2.2%) | 0 (0.0%) |
| $10,000 to $14,999 | 0 (0.0%) | 0 (0.0%) |
| $15,000 to $19,999 | 5 (1.1%) | 0 (0.0%) |
| $20,000 to $24,999 | 0 (0.0%) | 2 (2.0%) |
| $25,000 to $34,999 | 13 (2.9%) | 20 (19.8%) |
| $35,000 to $49,999 | 24 (5.4%) | 0 (0.0%) |
| $50,000 to $74,999 | 43 (9.7%) | 20 (19.8%) |
| $75,000 to $99,999 | 115 (25.9%) | 34 (33.7%) |
| $100,000 to $149,999 | 125 (28.1%) | 25 (24.7%) |
| $150,000 or more | 107 (24.1%) | 0 (0.0%) |
| Total | 444 (100.0%) | 101 (100.0%) |
Monthly Housing Cost Tiers in Loganville borough
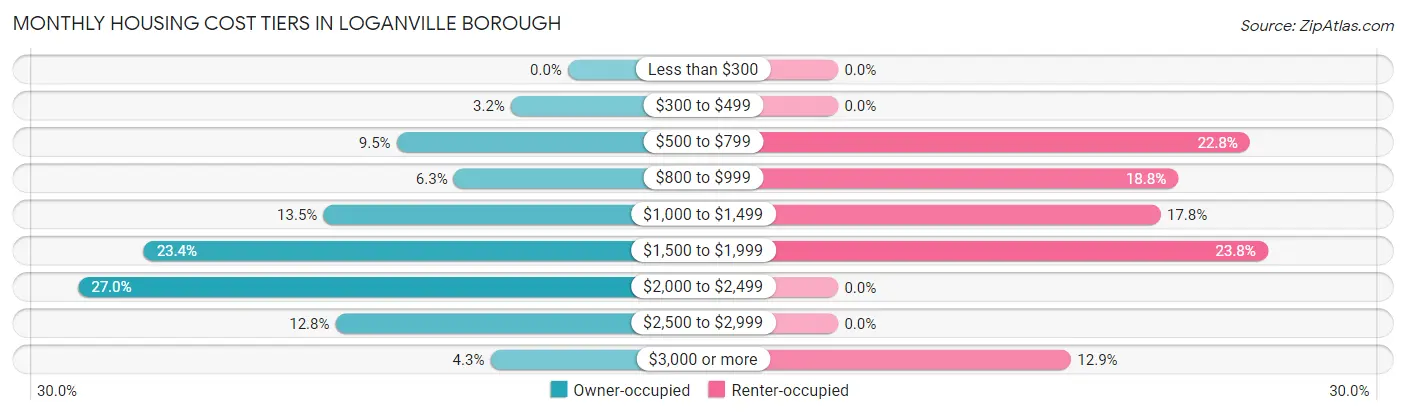
| Monthly Cost | Owner-occupied | Renter-occupied |
| Less than $300 | 0 (0.0%) | 0 (0.0%) |
| $300 to $499 | 14 (3.2%) | 0 (0.0%) |
| $500 to $799 | 42 (9.5%) | 23 (22.8%) |
| $800 to $999 | 28 (6.3%) | 19 (18.8%) |
| $1,000 to $1,499 | 60 (13.5%) | 18 (17.8%) |
| $1,500 to $1,999 | 104 (23.4%) | 24 (23.8%) |
| $2,000 to $2,499 | 120 (27.0%) | 0 (0.0%) |
| $2,500 to $2,999 | 57 (12.8%) | 0 (0.0%) |
| $3,000 or more | 19 (4.3%) | 13 (12.9%) |
| Total | 444 (100.0%) | 101 (100.0%) |
Physical Housing Characteristics in Loganville borough
Housing Structures in Loganville borough
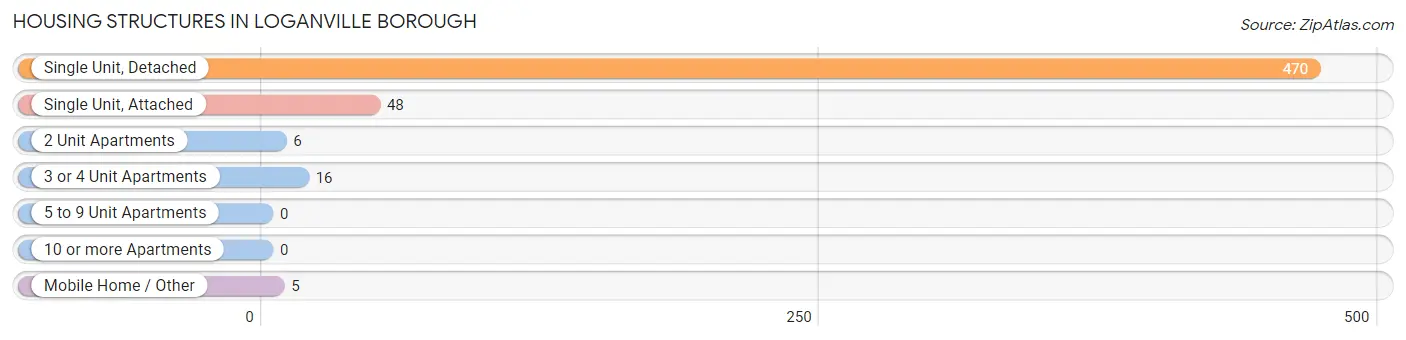
| Structure Type | # Housing Units | % Housing Units |
| Single Unit, Detached | 470 | 86.2% |
| Single Unit, Attached | 48 | 8.8% |
| 2 Unit Apartments | 6 | 1.1% |
| 3 or 4 Unit Apartments | 16 | 2.9% |
| 5 to 9 Unit Apartments | 0 | 0.0% |
| 10 or more Apartments | 0 | 0.0% |
| Mobile Home / Other | 5 | 0.9% |
| Total | 545 | 100.0% |
Housing Structures by Occupancy in Loganville borough
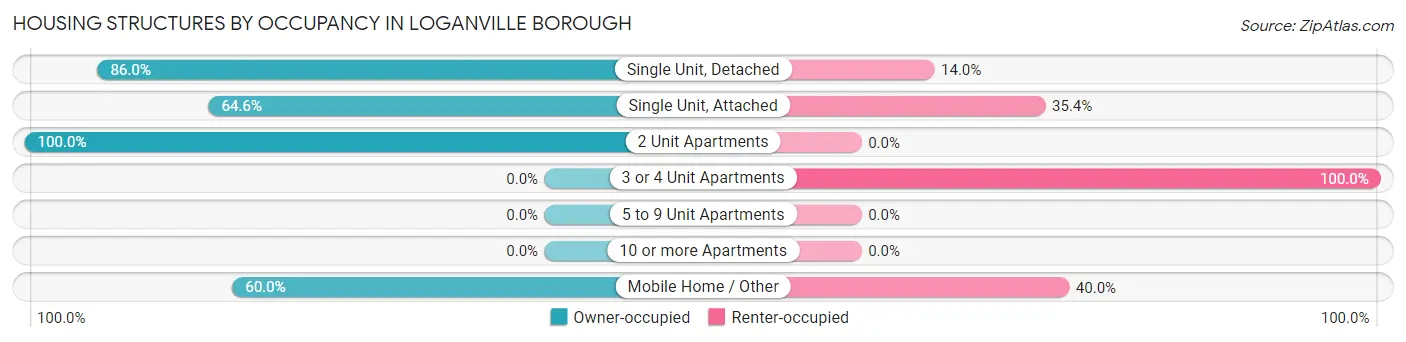
| Structure Type | Owner-occupied | Renter-occupied |
| Single Unit, Detached | 404 (86.0%) | 66 (14.0%) |
| Single Unit, Attached | 31 (64.6%) | 17 (35.4%) |
| 2 Unit Apartments | 6 (100.0%) | 0 (0.0%) |
| 3 or 4 Unit Apartments | 0 (0.0%) | 16 (100.0%) |
| 5 to 9 Unit Apartments | 0 (0.0%) | 0 (0.0%) |
| 10 or more Apartments | 0 (0.0%) | 0 (0.0%) |
| Mobile Home / Other | 3 (60.0%) | 2 (40.0%) |
| Total | 444 (81.5%) | 101 (18.5%) |
Housing Structures by Number of Rooms in Loganville borough
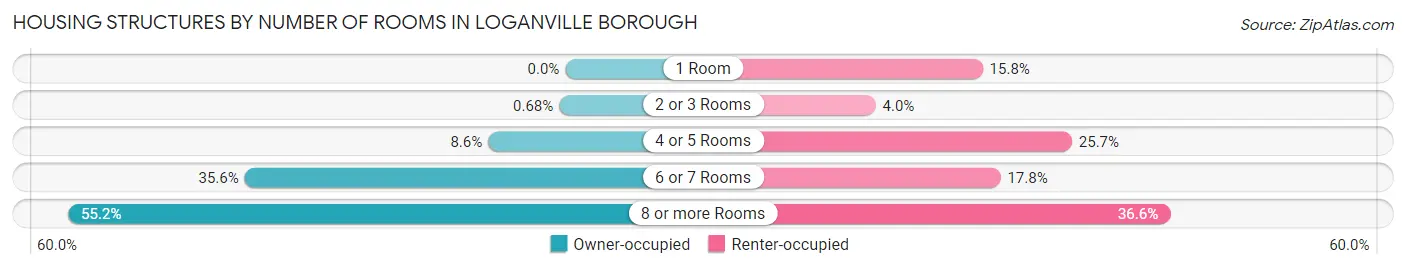
| Number of Rooms | Owner-occupied | Renter-occupied |
| 1 Room | 0 (0.0%) | 16 (15.8%) |
| 2 or 3 Rooms | 3 (0.7%) | 4 (4.0%) |
| 4 or 5 Rooms | 38 (8.6%) | 26 (25.7%) |
| 6 or 7 Rooms | 158 (35.6%) | 18 (17.8%) |
| 8 or more Rooms | 245 (55.2%) | 37 (36.6%) |
| Total | 444 (100.0%) | 101 (100.0%) |
Housing Structure by Heating Type in Loganville borough
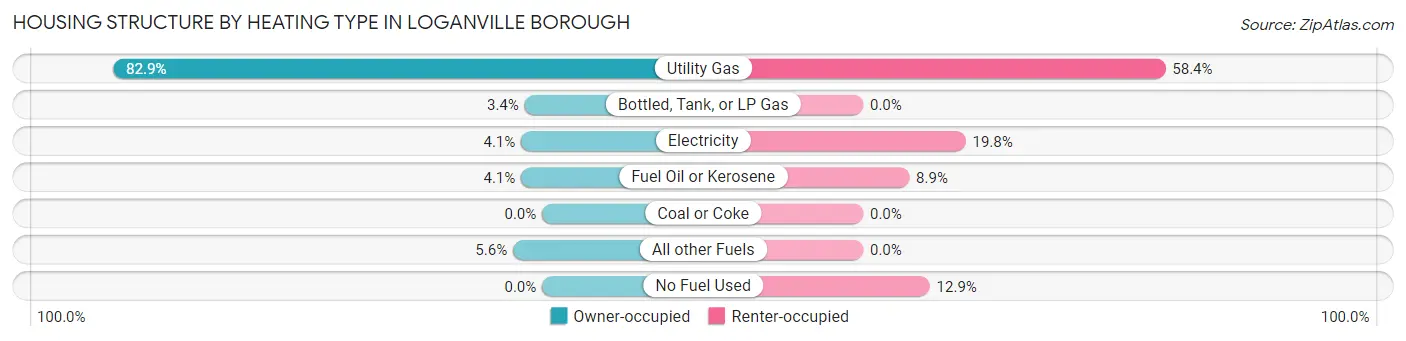
| Heating Type | Owner-occupied | Renter-occupied |
| Utility Gas | 368 (82.9%) | 59 (58.4%) |
| Bottled, Tank, or LP Gas | 15 (3.4%) | 0 (0.0%) |
| Electricity | 18 (4.1%) | 20 (19.8%) |
| Fuel Oil or Kerosene | 18 (4.1%) | 9 (8.9%) |
| Coal or Coke | 0 (0.0%) | 0 (0.0%) |
| All other Fuels | 25 (5.6%) | 0 (0.0%) |
| No Fuel Used | 0 (0.0%) | 13 (12.9%) |
| Total | 444 (100.0%) | 101 (100.0%) |
Household Vehicle Usage in Loganville borough
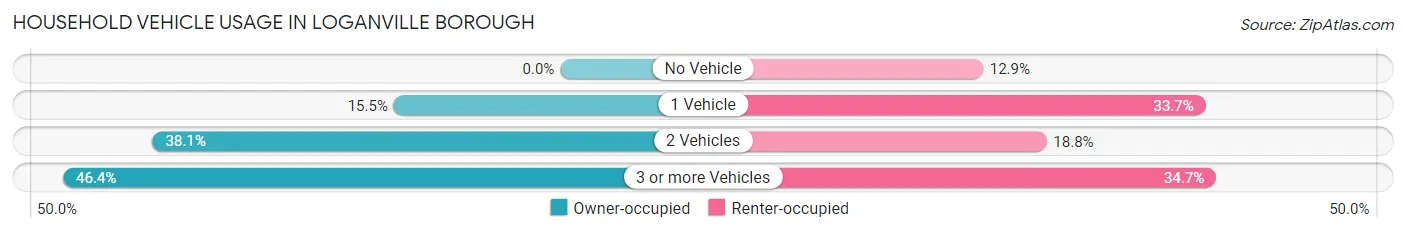
| Vehicles per Household | Owner-occupied | Renter-occupied |
| No Vehicle | 0 (0.0%) | 13 (12.9%) |
| 1 Vehicle | 69 (15.5%) | 34 (33.7%) |
| 2 Vehicles | 169 (38.1%) | 19 (18.8%) |
| 3 or more Vehicles | 206 (46.4%) | 35 (34.6%) |
| Total | 444 (100.0%) | 101 (100.0%) |
Real Estate & Mortgages in Loganville borough
Real Estate and Mortgage Overview in Loganville borough
| Characteristic | Without Mortgage | With Mortgage |
| Housing Units | 106 | 338 |
| Median Property Value | $226,700 | $269,300 |
| Median Household Income | $95,833 | $78 |
| Monthly Housing Costs | $809 | $19 |
| Real Estate Taxes | $4,000 | $8 |
Property Value by Mortgage Status in Loganville borough
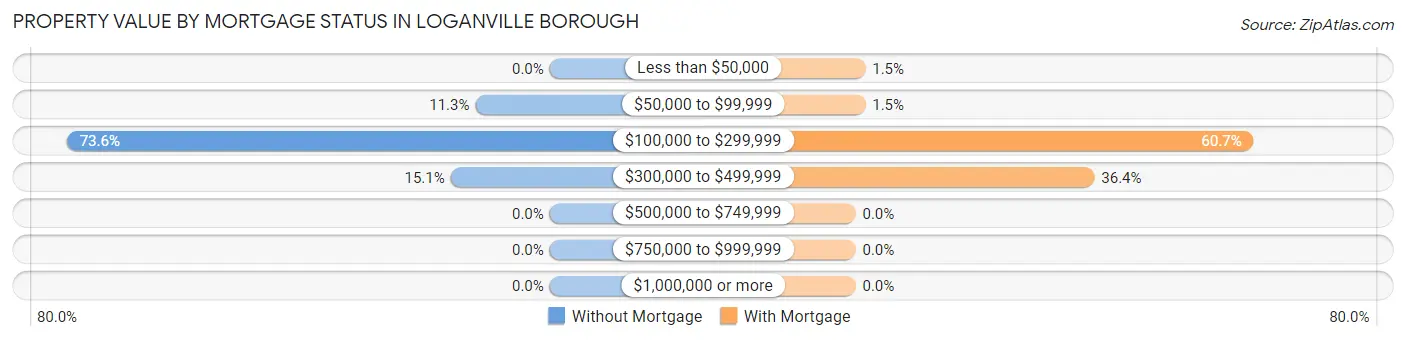
| Property Value | Without Mortgage | With Mortgage |
| Less than $50,000 | 0 (0.0%) | 5 (1.5%) |
| $50,000 to $99,999 | 12 (11.3%) | 5 (1.5%) |
| $100,000 to $299,999 | 78 (73.6%) | 205 (60.7%) |
| $300,000 to $499,999 | 16 (15.1%) | 123 (36.4%) |
| $500,000 to $749,999 | 0 (0.0%) | 0 (0.0%) |
| $750,000 to $999,999 | 0 (0.0%) | 0 (0.0%) |
| $1,000,000 or more | 0 (0.0%) | 0 (0.0%) |
| Total | 106 (100.0%) | 338 (100.0%) |
Household Income by Mortgage Status in Loganville borough
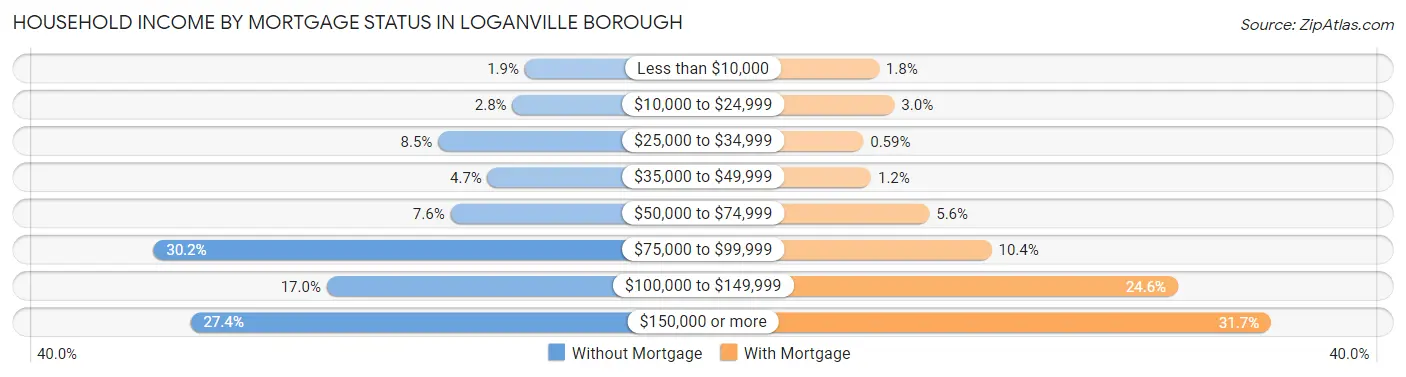
| Household Income | Without Mortgage | With Mortgage |
| Less than $10,000 | 2 (1.9%) | 6 (1.8%) |
| $10,000 to $24,999 | 3 (2.8%) | 10 (3.0%) |
| $25,000 to $34,999 | 9 (8.5%) | 2 (0.6%) |
| $35,000 to $49,999 | 5 (4.7%) | 4 (1.2%) |
| $50,000 to $74,999 | 8 (7.5%) | 19 (5.6%) |
| $75,000 to $99,999 | 32 (30.2%) | 35 (10.4%) |
| $100,000 to $149,999 | 18 (17.0%) | 83 (24.6%) |
| $150,000 or more | 29 (27.4%) | 107 (31.7%) |
| Total | 106 (100.0%) | 338 (100.0%) |
Property Value to Household Income Ratio in Loganville borough
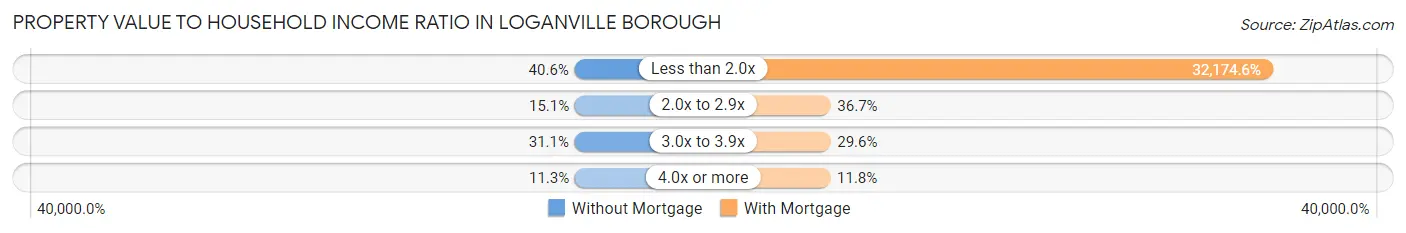
| Value-to-Income Ratio | Without Mortgage | With Mortgage |
| Less than 2.0x | 43 (40.6%) | 108,750 (32,174.6%) |
| 2.0x to 2.9x | 16 (15.1%) | 124 (36.7%) |
| 3.0x to 3.9x | 33 (31.1%) | 100 (29.6%) |
| 4.0x or more | 12 (11.3%) | 40 (11.8%) |
| Total | 106 (100.0%) | 338 (100.0%) |
Real Estate Taxes by Mortgage Status in Loganville borough
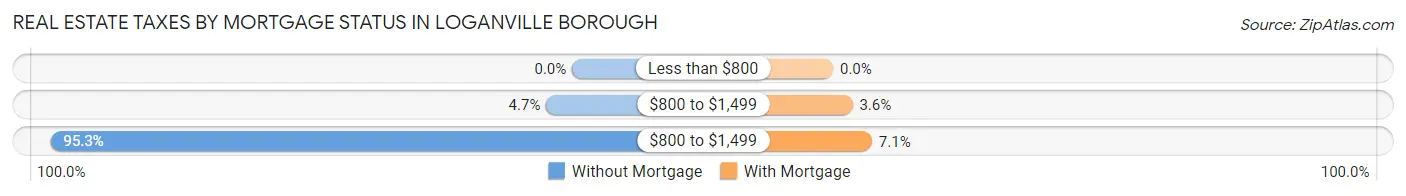
| Property Taxes | Without Mortgage | With Mortgage |
| Less than $800 | 0 (0.0%) | 0 (0.0%) |
| $800 to $1,499 | 5 (4.7%) | 12 (3.5%) |
| $800 to $1,499 | 101 (95.3%) | 24 (7.1%) |
| Total | 106 (100.0%) | 338 (100.0%) |
Health & Disability in Loganville borough
Health Insurance Coverage by Age in Loganville borough
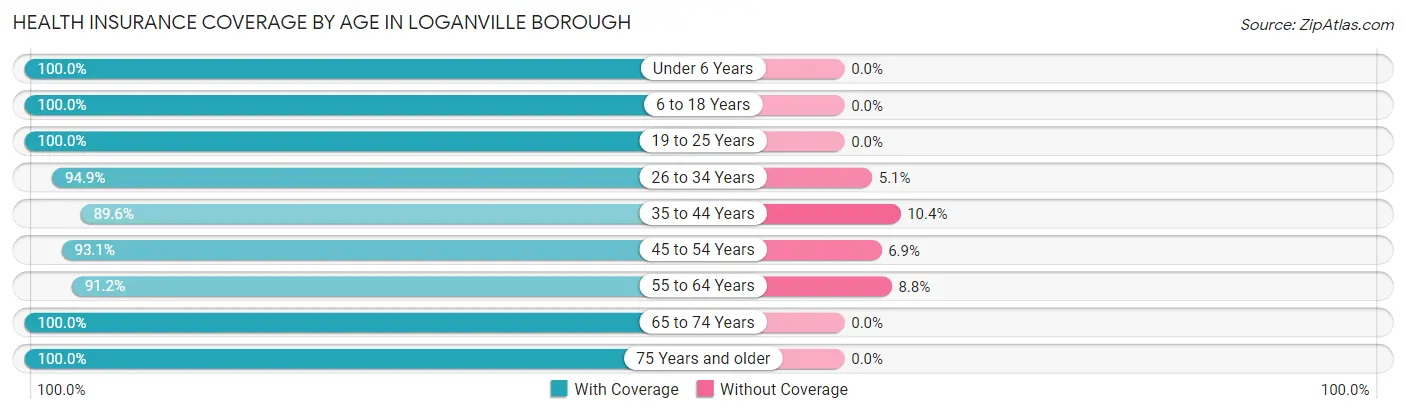
| Age Bracket | With Coverage | Without Coverage |
| Under 6 Years | 70 (100.0%) | 0 (0.0%) |
| 6 to 18 Years | 322 (100.0%) | 0 (0.0%) |
| 19 to 25 Years | 142 (100.0%) | 0 (0.0%) |
| 26 to 34 Years | 222 (94.9%) | 12 (5.1%) |
| 35 to 44 Years | 146 (89.6%) | 17 (10.4%) |
| 45 to 54 Years | 284 (93.1%) | 21 (6.9%) |
| 55 to 64 Years | 197 (91.2%) | 19 (8.8%) |
| 65 to 74 Years | 58 (100.0%) | 0 (0.0%) |
| 75 Years and older | 53 (100.0%) | 0 (0.0%) |
| Total | 1,494 (95.6%) | 69 (4.4%) |
Health Insurance Coverage by Citizenship Status in Loganville borough
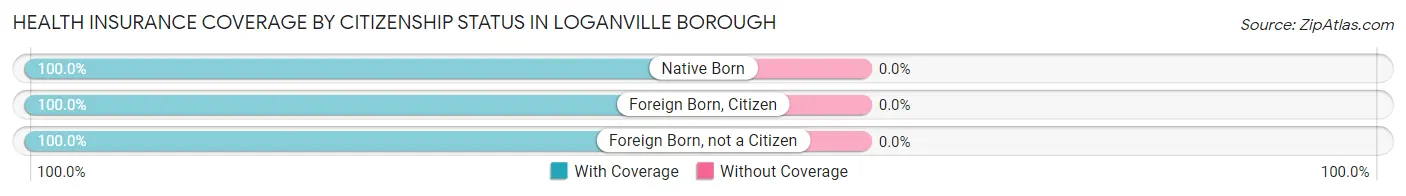
| Citizenship Status | With Coverage | Without Coverage |
| Native Born | 70 (100.0%) | 0 (0.0%) |
| Foreign Born, Citizen | 322 (100.0%) | 0 (0.0%) |
| Foreign Born, not a Citizen | 142 (100.0%) | 0 (0.0%) |
Health Insurance Coverage by Household Income in Loganville borough
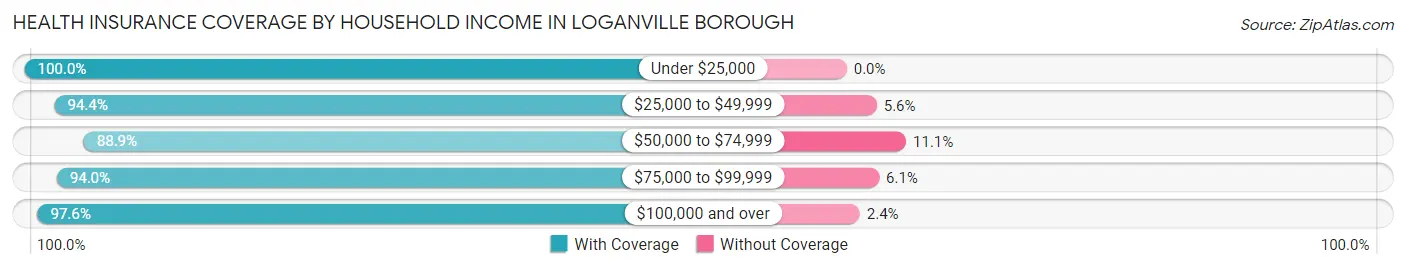
| Household Income | With Coverage | Without Coverage |
| Under $25,000 | 22 (100.0%) | 0 (0.0%) |
| $25,000 to $49,999 | 84 (94.4%) | 5 (5.6%) |
| $50,000 to $74,999 | 128 (88.9%) | 16 (11.1%) |
| $75,000 to $99,999 | 419 (94.0%) | 27 (6.0%) |
| $100,000 and over | 841 (97.6%) | 21 (2.4%) |
Public vs Private Health Insurance Coverage by Age in Loganville borough
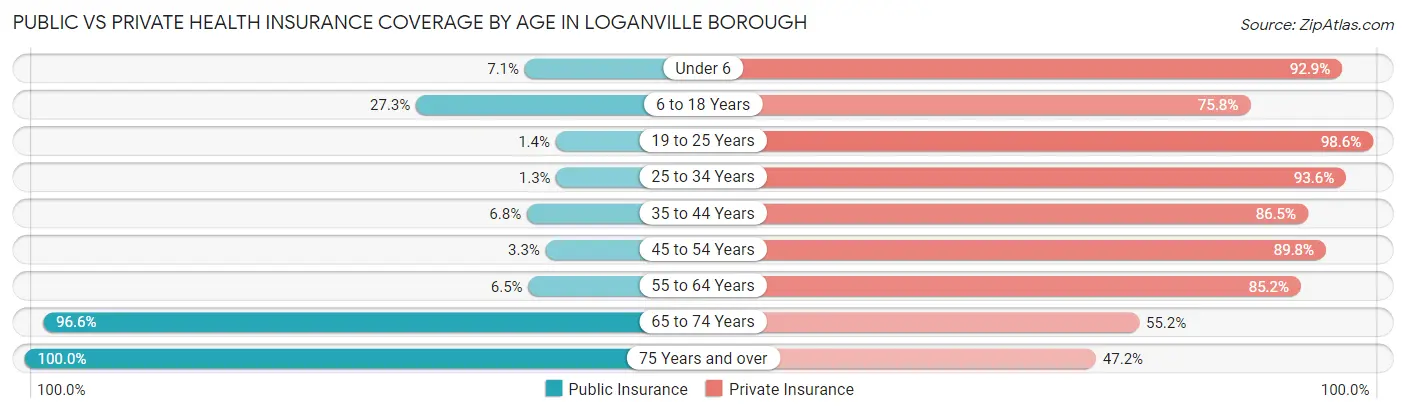
| Age Bracket | Public Insurance | Private Insurance |
| Under 6 | 5 (7.1%) | 65 (92.9%) |
| 6 to 18 Years | 88 (27.3%) | 244 (75.8%) |
| 19 to 25 Years | 2 (1.4%) | 140 (98.6%) |
| 25 to 34 Years | 3 (1.3%) | 219 (93.6%) |
| 35 to 44 Years | 11 (6.8%) | 141 (86.5%) |
| 45 to 54 Years | 10 (3.3%) | 274 (89.8%) |
| 55 to 64 Years | 14 (6.5%) | 184 (85.2%) |
| 65 to 74 Years | 56 (96.6%) | 32 (55.2%) |
| 75 Years and over | 53 (100.0%) | 25 (47.2%) |
| Total | 242 (15.5%) | 1,324 (84.7%) |
Disability Status by Sex by Age in Loganville borough
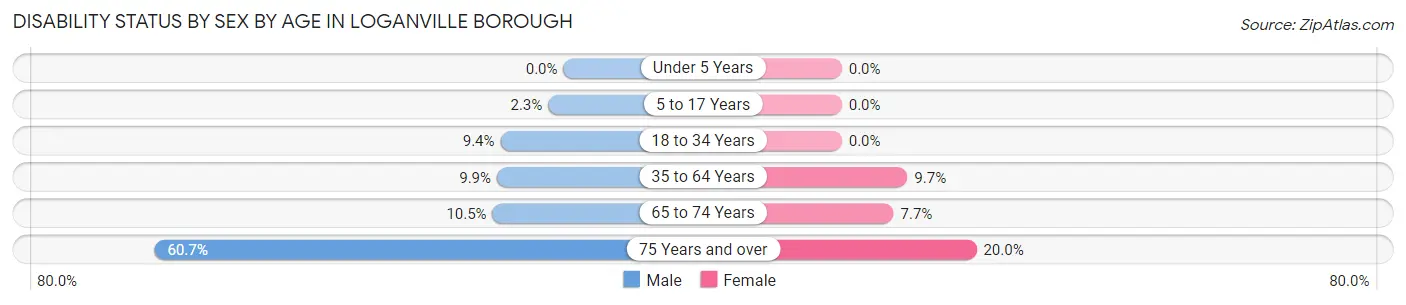
| Age Bracket | Male | Female |
| Under 5 Years | 0 (0.0%) | 0 (0.0%) |
| 5 to 17 Years | 5 (2.3%) | 0 (0.0%) |
| 18 to 34 Years | 20 (9.3%) | 0 (0.0%) |
| 35 to 64 Years | 30 (9.9%) | 37 (9.7%) |
| 65 to 74 Years | 2 (10.5%) | 3 (7.7%) |
| 75 Years and over | 17 (60.7%) | 5 (20.0%) |
Disability Class by Sex by Age in Loganville borough
Disability Class: Hearing Difficulty
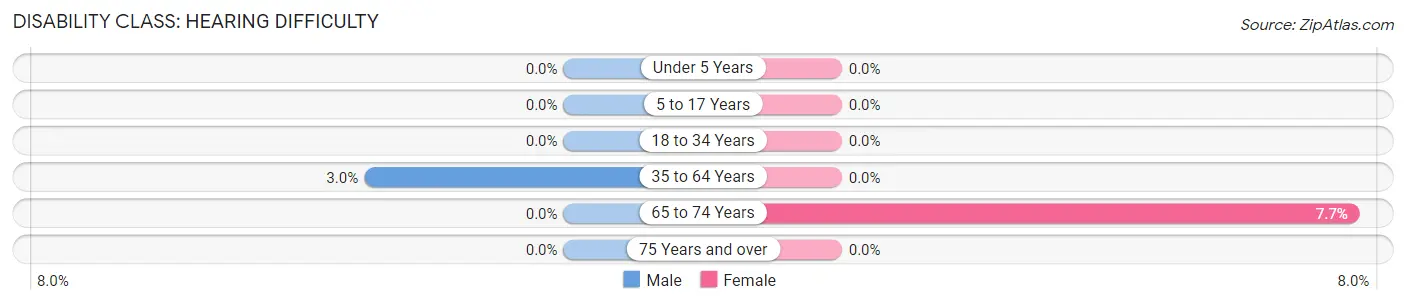
| Age Bracket | Male | Female |
| Under 5 Years | 0 (0.0%) | 0 (0.0%) |
| 5 to 17 Years | 0 (0.0%) | 0 (0.0%) |
| 18 to 34 Years | 0 (0.0%) | 0 (0.0%) |
| 35 to 64 Years | 9 (3.0%) | 0 (0.0%) |
| 65 to 74 Years | 0 (0.0%) | 3 (7.7%) |
| 75 Years and over | 0 (0.0%) | 0 (0.0%) |
Disability Class: Vision Difficulty
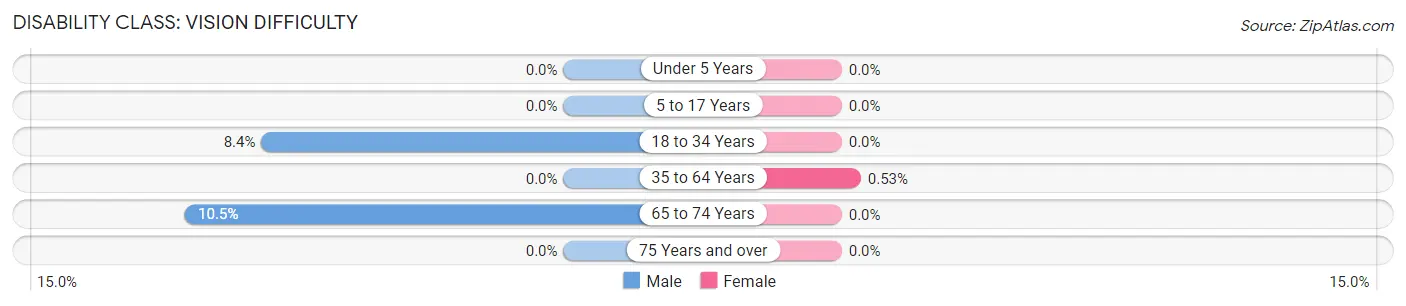
| Age Bracket | Male | Female |
| Under 5 Years | 0 (0.0%) | 0 (0.0%) |
| 5 to 17 Years | 0 (0.0%) | 0 (0.0%) |
| 18 to 34 Years | 18 (8.4%) | 0 (0.0%) |
| 35 to 64 Years | 0 (0.0%) | 2 (0.5%) |
| 65 to 74 Years | 2 (10.5%) | 0 (0.0%) |
| 75 Years and over | 0 (0.0%) | 0 (0.0%) |
Disability Class: Cognitive Difficulty
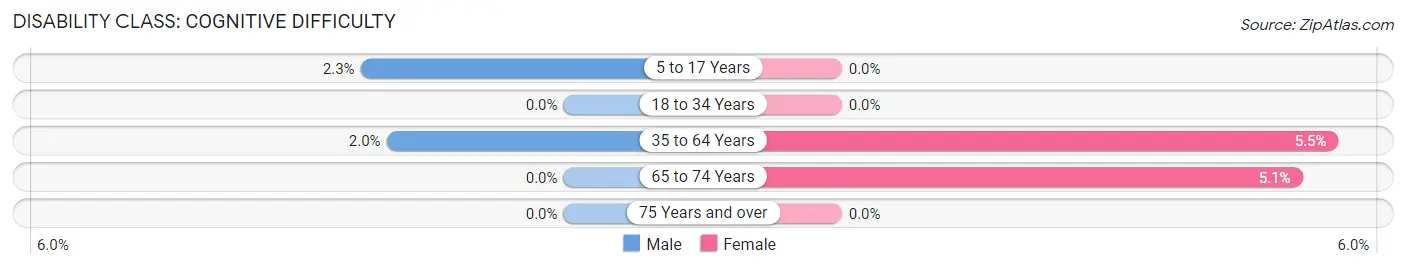
| Age Bracket | Male | Female |
| 5 to 17 Years | 5 (2.3%) | 0 (0.0%) |
| 18 to 34 Years | 0 (0.0%) | 0 (0.0%) |
| 35 to 64 Years | 6 (2.0%) | 21 (5.5%) |
| 65 to 74 Years | 0 (0.0%) | 2 (5.1%) |
| 75 Years and over | 0 (0.0%) | 0 (0.0%) |
Disability Class: Ambulatory Difficulty
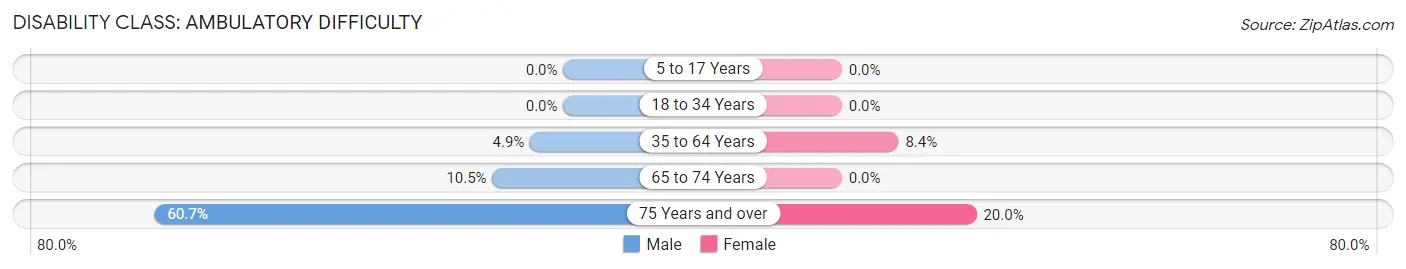
| Age Bracket | Male | Female |
| 5 to 17 Years | 0 (0.0%) | 0 (0.0%) |
| 18 to 34 Years | 0 (0.0%) | 0 (0.0%) |
| 35 to 64 Years | 15 (4.9%) | 32 (8.4%) |
| 65 to 74 Years | 2 (10.5%) | 0 (0.0%) |
| 75 Years and over | 17 (60.7%) | 5 (20.0%) |
Disability Class: Self-Care Difficulty
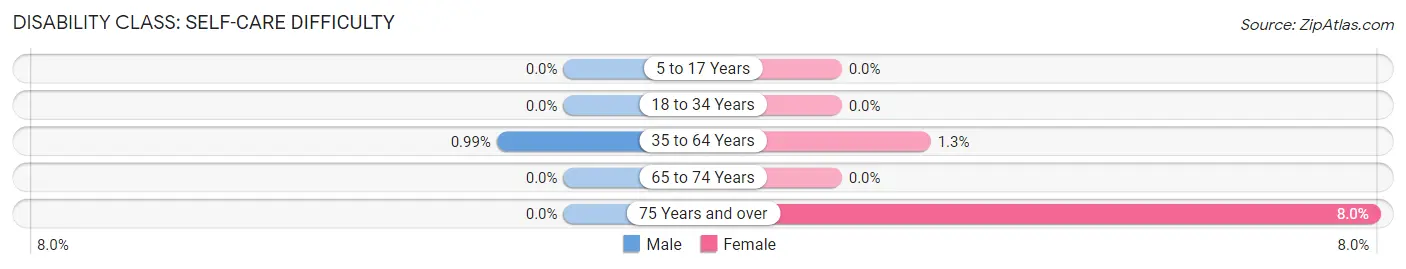
| Age Bracket | Male | Female |
| 5 to 17 Years | 0 (0.0%) | 0 (0.0%) |
| 18 to 34 Years | 0 (0.0%) | 0 (0.0%) |
| 35 to 64 Years | 3 (1.0%) | 5 (1.3%) |
| 65 to 74 Years | 0 (0.0%) | 0 (0.0%) |
| 75 Years and over | 0 (0.0%) | 2 (8.0%) |
Technology Access in Loganville borough
Computing Device Access in Loganville borough
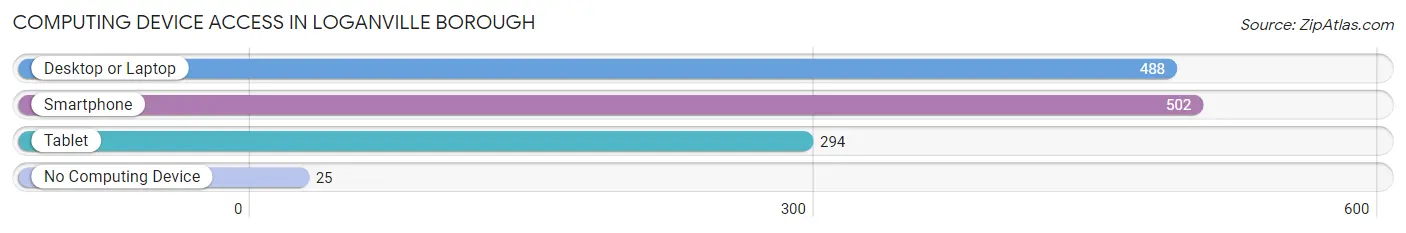
| Device Type | # Households | % Households |
| Desktop or Laptop | 488 | 89.5% |
| Smartphone | 502 | 92.1% |
| Tablet | 294 | 53.9% |
| No Computing Device | 25 | 4.6% |
| Total | 545 | 100.0% |
Internet Access in Loganville borough
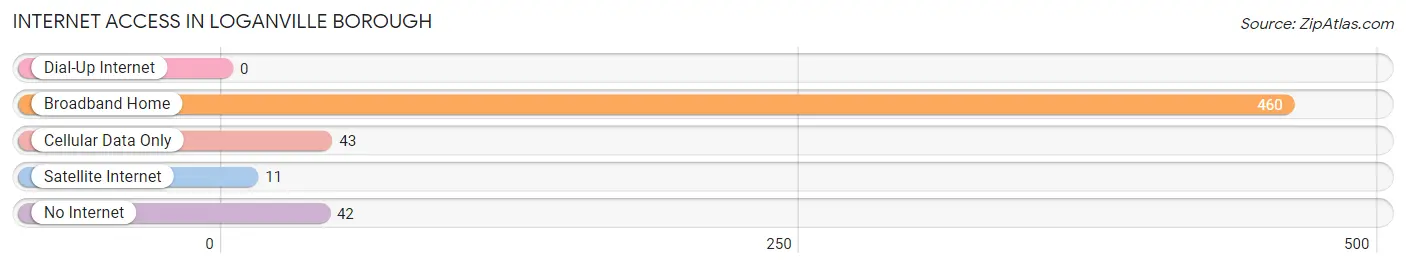
| Internet Type | # Households | % Households |
| Dial-Up Internet | 0 | 0.0% |
| Broadband Home | 460 | 84.4% |
| Cellular Data Only | 43 | 7.9% |
| Satellite Internet | 11 | 2.0% |
| No Internet | 42 | 7.7% |
| Total | 545 | 100.0% |
Loganville borough Summary
Loganville Borough is a small borough located in York County, Pennsylvania. It is situated in the southeastern corner of the county, just north of the Maryland border. The borough is part of the York-Hanover Metropolitan Statistical Area. As of the 2010 census, the population of Loganville was 1,093.
History
Loganville was founded in 1854 by John Logan, a local farmer. The town was originally known as Logansville, but the name was changed to Loganville in 1868. The town was incorporated as a borough in 1887.
The town was originally a farming community, but it has since become a bedroom community for the larger cities of York and Hanover. The town is home to several small businesses, including a grocery store, a hardware store, and a few restaurants.
Geography
Loganville is located at 39°45'25"N 76°45'45"W (39.7569, -76.7625). It is situated in the southeastern corner of York County, just north of the Maryland border. The borough is bordered by Codorus Township to the north, Heidelberg Township to the east, and Washington Township to the south and west.
The borough has a total area of 0.7 square miles, all of which is land. The town is situated in the Piedmont region of Pennsylvania, and is located in the Codorus Creek watershed.
Economy
The economy of Loganville is largely based on small businesses and services. The town is home to several small businesses, including a grocery store, a hardware store, and a few restaurants. The town is also home to a few small manufacturing companies.
The town is also home to a few small farms, which produce a variety of crops, including corn, soybeans, and hay.
Demographics
As of the 2010 census, the population of Loganville was 1,093. The racial makeup of the borough was 97.2% White, 0.7% African American, 0.2% Native American, 0.2% Asian, 0.2% from other races, and 1.7% from two or more races. Hispanic or Latino of any race were 1.2% of the population.
The median household income in Loganville was $50,938, and the median family income was $58,750. The per capita income for the borough was $22,945. About 5.2% of families and 6.7% of the population were below the poverty line, including 8.3% of those under age 18 and 4.2% of those age 65 or over.
Conclusion
Loganville Borough is a small borough located in York County, Pennsylvania. It is situated in the southeastern corner of the county, just north of the Maryland border. The borough is part of the York-Hanover Metropolitan Statistical Area. As of the 2010 census, the population of Loganville was 1,093. The town was originally a farming community, but it has since become a bedroom community for the larger cities of York and Hanover. The economy of Loganville is largely based on small businesses and services. The racial makeup of the borough was 97.2% White, 0.7% African American, 0.2% Native American, 0.2% Asian, 0.2% from other races, and 1.7% from two or more races. The median household income in Loganville was $50,938, and the median family income was $58,750.
Common Questions
What is Per Capita Income in Loganville borough?
Per Capita income in Loganville borough is $41,088.
What is the Median Family Income in Loganville borough?
Median Family Income in Loganville borough is $104,167.
What is the Median Household income in Loganville borough?
Median Household Income in Loganville borough is $92,050.
What is Income or Wage Gap in Loganville borough?
Income or Wage Gap in Loganville borough is 38.7%.
Women in Loganville borough earn 61.3 cents for every dollar earned by a man.
What is Inequality or Gini Index in Loganville borough?
Inequality or Gini Index in Loganville borough is 0.35.
What is the Total Population of Loganville borough?
Total Population of Loganville borough is 1,563.
What is the Total Male Population of Loganville borough?
Total Male Population of Loganville borough is 814.
What is the Total Female Population of Loganville borough?
Total Female Population of Loganville borough is 749.
What is the Ratio of Males per 100 Females in Loganville borough?
There are 108.68 Males per 100 Females in Loganville borough.
What is the Ratio of Females per 100 Males in Loganville borough?
There are 92.01 Females per 100 Males in Loganville borough.
What is the Median Population Age in Loganville borough?
Median Population Age in Loganville borough is 35.6 Years.
What is the Average Family Size in Loganville borough
Average Family Size in Loganville borough is 3.3 People.
What is the Average Household Size in Loganville borough
Average Household Size in Loganville borough is 2.9 People.
How Large is the Labor Force in Loganville borough?
There are 990 People in the Labor Forcein in Loganville borough.
What is the Percentage of People in the Labor Force in Loganville borough?
77.5% of People are in the Labor Force in Loganville borough.
What is the Unemployment Rate in Loganville borough?
Unemployment Rate in Loganville borough is 4.7%.