Lower Burrell, PA Map & Demographics
Lower Burrell Map
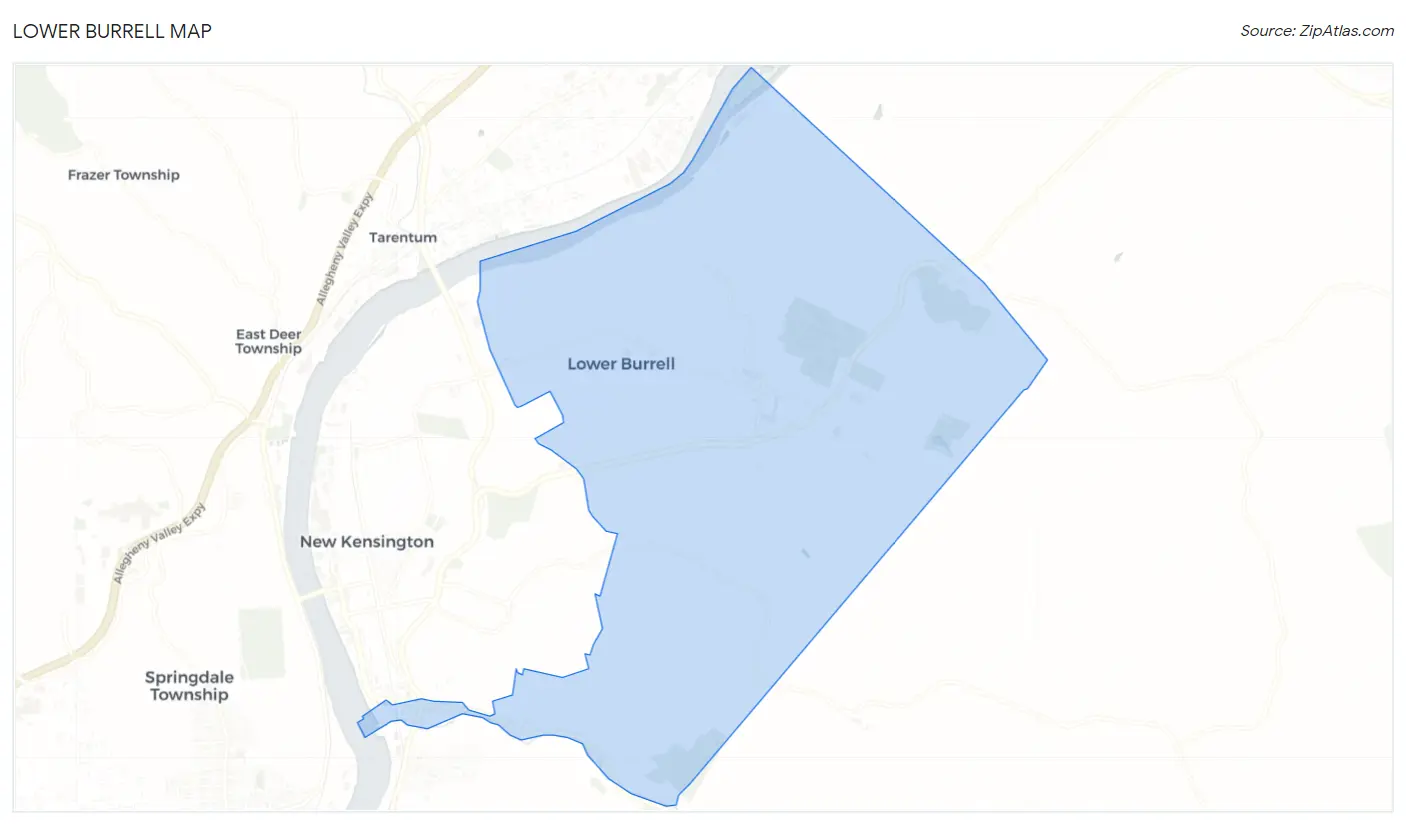
Lower Burrell Overview
$43,582
PER CAPITA INCOME
$98,720
AVG FAMILY INCOME
$78,639
AVG HOUSEHOLD INCOME
33.3%
WAGE / INCOME GAP [ % ]
66.7¢/ $1
WAGE / INCOME GAP [ $ ]
0.43
INEQUALITY / GINI INDEX
11,701
TOTAL POPULATION
5,791
MALE POPULATION
5,910
FEMALE POPULATION
97.99
MALES / 100 FEMALES
102.05
FEMALES / 100 MALES
48.9
MEDIAN AGE
2.7
AVG FAMILY SIZE
2.2
AVG HOUSEHOLD SIZE
5,837
LABOR FORCE [ PEOPLE ]
58.3%
PERCENT IN LABOR FORCE
2.2%
UNEMPLOYMENT RATE
Lower Burrell Area Codes
Income in Lower Burrell
Income Overview in Lower Burrell
Per Capita Income in Lower Burrell is $43,582, while median incomes of families and households are $98,720 and $78,639 respectively.
| Characteristic | Number | Measure |
| Per Capita Income | 11,701 | $43,582 |
| Median Family Income | 3,329 | $98,720 |
| Mean Family Income | 3,329 | $116,232 |
| Median Household Income | 5,284 | $78,639 |
| Mean Household Income | 5,284 | $95,338 |
| Income Deficit | 3,329 | $0 |
| Wage / Income Gap (%) | 11,701 | 33.29% |
| Wage / Income Gap ($) | 11,701 | 66.71¢ per $1 |
| Gini / Inequality Index | 11,701 | 0.43 |
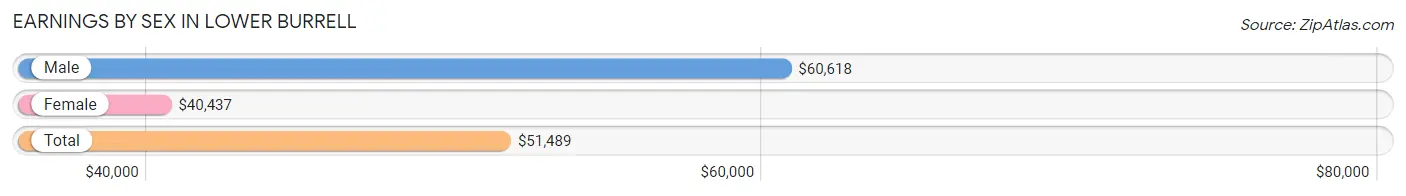
Earnings by Sex in Lower Burrell
Average Earnings in Lower Burrell are $51,489, $60,618 for men and $40,437 for women, a difference of 33.3%.
| Sex | Number | Average Earnings |
| Male | 3,472 (55.6%) | $60,618 |
| Female | 2,773 (44.4%) | $40,437 |
| Total | 6,245 (100.0%) | $51,489 |
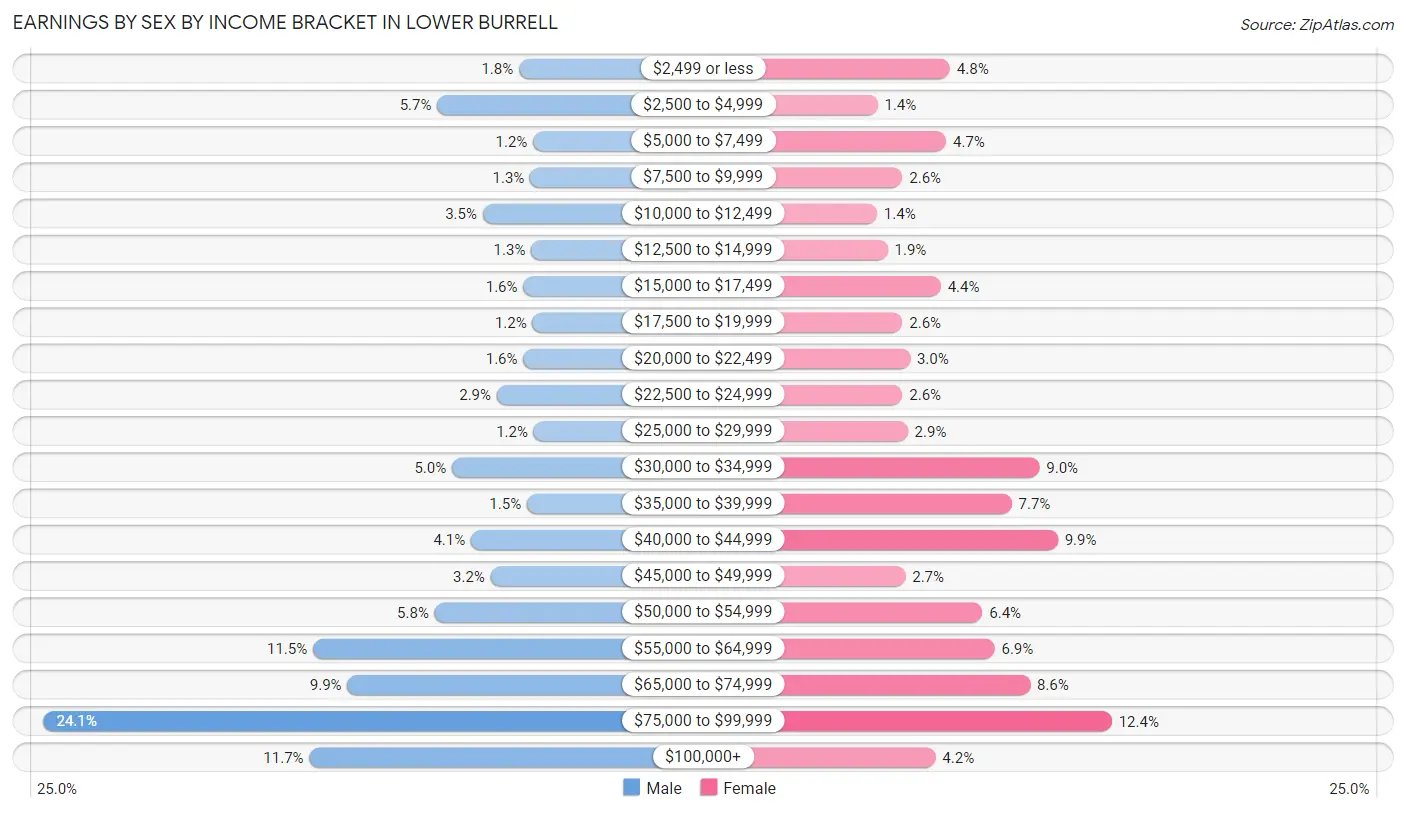
Earnings by Sex by Income Bracket in Lower Burrell
The most common earnings brackets in Lower Burrell are $75,000 to $99,999 for men (837 | 24.1%) and $75,000 to $99,999 for women (344 | 12.4%).
| Income | Male | Female |
| $2,499 or less | 64 (1.8%) | 134 (4.8%) |
| $2,500 to $4,999 | 197 (5.7%) | 40 (1.4%) |
| $5,000 to $7,499 | 41 (1.2%) | 129 (4.6%) |
| $7,500 to $9,999 | 46 (1.3%) | 72 (2.6%) |
| $10,000 to $12,499 | 123 (3.5%) | 39 (1.4%) |
| $12,500 to $14,999 | 44 (1.3%) | 53 (1.9%) |
| $15,000 to $17,499 | 57 (1.6%) | 122 (4.4%) |
| $17,500 to $19,999 | 42 (1.2%) | 72 (2.6%) |
| $20,000 to $22,499 | 57 (1.6%) | 82 (3.0%) |
| $22,500 to $24,999 | 100 (2.9%) | 72 (2.6%) |
| $25,000 to $29,999 | 40 (1.1%) | 79 (2.9%) |
| $30,000 to $34,999 | 173 (5.0%) | 250 (9.0%) |
| $35,000 to $39,999 | 51 (1.5%) | 214 (7.7%) |
| $40,000 to $44,999 | 142 (4.1%) | 274 (9.9%) |
| $45,000 to $49,999 | 110 (3.2%) | 76 (2.7%) |
| $50,000 to $54,999 | 201 (5.8%) | 176 (6.4%) |
| $55,000 to $64,999 | 399 (11.5%) | 192 (6.9%) |
| $65,000 to $74,999 | 343 (9.9%) | 238 (8.6%) |
| $75,000 to $99,999 | 837 (24.1%) | 344 (12.4%) |
| $100,000+ | 405 (11.7%) | 115 (4.2%) |
| Total | 3,472 (100.0%) | 2,773 (100.0%) |
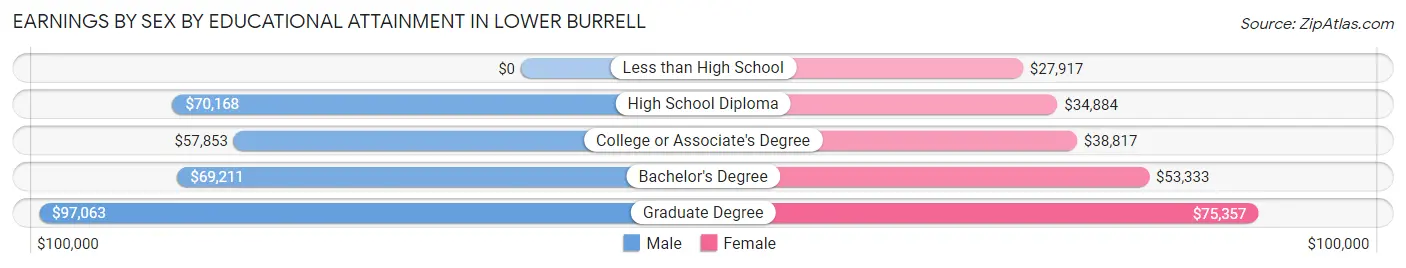
Earnings by Sex by Educational Attainment in Lower Burrell
Average earnings in Lower Burrell are $64,522 for men and $42,568 for women, a difference of 34.0%. Men with an educational attainment of graduate degree enjoy the highest average annual earnings of $97,063, while those with college or associate's degree education earn the least with $57,853. Women with an educational attainment of graduate degree earn the most with the average annual earnings of $75,357, while those with less than high school education have the smallest earnings of $27,917.
| Educational Attainment | Male Income | Female Income |
| Less than High School | - | - |
| High School Diploma | $70,168 | $34,884 |
| College or Associate's Degree | $57,853 | $38,817 |
| Bachelor's Degree | $69,211 | $53,333 |
| Graduate Degree | $97,063 | $75,357 |
| Total | $64,522 | $42,568 |
Family Income in Lower Burrell
Family Income Brackets in Lower Burrell
According to the Lower Burrell family income data, there are 899 families falling into the $100,000 to $149,999 income range, which is the most common income bracket and makes up 27.0% of all families. Conversely, the less than $10,000 income bracket is the least frequent group with only 13 families (0.4%) belonging to this category.
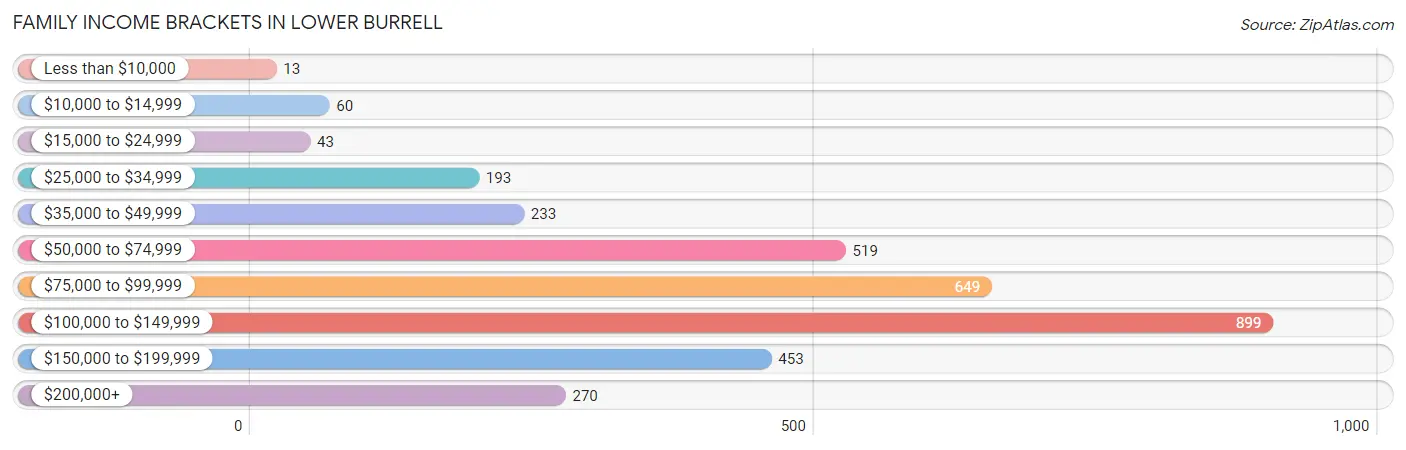
| Income Bracket | # Families | % Families |
| Less than $10,000 | 13 | 0.4% |
| $10,000 to $14,999 | 60 | 1.8% |
| $15,000 to $24,999 | 43 | 1.3% |
| $25,000 to $34,999 | 193 | 5.8% |
| $35,000 to $49,999 | 233 | 7.0% |
| $50,000 to $74,999 | 519 | 15.6% |
| $75,000 to $99,999 | 649 | 19.5% |
| $100,000 to $149,999 | 899 | 27.0% |
| $150,000 to $199,999 | 453 | 13.6% |
| $200,000+ | 270 | 8.1% |
Family Income by Famaliy Size in Lower Burrell
6-person families (56 | 1.7%) account for the highest median family income in Lower Burrell with $181,471 per family, while 3-person families (837 | 25.1%) have the highest median income of $47,649 per family member.
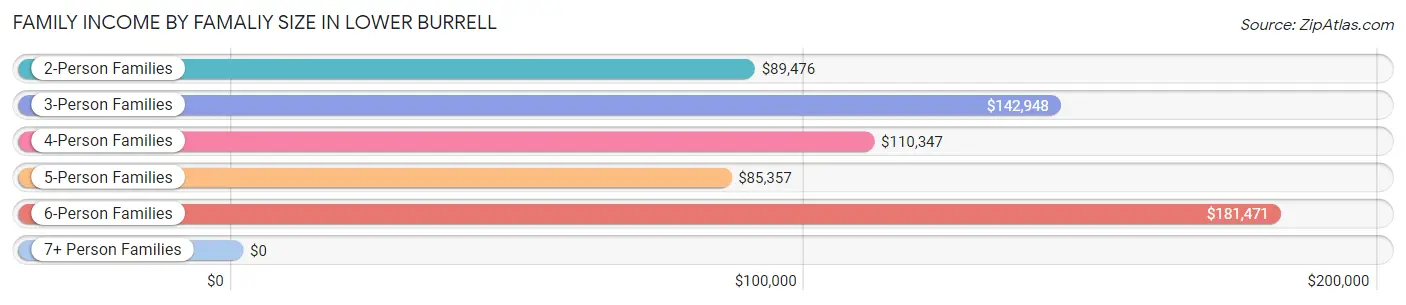
| Income Bracket | # Families | Median Income |
| 2-Person Families | 1,917 (57.6%) | $89,476 |
| 3-Person Families | 837 (25.1%) | $142,948 |
| 4-Person Families | 407 (12.2%) | $110,347 |
| 5-Person Families | 112 (3.4%) | $85,357 |
| 6-Person Families | 56 (1.7%) | $181,471 |
| 7+ Person Families | 0 (0.0%) | $0 |
| Total | 3,329 (100.0%) | $98,720 |
Family Income by Number of Earners in Lower Burrell
The median family income in Lower Burrell is $98,720, with families comprising 3+ earners (412) having the highest median family income of $143,299, while families with no earners (683) have the lowest median family income of $59,554, accounting for 12.4% and 20.5% of families, respectively.
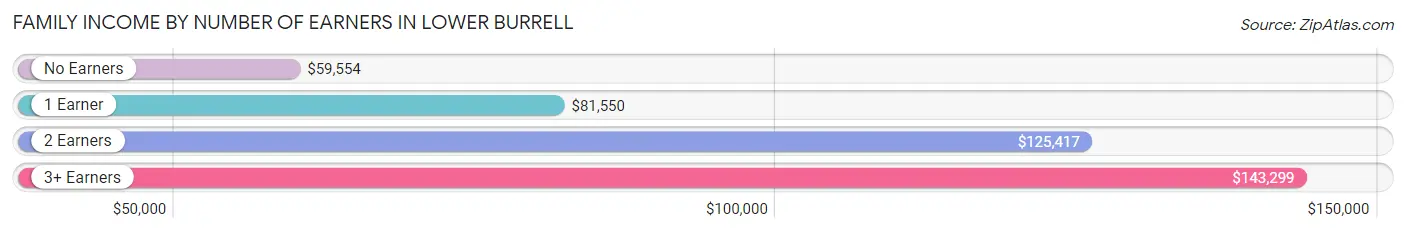
| Number of Earners | # Families | Median Income |
| No Earners | 683 (20.5%) | $59,554 |
| 1 Earner | 1,011 (30.4%) | $81,550 |
| 2 Earners | 1,223 (36.7%) | $125,417 |
| 3+ Earners | 412 (12.4%) | $143,299 |
| Total | 3,329 (100.0%) | $98,720 |
Household Income in Lower Burrell
Household Income Brackets in Lower Burrell
With 999 households falling in the category, the $100,000 to $149,999 income range is the most frequent in Lower Burrell, accounting for 18.9% of all households. In contrast, only 164 households (3.1%) fall into the less than $10,000 income bracket, making it the least populous group.
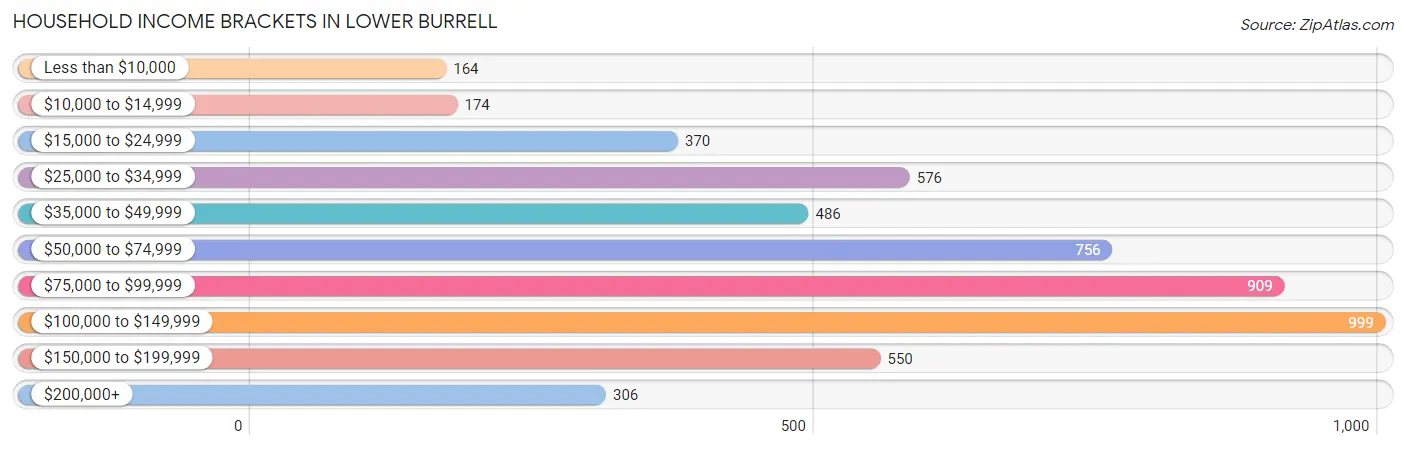
| Income Bracket | # Households | % Households |
| Less than $10,000 | 164 | 3.1% |
| $10,000 to $14,999 | 174 | 3.3% |
| $15,000 to $24,999 | 370 | 7.0% |
| $25,000 to $34,999 | 576 | 10.9% |
| $35,000 to $49,999 | 486 | 9.2% |
| $50,000 to $74,999 | 756 | 14.3% |
| $75,000 to $99,999 | 909 | 17.2% |
| $100,000 to $149,999 | 999 | 18.9% |
| $150,000 to $199,999 | 550 | 10.4% |
| $200,000+ | 306 | 5.8% |
Household Income by Householder Age in Lower Burrell
The median household income in Lower Burrell is $78,639, with the highest median household income of $95,992 found in the 45 to 64 years age bracket for the primary householder. A total of 1,932 households (36.6%) fall into this category. Meanwhile, the 15 to 24 years age bracket for the primary householder has the lowest median household income of $0, with 18 households (0.3%) in this group.
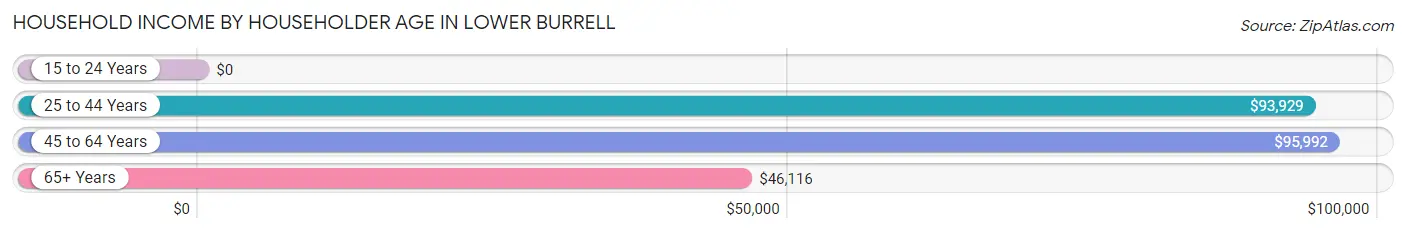
| Income Bracket | # Households | Median Income |
| 15 to 24 Years | 18 (0.3%) | $0 |
| 25 to 44 Years | 1,358 (25.7%) | $93,929 |
| 45 to 64 Years | 1,932 (36.6%) | $95,992 |
| 65+ Years | 1,976 (37.4%) | $46,116 |
| Total | 5,284 (100.0%) | $78,639 |
Poverty in Lower Burrell
Income Below Poverty by Sex and Age in Lower Burrell
With 4.3% poverty level for males and 6.9% for females among the residents of Lower Burrell, 15 year old males and 6 to 11 year old females are the most vulnerable to poverty, with 70 males (48.6%) and 59 females (22.4%) in their respective age groups living below the poverty level.
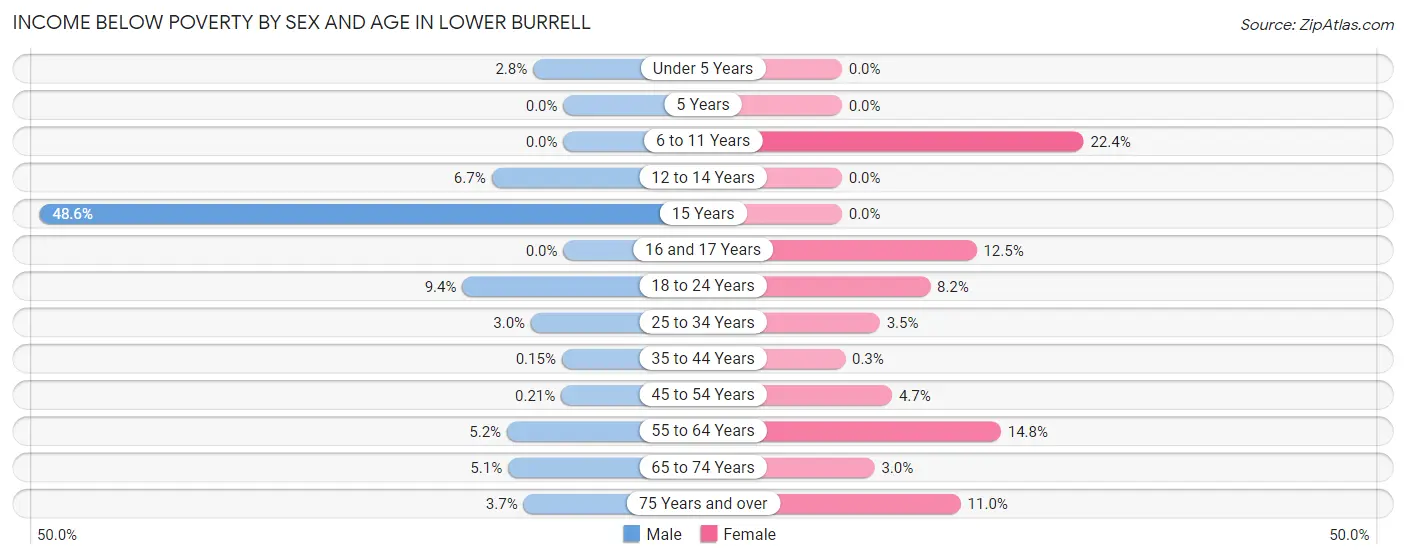
| Age Bracket | Male | Female |
| Under 5 Years | 8 (2.8%) | 0 (0.0%) |
| 5 Years | 0 (0.0%) | 0 (0.0%) |
| 6 to 11 Years | 0 (0.0%) | 59 (22.4%) |
| 12 to 14 Years | 7 (6.7%) | 0 (0.0%) |
| 15 Years | 70 (48.6%) | 0 (0.0%) |
| 16 and 17 Years | 0 (0.0%) | 17 (12.5%) |
| 18 to 24 Years | 33 (9.4%) | 28 (8.2%) |
| 25 to 34 Years | 16 (3.0%) | 25 (3.5%) |
| 35 to 44 Years | 1 (0.2%) | 2 (0.3%) |
| 45 to 54 Years | 2 (0.2%) | 31 (4.7%) |
| 55 to 64 Years | 49 (5.2%) | 128 (14.8%) |
| 65 to 74 Years | 42 (5.1%) | 25 (3.0%) |
| 75 Years and over | 18 (3.7%) | 92 (11.0%) |
| Total | 246 (4.3%) | 407 (6.9%) |
Income Above Poverty by Sex and Age in Lower Burrell
According to the poverty statistics in Lower Burrell, males aged 5 years and females aged under 5 years are the age groups that are most secure financially, with 100.0% of males and 100.0% of females in these age groups living above the poverty line.
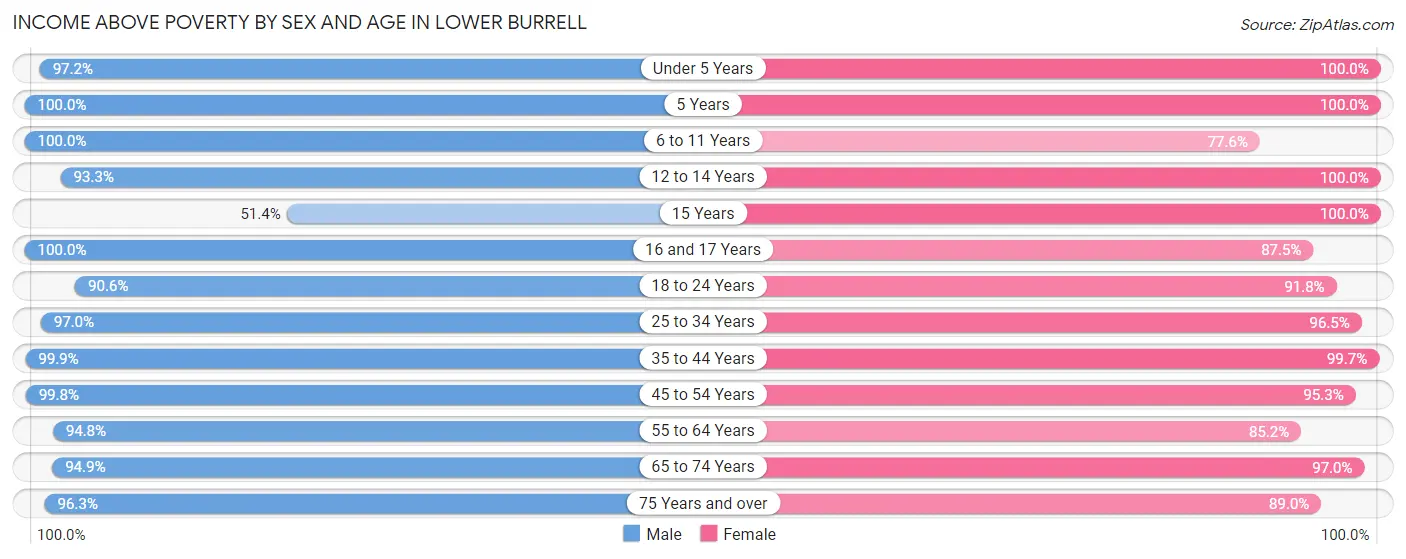
| Age Bracket | Male | Female |
| Under 5 Years | 277 (97.2%) | 282 (100.0%) |
| 5 Years | 24 (100.0%) | 40 (100.0%) |
| 6 to 11 Years | 249 (100.0%) | 204 (77.6%) |
| 12 to 14 Years | 98 (93.3%) | 218 (100.0%) |
| 15 Years | 74 (51.4%) | 34 (100.0%) |
| 16 and 17 Years | 91 (100.0%) | 119 (87.5%) |
| 18 to 24 Years | 319 (90.6%) | 314 (91.8%) |
| 25 to 34 Years | 516 (97.0%) | 686 (96.5%) |
| 35 to 44 Years | 685 (99.9%) | 656 (99.7%) |
| 45 to 54 Years | 965 (99.8%) | 634 (95.3%) |
| 55 to 64 Years | 886 (94.8%) | 739 (85.2%) |
| 65 to 74 Years | 775 (94.9%) | 799 (97.0%) |
| 75 Years and over | 469 (96.3%) | 742 (89.0%) |
| Total | 5,428 (95.7%) | 5,467 (93.1%) |
Income Below Poverty Among Married-Couple Families in Lower Burrell
The poverty statistics for married-couple families in Lower Burrell show that 1.1% or 29 of the total 2,724 families live below the poverty line. Families with 3 or 4 children have the highest poverty rate of 6.7%, comprising of 7 families. On the other hand, families with 1 or 2 children have the lowest poverty rate of 0.0%, which includes 0 families.
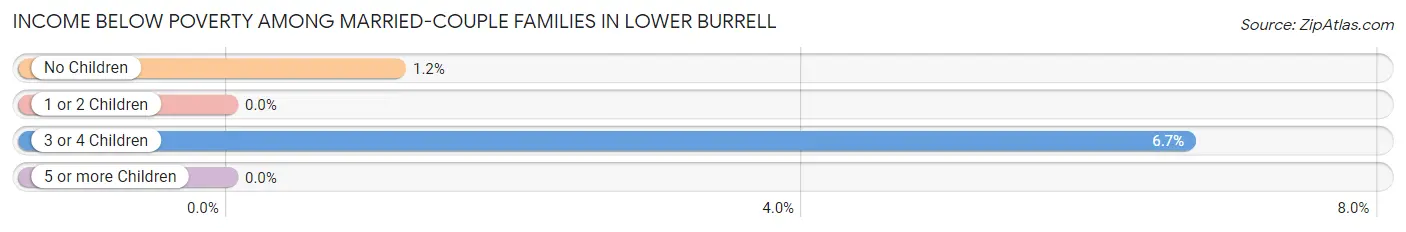
| Children | Above Poverty | Below Poverty |
| No Children | 1,859 (98.8%) | 22 (1.2%) |
| 1 or 2 Children | 738 (100.0%) | 0 (0.0%) |
| 3 or 4 Children | 98 (93.3%) | 7 (6.7%) |
| 5 or more Children | 0 (0.0%) | 0 (0.0%) |
| Total | 2,695 (98.9%) | 29 (1.1%) |
Income Below Poverty Among Single-Parent Households in Lower Burrell
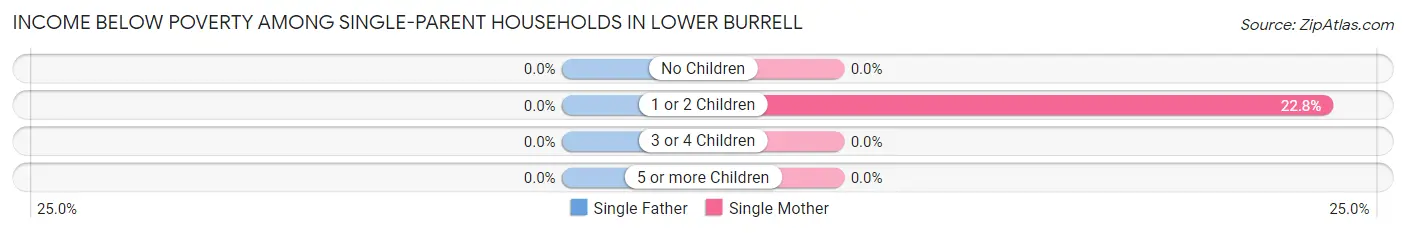
| Children | Single Father | Single Mother |
| No Children | 0 (0.0%) | 0 (0.0%) |
| 1 or 2 Children | 0 (0.0%) | 49 (22.8%) |
| 3 or 4 Children | 0 (0.0%) | 0 (0.0%) |
| 5 or more Children | 0 (0.0%) | 0 (0.0%) |
| Total | 0 (0.0%) | 49 (12.4%) |
Income Below Poverty Among Married-Couple vs Single-Parent Households in Lower Burrell
The poverty data for Lower Burrell shows that 29 of the married-couple family households (1.1%) and 49 of the single-parent households (8.1%) are living below the poverty level. Within the married-couple family households, those with 3 or 4 children have the highest poverty rate, with 7 households (6.7%) falling below the poverty line. Among the single-parent households, those with 1 or 2 children have the highest poverty rate, with 49 household (15.3%) living below poverty.
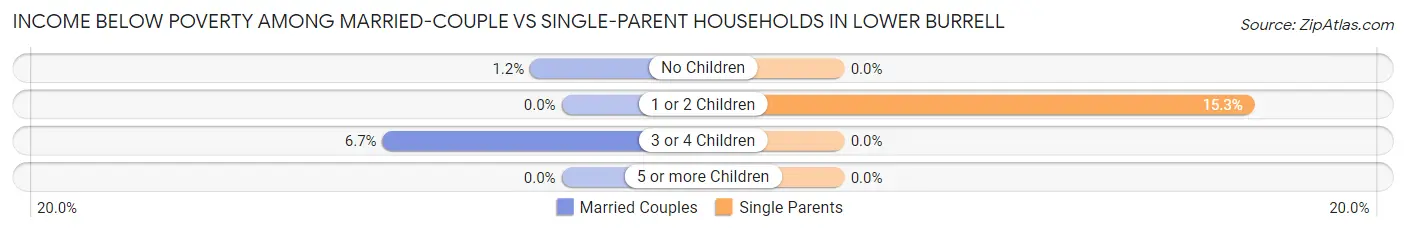
| Children | Married-Couple Families | Single-Parent Households |
| No Children | 22 (1.2%) | 0 (0.0%) |
| 1 or 2 Children | 0 (0.0%) | 49 (15.3%) |
| 3 or 4 Children | 7 (6.7%) | 0 (0.0%) |
| 5 or more Children | 0 (0.0%) | 0 (0.0%) |
| Total | 29 (1.1%) | 49 (8.1%) |
Race in Lower Burrell
The most populous races in Lower Burrell are White / Caucasian (11,311 | 96.7%), Two or more Races (262 | 2.2%), and Hispanic or Latino (119 | 1.0%).
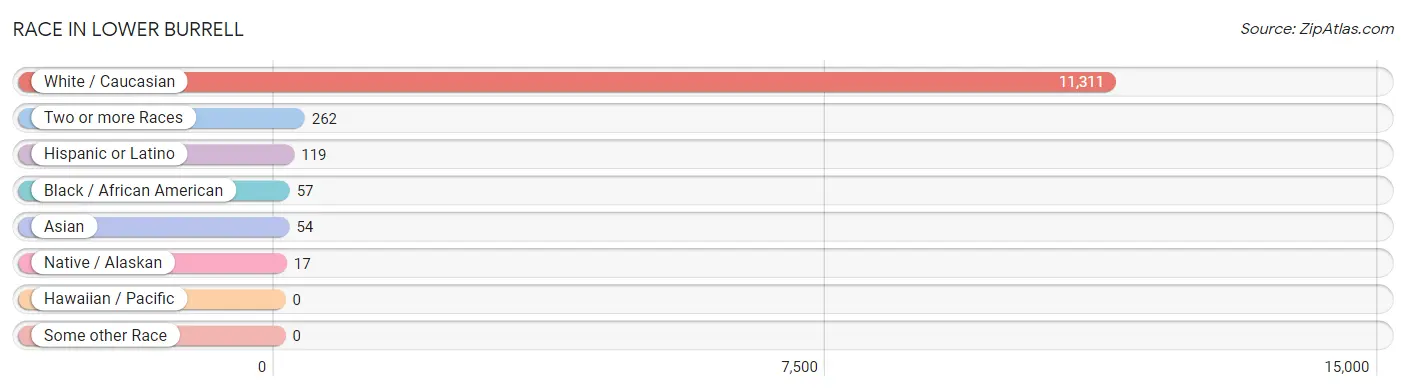
| Race | # Population | % Population |
| Asian | 54 | 0.5% |
| Black / African American | 57 | 0.5% |
| Hawaiian / Pacific | 0 | 0.0% |
| Hispanic or Latino | 119 | 1.0% |
| Native / Alaskan | 17 | 0.2% |
| White / Caucasian | 11,311 | 96.7% |
| Two or more Races | 262 | 2.2% |
| Some other Race | 0 | 0.0% |
| Total | 11,701 | 100.0% |
Ancestry in Lower Burrell
The most populous ancestries reported in Lower Burrell are German (2,776 | 23.7%), Italian (2,731 | 23.3%), Irish (2,263 | 19.3%), English (1,226 | 10.5%), and Polish (1,213 | 10.4%), together accounting for 87.3% of all Lower Burrell residents.
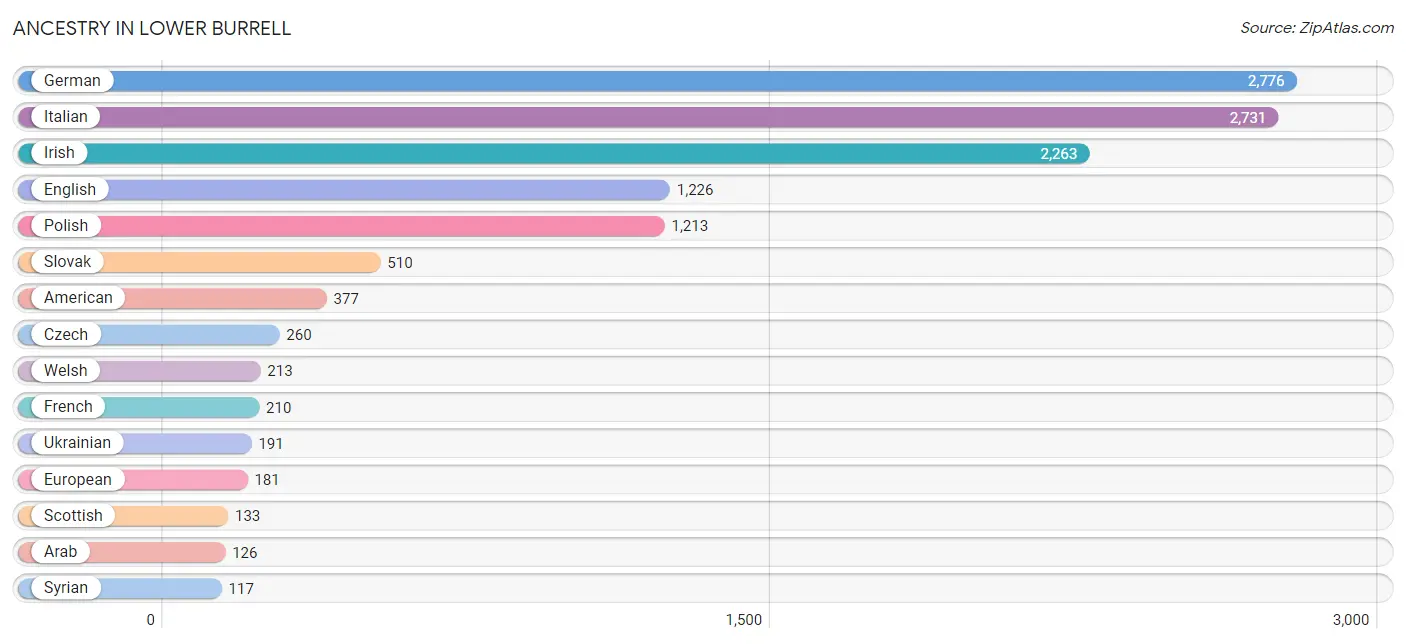
| Ancestry | # Population | % Population |
| Alaskan Athabascan | 15 | 0.1% |
| American | 377 | 3.2% |
| Arab | 126 | 1.1% |
| Austrian | 57 | 0.5% |
| Belgian | 50 | 0.4% |
| Bhutanese | 10 | 0.1% |
| Blackfeet | 1 | 0.0% |
| Bulgarian | 14 | 0.1% |
| Carpatho Rusyn | 9 | 0.1% |
| Celtic | 8 | 0.1% |
| Cherokee | 18 | 0.2% |
| Croatian | 43 | 0.4% |
| Czech | 260 | 2.2% |
| Czechoslovakian | 28 | 0.2% |
| Dutch | 59 | 0.5% |
| Eastern European | 33 | 0.3% |
| English | 1,226 | 10.5% |
| European | 181 | 1.5% |
| Filipino | 34 | 0.3% |
| French | 210 | 1.8% |
| French Canadian | 45 | 0.4% |
| German | 2,776 | 23.7% |
| Greek | 35 | 0.3% |
| Hungarian | 99 | 0.9% |
| Irish | 2,263 | 19.3% |
| Italian | 2,731 | 23.3% |
| Korean | 17 | 0.2% |
| Lebanese | 9 | 0.1% |
| Lithuanian | 29 | 0.3% |
| Mexican | 76 | 0.6% |
| Northern European | 11 | 0.1% |
| Norwegian | 71 | 0.6% |
| Pennsylvania German | 7 | 0.1% |
| Polish | 1,213 | 10.4% |
| Portuguese | 42 | 0.4% |
| Puerto Rican | 43 | 0.4% |
| Romanian | 22 | 0.2% |
| Russian | 31 | 0.3% |
| Scandinavian | 8 | 0.1% |
| Scotch-Irish | 66 | 0.6% |
| Scottish | 133 | 1.1% |
| Sioux | 10 | 0.1% |
| Slavic | 7 | 0.1% |
| Slovak | 510 | 4.4% |
| Slovene | 14 | 0.1% |
| Swedish | 111 | 0.9% |
| Swiss | 1 | 0.0% |
| Syrian | 117 | 1.0% |
| Tlingit-Haida | 15 | 0.1% |
| Turkish | 17 | 0.2% |
| Ukrainian | 191 | 1.6% |
| Welsh | 213 | 1.8% | View All 52 Rows |
Immigrants in Lower Burrell
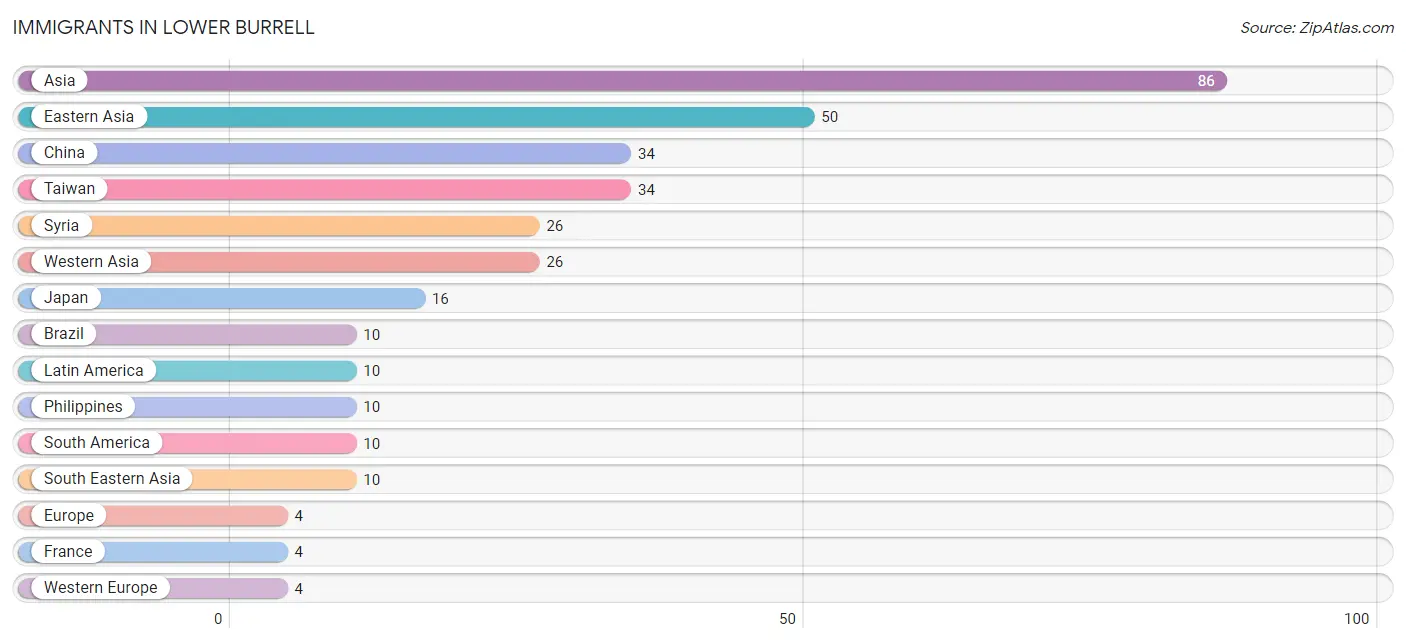
The most numerous immigrant groups reported in Lower Burrell came from Asia (86 | 0.7%), Eastern Asia (50 | 0.4%), China (34 | 0.3%), Taiwan (34 | 0.3%), and Syria (26 | 0.2%), together accounting for 2.0% of all Lower Burrell residents.
| Immigration Origin | # Population | % Population |
| Asia | 86 | 0.7% |
| Brazil | 10 | 0.1% |
| China | 34 | 0.3% |
| Eastern Asia | 50 | 0.4% |
| Europe | 4 | 0.0% |
| France | 4 | 0.0% |
| Japan | 16 | 0.1% |
| Latin America | 10 | 0.1% |
| Philippines | 10 | 0.1% |
| South America | 10 | 0.1% |
| South Eastern Asia | 10 | 0.1% |
| Syria | 26 | 0.2% |
| Taiwan | 34 | 0.3% |
| Western Asia | 26 | 0.2% |
| Western Europe | 4 | 0.0% | View All 15 Rows |
Sex and Age in Lower Burrell
Sex and Age in Lower Burrell
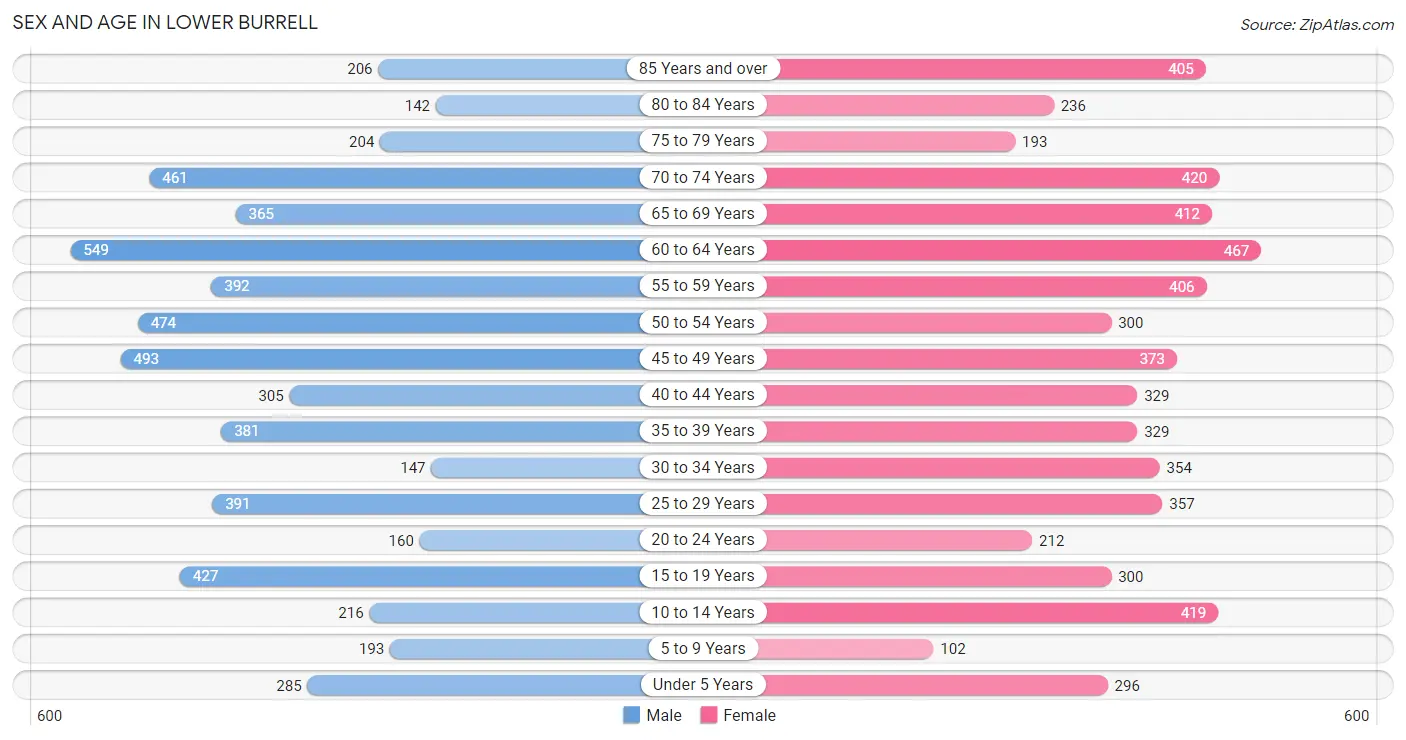
The most populous age groups in Lower Burrell are 60 to 64 Years (549 | 9.5%) for men and 60 to 64 Years (467 | 7.9%) for women.
| Age Bracket | Male | Female |
| Under 5 Years | 285 (4.9%) | 296 (5.0%) |
| 5 to 9 Years | 193 (3.3%) | 102 (1.7%) |
| 10 to 14 Years | 216 (3.7%) | 419 (7.1%) |
| 15 to 19 Years | 427 (7.4%) | 300 (5.1%) |
| 20 to 24 Years | 160 (2.8%) | 212 (3.6%) |
| 25 to 29 Years | 391 (6.8%) | 357 (6.0%) |
| 30 to 34 Years | 147 (2.5%) | 354 (6.0%) |
| 35 to 39 Years | 381 (6.6%) | 329 (5.6%) |
| 40 to 44 Years | 305 (5.3%) | 329 (5.6%) |
| 45 to 49 Years | 493 (8.5%) | 373 (6.3%) |
| 50 to 54 Years | 474 (8.2%) | 300 (5.1%) |
| 55 to 59 Years | 392 (6.8%) | 406 (6.9%) |
| 60 to 64 Years | 549 (9.5%) | 467 (7.9%) |
| 65 to 69 Years | 365 (6.3%) | 412 (7.0%) |
| 70 to 74 Years | 461 (8.0%) | 420 (7.1%) |
| 75 to 79 Years | 204 (3.5%) | 193 (3.3%) |
| 80 to 84 Years | 142 (2.5%) | 236 (4.0%) |
| 85 Years and over | 206 (3.6%) | 405 (6.9%) |
| Total | 5,791 (100.0%) | 5,910 (100.0%) |
Families and Households in Lower Burrell
Median Family Size in Lower Burrell
The median family size in Lower Burrell is 2.73 persons per family, with married-couple families (2,724 | 81.8%) accounting for the largest median family size of 2.79 persons per family. On the other hand, single male/father families (209 | 6.3%) represent the smallest median family size with 2.15 persons per family.
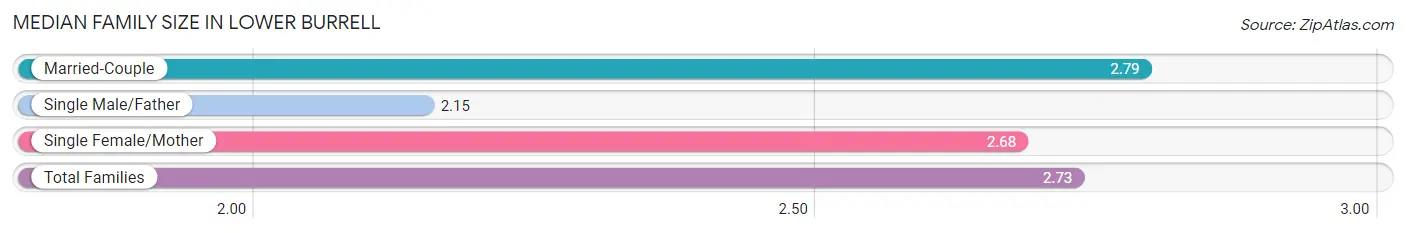
| Family Type | # Families | Family Size |
| Married-Couple | 2,724 (81.8%) | 2.79 |
| Single Male/Father | 209 (6.3%) | 2.15 |
| Single Female/Mother | 396 (11.9%) | 2.68 |
| Total Families | 3,329 (100.0%) | 2.73 |
Median Household Size in Lower Burrell
The median household size in Lower Burrell is 2.19 persons per household, with single female/mother households (396 | 7.5%) accounting for the largest median household size of 3.08 persons per household. non-family households (1,955 | 37.0%) represent the smallest median household size with 1.12 persons per household.
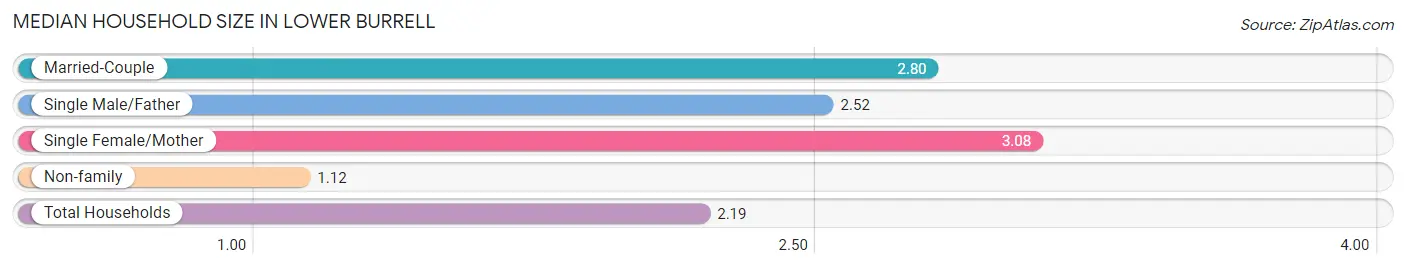
| Household Type | # Households | Household Size |
| Married-Couple | 2,724 (51.5%) | 2.80 |
| Single Male/Father | 209 (4.0%) | 2.52 |
| Single Female/Mother | 396 (7.5%) | 3.08 |
| Non-family | 1,955 (37.0%) | 1.12 |
| Total Households | 5,284 (100.0%) | 2.19 |
Household Size by Marriage Status in Lower Burrell
Out of a total of 5,284 households in Lower Burrell, 3,329 (63.0%) are family households, while 1,955 (37.0%) are nonfamily households. The most numerous type of family households are 2-person households, comprising 1,798, and the most common type of nonfamily households are 1-person households, comprising 1,768.
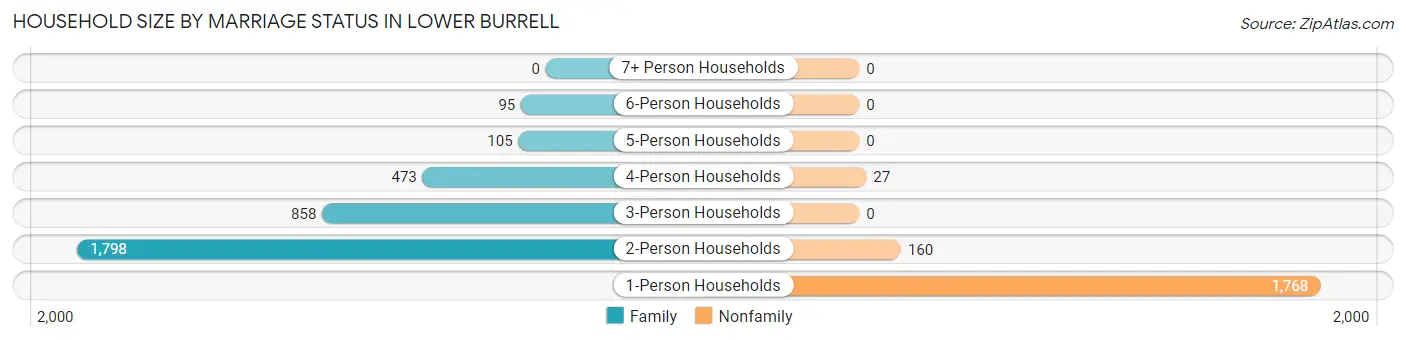
| Household Size | Family Households | Nonfamily Households |
| 1-Person Households | - | 1,768 (33.5%) |
| 2-Person Households | 1,798 (34.0%) | 160 (3.0%) |
| 3-Person Households | 858 (16.2%) | 0 (0.0%) |
| 4-Person Households | 473 (8.9%) | 27 (0.5%) |
| 5-Person Households | 105 (2.0%) | 0 (0.0%) |
| 6-Person Households | 95 (1.8%) | 0 (0.0%) |
| 7+ Person Households | 0 (0.0%) | 0 (0.0%) |
| Total | 3,329 (63.0%) | 1,955 (37.0%) |
Female Fertility in Lower Burrell
Fertility by Age in Lower Burrell
Average fertility rate in Lower Burrell is 83.0 births per 1,000 women. Women in the age bracket of 20 to 34 years have the highest fertility rate with 159.0 births per 1,000 women. Women in the age bracket of 20 to 34 years acount for 75.8% of all women with births.
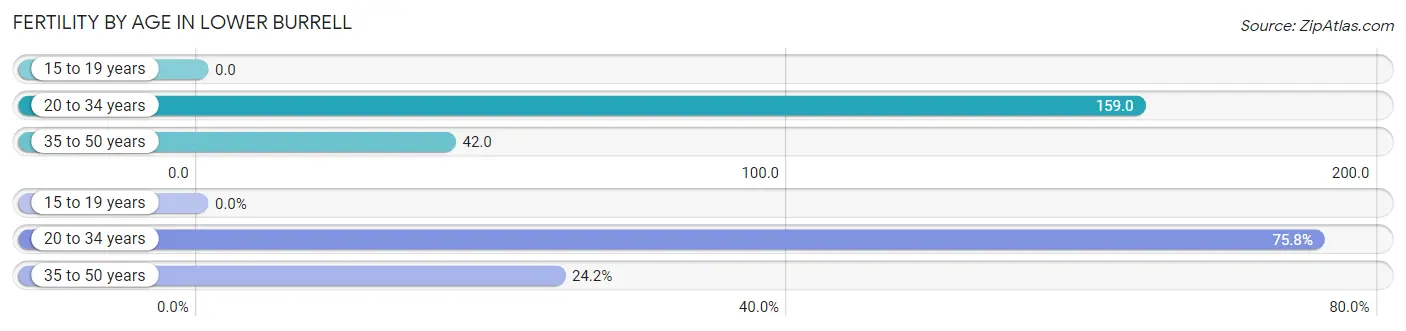
| Age Bracket | Women with Births | Births / 1,000 Women |
| 15 to 19 years | 0 (0.0%) | 0.0 |
| 20 to 34 years | 147 (75.8%) | 159.0 |
| 35 to 50 years | 47 (24.2%) | 42.0 |
| Total | 194 (100.0%) | 83.0 |
Fertility by Age by Marriage Status in Lower Burrell
90.2% of women with births (194) in Lower Burrell are married. The highest percentage of unmarried women with births falls into 35 to 50 years age bracket with 40.4% of them unmarried at the time of birth, while the lowest percentage of unmarried women with births belong to 20 to 34 years age bracket with 0.0% of them unmarried.
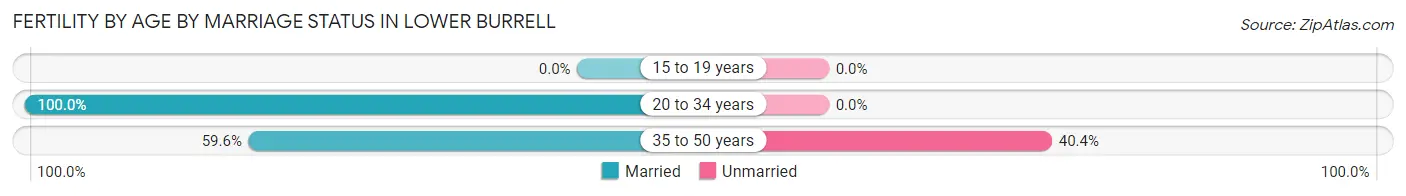
| Age Bracket | Married | Unmarried |
| 15 to 19 years | 0 (0.0%) | 0 (0.0%) |
| 20 to 34 years | 147 (100.0%) | 0 (0.0%) |
| 35 to 50 years | 28 (59.6%) | 19 (40.4%) |
| Total | 175 (90.2%) | 19 (9.8%) |
Fertility by Education in Lower Burrell
Average fertility rate in Lower Burrell is 83.0 births per 1,000 women. Women with the education attainment of bachelor's degree have the highest fertility rate of 225.0 births per 1,000 women, while women with the education attainment of high school diploma have the lowest fertility at 18.0 births per 1,000 women. Women with the education attainment of bachelor's degree represent 59.3% of all women with births.
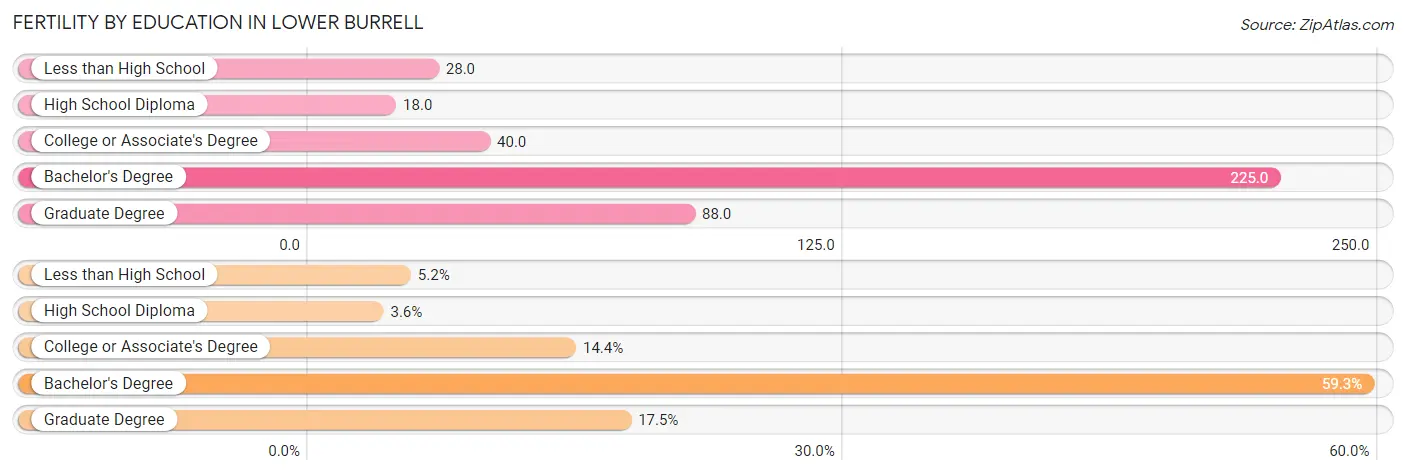
| Educational Attainment | Women with Births | Births / 1,000 Women |
| Less than High School | 10 (5.1%) | 28.0 |
| High School Diploma | 7 (3.6%) | 18.0 |
| College or Associate's Degree | 28 (14.4%) | 40.0 |
| Bachelor's Degree | 115 (59.3%) | 225.0 |
| Graduate Degree | 34 (17.5%) | 88.0 |
| Total | 194 (100.0%) | 83.0 |
Fertility by Education by Marriage Status in Lower Burrell
9.8% of women with births in Lower Burrell are unmarried. Women with the educational attainment of less than high school are most likely to be married with 100.0% of them married at childbirth, while women with the educational attainment of college or associate's degree are least likely to be married with 67.9% of them unmarried at childbirth.
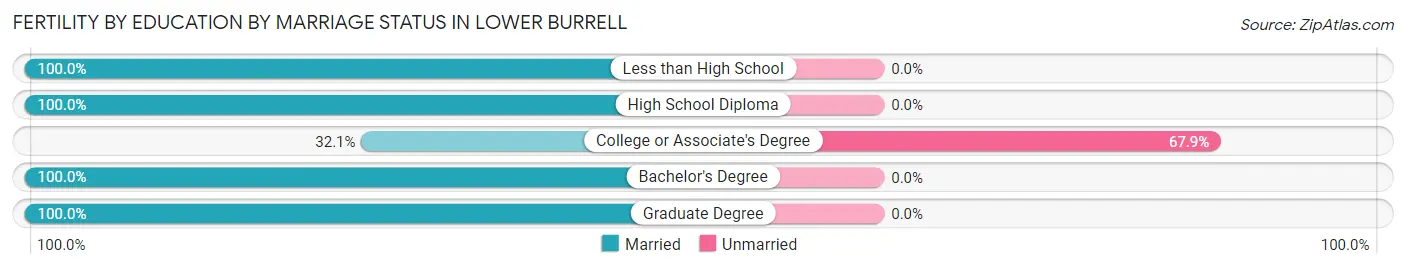
| Educational Attainment | Married | Unmarried |
| Less than High School | 10 (100.0%) | 0 (0.0%) |
| High School Diploma | 7 (100.0%) | 0 (0.0%) |
| College or Associate's Degree | 9 (32.1%) | 19 (67.9%) |
| Bachelor's Degree | 115 (100.0%) | 0 (0.0%) |
| Graduate Degree | 34 (100.0%) | 0 (0.0%) |
| Total | 175 (90.2%) | 19 (9.8%) |
Employment Characteristics in Lower Burrell
Employment by Class of Employer in Lower Burrell
Among the 5,633 employed individuals in Lower Burrell, private company employees (3,974 | 70.6%), not-for-profit organizations (738 | 13.1%), and local government employees (442 | 7.9%) make up the most common classes of employment.
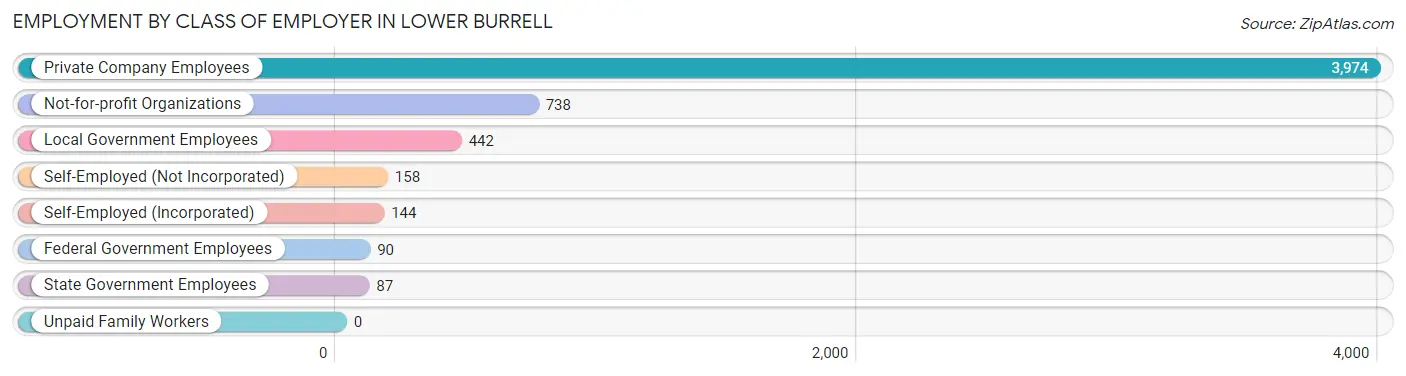
| Employer Class | # Employees | % Employees |
| Private Company Employees | 3,974 | 70.6% |
| Self-Employed (Incorporated) | 144 | 2.6% |
| Self-Employed (Not Incorporated) | 158 | 2.8% |
| Not-for-profit Organizations | 738 | 13.1% |
| Local Government Employees | 442 | 7.9% |
| State Government Employees | 87 | 1.5% |
| Federal Government Employees | 90 | 1.6% |
| Unpaid Family Workers | 0 | 0.0% |
| Total | 5,633 | 100.0% |
Employment Status by Age in Lower Burrell
According to the labor force statistics for Lower Burrell, out of the total population over 16 years of age (10,012), 58.3% or 5,837 individuals are in the labor force, with 2.2% or 128 of them unemployed. The age group with the highest labor force participation rate is 25 to 29 years, with 96.1% or 719 individuals in the labor force. Within the labor force, the 75 years and over age range has the highest percentage of unemployed individuals, with 9.3% or 12 of them being unemployed.
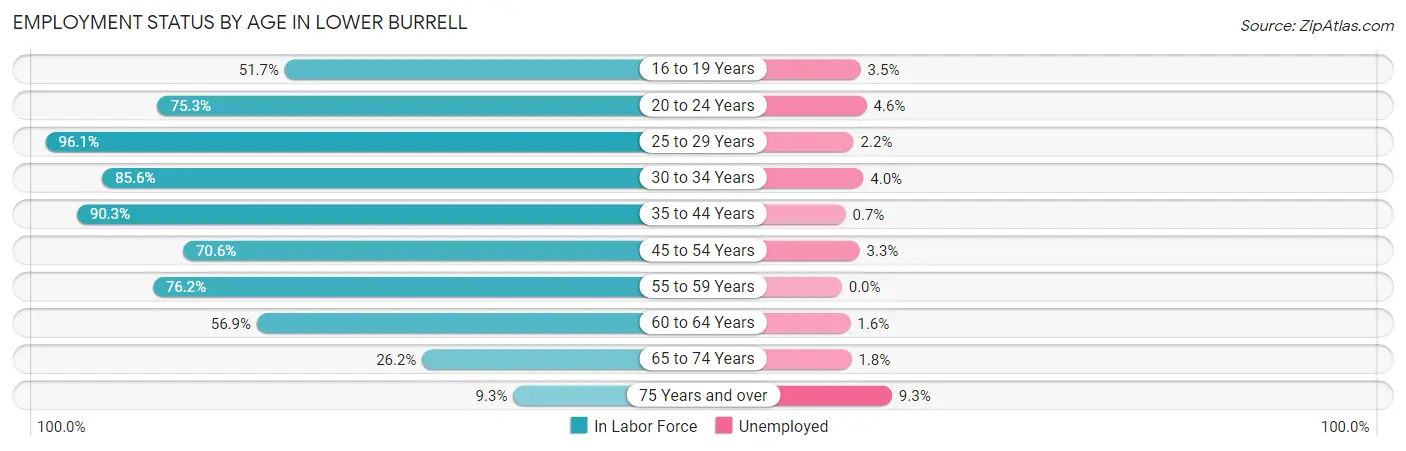
| Age Bracket | In Labor Force | Unemployed |
| 16 to 19 Years | 284 (51.7%) | 10 (3.5%) |
| 20 to 24 Years | 280 (75.3%) | 13 (4.6%) |
| 25 to 29 Years | 719 (96.1%) | 16 (2.2%) |
| 30 to 34 Years | 429 (85.6%) | 17 (4.0%) |
| 35 to 44 Years | 1,214 (90.3%) | 8 (0.7%) |
| 45 to 54 Years | 1,158 (70.6%) | 38 (3.3%) |
| 55 to 59 Years | 608 (76.2%) | 0 (0.0%) |
| 60 to 64 Years | 578 (56.9%) | 9 (1.6%) |
| 65 to 74 Years | 434 (26.2%) | 8 (1.8%) |
| 75 Years and over | 129 (9.3%) | 12 (9.3%) |
| Total | 5,837 (58.3%) | 128 (2.2%) |
Employment Status by Educational Attainment in Lower Burrell
According to labor force statistics for Lower Burrell, 77.8% of individuals (4,705) out of the total population between 25 and 64 years of age (6,047) are in the labor force, with 1.9% or 89 of them being unemployed. The group with the highest labor force participation rate are those with the educational attainment of bachelor's degree or higher, with 89.8% or 2,158 individuals in the labor force. Within the labor force, individuals with bachelor's degree or higher education have the highest percentage of unemployment, with 2.8% or 60 of them being unemployed.
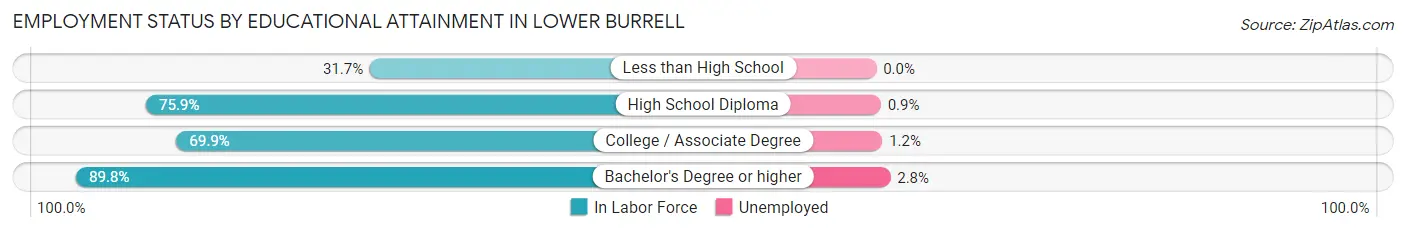
| Educational Attainment | In Labor Force | Unemployed |
| Less than High School | 69 (31.7%) | 0 (0.0%) |
| High School Diploma | 1,079 (75.9%) | 13 (0.9%) |
| College / Associate Degree | 1,401 (69.9%) | 24 (1.2%) |
| Bachelor's Degree or higher | 2,158 (89.8%) | 67 (2.8%) |
| Total | 4,705 (77.8%) | 115 (1.9%) |
Employment Occupations by Sex in Lower Burrell
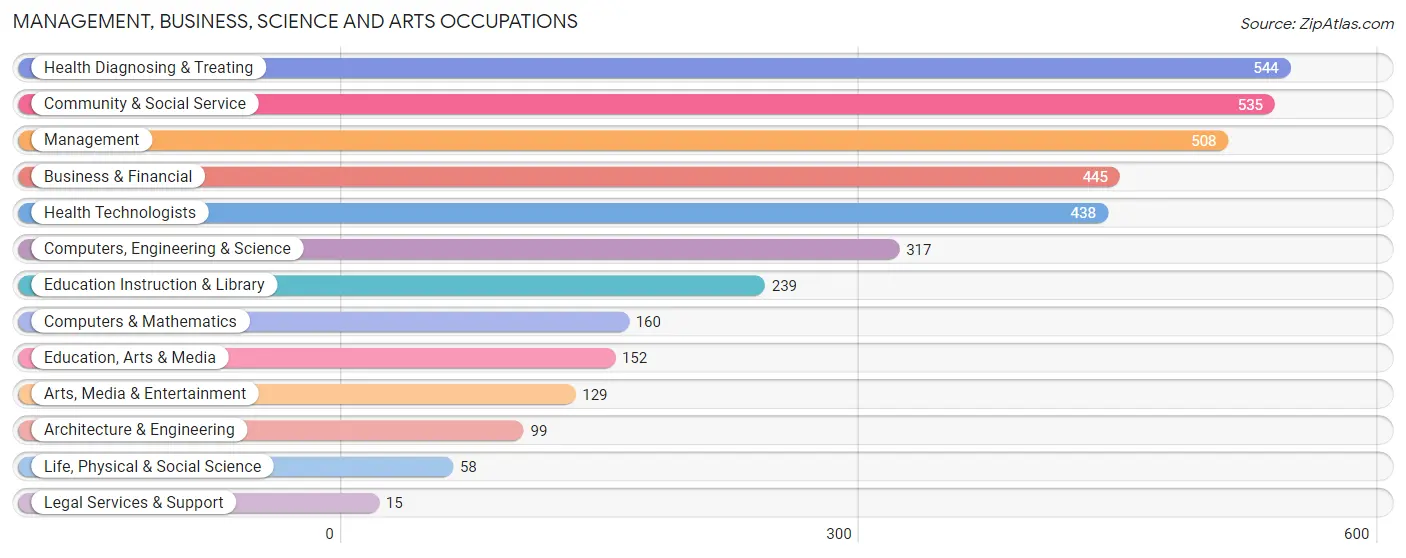
Management, Business, Science and Arts Occupations
The most common Management, Business, Science and Arts occupations in Lower Burrell are Health Diagnosing & Treating (544 | 9.5%), Community & Social Service (535 | 9.4%), Management (508 | 8.9%), Business & Financial (445 | 7.8%), and Health Technologists (438 | 7.7%).
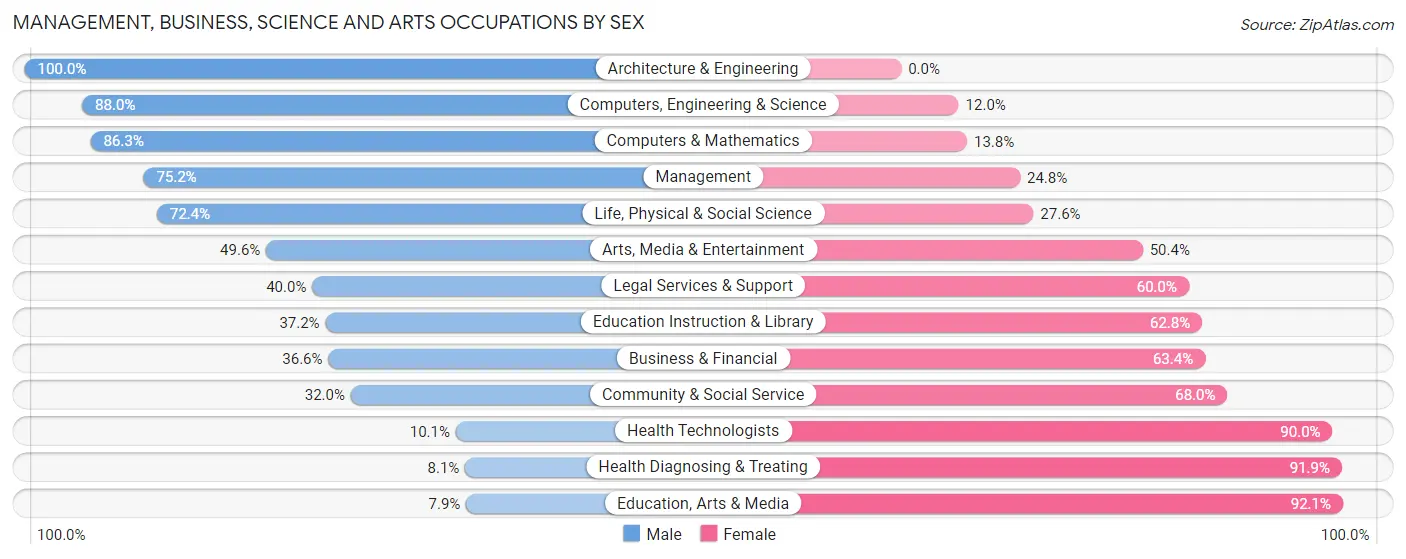
Management, Business, Science and Arts Occupations by Sex
Within the Management, Business, Science and Arts occupations in Lower Burrell, the most male-oriented occupations are Architecture & Engineering (100.0%), Computers, Engineering & Science (88.0%), and Computers & Mathematics (86.3%), while the most female-oriented occupations are Education, Arts & Media (92.1%), Health Diagnosing & Treating (91.9%), and Health Technologists (89.9%).
| Occupation | Male | Female |
| Management | 382 (75.2%) | 126 (24.8%) |
| Business & Financial | 163 (36.6%) | 282 (63.4%) |
| Computers, Engineering & Science | 279 (88.0%) | 38 (12.0%) |
| Computers & Mathematics | 138 (86.3%) | 22 (13.8%) |
| Architecture & Engineering | 99 (100.0%) | 0 (0.0%) |
| Life, Physical & Social Science | 42 (72.4%) | 16 (27.6%) |
| Community & Social Service | 171 (32.0%) | 364 (68.0%) |
| Education, Arts & Media | 12 (7.9%) | 140 (92.1%) |
| Legal Services & Support | 6 (40.0%) | 9 (60.0%) |
| Education Instruction & Library | 89 (37.2%) | 150 (62.8%) |
| Arts, Media & Entertainment | 64 (49.6%) | 65 (50.4%) |
| Health Diagnosing & Treating | 44 (8.1%) | 500 (91.9%) |
| Health Technologists | 44 (10.1%) | 394 (89.9%) |
| Total (Category) | 1,039 (44.2%) | 1,310 (55.8%) |
| Total (Overall) | 3,151 (55.2%) | 2,552 (44.8%) |
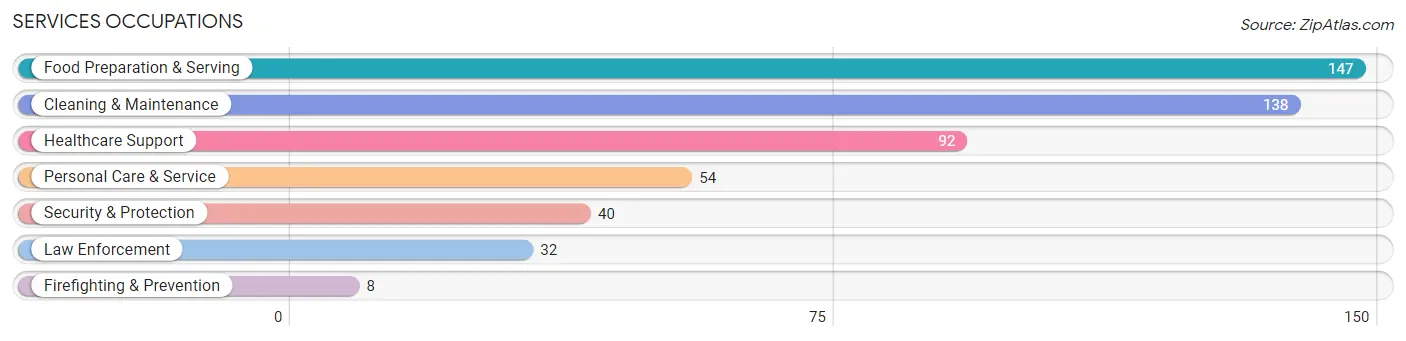
Services Occupations
The most common Services occupations in Lower Burrell are Food Preparation & Serving (147 | 2.6%), Cleaning & Maintenance (138 | 2.4%), Healthcare Support (92 | 1.6%), Personal Care & Service (54 | 0.9%), and Security & Protection (40 | 0.7%).
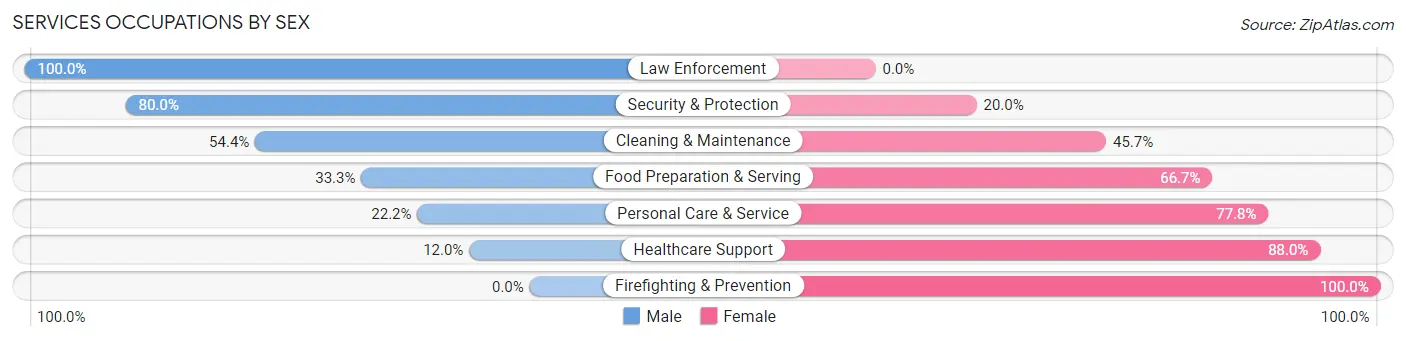
Services Occupations by Sex
Within the Services occupations in Lower Burrell, the most male-oriented occupations are Law Enforcement (100.0%), Security & Protection (80.0%), and Cleaning & Maintenance (54.3%), while the most female-oriented occupations are Firefighting & Prevention (100.0%), Healthcare Support (88.0%), and Personal Care & Service (77.8%).
| Occupation | Male | Female |
| Healthcare Support | 11 (12.0%) | 81 (88.0%) |
| Security & Protection | 32 (80.0%) | 8 (20.0%) |
| Firefighting & Prevention | 0 (0.0%) | 8 (100.0%) |
| Law Enforcement | 32 (100.0%) | 0 (0.0%) |
| Food Preparation & Serving | 49 (33.3%) | 98 (66.7%) |
| Cleaning & Maintenance | 75 (54.3%) | 63 (45.7%) |
| Personal Care & Service | 12 (22.2%) | 42 (77.8%) |
| Total (Category) | 179 (38.0%) | 292 (62.0%) |
| Total (Overall) | 3,151 (55.2%) | 2,552 (44.8%) |
Sales and Office Occupations
The most common Sales and Office occupations in Lower Burrell are Sales & Related (720 | 12.6%), and Office & Administration (610 | 10.7%).

Sales and Office Occupations by Sex
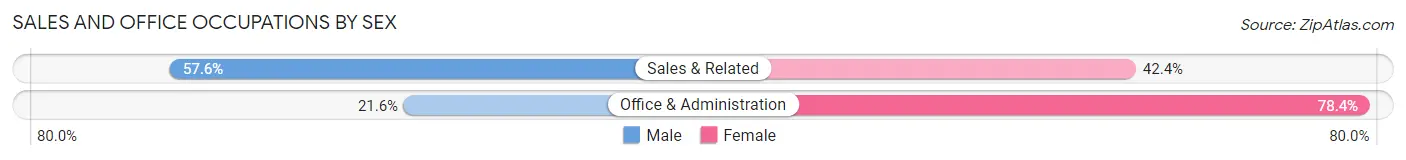
| Occupation | Male | Female |
| Sales & Related | 415 (57.6%) | 305 (42.4%) |
| Office & Administration | 132 (21.6%) | 478 (78.4%) |
| Total (Category) | 547 (41.1%) | 783 (58.9%) |
| Total (Overall) | 3,151 (55.2%) | 2,552 (44.8%) |
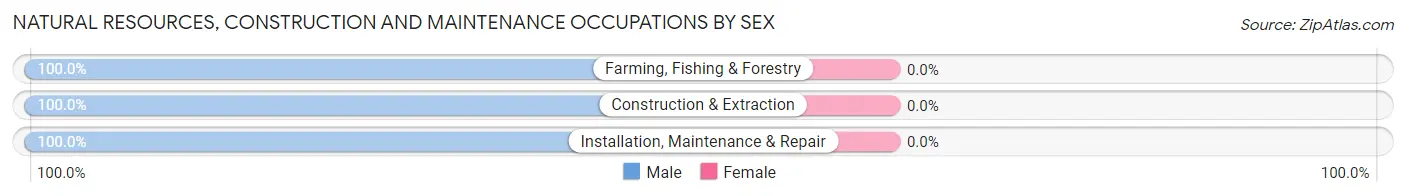
Natural Resources, Construction and Maintenance Occupations
The most common Natural Resources, Construction and Maintenance occupations in Lower Burrell are Construction & Extraction (306 | 5.4%), Installation, Maintenance & Repair (204 | 3.6%), and Farming, Fishing & Forestry (15 | 0.3%).

Natural Resources, Construction and Maintenance Occupations by Sex
| Occupation | Male | Female |
| Farming, Fishing & Forestry | 15 (100.0%) | 0 (0.0%) |
| Construction & Extraction | 306 (100.0%) | 0 (0.0%) |
| Installation, Maintenance & Repair | 204 (100.0%) | 0 (0.0%) |
| Total (Category) | 525 (100.0%) | 0 (0.0%) |
| Total (Overall) | 3,151 (55.2%) | 2,552 (44.8%) |
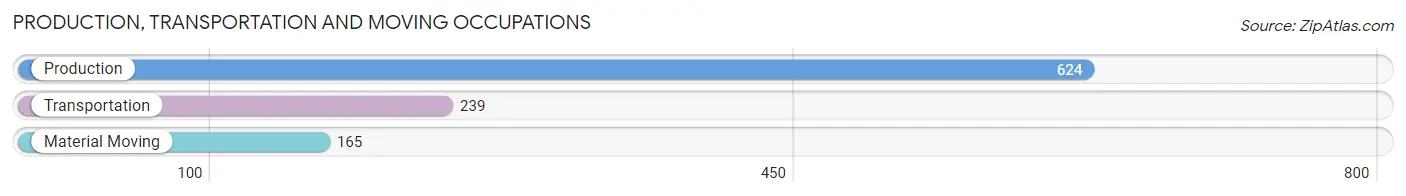
Production, Transportation and Moving Occupations
The most common Production, Transportation and Moving occupations in Lower Burrell are Production (624 | 10.9%), Transportation (239 | 4.2%), and Material Moving (165 | 2.9%).
Production, Transportation and Moving Occupations by Sex
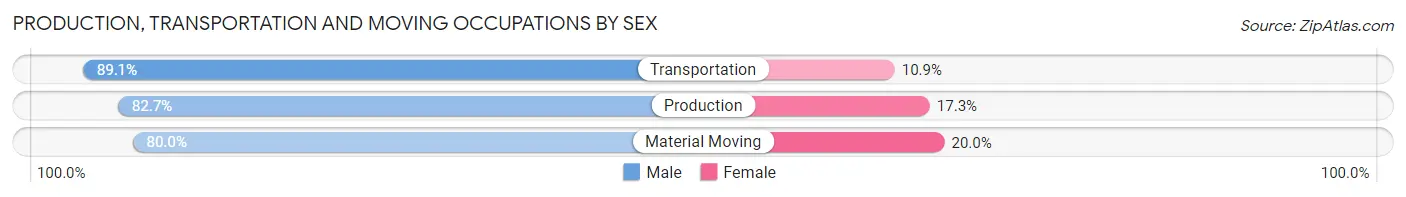
| Occupation | Male | Female |
| Production | 516 (82.7%) | 108 (17.3%) |
| Transportation | 213 (89.1%) | 26 (10.9%) |
| Material Moving | 132 (80.0%) | 33 (20.0%) |
| Total (Category) | 861 (83.8%) | 167 (16.3%) |
| Total (Overall) | 3,151 (55.2%) | 2,552 (44.8%) |
Employment Industries by Sex in Lower Burrell
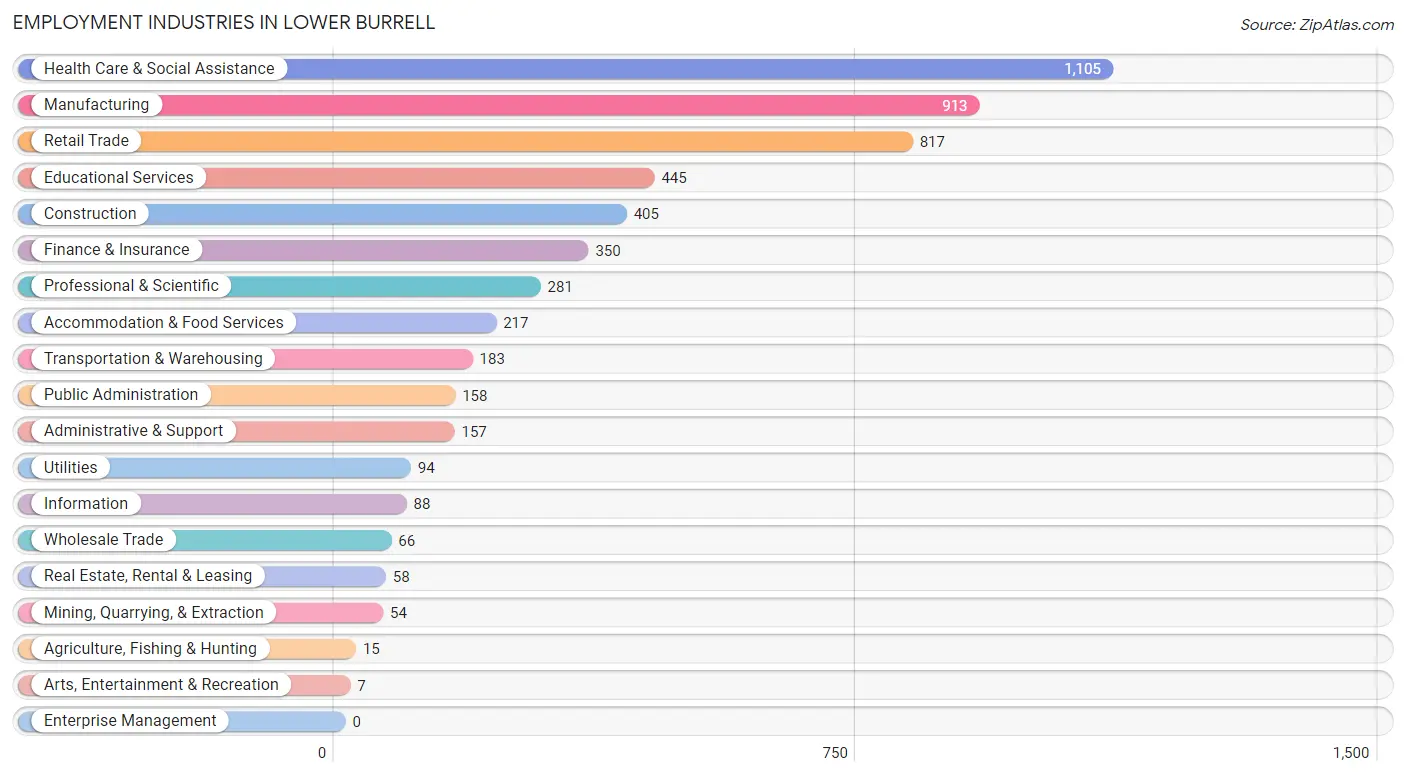
Employment Industries in Lower Burrell
The major employment industries in Lower Burrell include Health Care & Social Assistance (1,105 | 19.4%), Manufacturing (913 | 16.0%), Retail Trade (817 | 14.3%), Educational Services (445 | 7.8%), and Construction (405 | 7.1%).
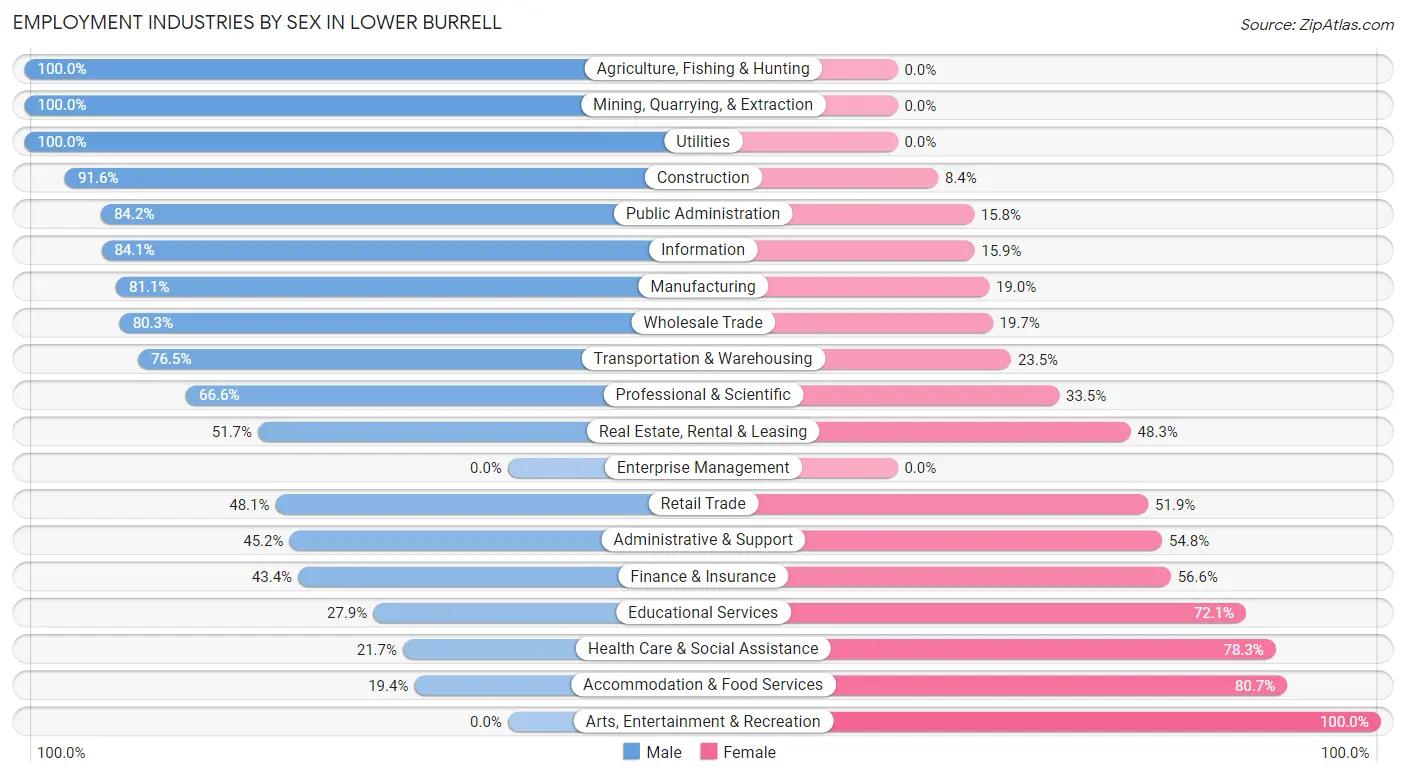
Employment Industries by Sex in Lower Burrell
The Lower Burrell industries that see more men than women are Agriculture, Fishing & Hunting (100.0%), Mining, Quarrying, & Extraction (100.0%), and Utilities (100.0%), whereas the industries that tend to have a higher number of women are Arts, Entertainment & Recreation (100.0%), Accommodation & Food Services (80.6%), and Health Care & Social Assistance (78.3%).
| Industry | Male | Female |
| Agriculture, Fishing & Hunting | 15 (100.0%) | 0 (0.0%) |
| Mining, Quarrying, & Extraction | 54 (100.0%) | 0 (0.0%) |
| Construction | 371 (91.6%) | 34 (8.4%) |
| Manufacturing | 740 (81.0%) | 173 (19.0%) |
| Wholesale Trade | 53 (80.3%) | 13 (19.7%) |
| Retail Trade | 393 (48.1%) | 424 (51.9%) |
| Transportation & Warehousing | 140 (76.5%) | 43 (23.5%) |
| Utilities | 94 (100.0%) | 0 (0.0%) |
| Information | 74 (84.1%) | 14 (15.9%) |
| Finance & Insurance | 152 (43.4%) | 198 (56.6%) |
| Real Estate, Rental & Leasing | 30 (51.7%) | 28 (48.3%) |
| Professional & Scientific | 187 (66.5%) | 94 (33.5%) |
| Enterprise Management | 0 (0.0%) | 0 (0.0%) |
| Administrative & Support | 71 (45.2%) | 86 (54.8%) |
| Educational Services | 124 (27.9%) | 321 (72.1%) |
| Health Care & Social Assistance | 240 (21.7%) | 865 (78.3%) |
| Arts, Entertainment & Recreation | 0 (0.0%) | 7 (100.0%) |
| Accommodation & Food Services | 42 (19.4%) | 175 (80.6%) |
| Public Administration | 133 (84.2%) | 25 (15.8%) |
| Total | 3,151 (55.2%) | 2,552 (44.8%) |
Education in Lower Burrell
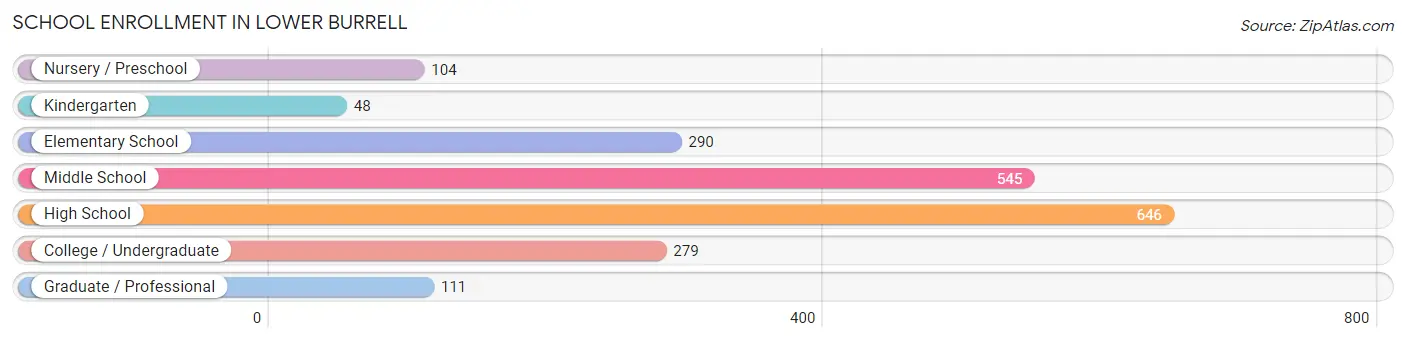
School Enrollment in Lower Burrell
The most common levels of schooling among the 2,023 students in Lower Burrell are high school (646 | 31.9%), middle school (545 | 26.9%), and elementary school (290 | 14.3%).
| School Level | # Students | % Students |
| Nursery / Preschool | 104 | 5.1% |
| Kindergarten | 48 | 2.4% |
| Elementary School | 290 | 14.3% |
| Middle School | 545 | 26.9% |
| High School | 646 | 31.9% |
| College / Undergraduate | 279 | 13.8% |
| Graduate / Professional | 111 | 5.5% |
| Total | 2,023 | 100.0% |
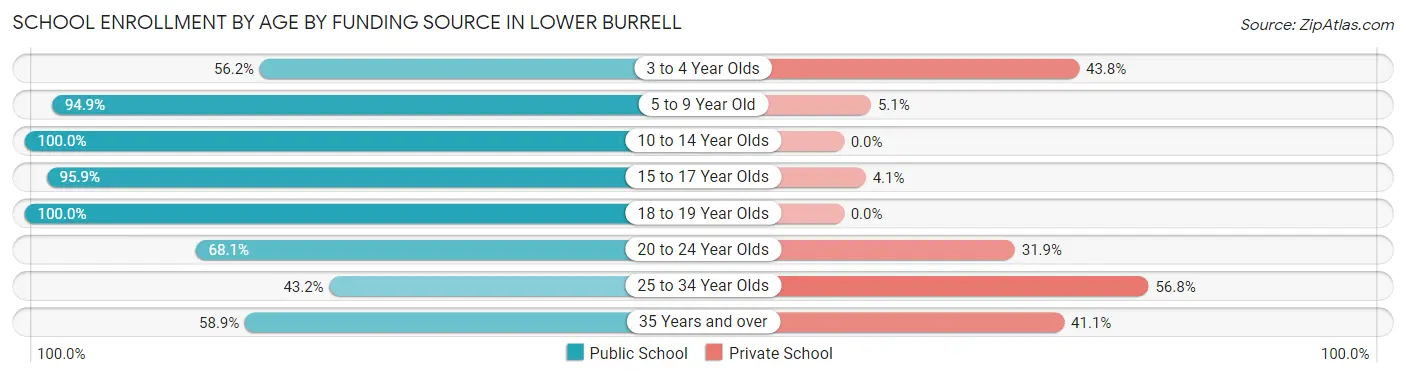
School Enrollment by Age by Funding Source in Lower Burrell
Out of a total of 2,023 students who are enrolled in schools in Lower Burrell, 210 (10.4%) attend a private institution, while the remaining 1,813 (89.6%) are enrolled in public schools. The age group of 25 to 34 year olds has the highest likelihood of being enrolled in private schools, with 67 (56.8% in the age bracket) enrolled. Conversely, the age group of 10 to 14 year olds has the lowest likelihood of being enrolled in a private school, with 635 (100.0% in the age bracket) attending a public institution.
| Age Bracket | Public School | Private School |
| 3 to 4 Year Olds | 41 (56.2%) | 32 (43.8%) |
| 5 to 9 Year Old | 280 (94.9%) | 15 (5.1%) |
| 10 to 14 Year Olds | 635 (100.0%) | 0 (0.0%) |
| 15 to 17 Year Olds | 373 (95.9%) | 16 (4.1%) |
| 18 to 19 Year Olds | 275 (100.0%) | 0 (0.0%) |
| 20 to 24 Year Olds | 124 (68.1%) | 58 (31.9%) |
| 25 to 34 Year Olds | 51 (43.2%) | 67 (56.8%) |
| 35 Years and over | 33 (58.9%) | 23 (41.1%) |
| Total | 1,813 (89.6%) | 210 (10.4%) |
Educational Attainment by Field of Study in Lower Burrell
Science & technology (640 | 19.9%), business (537 | 16.7%), education (529 | 16.5%), arts & humanities (295 | 9.2%), and psychology (183 | 5.7%) are the most common fields of study among 3,212 individuals in Lower Burrell who have obtained a bachelor's degree or higher.
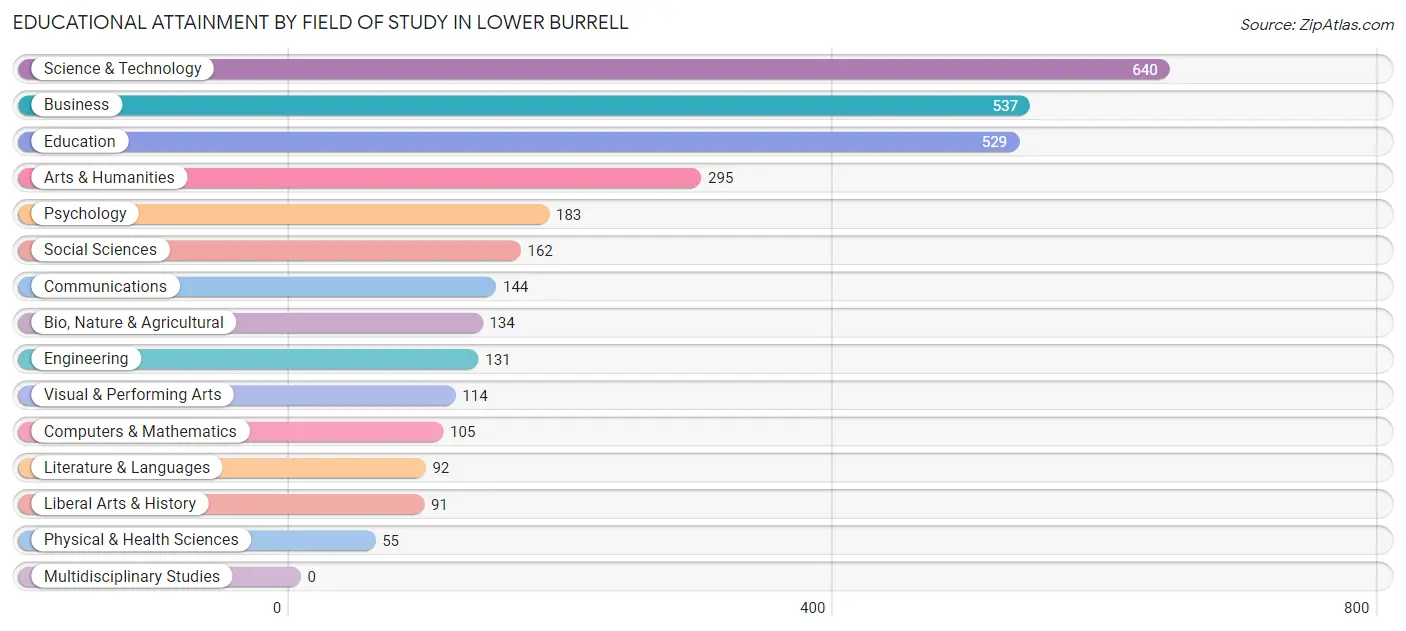
| Field of Study | # Graduates | % Graduates |
| Computers & Mathematics | 105 | 3.3% |
| Bio, Nature & Agricultural | 134 | 4.2% |
| Physical & Health Sciences | 55 | 1.7% |
| Psychology | 183 | 5.7% |
| Social Sciences | 162 | 5.0% |
| Engineering | 131 | 4.1% |
| Multidisciplinary Studies | 0 | 0.0% |
| Science & Technology | 640 | 19.9% |
| Business | 537 | 16.7% |
| Education | 529 | 16.5% |
| Literature & Languages | 92 | 2.9% |
| Liberal Arts & History | 91 | 2.8% |
| Visual & Performing Arts | 114 | 3.5% |
| Communications | 144 | 4.5% |
| Arts & Humanities | 295 | 9.2% |
| Total | 3,212 | 100.0% |
Transportation & Commute in Lower Burrell
Vehicle Availability by Sex in Lower Burrell
The most prevalent vehicle ownership categories in Lower Burrell are males with 2 vehicles (1,399, accounting for 44.7%) and females with 2 vehicles (1,068, making up 56.0%).
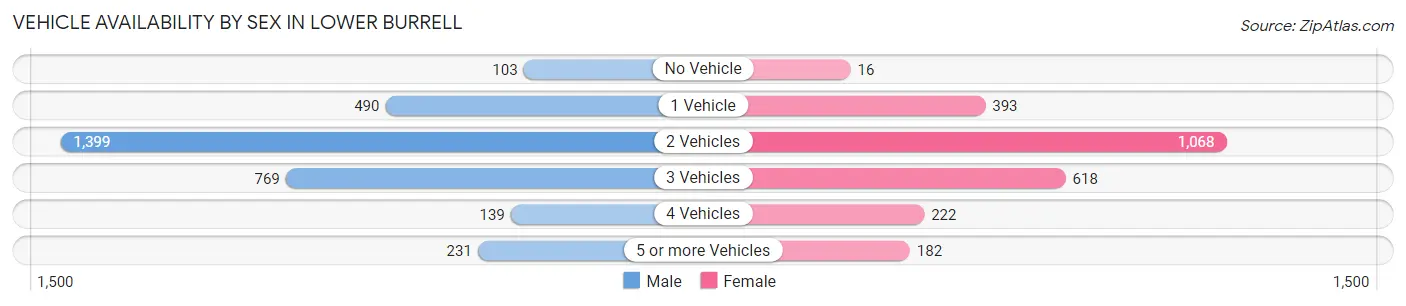
| Vehicles Available | Male | Female |
| No Vehicle | 103 (3.3%) | 16 (0.6%) |
| 1 Vehicle | 490 (15.7%) | 393 (15.7%) |
| 2 Vehicles | 1,399 (44.7%) | 1,068 (42.7%) |
| 3 Vehicles | 769 (24.6%) | 618 (24.7%) |
| 4 Vehicles | 139 (4.4%) | 222 (8.9%) |
| 5 or more Vehicles | 231 (7.4%) | 182 (7.3%) |
| Total | 3,131 (100.0%) | 2,499 (100.0%) |
Commute Time in Lower Burrell
The most frequently occuring commute durations in Lower Burrell are 15 to 19 minutes (779 commuters, 15.2%), 30 to 34 minutes (694 commuters, 13.5%), and 45 to 59 minutes (667 commuters, 13.0%).
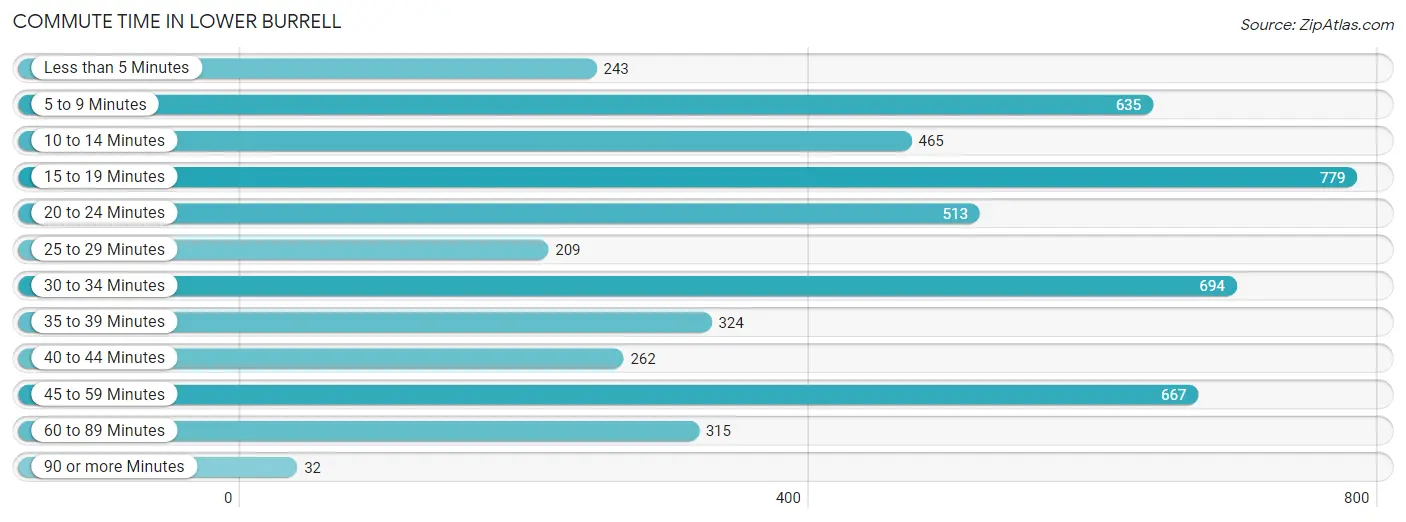
| Commute Time | # Commuters | % Commuters |
| Less than 5 Minutes | 243 | 4.7% |
| 5 to 9 Minutes | 635 | 12.4% |
| 10 to 14 Minutes | 465 | 9.0% |
| 15 to 19 Minutes | 779 | 15.2% |
| 20 to 24 Minutes | 513 | 10.0% |
| 25 to 29 Minutes | 209 | 4.1% |
| 30 to 34 Minutes | 694 | 13.5% |
| 35 to 39 Minutes | 324 | 6.3% |
| 40 to 44 Minutes | 262 | 5.1% |
| 45 to 59 Minutes | 667 | 13.0% |
| 60 to 89 Minutes | 315 | 6.1% |
| 90 or more Minutes | 32 | 0.6% |
Commute Time by Sex in Lower Burrell
The most common commute times in Lower Burrell are 45 to 59 minutes (539 commuters, 18.6%) for males and 30 to 34 minutes (422 commuters, 18.9%) for females.
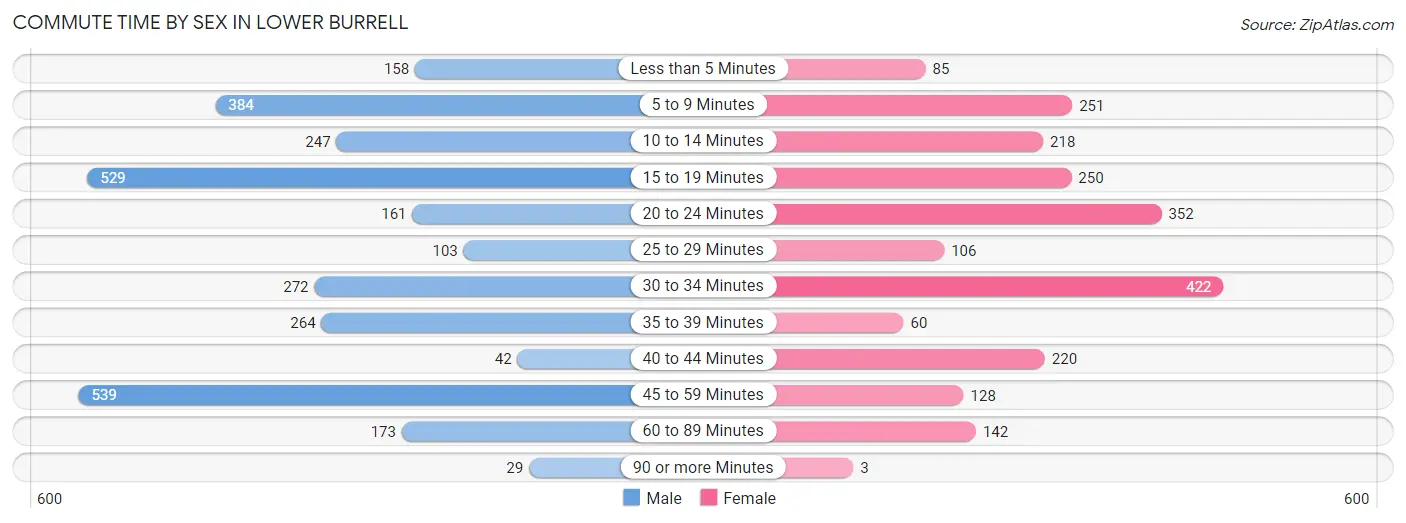
| Commute Time | Male | Female |
| Less than 5 Minutes | 158 (5.4%) | 85 (3.8%) |
| 5 to 9 Minutes | 384 (13.2%) | 251 (11.2%) |
| 10 to 14 Minutes | 247 (8.5%) | 218 (9.8%) |
| 15 to 19 Minutes | 529 (18.2%) | 250 (11.2%) |
| 20 to 24 Minutes | 161 (5.6%) | 352 (15.7%) |
| 25 to 29 Minutes | 103 (3.5%) | 106 (4.7%) |
| 30 to 34 Minutes | 272 (9.4%) | 422 (18.9%) |
| 35 to 39 Minutes | 264 (9.1%) | 60 (2.7%) |
| 40 to 44 Minutes | 42 (1.5%) | 220 (9.8%) |
| 45 to 59 Minutes | 539 (18.6%) | 128 (5.7%) |
| 60 to 89 Minutes | 173 (6.0%) | 142 (6.4%) |
| 90 or more Minutes | 29 (1.0%) | 3 (0.1%) |
Time of Departure to Work by Sex in Lower Burrell
The most frequent times of departure to work in Lower Burrell are 6:00 AM to 6:29 AM (517, 17.8%) for males and 7:00 AM to 7:29 AM (327, 14.6%) for females.
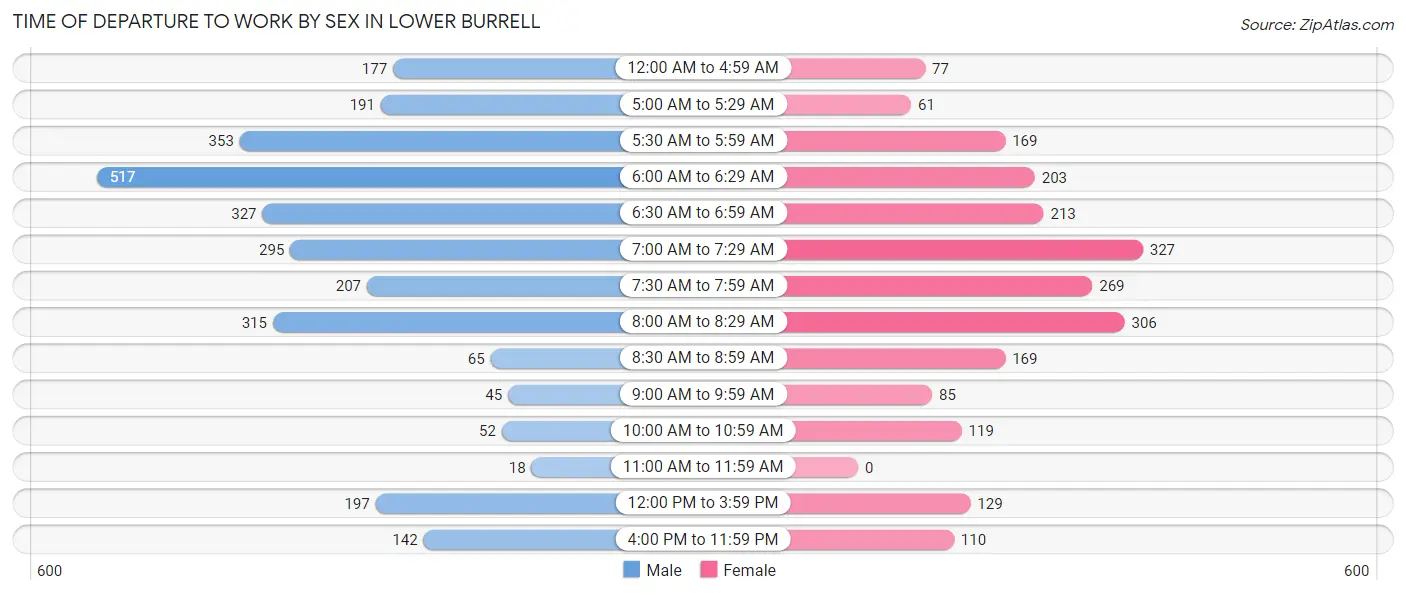
| Time of Departure | Male | Female |
| 12:00 AM to 4:59 AM | 177 (6.1%) | 77 (3.4%) |
| 5:00 AM to 5:29 AM | 191 (6.6%) | 61 (2.7%) |
| 5:30 AM to 5:59 AM | 353 (12.2%) | 169 (7.5%) |
| 6:00 AM to 6:29 AM | 517 (17.8%) | 203 (9.1%) |
| 6:30 AM to 6:59 AM | 327 (11.3%) | 213 (9.5%) |
| 7:00 AM to 7:29 AM | 295 (10.2%) | 327 (14.6%) |
| 7:30 AM to 7:59 AM | 207 (7.1%) | 269 (12.0%) |
| 8:00 AM to 8:29 AM | 315 (10.9%) | 306 (13.7%) |
| 8:30 AM to 8:59 AM | 65 (2.2%) | 169 (7.5%) |
| 9:00 AM to 9:59 AM | 45 (1.5%) | 85 (3.8%) |
| 10:00 AM to 10:59 AM | 52 (1.8%) | 119 (5.3%) |
| 11:00 AM to 11:59 AM | 18 (0.6%) | 0 (0.0%) |
| 12:00 PM to 3:59 PM | 197 (6.8%) | 129 (5.8%) |
| 4:00 PM to 11:59 PM | 142 (4.9%) | 110 (4.9%) |
| Total | 2,901 (100.0%) | 2,237 (100.0%) |
Housing Occupancy in Lower Burrell
Occupancy by Ownership in Lower Burrell
Of the total 5,284 dwellings in Lower Burrell, owner-occupied units account for 4,368 (82.7%), while renter-occupied units make up 916 (17.3%).
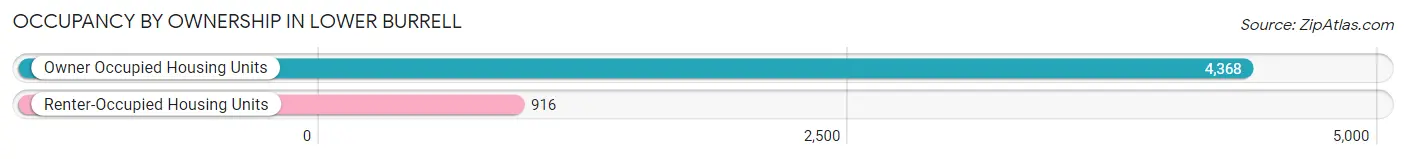
| Occupancy | # Housing Units | % Housing Units |
| Owner Occupied Housing Units | 4,368 | 82.7% |
| Renter-Occupied Housing Units | 916 | 17.3% |
| Total Occupied Housing Units | 5,284 | 100.0% |
Occupancy by Household Size in Lower Burrell
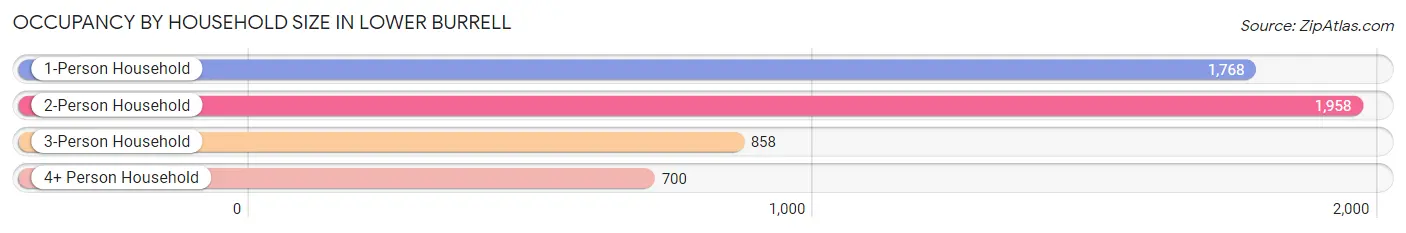
| Household Size | # Housing Units | % Housing Units |
| 1-Person Household | 1,768 | 33.5% |
| 2-Person Household | 1,958 | 37.1% |
| 3-Person Household | 858 | 16.2% |
| 4+ Person Household | 700 | 13.3% |
| Total Housing Units | 5,284 | 100.0% |
Occupancy by Ownership by Household Size in Lower Burrell
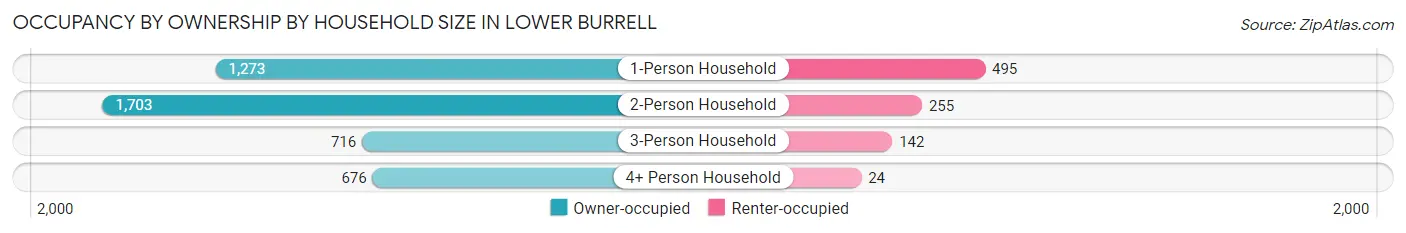
| Household Size | Owner-occupied | Renter-occupied |
| 1-Person Household | 1,273 (72.0%) | 495 (28.0%) |
| 2-Person Household | 1,703 (87.0%) | 255 (13.0%) |
| 3-Person Household | 716 (83.5%) | 142 (16.6%) |
| 4+ Person Household | 676 (96.6%) | 24 (3.4%) |
| Total Housing Units | 4,368 (82.7%) | 916 (17.3%) |
Occupancy by Educational Attainment in Lower Burrell
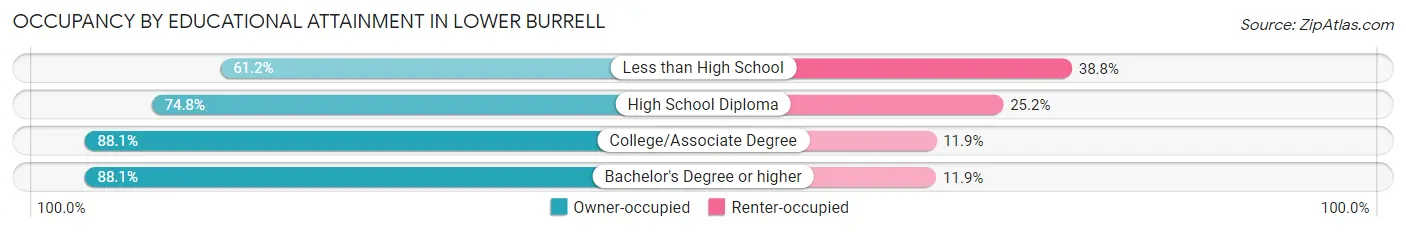
| Household Size | Owner-occupied | Renter-occupied |
| Less than High School | 172 (61.2%) | 109 (38.8%) |
| High School Diploma | 1,191 (74.8%) | 401 (25.2%) |
| College/Associate Degree | 1,464 (88.1%) | 198 (11.9%) |
| Bachelor's Degree or higher | 1,541 (88.1%) | 208 (11.9%) |
Occupancy by Age of Householder in Lower Burrell
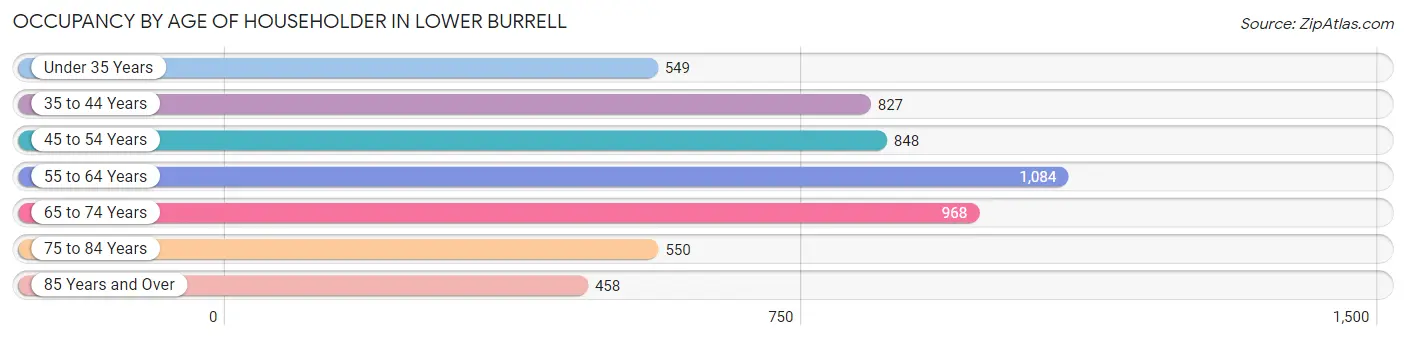
| Age Bracket | # Households | % Households |
| Under 35 Years | 549 | 10.4% |
| 35 to 44 Years | 827 | 15.7% |
| 45 to 54 Years | 848 | 16.1% |
| 55 to 64 Years | 1,084 | 20.5% |
| 65 to 74 Years | 968 | 18.3% |
| 75 to 84 Years | 550 | 10.4% |
| 85 Years and Over | 458 | 8.7% |
| Total | 5,284 | 100.0% |
Housing Finances in Lower Burrell
Median Income by Occupancy in Lower Burrell
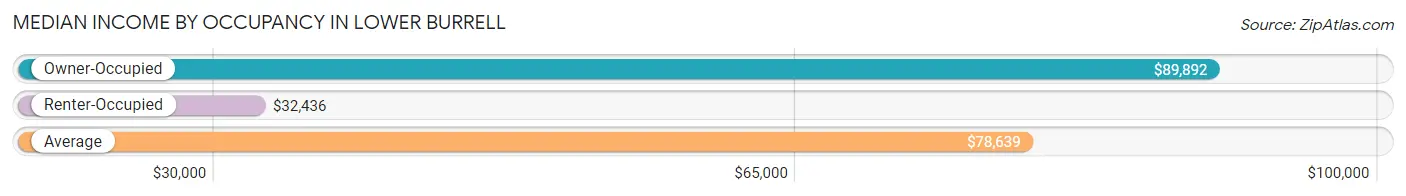
| Occupancy Type | # Households | Median Income |
| Owner-Occupied | 4,368 (82.7%) | $89,892 |
| Renter-Occupied | 916 (17.3%) | $32,436 |
| Average | 5,284 (100.0%) | $78,639 |
Occupancy by Householder Income Bracket in Lower Burrell
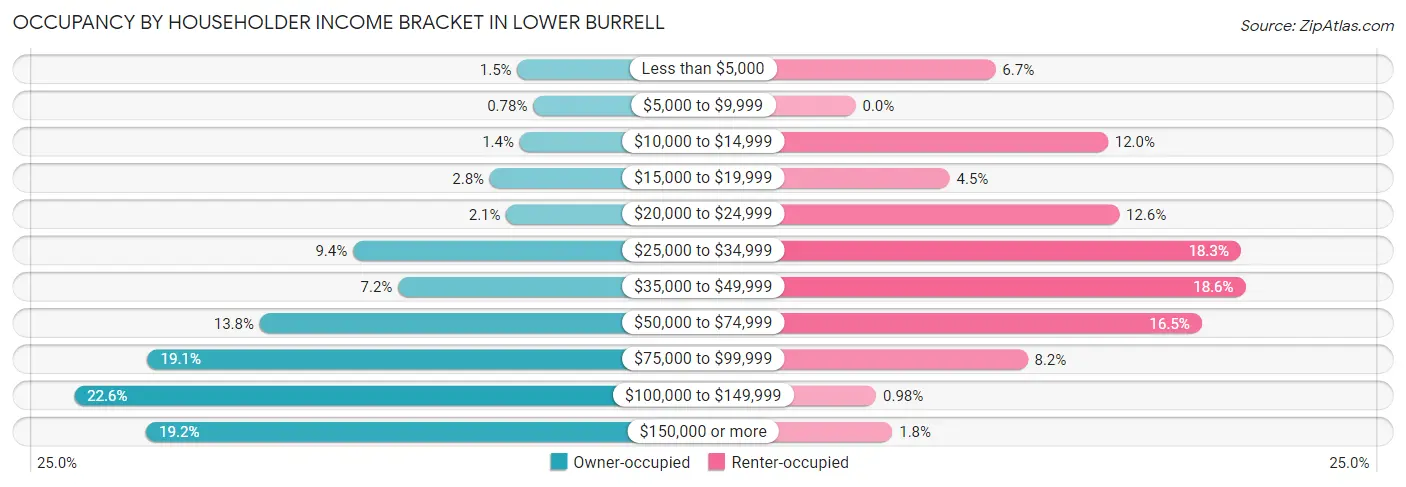
| Income Bracket | Owner-occupied | Renter-occupied |
| Less than $5,000 | 67 (1.5%) | 61 (6.7%) |
| $5,000 to $9,999 | 34 (0.8%) | 0 (0.0%) |
| $10,000 to $14,999 | 62 (1.4%) | 110 (12.0%) |
| $15,000 to $19,999 | 124 (2.8%) | 41 (4.5%) |
| $20,000 to $24,999 | 90 (2.1%) | 115 (12.6%) |
| $25,000 to $34,999 | 409 (9.4%) | 168 (18.3%) |
| $35,000 to $49,999 | 315 (7.2%) | 170 (18.6%) |
| $50,000 to $74,999 | 603 (13.8%) | 151 (16.5%) |
| $75,000 to $99,999 | 836 (19.1%) | 75 (8.2%) |
| $100,000 to $149,999 | 989 (22.6%) | 9 (1.0%) |
| $150,000 or more | 839 (19.2%) | 16 (1.8%) |
| Total | 4,368 (100.0%) | 916 (100.0%) |
Monthly Housing Cost Tiers in Lower Burrell
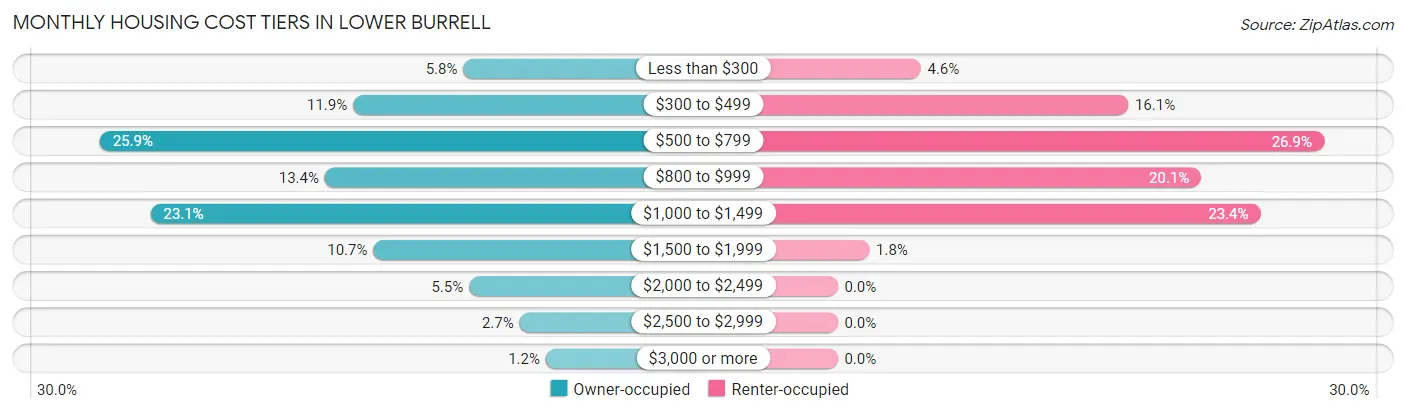
| Monthly Cost | Owner-occupied | Renter-occupied |
| Less than $300 | 252 (5.8%) | 42 (4.6%) |
| $300 to $499 | 518 (11.9%) | 147 (16.1%) |
| $500 to $799 | 1,129 (25.9%) | 246 (26.9%) |
| $800 to $999 | 586 (13.4%) | 184 (20.1%) |
| $1,000 to $1,499 | 1,007 (23.1%) | 214 (23.4%) |
| $1,500 to $1,999 | 469 (10.7%) | 16 (1.8%) |
| $2,000 to $2,499 | 238 (5.4%) | 0 (0.0%) |
| $2,500 to $2,999 | 116 (2.7%) | 0 (0.0%) |
| $3,000 or more | 53 (1.2%) | 0 (0.0%) |
| Total | 4,368 (100.0%) | 916 (100.0%) |
Physical Housing Characteristics in Lower Burrell
Housing Structures in Lower Burrell
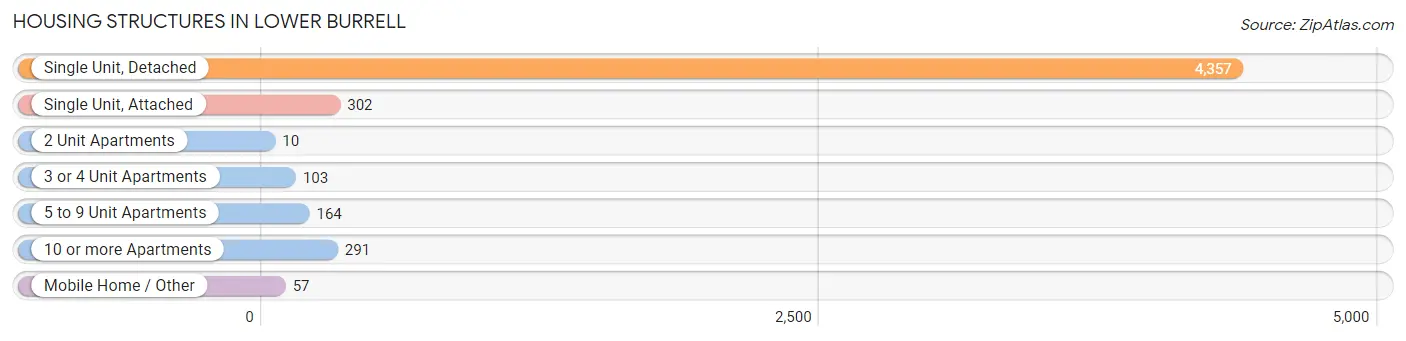
| Structure Type | # Housing Units | % Housing Units |
| Single Unit, Detached | 4,357 | 82.5% |
| Single Unit, Attached | 302 | 5.7% |
| 2 Unit Apartments | 10 | 0.2% |
| 3 or 4 Unit Apartments | 103 | 1.9% |
| 5 to 9 Unit Apartments | 164 | 3.1% |
| 10 or more Apartments | 291 | 5.5% |
| Mobile Home / Other | 57 | 1.1% |
| Total | 5,284 | 100.0% |
Housing Structures by Occupancy in Lower Burrell
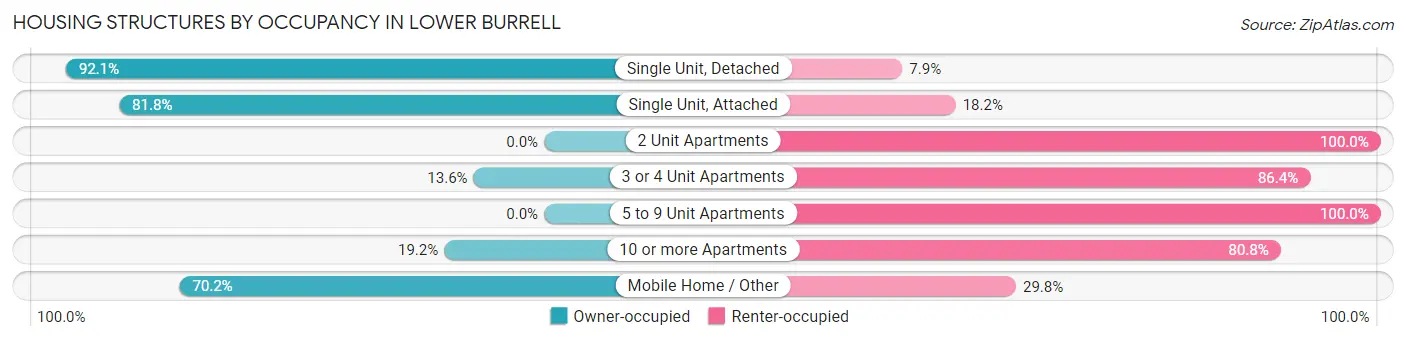
| Structure Type | Owner-occupied | Renter-occupied |
| Single Unit, Detached | 4,011 (92.1%) | 346 (7.9%) |
| Single Unit, Attached | 247 (81.8%) | 55 (18.2%) |
| 2 Unit Apartments | 0 (0.0%) | 10 (100.0%) |
| 3 or 4 Unit Apartments | 14 (13.6%) | 89 (86.4%) |
| 5 to 9 Unit Apartments | 0 (0.0%) | 164 (100.0%) |
| 10 or more Apartments | 56 (19.2%) | 235 (80.8%) |
| Mobile Home / Other | 40 (70.2%) | 17 (29.8%) |
| Total | 4,368 (82.7%) | 916 (17.3%) |
Housing Structures by Number of Rooms in Lower Burrell
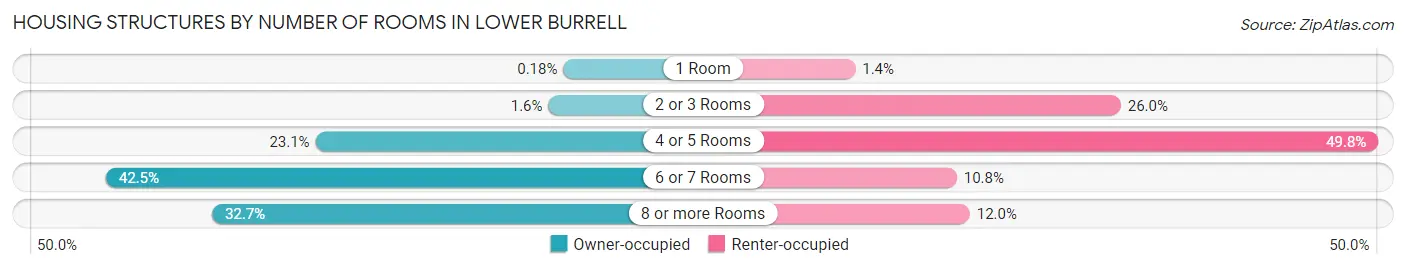
| Number of Rooms | Owner-occupied | Renter-occupied |
| 1 Room | 8 (0.2%) | 13 (1.4%) |
| 2 or 3 Rooms | 68 (1.6%) | 238 (26.0%) |
| 4 or 5 Rooms | 1,009 (23.1%) | 456 (49.8%) |
| 6 or 7 Rooms | 1,856 (42.5%) | 99 (10.8%) |
| 8 or more Rooms | 1,427 (32.7%) | 110 (12.0%) |
| Total | 4,368 (100.0%) | 916 (100.0%) |
Housing Structure by Heating Type in Lower Burrell
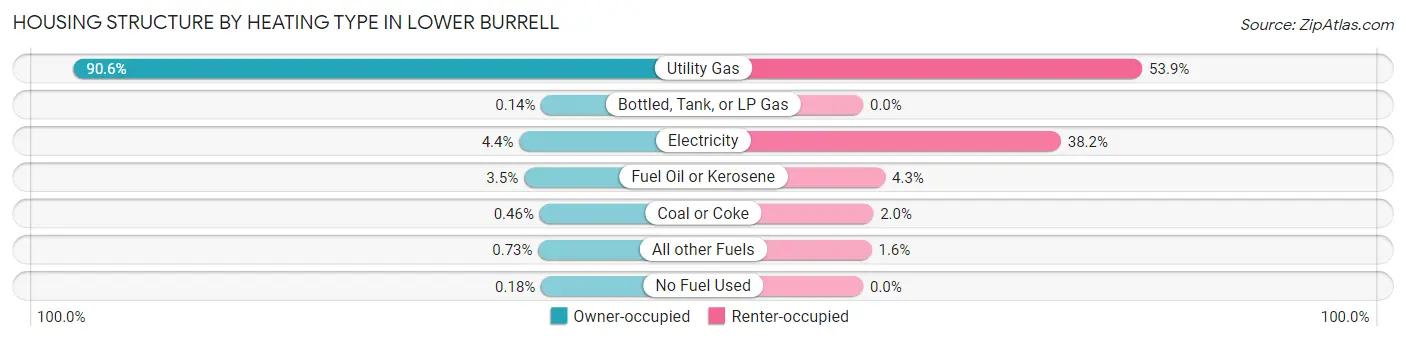
| Heating Type | Owner-occupied | Renter-occupied |
| Utility Gas | 3,957 (90.6%) | 494 (53.9%) |
| Bottled, Tank, or LP Gas | 6 (0.1%) | 0 (0.0%) |
| Electricity | 192 (4.4%) | 350 (38.2%) |
| Fuel Oil or Kerosene | 153 (3.5%) | 39 (4.3%) |
| Coal or Coke | 20 (0.5%) | 18 (2.0%) |
| All other Fuels | 32 (0.7%) | 15 (1.6%) |
| No Fuel Used | 8 (0.2%) | 0 (0.0%) |
| Total | 4,368 (100.0%) | 916 (100.0%) |
Household Vehicle Usage in Lower Burrell
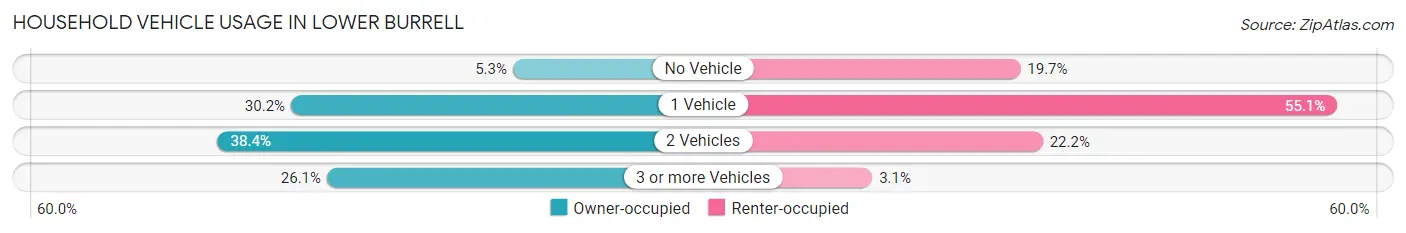
| Vehicles per Household | Owner-occupied | Renter-occupied |
| No Vehicle | 232 (5.3%) | 180 (19.7%) |
| 1 Vehicle | 1,318 (30.2%) | 505 (55.1%) |
| 2 Vehicles | 1,676 (38.4%) | 203 (22.2%) |
| 3 or more Vehicles | 1,142 (26.1%) | 28 (3.1%) |
| Total | 4,368 (100.0%) | 916 (100.0%) |
Real Estate & Mortgages in Lower Burrell
Real Estate and Mortgage Overview in Lower Burrell
| Characteristic | Without Mortgage | With Mortgage |
| Housing Units | 2,092 | 2,276 |
| Median Property Value | $169,800 | $188,500 |
| Median Household Income | $58,636 | $560 |
| Monthly Housing Costs | $574 | $53 |
| Real Estate Taxes | $2,771 | $29 |
Property Value by Mortgage Status in Lower Burrell
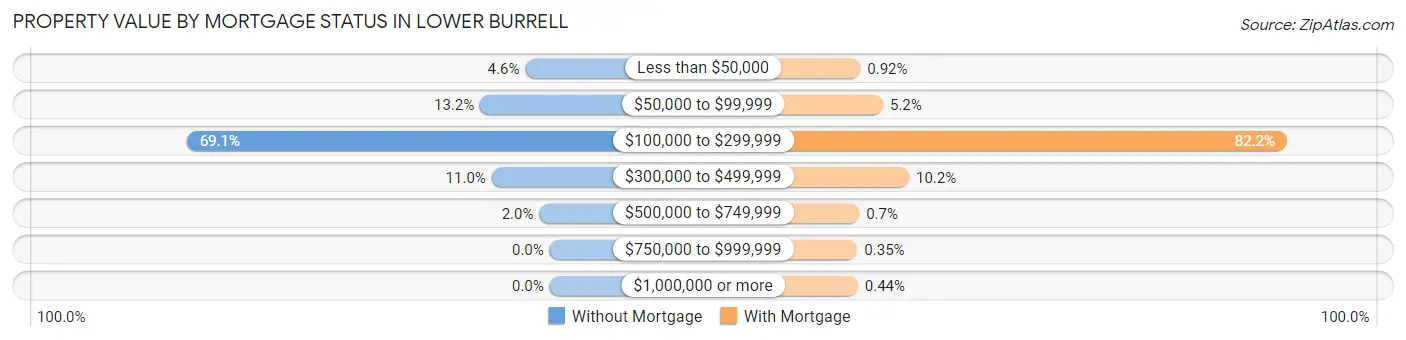
| Property Value | Without Mortgage | With Mortgage |
| Less than $50,000 | 97 (4.6%) | 21 (0.9%) |
| $50,000 to $99,999 | 277 (13.2%) | 119 (5.2%) |
| $100,000 to $299,999 | 1,446 (69.1%) | 1,870 (82.2%) |
| $300,000 to $499,999 | 231 (11.0%) | 232 (10.2%) |
| $500,000 to $749,999 | 41 (2.0%) | 16 (0.7%) |
| $750,000 to $999,999 | 0 (0.0%) | 8 (0.4%) |
| $1,000,000 or more | 0 (0.0%) | 10 (0.4%) |
| Total | 2,092 (100.0%) | 2,276 (100.0%) |
Household Income by Mortgage Status in Lower Burrell
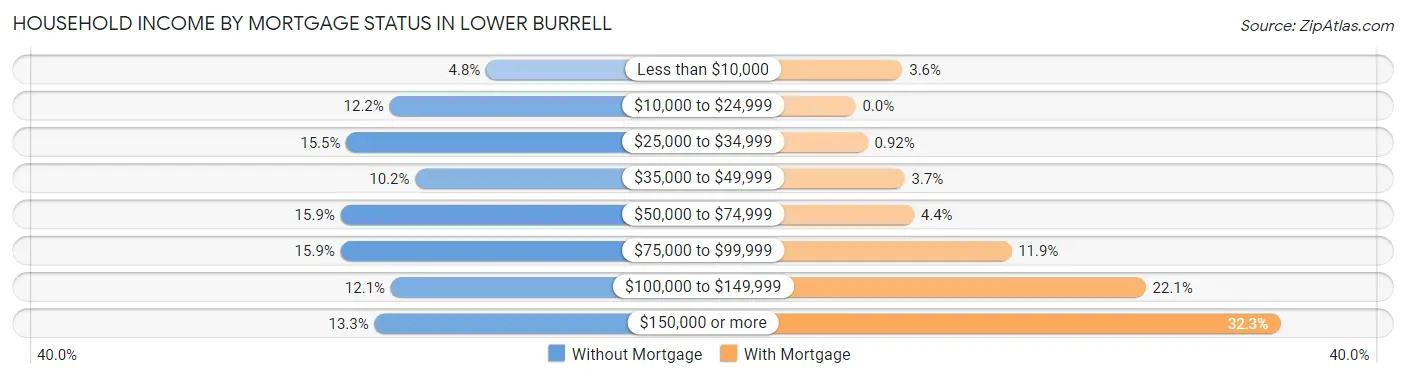
| Household Income | Without Mortgage | With Mortgage |
| Less than $10,000 | 101 (4.8%) | 81 (3.6%) |
| $10,000 to $24,999 | 255 (12.2%) | 0 (0.0%) |
| $25,000 to $34,999 | 324 (15.5%) | 21 (0.9%) |
| $35,000 to $49,999 | 214 (10.2%) | 85 (3.7%) |
| $50,000 to $74,999 | 333 (15.9%) | 101 (4.4%) |
| $75,000 to $99,999 | 333 (15.9%) | 270 (11.9%) |
| $100,000 to $149,999 | 253 (12.1%) | 503 (22.1%) |
| $150,000 or more | 279 (13.3%) | 736 (32.3%) |
| Total | 2,092 (100.0%) | 2,276 (100.0%) |
Property Value to Household Income Ratio in Lower Burrell
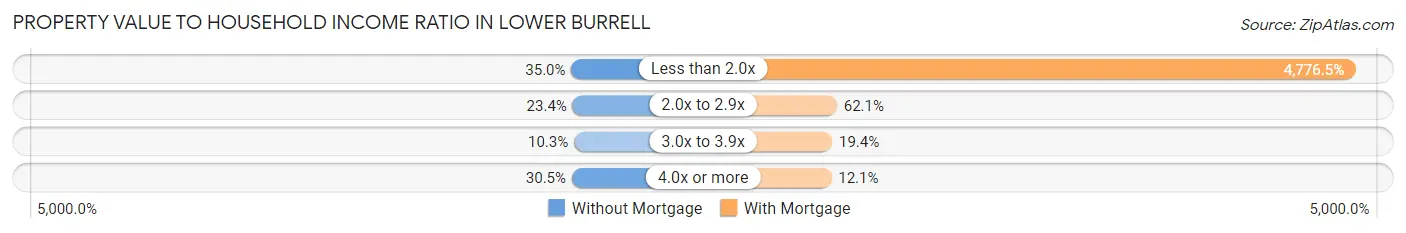
| Value-to-Income Ratio | Without Mortgage | With Mortgage |
| Less than 2.0x | 732 (35.0%) | 108,712 (4,776.4%) |
| 2.0x to 2.9x | 489 (23.4%) | 1,413 (62.1%) |
| 3.0x to 3.9x | 216 (10.3%) | 442 (19.4%) |
| 4.0x or more | 638 (30.5%) | 275 (12.1%) |
| Total | 2,092 (100.0%) | 2,276 (100.0%) |
Real Estate Taxes by Mortgage Status in Lower Burrell
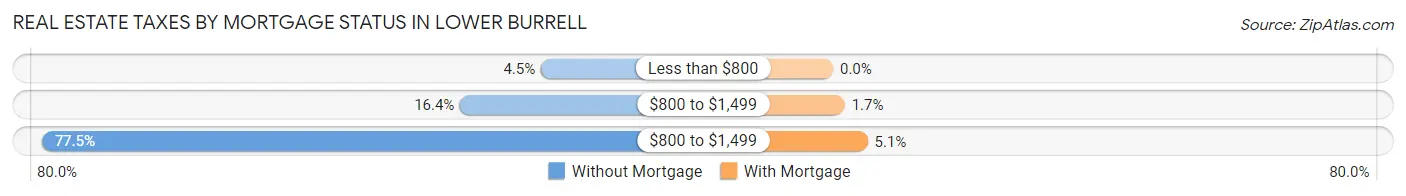
| Property Taxes | Without Mortgage | With Mortgage |
| Less than $800 | 95 (4.5%) | 0 (0.0%) |
| $800 to $1,499 | 342 (16.4%) | 39 (1.7%) |
| $800 to $1,499 | 1,621 (77.5%) | 115 (5.1%) |
| Total | 2,092 (100.0%) | 2,276 (100.0%) |
Health & Disability in Lower Burrell
Health Insurance Coverage by Age in Lower Burrell
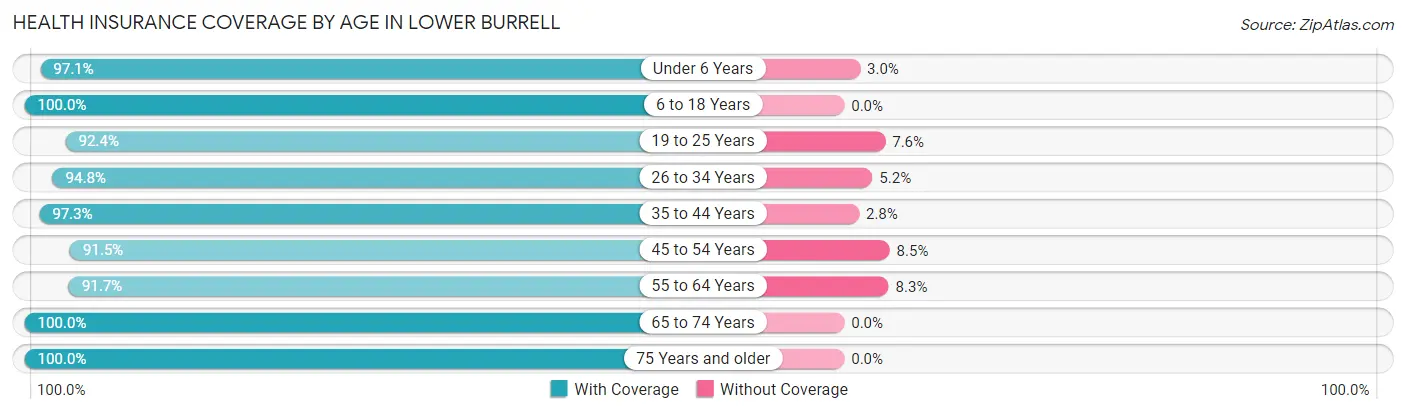
| Age Bracket | With Coverage | Without Coverage |
| Under 6 Years | 626 (97.1%) | 19 (2.9%) |
| 6 to 18 Years | 1,518 (100.0%) | 0 (0.0%) |
| 19 to 25 Years | 556 (92.4%) | 46 (7.6%) |
| 26 to 34 Years | 1,031 (94.8%) | 57 (5.2%) |
| 35 to 44 Years | 1,307 (97.3%) | 37 (2.8%) |
| 45 to 54 Years | 1,494 (91.5%) | 138 (8.5%) |
| 55 to 64 Years | 1,653 (91.7%) | 149 (8.3%) |
| 65 to 74 Years | 1,641 (100.0%) | 0 (0.0%) |
| 75 Years and older | 1,321 (100.0%) | 0 (0.0%) |
| Total | 11,147 (96.2%) | 446 (3.8%) |
Health Insurance Coverage by Citizenship Status in Lower Burrell
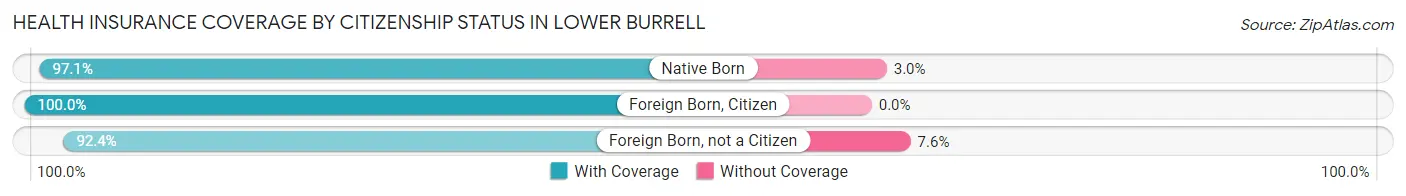
| Citizenship Status | With Coverage | Without Coverage |
| Native Born | 626 (97.1%) | 19 (2.9%) |
| Foreign Born, Citizen | 1,518 (100.0%) | 0 (0.0%) |
| Foreign Born, not a Citizen | 556 (92.4%) | 46 (7.6%) |
Health Insurance Coverage by Household Income in Lower Burrell
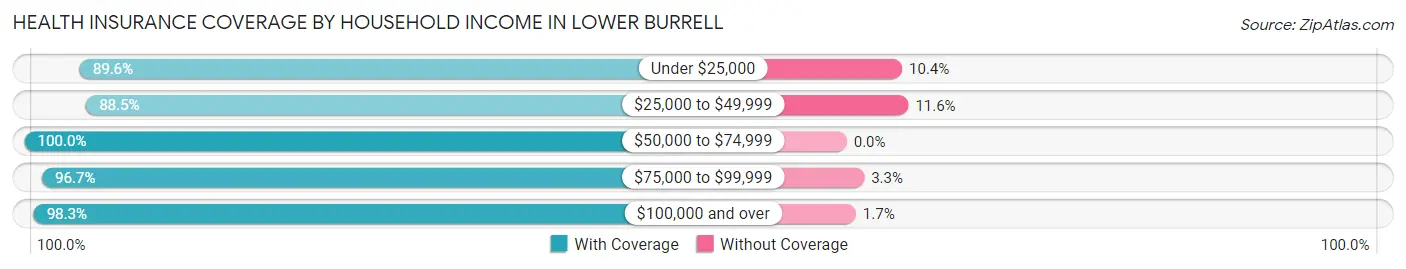
| Household Income | With Coverage | Without Coverage |
| Under $25,000 | 805 (89.6%) | 93 (10.4%) |
| $25,000 to $49,999 | 1,401 (88.4%) | 183 (11.6%) |
| $50,000 to $74,999 | 1,655 (100.0%) | 0 (0.0%) |
| $75,000 to $99,999 | 1,979 (96.7%) | 67 (3.3%) |
| $100,000 and over | 5,295 (98.3%) | 92 (1.7%) |
Public vs Private Health Insurance Coverage by Age in Lower Burrell
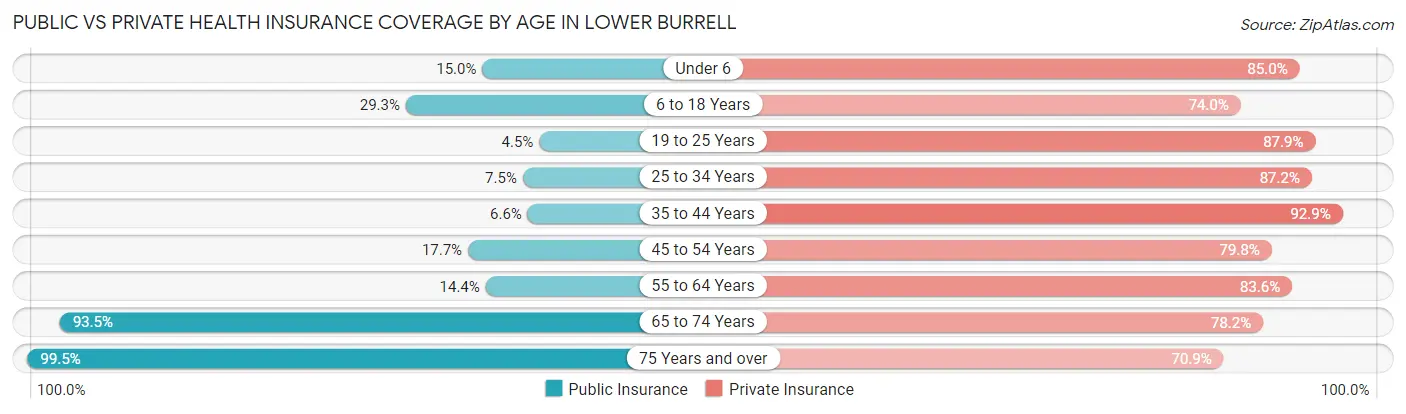
| Age Bracket | Public Insurance | Private Insurance |
| Under 6 | 97 (15.0%) | 548 (85.0%) |
| 6 to 18 Years | 444 (29.2%) | 1,124 (74.0%) |
| 19 to 25 Years | 27 (4.5%) | 529 (87.9%) |
| 25 to 34 Years | 82 (7.5%) | 949 (87.2%) |
| 35 to 44 Years | 89 (6.6%) | 1,249 (92.9%) |
| 45 to 54 Years | 289 (17.7%) | 1,302 (79.8%) |
| 55 to 64 Years | 260 (14.4%) | 1,506 (83.6%) |
| 65 to 74 Years | 1,534 (93.5%) | 1,283 (78.2%) |
| 75 Years and over | 1,314 (99.5%) | 936 (70.9%) |
| Total | 4,136 (35.7%) | 9,426 (81.3%) |
Disability Status by Sex by Age in Lower Burrell
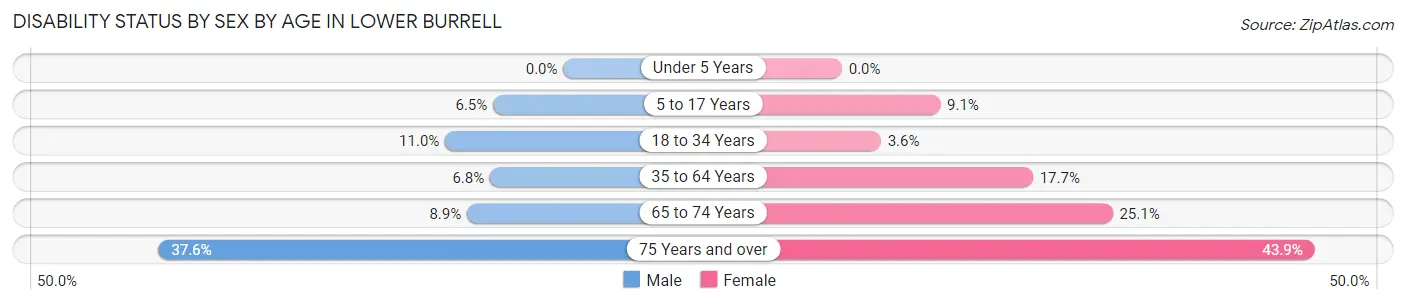
| Age Bracket | Male | Female |
| Under 5 Years | 0 (0.0%) | 0 (0.0%) |
| 5 to 17 Years | 42 (6.5%) | 63 (9.1%) |
| 18 to 34 Years | 97 (11.0%) | 38 (3.6%) |
| 35 to 64 Years | 176 (6.8%) | 388 (17.7%) |
| 65 to 74 Years | 73 (8.9%) | 207 (25.1%) |
| 75 Years and over | 183 (37.6%) | 366 (43.9%) |
Disability Class by Sex by Age in Lower Burrell
Disability Class: Hearing Difficulty
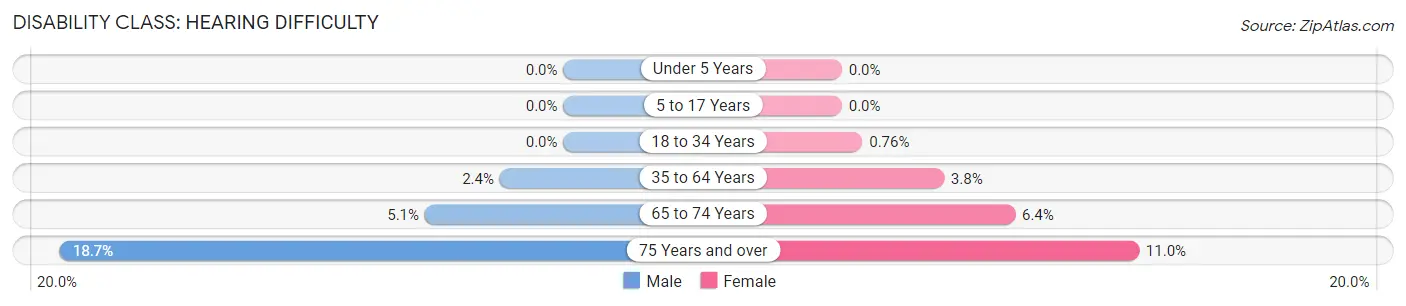
| Age Bracket | Male | Female |
| Under 5 Years | 0 (0.0%) | 0 (0.0%) |
| 5 to 17 Years | 0 (0.0%) | 0 (0.0%) |
| 18 to 34 Years | 0 (0.0%) | 8 (0.8%) |
| 35 to 64 Years | 61 (2.4%) | 83 (3.8%) |
| 65 to 74 Years | 42 (5.1%) | 53 (6.4%) |
| 75 Years and over | 91 (18.7%) | 92 (11.0%) |
Disability Class: Vision Difficulty
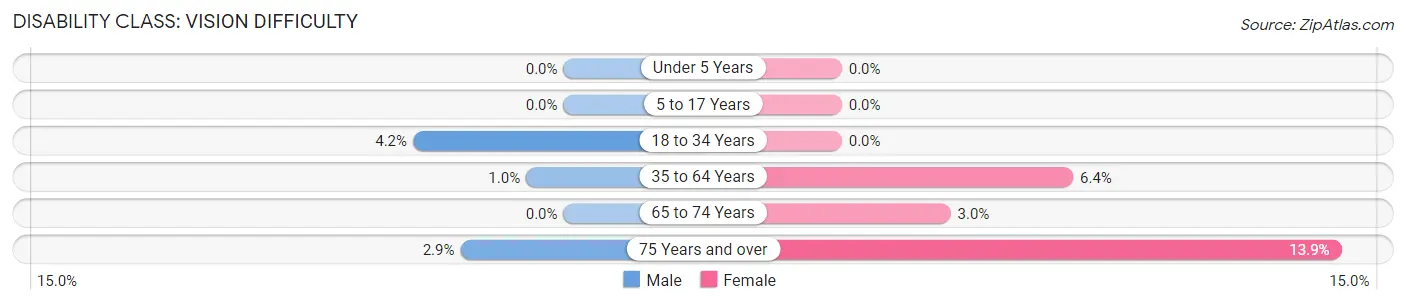
| Age Bracket | Male | Female |
| Under 5 Years | 0 (0.0%) | 0 (0.0%) |
| 5 to 17 Years | 0 (0.0%) | 0 (0.0%) |
| 18 to 34 Years | 37 (4.2%) | 0 (0.0%) |
| 35 to 64 Years | 27 (1.0%) | 141 (6.4%) |
| 65 to 74 Years | 0 (0.0%) | 25 (3.0%) |
| 75 Years and over | 14 (2.9%) | 116 (13.9%) |
Disability Class: Cognitive Difficulty
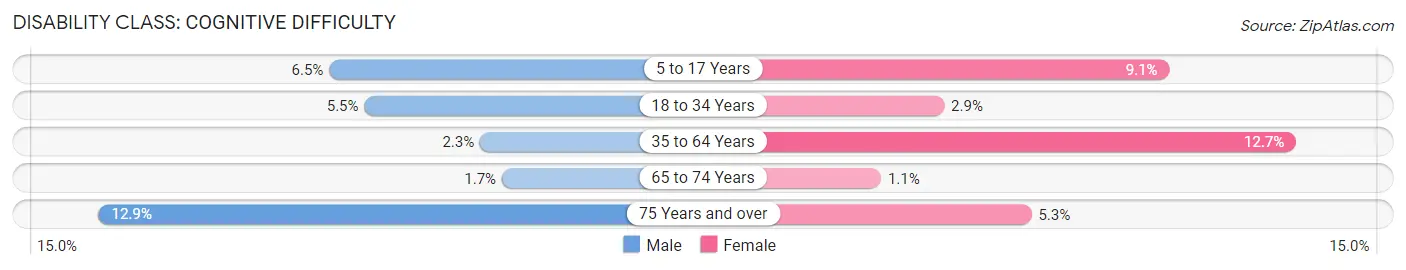
| Age Bracket | Male | Female |
| 5 to 17 Years | 42 (6.5%) | 63 (9.1%) |
| 18 to 34 Years | 49 (5.5%) | 30 (2.9%) |
| 35 to 64 Years | 60 (2.3%) | 277 (12.7%) |
| 65 to 74 Years | 14 (1.7%) | 9 (1.1%) |
| 75 Years and over | 63 (12.9%) | 44 (5.3%) |
Disability Class: Ambulatory Difficulty
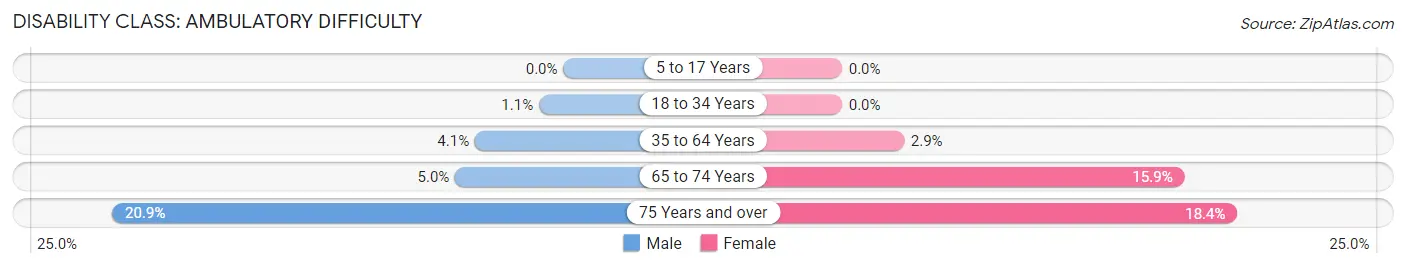
| Age Bracket | Male | Female |
| 5 to 17 Years | 0 (0.0%) | 0 (0.0%) |
| 18 to 34 Years | 10 (1.1%) | 0 (0.0%) |
| 35 to 64 Years | 106 (4.1%) | 63 (2.9%) |
| 65 to 74 Years | 41 (5.0%) | 131 (15.9%) |
| 75 Years and over | 102 (20.9%) | 153 (18.3%) |
Disability Class: Self-Care Difficulty
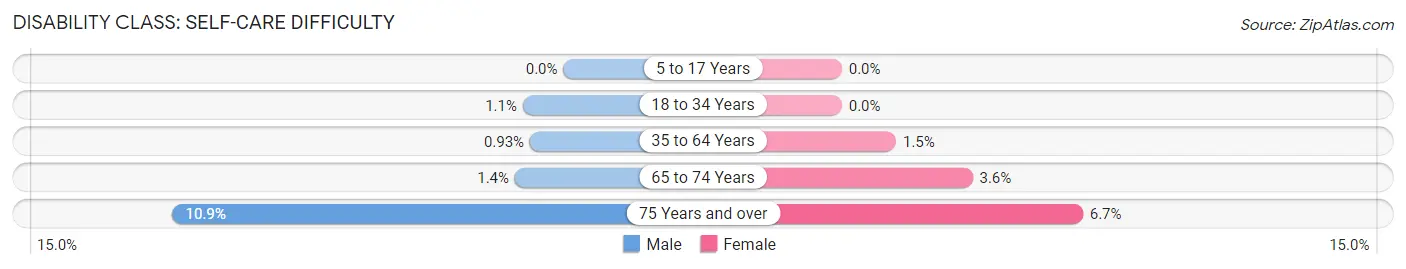
| Age Bracket | Male | Female |
| 5 to 17 Years | 0 (0.0%) | 0 (0.0%) |
| 18 to 34 Years | 10 (1.1%) | 0 (0.0%) |
| 35 to 64 Years | 24 (0.9%) | 33 (1.5%) |
| 65 to 74 Years | 11 (1.3%) | 30 (3.6%) |
| 75 Years and over | 53 (10.9%) | 56 (6.7%) |
Technology Access in Lower Burrell
Computing Device Access in Lower Burrell
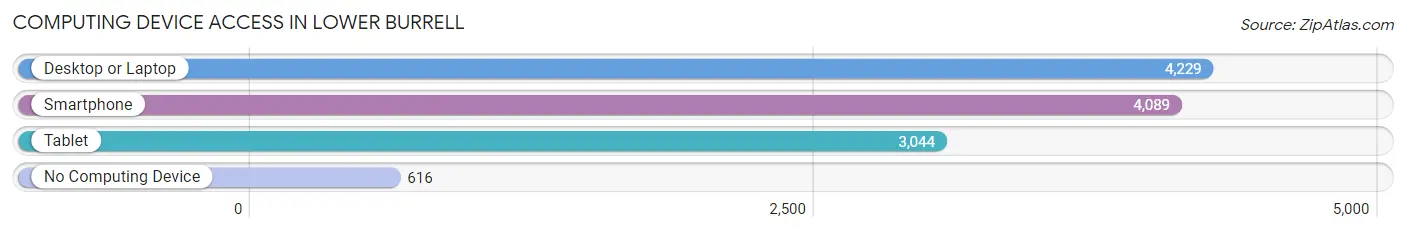
| Device Type | # Households | % Households |
| Desktop or Laptop | 4,229 | 80.0% |
| Smartphone | 4,089 | 77.4% |
| Tablet | 3,044 | 57.6% |
| No Computing Device | 616 | 11.7% |
| Total | 5,284 | 100.0% |
Internet Access in Lower Burrell
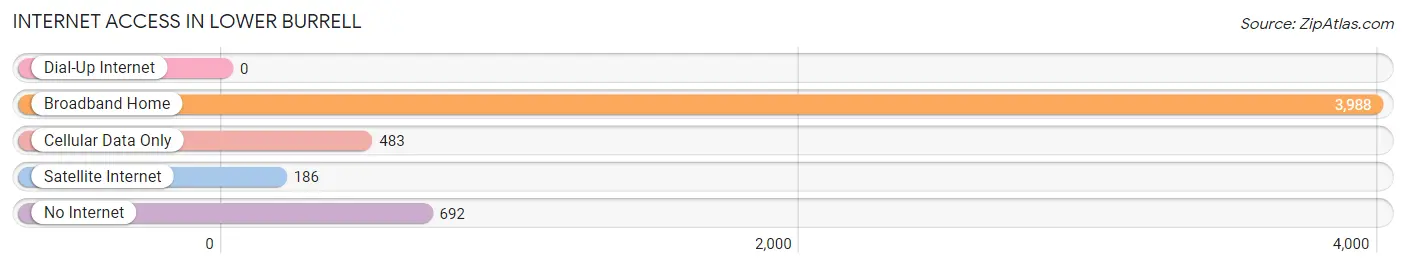
| Internet Type | # Households | % Households |
| Dial-Up Internet | 0 | 0.0% |
| Broadband Home | 3,988 | 75.5% |
| Cellular Data Only | 483 | 9.1% |
| Satellite Internet | 186 | 3.5% |
| No Internet | 692 | 13.1% |
| Total | 5,284 | 100.0% |
Lower Burrell Summary
Burrell, Pennsylvania is a small borough located in Westmoreland County, Pennsylvania. It is situated in the Allegheny Mountains, approximately 25 miles northeast of Pittsburgh. The borough was founded in 1891 and is home to approximately 4,000 people.
History
The area that is now Burrell was originally inhabited by the Lenape Native Americans. The first European settlers arrived in the area in the late 1700s. The area was originally known as Lower Burrell Township, and was part of Allegheny County until Westmoreland County was formed in 1773. The area was primarily agricultural, with the main crops being wheat, corn, and oats.
In 1891, the area was incorporated as a borough. The name “Burrell” was chosen in honor of William Burrell, a local landowner and businessman. The borough was primarily a farming community until the early 1900s, when the coal and steel industries began to take off in the area. The population of the borough grew rapidly during this time, and by the 1950s, the population had reached its peak of over 5,000 people.
Geography
Burrell is located in the Allegheny Mountains, approximately 25 miles northeast of Pittsburgh. The borough is situated on the banks of the Allegheny River, and is surrounded by the townships of Upper Burrell, Lower Burrell, and Washington. The borough covers an area of 1.2 square miles, and is located at an elevation of 1,000 feet.
The climate in Burrell is classified as humid continental, with hot summers and cold winters. The average annual temperature is around 50 degrees Fahrenheit, and the average annual precipitation is around 40 inches.
Economy
The economy of Burrell is primarily based on manufacturing and retail. The borough is home to several manufacturing companies, including a steel mill, a paper mill, and a plastics factory. The retail sector is also important to the local economy, with several stores and restaurants located in the borough.
The unemployment rate in Burrell is slightly higher than the national average, at around 6%. The median household income is around $40,000, and the median home value is around $90,000.
Demographics
As of the 2010 census, the population of Burrell was 4,072. The racial makeup of the borough was 97.3% White, 0.9% African American, 0.3% Native American, 0.3% Asian, and 0.9% from other races. The median age of the population was 43.7 years.
The majority of the population (90.2%) is of European descent, with the largest ethnic group being German (44.2%). The other major ethnic groups are Irish (17.2%), Italian (14.2%), and Polish (14.1%). The majority of the population (90.2%) is Christian, with the largest denominations being Catholic (45.2%) and Protestant (44.2%).
Conclusion
Burrell, Pennsylvania is a small borough located in Westmoreland County, Pennsylvania. It is situated in the Allegheny Mountains, approximately 25 miles northeast of Pittsburgh. The borough was founded in 1891 and is home to approximately 4,000 people. The economy of Burrell is primarily based on manufacturing and retail, and the population is primarily of European descent. The median household income is around $40,000, and the median home value is around $90,000.
Common Questions
What is Per Capita Income in Lower Burrell?
Per Capita income in Lower Burrell is $43,582.
What is the Median Family Income in Lower Burrell?
Median Family Income in Lower Burrell is $98,720.
What is the Median Household income in Lower Burrell?
Median Household Income in Lower Burrell is $78,639.
What is Income or Wage Gap in Lower Burrell?
Income or Wage Gap in Lower Burrell is 33.3%.
Women in Lower Burrell earn 66.7 cents for every dollar earned by a man.
What is Inequality or Gini Index in Lower Burrell?
Inequality or Gini Index in Lower Burrell is 0.43.
What is the Total Population of Lower Burrell?
Total Population of Lower Burrell is 11,701.
What is the Total Male Population of Lower Burrell?
Total Male Population of Lower Burrell is 5,791.
What is the Total Female Population of Lower Burrell?
Total Female Population of Lower Burrell is 5,910.
What is the Ratio of Males per 100 Females in Lower Burrell?
There are 97.99 Males per 100 Females in Lower Burrell.
What is the Ratio of Females per 100 Males in Lower Burrell?
There are 102.05 Females per 100 Males in Lower Burrell.
What is the Median Population Age in Lower Burrell?
Median Population Age in Lower Burrell is 48.9 Years.
What is the Average Family Size in Lower Burrell
Average Family Size in Lower Burrell is 2.7 People.
What is the Average Household Size in Lower Burrell
Average Household Size in Lower Burrell is 2.2 People.
How Large is the Labor Force in Lower Burrell?
There are 5,837 People in the Labor Forcein in Lower Burrell.
What is the Percentage of People in the Labor Force in Lower Burrell?
58.3% of People are in the Labor Force in Lower Burrell.
What is the Unemployment Rate in Lower Burrell?
Unemployment Rate in Lower Burrell is 2.2%.