Montgomery borough, PA Map & Demographics
Montgomery borough Overview
$26,193
PER CAPITA INCOME
$59,543
AVG FAMILY INCOME
$54,250
AVG HOUSEHOLD INCOME
35.2%
WAGE / INCOME GAP [ % ]
64.8¢/ $1
WAGE / INCOME GAP [ $ ]
0.43
INEQUALITY / GINI INDEX
1,421
TOTAL POPULATION
760
MALE POPULATION
661
FEMALE POPULATION
114.98
MALES / 100 FEMALES
86.97
FEMALES / 100 MALES
31.2
MEDIAN AGE
3.3
AVG FAMILY SIZE
2.5
AVG HOUSEHOLD SIZE
632
LABOR FORCE [ PEOPLE ]
64.6%
PERCENT IN LABOR FORCE
6.2%
UNEMPLOYMENT RATE
Income in Montgomery borough
Income Overview in Montgomery borough
Per Capita Income in Montgomery borough is $26,193, while median incomes of families and households are $59,543 and $54,250 respectively.
| Characteristic | Number | Measure |
| Per Capita Income | 1,421 | $26,193 |
| Median Family Income | 339 | $59,543 |
| Mean Family Income | 339 | $75,620 |
| Median Household Income | 570 | $54,250 |
| Mean Household Income | 570 | $63,657 |
| Income Deficit | 339 | $0 |
| Wage / Income Gap (%) | 1,421 | 35.21% |
| Wage / Income Gap ($) | 1,421 | 64.79¢ per $1 |
| Gini / Inequality Index | 1,421 | 0.43 |
Earnings by Sex in Montgomery borough
Average Earnings in Montgomery borough are $38,897, $52,893 for men and $34,271 for women, a difference of 35.2%.
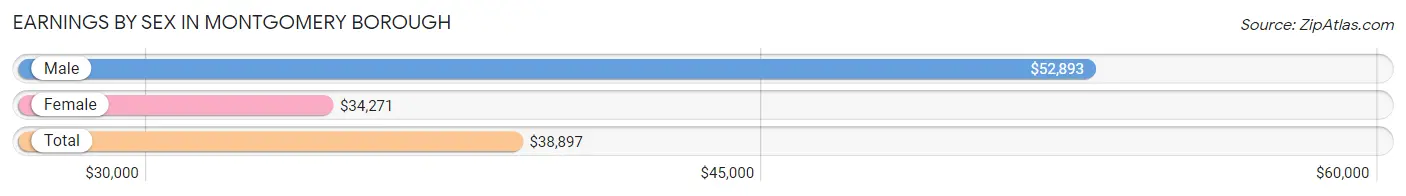
| Sex | Number | Average Earnings |
| Male | 351 (54.2%) | $52,893 |
| Female | 297 (45.8%) | $34,271 |
| Total | 648 (100.0%) | $38,897 |
Earnings by Sex by Income Bracket in Montgomery borough
The most common earnings brackets in Montgomery borough are $50,000 to $54,999 for men (57 | 16.2%) and $35,000 to $39,999 for women (47 | 15.8%).
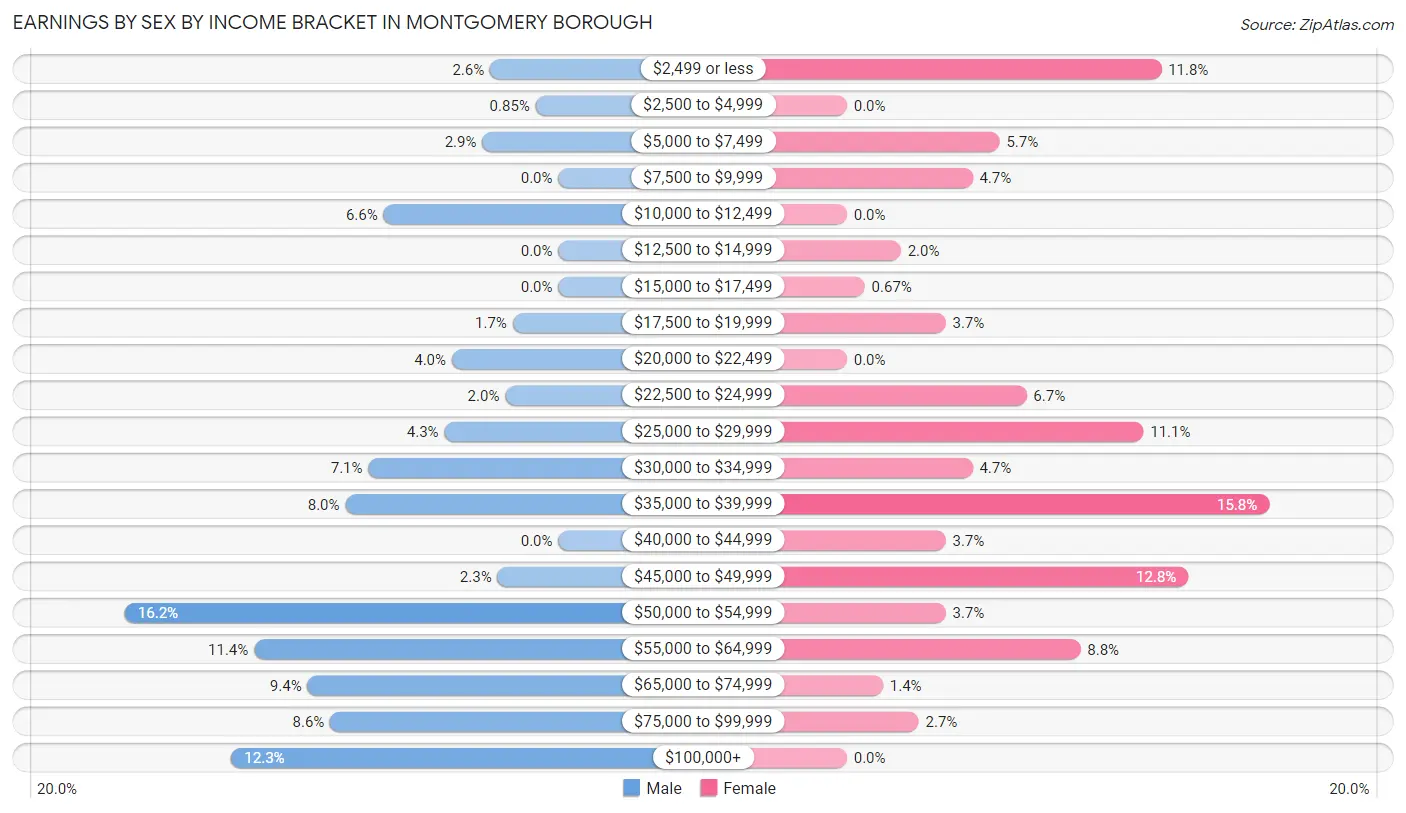
| Income | Male | Female |
| $2,499 or less | 9 (2.6%) | 35 (11.8%) |
| $2,500 to $4,999 | 3 (0.9%) | 0 (0.0%) |
| $5,000 to $7,499 | 10 (2.9%) | 17 (5.7%) |
| $7,500 to $9,999 | 0 (0.0%) | 14 (4.7%) |
| $10,000 to $12,499 | 23 (6.6%) | 0 (0.0%) |
| $12,500 to $14,999 | 0 (0.0%) | 6 (2.0%) |
| $15,000 to $17,499 | 0 (0.0%) | 2 (0.7%) |
| $17,500 to $19,999 | 6 (1.7%) | 11 (3.7%) |
| $20,000 to $22,499 | 14 (4.0%) | 0 (0.0%) |
| $22,500 to $24,999 | 7 (2.0%) | 20 (6.7%) |
| $25,000 to $29,999 | 15 (4.3%) | 33 (11.1%) |
| $30,000 to $34,999 | 25 (7.1%) | 14 (4.7%) |
| $35,000 to $39,999 | 28 (8.0%) | 47 (15.8%) |
| $40,000 to $44,999 | 0 (0.0%) | 11 (3.7%) |
| $45,000 to $49,999 | 8 (2.3%) | 38 (12.8%) |
| $50,000 to $54,999 | 57 (16.2%) | 11 (3.7%) |
| $55,000 to $64,999 | 40 (11.4%) | 26 (8.7%) |
| $65,000 to $74,999 | 33 (9.4%) | 4 (1.3%) |
| $75,000 to $99,999 | 30 (8.6%) | 8 (2.7%) |
| $100,000+ | 43 (12.2%) | 0 (0.0%) |
| Total | 351 (100.0%) | 297 (100.0%) |
Earnings by Sex by Educational Attainment in Montgomery borough
Average earnings in Montgomery borough are $53,500 for men and $35,595 for women, a difference of 33.5%. Men with an educational attainment of bachelor's degree enjoy the highest average annual earnings of $111,250, while those with less than high school education earn the least with $33,750. Women with an educational attainment of graduate degree earn the most with the average annual earnings of $61,250, while those with college or associate's degree education have the smallest earnings of $26,875.
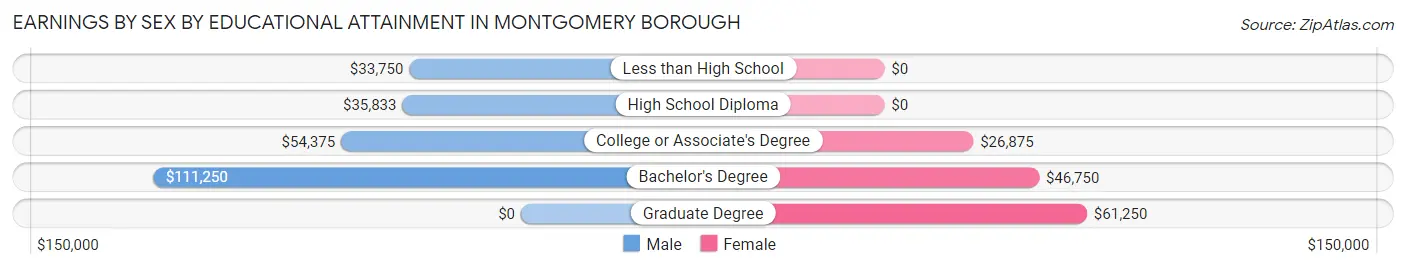
| Educational Attainment | Male Income | Female Income |
| Less than High School | $33,750 | $0 |
| High School Diploma | $35,833 | $0 |
| College or Associate's Degree | $54,375 | $26,875 |
| Bachelor's Degree | $111,250 | $46,750 |
| Graduate Degree | - | - |
| Total | $53,500 | $35,595 |
Family Income in Montgomery borough
Family Income Brackets in Montgomery borough
According to the Montgomery borough family income data, there are 105 families falling into the $50,000 to $74,999 income range, which is the most common income bracket and makes up 31.0% of all families.
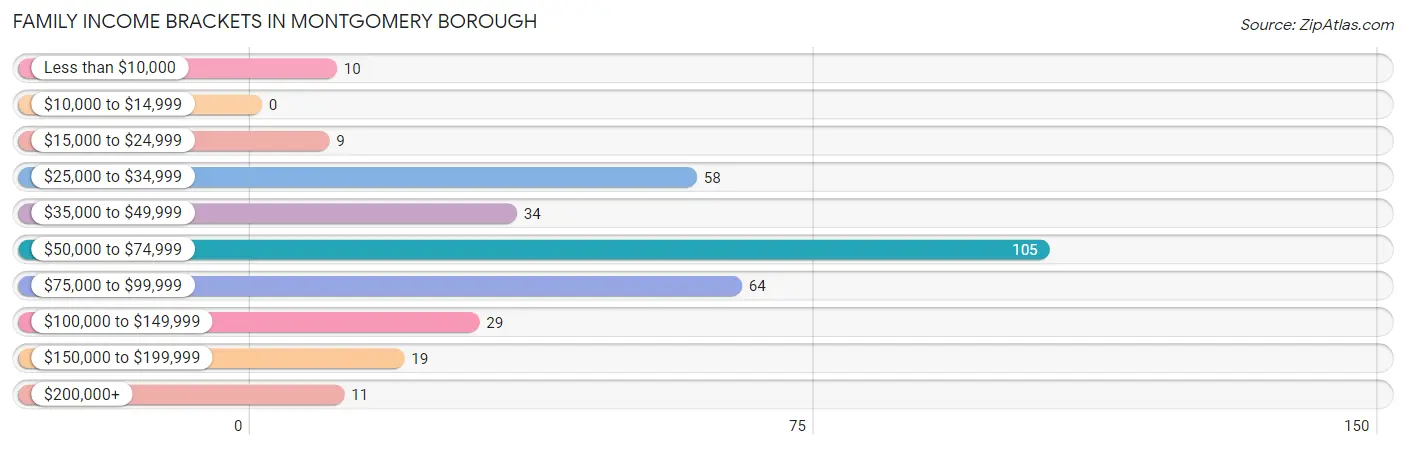
| Income Bracket | # Families | % Families |
| Less than $10,000 | 10 | 2.9% |
| $10,000 to $14,999 | 0 | 0.0% |
| $15,000 to $24,999 | 9 | 2.7% |
| $25,000 to $34,999 | 58 | 17.1% |
| $35,000 to $49,999 | 34 | 10.0% |
| $50,000 to $74,999 | 105 | 31.0% |
| $75,000 to $99,999 | 64 | 18.9% |
| $100,000 to $149,999 | 29 | 8.6% |
| $150,000 to $199,999 | 19 | 5.6% |
| $200,000+ | 11 | 3.2% |
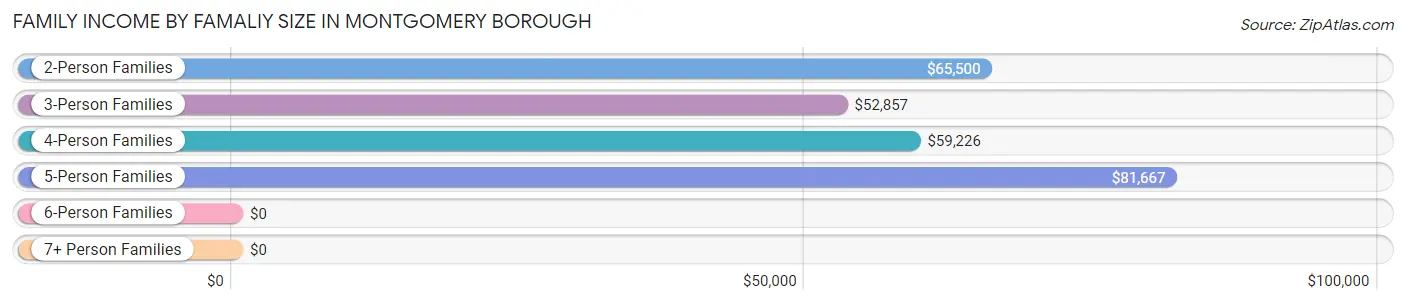
Family Income by Famaliy Size in Montgomery borough
5-person families (22 | 6.5%) account for the highest median family income in Montgomery borough with $81,667 per family, while 2-person families (146 | 43.1%) have the highest median income of $32,750 per family member.
| Income Bracket | # Families | Median Income |
| 2-Person Families | 146 (43.1%) | $65,500 |
| 3-Person Families | 72 (21.2%) | $52,857 |
| 4-Person Families | 75 (22.1%) | $59,226 |
| 5-Person Families | 22 (6.5%) | $81,667 |
| 6-Person Families | 5 (1.5%) | $0 |
| 7+ Person Families | 19 (5.6%) | $0 |
| Total | 339 (100.0%) | $59,543 |
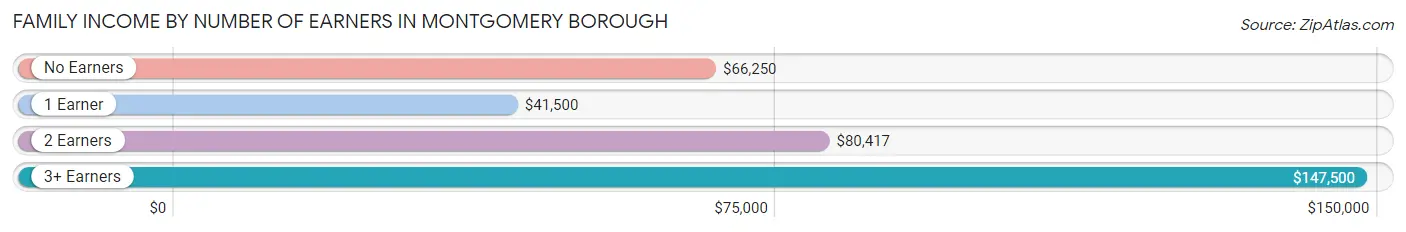
Family Income by Number of Earners in Montgomery borough
The median family income in Montgomery borough is $59,543, with families comprising 3+ earners (22) having the highest median family income of $147,500, while families with 1 earner (144) have the lowest median family income of $41,500, accounting for 6.5% and 42.5% of families, respectively.
| Number of Earners | # Families | Median Income |
| No Earners | 52 (15.3%) | $66,250 |
| 1 Earner | 144 (42.5%) | $41,500 |
| 2 Earners | 121 (35.7%) | $80,417 |
| 3+ Earners | 22 (6.5%) | $147,500 |
| Total | 339 (100.0%) | $59,543 |
Household Income in Montgomery borough
Household Income Brackets in Montgomery borough
With 124 households falling in the category, the $50,000 to $74,999 income range is the most frequent in Montgomery borough, accounting for 21.7% of all households. In contrast, only 11 households (1.9%) fall into the $200,000+ income bracket, making it the least populous group.
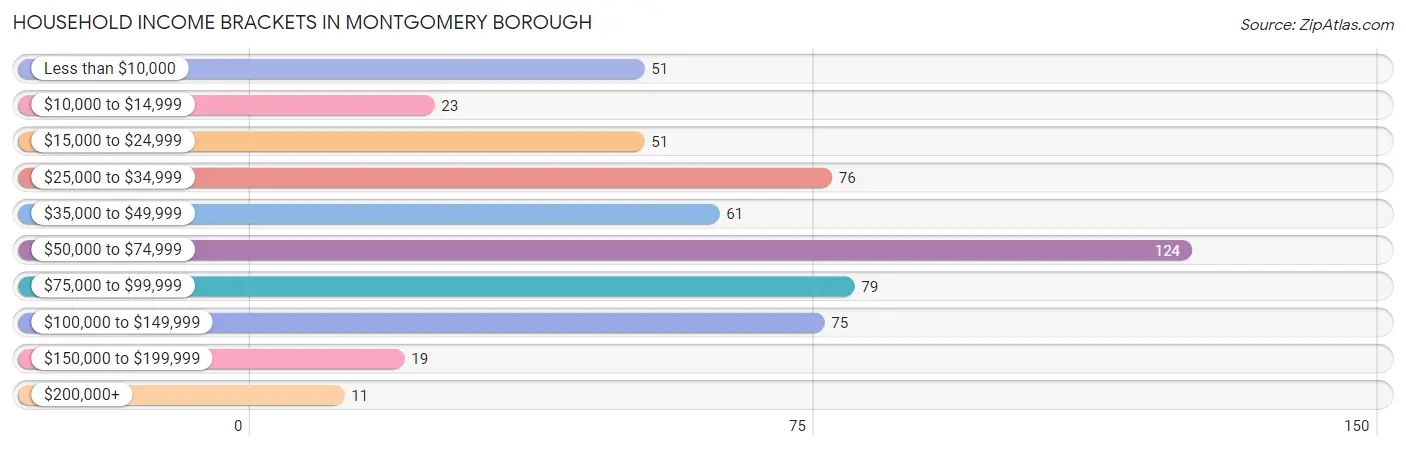
| Income Bracket | # Households | % Households |
| Less than $10,000 | 51 | 8.9% |
| $10,000 to $14,999 | 23 | 4.0% |
| $15,000 to $24,999 | 51 | 8.9% |
| $25,000 to $34,999 | 76 | 13.3% |
| $35,000 to $49,999 | 61 | 10.7% |
| $50,000 to $74,999 | 124 | 21.8% |
| $75,000 to $99,999 | 79 | 13.9% |
| $100,000 to $149,999 | 75 | 13.2% |
| $150,000 to $199,999 | 19 | 3.3% |
| $200,000+ | 11 | 1.9% |
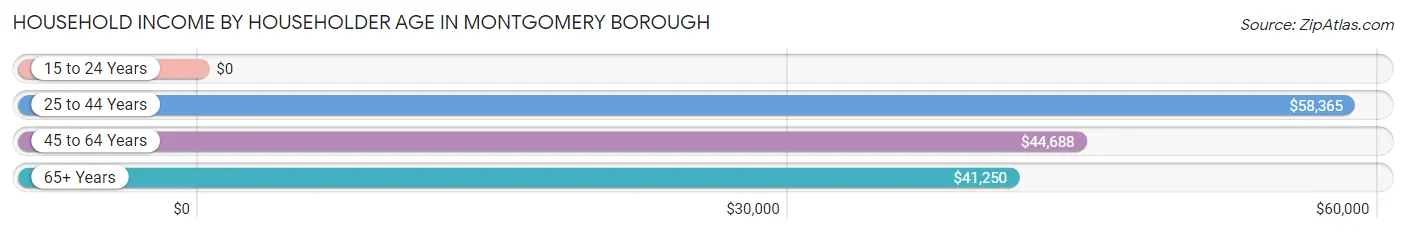
Household Income by Householder Age in Montgomery borough
The median household income in Montgomery borough is $54,250, with the highest median household income of $58,365 found in the 25 to 44 years age bracket for the primary householder. A total of 253 households (44.4%) fall into this category. Meanwhile, the 15 to 24 years age bracket for the primary householder has the lowest median household income of $0, with 3 households (0.5%) in this group.
| Income Bracket | # Households | Median Income |
| 15 to 24 Years | 3 (0.5%) | $0 |
| 25 to 44 Years | 253 (44.4%) | $58,365 |
| 45 to 64 Years | 193 (33.9%) | $44,688 |
| 65+ Years | 121 (21.2%) | $41,250 |
| Total | 570 (100.0%) | $54,250 |
Poverty in Montgomery borough
Income Below Poverty by Sex and Age in Montgomery borough
With 6.8% poverty level for males and 13.5% for females among the residents of Montgomery borough, 18 to 24 year old males and 5 year old females are the most vulnerable to poverty, with 4 males (26.7%) and 5 females (50.0%) in their respective age groups living below the poverty level.
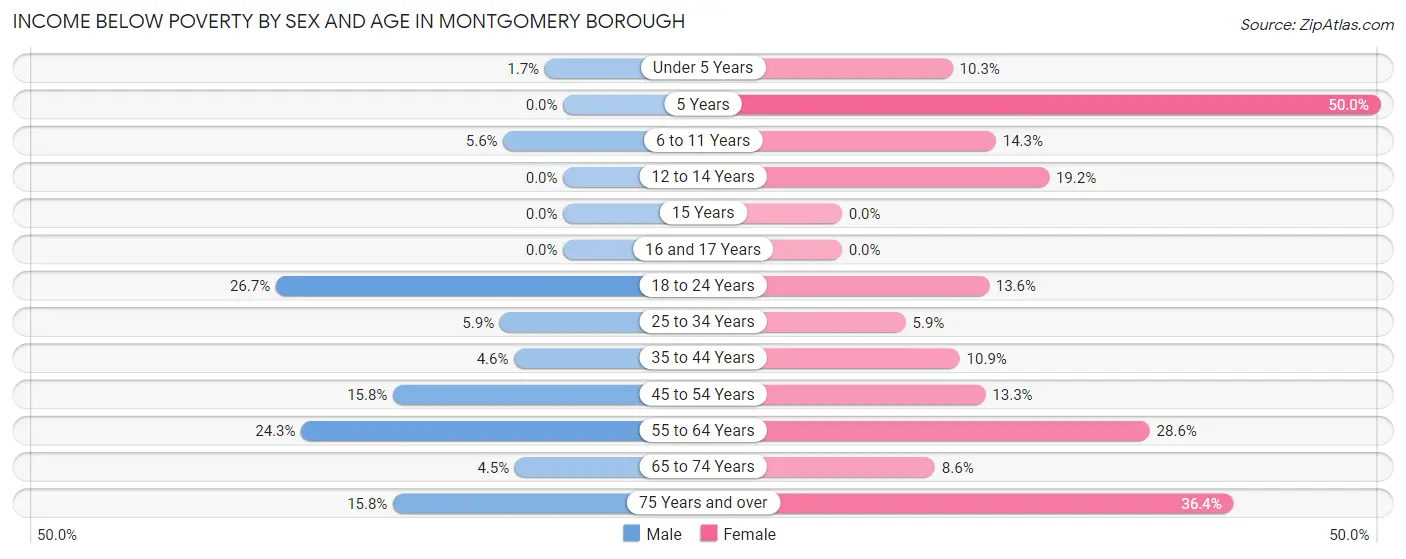
| Age Bracket | Male | Female |
| Under 5 Years | 2 (1.7%) | 7 (10.3%) |
| 5 Years | 0 (0.0%) | 5 (50.0%) |
| 6 to 11 Years | 5 (5.6%) | 5 (14.3%) |
| 12 to 14 Years | 0 (0.0%) | 5 (19.2%) |
| 15 Years | 0 (0.0%) | 0 (0.0%) |
| 16 and 17 Years | 0 (0.0%) | 0 (0.0%) |
| 18 to 24 Years | 4 (26.7%) | 3 (13.6%) |
| 25 to 34 Years | 9 (5.9%) | 10 (5.9%) |
| 35 to 44 Years | 4 (4.5%) | 7 (10.9%) |
| 45 to 54 Years | 12 (15.8%) | 8 (13.3%) |
| 55 to 64 Years | 9 (24.3%) | 24 (28.6%) |
| 65 to 74 Years | 3 (4.5%) | 7 (8.6%) |
| 75 Years and over | 3 (15.8%) | 8 (36.4%) |
| Total | 51 (6.8%) | 89 (13.5%) |
Income Above Poverty by Sex and Age in Montgomery borough
According to the poverty statistics in Montgomery borough, males aged 5 years and females aged 15 years are the age groups that are most secure financially, with 100.0% of males and 100.0% of females in these age groups living above the poverty line.
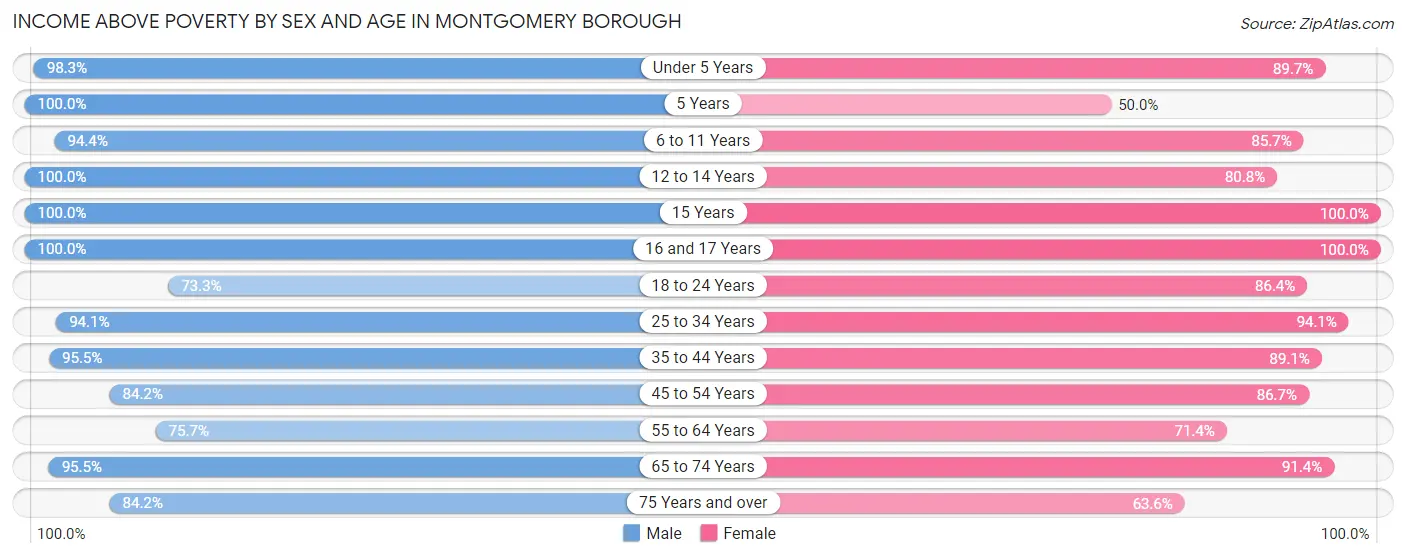
| Age Bracket | Male | Female |
| Under 5 Years | 115 (98.3%) | 61 (89.7%) |
| 5 Years | 15 (100.0%) | 5 (50.0%) |
| 6 to 11 Years | 85 (94.4%) | 30 (85.7%) |
| 12 to 14 Years | 52 (100.0%) | 21 (80.8%) |
| 15 Years | 8 (100.0%) | 7 (100.0%) |
| 16 and 17 Years | 9 (100.0%) | 13 (100.0%) |
| 18 to 24 Years | 11 (73.3%) | 19 (86.4%) |
| 25 to 34 Years | 144 (94.1%) | 159 (94.1%) |
| 35 to 44 Years | 84 (95.5%) | 57 (89.1%) |
| 45 to 54 Years | 64 (84.2%) | 52 (86.7%) |
| 55 to 64 Years | 28 (75.7%) | 60 (71.4%) |
| 65 to 74 Years | 64 (95.5%) | 74 (91.4%) |
| 75 Years and over | 16 (84.2%) | 14 (63.6%) |
| Total | 695 (93.2%) | 572 (86.5%) |
Income Below Poverty Among Married-Couple Families in Montgomery borough
The poverty statistics for married-couple families in Montgomery borough show that 5.6% or 14 of the total 250 families live below the poverty line. Families with no children have the highest poverty rate of 8.7%, comprising of 10 families. On the other hand, families with 3 or 4 children have the lowest poverty rate of 0.0%, which includes 0 families.
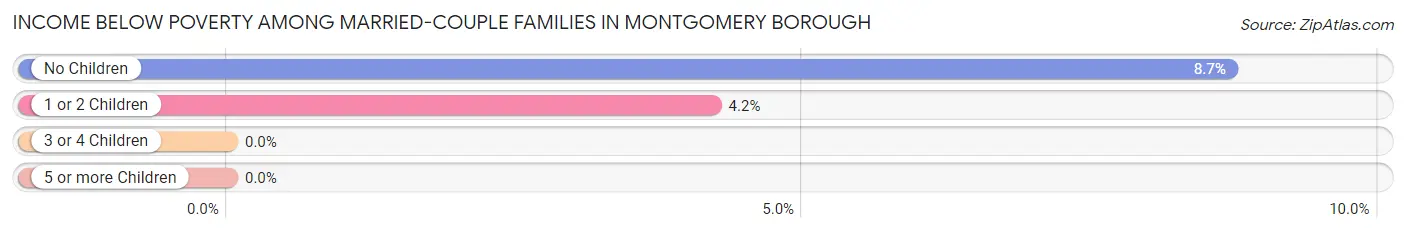
| Children | Above Poverty | Below Poverty |
| No Children | 105 (91.3%) | 10 (8.7%) |
| 1 or 2 Children | 91 (95.8%) | 4 (4.2%) |
| 3 or 4 Children | 25 (100.0%) | 0 (0.0%) |
| 5 or more Children | 15 (100.0%) | 0 (0.0%) |
| Total | 236 (94.4%) | 14 (5.6%) |
Income Below Poverty Among Single-Parent Households in Montgomery borough
According to the poverty data in Montgomery borough, 3.1% or 1 single-father households and 14.0% or 8 single-mother households are living below the poverty line. Among single-father households, those with 3 or 4 children have the highest poverty rate, with 1 households (100.0%) experiencing poverty. Likewise, among single-mother households, those with 3 or 4 children have the highest poverty rate, with 3 households (33.3%) falling below the poverty line.
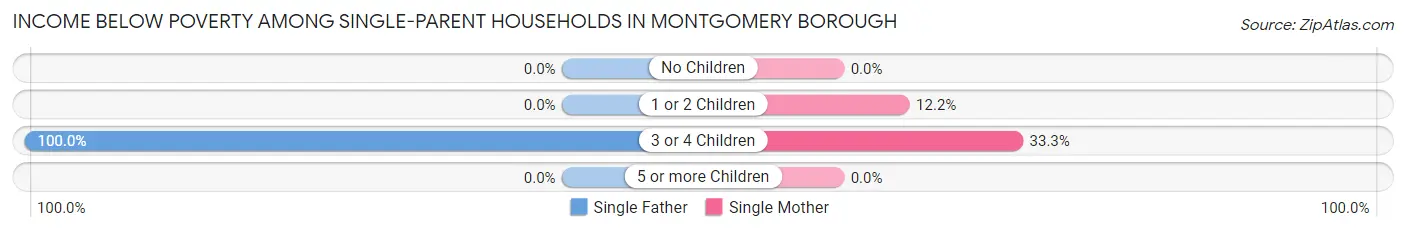
| Children | Single Father | Single Mother |
| No Children | 0 (0.0%) | 0 (0.0%) |
| 1 or 2 Children | 0 (0.0%) | 5 (12.2%) |
| 3 or 4 Children | 1 (100.0%) | 3 (33.3%) |
| 5 or more Children | 0 (0.0%) | 0 (0.0%) |
| Total | 1 (3.1%) | 8 (14.0%) |
Income Below Poverty Among Married-Couple vs Single-Parent Households in Montgomery borough
The poverty data for Montgomery borough shows that 14 of the married-couple family households (5.6%) and 9 of the single-parent households (10.1%) are living below the poverty level. Within the married-couple family households, those with no children have the highest poverty rate, with 10 households (8.7%) falling below the poverty line. Among the single-parent households, those with 3 or 4 children have the highest poverty rate, with 4 household (40.0%) living below poverty.
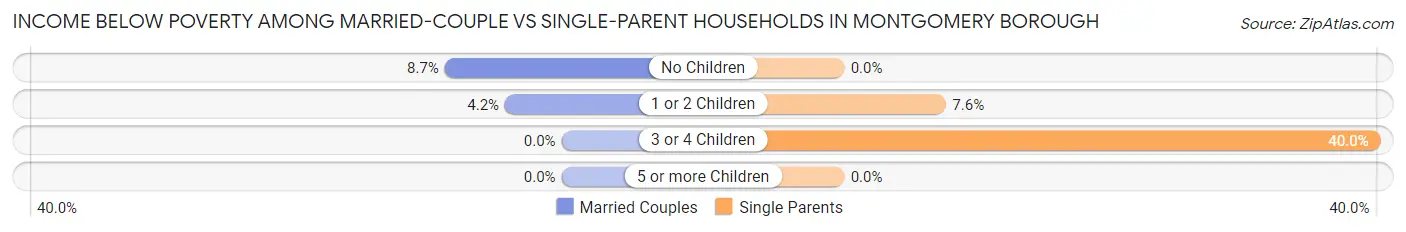
| Children | Married-Couple Families | Single-Parent Households |
| No Children | 10 (8.7%) | 0 (0.0%) |
| 1 or 2 Children | 4 (4.2%) | 5 (7.6%) |
| 3 or 4 Children | 0 (0.0%) | 4 (40.0%) |
| 5 or more Children | 0 (0.0%) | 0 (0.0%) |
| Total | 14 (5.6%) | 9 (10.1%) |
Race in Montgomery borough
The most populous races in Montgomery borough are White / Caucasian (1,286 | 90.5%), Two or more Races (85 | 6.0%), and Hispanic or Latino (43 | 3.0%).
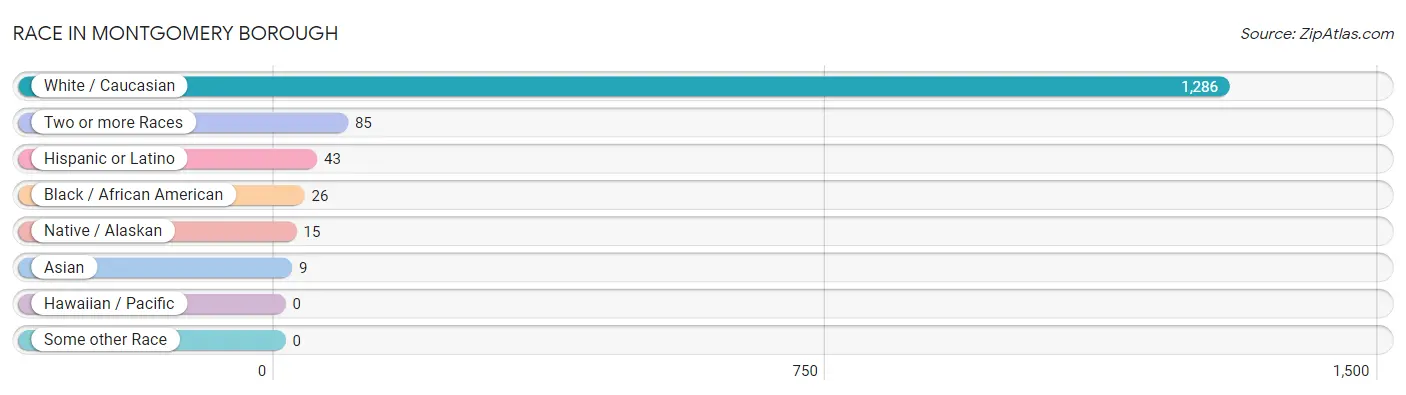
| Race | # Population | % Population |
| Asian | 9 | 0.6% |
| Black / African American | 26 | 1.8% |
| Hawaiian / Pacific | 0 | 0.0% |
| Hispanic or Latino | 43 | 3.0% |
| Native / Alaskan | 15 | 1.1% |
| White / Caucasian | 1,286 | 90.5% |
| Two or more Races | 85 | 6.0% |
| Some other Race | 0 | 0.0% |
| Total | 1,421 | 100.0% |
Ancestry in Montgomery borough
The most populous ancestries reported in Montgomery borough are German (322 | 22.7%), American (188 | 13.2%), English (120 | 8.4%), Irish (114 | 8.0%), and Polish (50 | 3.5%), together accounting for 55.9% of all Montgomery borough residents.
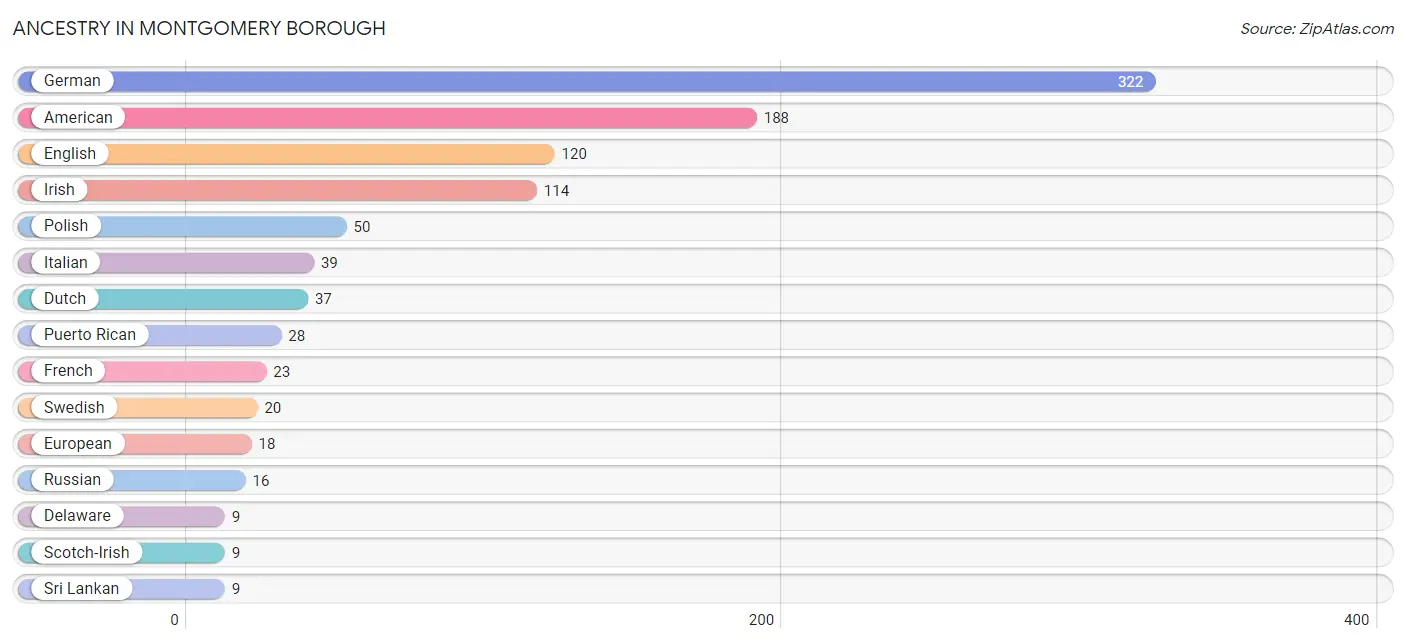
| Ancestry | # Population | % Population |
| Aleut | 4 | 0.3% |
| American | 188 | 13.2% |
| Bolivian | 8 | 0.6% |
| Canadian | 5 | 0.4% |
| Chippewa | 2 | 0.1% |
| Cuban | 7 | 0.5% |
| Czech | 6 | 0.4% |
| Delaware | 9 | 0.6% |
| Dutch | 37 | 2.6% |
| English | 120 | 8.4% |
| European | 18 | 1.3% |
| French | 23 | 1.6% |
| German | 322 | 22.7% |
| Hungarian | 2 | 0.1% |
| Irish | 114 | 8.0% |
| Italian | 39 | 2.7% |
| Korean | 3 | 0.2% |
| Northern European | 2 | 0.1% |
| Norwegian | 5 | 0.4% |
| Pennsylvania German | 8 | 0.6% |
| Polish | 50 | 3.5% |
| Puerto Rican | 28 | 2.0% |
| Russian | 16 | 1.1% |
| Scotch-Irish | 9 | 0.6% |
| Scottish | 8 | 0.6% |
| Slovak | 4 | 0.3% |
| South American | 8 | 0.6% |
| Sri Lankan | 9 | 0.6% |
| Swedish | 20 | 1.4% |
| Welsh | 4 | 0.3% | View All 30 Rows |
Immigrants in Montgomery borough
The most numerous immigrant groups reported in Montgomery borough came from Asia (9 | 0.6%), South Eastern Asia (9 | 0.6%), and Vietnam (9 | 0.6%), together accounting for 1.9% of all Montgomery borough residents.
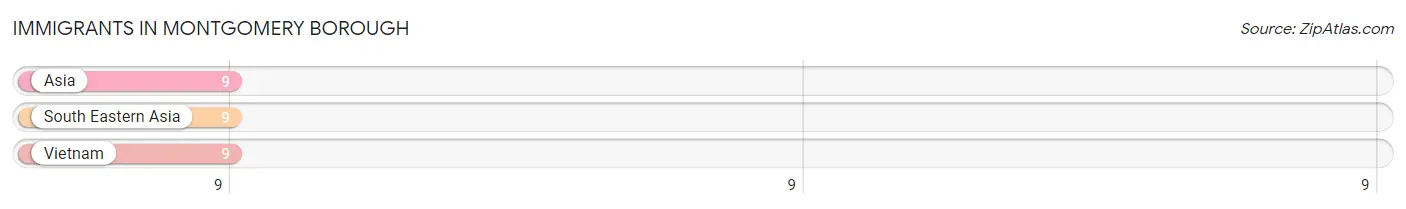
| Immigration Origin | # Population | % Population |
| Asia | 9 | 0.6% |
| South Eastern Asia | 9 | 0.6% |
| Vietnam | 9 | 0.6% | View All 3 Rows |
Sex and Age in Montgomery borough
Sex and Age in Montgomery borough
The most populous age groups in Montgomery borough are Under 5 Years (117 | 15.4%) for men and 30 to 34 Years (109 | 16.5%) for women.
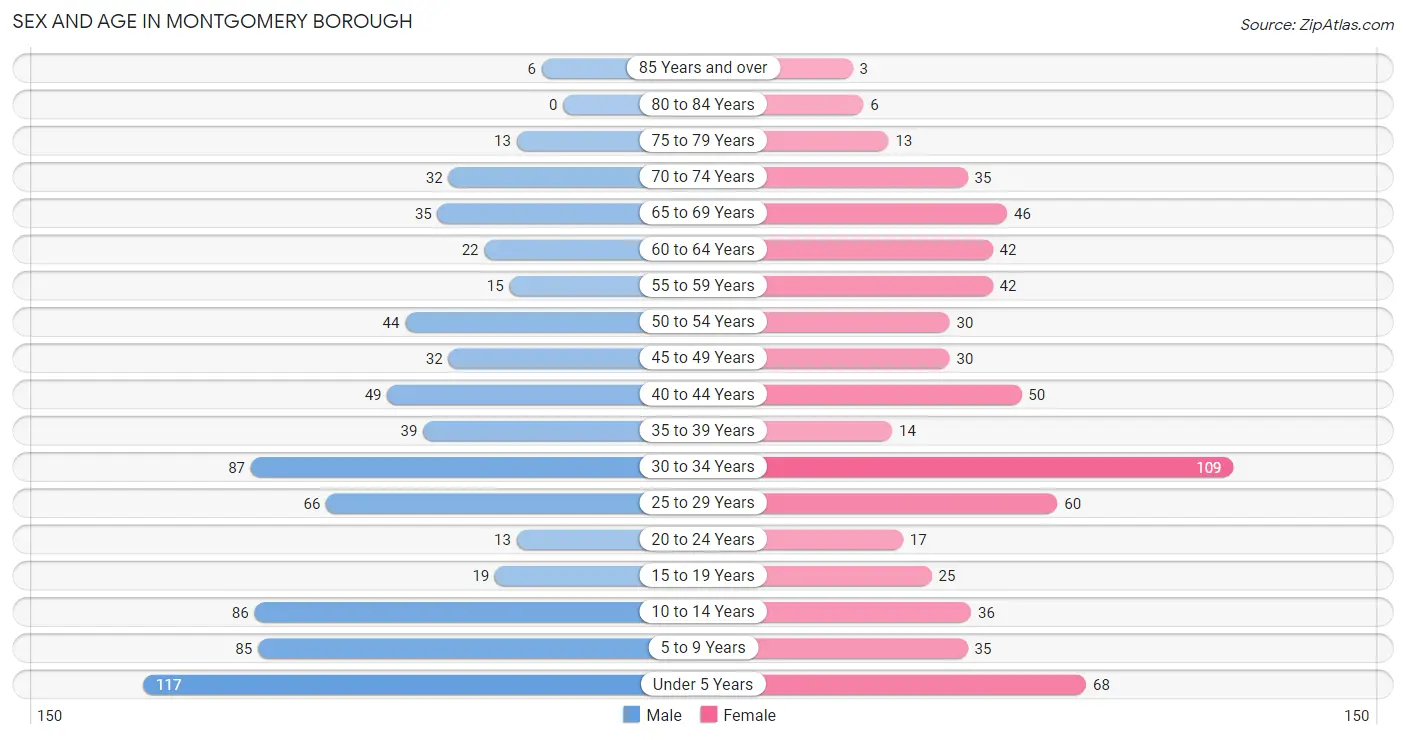
| Age Bracket | Male | Female |
| Under 5 Years | 117 (15.4%) | 68 (10.3%) |
| 5 to 9 Years | 85 (11.2%) | 35 (5.3%) |
| 10 to 14 Years | 86 (11.3%) | 36 (5.4%) |
| 15 to 19 Years | 19 (2.5%) | 25 (3.8%) |
| 20 to 24 Years | 13 (1.7%) | 17 (2.6%) |
| 25 to 29 Years | 66 (8.7%) | 60 (9.1%) |
| 30 to 34 Years | 87 (11.5%) | 109 (16.5%) |
| 35 to 39 Years | 39 (5.1%) | 14 (2.1%) |
| 40 to 44 Years | 49 (6.5%) | 50 (7.6%) |
| 45 to 49 Years | 32 (4.2%) | 30 (4.5%) |
| 50 to 54 Years | 44 (5.8%) | 30 (4.5%) |
| 55 to 59 Years | 15 (2.0%) | 42 (6.4%) |
| 60 to 64 Years | 22 (2.9%) | 42 (6.4%) |
| 65 to 69 Years | 35 (4.6%) | 46 (7.0%) |
| 70 to 74 Years | 32 (4.2%) | 35 (5.3%) |
| 75 to 79 Years | 13 (1.7%) | 13 (2.0%) |
| 80 to 84 Years | 0 (0.0%) | 6 (0.9%) |
| 85 Years and over | 6 (0.8%) | 3 (0.4%) |
| Total | 760 (100.0%) | 661 (100.0%) |
Families and Households in Montgomery borough
Median Family Size in Montgomery borough
The median family size in Montgomery borough is 3.28 persons per family, with married-couple families (250 | 73.8%) accounting for the largest median family size of 3.56 persons per family. On the other hand, single female/mother families (57 | 16.8%) represent the smallest median family size with 2.44 persons per family.
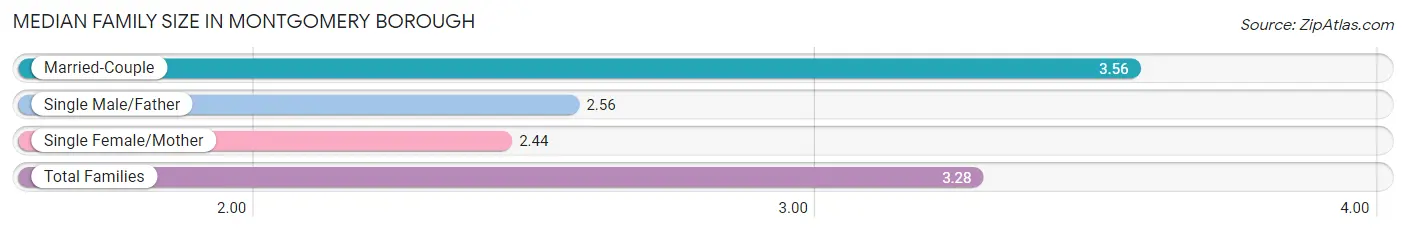
| Family Type | # Families | Family Size |
| Married-Couple | 250 (73.8%) | 3.56 |
| Single Male/Father | 32 (9.4%) | 2.56 |
| Single Female/Mother | 57 (16.8%) | 2.44 |
| Total Families | 339 (100.0%) | 3.28 |
Median Household Size in Montgomery borough
The median household size in Montgomery borough is 2.49 persons per household, with married-couple households (250 | 43.9%) accounting for the largest median household size of 3.56 persons per household. non-family households (231 | 40.5%) represent the smallest median household size with 1.29 persons per household.
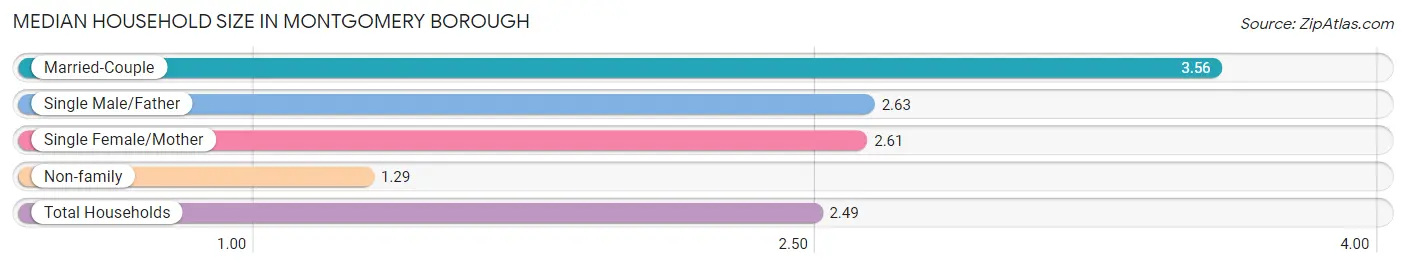
| Household Type | # Households | Household Size |
| Married-Couple | 250 (43.9%) | 3.56 |
| Single Male/Father | 32 (5.6%) | 2.63 |
| Single Female/Mother | 57 (10.0%) | 2.61 |
| Non-family | 231 (40.5%) | 1.29 |
| Total Households | 570 (100.0%) | 2.49 |
Household Size by Marriage Status in Montgomery borough
Out of a total of 570 households in Montgomery borough, 339 (59.5%) are family households, while 231 (40.5%) are nonfamily households. The most numerous type of family households are 2-person households, comprising 138, and the most common type of nonfamily households are 1-person households, comprising 177.
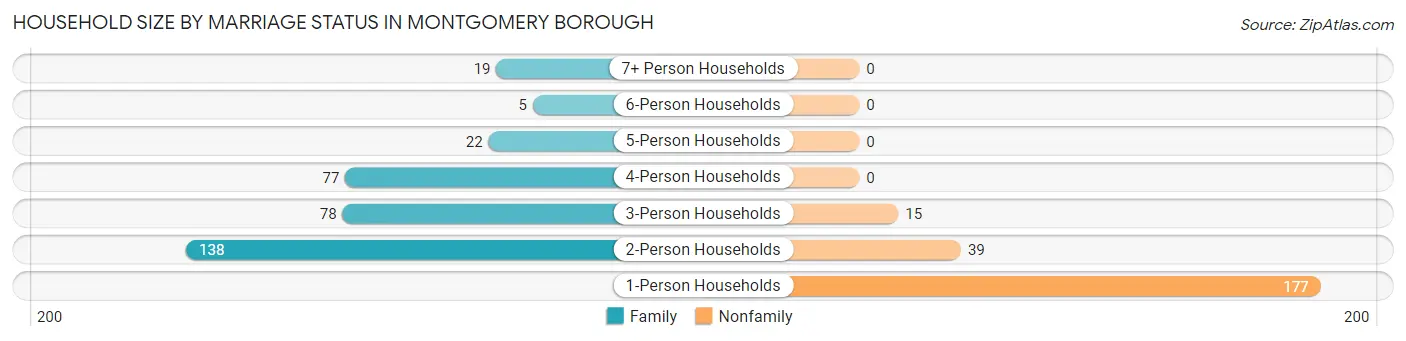
| Household Size | Family Households | Nonfamily Households |
| 1-Person Households | - | 177 (31.0%) |
| 2-Person Households | 138 (24.2%) | 39 (6.8%) |
| 3-Person Households | 78 (13.7%) | 15 (2.6%) |
| 4-Person Households | 77 (13.5%) | 0 (0.0%) |
| 5-Person Households | 22 (3.9%) | 0 (0.0%) |
| 6-Person Households | 5 (0.9%) | 0 (0.0%) |
| 7+ Person Households | 19 (3.3%) | 0 (0.0%) |
| Total | 339 (59.5%) | 231 (40.5%) |
Female Fertility in Montgomery borough
Fertility by Age in Montgomery borough
Average fertility rate in Montgomery borough is 120.0 births per 1,000 women. Women in the age bracket of 20 to 34 years have the highest fertility rate with 199.0 births per 1,000 women. Women in the age bracket of 20 to 34 years acount for 100.0% of all women with births.
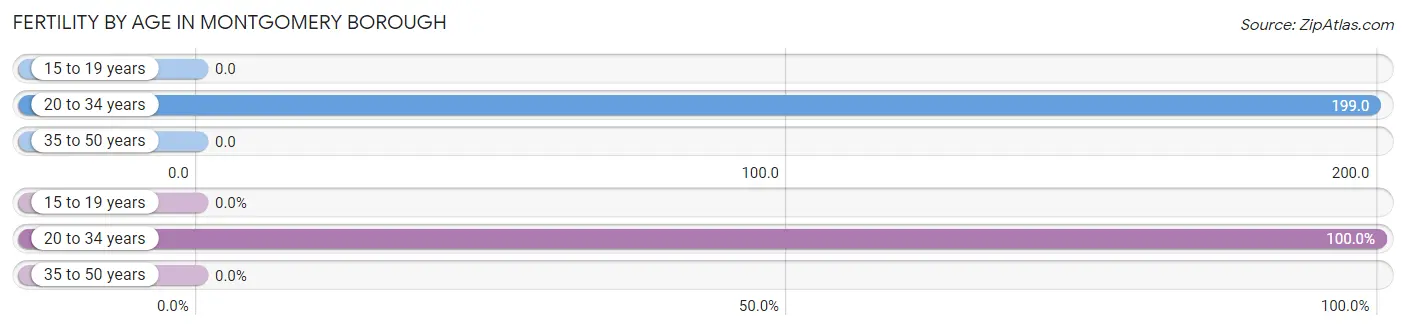
| Age Bracket | Women with Births | Births / 1,000 Women |
| 15 to 19 years | 0 (0.0%) | 0.0 |
| 20 to 34 years | 37 (100.0%) | 199.0 |
| 35 to 50 years | 0 (0.0%) | 0.0 |
| Total | 37 (100.0%) | 120.0 |
Fertility by Age by Marriage Status in Montgomery borough
89.2% of women with births (37) in Montgomery borough are married. The highest percentage of unmarried women with births falls into 20 to 34 years age bracket with 10.8% of them unmarried at the time of birth, while the lowest percentage of unmarried women with births belong to 20 to 34 years age bracket with 10.8% of them unmarried.
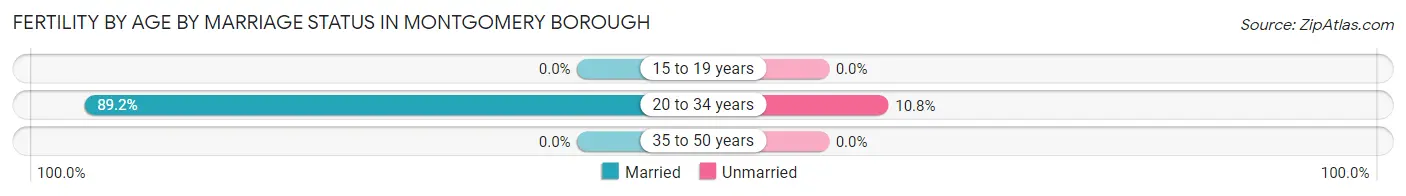
| Age Bracket | Married | Unmarried |
| 15 to 19 years | 0 (0.0%) | 0 (0.0%) |
| 20 to 34 years | 33 (89.2%) | 4 (10.8%) |
| 35 to 50 years | 0 (0.0%) | 0 (0.0%) |
| Total | 33 (89.2%) | 4 (10.8%) |
Fertility by Education in Montgomery borough
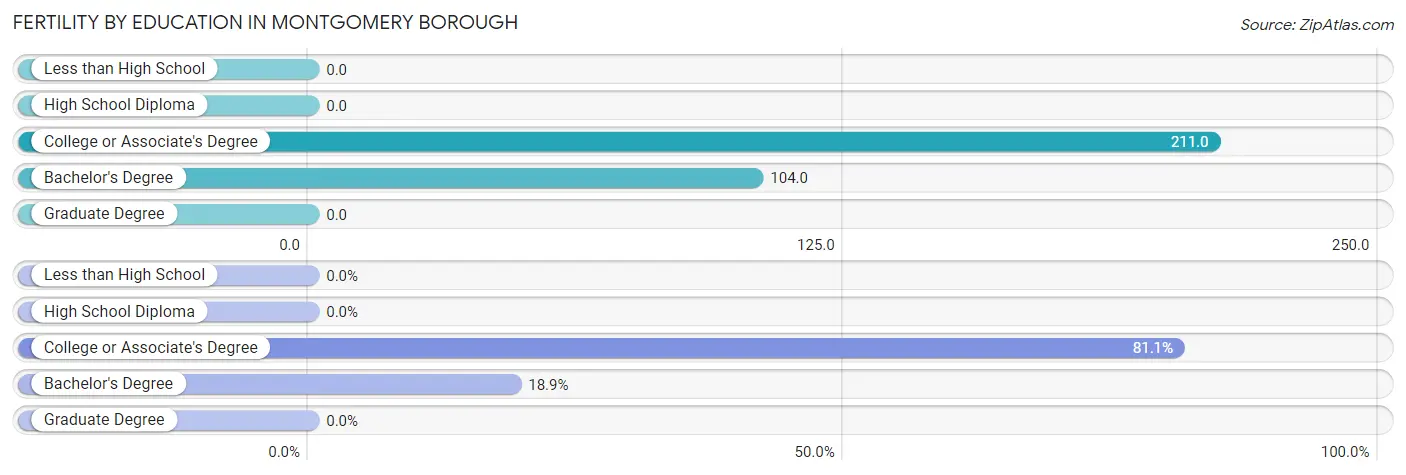
| Educational Attainment | Women with Births | Births / 1,000 Women |
| Less than High School | 0 (0.0%) | 0.0 |
| High School Diploma | 0 (0.0%) | 0.0 |
| College or Associate's Degree | 30 (81.1%) | 211.0 |
| Bachelor's Degree | 7 (18.9%) | 104.0 |
| Graduate Degree | 0 (0.0%) | 0.0 |
| Total | 37 (100.0%) | 120.0 |
Fertility by Education by Marriage Status in Montgomery borough
10.8% of women with births in Montgomery borough are unmarried. Women with the educational attainment of bachelor's degree are most likely to be married with 100.0% of them married at childbirth, while women with the educational attainment of college or associate's degree are least likely to be married with 13.3% of them unmarried at childbirth.
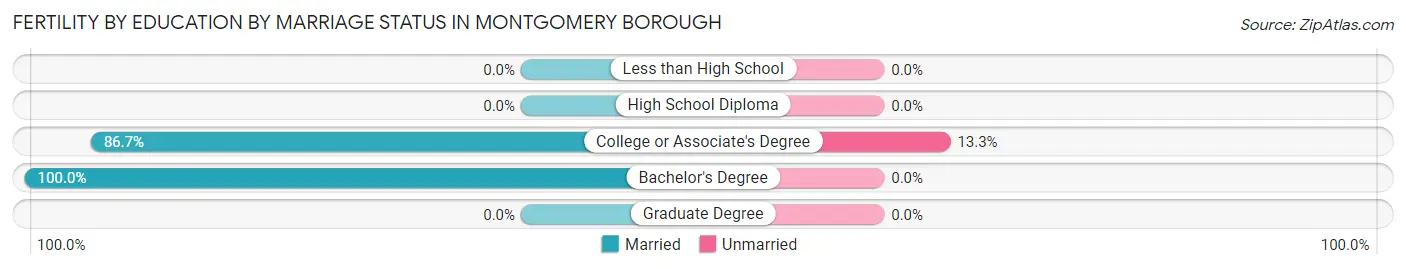
| Educational Attainment | Married | Unmarried |
| Less than High School | 0 (0.0%) | 0 (0.0%) |
| High School Diploma | 0 (0.0%) | 0 (0.0%) |
| College or Associate's Degree | 26 (86.7%) | 4 (13.3%) |
| Bachelor's Degree | 7 (100.0%) | 0 (0.0%) |
| Graduate Degree | 0 (0.0%) | 0 (0.0%) |
| Total | 33 (89.2%) | 4 (10.8%) |
Employment Characteristics in Montgomery borough
Employment by Class of Employer in Montgomery borough
Among the 578 employed individuals in Montgomery borough, private company employees (407 | 70.4%), not-for-profit organizations (56 | 9.7%), and federal government employees (46 | 8.0%) make up the most common classes of employment.
| Employer Class | # Employees | % Employees |
| Private Company Employees | 407 | 70.4% |
| Self-Employed (Incorporated) | 0 | 0.0% |
| Self-Employed (Not Incorporated) | 4 | 0.7% |
| Not-for-profit Organizations | 56 | 9.7% |
| Local Government Employees | 35 | 6.1% |
| State Government Employees | 30 | 5.2% |
| Federal Government Employees | 46 | 8.0% |
| Unpaid Family Workers | 0 | 0.0% |
| Total | 578 | 100.0% |
Employment Status by Age in Montgomery borough
According to the labor force statistics for Montgomery borough, out of the total population over 16 years of age (979), 64.6% or 632 individuals are in the labor force, with 6.2% or 39 of them unemployed. The age group with the highest labor force participation rate is 20 to 24 years, with 90.0% or 27 individuals in the labor force. Within the labor force, the 20 to 24 years age range has the highest percentage of unemployed individuals, with 25.9% or 7 of them being unemployed.
| Age Bracket | In Labor Force | Unemployed |
| 16 to 19 Years | 13 (44.8%) | 0 (0.0%) |
| 20 to 24 Years | 27 (90.0%) | 7 (25.9%) |
| 25 to 29 Years | 101 (80.2%) | 0 (0.0%) |
| 30 to 34 Years | 168 (85.7%) | 21 (12.5%) |
| 35 to 44 Years | 136 (89.5%) | 9 (6.9%) |
| 45 to 54 Years | 111 (81.6%) | 2 (1.8%) |
| 55 to 59 Years | 18 (31.6%) | 0 (0.0%) |
| 60 to 64 Years | 32 (50.0%) | 0 (0.0%) |
| 65 to 74 Years | 26 (17.6%) | 0 (0.0%) |
| 75 Years and over | 0 (0.0%) | 0 (0.0%) |
| Total | 632 (64.6%) | 39 (6.2%) |
Employment Status by Educational Attainment in Montgomery borough
According to labor force statistics for Montgomery borough, 77.4% of individuals (566) out of the total population between 25 and 64 years of age (731) are in the labor force, with 5.7% or 32 of them being unemployed. The group with the highest labor force participation rate are those with the educational attainment of bachelor's degree or higher, with 87.3% or 110 individuals in the labor force. Within the labor force, individuals with college / associate degree education have the highest percentage of unemployment, with 10.0% or 26 of them being unemployed.
| Educational Attainment | In Labor Force | Unemployed |
| Less than High School | 15 (51.7%) | 0 (0.0%) |
| High School Diploma | 180 (77.6%) | 8 (3.3%) |
| College / Associate Degree | 261 (75.9%) | 34 (10.0%) |
| Bachelor's Degree or higher | 110 (87.3%) | 0 (0.0%) |
| Total | 566 (77.4%) | 42 (5.7%) |
Employment Occupations by Sex in Montgomery borough
Management, Business, Science and Arts Occupations
The most common Management, Business, Science and Arts occupations in Montgomery borough are Management (60 | 10.2%), Health Diagnosing & Treating (46 | 7.8%), Computers, Engineering & Science (36 | 6.1%), Community & Social Service (32 | 5.4%), and Education Instruction & Library (21 | 3.6%).
Management, Business, Science and Arts Occupations by Sex
Within the Management, Business, Science and Arts occupations in Montgomery borough, the most male-oriented occupations are Computers & Mathematics (100.0%), Architecture & Engineering (100.0%), and Computers, Engineering & Science (94.4%), while the most female-oriented occupations are Life, Physical & Social Science (100.0%), Legal Services & Support (100.0%), and Health Technologists (100.0%).
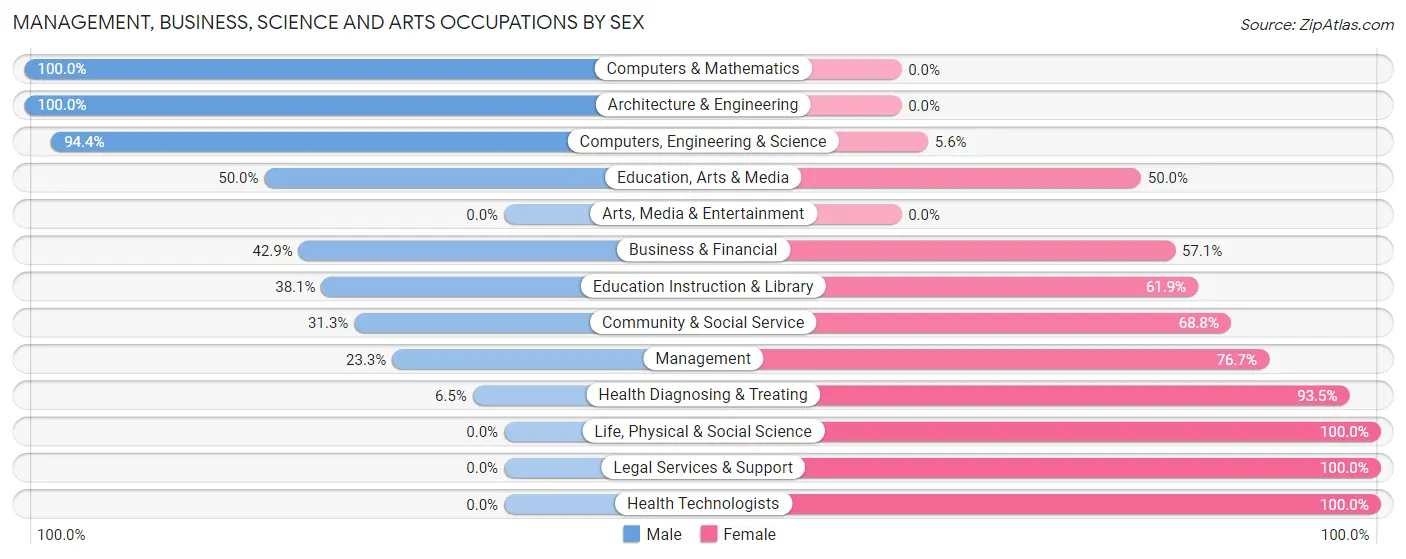
| Occupation | Male | Female |
| Management | 14 (23.3%) | 46 (76.7%) |
| Business & Financial | 6 (42.9%) | 8 (57.1%) |
| Computers, Engineering & Science | 34 (94.4%) | 2 (5.6%) |
| Computers & Mathematics | 18 (100.0%) | 0 (0.0%) |
| Architecture & Engineering | 16 (100.0%) | 0 (0.0%) |
| Life, Physical & Social Science | 0 (0.0%) | 2 (100.0%) |
| Community & Social Service | 10 (31.2%) | 22 (68.8%) |
| Education, Arts & Media | 2 (50.0%) | 2 (50.0%) |
| Legal Services & Support | 0 (0.0%) | 7 (100.0%) |
| Education Instruction & Library | 8 (38.1%) | 13 (61.9%) |
| Arts, Media & Entertainment | 0 (0.0%) | 0 (0.0%) |
| Health Diagnosing & Treating | 3 (6.5%) | 43 (93.5%) |
| Health Technologists | 0 (0.0%) | 3 (100.0%) |
| Total (Category) | 67 (35.6%) | 121 (64.4%) |
| Total (Overall) | 328 (55.8%) | 260 (44.2%) |
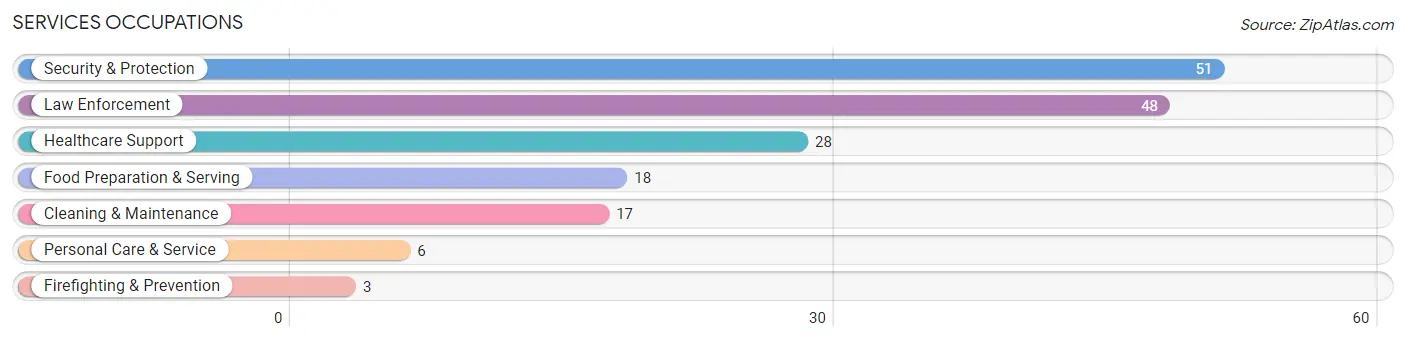
Services Occupations
The most common Services occupations in Montgomery borough are Security & Protection (51 | 8.7%), Law Enforcement (48 | 8.2%), Healthcare Support (28 | 4.8%), Food Preparation & Serving (18 | 3.1%), and Cleaning & Maintenance (17 | 2.9%).
Services Occupations by Sex
Within the Services occupations in Montgomery borough, the most male-oriented occupations are Firefighting & Prevention (100.0%), Cleaning & Maintenance (88.2%), and Security & Protection (76.5%), while the most female-oriented occupations are Personal Care & Service (100.0%), Healthcare Support (82.1%), and Food Preparation & Serving (61.1%).
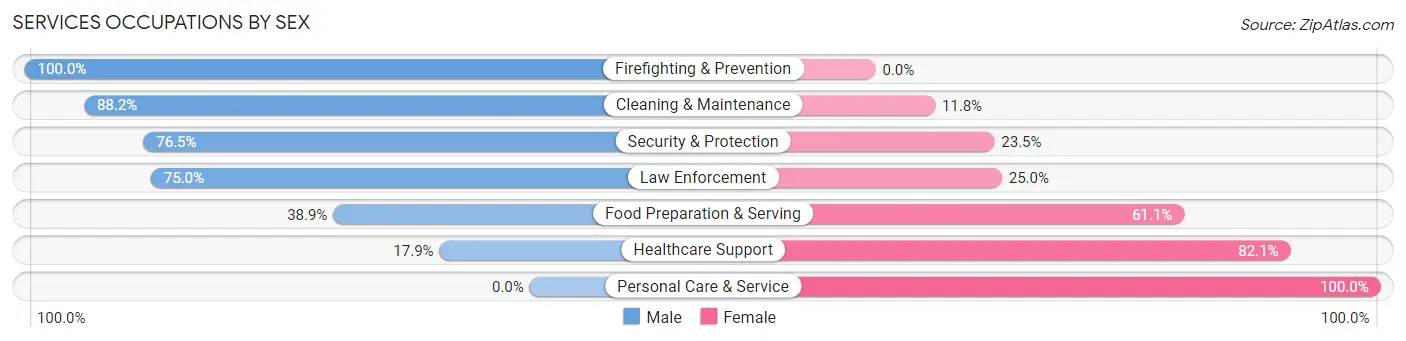
| Occupation | Male | Female |
| Healthcare Support | 5 (17.9%) | 23 (82.1%) |
| Security & Protection | 39 (76.5%) | 12 (23.5%) |
| Firefighting & Prevention | 3 (100.0%) | 0 (0.0%) |
| Law Enforcement | 36 (75.0%) | 12 (25.0%) |
| Food Preparation & Serving | 7 (38.9%) | 11 (61.1%) |
| Cleaning & Maintenance | 15 (88.2%) | 2 (11.8%) |
| Personal Care & Service | 0 (0.0%) | 6 (100.0%) |
| Total (Category) | 66 (55.0%) | 54 (45.0%) |
| Total (Overall) | 328 (55.8%) | 260 (44.2%) |
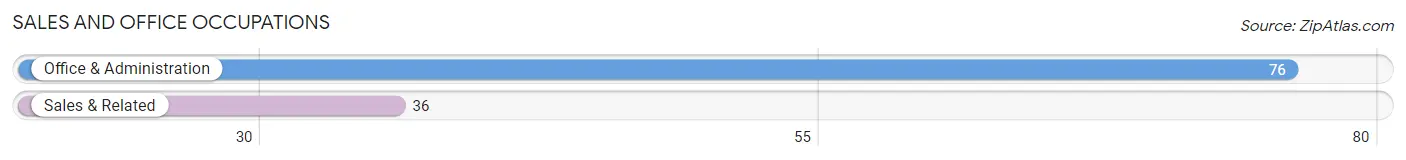
Sales and Office Occupations
The most common Sales and Office occupations in Montgomery borough are Office & Administration (76 | 12.9%), and Sales & Related (36 | 6.1%).
Sales and Office Occupations by Sex
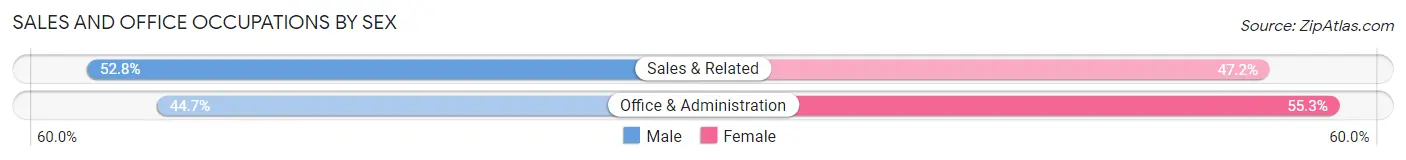
| Occupation | Male | Female |
| Sales & Related | 19 (52.8%) | 17 (47.2%) |
| Office & Administration | 34 (44.7%) | 42 (55.3%) |
| Total (Category) | 53 (47.3%) | 59 (52.7%) |
| Total (Overall) | 328 (55.8%) | 260 (44.2%) |
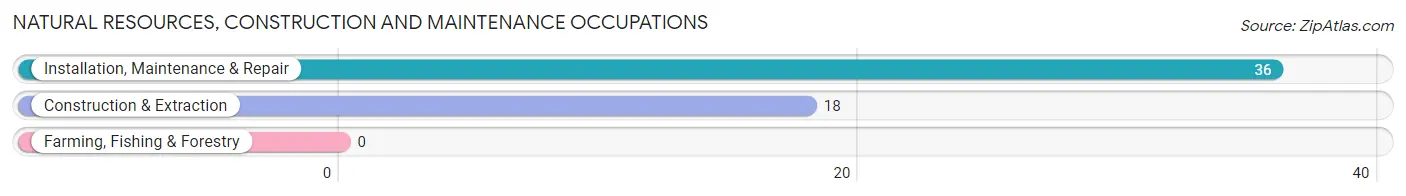
Natural Resources, Construction and Maintenance Occupations
The most common Natural Resources, Construction and Maintenance occupations in Montgomery borough are Installation, Maintenance & Repair (36 | 6.1%), and Construction & Extraction (18 | 3.1%).
Natural Resources, Construction and Maintenance Occupations by Sex
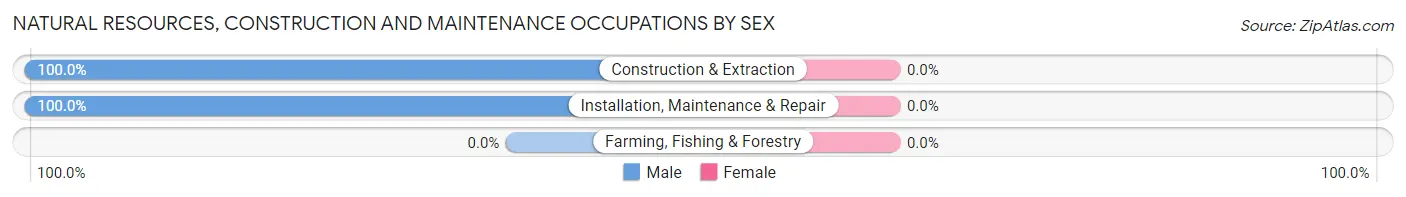
| Occupation | Male | Female |
| Farming, Fishing & Forestry | 0 (0.0%) | 0 (0.0%) |
| Construction & Extraction | 18 (100.0%) | 0 (0.0%) |
| Installation, Maintenance & Repair | 36 (100.0%) | 0 (0.0%) |
| Total (Category) | 54 (100.0%) | 0 (0.0%) |
| Total (Overall) | 328 (55.8%) | 260 (44.2%) |
Production, Transportation and Moving Occupations
The most common Production, Transportation and Moving occupations in Montgomery borough are Material Moving (53 | 9.0%), Production (51 | 8.7%), and Transportation (10 | 1.7%).
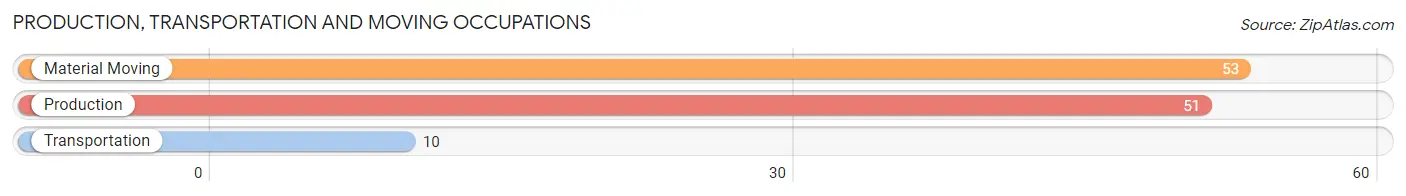
Production, Transportation and Moving Occupations by Sex
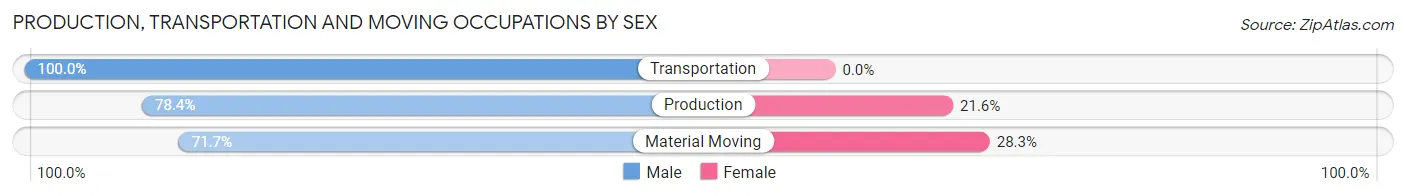
| Occupation | Male | Female |
| Production | 40 (78.4%) | 11 (21.6%) |
| Transportation | 10 (100.0%) | 0 (0.0%) |
| Material Moving | 38 (71.7%) | 15 (28.3%) |
| Total (Category) | 88 (77.2%) | 26 (22.8%) |
| Total (Overall) | 328 (55.8%) | 260 (44.2%) |
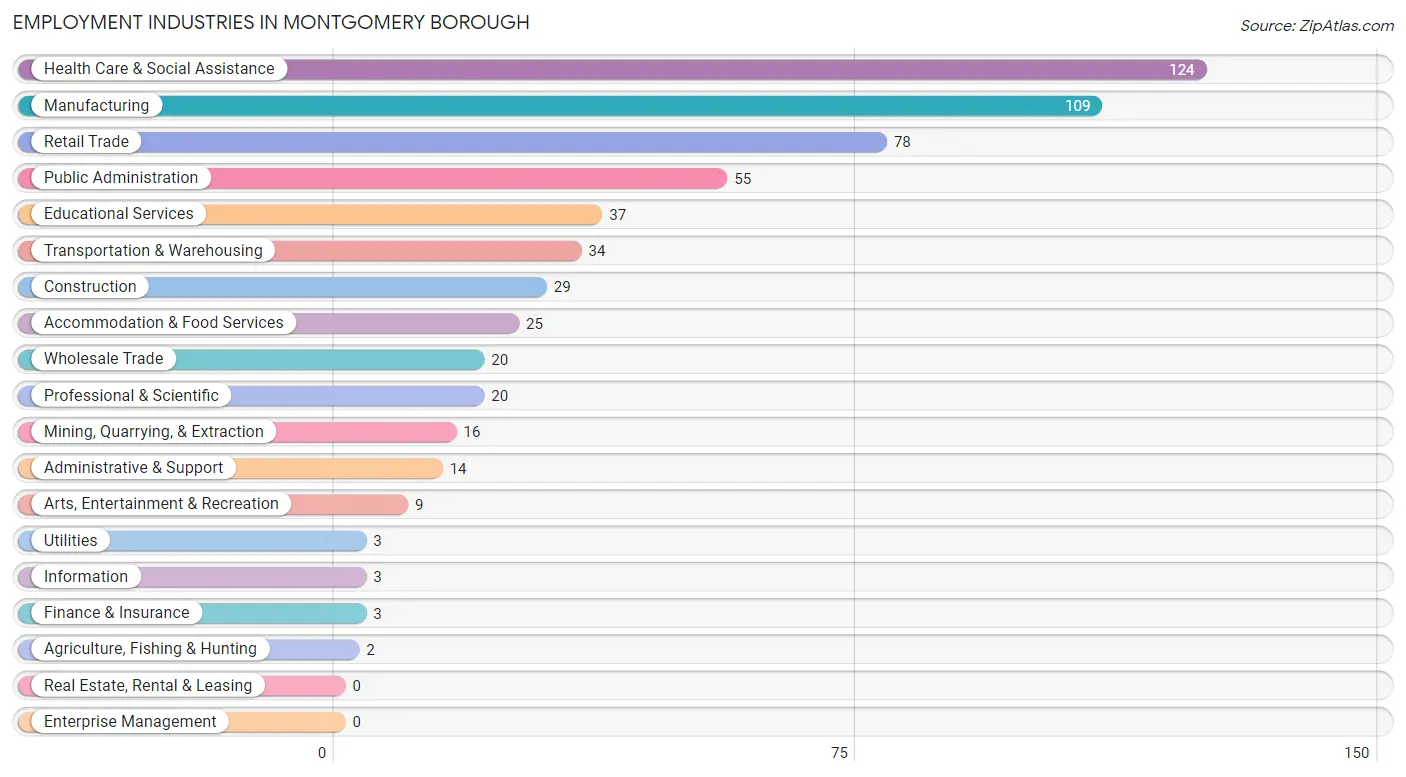
Employment Industries by Sex in Montgomery borough
Employment Industries in Montgomery borough
The major employment industries in Montgomery borough include Health Care & Social Assistance (124 | 21.1%), Manufacturing (109 | 18.5%), Retail Trade (78 | 13.3%), Public Administration (55 | 9.3%), and Educational Services (37 | 6.3%).
Employment Industries by Sex in Montgomery borough
The Montgomery borough industries that see more men than women are Agriculture, Fishing & Hunting (100.0%), Mining, Quarrying, & Extraction (100.0%), and Construction (100.0%), whereas the industries that tend to have a higher number of women are Utilities (100.0%), Finance & Insurance (100.0%), and Health Care & Social Assistance (79.8%).
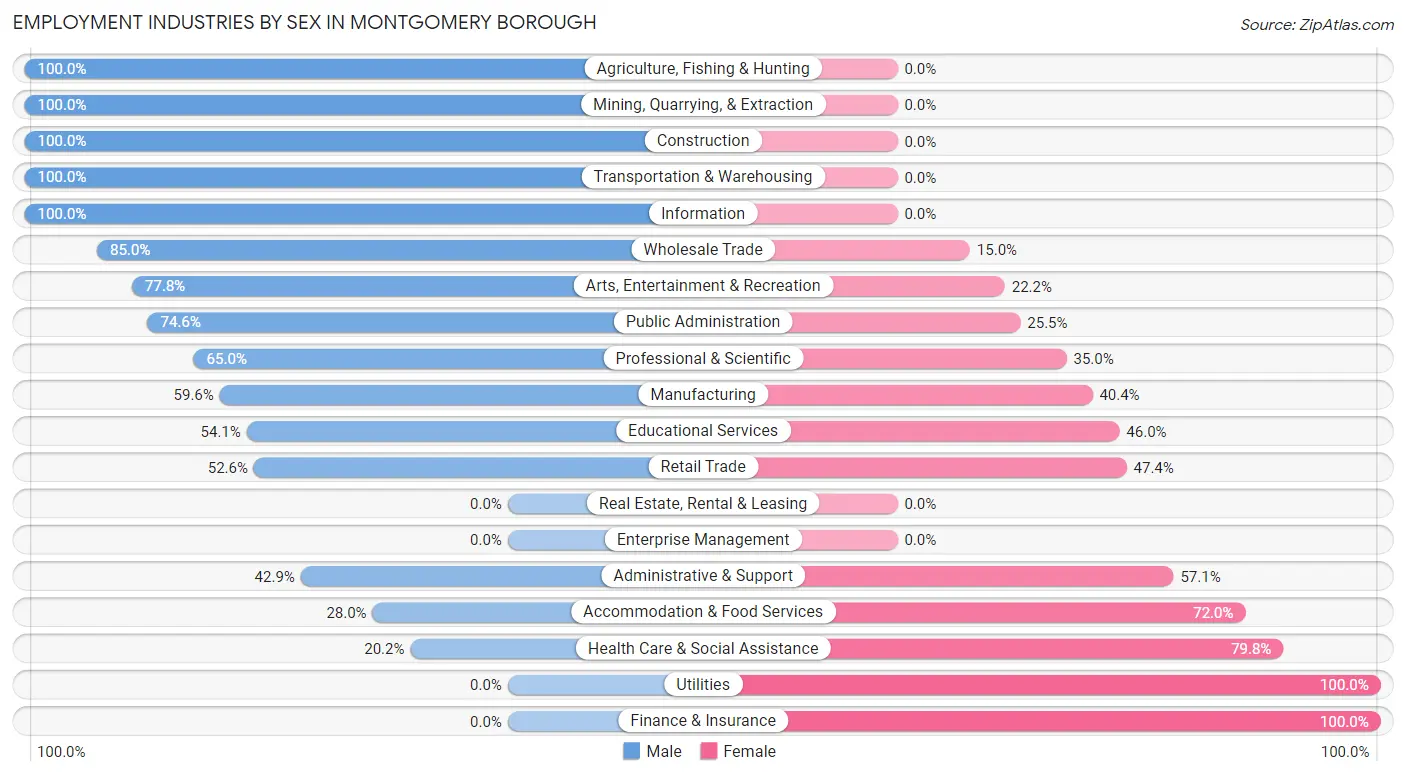
| Industry | Male | Female |
| Agriculture, Fishing & Hunting | 2 (100.0%) | 0 (0.0%) |
| Mining, Quarrying, & Extraction | 16 (100.0%) | 0 (0.0%) |
| Construction | 29 (100.0%) | 0 (0.0%) |
| Manufacturing | 65 (59.6%) | 44 (40.4%) |
| Wholesale Trade | 17 (85.0%) | 3 (15.0%) |
| Retail Trade | 41 (52.6%) | 37 (47.4%) |
| Transportation & Warehousing | 34 (100.0%) | 0 (0.0%) |
| Utilities | 0 (0.0%) | 3 (100.0%) |
| Information | 3 (100.0%) | 0 (0.0%) |
| Finance & Insurance | 0 (0.0%) | 3 (100.0%) |
| Real Estate, Rental & Leasing | 0 (0.0%) | 0 (0.0%) |
| Professional & Scientific | 13 (65.0%) | 7 (35.0%) |
| Enterprise Management | 0 (0.0%) | 0 (0.0%) |
| Administrative & Support | 6 (42.9%) | 8 (57.1%) |
| Educational Services | 20 (54.0%) | 17 (46.0%) |
| Health Care & Social Assistance | 25 (20.2%) | 99 (79.8%) |
| Arts, Entertainment & Recreation | 7 (77.8%) | 2 (22.2%) |
| Accommodation & Food Services | 7 (28.0%) | 18 (72.0%) |
| Public Administration | 41 (74.6%) | 14 (25.5%) |
| Total | 328 (55.8%) | 260 (44.2%) |
Education in Montgomery borough
School Enrollment in Montgomery borough
The most common levels of schooling among the 393 students in Montgomery borough are middle school (115 | 29.3%), elementary school (95 | 24.2%), and college / undergraduate (51 | 13.0%).
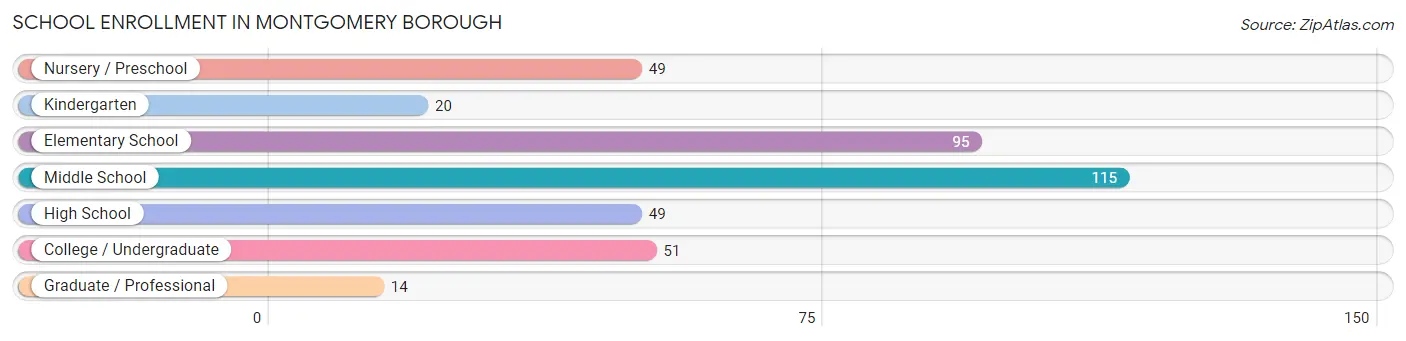
| School Level | # Students | % Students |
| Nursery / Preschool | 49 | 12.5% |
| Kindergarten | 20 | 5.1% |
| Elementary School | 95 | 24.2% |
| Middle School | 115 | 29.3% |
| High School | 49 | 12.5% |
| College / Undergraduate | 51 | 13.0% |
| Graduate / Professional | 14 | 3.6% |
| Total | 393 | 100.0% |
School Enrollment by Age by Funding Source in Montgomery borough
Out of a total of 393 students who are enrolled in schools in Montgomery borough, 92 (23.4%) attend a private institution, while the remaining 301 (76.6%) are enrolled in public schools. The age group of 35 years and over has the highest likelihood of being enrolled in private schools, with 23 (100.0% in the age bracket) enrolled. Conversely, the age group of 15 to 17 year olds has the lowest likelihood of being enrolled in a private school, with 37 (100.0% in the age bracket) attending a public institution.
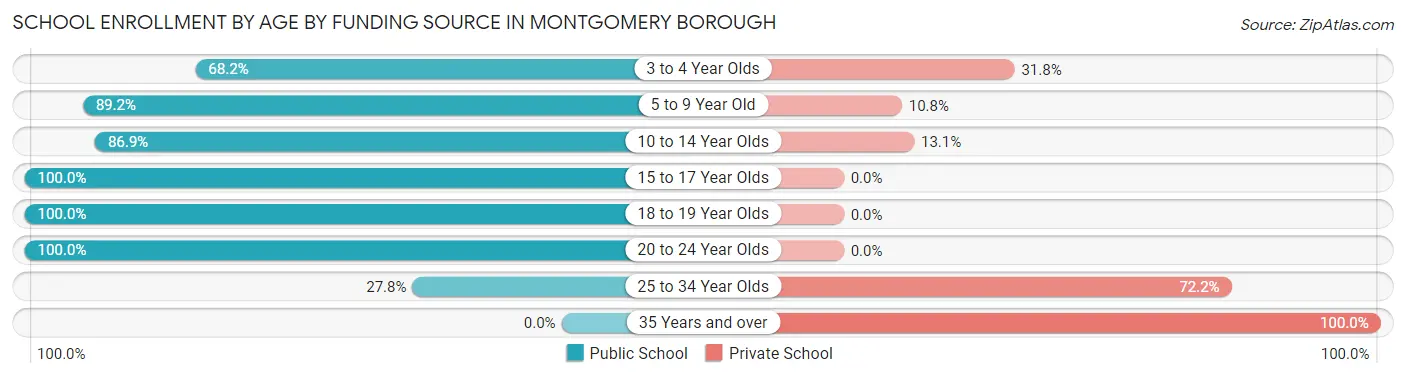
| Age Bracket | Public School | Private School |
| 3 to 4 Year Olds | 30 (68.2%) | 14 (31.8%) |
| 5 to 9 Year Old | 107 (89.2%) | 13 (10.8%) |
| 10 to 14 Year Olds | 106 (86.9%) | 16 (13.1%) |
| 15 to 17 Year Olds | 37 (100.0%) | 0 (0.0%) |
| 18 to 19 Year Olds | 5 (100.0%) | 0 (0.0%) |
| 20 to 24 Year Olds | 6 (100.0%) | 0 (0.0%) |
| 25 to 34 Year Olds | 10 (27.8%) | 26 (72.2%) |
| 35 Years and over | 0 (0.0%) | 23 (100.0%) |
| Total | 301 (76.6%) | 92 (23.4%) |
Educational Attainment by Field of Study in Montgomery borough
Arts & humanities (31 | 20.5%), education (29 | 19.2%), engineering (22 | 14.6%), business (20 | 13.3%), and science & technology (15 | 9.9%) are the most common fields of study among 151 individuals in Montgomery borough who have obtained a bachelor's degree or higher.
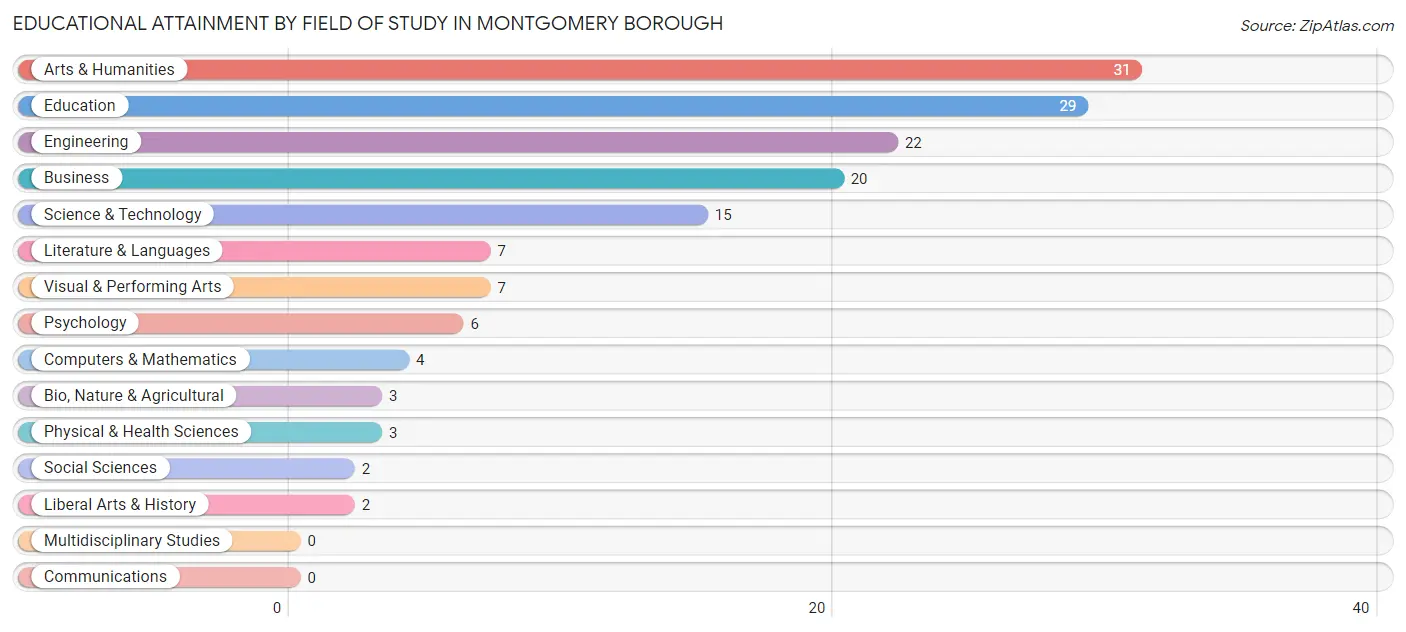
| Field of Study | # Graduates | % Graduates |
| Computers & Mathematics | 4 | 2.6% |
| Bio, Nature & Agricultural | 3 | 2.0% |
| Physical & Health Sciences | 3 | 2.0% |
| Psychology | 6 | 4.0% |
| Social Sciences | 2 | 1.3% |
| Engineering | 22 | 14.6% |
| Multidisciplinary Studies | 0 | 0.0% |
| Science & Technology | 15 | 9.9% |
| Business | 20 | 13.3% |
| Education | 29 | 19.2% |
| Literature & Languages | 7 | 4.6% |
| Liberal Arts & History | 2 | 1.3% |
| Visual & Performing Arts | 7 | 4.6% |
| Communications | 0 | 0.0% |
| Arts & Humanities | 31 | 20.5% |
| Total | 151 | 100.0% |
Transportation & Commute in Montgomery borough
Vehicle Availability by Sex in Montgomery borough
The most prevalent vehicle ownership categories in Montgomery borough are males with 2 vehicles (144, accounting for 45.3%) and females with 2 vehicles (118, making up 55.4%).
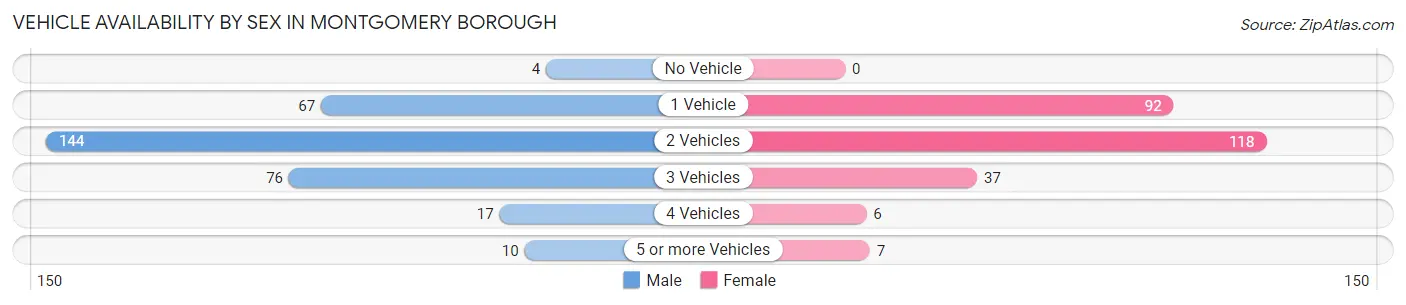
| Vehicles Available | Male | Female |
| No Vehicle | 4 (1.3%) | 0 (0.0%) |
| 1 Vehicle | 67 (21.1%) | 92 (35.4%) |
| 2 Vehicles | 144 (45.3%) | 118 (45.4%) |
| 3 Vehicles | 76 (23.9%) | 37 (14.2%) |
| 4 Vehicles | 17 (5.3%) | 6 (2.3%) |
| 5 or more Vehicles | 10 (3.1%) | 7 (2.7%) |
| Total | 318 (100.0%) | 260 (100.0%) |
Commute Time in Montgomery borough
The most frequently occuring commute durations in Montgomery borough are 15 to 19 minutes (94 commuters, 17.7%), 20 to 24 minutes (83 commuters, 15.7%), and 30 to 34 minutes (83 commuters, 15.7%).
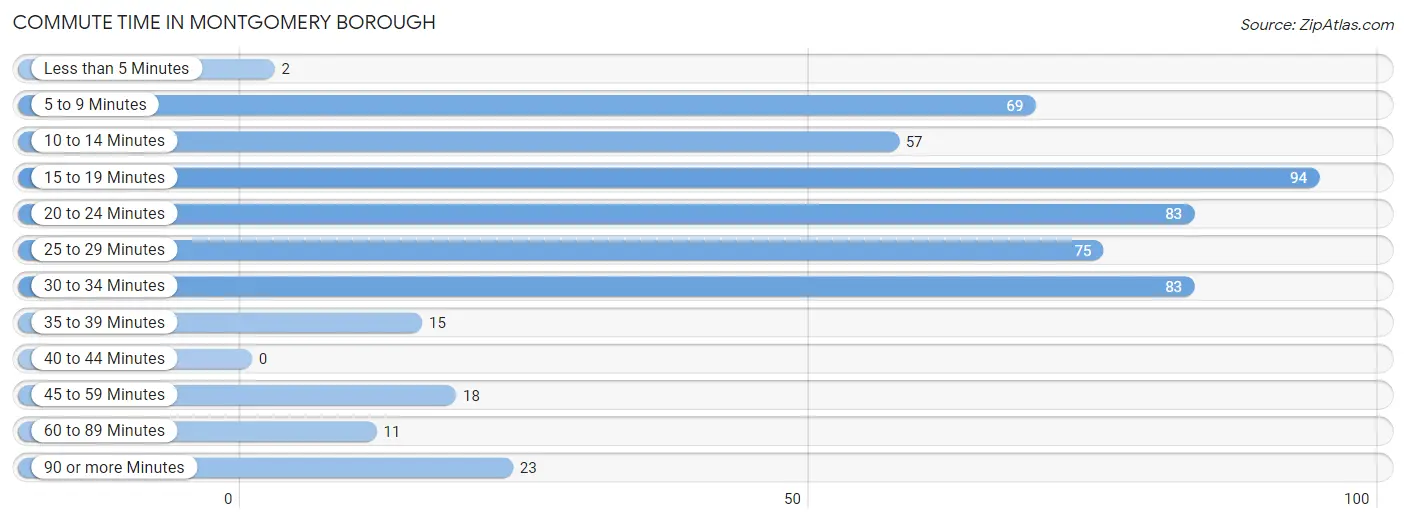
| Commute Time | # Commuters | % Commuters |
| Less than 5 Minutes | 2 | 0.4% |
| 5 to 9 Minutes | 69 | 13.0% |
| 10 to 14 Minutes | 57 | 10.7% |
| 15 to 19 Minutes | 94 | 17.7% |
| 20 to 24 Minutes | 83 | 15.7% |
| 25 to 29 Minutes | 75 | 14.1% |
| 30 to 34 Minutes | 83 | 15.7% |
| 35 to 39 Minutes | 15 | 2.8% |
| 40 to 44 Minutes | 0 | 0.0% |
| 45 to 59 Minutes | 18 | 3.4% |
| 60 to 89 Minutes | 11 | 2.1% |
| 90 or more Minutes | 23 | 4.3% |
Commute Time by Sex in Montgomery borough
The most common commute times in Montgomery borough are 30 to 34 minutes (56 commuters, 18.2%) for males and 15 to 19 minutes (59 commuters, 26.6%) for females.
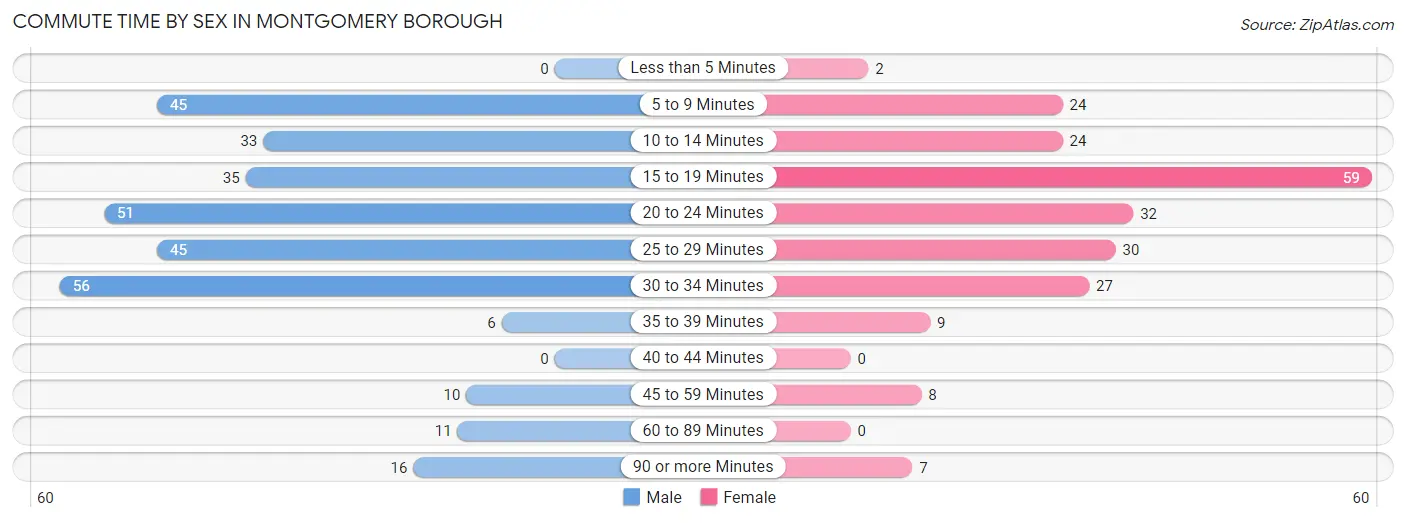
| Commute Time | Male | Female |
| Less than 5 Minutes | 0 (0.0%) | 2 (0.9%) |
| 5 to 9 Minutes | 45 (14.6%) | 24 (10.8%) |
| 10 to 14 Minutes | 33 (10.7%) | 24 (10.8%) |
| 15 to 19 Minutes | 35 (11.4%) | 59 (26.6%) |
| 20 to 24 Minutes | 51 (16.6%) | 32 (14.4%) |
| 25 to 29 Minutes | 45 (14.6%) | 30 (13.5%) |
| 30 to 34 Minutes | 56 (18.2%) | 27 (12.2%) |
| 35 to 39 Minutes | 6 (1.9%) | 9 (4.1%) |
| 40 to 44 Minutes | 0 (0.0%) | 0 (0.0%) |
| 45 to 59 Minutes | 10 (3.3%) | 8 (3.6%) |
| 60 to 89 Minutes | 11 (3.6%) | 0 (0.0%) |
| 90 or more Minutes | 16 (5.2%) | 7 (3.2%) |
Time of Departure to Work by Sex in Montgomery borough
The most frequent times of departure to work in Montgomery borough are 6:00 AM to 6:29 AM (66, 21.4%) for males and 7:30 AM to 7:59 AM (31, 14.0%) for females.
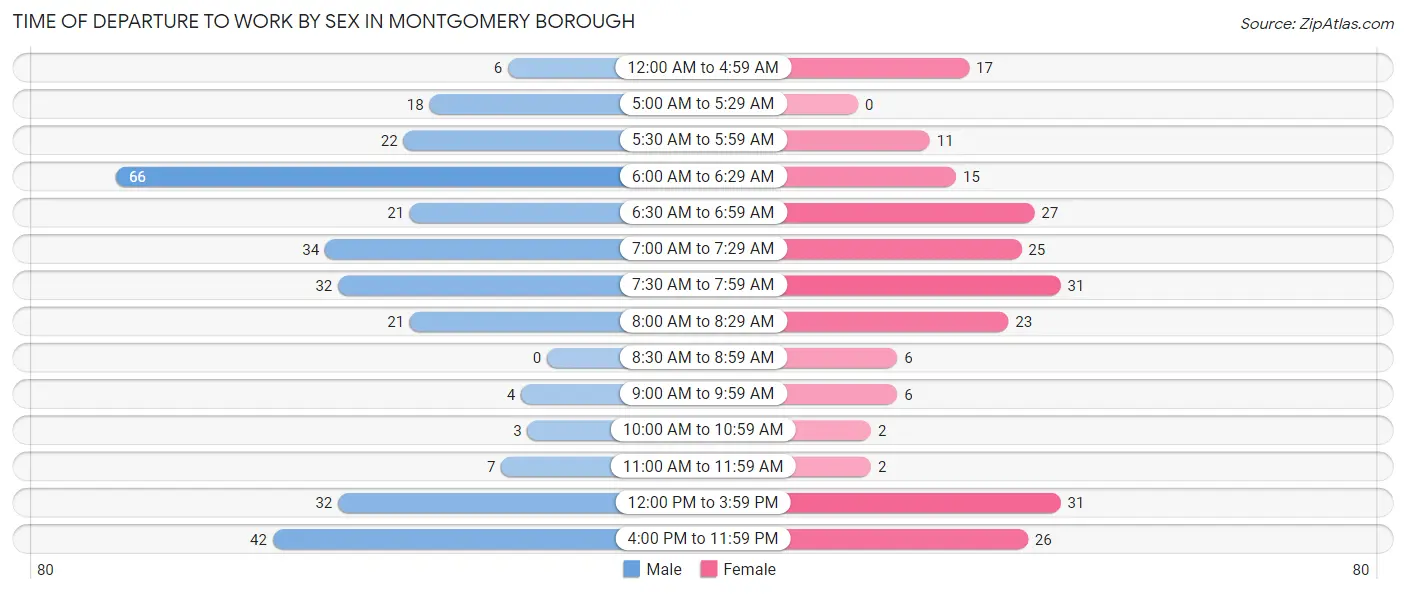
| Time of Departure | Male | Female |
| 12:00 AM to 4:59 AM | 6 (1.9%) | 17 (7.7%) |
| 5:00 AM to 5:29 AM | 18 (5.8%) | 0 (0.0%) |
| 5:30 AM to 5:59 AM | 22 (7.1%) | 11 (5.0%) |
| 6:00 AM to 6:29 AM | 66 (21.4%) | 15 (6.8%) |
| 6:30 AM to 6:59 AM | 21 (6.8%) | 27 (12.2%) |
| 7:00 AM to 7:29 AM | 34 (11.0%) | 25 (11.3%) |
| 7:30 AM to 7:59 AM | 32 (10.4%) | 31 (14.0%) |
| 8:00 AM to 8:29 AM | 21 (6.8%) | 23 (10.4%) |
| 8:30 AM to 8:59 AM | 0 (0.0%) | 6 (2.7%) |
| 9:00 AM to 9:59 AM | 4 (1.3%) | 6 (2.7%) |
| 10:00 AM to 10:59 AM | 3 (1.0%) | 2 (0.9%) |
| 11:00 AM to 11:59 AM | 7 (2.3%) | 2 (0.9%) |
| 12:00 PM to 3:59 PM | 32 (10.4%) | 31 (14.0%) |
| 4:00 PM to 11:59 PM | 42 (13.6%) | 26 (11.7%) |
| Total | 308 (100.0%) | 222 (100.0%) |
Housing Occupancy in Montgomery borough
Occupancy by Ownership in Montgomery borough
Of the total 570 dwellings in Montgomery borough, owner-occupied units account for 349 (61.2%), while renter-occupied units make up 221 (38.8%).
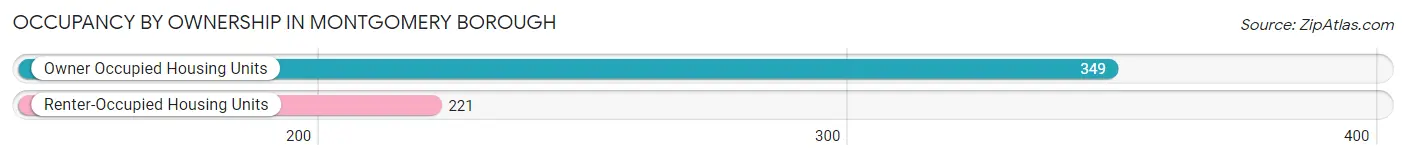
| Occupancy | # Housing Units | % Housing Units |
| Owner Occupied Housing Units | 349 | 61.2% |
| Renter-Occupied Housing Units | 221 | 38.8% |
| Total Occupied Housing Units | 570 | 100.0% |
Occupancy by Household Size in Montgomery borough
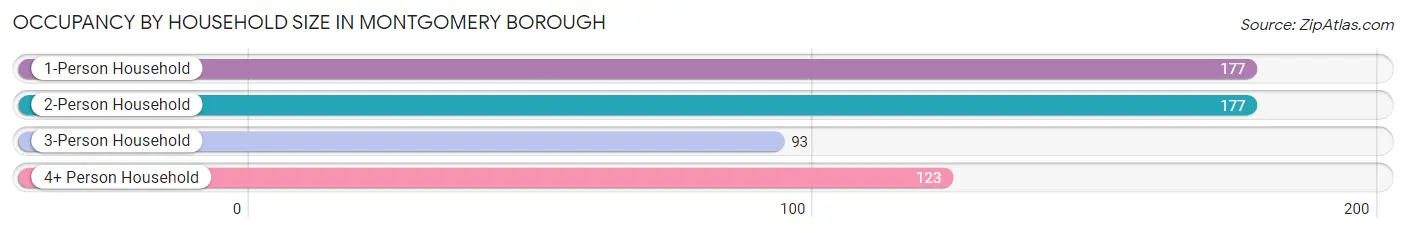
| Household Size | # Housing Units | % Housing Units |
| 1-Person Household | 177 | 31.0% |
| 2-Person Household | 177 | 31.0% |
| 3-Person Household | 93 | 16.3% |
| 4+ Person Household | 123 | 21.6% |
| Total Housing Units | 570 | 100.0% |
Occupancy by Ownership by Household Size in Montgomery borough
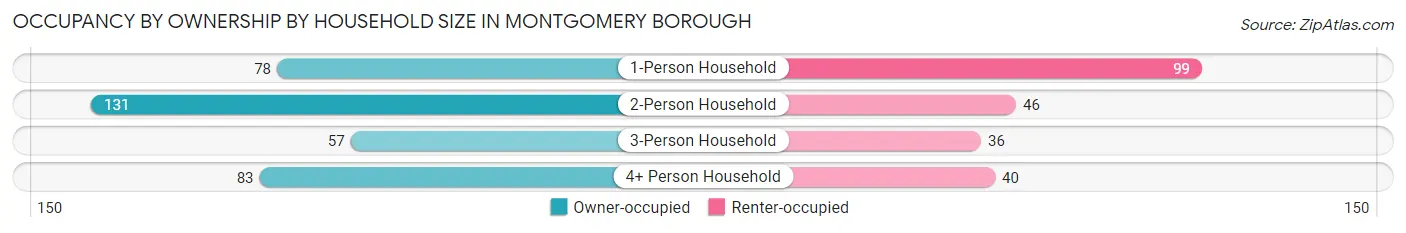
| Household Size | Owner-occupied | Renter-occupied |
| 1-Person Household | 78 (44.1%) | 99 (55.9%) |
| 2-Person Household | 131 (74.0%) | 46 (26.0%) |
| 3-Person Household | 57 (61.3%) | 36 (38.7%) |
| 4+ Person Household | 83 (67.5%) | 40 (32.5%) |
| Total Housing Units | 349 (61.2%) | 221 (38.8%) |
Occupancy by Educational Attainment in Montgomery borough
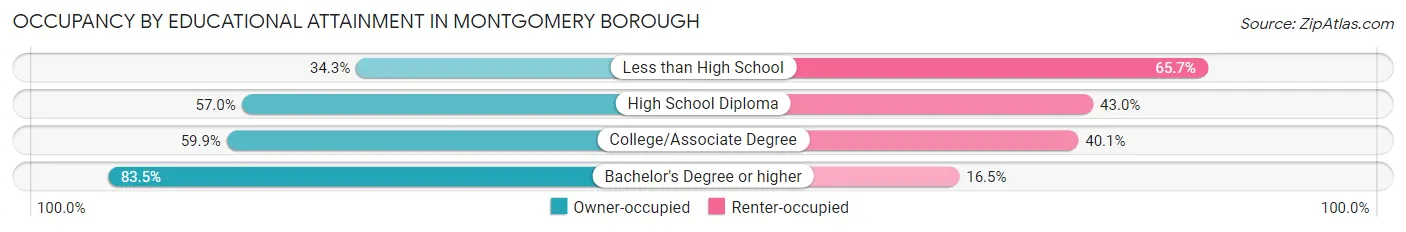
| Household Size | Owner-occupied | Renter-occupied |
| Less than High School | 12 (34.3%) | 23 (65.7%) |
| High School Diploma | 98 (57.0%) | 74 (43.0%) |
| College/Associate Degree | 163 (59.9%) | 109 (40.1%) |
| Bachelor's Degree or higher | 76 (83.5%) | 15 (16.5%) |
Occupancy by Age of Householder in Montgomery borough
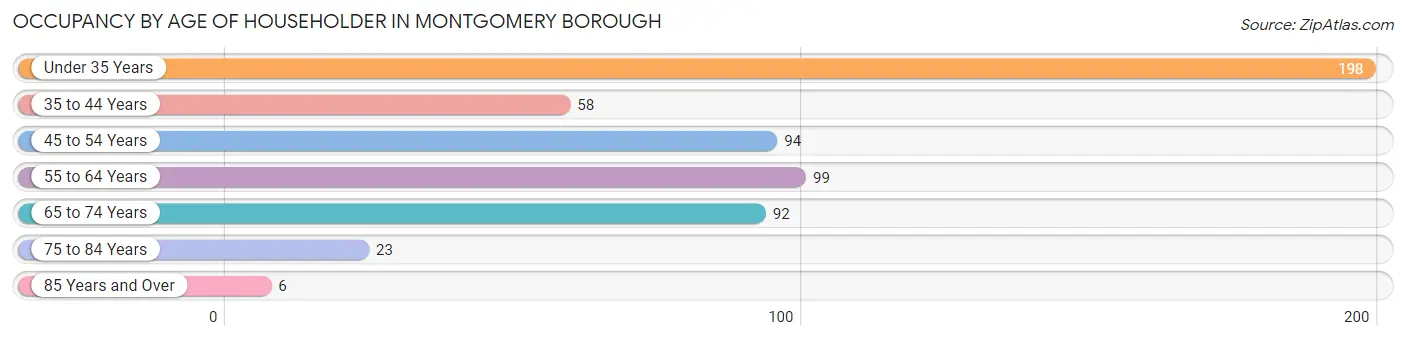
| Age Bracket | # Households | % Households |
| Under 35 Years | 198 | 34.7% |
| 35 to 44 Years | 58 | 10.2% |
| 45 to 54 Years | 94 | 16.5% |
| 55 to 64 Years | 99 | 17.4% |
| 65 to 74 Years | 92 | 16.1% |
| 75 to 84 Years | 23 | 4.0% |
| 85 Years and Over | 6 | 1.1% |
| Total | 570 | 100.0% |
Housing Finances in Montgomery borough
Median Income by Occupancy in Montgomery borough
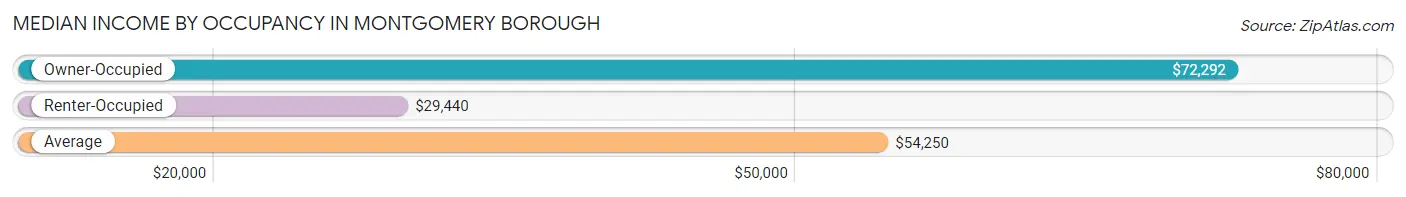
| Occupancy Type | # Households | Median Income |
| Owner-Occupied | 349 (61.2%) | $72,292 |
| Renter-Occupied | 221 (38.8%) | $29,440 |
| Average | 570 (100.0%) | $54,250 |
Occupancy by Householder Income Bracket in Montgomery borough
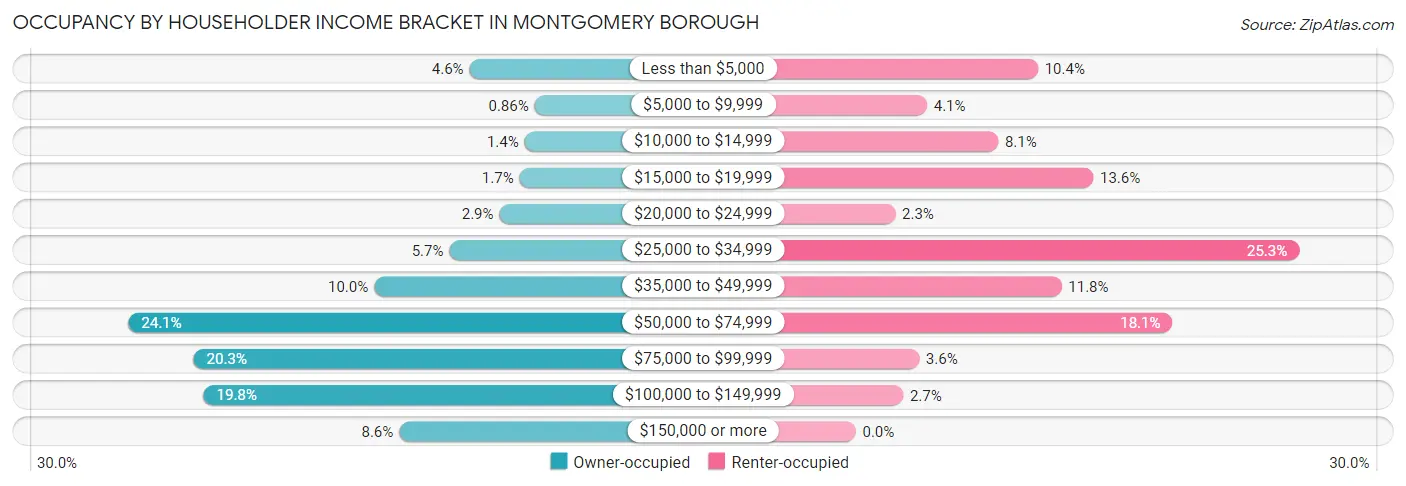
| Income Bracket | Owner-occupied | Renter-occupied |
| Less than $5,000 | 16 (4.6%) | 23 (10.4%) |
| $5,000 to $9,999 | 3 (0.9%) | 9 (4.1%) |
| $10,000 to $14,999 | 5 (1.4%) | 18 (8.1%) |
| $15,000 to $19,999 | 6 (1.7%) | 30 (13.6%) |
| $20,000 to $24,999 | 10 (2.9%) | 5 (2.3%) |
| $25,000 to $34,999 | 20 (5.7%) | 56 (25.3%) |
| $35,000 to $49,999 | 35 (10.0%) | 26 (11.8%) |
| $50,000 to $74,999 | 84 (24.1%) | 40 (18.1%) |
| $75,000 to $99,999 | 71 (20.3%) | 8 (3.6%) |
| $100,000 to $149,999 | 69 (19.8%) | 6 (2.7%) |
| $150,000 or more | 30 (8.6%) | 0 (0.0%) |
| Total | 349 (100.0%) | 221 (100.0%) |
Monthly Housing Cost Tiers in Montgomery borough
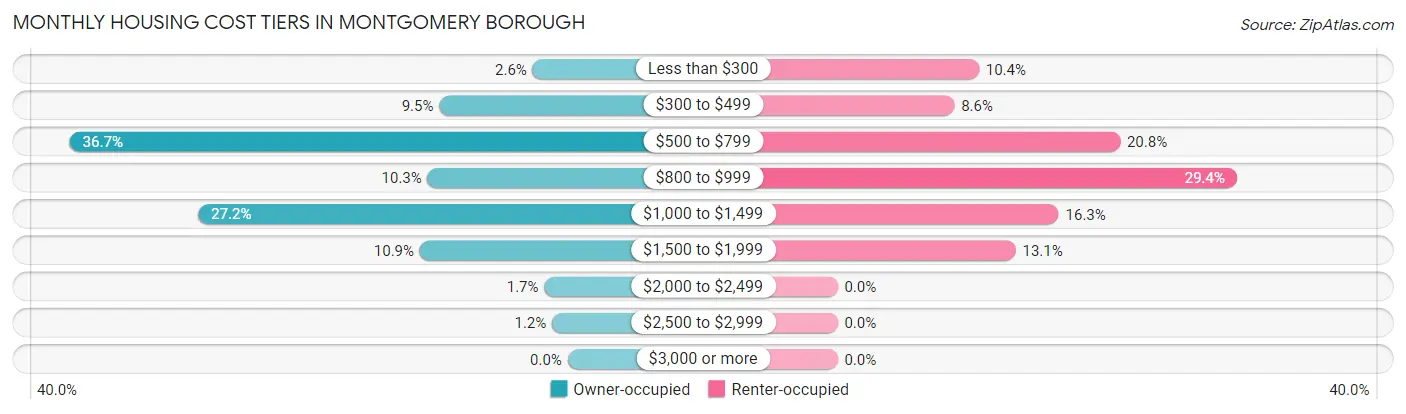
| Monthly Cost | Owner-occupied | Renter-occupied |
| Less than $300 | 9 (2.6%) | 23 (10.4%) |
| $300 to $499 | 33 (9.5%) | 19 (8.6%) |
| $500 to $799 | 128 (36.7%) | 46 (20.8%) |
| $800 to $999 | 36 (10.3%) | 65 (29.4%) |
| $1,000 to $1,499 | 95 (27.2%) | 36 (16.3%) |
| $1,500 to $1,999 | 38 (10.9%) | 29 (13.1%) |
| $2,000 to $2,499 | 6 (1.7%) | 0 (0.0%) |
| $2,500 to $2,999 | 4 (1.1%) | 0 (0.0%) |
| $3,000 or more | 0 (0.0%) | 0 (0.0%) |
| Total | 349 (100.0%) | 221 (100.0%) |
Physical Housing Characteristics in Montgomery borough
Housing Structures in Montgomery borough
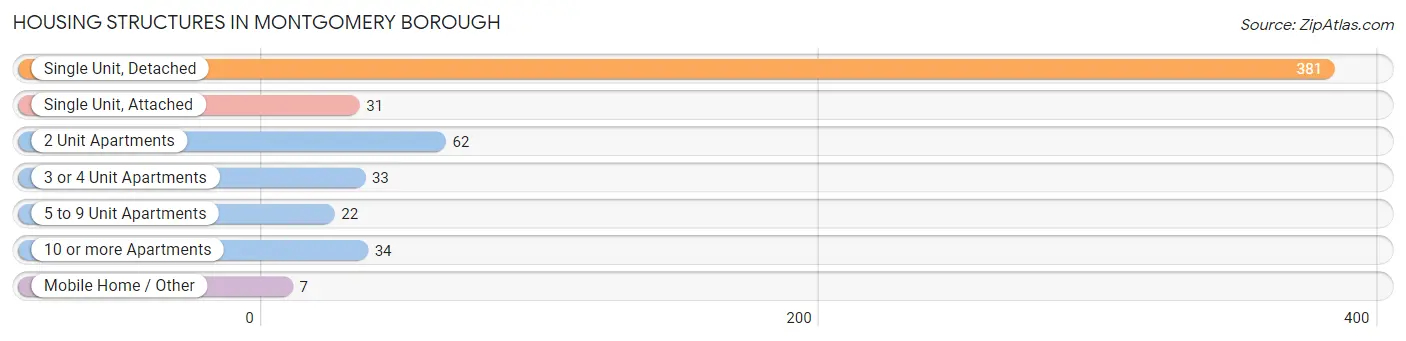
| Structure Type | # Housing Units | % Housing Units |
| Single Unit, Detached | 381 | 66.8% |
| Single Unit, Attached | 31 | 5.4% |
| 2 Unit Apartments | 62 | 10.9% |
| 3 or 4 Unit Apartments | 33 | 5.8% |
| 5 to 9 Unit Apartments | 22 | 3.9% |
| 10 or more Apartments | 34 | 6.0% |
| Mobile Home / Other | 7 | 1.2% |
| Total | 570 | 100.0% |
Housing Structures by Occupancy in Montgomery borough
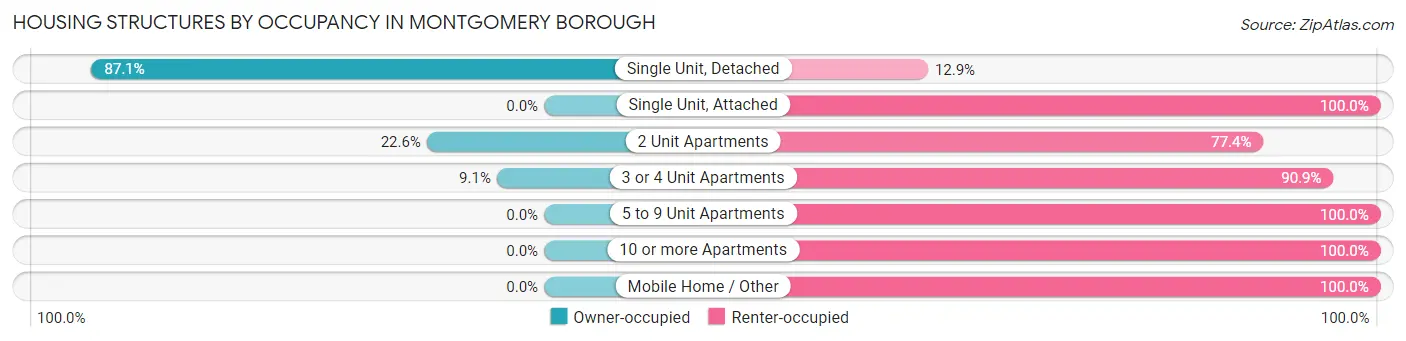
| Structure Type | Owner-occupied | Renter-occupied |
| Single Unit, Detached | 332 (87.1%) | 49 (12.9%) |
| Single Unit, Attached | 0 (0.0%) | 31 (100.0%) |
| 2 Unit Apartments | 14 (22.6%) | 48 (77.4%) |
| 3 or 4 Unit Apartments | 3 (9.1%) | 30 (90.9%) |
| 5 to 9 Unit Apartments | 0 (0.0%) | 22 (100.0%) |
| 10 or more Apartments | 0 (0.0%) | 34 (100.0%) |
| Mobile Home / Other | 0 (0.0%) | 7 (100.0%) |
| Total | 349 (61.2%) | 221 (38.8%) |
Housing Structures by Number of Rooms in Montgomery borough
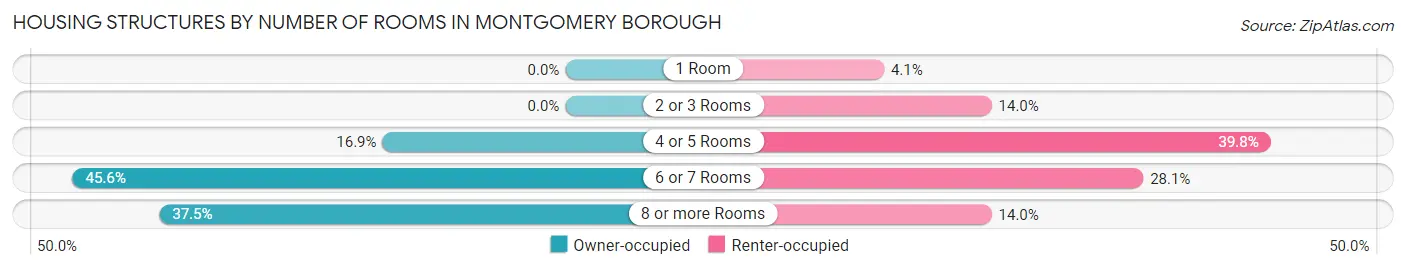
| Number of Rooms | Owner-occupied | Renter-occupied |
| 1 Room | 0 (0.0%) | 9 (4.1%) |
| 2 or 3 Rooms | 0 (0.0%) | 31 (14.0%) |
| 4 or 5 Rooms | 59 (16.9%) | 88 (39.8%) |
| 6 or 7 Rooms | 159 (45.6%) | 62 (28.1%) |
| 8 or more Rooms | 131 (37.5%) | 31 (14.0%) |
| Total | 349 (100.0%) | 221 (100.0%) |
Housing Structure by Heating Type in Montgomery borough
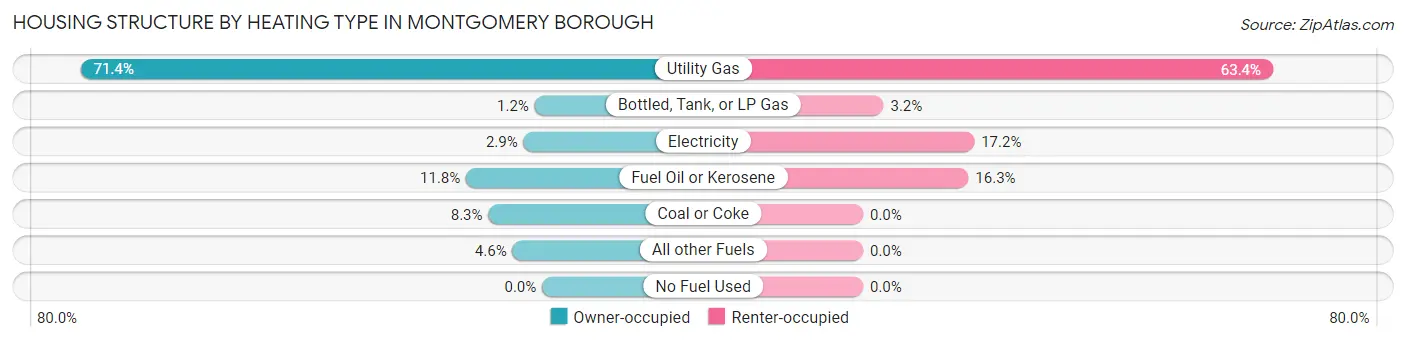
| Heating Type | Owner-occupied | Renter-occupied |
| Utility Gas | 249 (71.4%) | 140 (63.3%) |
| Bottled, Tank, or LP Gas | 4 (1.1%) | 7 (3.2%) |
| Electricity | 10 (2.9%) | 38 (17.2%) |
| Fuel Oil or Kerosene | 41 (11.7%) | 36 (16.3%) |
| Coal or Coke | 29 (8.3%) | 0 (0.0%) |
| All other Fuels | 16 (4.6%) | 0 (0.0%) |
| No Fuel Used | 0 (0.0%) | 0 (0.0%) |
| Total | 349 (100.0%) | 221 (100.0%) |
Household Vehicle Usage in Montgomery borough
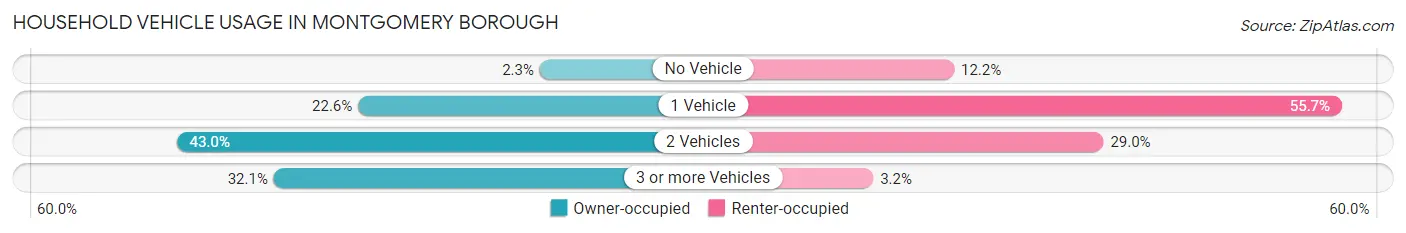
| Vehicles per Household | Owner-occupied | Renter-occupied |
| No Vehicle | 8 (2.3%) | 27 (12.2%) |
| 1 Vehicle | 79 (22.6%) | 123 (55.7%) |
| 2 Vehicles | 150 (43.0%) | 64 (29.0%) |
| 3 or more Vehicles | 112 (32.1%) | 7 (3.2%) |
| Total | 349 (100.0%) | 221 (100.0%) |
Real Estate & Mortgages in Montgomery borough
Real Estate and Mortgage Overview in Montgomery borough
| Characteristic | Without Mortgage | With Mortgage |
| Housing Units | 132 | 217 |
| Median Property Value | $133,100 | $115,400 |
| Median Household Income | $59,479 | $22 |
| Monthly Housing Costs | $551 | $0 |
| Real Estate Taxes | $2,155 | $11 |
Property Value by Mortgage Status in Montgomery borough
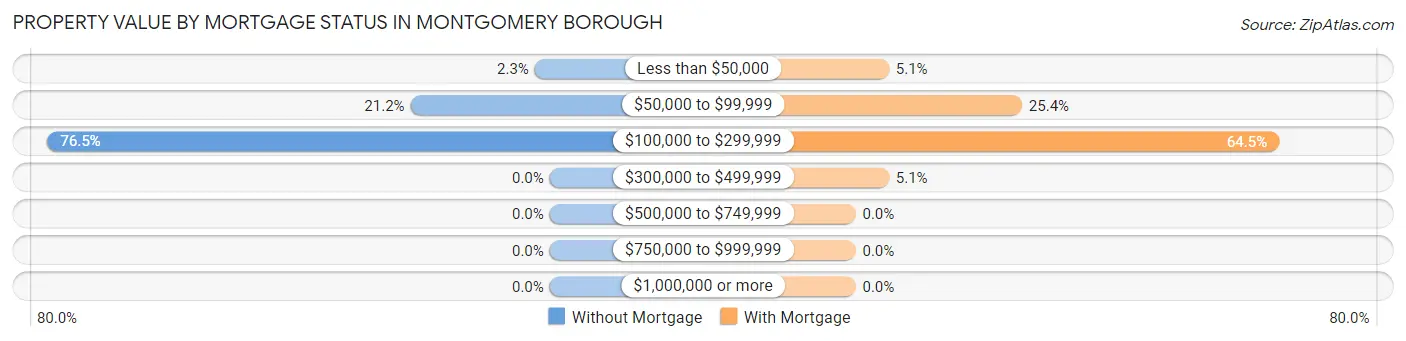
| Property Value | Without Mortgage | With Mortgage |
| Less than $50,000 | 3 (2.3%) | 11 (5.1%) |
| $50,000 to $99,999 | 28 (21.2%) | 55 (25.4%) |
| $100,000 to $299,999 | 101 (76.5%) | 140 (64.5%) |
| $300,000 to $499,999 | 0 (0.0%) | 11 (5.1%) |
| $500,000 to $749,999 | 0 (0.0%) | 0 (0.0%) |
| $750,000 to $999,999 | 0 (0.0%) | 0 (0.0%) |
| $1,000,000 or more | 0 (0.0%) | 0 (0.0%) |
| Total | 132 (100.0%) | 217 (100.0%) |
Household Income by Mortgage Status in Montgomery borough
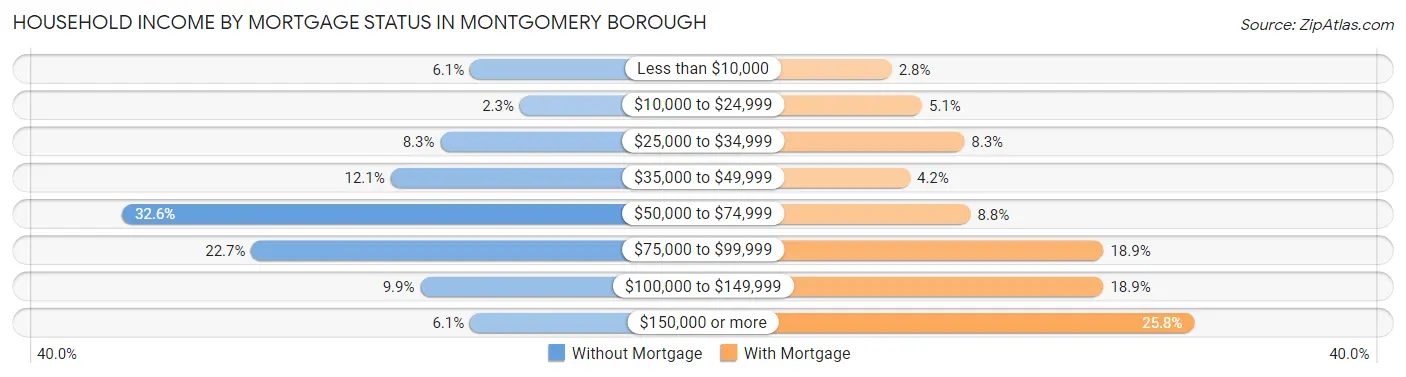
| Household Income | Without Mortgage | With Mortgage |
| Less than $10,000 | 8 (6.1%) | 6 (2.8%) |
| $10,000 to $24,999 | 3 (2.3%) | 11 (5.1%) |
| $25,000 to $34,999 | 11 (8.3%) | 18 (8.3%) |
| $35,000 to $49,999 | 16 (12.1%) | 9 (4.2%) |
| $50,000 to $74,999 | 43 (32.6%) | 19 (8.8%) |
| $75,000 to $99,999 | 30 (22.7%) | 41 (18.9%) |
| $100,000 to $149,999 | 13 (9.9%) | 41 (18.9%) |
| $150,000 or more | 8 (6.1%) | 56 (25.8%) |
| Total | 132 (100.0%) | 217 (100.0%) |
Property Value to Household Income Ratio in Montgomery borough
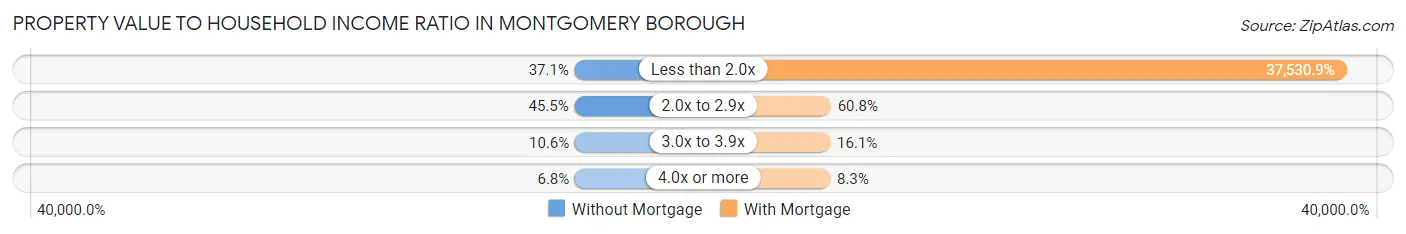
| Value-to-Income Ratio | Without Mortgage | With Mortgage |
| Less than 2.0x | 49 (37.1%) | 81,442 (37,530.9%) |
| 2.0x to 2.9x | 60 (45.5%) | 132 (60.8%) |
| 3.0x to 3.9x | 14 (10.6%) | 35 (16.1%) |
| 4.0x or more | 9 (6.8%) | 18 (8.3%) |
| Total | 132 (100.0%) | 217 (100.0%) |
Real Estate Taxes by Mortgage Status in Montgomery borough
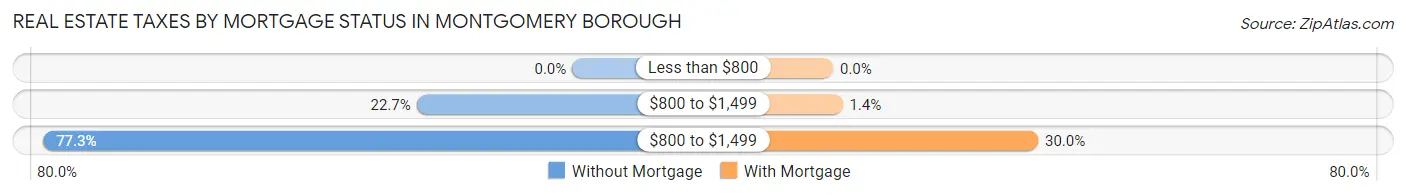
| Property Taxes | Without Mortgage | With Mortgage |
| Less than $800 | 0 (0.0%) | 0 (0.0%) |
| $800 to $1,499 | 30 (22.7%) | 3 (1.4%) |
| $800 to $1,499 | 102 (77.3%) | 65 (29.9%) |
| Total | 132 (100.0%) | 217 (100.0%) |
Health & Disability in Montgomery borough
Health Insurance Coverage by Age in Montgomery borough
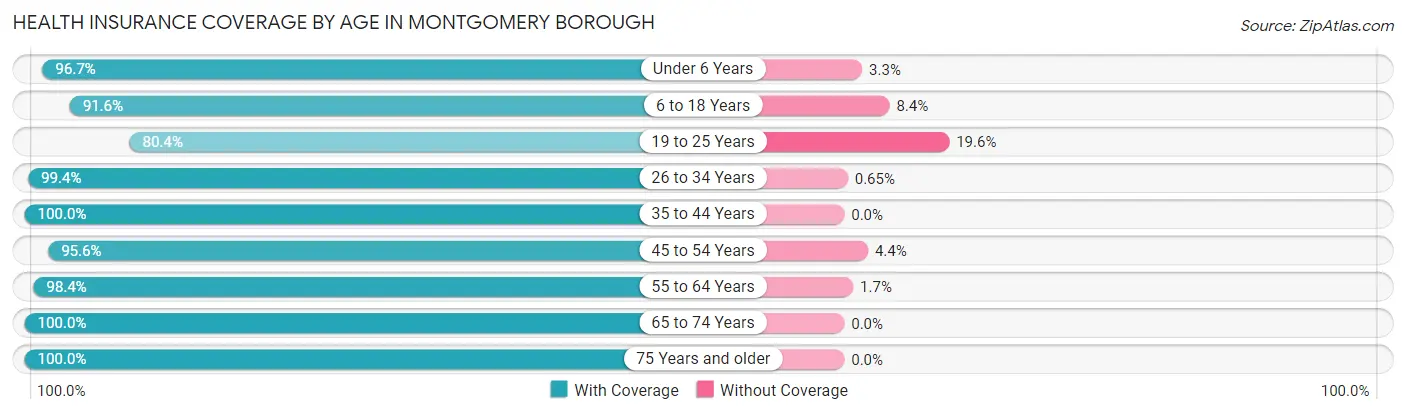
| Age Bracket | With Coverage | Without Coverage |
| Under 6 Years | 203 (96.7%) | 7 (3.3%) |
| 6 to 18 Years | 239 (91.6%) | 22 (8.4%) |
| 19 to 25 Years | 37 (80.4%) | 9 (19.6%) |
| 26 to 34 Years | 304 (99.4%) | 2 (0.6%) |
| 35 to 44 Years | 147 (100.0%) | 0 (0.0%) |
| 45 to 54 Years | 130 (95.6%) | 6 (4.4%) |
| 55 to 64 Years | 119 (98.4%) | 2 (1.7%) |
| 65 to 74 Years | 148 (100.0%) | 0 (0.0%) |
| 75 Years and older | 41 (100.0%) | 0 (0.0%) |
| Total | 1,368 (96.6%) | 48 (3.4%) |
Health Insurance Coverage by Citizenship Status in Montgomery borough
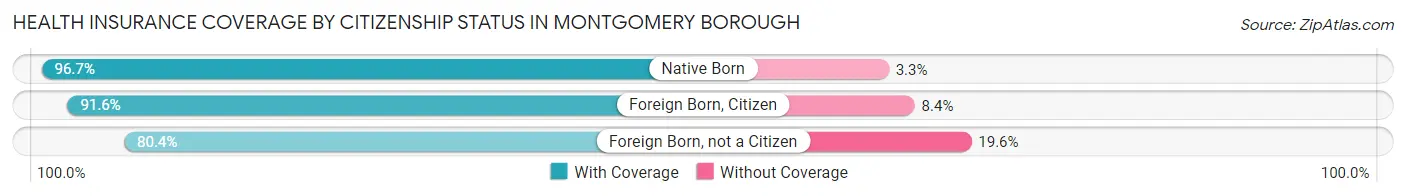
| Citizenship Status | With Coverage | Without Coverage |
| Native Born | 203 (96.7%) | 7 (3.3%) |
| Foreign Born, Citizen | 239 (91.6%) | 22 (8.4%) |
| Foreign Born, not a Citizen | 37 (80.4%) | 9 (19.6%) |
Health Insurance Coverage by Household Income in Montgomery borough
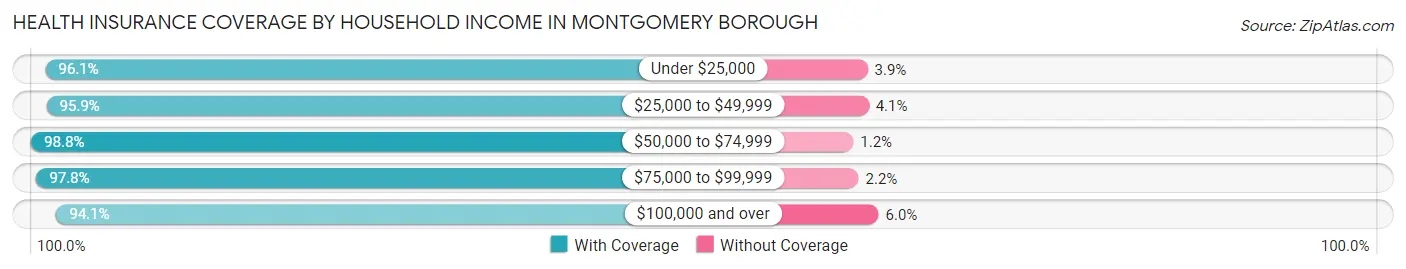
| Household Income | With Coverage | Without Coverage |
| Under $25,000 | 148 (96.1%) | 6 (3.9%) |
| $25,000 to $49,999 | 281 (95.9%) | 12 (4.1%) |
| $50,000 to $74,999 | 402 (98.8%) | 5 (1.2%) |
| $75,000 to $99,999 | 221 (97.8%) | 5 (2.2%) |
| $100,000 and over | 316 (94.1%) | 20 (5.9%) |
Public vs Private Health Insurance Coverage by Age in Montgomery borough
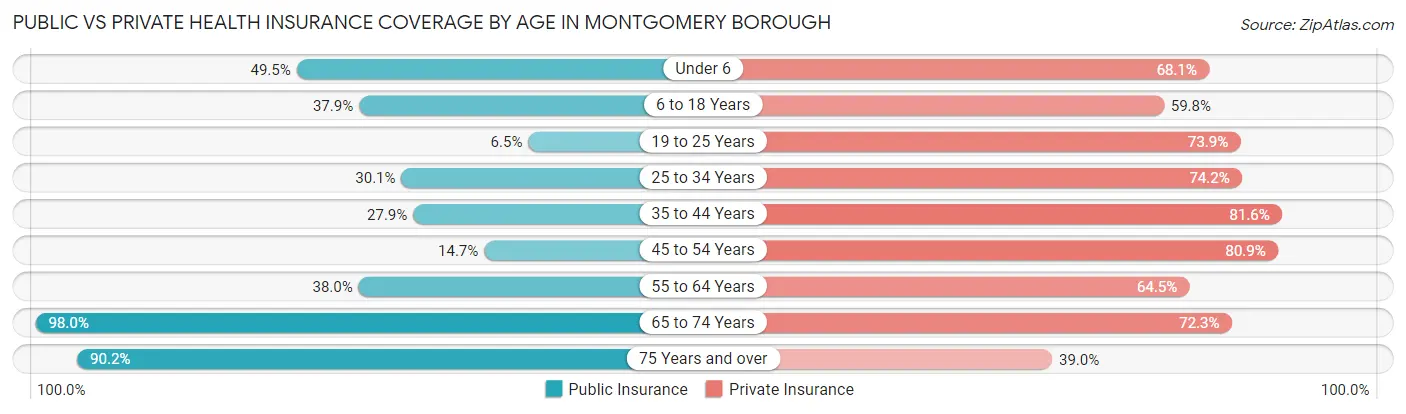
| Age Bracket | Public Insurance | Private Insurance |
| Under 6 | 104 (49.5%) | 143 (68.1%) |
| 6 to 18 Years | 99 (37.9%) | 156 (59.8%) |
| 19 to 25 Years | 3 (6.5%) | 34 (73.9%) |
| 25 to 34 Years | 92 (30.1%) | 227 (74.2%) |
| 35 to 44 Years | 41 (27.9%) | 120 (81.6%) |
| 45 to 54 Years | 20 (14.7%) | 110 (80.9%) |
| 55 to 64 Years | 46 (38.0%) | 78 (64.5%) |
| 65 to 74 Years | 145 (98.0%) | 107 (72.3%) |
| 75 Years and over | 37 (90.2%) | 16 (39.0%) |
| Total | 587 (41.4%) | 991 (70.0%) |
Disability Status by Sex by Age in Montgomery borough
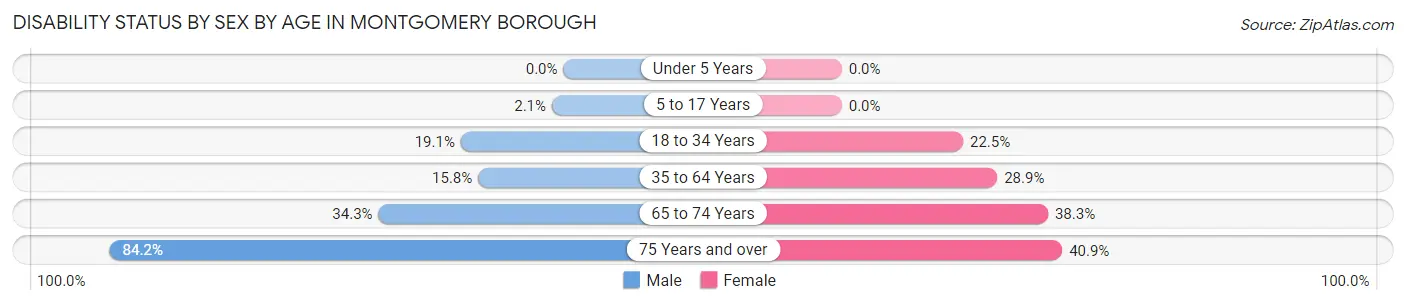
| Age Bracket | Male | Female |
| Under 5 Years | 0 (0.0%) | 0 (0.0%) |
| 5 to 17 Years | 4 (2.1%) | 0 (0.0%) |
| 18 to 34 Years | 32 (19.1%) | 43 (22.5%) |
| 35 to 64 Years | 31 (15.8%) | 60 (28.8%) |
| 65 to 74 Years | 23 (34.3%) | 31 (38.3%) |
| 75 Years and over | 16 (84.2%) | 9 (40.9%) |
Disability Class by Sex by Age in Montgomery borough
Disability Class: Hearing Difficulty
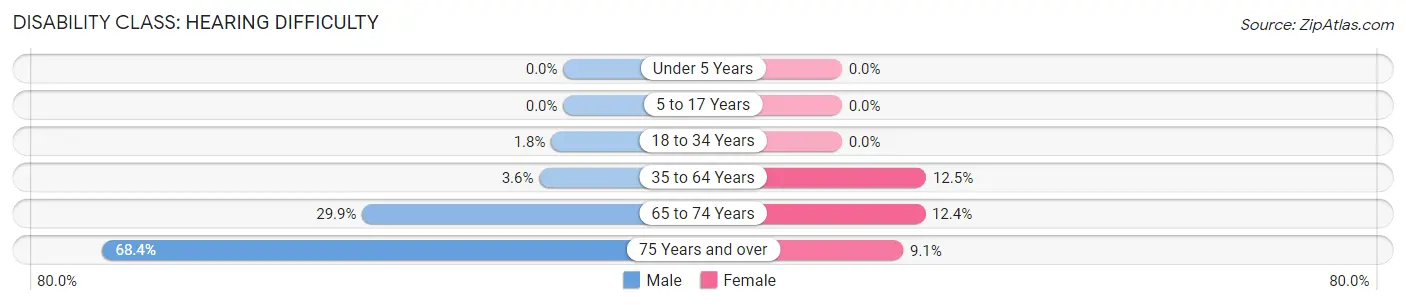
| Age Bracket | Male | Female |
| Under 5 Years | 0 (0.0%) | 0 (0.0%) |
| 5 to 17 Years | 0 (0.0%) | 0 (0.0%) |
| 18 to 34 Years | 3 (1.8%) | 0 (0.0%) |
| 35 to 64 Years | 7 (3.6%) | 26 (12.5%) |
| 65 to 74 Years | 20 (29.8%) | 10 (12.3%) |
| 75 Years and over | 13 (68.4%) | 2 (9.1%) |
Disability Class: Vision Difficulty
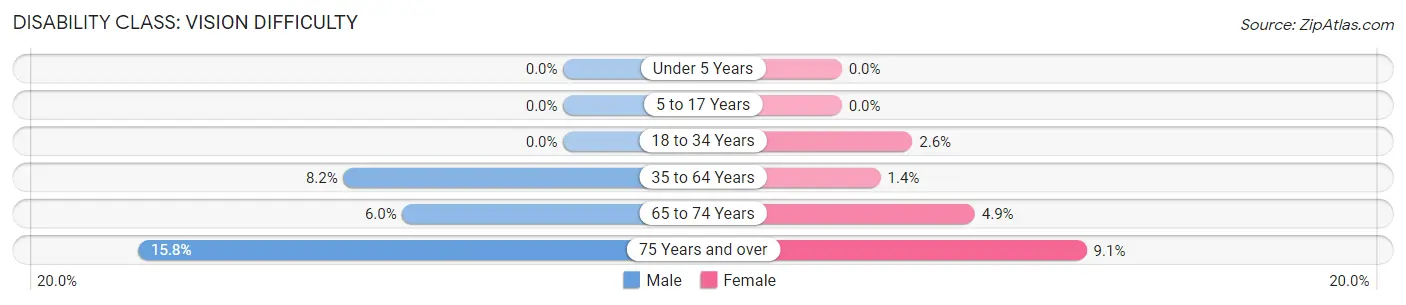
| Age Bracket | Male | Female |
| Under 5 Years | 0 (0.0%) | 0 (0.0%) |
| 5 to 17 Years | 0 (0.0%) | 0 (0.0%) |
| 18 to 34 Years | 0 (0.0%) | 5 (2.6%) |
| 35 to 64 Years | 16 (8.2%) | 3 (1.4%) |
| 65 to 74 Years | 4 (6.0%) | 4 (4.9%) |
| 75 Years and over | 3 (15.8%) | 2 (9.1%) |
Disability Class: Cognitive Difficulty
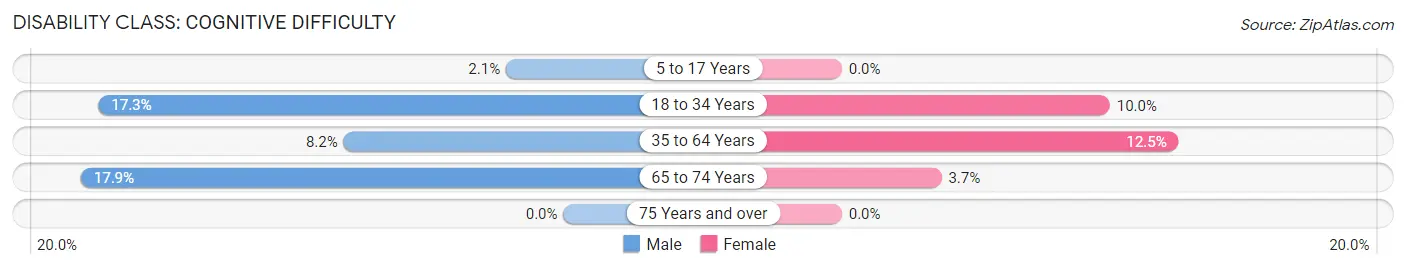
| Age Bracket | Male | Female |
| 5 to 17 Years | 4 (2.1%) | 0 (0.0%) |
| 18 to 34 Years | 29 (17.3%) | 19 (10.0%) |
| 35 to 64 Years | 16 (8.2%) | 26 (12.5%) |
| 65 to 74 Years | 12 (17.9%) | 3 (3.7%) |
| 75 Years and over | 0 (0.0%) | 0 (0.0%) |
Disability Class: Ambulatory Difficulty
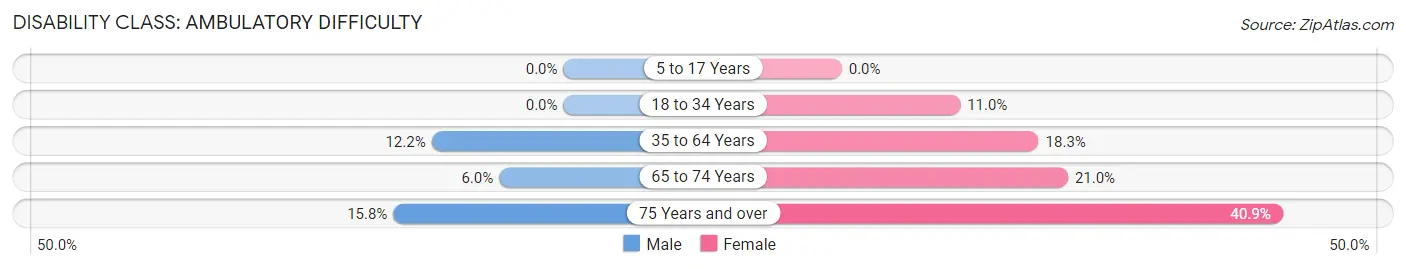
| Age Bracket | Male | Female |
| 5 to 17 Years | 0 (0.0%) | 0 (0.0%) |
| 18 to 34 Years | 0 (0.0%) | 21 (11.0%) |
| 35 to 64 Years | 24 (12.2%) | 38 (18.3%) |
| 65 to 74 Years | 4 (6.0%) | 17 (21.0%) |
| 75 Years and over | 3 (15.8%) | 9 (40.9%) |
Disability Class: Self-Care Difficulty
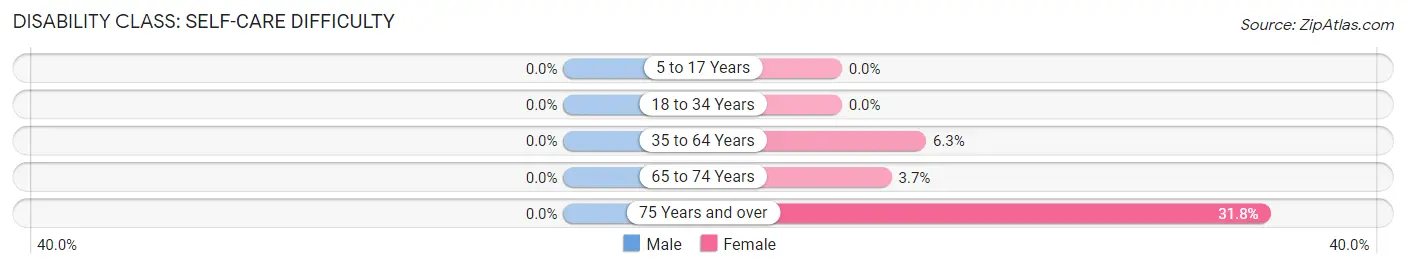
| Age Bracket | Male | Female |
| 5 to 17 Years | 0 (0.0%) | 0 (0.0%) |
| 18 to 34 Years | 0 (0.0%) | 0 (0.0%) |
| 35 to 64 Years | 0 (0.0%) | 13 (6.2%) |
| 65 to 74 Years | 0 (0.0%) | 3 (3.7%) |
| 75 Years and over | 0 (0.0%) | 7 (31.8%) |
Technology Access in Montgomery borough
Computing Device Access in Montgomery borough
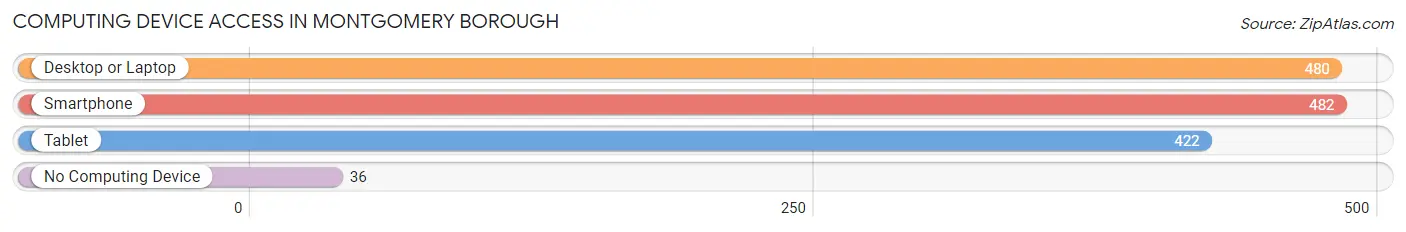
| Device Type | # Households | % Households |
| Desktop or Laptop | 480 | 84.2% |
| Smartphone | 482 | 84.6% |
| Tablet | 422 | 74.0% |
| No Computing Device | 36 | 6.3% |
| Total | 570 | 100.0% |
Internet Access in Montgomery borough
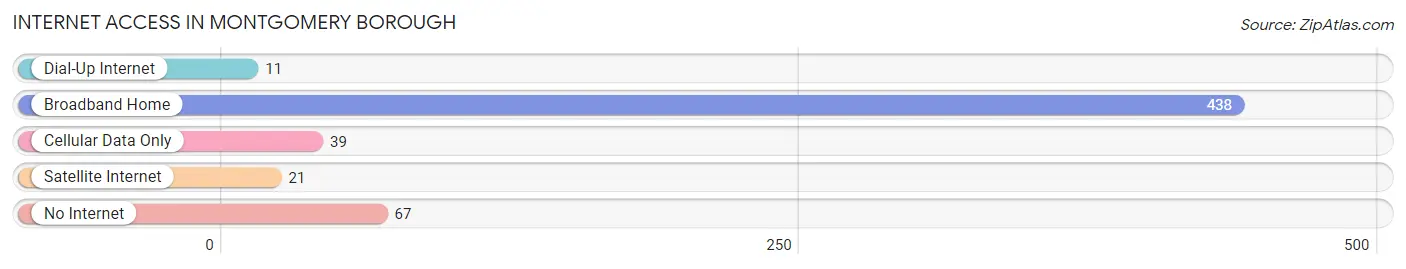
| Internet Type | # Households | % Households |
| Dial-Up Internet | 11 | 1.9% |
| Broadband Home | 438 | 76.8% |
| Cellular Data Only | 39 | 6.8% |
| Satellite Internet | 21 | 3.7% |
| No Internet | 67 | 11.7% |
| Total | 570 | 100.0% |
Montgomery borough Summary
Montgomery Borough is a small borough located in Lycoming County, Pennsylvania. It is situated in the north-central part of the state, approximately 10 miles south of Williamsport and about 20 miles north of State College. The borough is part of the Williamsport, Pennsylvania Metropolitan Statistical Area. As of the 2010 census, the population of Montgomery Borough was 1,845.
History
Montgomery Borough was founded in 1845 by a group of settlers from Montgomery County, Pennsylvania. The borough was named after the county from which the settlers had come. The first settlers were primarily of German and English descent. The borough was incorporated in 1851.
In the late 19th century, Montgomery Borough was a thriving industrial center. The borough was home to several factories, including a tannery, a sawmill, a grist mill, and a brickyard. The borough also had a railroad station, which connected it to the rest of the state.
In the early 20th century, Montgomery Borough experienced a period of decline. The factories closed and the railroad station was abandoned. The borough was also hit hard by the Great Depression. However, the borough began to experience a resurgence in the late 20th century. The borough was revitalized with the construction of a new shopping center and the opening of several new businesses.
Geography
Montgomery Borough is located at 40°48'N 76°59'W (40.80, -76.98). The borough is situated in the north-central part of the state, approximately 10 miles south of Williamsport and about 20 miles north of State College.
The borough is located in the Appalachian Mountains region of Pennsylvania. The terrain is mostly hilly and forested. The borough is located in the Susquehanna River watershed. The borough is bordered by the boroughs of Muncy and Hughesville to the north, the borough of Montgomery to the east, the borough of Jersey Shore to the south, and the borough of Trout Run to the west.
Economy
The economy of Montgomery Borough is largely based on the service sector. The borough is home to several retail stores, restaurants, and other businesses. The borough is also home to a number of manufacturing companies, including a plastics manufacturer and a metal fabrication company.
The borough is also home to a number of educational institutions, including a community college and a technical school. The borough is also home to a number of medical facilities, including a hospital and several clinics.
Demographics
As of the 2010 census, the population of Montgomery Borough was 1,845. The racial makeup of the borough was 97.2% White, 0.9% African American, 0.3% Native American, 0.3% Asian, 0.2% from other races, and 0.9% from two or more races. Hispanic or Latino of any race were 1.2% of the population.
The median household income in Montgomery Borough was $37,917, and the median family income was $45,938. The per capita income in the borough was $19,945. About 11.2% of families and 14.2% of the population were below the poverty line, including 19.2% of those under age 18 and 8.2% of those age 65 or over.
Common Questions
What is Per Capita Income in Montgomery borough?
Per Capita income in Montgomery borough is $26,193.
What is the Median Family Income in Montgomery borough?
Median Family Income in Montgomery borough is $59,543.
What is the Median Household income in Montgomery borough?
Median Household Income in Montgomery borough is $54,250.
What is Income or Wage Gap in Montgomery borough?
Income or Wage Gap in Montgomery borough is 35.2%.
Women in Montgomery borough earn 64.8 cents for every dollar earned by a man.
What is Inequality or Gini Index in Montgomery borough?
Inequality or Gini Index in Montgomery borough is 0.43.
What is the Total Population of Montgomery borough?
Total Population of Montgomery borough is 1,421.
What is the Total Male Population of Montgomery borough?
Total Male Population of Montgomery borough is 760.
What is the Total Female Population of Montgomery borough?
Total Female Population of Montgomery borough is 661.
What is the Ratio of Males per 100 Females in Montgomery borough?
There are 114.98 Males per 100 Females in Montgomery borough.
What is the Ratio of Females per 100 Males in Montgomery borough?
There are 86.97 Females per 100 Males in Montgomery borough.
What is the Median Population Age in Montgomery borough?
Median Population Age in Montgomery borough is 31.2 Years.
What is the Average Family Size in Montgomery borough
Average Family Size in Montgomery borough is 3.3 People.
What is the Average Household Size in Montgomery borough
Average Household Size in Montgomery borough is 2.5 People.
How Large is the Labor Force in Montgomery borough?
There are 632 People in the Labor Forcein in Montgomery borough.
What is the Percentage of People in the Labor Force in Montgomery borough?
64.6% of People are in the Labor Force in Montgomery borough.
What is the Unemployment Rate in Montgomery borough?
Unemployment Rate in Montgomery borough is 6.2%.