Ebensburg borough, PA Map & Demographics
Ebensburg borough Overview
$37,756
PER CAPITA INCOME
$89,228
AVG FAMILY INCOME
$56,875
AVG HOUSEHOLD INCOME
6.1%
WAGE / INCOME GAP [ % ]
93.9¢/ $1
WAGE / INCOME GAP [ $ ]
0.44
INEQUALITY / GINI INDEX
3,382
TOTAL POPULATION
1,826
MALE POPULATION
1,556
FEMALE POPULATION
117.35
MALES / 100 FEMALES
85.21
FEMALES / 100 MALES
41.5
MEDIAN AGE
3.0
AVG FAMILY SIZE
2.1
AVG HOUSEHOLD SIZE
1,552
LABOR FORCE [ PEOPLE ]
54.1%
PERCENT IN LABOR FORCE
3.7%
UNEMPLOYMENT RATE
Income in Ebensburg borough
Income Overview in Ebensburg borough
Per Capita Income in Ebensburg borough is $37,756, while median incomes of families and households are $89,228 and $56,875 respectively.
| Characteristic | Number | Measure |
| Per Capita Income | 3,382 | $37,756 |
| Median Family Income | 799 | $89,228 |
| Mean Family Income | 799 | $109,572 |
| Median Household Income | 1,636 | $56,875 |
| Mean Household Income | 1,636 | $77,601 |
| Income Deficit | 799 | $0 |
| Wage / Income Gap (%) | 3,382 | 6.09% |
| Wage / Income Gap ($) | 3,382 | 93.91¢ per $1 |
| Gini / Inequality Index | 3,382 | 0.44 |
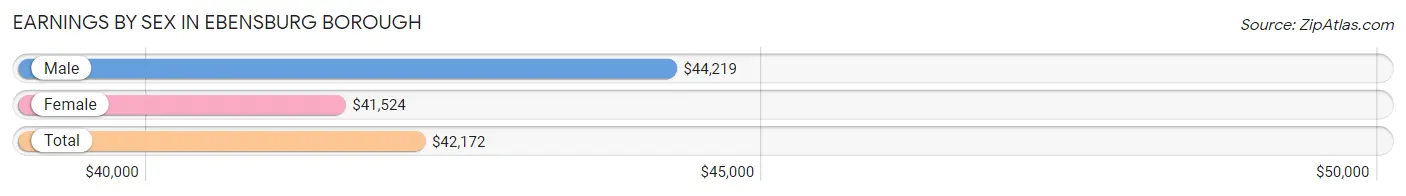
Earnings by Sex in Ebensburg borough
Average Earnings in Ebensburg borough are $42,172, $44,219 for men and $41,524 for women, a difference of 6.1%.
| Sex | Number | Average Earnings |
| Male | 963 (57.5%) | $44,219 |
| Female | 712 (42.5%) | $41,524 |
| Total | 1,675 (100.0%) | $42,172 |
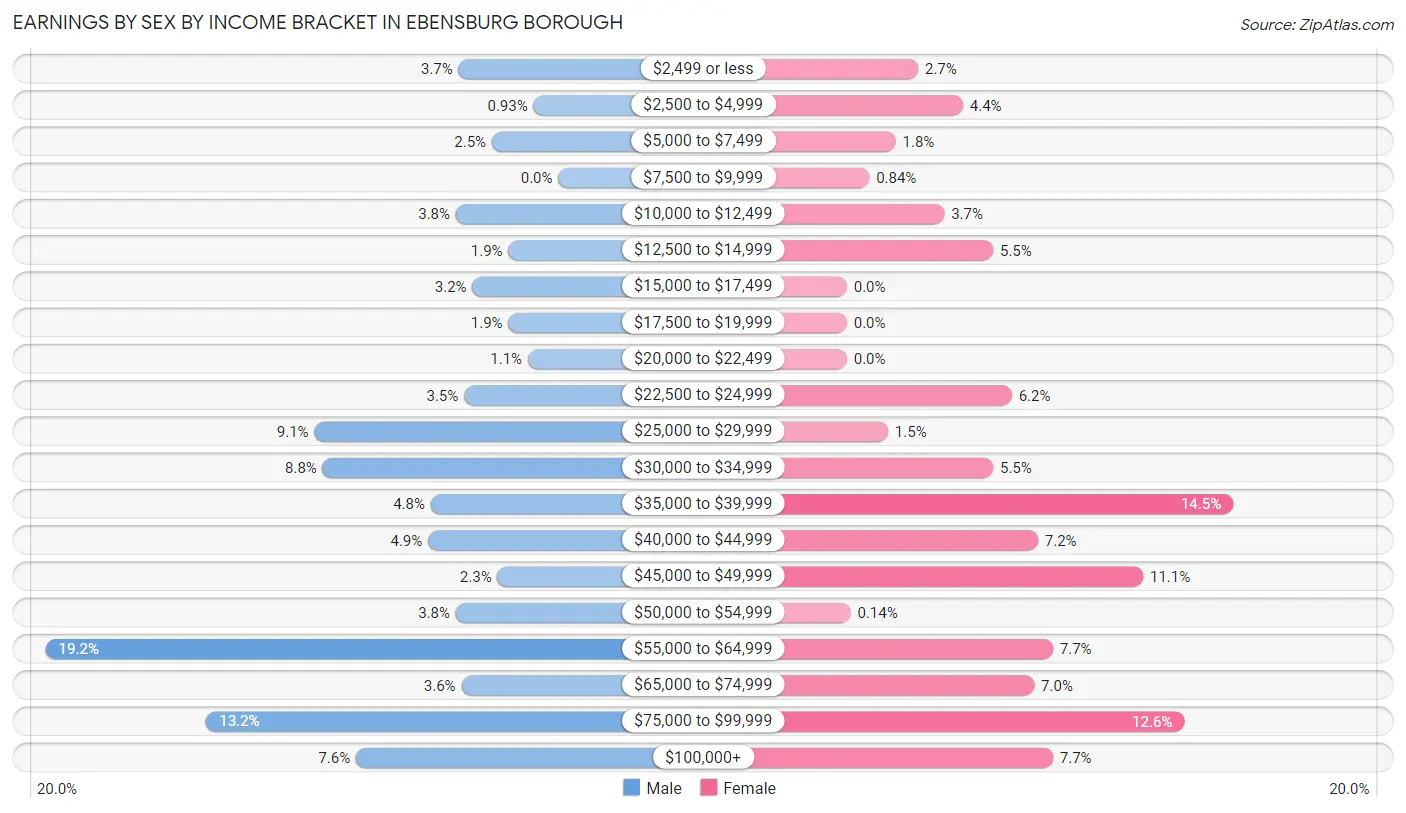
Earnings by Sex by Income Bracket in Ebensburg borough
The most common earnings brackets in Ebensburg borough are $55,000 to $64,999 for men (185 | 19.2%) and $35,000 to $39,999 for women (103 | 14.5%).
| Income | Male | Female |
| $2,499 or less | 36 (3.7%) | 19 (2.7%) |
| $2,500 to $4,999 | 9 (0.9%) | 31 (4.3%) |
| $5,000 to $7,499 | 24 (2.5%) | 13 (1.8%) |
| $7,500 to $9,999 | 0 (0.0%) | 6 (0.8%) |
| $10,000 to $12,499 | 37 (3.8%) | 26 (3.6%) |
| $12,500 to $14,999 | 18 (1.9%) | 39 (5.5%) |
| $15,000 to $17,499 | 31 (3.2%) | 0 (0.0%) |
| $17,500 to $19,999 | 18 (1.9%) | 0 (0.0%) |
| $20,000 to $22,499 | 11 (1.1%) | 0 (0.0%) |
| $22,500 to $24,999 | 34 (3.5%) | 44 (6.2%) |
| $25,000 to $29,999 | 88 (9.1%) | 11 (1.5%) |
| $30,000 to $34,999 | 85 (8.8%) | 39 (5.5%) |
| $35,000 to $39,999 | 46 (4.8%) | 103 (14.5%) |
| $40,000 to $44,999 | 47 (4.9%) | 51 (7.2%) |
| $45,000 to $49,999 | 22 (2.3%) | 79 (11.1%) |
| $50,000 to $54,999 | 37 (3.8%) | 1 (0.1%) |
| $55,000 to $64,999 | 185 (19.2%) | 55 (7.7%) |
| $65,000 to $74,999 | 35 (3.6%) | 50 (7.0%) |
| $75,000 to $99,999 | 127 (13.2%) | 90 (12.6%) |
| $100,000+ | 73 (7.6%) | 55 (7.7%) |
| Total | 963 (100.0%) | 712 (100.0%) |
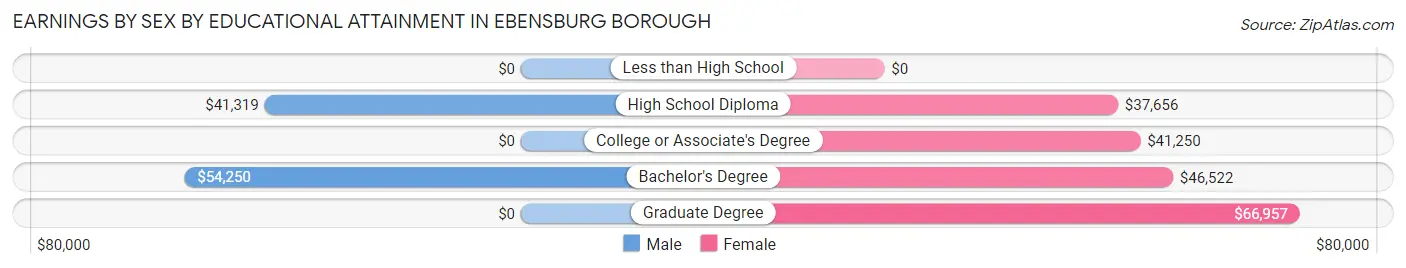
Earnings by Sex by Educational Attainment in Ebensburg borough
Average earnings in Ebensburg borough are $48,229 for men and $45,833 for women, a difference of 5.0%. Men with an educational attainment of bachelor's degree enjoy the highest average annual earnings of $54,250, while those with high school diploma education earn the least with $41,319. Women with an educational attainment of graduate degree earn the most with the average annual earnings of $66,957, while those with high school diploma education have the smallest earnings of $37,656.
| Educational Attainment | Male Income | Female Income |
| Less than High School | - | - |
| High School Diploma | $41,319 | $37,656 |
| College or Associate's Degree | - | - |
| Bachelor's Degree | $54,250 | $46,522 |
| Graduate Degree | - | - |
| Total | $48,229 | $45,833 |
Family Income in Ebensburg borough
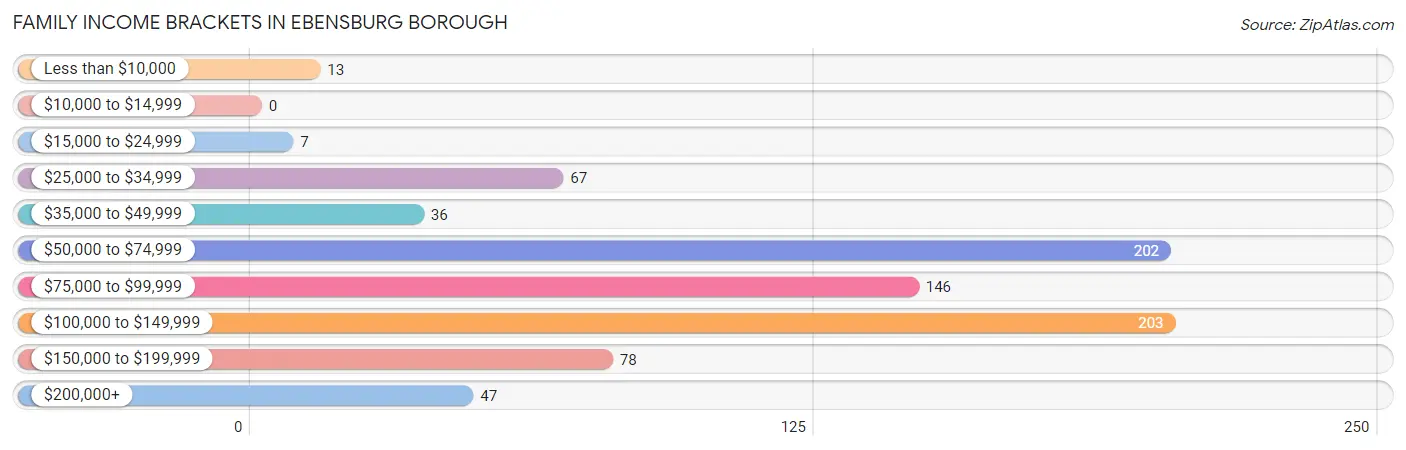
Family Income Brackets in Ebensburg borough
According to the Ebensburg borough family income data, there are 203 families falling into the $100,000 to $149,999 income range, which is the most common income bracket and makes up 25.4% of all families.
| Income Bracket | # Families | % Families |
| Less than $10,000 | 13 | 1.6% |
| $10,000 to $14,999 | 0 | 0.0% |
| $15,000 to $24,999 | 7 | 0.9% |
| $25,000 to $34,999 | 67 | 8.4% |
| $35,000 to $49,999 | 36 | 4.5% |
| $50,000 to $74,999 | 202 | 25.3% |
| $75,000 to $99,999 | 146 | 18.3% |
| $100,000 to $149,999 | 203 | 25.4% |
| $150,000 to $199,999 | 78 | 9.8% |
| $200,000+ | 47 | 5.9% |
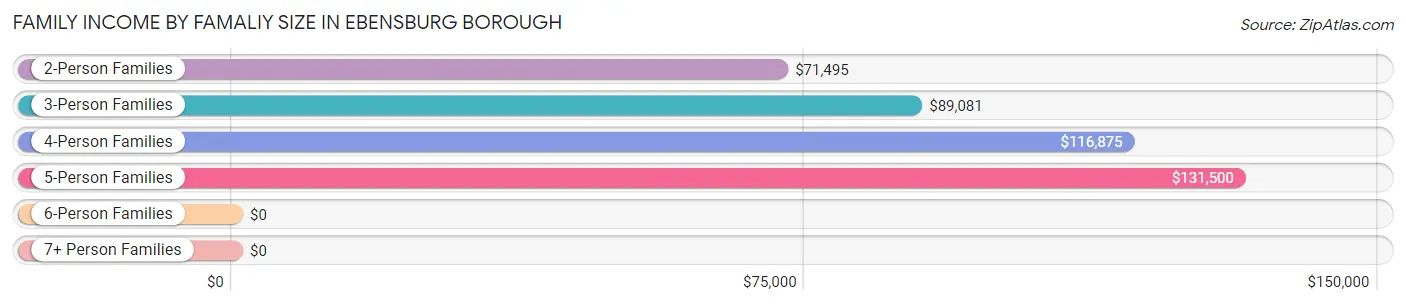
Family Income by Famaliy Size in Ebensburg borough
5-person families (100 | 12.5%) account for the highest median family income in Ebensburg borough with $131,500 per family, while 2-person families (425 | 53.2%) have the highest median income of $35,748 per family member.
| Income Bracket | # Families | Median Income |
| 2-Person Families | 425 (53.2%) | $71,495 |
| 3-Person Families | 143 (17.9%) | $89,081 |
| 4-Person Families | 131 (16.4%) | $116,875 |
| 5-Person Families | 100 (12.5%) | $131,500 |
| 6-Person Families | 0 (0.0%) | $0 |
| 7+ Person Families | 0 (0.0%) | $0 |
| Total | 799 (100.0%) | $89,228 |
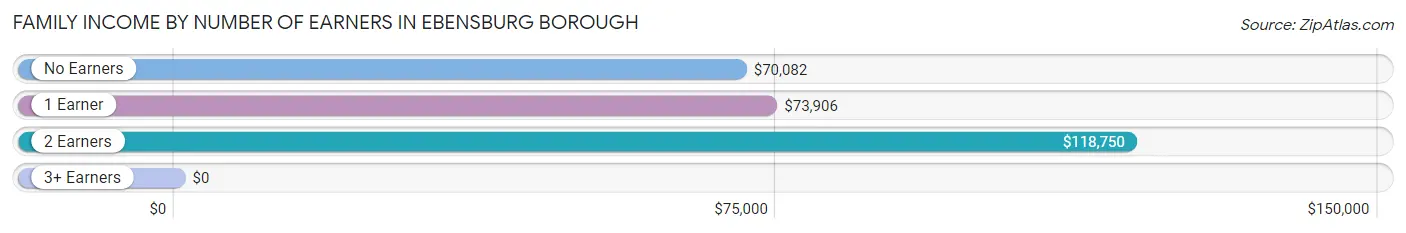
Family Income by Number of Earners in Ebensburg borough
| Number of Earners | # Families | Median Income |
| No Earners | 185 (23.2%) | $70,082 |
| 1 Earner | 201 (25.2%) | $73,906 |
| 2 Earners | 355 (44.4%) | $118,750 |
| 3+ Earners | 58 (7.3%) | $0 |
| Total | 799 (100.0%) | $89,228 |
Household Income in Ebensburg borough
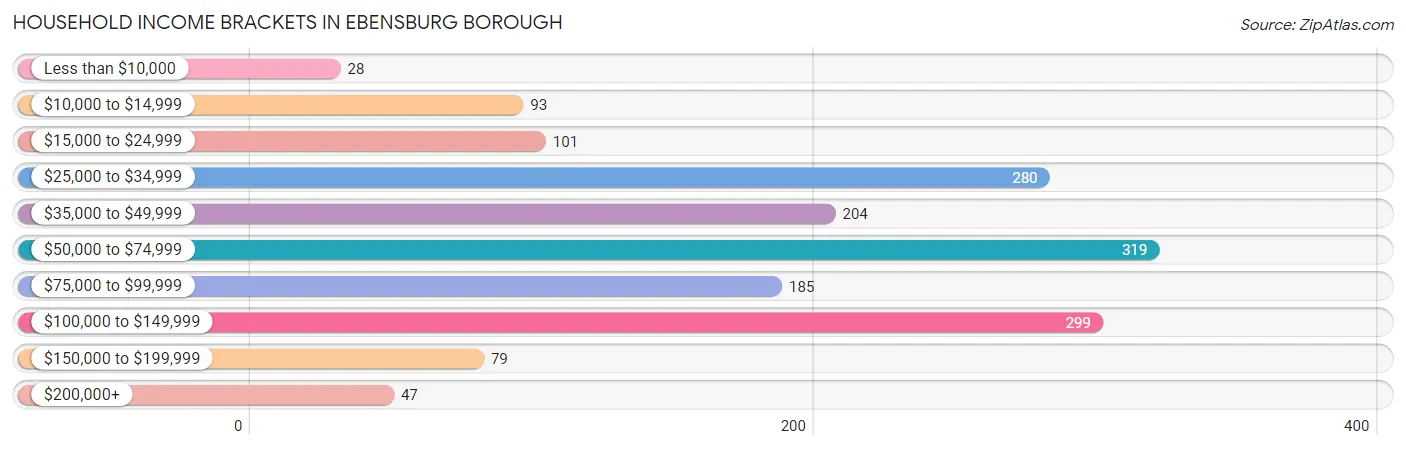
Household Income Brackets in Ebensburg borough
With 319 households falling in the category, the $50,000 to $74,999 income range is the most frequent in Ebensburg borough, accounting for 19.5% of all households. In contrast, only 28 households (1.7%) fall into the less than $10,000 income bracket, making it the least populous group.
| Income Bracket | # Households | % Households |
| Less than $10,000 | 28 | 1.7% |
| $10,000 to $14,999 | 93 | 5.7% |
| $15,000 to $24,999 | 101 | 6.2% |
| $25,000 to $34,999 | 280 | 17.1% |
| $35,000 to $49,999 | 204 | 12.5% |
| $50,000 to $74,999 | 319 | 19.5% |
| $75,000 to $99,999 | 185 | 11.3% |
| $100,000 to $149,999 | 299 | 18.3% |
| $150,000 to $199,999 | 79 | 4.8% |
| $200,000+ | 47 | 2.9% |
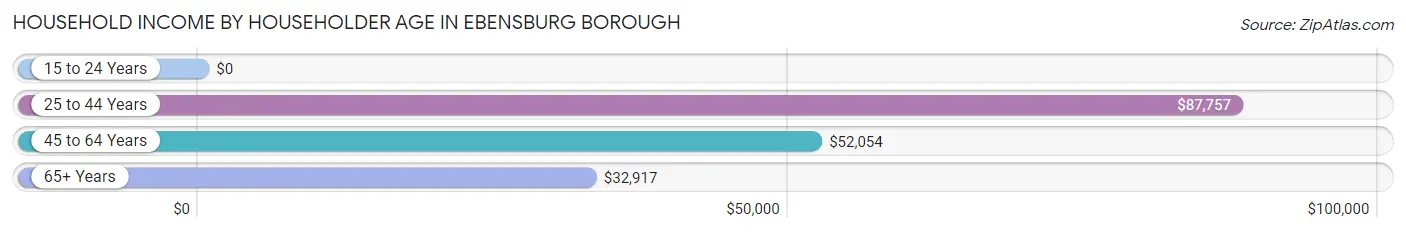
Household Income by Householder Age in Ebensburg borough
The median household income in Ebensburg borough is $56,875, with the highest median household income of $87,757 found in the 25 to 44 years age bracket for the primary householder. A total of 457 households (27.9%) fall into this category. Meanwhile, the 15 to 24 years age bracket for the primary householder has the lowest median household income of $0, with 134 households (8.2%) in this group.
| Income Bracket | # Households | Median Income |
| 15 to 24 Years | 134 (8.2%) | $0 |
| 25 to 44 Years | 457 (27.9%) | $87,757 |
| 45 to 64 Years | 462 (28.2%) | $52,054 |
| 65+ Years | 583 (35.6%) | $32,917 |
| Total | 1,636 (100.0%) | $56,875 |
Poverty in Ebensburg borough
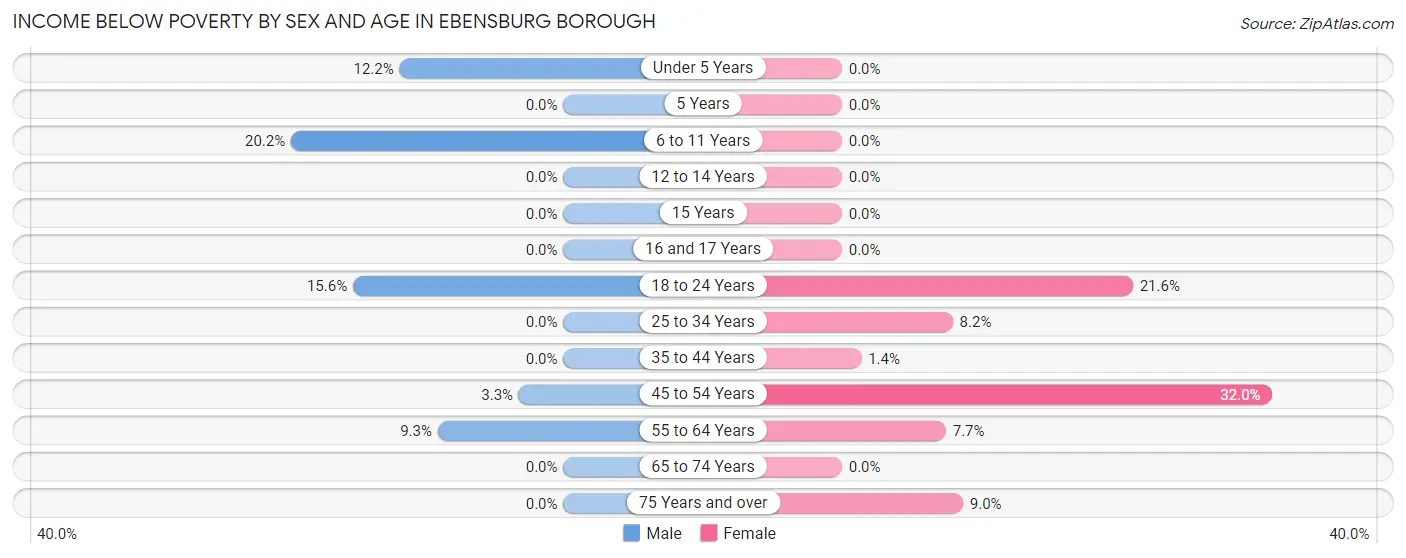
Income Below Poverty by Sex and Age in Ebensburg borough
With 4.7% poverty level for males and 8.7% for females among the residents of Ebensburg borough, 6 to 11 year old males and 45 to 54 year old females are the most vulnerable to poverty, with 18 males (20.2%) and 47 females (32.0%) in their respective age groups living below the poverty level.
| Age Bracket | Male | Female |
| Under 5 Years | 9 (12.2%) | 0 (0.0%) |
| 5 Years | 0 (0.0%) | 0 (0.0%) |
| 6 to 11 Years | 18 (20.2%) | 0 (0.0%) |
| 12 to 14 Years | 0 (0.0%) | 0 (0.0%) |
| 15 Years | 0 (0.0%) | 0 (0.0%) |
| 16 and 17 Years | 0 (0.0%) | 0 (0.0%) |
| 18 to 24 Years | 40 (15.6%) | 35 (21.6%) |
| 25 to 34 Years | 0 (0.0%) | 13 (8.2%) |
| 35 to 44 Years | 0 (0.0%) | 3 (1.4%) |
| 45 to 54 Years | 7 (3.3%) | 47 (32.0%) |
| 55 to 64 Years | 11 (9.3%) | 20 (7.7%) |
| 65 to 74 Years | 0 (0.0%) | 0 (0.0%) |
| 75 Years and over | 0 (0.0%) | 17 (9.0%) |
| Total | 85 (4.7%) | 135 (8.7%) |
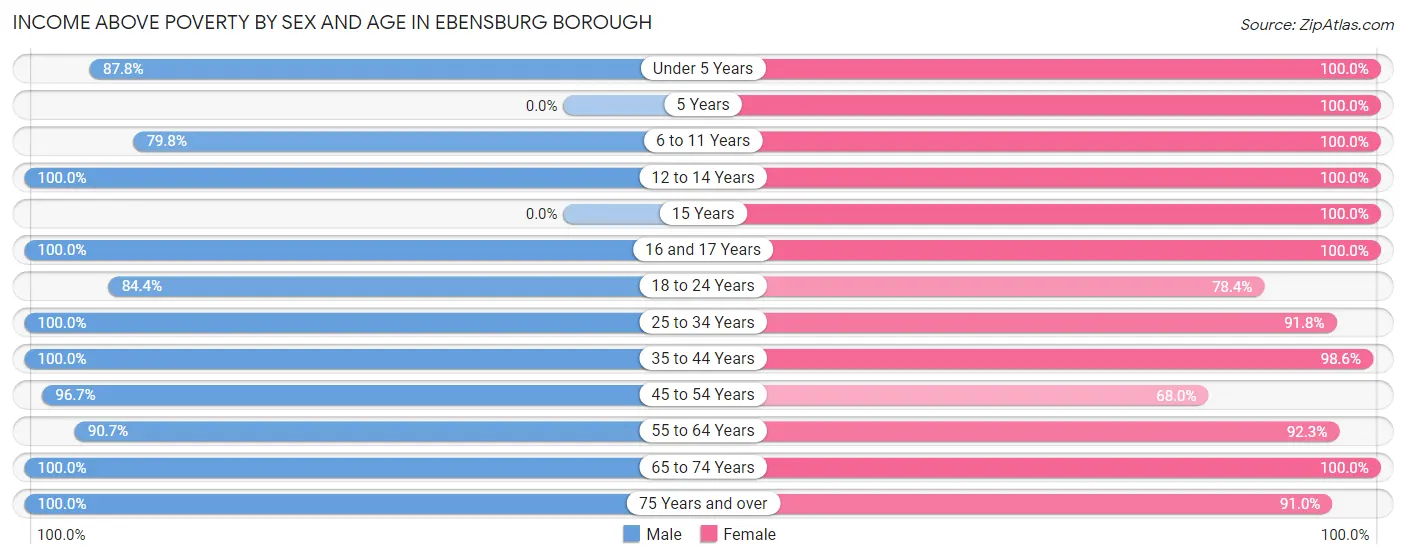
Income Above Poverty by Sex and Age in Ebensburg borough
According to the poverty statistics in Ebensburg borough, males aged 12 to 14 years and females aged under 5 years are the age groups that are most secure financially, with 100.0% of males and 100.0% of females in these age groups living above the poverty line.
| Age Bracket | Male | Female |
| Under 5 Years | 65 (87.8%) | 84 (100.0%) |
| 5 Years | 0 (0.0%) | 7 (100.0%) |
| 6 to 11 Years | 71 (79.8%) | 36 (100.0%) |
| 12 to 14 Years | 102 (100.0%) | 80 (100.0%) |
| 15 Years | 0 (0.0%) | 38 (100.0%) |
| 16 and 17 Years | 146 (100.0%) | 10 (100.0%) |
| 18 to 24 Years | 216 (84.4%) | 127 (78.4%) |
| 25 to 34 Years | 187 (100.0%) | 145 (91.8%) |
| 35 to 44 Years | 235 (100.0%) | 205 (98.6%) |
| 45 to 54 Years | 205 (96.7%) | 100 (68.0%) |
| 55 to 64 Years | 107 (90.7%) | 239 (92.3%) |
| 65 to 74 Years | 185 (100.0%) | 173 (100.0%) |
| 75 Years and over | 218 (100.0%) | 172 (91.0%) |
| Total | 1,737 (95.3%) | 1,416 (91.3%) |
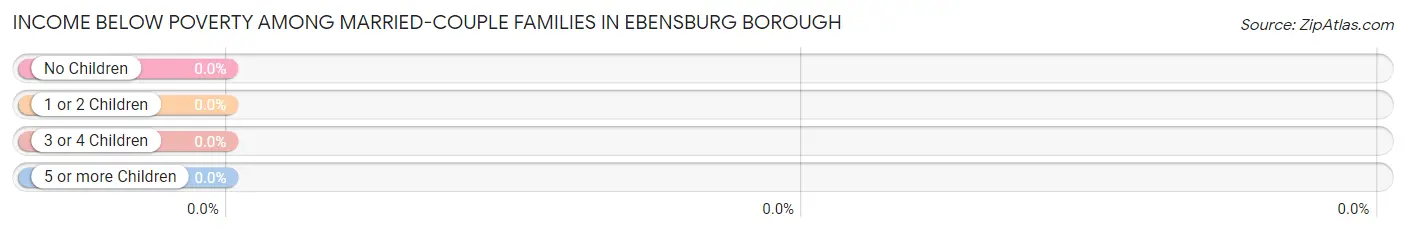
Income Below Poverty Among Married-Couple Families in Ebensburg borough
| Children | Above Poverty | Below Poverty |
| No Children | 343 (100.0%) | 0 (0.0%) |
| 1 or 2 Children | 166 (100.0%) | 0 (0.0%) |
| 3 or 4 Children | 76 (100.0%) | 0 (0.0%) |
| 5 or more Children | 0 (0.0%) | 0 (0.0%) |
| Total | 585 (100.0%) | 0 (0.0%) |
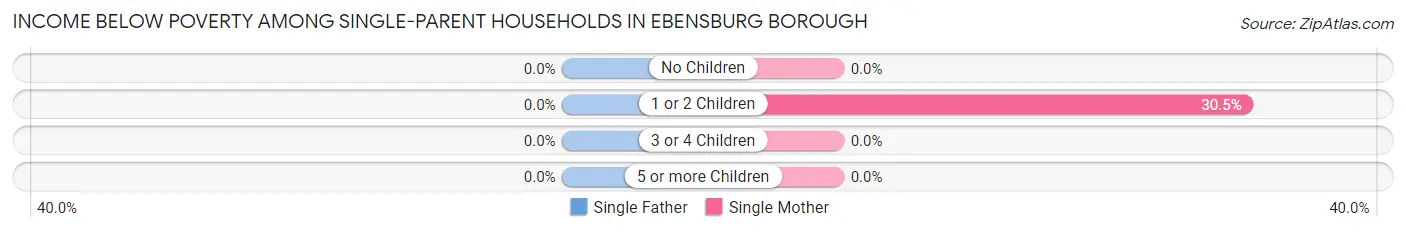
Income Below Poverty Among Single-Parent Households in Ebensburg borough
| Children | Single Father | Single Mother |
| No Children | 0 (0.0%) | 0 (0.0%) |
| 1 or 2 Children | 0 (0.0%) | 29 (30.5%) |
| 3 or 4 Children | 0 (0.0%) | 0 (0.0%) |
| 5 or more Children | 0 (0.0%) | 0 (0.0%) |
| Total | 0 (0.0%) | 29 (25.9%) |
Income Below Poverty Among Married-Couple vs Single-Parent Households in Ebensburg borough
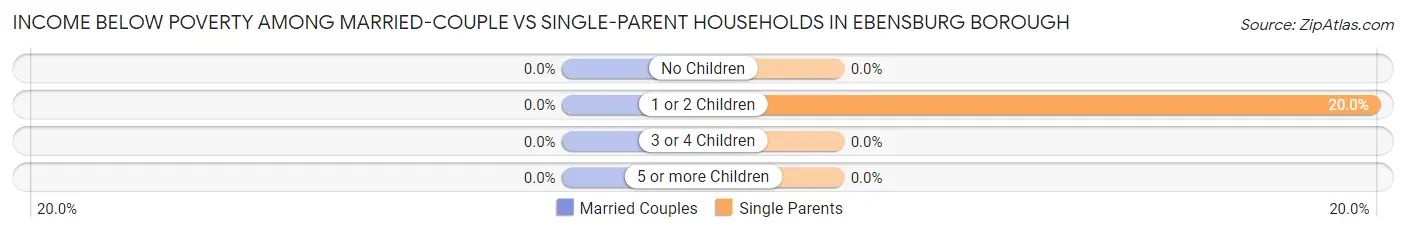
| Children | Married-Couple Families | Single-Parent Households |
| No Children | 0 (0.0%) | 0 (0.0%) |
| 1 or 2 Children | 0 (0.0%) | 29 (20.0%) |
| 3 or 4 Children | 0 (0.0%) | 0 (0.0%) |
| 5 or more Children | 0 (0.0%) | 0 (0.0%) |
| Total | 0 (0.0%) | 29 (13.6%) |
Race in Ebensburg borough
The most populous races in Ebensburg borough are White / Caucasian (3,327 | 98.4%), Two or more Races (29 | 0.9%), and Hispanic or Latino (22 | 0.6%).
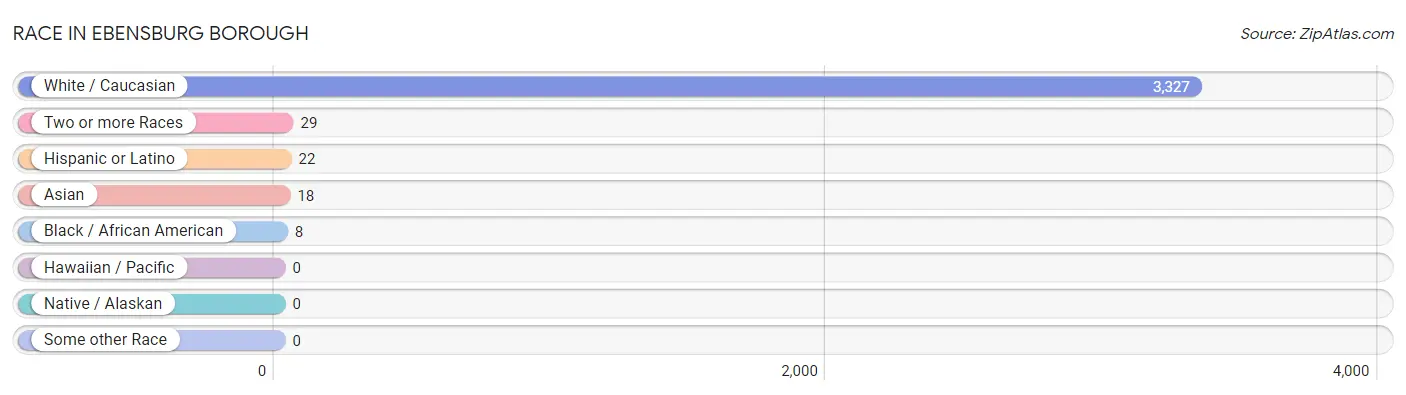
| Race | # Population | % Population |
| Asian | 18 | 0.5% |
| Black / African American | 8 | 0.2% |
| Hawaiian / Pacific | 0 | 0.0% |
| Hispanic or Latino | 22 | 0.6% |
| Native / Alaskan | 0 | 0.0% |
| White / Caucasian | 3,327 | 98.4% |
| Two or more Races | 29 | 0.9% |
| Some other Race | 0 | 0.0% |
| Total | 3,382 | 100.0% |
Ancestry in Ebensburg borough
The most populous ancestries reported in Ebensburg borough are German (1,352 | 40.0%), Irish (827 | 24.4%), English (507 | 15.0%), Polish (467 | 13.8%), and Italian (369 | 10.9%), together accounting for 104.1% of all Ebensburg borough residents.
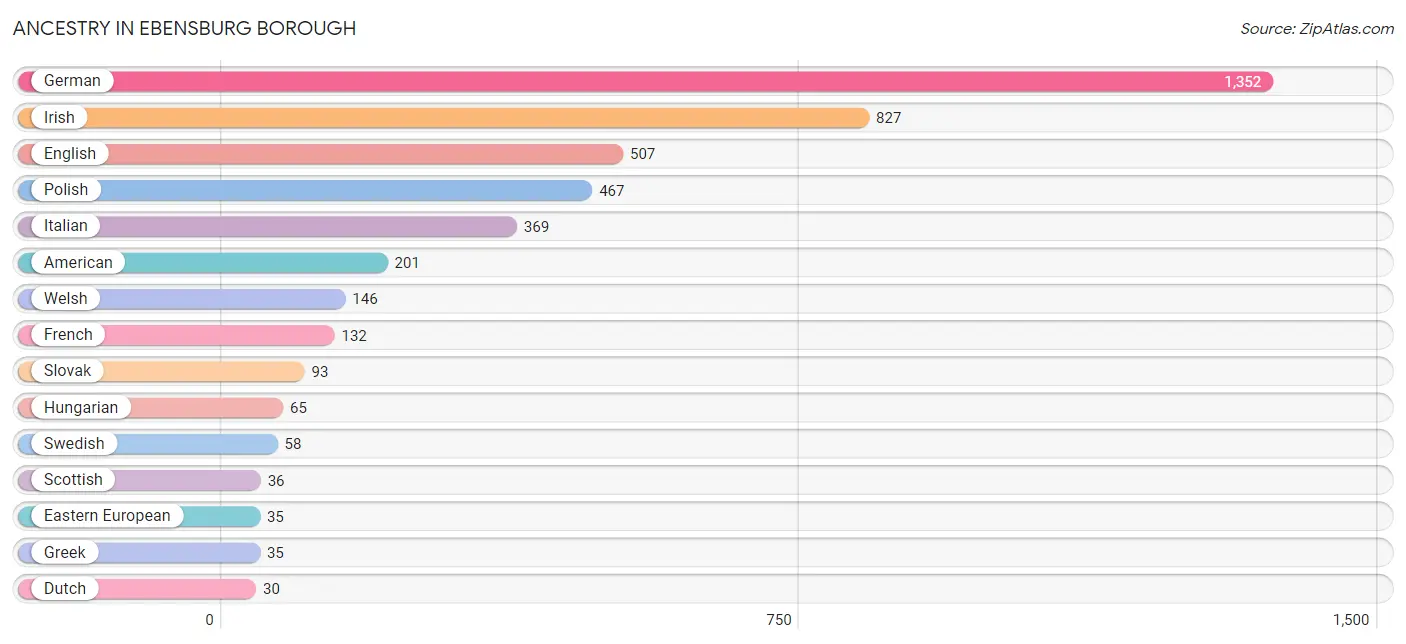
| Ancestry | # Population | % Population |
| American | 201 | 5.9% |
| Apache | 3 | 0.1% |
| Austrian | 18 | 0.5% |
| Cuban | 7 | 0.2% |
| Czech | 18 | 0.5% |
| Danish | 8 | 0.2% |
| Dutch | 30 | 0.9% |
| Eastern European | 35 | 1.0% |
| English | 507 | 15.0% |
| Finnish | 16 | 0.5% |
| French | 132 | 3.9% |
| German | 1,352 | 40.0% |
| Greek | 35 | 1.0% |
| Hungarian | 65 | 1.9% |
| Irish | 827 | 24.4% |
| Italian | 369 | 10.9% |
| Korean | 10 | 0.3% |
| Lithuanian | 9 | 0.3% |
| Pennsylvania German | 24 | 0.7% |
| Polish | 467 | 13.8% |
| Puerto Rican | 15 | 0.4% |
| Russian | 8 | 0.2% |
| Scotch-Irish | 28 | 0.8% |
| Scottish | 36 | 1.1% |
| Serbian | 8 | 0.2% |
| Slovak | 93 | 2.8% |
| Swedish | 58 | 1.7% |
| Thai | 8 | 0.2% |
| Ukrainian | 13 | 0.4% |
| Welsh | 146 | 4.3% | View All 30 Rows |
Immigrants in Ebensburg borough
The most numerous immigrant groups reported in Ebensburg borough came from Europe (22 | 0.6%), Northern Europe (22 | 0.6%), Asia (18 | 0.5%), Philippines (10 | 0.3%), and South Eastern Asia (10 | 0.3%), together accounting for 2.4% of all Ebensburg borough residents.
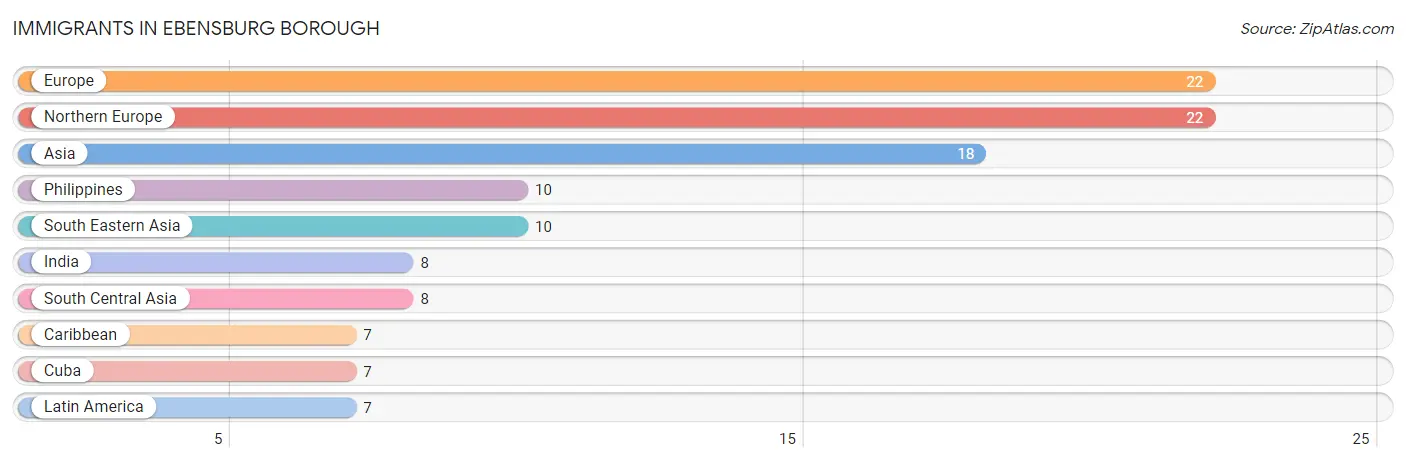
| Immigration Origin | # Population | % Population |
| Asia | 18 | 0.5% |
| Caribbean | 7 | 0.2% |
| Cuba | 7 | 0.2% |
| Europe | 22 | 0.6% |
| India | 8 | 0.2% |
| Latin America | 7 | 0.2% |
| Northern Europe | 22 | 0.6% |
| Philippines | 10 | 0.3% |
| South Central Asia | 8 | 0.2% |
| South Eastern Asia | 10 | 0.3% | View All 10 Rows |
Sex and Age in Ebensburg borough
Sex and Age in Ebensburg borough
The most populous age groups in Ebensburg borough are 20 to 24 Years (217 | 11.9%) for men and 20 to 24 Years (162 | 10.4%) for women.
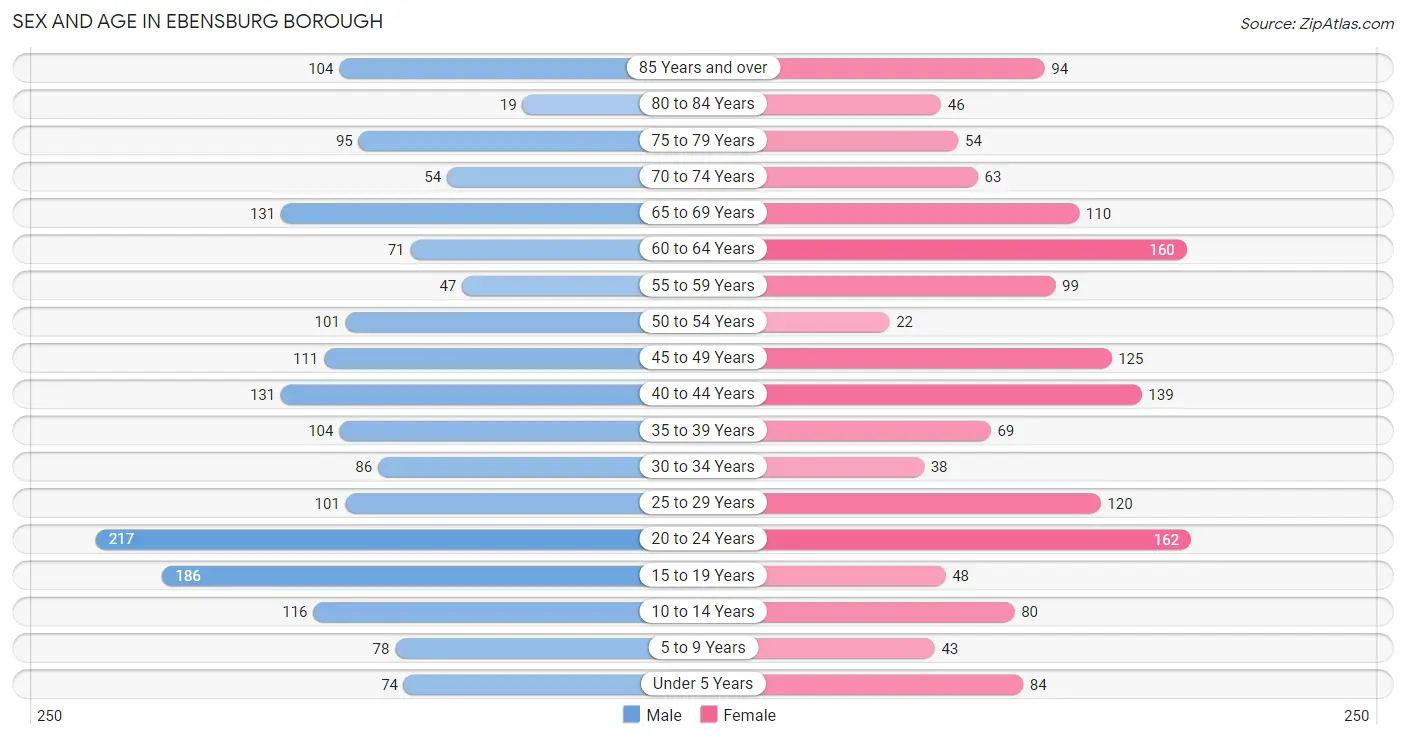
| Age Bracket | Male | Female |
| Under 5 Years | 74 (4.1%) | 84 (5.4%) |
| 5 to 9 Years | 78 (4.3%) | 43 (2.8%) |
| 10 to 14 Years | 116 (6.4%) | 80 (5.1%) |
| 15 to 19 Years | 186 (10.2%) | 48 (3.1%) |
| 20 to 24 Years | 217 (11.9%) | 162 (10.4%) |
| 25 to 29 Years | 101 (5.5%) | 120 (7.7%) |
| 30 to 34 Years | 86 (4.7%) | 38 (2.4%) |
| 35 to 39 Years | 104 (5.7%) | 69 (4.4%) |
| 40 to 44 Years | 131 (7.2%) | 139 (8.9%) |
| 45 to 49 Years | 111 (6.1%) | 125 (8.0%) |
| 50 to 54 Years | 101 (5.5%) | 22 (1.4%) |
| 55 to 59 Years | 47 (2.6%) | 99 (6.4%) |
| 60 to 64 Years | 71 (3.9%) | 160 (10.3%) |
| 65 to 69 Years | 131 (7.2%) | 110 (7.1%) |
| 70 to 74 Years | 54 (3.0%) | 63 (4.1%) |
| 75 to 79 Years | 95 (5.2%) | 54 (3.5%) |
| 80 to 84 Years | 19 (1.0%) | 46 (3.0%) |
| 85 Years and over | 104 (5.7%) | 94 (6.0%) |
| Total | 1,826 (100.0%) | 1,556 (100.0%) |
Families and Households in Ebensburg borough
Median Family Size in Ebensburg borough
The median family size in Ebensburg borough is 2.97 persons per family, with married-couple families (585 | 73.2%) accounting for the largest median family size of 3.05 persons per family. On the other hand, single female/mother families (112 | 14.0%) represent the smallest median family size with 2.65 persons per family.
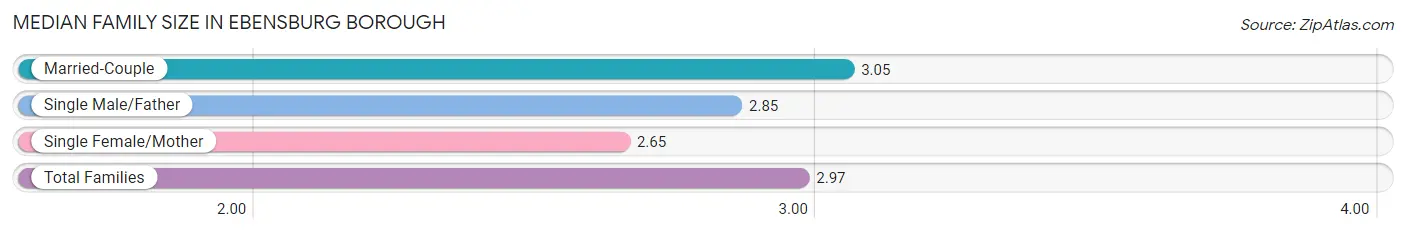
| Family Type | # Families | Family Size |
| Married-Couple | 585 (73.2%) | 3.05 |
| Single Male/Father | 102 (12.8%) | 2.85 |
| Single Female/Mother | 112 (14.0%) | 2.65 |
| Total Families | 799 (100.0%) | 2.97 |
Median Household Size in Ebensburg borough
The median household size in Ebensburg borough is 2.06 persons per household, with single female/mother households (112 | 6.9%) accounting for the largest median household size of 3.29 persons per household. non-family households (837 | 51.2%) represent the smallest median household size with 1.08 persons per household.
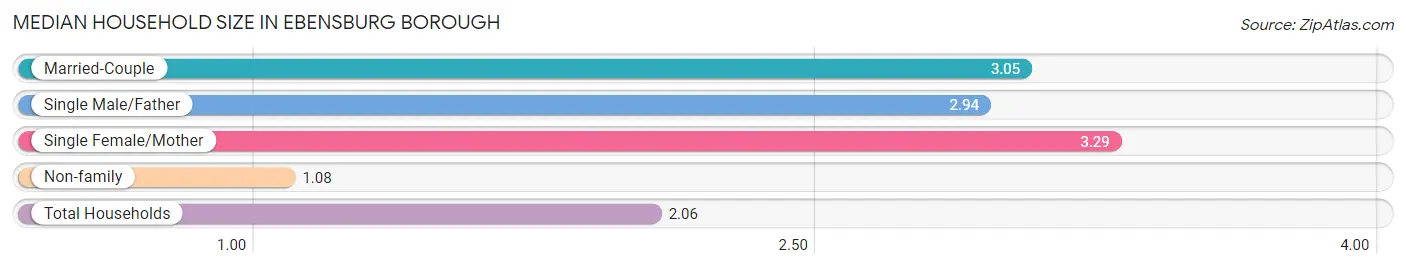
| Household Type | # Households | Household Size |
| Married-Couple | 585 (35.8%) | 3.05 |
| Single Male/Father | 102 (6.2%) | 2.94 |
| Single Female/Mother | 112 (6.9%) | 3.29 |
| Non-family | 837 (51.2%) | 1.08 |
| Total Households | 1,636 (100.0%) | 2.06 |
Household Size by Marriage Status in Ebensburg borough
Out of a total of 1,636 households in Ebensburg borough, 799 (48.8%) are family households, while 837 (51.2%) are nonfamily households. The most numerous type of family households are 2-person households, comprising 347, and the most common type of nonfamily households are 1-person households, comprising 753.
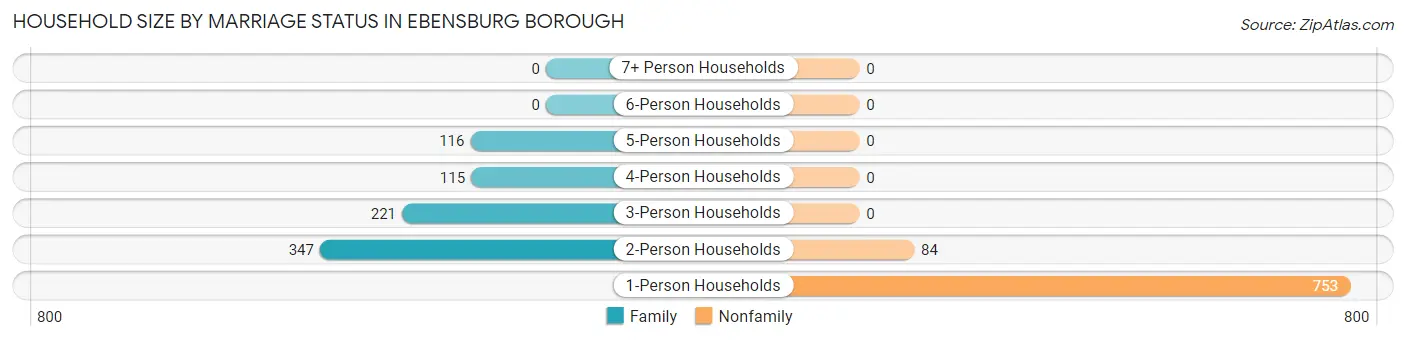
| Household Size | Family Households | Nonfamily Households |
| 1-Person Households | - | 753 (46.0%) |
| 2-Person Households | 347 (21.2%) | 84 (5.1%) |
| 3-Person Households | 221 (13.5%) | 0 (0.0%) |
| 4-Person Households | 115 (7.0%) | 0 (0.0%) |
| 5-Person Households | 116 (7.1%) | 0 (0.0%) |
| 6-Person Households | 0 (0.0%) | 0 (0.0%) |
| 7+ Person Households | 0 (0.0%) | 0 (0.0%) |
| Total | 799 (48.8%) | 837 (51.2%) |
Female Fertility in Ebensburg borough
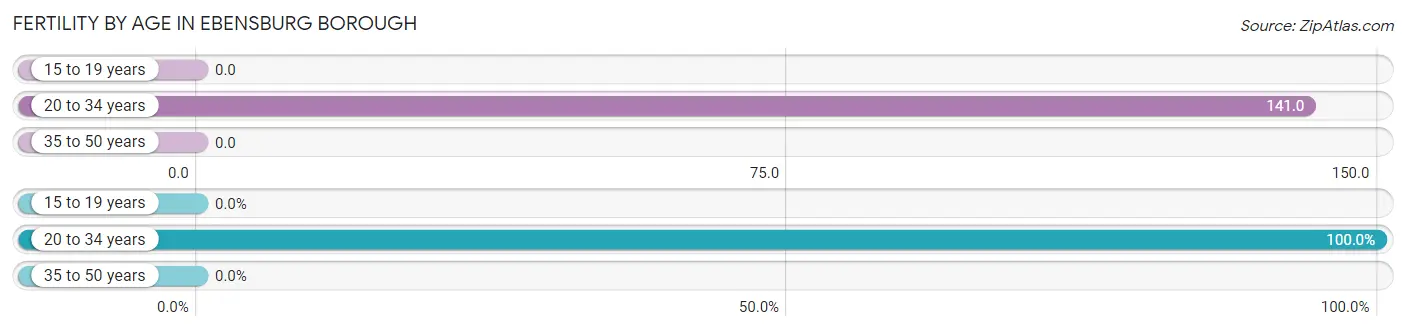
Fertility by Age in Ebensburg borough
Average fertility rate in Ebensburg borough is 63.0 births per 1,000 women. Women in the age bracket of 20 to 34 years have the highest fertility rate with 141.0 births per 1,000 women. Women in the age bracket of 20 to 34 years acount for 100.0% of all women with births.
| Age Bracket | Women with Births | Births / 1,000 Women |
| 15 to 19 years | 0 (0.0%) | 0.0 |
| 20 to 34 years | 45 (100.0%) | 141.0 |
| 35 to 50 years | 0 (0.0%) | 0.0 |
| Total | 45 (100.0%) | 63.0 |
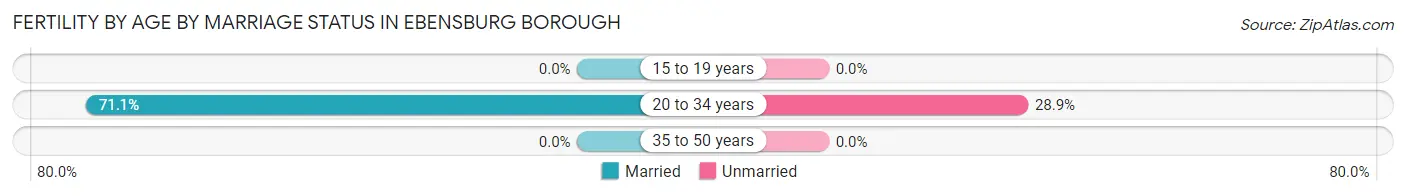
Fertility by Age by Marriage Status in Ebensburg borough
71.1% of women with births (45) in Ebensburg borough are married. The highest percentage of unmarried women with births falls into 20 to 34 years age bracket with 28.9% of them unmarried at the time of birth, while the lowest percentage of unmarried women with births belong to 20 to 34 years age bracket with 28.9% of them unmarried.
| Age Bracket | Married | Unmarried |
| 15 to 19 years | 0 (0.0%) | 0 (0.0%) |
| 20 to 34 years | 32 (71.1%) | 13 (28.9%) |
| 35 to 50 years | 0 (0.0%) | 0 (0.0%) |
| Total | 32 (71.1%) | 13 (28.9%) |
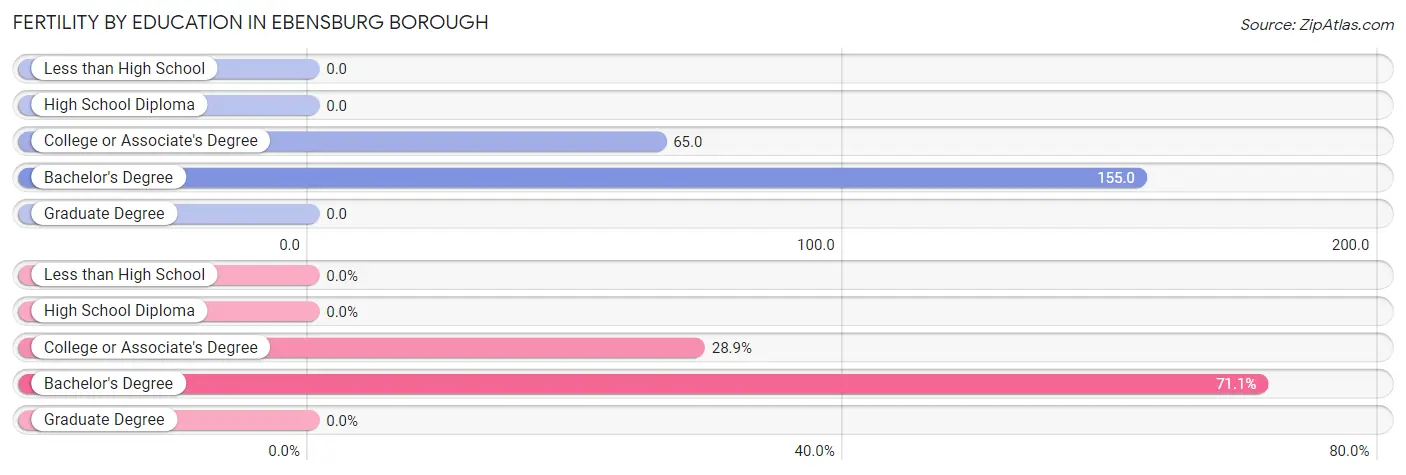
Fertility by Education in Ebensburg borough
| Educational Attainment | Women with Births | Births / 1,000 Women |
| Less than High School | 0 (0.0%) | 0.0 |
| High School Diploma | 0 (0.0%) | 0.0 |
| College or Associate's Degree | 13 (28.9%) | 65.0 |
| Bachelor's Degree | 32 (71.1%) | 155.0 |
| Graduate Degree | 0 (0.0%) | 0.0 |
| Total | 45 (100.0%) | 63.0 |
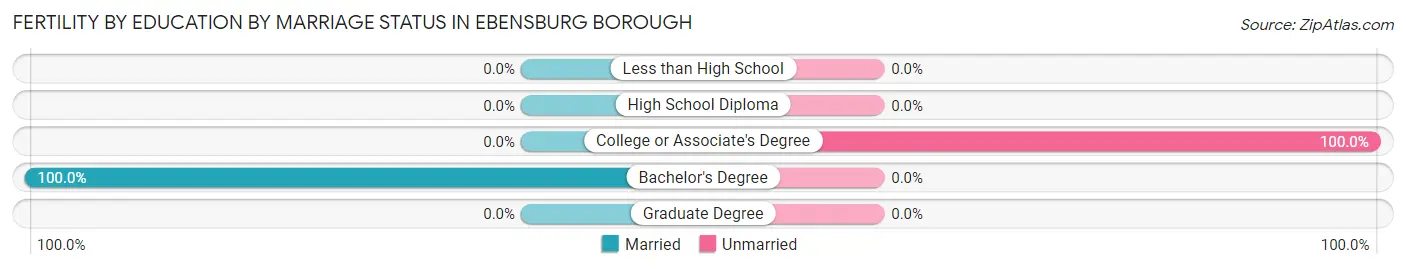
Fertility by Education by Marriage Status in Ebensburg borough
28.9% of women with births in Ebensburg borough are unmarried. Women with the educational attainment of bachelor's degree are most likely to be married with 100.0% of them married at childbirth, while women with the educational attainment of college or associate's degree are least likely to be married with 100.0% of them unmarried at childbirth.
| Educational Attainment | Married | Unmarried |
| Less than High School | 0 (0.0%) | 0 (0.0%) |
| High School Diploma | 0 (0.0%) | 0 (0.0%) |
| College or Associate's Degree | 0 (0.0%) | 13 (100.0%) |
| Bachelor's Degree | 32 (100.0%) | 0 (0.0%) |
| Graduate Degree | 0 (0.0%) | 0 (0.0%) |
| Total | 32 (71.1%) | 13 (28.9%) |
Employment Characteristics in Ebensburg borough
Employment by Class of Employer in Ebensburg borough
Among the 1,488 employed individuals in Ebensburg borough, private company employees (801 | 53.8%), not-for-profit organizations (192 | 12.9%), and state government employees (150 | 10.1%) make up the most common classes of employment.
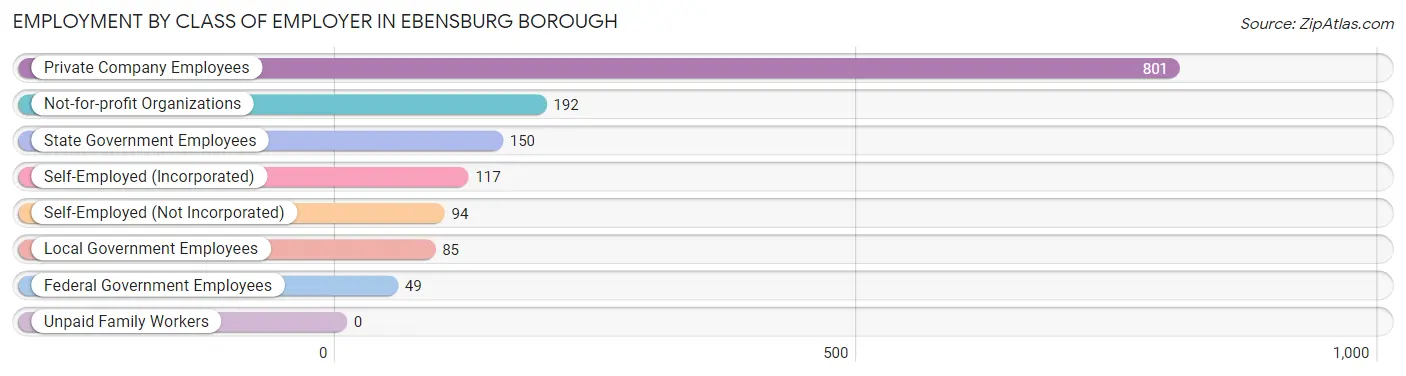
| Employer Class | # Employees | % Employees |
| Private Company Employees | 801 | 53.8% |
| Self-Employed (Incorporated) | 117 | 7.9% |
| Self-Employed (Not Incorporated) | 94 | 6.3% |
| Not-for-profit Organizations | 192 | 12.9% |
| Local Government Employees | 85 | 5.7% |
| State Government Employees | 150 | 10.1% |
| Federal Government Employees | 49 | 3.3% |
| Unpaid Family Workers | 0 | 0.0% |
| Total | 1,488 | 100.0% |
Employment Status by Age in Ebensburg borough
According to the labor force statistics for Ebensburg borough, out of the total population over 16 years of age (2,869), 54.1% or 1,552 individuals are in the labor force, with 3.7% or 57 of them unemployed. The age group with the highest labor force participation rate is 30 to 34 years, with 100.0% or 124 individuals in the labor force. Within the labor force, the 60 to 64 years age range has the highest percentage of unemployed individuals, with 9.9% or 7 of them being unemployed.
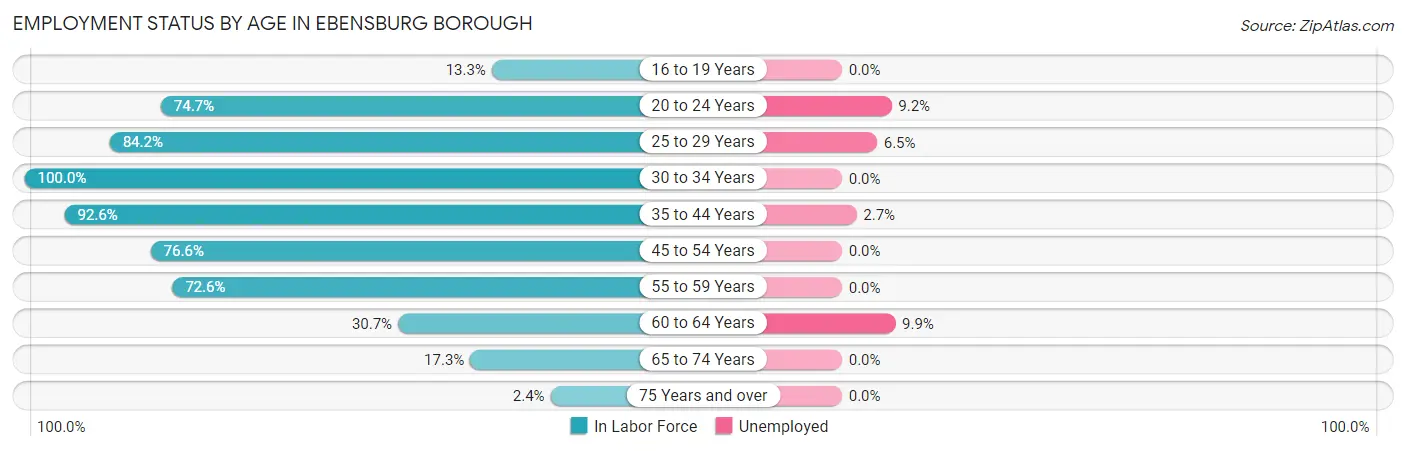
| Age Bracket | In Labor Force | Unemployed |
| 16 to 19 Years | 26 (13.3%) | 0 (0.0%) |
| 20 to 24 Years | 283 (74.7%) | 26 (9.2%) |
| 25 to 29 Years | 186 (84.2%) | 12 (6.5%) |
| 30 to 34 Years | 124 (100.0%) | 0 (0.0%) |
| 35 to 44 Years | 410 (92.6%) | 11 (2.7%) |
| 45 to 54 Years | 275 (76.6%) | 0 (0.0%) |
| 55 to 59 Years | 106 (72.6%) | 0 (0.0%) |
| 60 to 64 Years | 71 (30.7%) | 7 (9.9%) |
| 65 to 74 Years | 62 (17.3%) | 0 (0.0%) |
| 75 Years and over | 10 (2.4%) | 0 (0.0%) |
| Total | 1,552 (54.1%) | 57 (3.7%) |
Employment Status by Educational Attainment in Ebensburg borough
According to labor force statistics for Ebensburg borough, 76.9% of individuals (1,172) out of the total population between 25 and 64 years of age (1,524) are in the labor force, with 2.6% or 30 of them being unemployed. The group with the highest labor force participation rate are those with the educational attainment of bachelor's degree or higher, with 84.5% or 713 individuals in the labor force. Within the labor force, individuals with less than high school education have the highest percentage of unemployment, with 55.0% or 11 of them being unemployed.
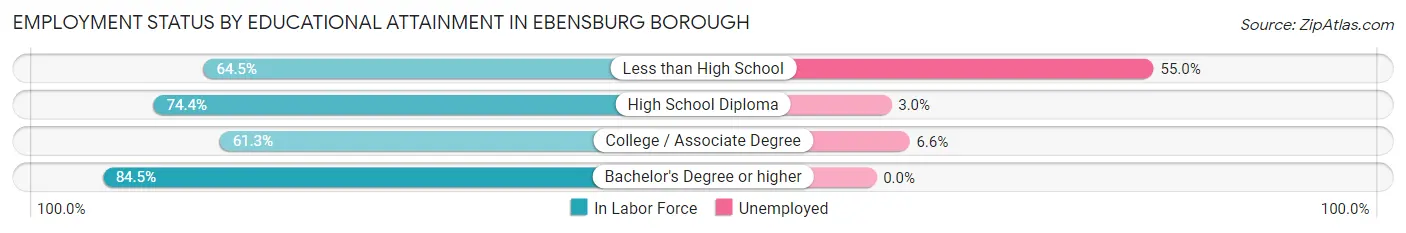
| Educational Attainment | In Labor Force | Unemployed |
| Less than High School | 20 (64.5%) | 17 (55.0%) |
| High School Diploma | 233 (74.4%) | 9 (3.0%) |
| College / Associate Degree | 206 (61.3%) | 22 (6.6%) |
| Bachelor's Degree or higher | 713 (84.5%) | 0 (0.0%) |
| Total | 1,172 (76.9%) | 40 (2.6%) |
Employment Occupations by Sex in Ebensburg borough
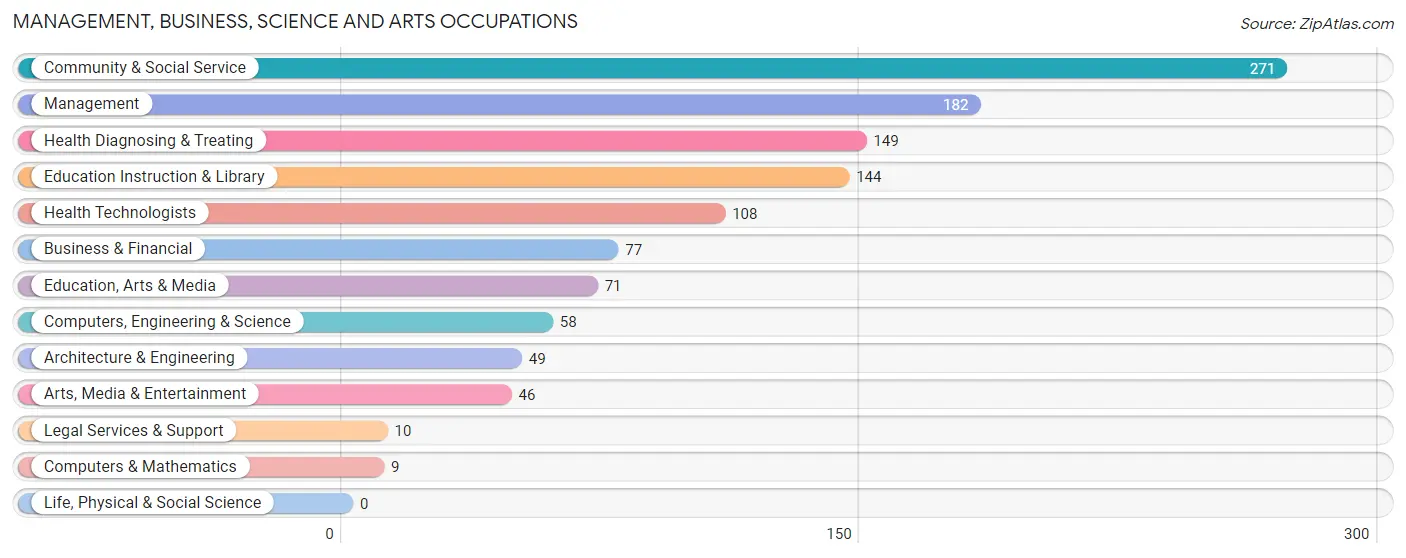
Management, Business, Science and Arts Occupations
The most common Management, Business, Science and Arts occupations in Ebensburg borough are Community & Social Service (271 | 18.4%), Management (182 | 12.4%), Health Diagnosing & Treating (149 | 10.1%), Education Instruction & Library (144 | 9.8%), and Health Technologists (108 | 7.3%).
Management, Business, Science and Arts Occupations by Sex
Within the Management, Business, Science and Arts occupations in Ebensburg borough, the most male-oriented occupations are Architecture & Engineering (100.0%), Legal Services & Support (100.0%), and Computers, Engineering & Science (84.5%), while the most female-oriented occupations are Computers & Mathematics (100.0%), Education Instruction & Library (63.9%), and Arts, Media & Entertainment (60.9%).
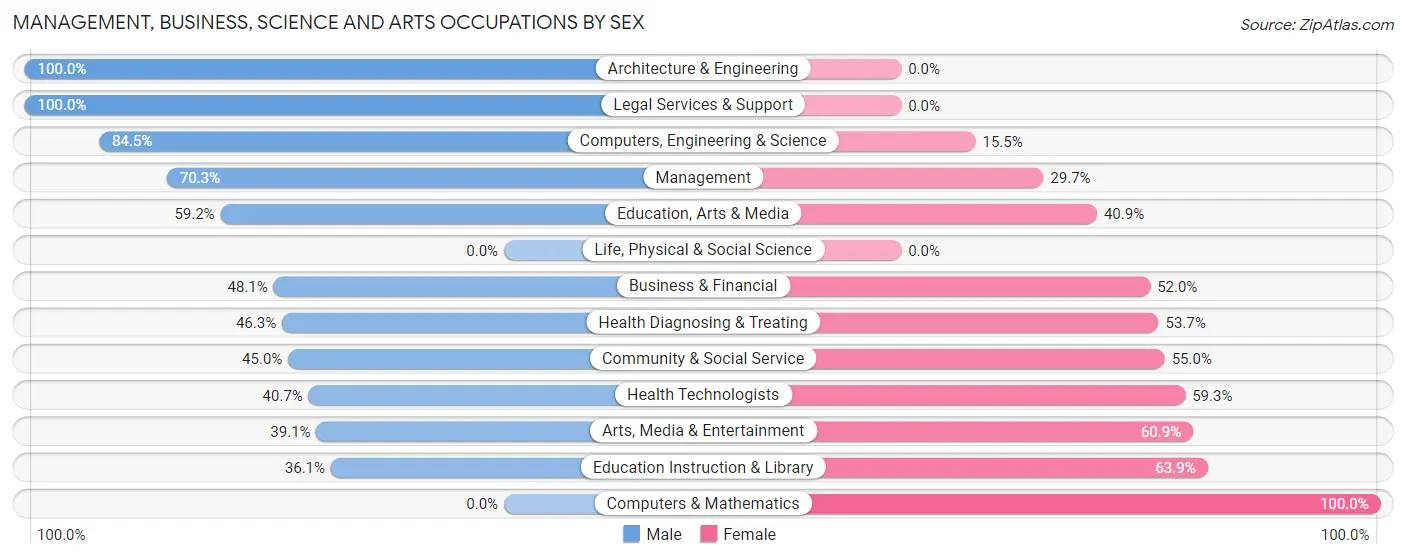
| Occupation | Male | Female |
| Management | 128 (70.3%) | 54 (29.7%) |
| Business & Financial | 37 (48.0%) | 40 (51.9%) |
| Computers, Engineering & Science | 49 (84.5%) | 9 (15.5%) |
| Computers & Mathematics | 0 (0.0%) | 9 (100.0%) |
| Architecture & Engineering | 49 (100.0%) | 0 (0.0%) |
| Life, Physical & Social Science | 0 (0.0%) | 0 (0.0%) |
| Community & Social Service | 122 (45.0%) | 149 (55.0%) |
| Education, Arts & Media | 42 (59.2%) | 29 (40.8%) |
| Legal Services & Support | 10 (100.0%) | 0 (0.0%) |
| Education Instruction & Library | 52 (36.1%) | 92 (63.9%) |
| Arts, Media & Entertainment | 18 (39.1%) | 28 (60.9%) |
| Health Diagnosing & Treating | 69 (46.3%) | 80 (53.7%) |
| Health Technologists | 44 (40.7%) | 64 (59.3%) |
| Total (Category) | 405 (54.9%) | 332 (45.1%) |
| Total (Overall) | 813 (55.2%) | 659 (44.8%) |
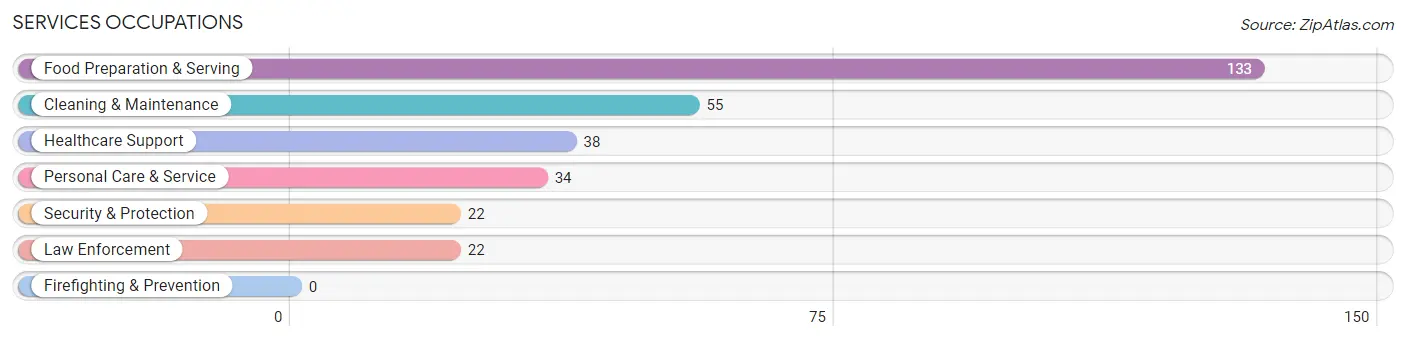
Services Occupations
The most common Services occupations in Ebensburg borough are Food Preparation & Serving (133 | 9.0%), Cleaning & Maintenance (55 | 3.7%), Healthcare Support (38 | 2.6%), Personal Care & Service (34 | 2.3%), and Security & Protection (22 | 1.5%).
Services Occupations by Sex
Within the Services occupations in Ebensburg borough, the most male-oriented occupations are Security & Protection (100.0%), Law Enforcement (100.0%), and Personal Care & Service (100.0%), while the most female-oriented occupations are Healthcare Support (100.0%), Food Preparation & Serving (58.7%), and Cleaning & Maintenance (36.4%).
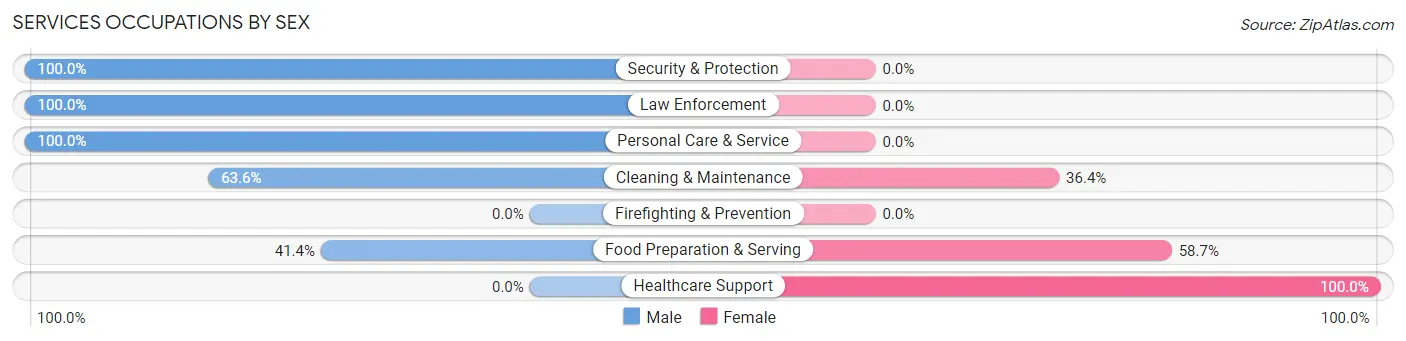
| Occupation | Male | Female |
| Healthcare Support | 0 (0.0%) | 38 (100.0%) |
| Security & Protection | 22 (100.0%) | 0 (0.0%) |
| Firefighting & Prevention | 0 (0.0%) | 0 (0.0%) |
| Law Enforcement | 22 (100.0%) | 0 (0.0%) |
| Food Preparation & Serving | 55 (41.3%) | 78 (58.7%) |
| Cleaning & Maintenance | 35 (63.6%) | 20 (36.4%) |
| Personal Care & Service | 34 (100.0%) | 0 (0.0%) |
| Total (Category) | 146 (51.8%) | 136 (48.2%) |
| Total (Overall) | 813 (55.2%) | 659 (44.8%) |
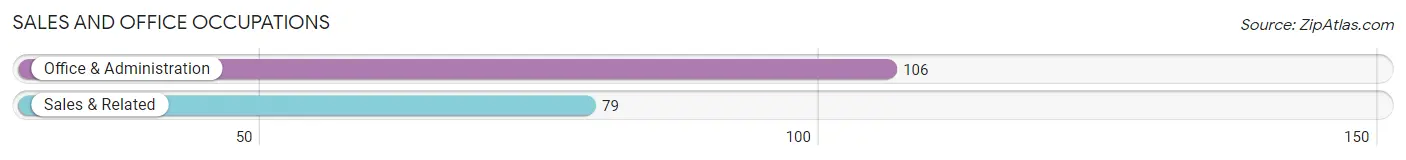
Sales and Office Occupations
The most common Sales and Office occupations in Ebensburg borough are Office & Administration (106 | 7.2%), and Sales & Related (79 | 5.4%).
Sales and Office Occupations by Sex
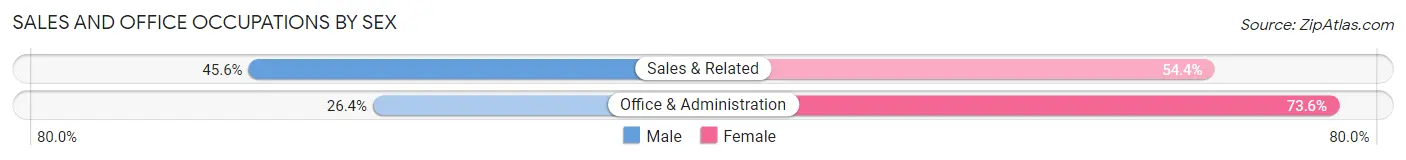
| Occupation | Male | Female |
| Sales & Related | 36 (45.6%) | 43 (54.4%) |
| Office & Administration | 28 (26.4%) | 78 (73.6%) |
| Total (Category) | 64 (34.6%) | 121 (65.4%) |
| Total (Overall) | 813 (55.2%) | 659 (44.8%) |
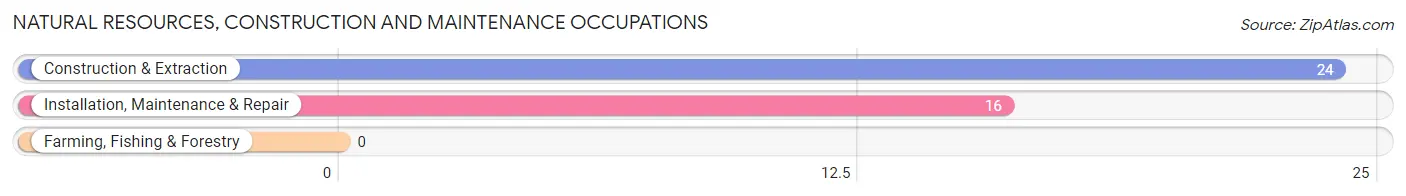
Natural Resources, Construction and Maintenance Occupations
The most common Natural Resources, Construction and Maintenance occupations in Ebensburg borough are Construction & Extraction (24 | 1.6%), and Installation, Maintenance & Repair (16 | 1.1%).
Natural Resources, Construction and Maintenance Occupations by Sex
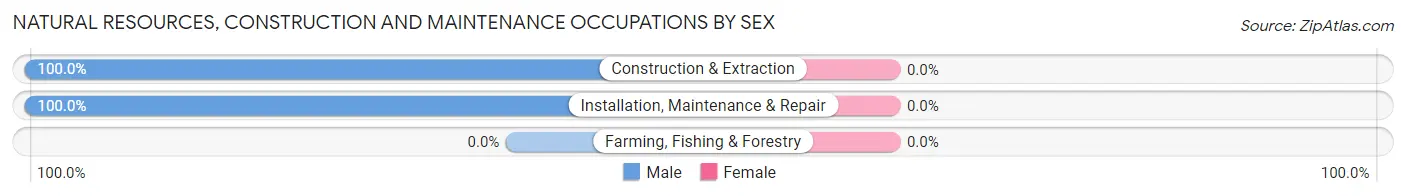
| Occupation | Male | Female |
| Farming, Fishing & Forestry | 0 (0.0%) | 0 (0.0%) |
| Construction & Extraction | 24 (100.0%) | 0 (0.0%) |
| Installation, Maintenance & Repair | 16 (100.0%) | 0 (0.0%) |
| Total (Category) | 40 (100.0%) | 0 (0.0%) |
| Total (Overall) | 813 (55.2%) | 659 (44.8%) |
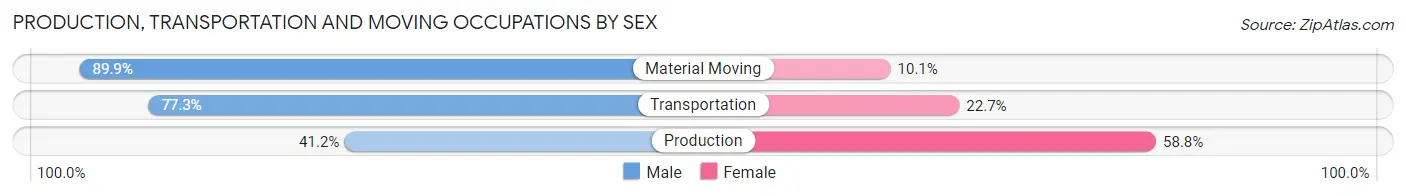
Production, Transportation and Moving Occupations
The most common Production, Transportation and Moving occupations in Ebensburg borough are Material Moving (99 | 6.7%), Production (85 | 5.8%), and Transportation (44 | 3.0%).
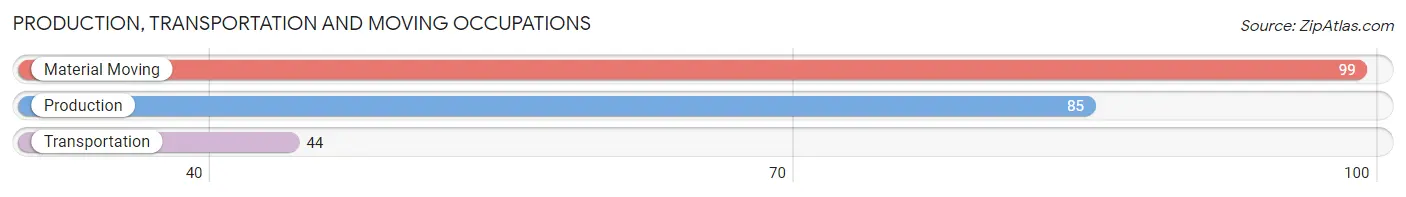
Production, Transportation and Moving Occupations by Sex
| Occupation | Male | Female |
| Production | 35 (41.2%) | 50 (58.8%) |
| Transportation | 34 (77.3%) | 10 (22.7%) |
| Material Moving | 89 (89.9%) | 10 (10.1%) |
| Total (Category) | 158 (69.3%) | 70 (30.7%) |
| Total (Overall) | 813 (55.2%) | 659 (44.8%) |
Employment Industries by Sex in Ebensburg borough
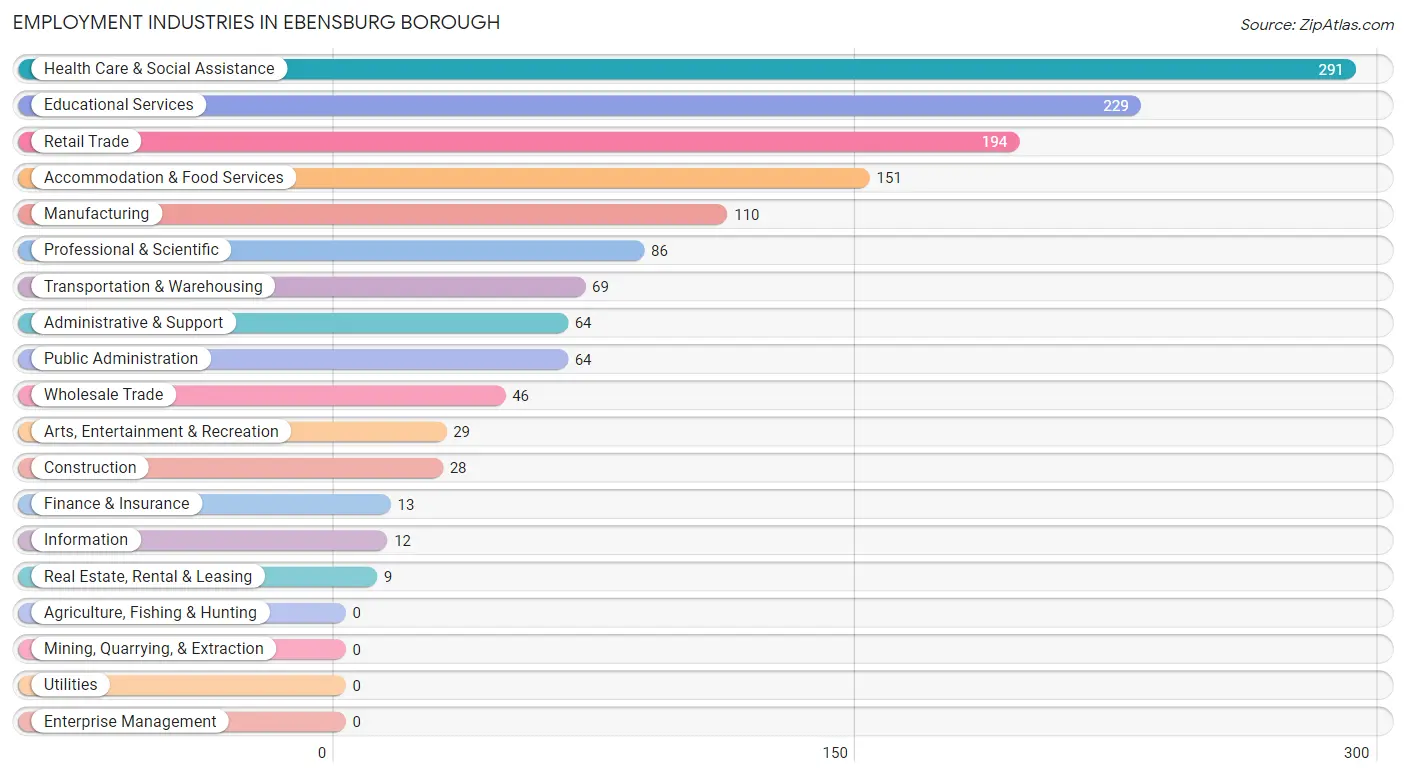
Employment Industries in Ebensburg borough
The major employment industries in Ebensburg borough include Health Care & Social Assistance (291 | 19.8%), Educational Services (229 | 15.6%), Retail Trade (194 | 13.2%), Accommodation & Food Services (151 | 10.3%), and Manufacturing (110 | 7.5%).
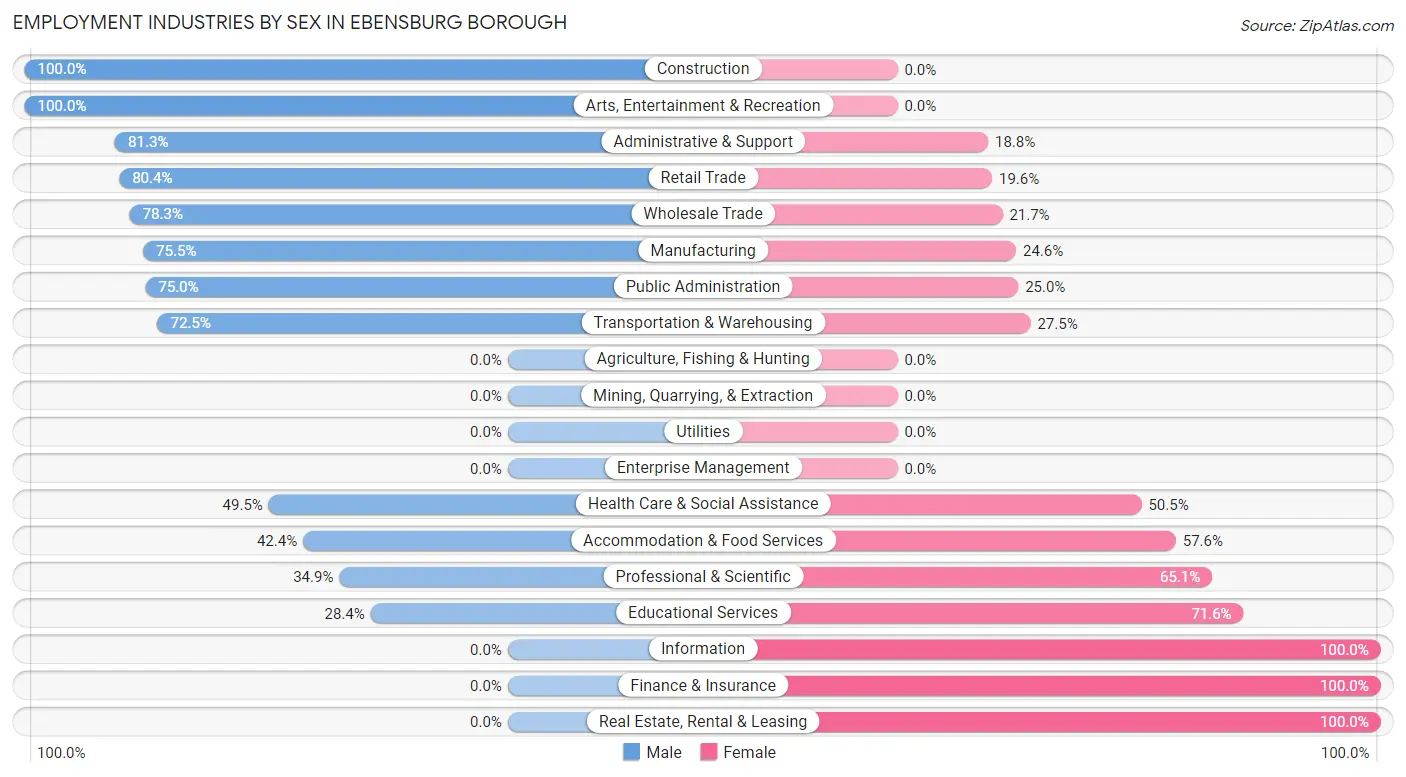
Employment Industries by Sex in Ebensburg borough
The Ebensburg borough industries that see more men than women are Construction (100.0%), Arts, Entertainment & Recreation (100.0%), and Administrative & Support (81.2%), whereas the industries that tend to have a higher number of women are Information (100.0%), Finance & Insurance (100.0%), and Real Estate, Rental & Leasing (100.0%).
| Industry | Male | Female |
| Agriculture, Fishing & Hunting | 0 (0.0%) | 0 (0.0%) |
| Mining, Quarrying, & Extraction | 0 (0.0%) | 0 (0.0%) |
| Construction | 28 (100.0%) | 0 (0.0%) |
| Manufacturing | 83 (75.4%) | 27 (24.5%) |
| Wholesale Trade | 36 (78.3%) | 10 (21.7%) |
| Retail Trade | 156 (80.4%) | 38 (19.6%) |
| Transportation & Warehousing | 50 (72.5%) | 19 (27.5%) |
| Utilities | 0 (0.0%) | 0 (0.0%) |
| Information | 0 (0.0%) | 12 (100.0%) |
| Finance & Insurance | 0 (0.0%) | 13 (100.0%) |
| Real Estate, Rental & Leasing | 0 (0.0%) | 9 (100.0%) |
| Professional & Scientific | 30 (34.9%) | 56 (65.1%) |
| Enterprise Management | 0 (0.0%) | 0 (0.0%) |
| Administrative & Support | 52 (81.2%) | 12 (18.8%) |
| Educational Services | 65 (28.4%) | 164 (71.6%) |
| Health Care & Social Assistance | 144 (49.5%) | 147 (50.5%) |
| Arts, Entertainment & Recreation | 29 (100.0%) | 0 (0.0%) |
| Accommodation & Food Services | 64 (42.4%) | 87 (57.6%) |
| Public Administration | 48 (75.0%) | 16 (25.0%) |
| Total | 813 (55.2%) | 659 (44.8%) |
Education in Ebensburg borough
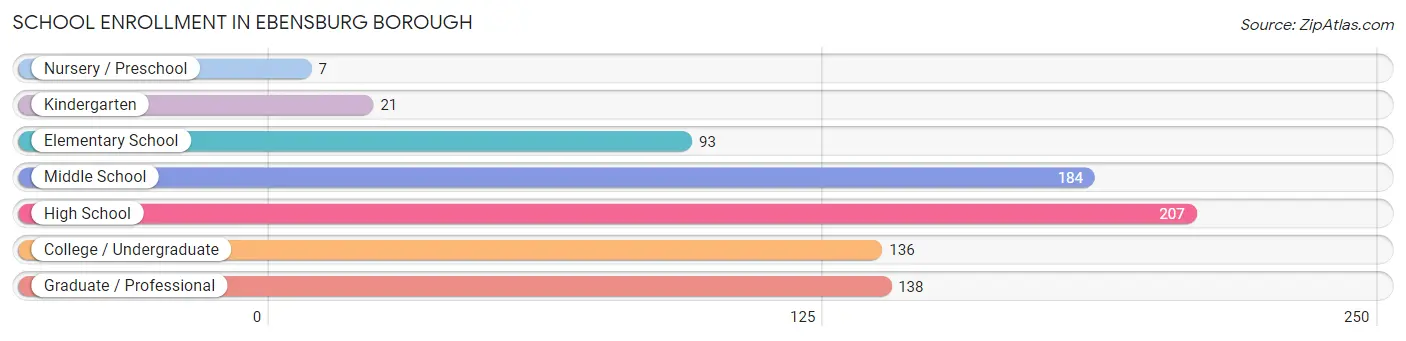
School Enrollment in Ebensburg borough
The most common levels of schooling among the 786 students in Ebensburg borough are high school (207 | 26.3%), middle school (184 | 23.4%), and graduate / professional (138 | 17.6%).
| School Level | # Students | % Students |
| Nursery / Preschool | 7 | 0.9% |
| Kindergarten | 21 | 2.7% |
| Elementary School | 93 | 11.8% |
| Middle School | 184 | 23.4% |
| High School | 207 | 26.3% |
| College / Undergraduate | 136 | 17.3% |
| Graduate / Professional | 138 | 17.6% |
| Total | 786 | 100.0% |
School Enrollment by Age by Funding Source in Ebensburg borough
Out of a total of 786 students who are enrolled in schools in Ebensburg borough, 249 (31.7%) attend a private institution, while the remaining 537 (68.3%) are enrolled in public schools. The age group of 25 to 34 year olds has the highest likelihood of being enrolled in private schools, with 66 (68.0% in the age bracket) enrolled. Conversely, the age group of 15 to 17 year olds has the lowest likelihood of being enrolled in a private school, with 195 (100.0% in the age bracket) attending a public institution.
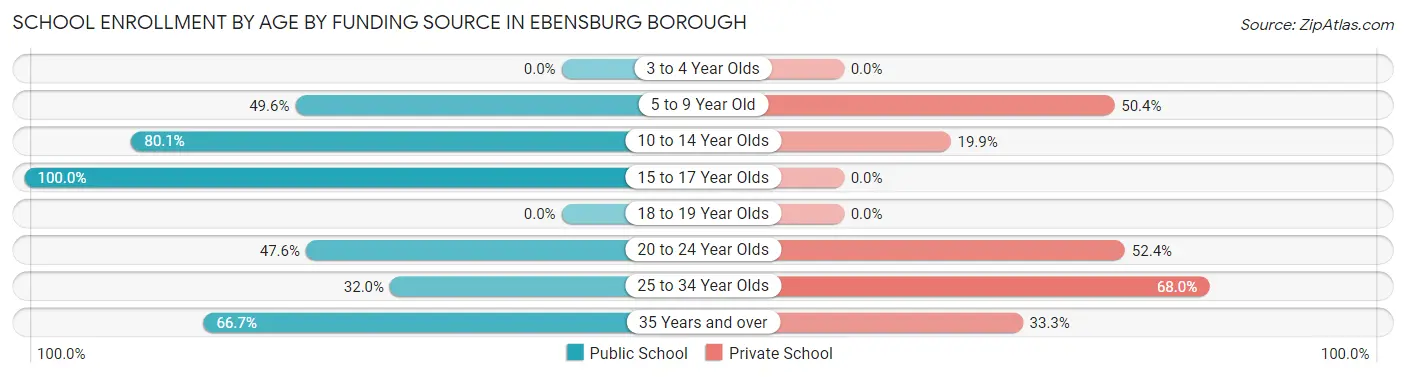
| Age Bracket | Public School | Private School |
| 3 to 4 Year Olds | 0 (0.0%) | 0 (0.0%) |
| 5 to 9 Year Old | 60 (49.6%) | 61 (50.4%) |
| 10 to 14 Year Olds | 157 (80.1%) | 39 (19.9%) |
| 15 to 17 Year Olds | 195 (100.0%) | 0 (0.0%) |
| 18 to 19 Year Olds | 0 (0.0%) | 0 (0.0%) |
| 20 to 24 Year Olds | 60 (47.6%) | 66 (52.4%) |
| 25 to 34 Year Olds | 31 (32.0%) | 66 (68.0%) |
| 35 Years and over | 34 (66.7%) | 17 (33.3%) |
| Total | 537 (68.3%) | 249 (31.7%) |
Educational Attainment by Field of Study in Ebensburg borough
Education (250 | 23.6%), business (186 | 17.5%), science & technology (147 | 13.9%), arts & humanities (126 | 11.9%), and bio, nature & agricultural (113 | 10.6%) are the most common fields of study among 1,061 individuals in Ebensburg borough who have obtained a bachelor's degree or higher.
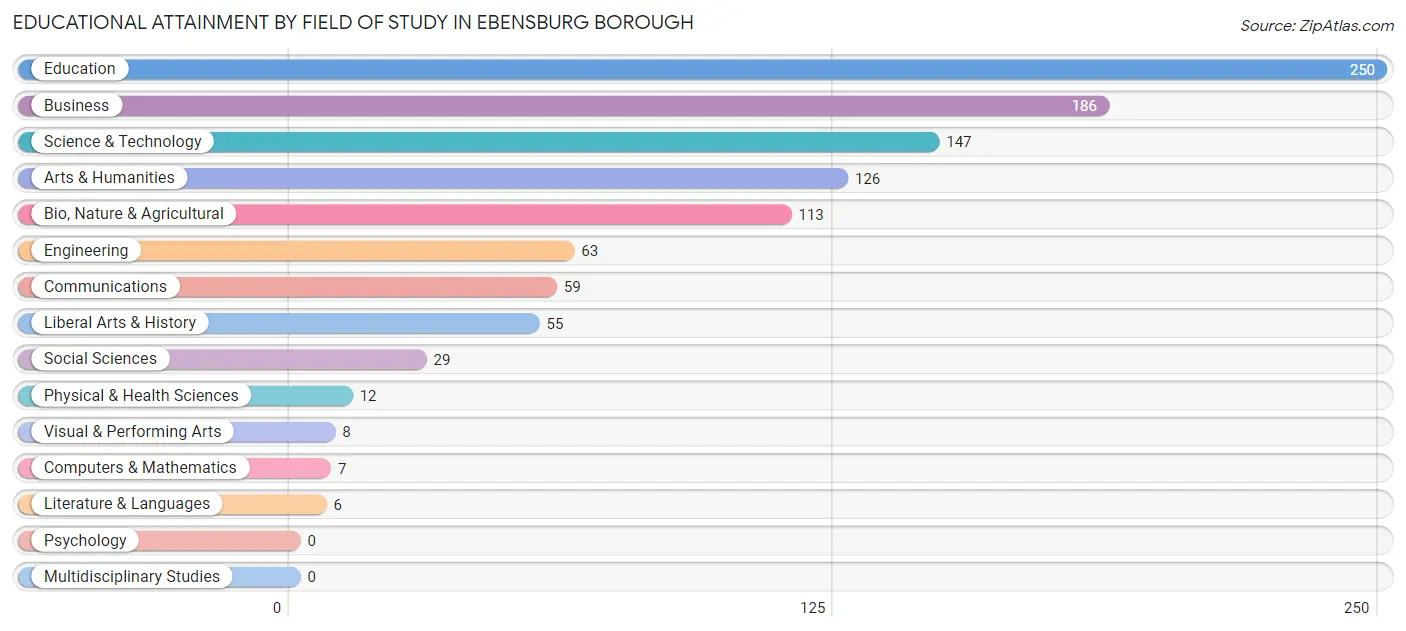
| Field of Study | # Graduates | % Graduates |
| Computers & Mathematics | 7 | 0.7% |
| Bio, Nature & Agricultural | 113 | 10.6% |
| Physical & Health Sciences | 12 | 1.1% |
| Psychology | 0 | 0.0% |
| Social Sciences | 29 | 2.7% |
| Engineering | 63 | 5.9% |
| Multidisciplinary Studies | 0 | 0.0% |
| Science & Technology | 147 | 13.9% |
| Business | 186 | 17.5% |
| Education | 250 | 23.6% |
| Literature & Languages | 6 | 0.6% |
| Liberal Arts & History | 55 | 5.2% |
| Visual & Performing Arts | 8 | 0.7% |
| Communications | 59 | 5.6% |
| Arts & Humanities | 126 | 11.9% |
| Total | 1,061 | 100.0% |
Transportation & Commute in Ebensburg borough
Vehicle Availability by Sex in Ebensburg borough
The most prevalent vehicle ownership categories in Ebensburg borough are males with 2 vehicles (446, accounting for 53.9%) and females with 2 vehicles (358, making up 67.7%).
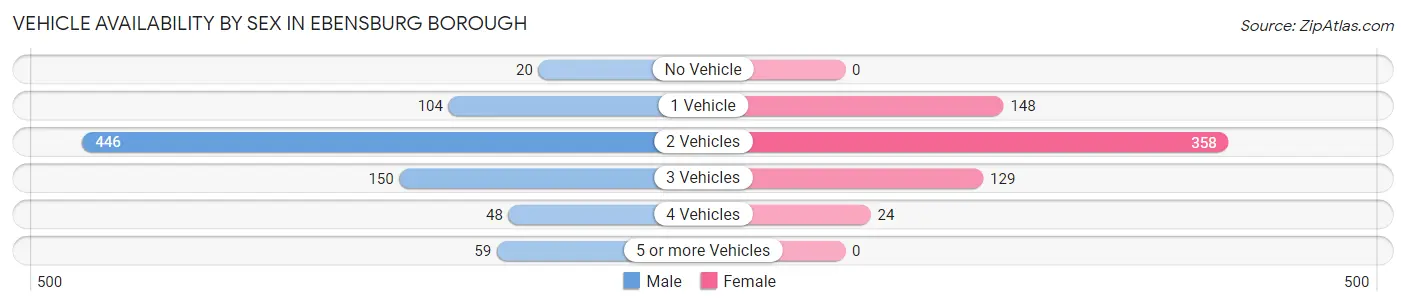
| Vehicles Available | Male | Female |
| No Vehicle | 20 (2.4%) | 0 (0.0%) |
| 1 Vehicle | 104 (12.6%) | 148 (22.5%) |
| 2 Vehicles | 446 (53.9%) | 358 (54.3%) |
| 3 Vehicles | 150 (18.1%) | 129 (19.6%) |
| 4 Vehicles | 48 (5.8%) | 24 (3.6%) |
| 5 or more Vehicles | 59 (7.1%) | 0 (0.0%) |
| Total | 827 (100.0%) | 659 (100.0%) |
Commute Time in Ebensburg borough
The most frequently occuring commute durations in Ebensburg borough are 5 to 9 minutes (416 commuters, 30.6%), 30 to 34 minutes (185 commuters, 13.6%), and 45 to 59 minutes (157 commuters, 11.5%).
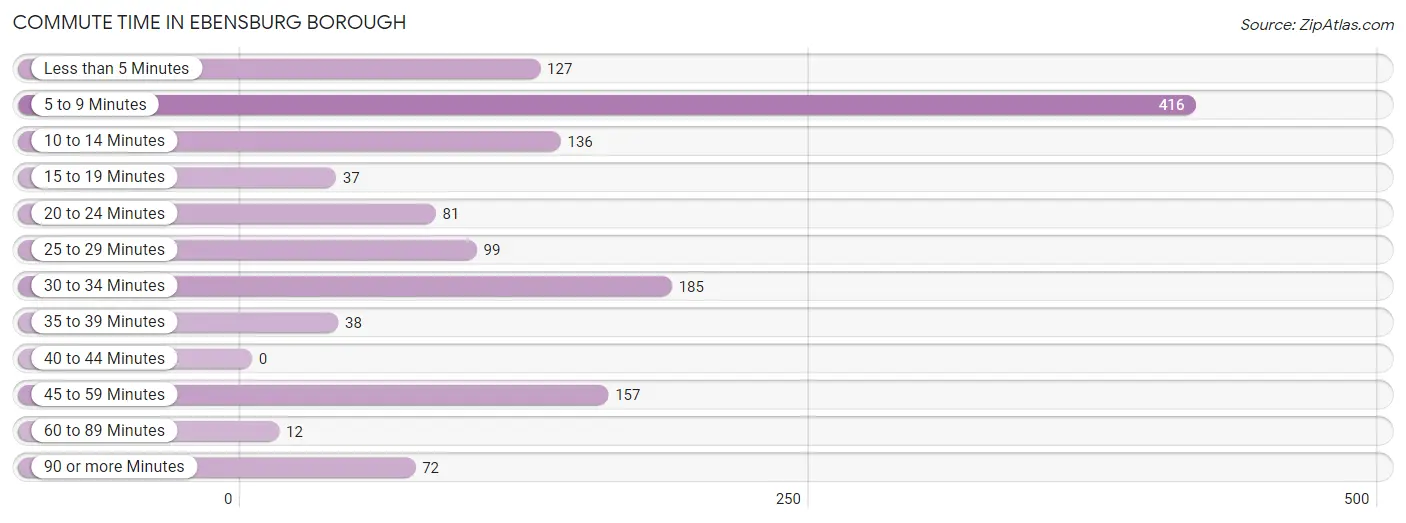
| Commute Time | # Commuters | % Commuters |
| Less than 5 Minutes | 127 | 9.3% |
| 5 to 9 Minutes | 416 | 30.6% |
| 10 to 14 Minutes | 136 | 10.0% |
| 15 to 19 Minutes | 37 | 2.7% |
| 20 to 24 Minutes | 81 | 6.0% |
| 25 to 29 Minutes | 99 | 7.3% |
| 30 to 34 Minutes | 185 | 13.6% |
| 35 to 39 Minutes | 38 | 2.8% |
| 40 to 44 Minutes | 0 | 0.0% |
| 45 to 59 Minutes | 157 | 11.5% |
| 60 to 89 Minutes | 12 | 0.9% |
| 90 or more Minutes | 72 | 5.3% |
Commute Time by Sex in Ebensburg borough
The most common commute times in Ebensburg borough are 5 to 9 minutes (223 commuters, 28.1%) for males and 5 to 9 minutes (193 commuters, 34.0%) for females.
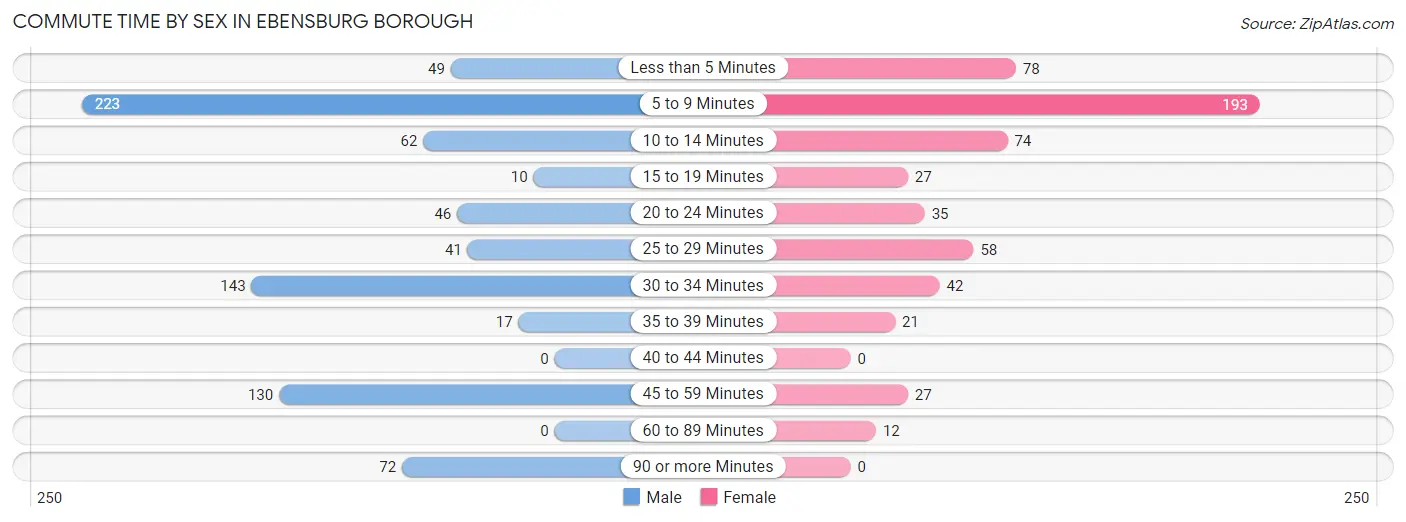
| Commute Time | Male | Female |
| Less than 5 Minutes | 49 (6.2%) | 78 (13.8%) |
| 5 to 9 Minutes | 223 (28.1%) | 193 (34.0%) |
| 10 to 14 Minutes | 62 (7.8%) | 74 (13.1%) |
| 15 to 19 Minutes | 10 (1.3%) | 27 (4.8%) |
| 20 to 24 Minutes | 46 (5.8%) | 35 (6.2%) |
| 25 to 29 Minutes | 41 (5.2%) | 58 (10.2%) |
| 30 to 34 Minutes | 143 (18.0%) | 42 (7.4%) |
| 35 to 39 Minutes | 17 (2.1%) | 21 (3.7%) |
| 40 to 44 Minutes | 0 (0.0%) | 0 (0.0%) |
| 45 to 59 Minutes | 130 (16.4%) | 27 (4.8%) |
| 60 to 89 Minutes | 0 (0.0%) | 12 (2.1%) |
| 90 or more Minutes | 72 (9.1%) | 0 (0.0%) |
Time of Departure to Work by Sex in Ebensburg borough
The most frequent times of departure to work in Ebensburg borough are 7:00 AM to 7:29 AM (142, 17.9%) for males and 8:00 AM to 8:29 AM (158, 27.9%) for females.
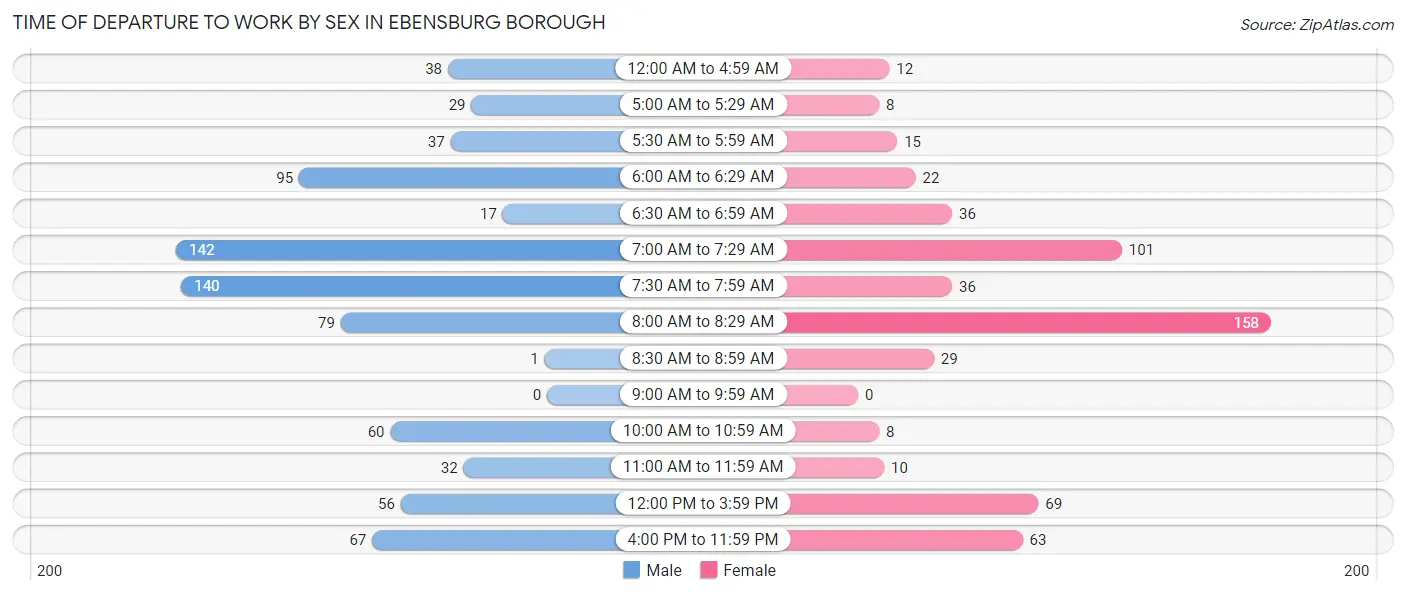
| Time of Departure | Male | Female |
| 12:00 AM to 4:59 AM | 38 (4.8%) | 12 (2.1%) |
| 5:00 AM to 5:29 AM | 29 (3.7%) | 8 (1.4%) |
| 5:30 AM to 5:59 AM | 37 (4.7%) | 15 (2.6%) |
| 6:00 AM to 6:29 AM | 95 (12.0%) | 22 (3.9%) |
| 6:30 AM to 6:59 AM | 17 (2.1%) | 36 (6.4%) |
| 7:00 AM to 7:29 AM | 142 (17.9%) | 101 (17.8%) |
| 7:30 AM to 7:59 AM | 140 (17.6%) | 36 (6.4%) |
| 8:00 AM to 8:29 AM | 79 (10.0%) | 158 (27.9%) |
| 8:30 AM to 8:59 AM | 1 (0.1%) | 29 (5.1%) |
| 9:00 AM to 9:59 AM | 0 (0.0%) | 0 (0.0%) |
| 10:00 AM to 10:59 AM | 60 (7.6%) | 8 (1.4%) |
| 11:00 AM to 11:59 AM | 32 (4.0%) | 10 (1.8%) |
| 12:00 PM to 3:59 PM | 56 (7.1%) | 69 (12.2%) |
| 4:00 PM to 11:59 PM | 67 (8.5%) | 63 (11.1%) |
| Total | 793 (100.0%) | 567 (100.0%) |
Housing Occupancy in Ebensburg borough
Occupancy by Ownership in Ebensburg borough
Of the total 1,636 dwellings in Ebensburg borough, owner-occupied units account for 1,015 (62.0%), while renter-occupied units make up 621 (38.0%).
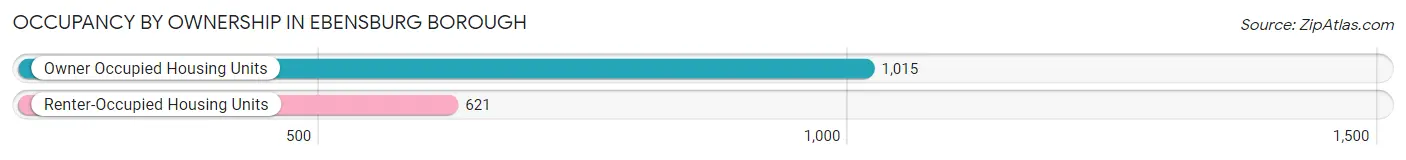
| Occupancy | # Housing Units | % Housing Units |
| Owner Occupied Housing Units | 1,015 | 62.0% |
| Renter-Occupied Housing Units | 621 | 38.0% |
| Total Occupied Housing Units | 1,636 | 100.0% |
Occupancy by Household Size in Ebensburg borough
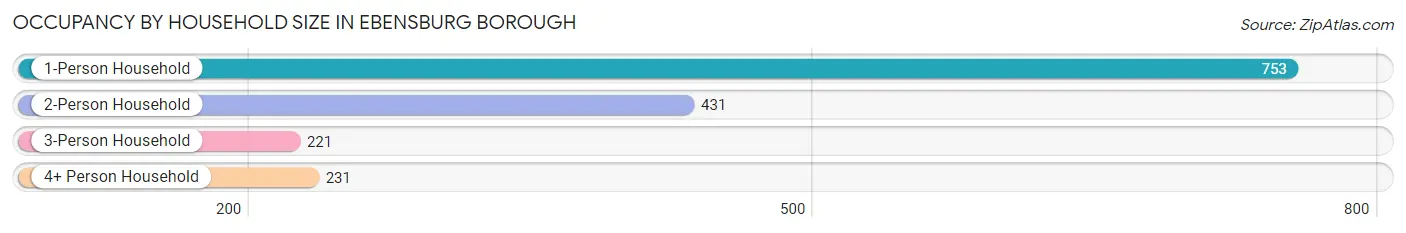
| Household Size | # Housing Units | % Housing Units |
| 1-Person Household | 753 | 46.0% |
| 2-Person Household | 431 | 26.3% |
| 3-Person Household | 221 | 13.5% |
| 4+ Person Household | 231 | 14.1% |
| Total Housing Units | 1,636 | 100.0% |
Occupancy by Ownership by Household Size in Ebensburg borough
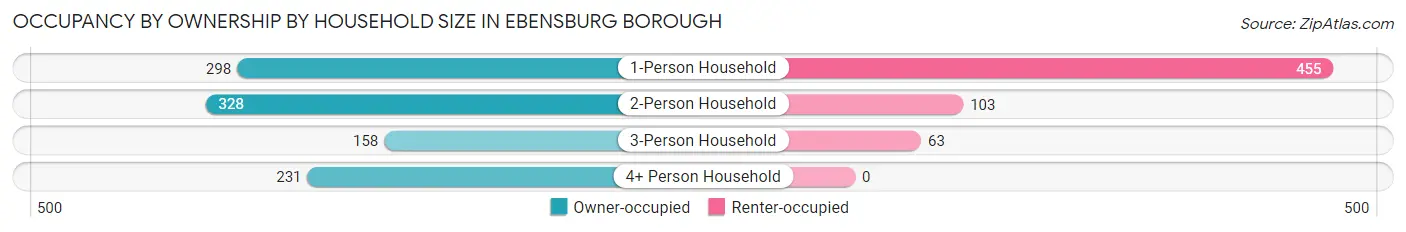
| Household Size | Owner-occupied | Renter-occupied |
| 1-Person Household | 298 (39.6%) | 455 (60.4%) |
| 2-Person Household | 328 (76.1%) | 103 (23.9%) |
| 3-Person Household | 158 (71.5%) | 63 (28.5%) |
| 4+ Person Household | 231 (100.0%) | 0 (0.0%) |
| Total Housing Units | 1,015 (62.0%) | 621 (38.0%) |
Occupancy by Educational Attainment in Ebensburg borough
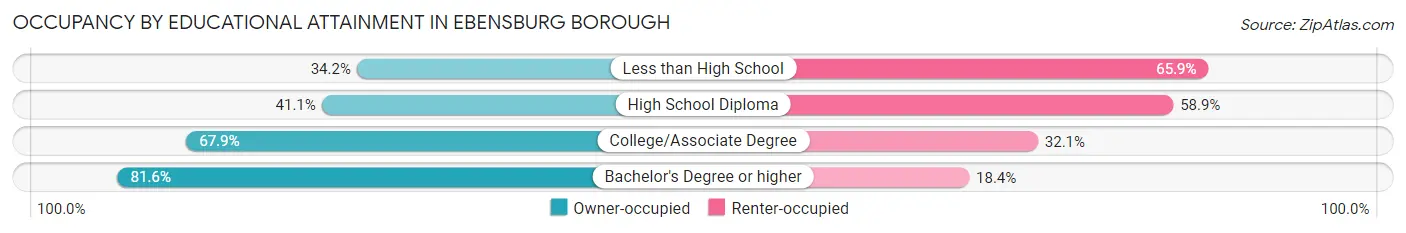
| Household Size | Owner-occupied | Renter-occupied |
| Less than High School | 28 (34.2%) | 54 (65.8%) |
| High School Diploma | 238 (41.1%) | 341 (58.9%) |
| College/Associate Degree | 231 (67.9%) | 109 (32.1%) |
| Bachelor's Degree or higher | 518 (81.6%) | 117 (18.4%) |
Occupancy by Age of Householder in Ebensburg borough
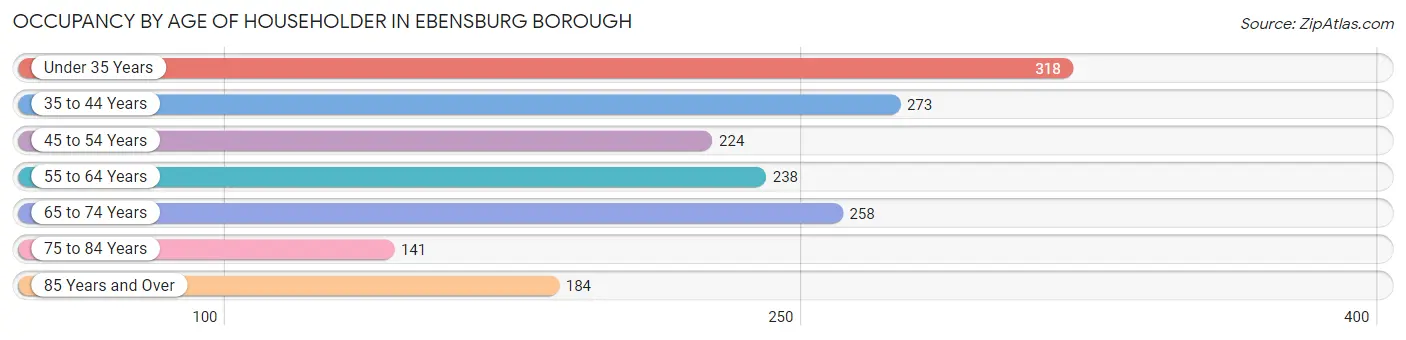
| Age Bracket | # Households | % Households |
| Under 35 Years | 318 | 19.4% |
| 35 to 44 Years | 273 | 16.7% |
| 45 to 54 Years | 224 | 13.7% |
| 55 to 64 Years | 238 | 14.5% |
| 65 to 74 Years | 258 | 15.8% |
| 75 to 84 Years | 141 | 8.6% |
| 85 Years and Over | 184 | 11.3% |
| Total | 1,636 | 100.0% |
Housing Finances in Ebensburg borough
Median Income by Occupancy in Ebensburg borough
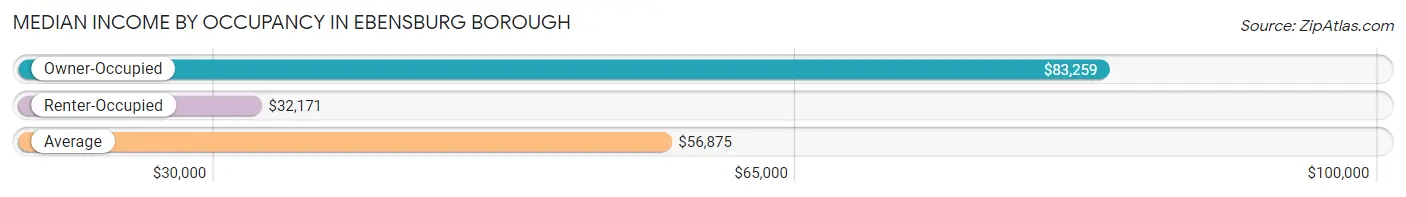
| Occupancy Type | # Households | Median Income |
| Owner-Occupied | 1,015 (62.0%) | $83,259 |
| Renter-Occupied | 621 (38.0%) | $32,171 |
| Average | 1,636 (100.0%) | $56,875 |
Occupancy by Householder Income Bracket in Ebensburg borough
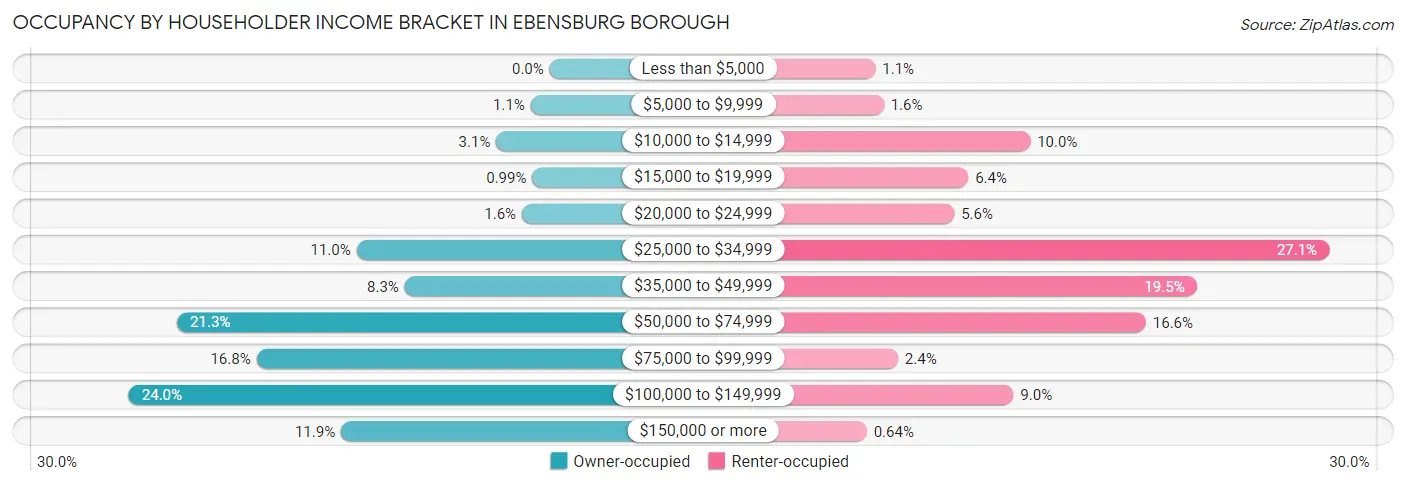
| Income Bracket | Owner-occupied | Renter-occupied |
| Less than $5,000 | 0 (0.0%) | 7 (1.1%) |
| $5,000 to $9,999 | 11 (1.1%) | 10 (1.6%) |
| $10,000 to $14,999 | 31 (3.0%) | 62 (10.0%) |
| $15,000 to $19,999 | 10 (1.0%) | 40 (6.4%) |
| $20,000 to $24,999 | 16 (1.6%) | 35 (5.6%) |
| $25,000 to $34,999 | 112 (11.0%) | 168 (27.1%) |
| $35,000 to $49,999 | 84 (8.3%) | 121 (19.5%) |
| $50,000 to $74,999 | 216 (21.3%) | 103 (16.6%) |
| $75,000 to $99,999 | 170 (16.8%) | 15 (2.4%) |
| $100,000 to $149,999 | 244 (24.0%) | 56 (9.0%) |
| $150,000 or more | 121 (11.9%) | 4 (0.6%) |
| Total | 1,015 (100.0%) | 621 (100.0%) |
Monthly Housing Cost Tiers in Ebensburg borough
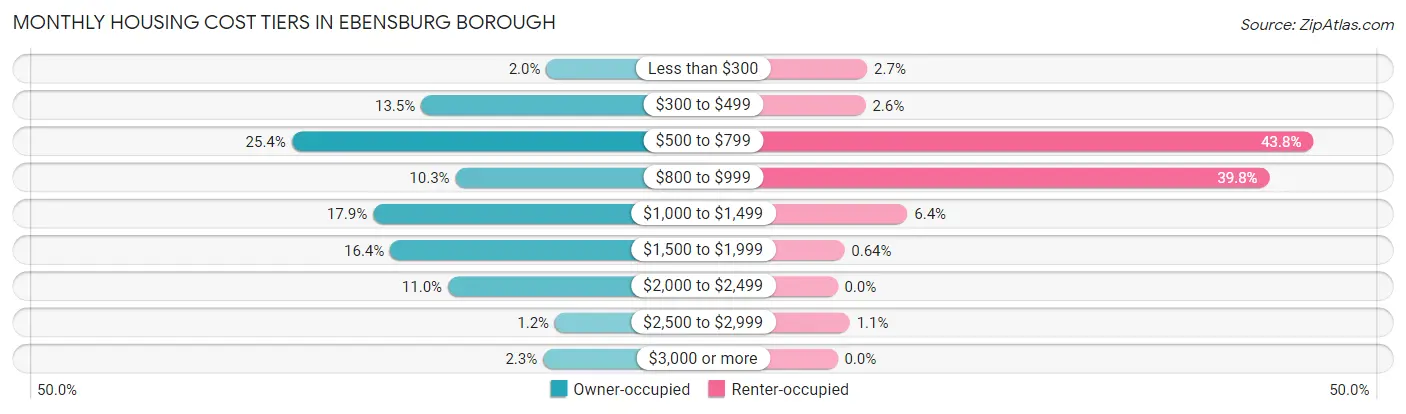
| Monthly Cost | Owner-occupied | Renter-occupied |
| Less than $300 | 20 (2.0%) | 17 (2.7%) |
| $300 to $499 | 137 (13.5%) | 16 (2.6%) |
| $500 to $799 | 258 (25.4%) | 272 (43.8%) |
| $800 to $999 | 105 (10.3%) | 247 (39.8%) |
| $1,000 to $1,499 | 182 (17.9%) | 40 (6.4%) |
| $1,500 to $1,999 | 166 (16.4%) | 4 (0.6%) |
| $2,000 to $2,499 | 112 (11.0%) | 0 (0.0%) |
| $2,500 to $2,999 | 12 (1.2%) | 7 (1.1%) |
| $3,000 or more | 23 (2.3%) | 0 (0.0%) |
| Total | 1,015 (100.0%) | 621 (100.0%) |
Physical Housing Characteristics in Ebensburg borough
Housing Structures in Ebensburg borough
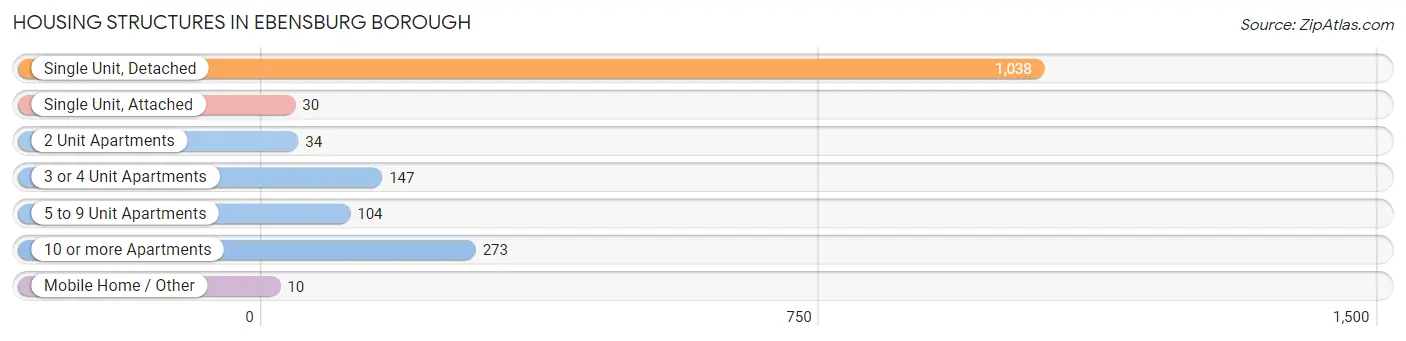
| Structure Type | # Housing Units | % Housing Units |
| Single Unit, Detached | 1,038 | 63.4% |
| Single Unit, Attached | 30 | 1.8% |
| 2 Unit Apartments | 34 | 2.1% |
| 3 or 4 Unit Apartments | 147 | 9.0% |
| 5 to 9 Unit Apartments | 104 | 6.4% |
| 10 or more Apartments | 273 | 16.7% |
| Mobile Home / Other | 10 | 0.6% |
| Total | 1,636 | 100.0% |
Housing Structures by Occupancy in Ebensburg borough
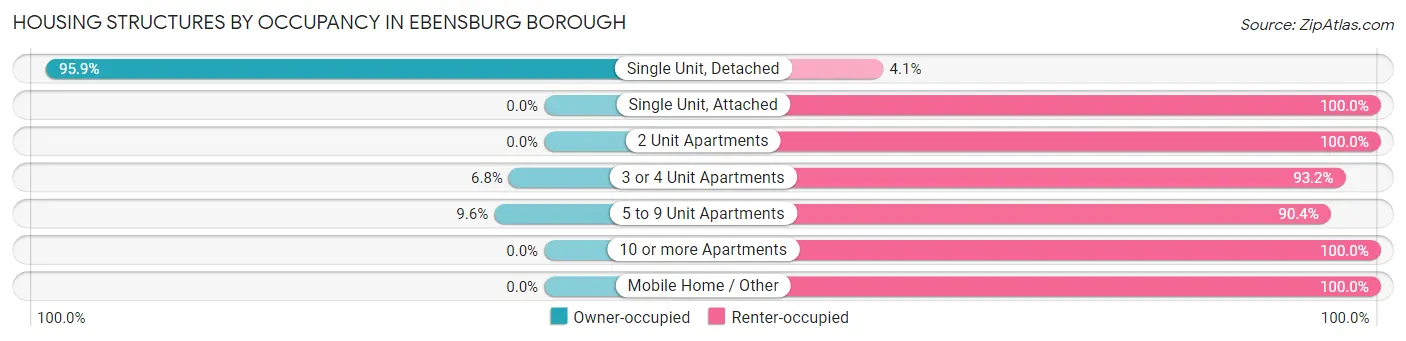
| Structure Type | Owner-occupied | Renter-occupied |
| Single Unit, Detached | 995 (95.9%) | 43 (4.1%) |
| Single Unit, Attached | 0 (0.0%) | 30 (100.0%) |
| 2 Unit Apartments | 0 (0.0%) | 34 (100.0%) |
| 3 or 4 Unit Apartments | 10 (6.8%) | 137 (93.2%) |
| 5 to 9 Unit Apartments | 10 (9.6%) | 94 (90.4%) |
| 10 or more Apartments | 0 (0.0%) | 273 (100.0%) |
| Mobile Home / Other | 0 (0.0%) | 10 (100.0%) |
| Total | 1,015 (62.0%) | 621 (38.0%) |
Housing Structures by Number of Rooms in Ebensburg borough
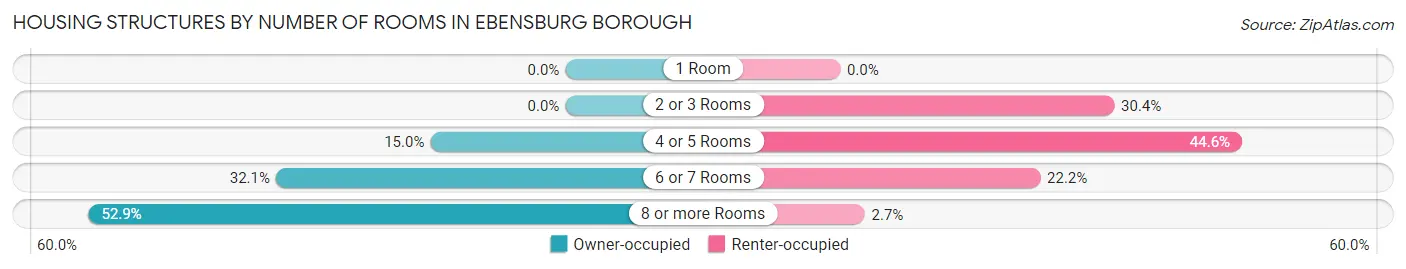
| Number of Rooms | Owner-occupied | Renter-occupied |
| 1 Room | 0 (0.0%) | 0 (0.0%) |
| 2 or 3 Rooms | 0 (0.0%) | 189 (30.4%) |
| 4 or 5 Rooms | 152 (15.0%) | 277 (44.6%) |
| 6 or 7 Rooms | 326 (32.1%) | 138 (22.2%) |
| 8 or more Rooms | 537 (52.9%) | 17 (2.7%) |
| Total | 1,015 (100.0%) | 621 (100.0%) |
Housing Structure by Heating Type in Ebensburg borough
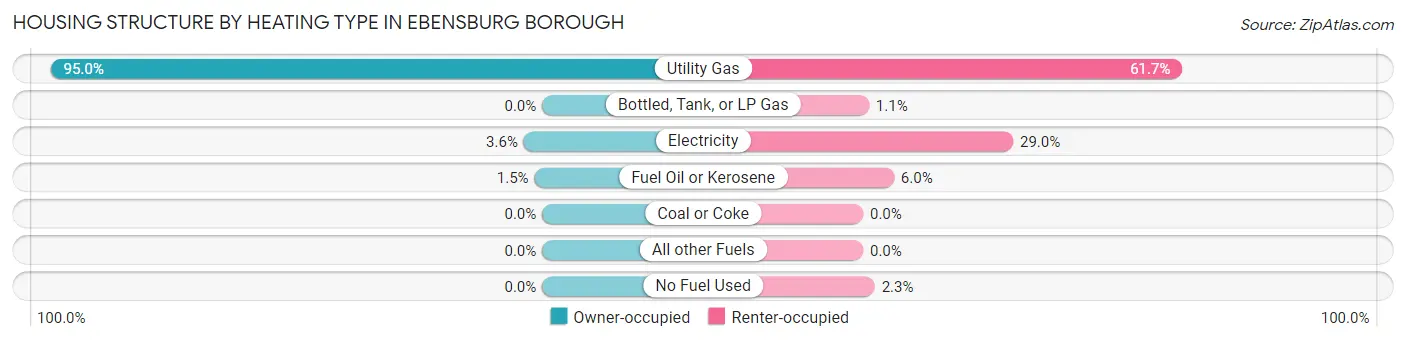
| Heating Type | Owner-occupied | Renter-occupied |
| Utility Gas | 964 (95.0%) | 383 (61.7%) |
| Bottled, Tank, or LP Gas | 0 (0.0%) | 7 (1.1%) |
| Electricity | 36 (3.5%) | 180 (29.0%) |
| Fuel Oil or Kerosene | 15 (1.5%) | 37 (6.0%) |
| Coal or Coke | 0 (0.0%) | 0 (0.0%) |
| All other Fuels | 0 (0.0%) | 0 (0.0%) |
| No Fuel Used | 0 (0.0%) | 14 (2.2%) |
| Total | 1,015 (100.0%) | 621 (100.0%) |
Household Vehicle Usage in Ebensburg borough
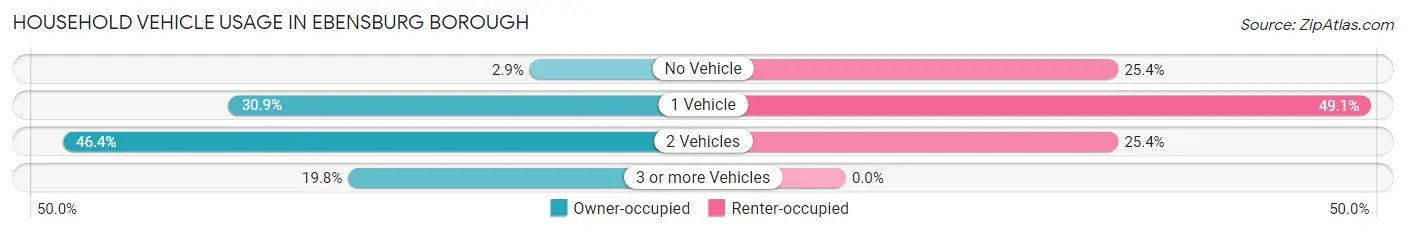
| Vehicles per Household | Owner-occupied | Renter-occupied |
| No Vehicle | 29 (2.9%) | 158 (25.4%) |
| 1 Vehicle | 314 (30.9%) | 305 (49.1%) |
| 2 Vehicles | 471 (46.4%) | 158 (25.4%) |
| 3 or more Vehicles | 201 (19.8%) | 0 (0.0%) |
| Total | 1,015 (100.0%) | 621 (100.0%) |
Real Estate & Mortgages in Ebensburg borough
Real Estate and Mortgage Overview in Ebensburg borough
| Characteristic | Without Mortgage | With Mortgage |
| Housing Units | 474 | 541 |
| Median Property Value | $139,200 | $184,100 |
| Median Household Income | $53,750 | $87 |
| Monthly Housing Costs | $566 | $16 |
| Real Estate Taxes | $1,689 | $0 |
Property Value by Mortgage Status in Ebensburg borough
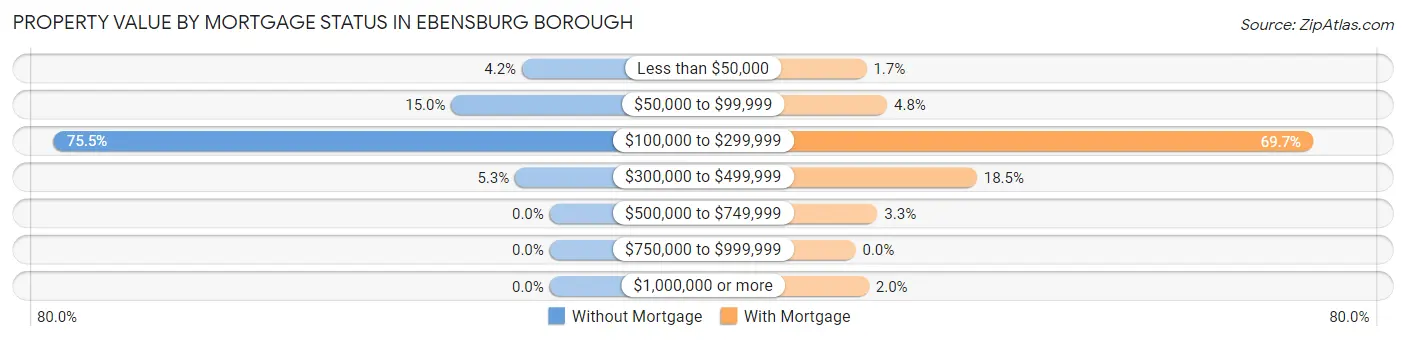
| Property Value | Without Mortgage | With Mortgage |
| Less than $50,000 | 20 (4.2%) | 9 (1.7%) |
| $50,000 to $99,999 | 71 (15.0%) | 26 (4.8%) |
| $100,000 to $299,999 | 358 (75.5%) | 377 (69.7%) |
| $300,000 to $499,999 | 25 (5.3%) | 100 (18.5%) |
| $500,000 to $749,999 | 0 (0.0%) | 18 (3.3%) |
| $750,000 to $999,999 | 0 (0.0%) | 0 (0.0%) |
| $1,000,000 or more | 0 (0.0%) | 11 (2.0%) |
| Total | 474 (100.0%) | 541 (100.0%) |
Household Income by Mortgage Status in Ebensburg borough
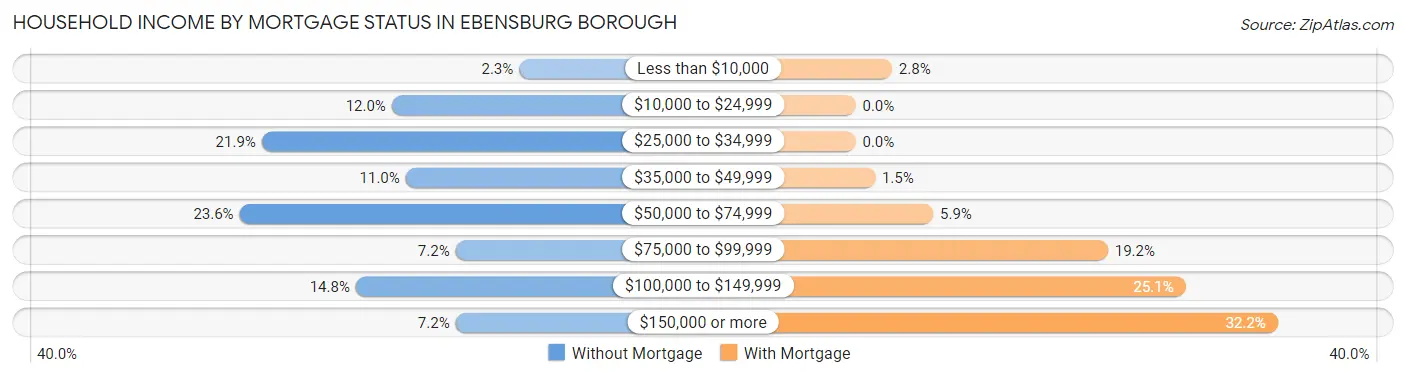
| Household Income | Without Mortgage | With Mortgage |
| Less than $10,000 | 11 (2.3%) | 15 (2.8%) |
| $10,000 to $24,999 | 57 (12.0%) | 0 (0.0%) |
| $25,000 to $34,999 | 104 (21.9%) | 0 (0.0%) |
| $35,000 to $49,999 | 52 (11.0%) | 8 (1.5%) |
| $50,000 to $74,999 | 112 (23.6%) | 32 (5.9%) |
| $75,000 to $99,999 | 34 (7.2%) | 104 (19.2%) |
| $100,000 to $149,999 | 70 (14.8%) | 136 (25.1%) |
| $150,000 or more | 34 (7.2%) | 174 (32.2%) |
| Total | 474 (100.0%) | 541 (100.0%) |
Property Value to Household Income Ratio in Ebensburg borough
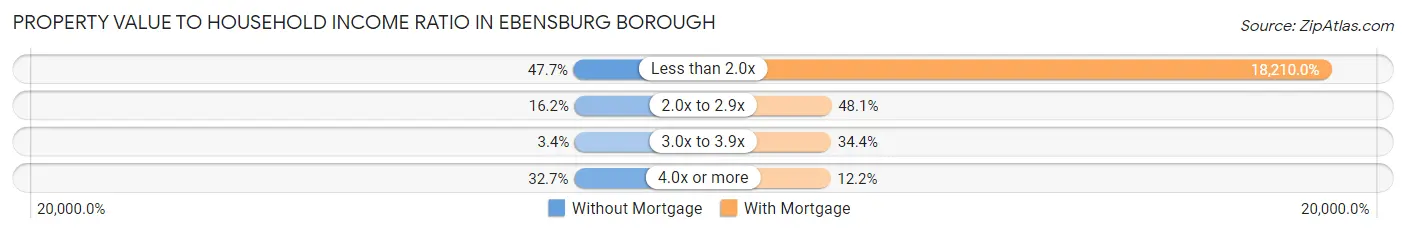
| Value-to-Income Ratio | Without Mortgage | With Mortgage |
| Less than 2.0x | 226 (47.7%) | 98,516 (18,210.0%) |
| 2.0x to 2.9x | 77 (16.2%) | 260 (48.1%) |
| 3.0x to 3.9x | 16 (3.4%) | 186 (34.4%) |
| 4.0x or more | 155 (32.7%) | 66 (12.2%) |
| Total | 474 (100.0%) | 541 (100.0%) |
Real Estate Taxes by Mortgage Status in Ebensburg borough
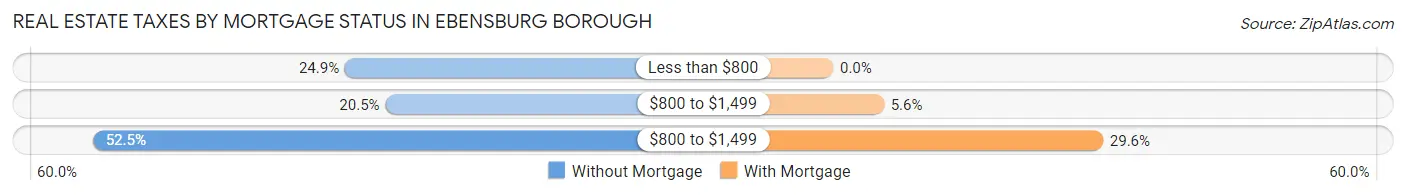
| Property Taxes | Without Mortgage | With Mortgage |
| Less than $800 | 118 (24.9%) | 0 (0.0%) |
| $800 to $1,499 | 97 (20.5%) | 30 (5.6%) |
| $800 to $1,499 | 249 (52.5%) | 160 (29.6%) |
| Total | 474 (100.0%) | 541 (100.0%) |
Health & Disability in Ebensburg borough
Health Insurance Coverage by Age in Ebensburg borough
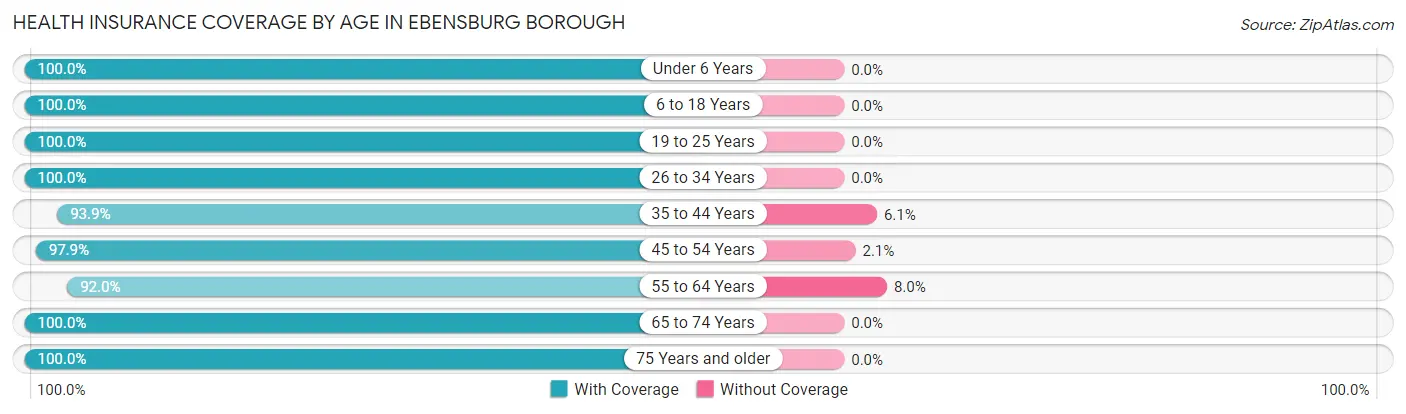
| Age Bracket | With Coverage | Without Coverage |
| Under 6 Years | 165 (100.0%) | 0 (0.0%) |
| 6 to 18 Years | 517 (100.0%) | 0 (0.0%) |
| 19 to 25 Years | 433 (100.0%) | 0 (0.0%) |
| 26 to 34 Years | 314 (100.0%) | 0 (0.0%) |
| 35 to 44 Years | 416 (93.9%) | 27 (6.1%) |
| 45 to 54 Years | 327 (97.9%) | 7 (2.1%) |
| 55 to 64 Years | 347 (92.0%) | 30 (8.0%) |
| 65 to 74 Years | 358 (100.0%) | 0 (0.0%) |
| 75 Years and older | 407 (100.0%) | 0 (0.0%) |
| Total | 3,284 (98.1%) | 64 (1.9%) |
Health Insurance Coverage by Citizenship Status in Ebensburg borough
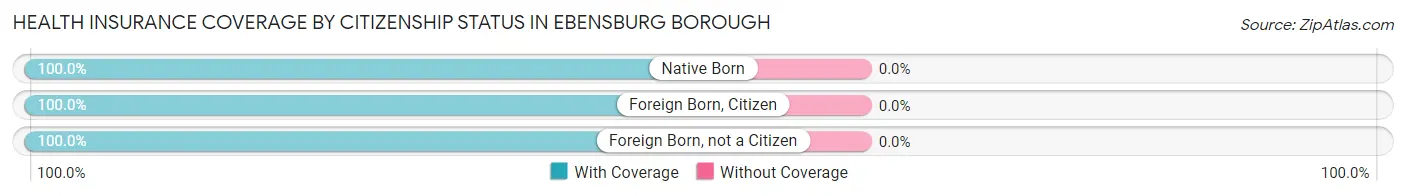
| Citizenship Status | With Coverage | Without Coverage |
| Native Born | 165 (100.0%) | 0 (0.0%) |
| Foreign Born, Citizen | 517 (100.0%) | 0 (0.0%) |
| Foreign Born, not a Citizen | 433 (100.0%) | 0 (0.0%) |
Health Insurance Coverage by Household Income in Ebensburg borough
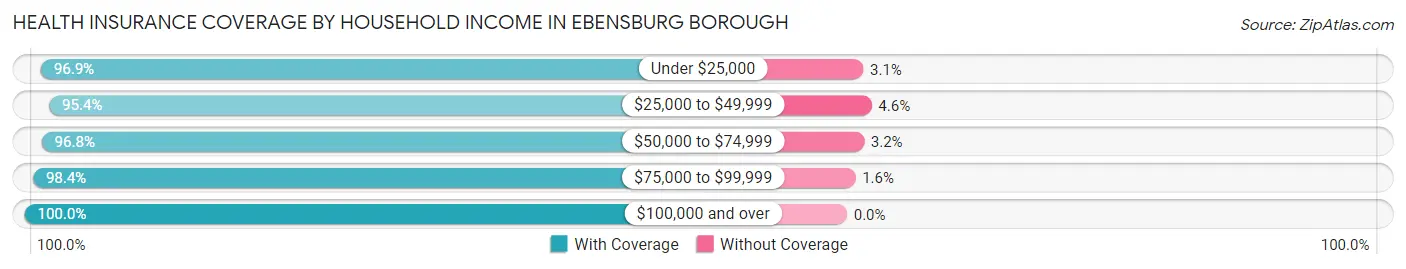
| Household Income | With Coverage | Without Coverage |
| Under $25,000 | 222 (96.9%) | 7 (3.1%) |
| $25,000 to $49,999 | 621 (95.4%) | 30 (4.6%) |
| $50,000 to $74,999 | 605 (96.8%) | 20 (3.2%) |
| $75,000 to $99,999 | 438 (98.4%) | 7 (1.6%) |
| $100,000 and over | 1,387 (100.0%) | 0 (0.0%) |
Public vs Private Health Insurance Coverage by Age in Ebensburg borough
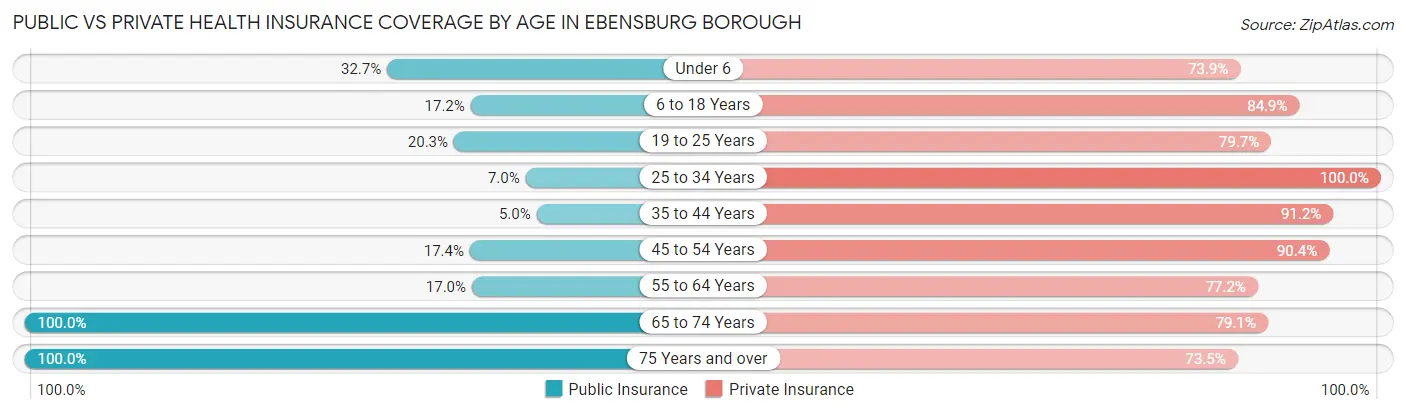
| Age Bracket | Public Insurance | Private Insurance |
| Under 6 | 54 (32.7%) | 122 (73.9%) |
| 6 to 18 Years | 89 (17.2%) | 439 (84.9%) |
| 19 to 25 Years | 88 (20.3%) | 345 (79.7%) |
| 25 to 34 Years | 22 (7.0%) | 314 (100.0%) |
| 35 to 44 Years | 22 (5.0%) | 404 (91.2%) |
| 45 to 54 Years | 58 (17.4%) | 302 (90.4%) |
| 55 to 64 Years | 64 (17.0%) | 291 (77.2%) |
| 65 to 74 Years | 358 (100.0%) | 283 (79.0%) |
| 75 Years and over | 407 (100.0%) | 299 (73.5%) |
| Total | 1,162 (34.7%) | 2,799 (83.6%) |
Disability Status by Sex by Age in Ebensburg borough
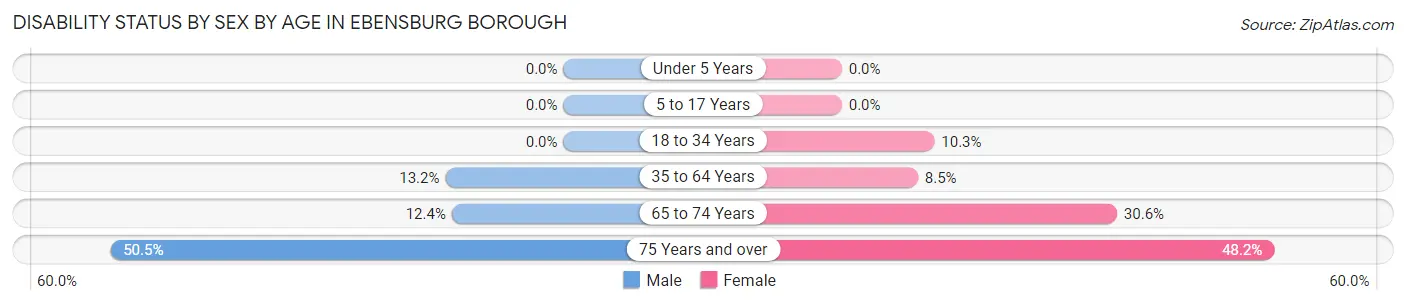
| Age Bracket | Male | Female |
| Under 5 Years | 0 (0.0%) | 0 (0.0%) |
| 5 to 17 Years | 0 (0.0%) | 0 (0.0%) |
| 18 to 34 Years | 0 (0.0%) | 33 (10.3%) |
| 35 to 64 Years | 71 (13.2%) | 52 (8.5%) |
| 65 to 74 Years | 23 (12.4%) | 53 (30.6%) |
| 75 Years and over | 110 (50.5%) | 91 (48.1%) |
Disability Class by Sex by Age in Ebensburg borough
Disability Class: Hearing Difficulty
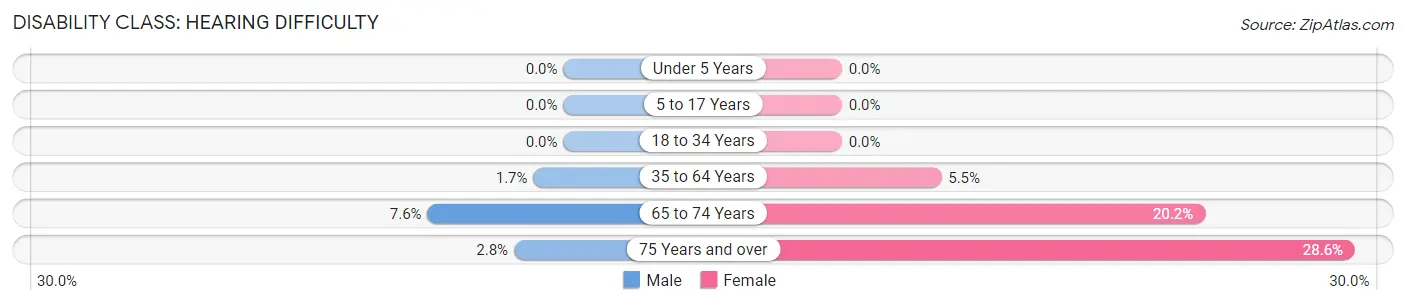
| Age Bracket | Male | Female |
| Under 5 Years | 0 (0.0%) | 0 (0.0%) |
| 5 to 17 Years | 0 (0.0%) | 0 (0.0%) |
| 18 to 34 Years | 0 (0.0%) | 0 (0.0%) |
| 35 to 64 Years | 9 (1.7%) | 34 (5.5%) |
| 65 to 74 Years | 14 (7.6%) | 35 (20.2%) |
| 75 Years and over | 6 (2.8%) | 54 (28.6%) |
Disability Class: Vision Difficulty
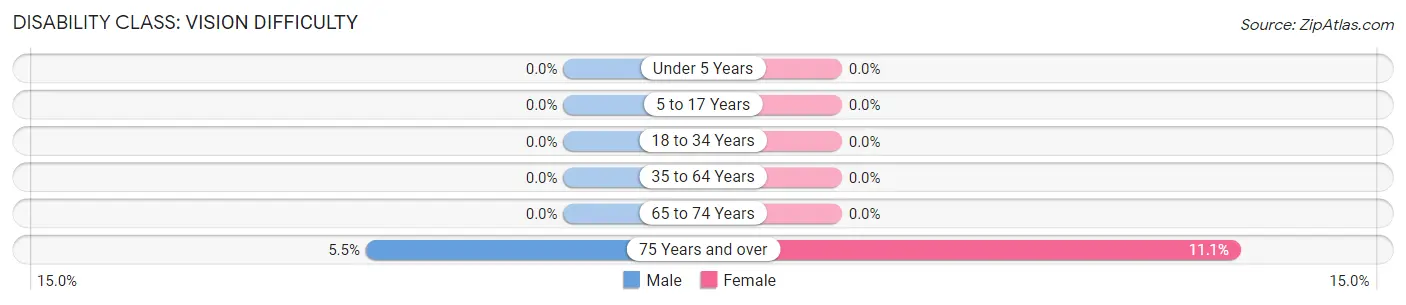
| Age Bracket | Male | Female |
| Under 5 Years | 0 (0.0%) | 0 (0.0%) |
| 5 to 17 Years | 0 (0.0%) | 0 (0.0%) |
| 18 to 34 Years | 0 (0.0%) | 0 (0.0%) |
| 35 to 64 Years | 0 (0.0%) | 0 (0.0%) |
| 65 to 74 Years | 0 (0.0%) | 0 (0.0%) |
| 75 Years and over | 12 (5.5%) | 21 (11.1%) |
Disability Class: Cognitive Difficulty
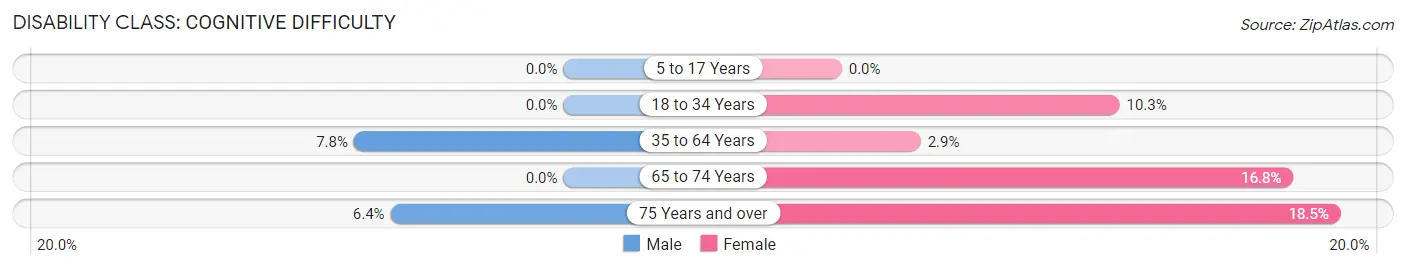
| Age Bracket | Male | Female |
| 5 to 17 Years | 0 (0.0%) | 0 (0.0%) |
| 18 to 34 Years | 0 (0.0%) | 33 (10.3%) |
| 35 to 64 Years | 42 (7.8%) | 18 (2.9%) |
| 65 to 74 Years | 0 (0.0%) | 29 (16.8%) |
| 75 Years and over | 14 (6.4%) | 35 (18.5%) |
Disability Class: Ambulatory Difficulty
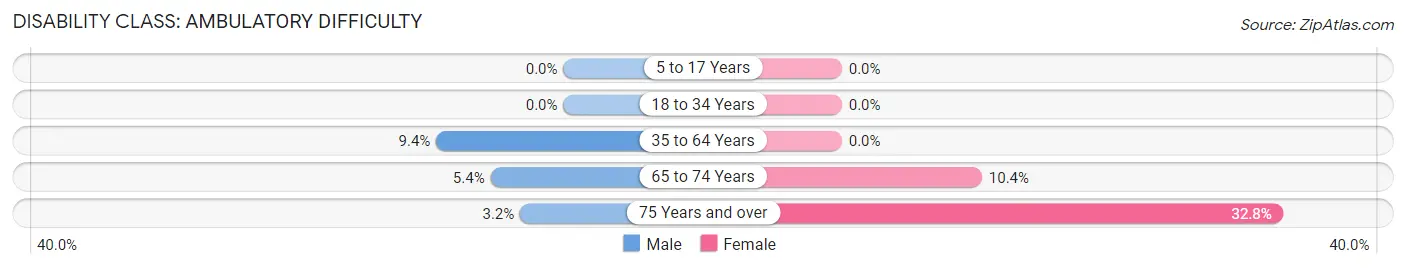
| Age Bracket | Male | Female |
| 5 to 17 Years | 0 (0.0%) | 0 (0.0%) |
| 18 to 34 Years | 0 (0.0%) | 0 (0.0%) |
| 35 to 64 Years | 51 (9.4%) | 0 (0.0%) |
| 65 to 74 Years | 10 (5.4%) | 18 (10.4%) |
| 75 Years and over | 7 (3.2%) | 62 (32.8%) |
Disability Class: Self-Care Difficulty
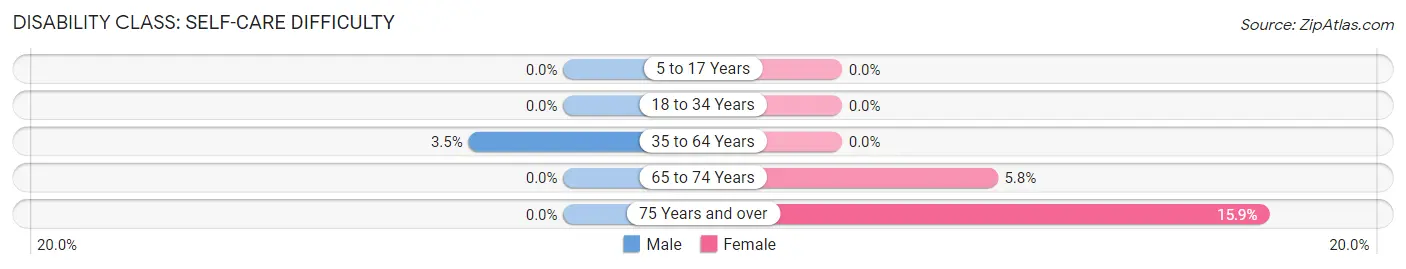
| Age Bracket | Male | Female |
| 5 to 17 Years | 0 (0.0%) | 0 (0.0%) |
| 18 to 34 Years | 0 (0.0%) | 0 (0.0%) |
| 35 to 64 Years | 19 (3.5%) | 0 (0.0%) |
| 65 to 74 Years | 0 (0.0%) | 10 (5.8%) |
| 75 Years and over | 0 (0.0%) | 30 (15.9%) |
Technology Access in Ebensburg borough
Computing Device Access in Ebensburg borough
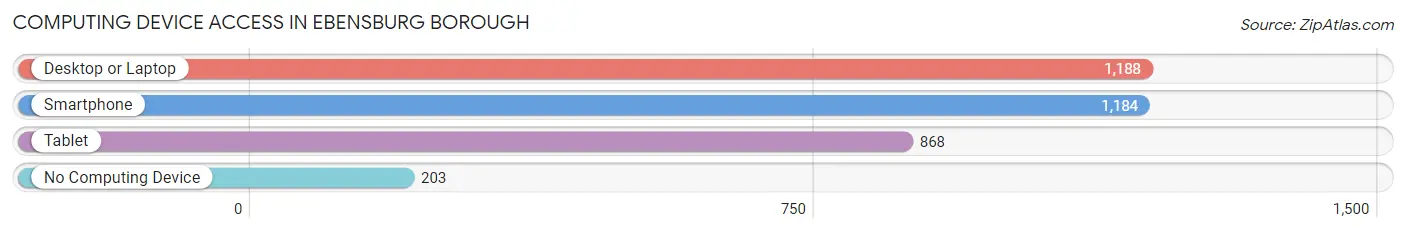
| Device Type | # Households | % Households |
| Desktop or Laptop | 1,188 | 72.6% |
| Smartphone | 1,184 | 72.4% |
| Tablet | 868 | 53.1% |
| No Computing Device | 203 | 12.4% |
| Total | 1,636 | 100.0% |
Internet Access in Ebensburg borough
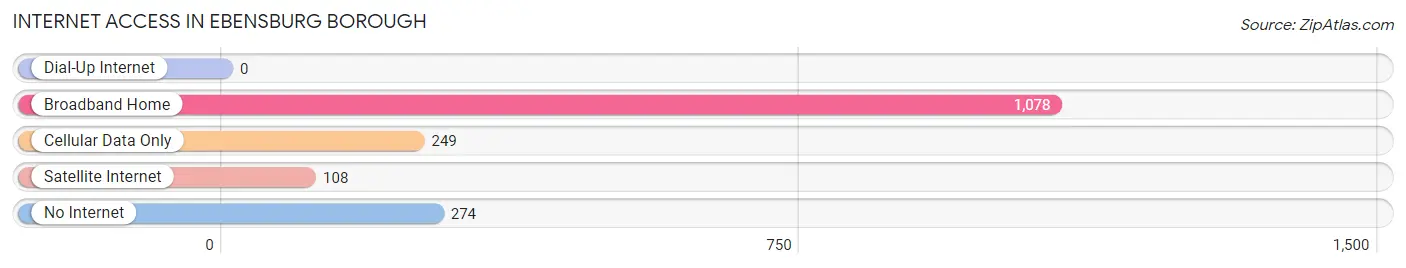
| Internet Type | # Households | % Households |
| Dial-Up Internet | 0 | 0.0% |
| Broadband Home | 1,078 | 65.9% |
| Cellular Data Only | 249 | 15.2% |
| Satellite Internet | 108 | 6.6% |
| No Internet | 274 | 16.8% |
| Total | 1,636 | 100.0% |
Ebensburg borough Summary
Ebensburg Borough is a borough located in Cambria County, Pennsylvania, United States. It is the county seat of Cambria County. The population was 3,351 at the 2010 census.
History
Ebensburg was founded in 1806 by John and Michael Eben, two brothers of German descent. The brothers purchased the land from the heirs of William Penn and named the town after their father, Eben Eben. The town was incorporated in 1839 and became the county seat of Cambria County in 1804.
The town was an important stop on the Pennsylvania Main Line Canal, which ran from Philadelphia to Pittsburgh. The canal was completed in 1834 and provided a major transportation route for goods and people. The canal was eventually replaced by the Pennsylvania Railroad in the late 19th century.
The town was also an important stop on the Underground Railroad, which was used by escaped slaves to reach freedom in the northern states. Ebensburg was a safe haven for many African Americans during the Civil War.
Geography
Ebensburg is located at 40°29′N 78°45′W (40.48, -78.75). According to the United States Census Bureau, the borough has a total area of 1.2 square miles (3.1 km2), all of it land.
Economy
Ebensburg is the county seat of Cambria County and is home to many government offices and services. The borough is also home to several businesses, including manufacturing, retail, and health care.
The borough is home to several large employers, including the Cambria County Courthouse, the Ebensburg Center for the Arts, and the Ebensburg Medical Center.
Demographics
As of the census of 2000, there were 3,351 people, 1,521 households, and 890 families residing in the borough. The population density was 2,817.2 people per square mile (1,092.2/km2). There were 1,637 housing units at an average density of 1,372.2 per square mile (531.2/km2). The racial makeup of the borough was 97.90% White, 0.30% African American, 0.12% Native American, 0.45% Asian, 0.03% Pacific Islander, 0.45% from other races, and 0.75% from two or more races. Hispanic or Latino of any race were 0.90% of the population.
There were 1,521 households, out of which 24.2% had children under the age of 18 living with them, 43.2% were married couples living together, 11.7% had a female householder with no husband present, and 41.2% were non-families. 36.2% of all households were made up of individuals, and 19.2% had someone living alone who was 65 years of age or older. The average household size was 2.19 and the average family size was 2.86.
In the borough the population was spread out, with 20.7% under the age of 18, 7.2% from 18 to 24, 27.2% from 25 to 44, 22.3% from 45 to 64, and 22.6% who were 65 years of age or older. The median age was 41 years. For every 100 females, there were 87.2 males. For every 100 females age 18 and over, there were 82.7 males.
The median income for a household in the borough was $27,917, and the median income for a family was $36,964. Males had a median income of $30,000 versus $20,972 for females. The per capita income for the borough was $16,945. About 8.2% of families and 11.2% of the population were below the poverty line, including 15.2% of those under age 18 and 8.7% of those age 65 or over.
Common Questions
What is Per Capita Income in Ebensburg borough?
Per Capita income in Ebensburg borough is $37,756.
What is the Median Family Income in Ebensburg borough?
Median Family Income in Ebensburg borough is $89,228.
What is the Median Household income in Ebensburg borough?
Median Household Income in Ebensburg borough is $56,875.
What is Income or Wage Gap in Ebensburg borough?
Income or Wage Gap in Ebensburg borough is 6.1%.
Women in Ebensburg borough earn 93.9 cents for every dollar earned by a man.
What is Inequality or Gini Index in Ebensburg borough?
Inequality or Gini Index in Ebensburg borough is 0.44.
What is the Total Population of Ebensburg borough?
Total Population of Ebensburg borough is 3,382.
What is the Total Male Population of Ebensburg borough?
Total Male Population of Ebensburg borough is 1,826.
What is the Total Female Population of Ebensburg borough?
Total Female Population of Ebensburg borough is 1,556.
What is the Ratio of Males per 100 Females in Ebensburg borough?
There are 117.35 Males per 100 Females in Ebensburg borough.
What is the Ratio of Females per 100 Males in Ebensburg borough?
There are 85.21 Females per 100 Males in Ebensburg borough.
What is the Median Population Age in Ebensburg borough?
Median Population Age in Ebensburg borough is 41.5 Years.
What is the Average Family Size in Ebensburg borough
Average Family Size in Ebensburg borough is 3.0 People.
What is the Average Household Size in Ebensburg borough
Average Household Size in Ebensburg borough is 2.1 People.
How Large is the Labor Force in Ebensburg borough?
There are 1,552 People in the Labor Forcein in Ebensburg borough.
What is the Percentage of People in the Labor Force in Ebensburg borough?
54.1% of People are in the Labor Force in Ebensburg borough.
What is the Unemployment Rate in Ebensburg borough?
Unemployment Rate in Ebensburg borough is 3.7%.