Ashland borough, PA Map & Demographics
Ashland borough Overview
$35,072
PER CAPITA INCOME
$73,676
AVG FAMILY INCOME
$62,854
AVG HOUSEHOLD INCOME
33.4%
WAGE / INCOME GAP [ % ]
66.6¢/ $1
WAGE / INCOME GAP [ $ ]
0.47
INEQUALITY / GINI INDEX
2,493
TOTAL POPULATION
1,214
MALE POPULATION
1,279
FEMALE POPULATION
94.92
MALES / 100 FEMALES
105.35
FEMALES / 100 MALES
42.8
MEDIAN AGE
2.6
AVG FAMILY SIZE
2.2
AVG HOUSEHOLD SIZE
1,212
LABOR FORCE [ PEOPLE ]
57.4%
PERCENT IN LABOR FORCE
6.0%
UNEMPLOYMENT RATE
Income in Ashland borough
Income Overview in Ashland borough
Per Capita Income in Ashland borough is $35,072, while median incomes of families and households are $73,676 and $62,854 respectively.
| Characteristic | Number | Measure |
| Per Capita Income | 2,493 | $35,072 |
| Median Family Income | 596 | $73,676 |
| Mean Family Income | 596 | $87,903 |
| Median Household Income | 1,153 | $62,854 |
| Mean Household Income | 1,153 | $75,017 |
| Income Deficit | 596 | $0 |
| Wage / Income Gap (%) | 2,493 | 33.41% |
| Wage / Income Gap ($) | 2,493 | 66.59¢ per $1 |
| Gini / Inequality Index | 2,493 | 0.47 |
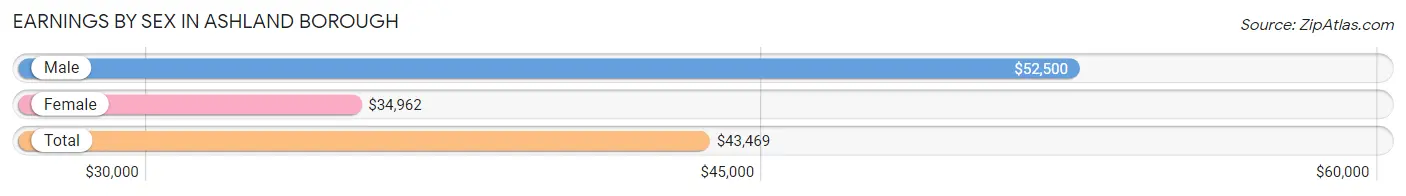
Earnings by Sex in Ashland borough
Average Earnings in Ashland borough are $43,469, $52,500 for men and $34,962 for women, a difference of 33.4%.
| Sex | Number | Average Earnings |
| Male | 746 (60.2%) | $52,500 |
| Female | 494 (39.8%) | $34,962 |
| Total | 1,240 (100.0%) | $43,469 |
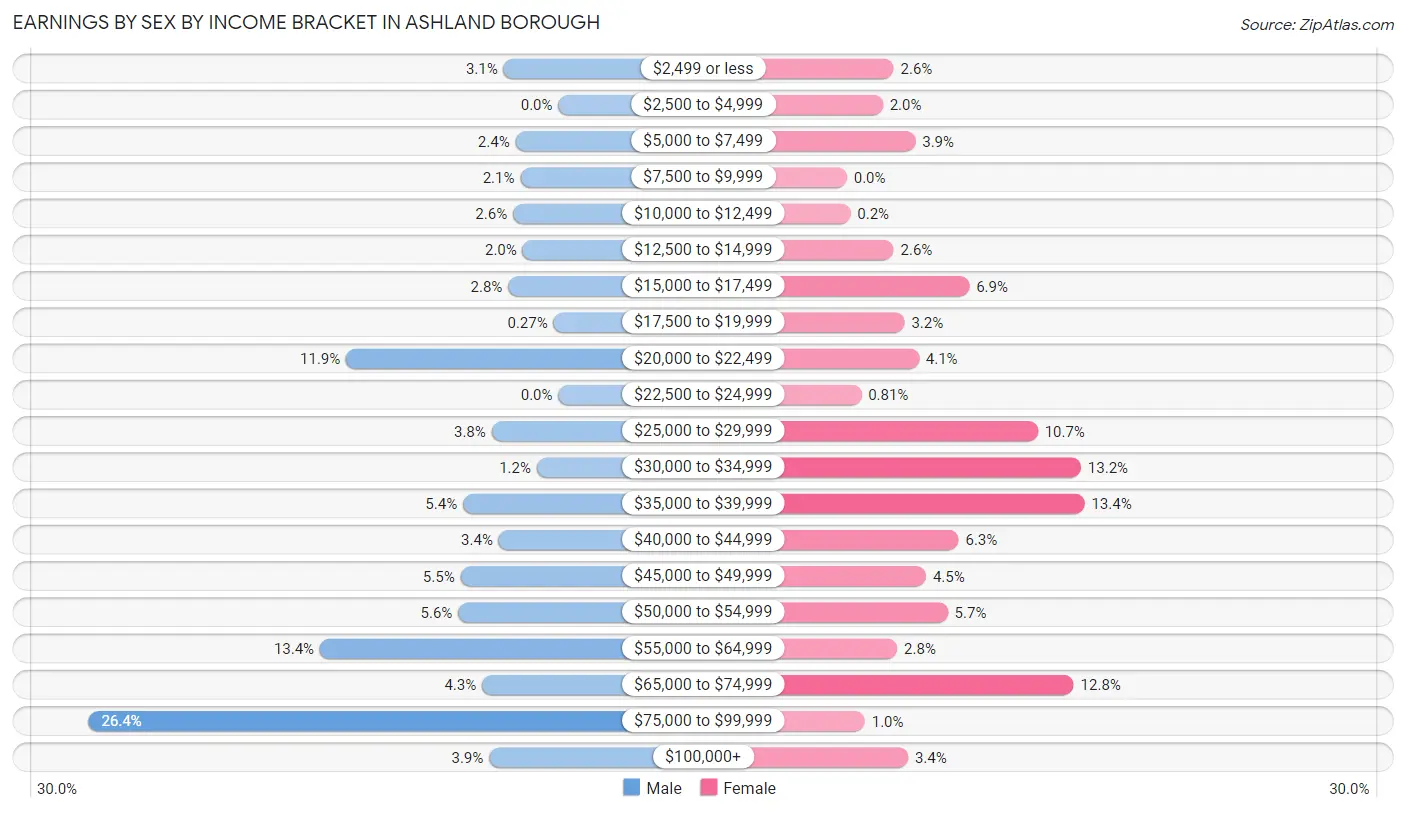
Earnings by Sex by Income Bracket in Ashland borough
The most common earnings brackets in Ashland borough are $75,000 to $99,999 for men (197 | 26.4%) and $35,000 to $39,999 for women (66 | 13.4%).
| Income | Male | Female |
| $2,499 or less | 23 (3.1%) | 13 (2.6%) |
| $2,500 to $4,999 | 0 (0.0%) | 10 (2.0%) |
| $5,000 to $7,499 | 18 (2.4%) | 19 (3.8%) |
| $7,500 to $9,999 | 16 (2.1%) | 0 (0.0%) |
| $10,000 to $12,499 | 19 (2.5%) | 1 (0.2%) |
| $12,500 to $14,999 | 15 (2.0%) | 13 (2.6%) |
| $15,000 to $17,499 | 21 (2.8%) | 34 (6.9%) |
| $17,500 to $19,999 | 2 (0.3%) | 16 (3.2%) |
| $20,000 to $22,499 | 89 (11.9%) | 20 (4.1%) |
| $22,500 to $24,999 | 0 (0.0%) | 4 (0.8%) |
| $25,000 to $29,999 | 28 (3.7%) | 53 (10.7%) |
| $30,000 to $34,999 | 9 (1.2%) | 65 (13.2%) |
| $35,000 to $39,999 | 40 (5.4%) | 66 (13.4%) |
| $40,000 to $44,999 | 25 (3.4%) | 31 (6.3%) |
| $45,000 to $49,999 | 41 (5.5%) | 22 (4.4%) |
| $50,000 to $54,999 | 42 (5.6%) | 28 (5.7%) |
| $55,000 to $64,999 | 100 (13.4%) | 14 (2.8%) |
| $65,000 to $74,999 | 32 (4.3%) | 63 (12.8%) |
| $75,000 to $99,999 | 197 (26.4%) | 5 (1.0%) |
| $100,000+ | 29 (3.9%) | 17 (3.4%) |
| Total | 746 (100.0%) | 494 (100.0%) |
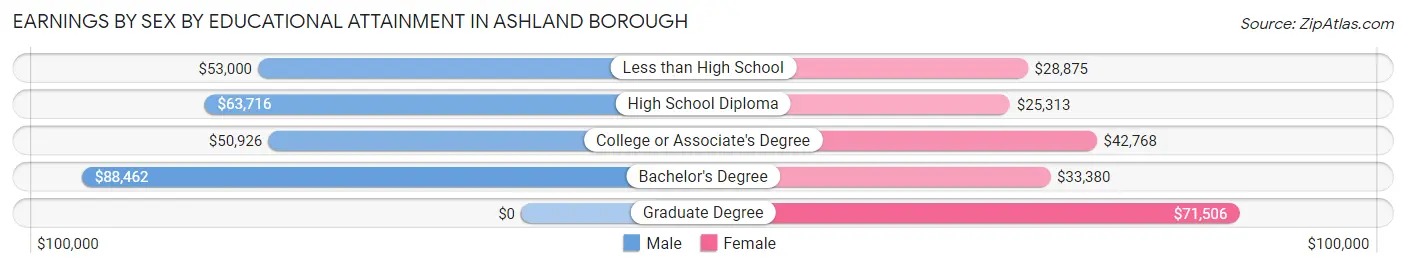
Earnings by Sex by Educational Attainment in Ashland borough
Average earnings in Ashland borough are $63,393 for men and $35,118 for women, a difference of 44.6%. Men with an educational attainment of bachelor's degree enjoy the highest average annual earnings of $88,462, while those with college or associate's degree education earn the least with $50,926. Women with an educational attainment of graduate degree earn the most with the average annual earnings of $71,506, while those with high school diploma education have the smallest earnings of $25,313.
| Educational Attainment | Male Income | Female Income |
| Less than High School | $53,000 | $28,875 |
| High School Diploma | $63,716 | $25,313 |
| College or Associate's Degree | $50,926 | $42,768 |
| Bachelor's Degree | $88,462 | $33,380 |
| Graduate Degree | - | - |
| Total | $63,393 | $35,118 |
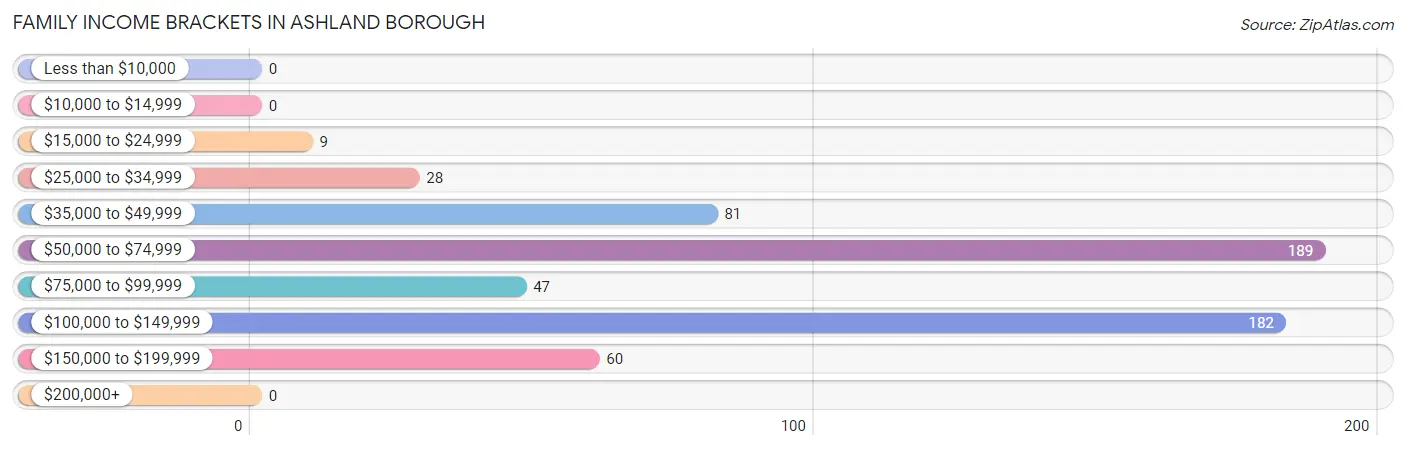
Family Income in Ashland borough
Family Income Brackets in Ashland borough
According to the Ashland borough family income data, there are 189 families falling into the $50,000 to $74,999 income range, which is the most common income bracket and makes up 31.7% of all families.
| Income Bracket | # Families | % Families |
| Less than $10,000 | 0 | 0.0% |
| $10,000 to $14,999 | 0 | 0.0% |
| $15,000 to $24,999 | 9 | 1.5% |
| $25,000 to $34,999 | 28 | 4.7% |
| $35,000 to $49,999 | 81 | 13.6% |
| $50,000 to $74,999 | 189 | 31.7% |
| $75,000 to $99,999 | 47 | 7.9% |
| $100,000 to $149,999 | 182 | 30.5% |
| $150,000 to $199,999 | 60 | 10.1% |
| $200,000+ | 0 | 0.0% |
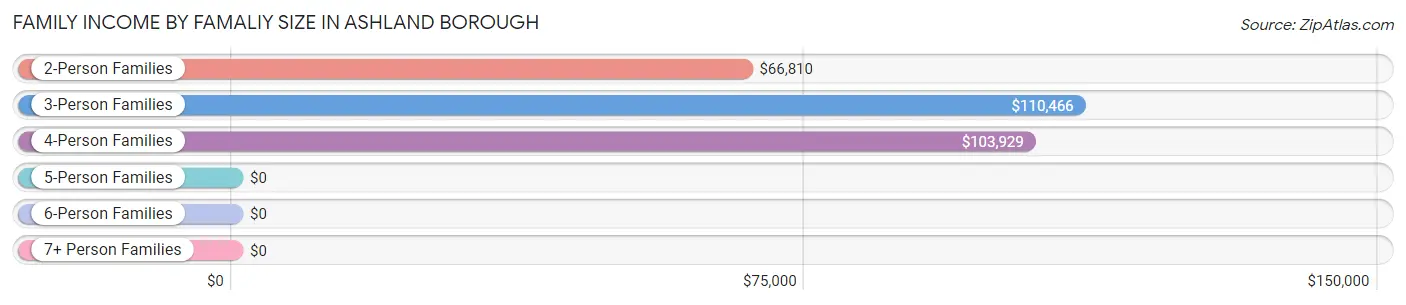
Family Income by Famaliy Size in Ashland borough
3-person families (133 | 22.3%) account for the highest median family income in Ashland borough with $110,466 per family, while 3-person families (133 | 22.3%) have the highest median income of $36,822 per family member.
| Income Bracket | # Families | Median Income |
| 2-Person Families | 350 (58.7%) | $66,810 |
| 3-Person Families | 133 (22.3%) | $110,466 |
| 4-Person Families | 100 (16.8%) | $103,929 |
| 5-Person Families | 6 (1.0%) | $0 |
| 6-Person Families | 7 (1.2%) | $0 |
| 7+ Person Families | 0 (0.0%) | $0 |
| Total | 596 (100.0%) | $73,676 |
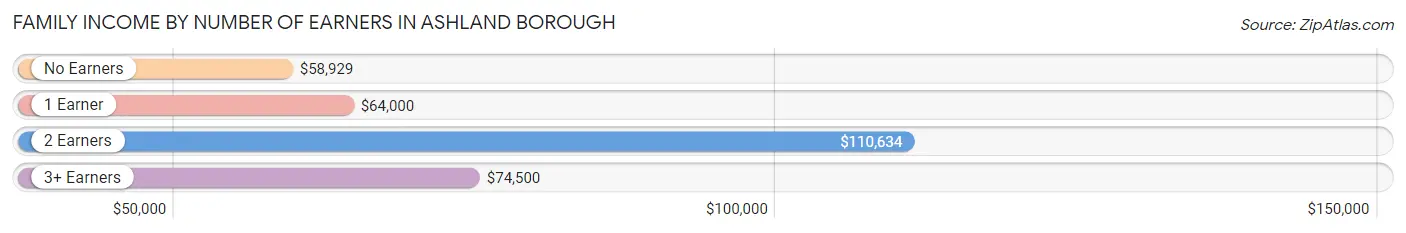
Family Income by Number of Earners in Ashland borough
The median family income in Ashland borough is $73,676, with families comprising 2 earners (298) having the highest median family income of $110,634, while families with no earners (80) have the lowest median family income of $58,929, accounting for 50.0% and 13.4% of families, respectively.
| Number of Earners | # Families | Median Income |
| No Earners | 80 (13.4%) | $58,929 |
| 1 Earner | 198 (33.2%) | $64,000 |
| 2 Earners | 298 (50.0%) | $110,634 |
| 3+ Earners | 20 (3.4%) | $74,500 |
| Total | 596 (100.0%) | $73,676 |
Household Income in Ashland borough
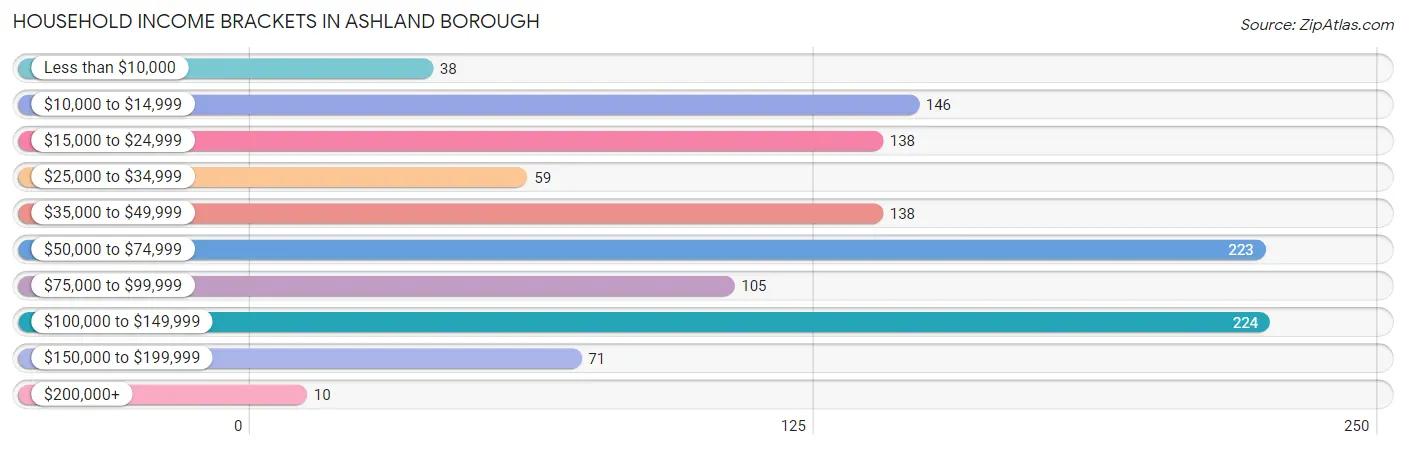
Household Income Brackets in Ashland borough
With 224 households falling in the category, the $100,000 to $149,999 income range is the most frequent in Ashland borough, accounting for 19.4% of all households. In contrast, only 10 households (0.9%) fall into the $200,000+ income bracket, making it the least populous group.
| Income Bracket | # Households | % Households |
| Less than $10,000 | 38 | 3.3% |
| $10,000 to $14,999 | 146 | 12.7% |
| $15,000 to $24,999 | 138 | 12.0% |
| $25,000 to $34,999 | 59 | 5.1% |
| $35,000 to $49,999 | 138 | 12.0% |
| $50,000 to $74,999 | 223 | 19.3% |
| $75,000 to $99,999 | 105 | 9.1% |
| $100,000 to $149,999 | 224 | 19.4% |
| $150,000 to $199,999 | 71 | 6.2% |
| $200,000+ | 10 | 0.9% |
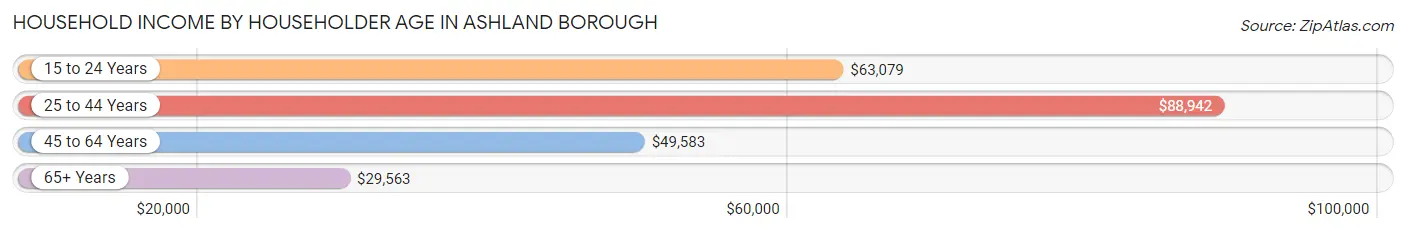
Household Income by Householder Age in Ashland borough
The median household income in Ashland borough is $62,854, with the highest median household income of $88,942 found in the 25 to 44 years age bracket for the primary householder. A total of 283 households (24.5%) fall into this category. Meanwhile, the 65+ years age bracket for the primary householder has the lowest median household income of $29,563, with 297 households (25.8%) in this group.
| Income Bracket | # Households | Median Income |
| 15 to 24 Years | 63 (5.5%) | $63,079 |
| 25 to 44 Years | 283 (24.5%) | $88,942 |
| 45 to 64 Years | 510 (44.2%) | $49,583 |
| 65+ Years | 297 (25.8%) | $29,563 |
| Total | 1,153 (100.0%) | $62,854 |
Poverty in Ashland borough
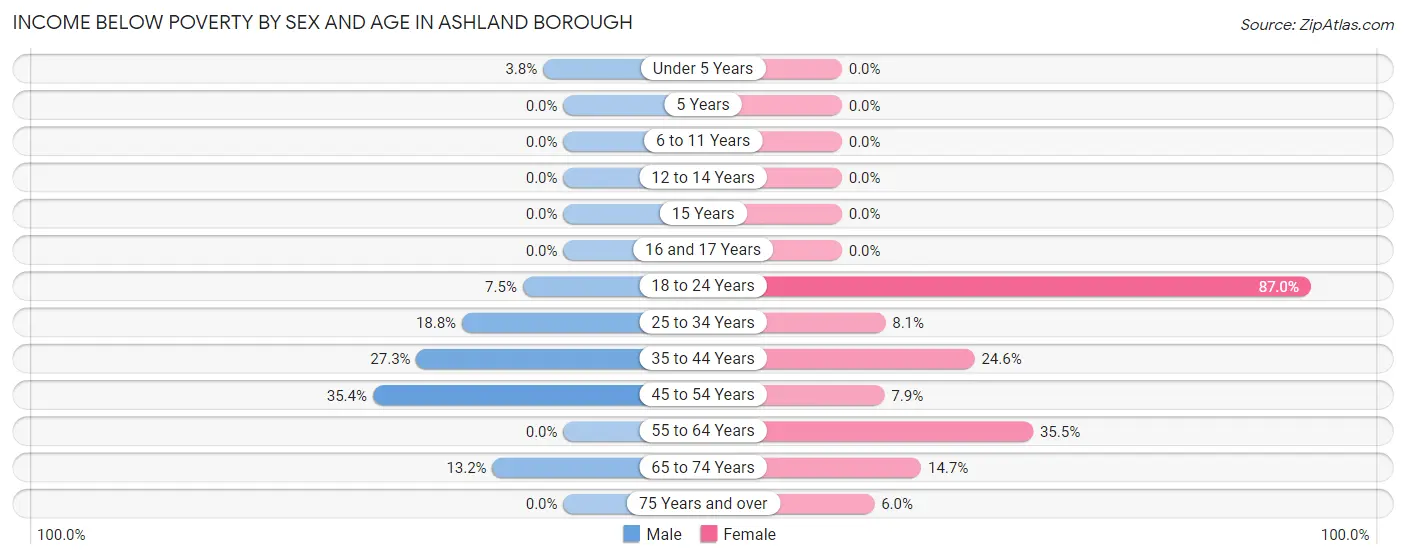
Income Below Poverty by Sex and Age in Ashland borough
With 12.9% poverty level for males and 18.8% for females among the residents of Ashland borough, 45 to 54 year old males and 18 to 24 year old females are the most vulnerable to poverty, with 52 males (35.4%) and 47 females (87.0%) in their respective age groups living below the poverty level.
| Age Bracket | Male | Female |
| Under 5 Years | 4 (3.8%) | 0 (0.0%) |
| 5 Years | 0 (0.0%) | 0 (0.0%) |
| 6 to 11 Years | 0 (0.0%) | 0 (0.0%) |
| 12 to 14 Years | 0 (0.0%) | 0 (0.0%) |
| 15 Years | 0 (0.0%) | 0 (0.0%) |
| 16 and 17 Years | 0 (0.0%) | 0 (0.0%) |
| 18 to 24 Years | 15 (7.5%) | 47 (87.0%) |
| 25 to 34 Years | 35 (18.8%) | 13 (8.1%) |
| 35 to 44 Years | 36 (27.3%) | 33 (24.6%) |
| 45 to 54 Years | 52 (35.4%) | 14 (7.9%) |
| 55 to 64 Years | 0 (0.0%) | 104 (35.5%) |
| 65 to 74 Years | 10 (13.2%) | 15 (14.7%) |
| 75 Years and over | 0 (0.0%) | 10 (6.0%) |
| Total | 152 (12.9%) | 236 (18.8%) |
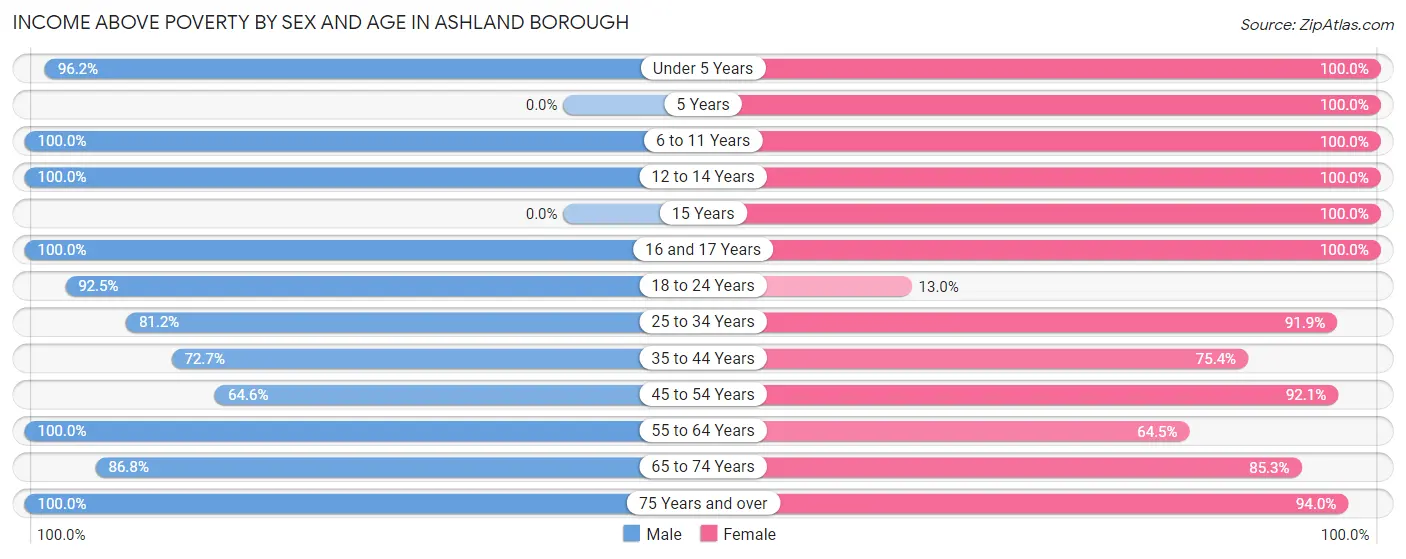
Income Above Poverty by Sex and Age in Ashland borough
According to the poverty statistics in Ashland borough, males aged 6 to 11 years and females aged under 5 years are the age groups that are most secure financially, with 100.0% of males and 100.0% of females in these age groups living above the poverty line.
| Age Bracket | Male | Female |
| Under 5 Years | 102 (96.2%) | 78 (100.0%) |
| 5 Years | 0 (0.0%) | 5 (100.0%) |
| 6 to 11 Years | 60 (100.0%) | 14 (100.0%) |
| 12 to 14 Years | 9 (100.0%) | 36 (100.0%) |
| 15 Years | 0 (0.0%) | 14 (100.0%) |
| 16 and 17 Years | 8 (100.0%) | 19 (100.0%) |
| 18 to 24 Years | 184 (92.5%) | 7 (13.0%) |
| 25 to 34 Years | 151 (81.2%) | 148 (91.9%) |
| 35 to 44 Years | 96 (72.7%) | 101 (75.4%) |
| 45 to 54 Years | 95 (64.6%) | 163 (92.1%) |
| 55 to 64 Years | 228 (100.0%) | 189 (64.5%) |
| 65 to 74 Years | 66 (86.8%) | 87 (85.3%) |
| 75 Years and over | 30 (100.0%) | 156 (94.0%) |
| Total | 1,029 (87.1%) | 1,017 (81.2%) |
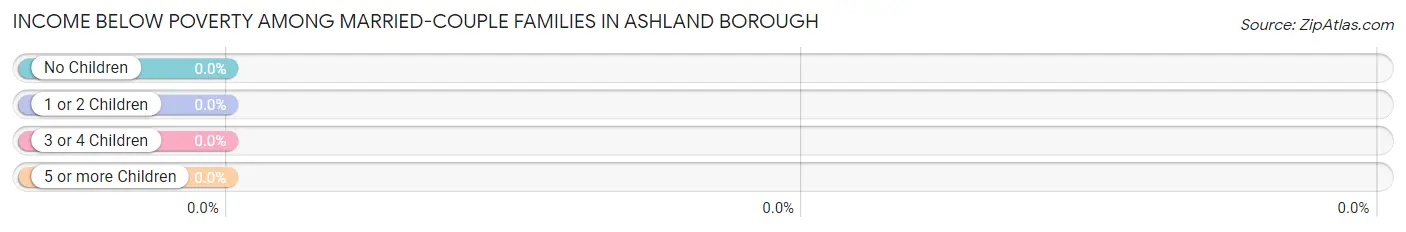
Income Below Poverty Among Married-Couple Families in Ashland borough
| Children | Above Poverty | Below Poverty |
| No Children | 294 (100.0%) | 0 (0.0%) |
| 1 or 2 Children | 79 (100.0%) | 0 (0.0%) |
| 3 or 4 Children | 0 (0.0%) | 0 (0.0%) |
| 5 or more Children | 0 (0.0%) | 0 (0.0%) |
| Total | 373 (100.0%) | 0 (0.0%) |
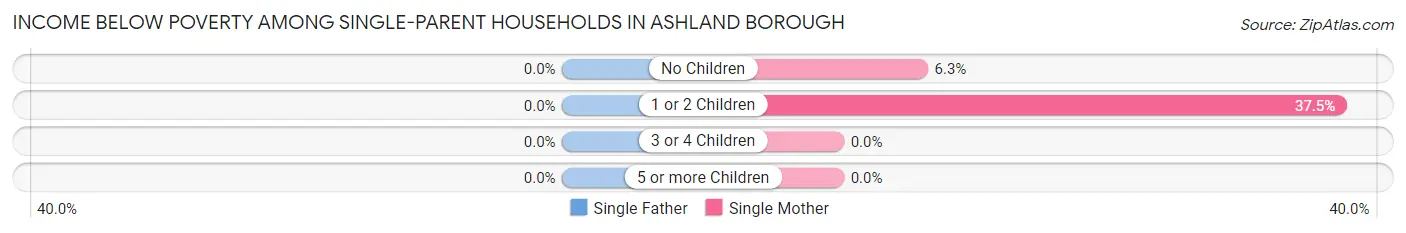
Income Below Poverty Among Single-Parent Households in Ashland borough
| Children | Single Father | Single Mother |
| No Children | 0 (0.0%) | 4 (6.2%) |
| 1 or 2 Children | 0 (0.0%) | 3 (37.5%) |
| 3 or 4 Children | 0 (0.0%) | 0 (0.0%) |
| 5 or more Children | 0 (0.0%) | 0 (0.0%) |
| Total | 0 (0.0%) | 7 (6.7%) |
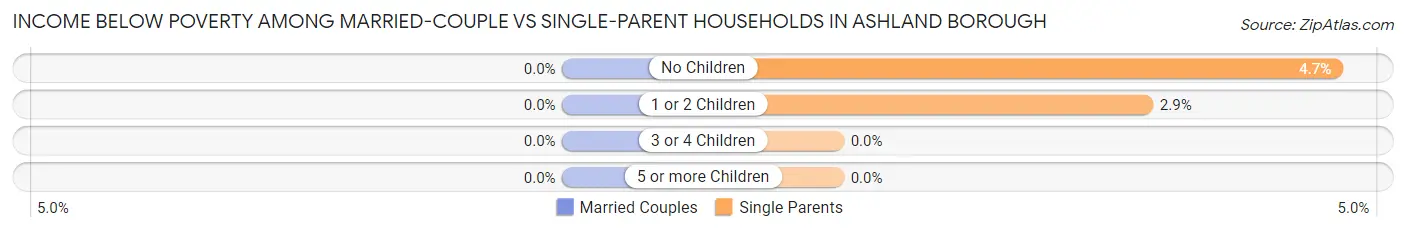
Income Below Poverty Among Married-Couple vs Single-Parent Households in Ashland borough
| Children | Married-Couple Families | Single-Parent Households |
| No Children | 0 (0.0%) | 4 (4.6%) |
| 1 or 2 Children | 0 (0.0%) | 3 (2.9%) |
| 3 or 4 Children | 0 (0.0%) | 0 (0.0%) |
| 5 or more Children | 0 (0.0%) | 0 (0.0%) |
| Total | 0 (0.0%) | 7 (3.1%) |
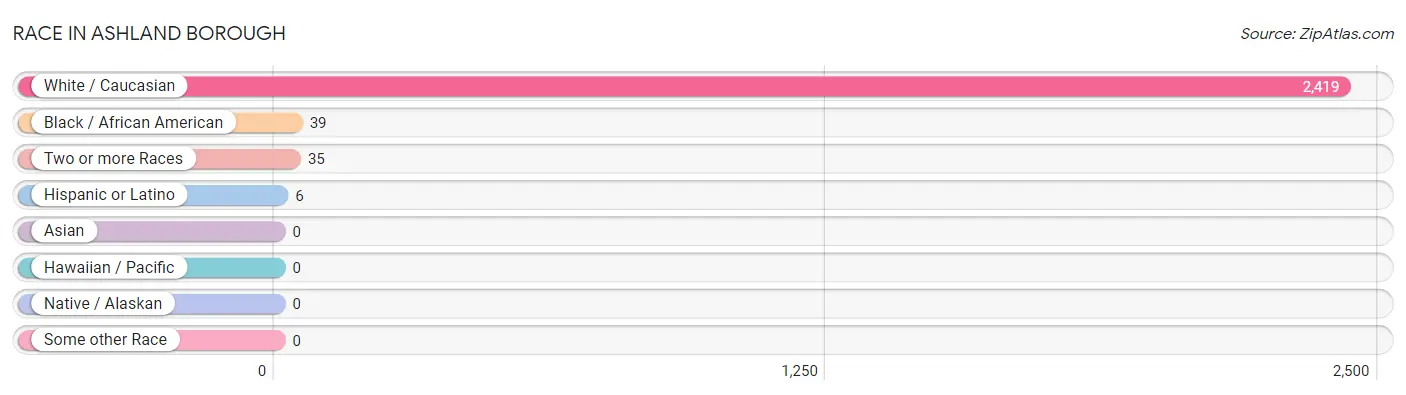
Race in Ashland borough
The most populous races in Ashland borough are White / Caucasian (2,419 | 97.0%), Black / African American (39 | 1.6%), and Two or more Races (35 | 1.4%).
| Race | # Population | % Population |
| Asian | 0 | 0.0% |
| Black / African American | 39 | 1.6% |
| Hawaiian / Pacific | 0 | 0.0% |
| Hispanic or Latino | 6 | 0.2% |
| Native / Alaskan | 0 | 0.0% |
| White / Caucasian | 2,419 | 97.0% |
| Two or more Races | 35 | 1.4% |
| Some other Race | 0 | 0.0% |
| Total | 2,493 | 100.0% |
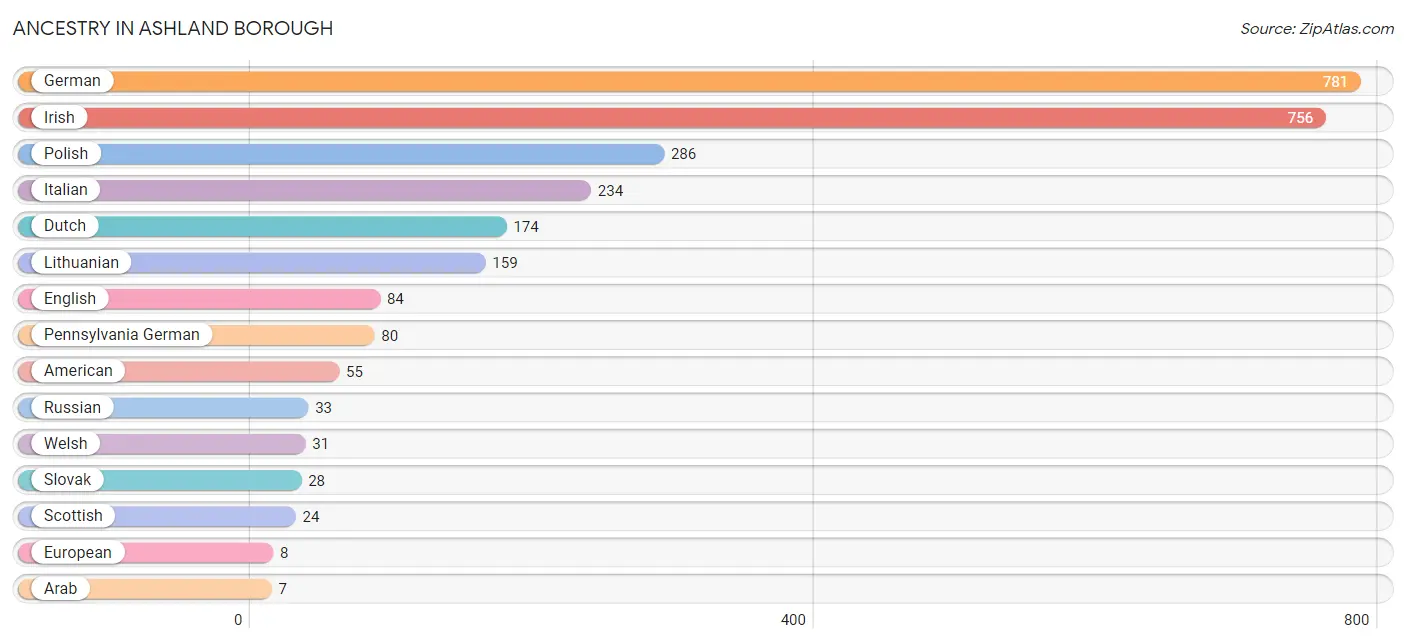
Ancestry in Ashland borough
The most populous ancestries reported in Ashland borough are German (781 | 31.3%), Irish (756 | 30.3%), Polish (286 | 11.5%), Italian (234 | 9.4%), and Dutch (174 | 7.0%), together accounting for 89.5% of all Ashland borough residents.
| Ancestry | # Population | % Population |
| American | 55 | 2.2% |
| Arab | 7 | 0.3% |
| Austrian | 7 | 0.3% |
| Dutch | 174 | 7.0% |
| English | 84 | 3.4% |
| European | 8 | 0.3% |
| French | 6 | 0.2% |
| German | 781 | 31.3% |
| Irish | 756 | 30.3% |
| Italian | 234 | 9.4% |
| Lebanese | 7 | 0.3% |
| Lithuanian | 159 | 6.4% |
| Mexican | 6 | 0.2% |
| Pennsylvania German | 80 | 3.2% |
| Polish | 286 | 11.5% |
| Russian | 33 | 1.3% |
| Scotch-Irish | 5 | 0.2% |
| Scottish | 24 | 1.0% |
| Slovak | 28 | 1.1% |
| Welsh | 31 | 1.2% | View All 20 Rows |
Immigrants in Ashland borough

| Immigration Origin | # Population | % Population | View All 0 Rows |
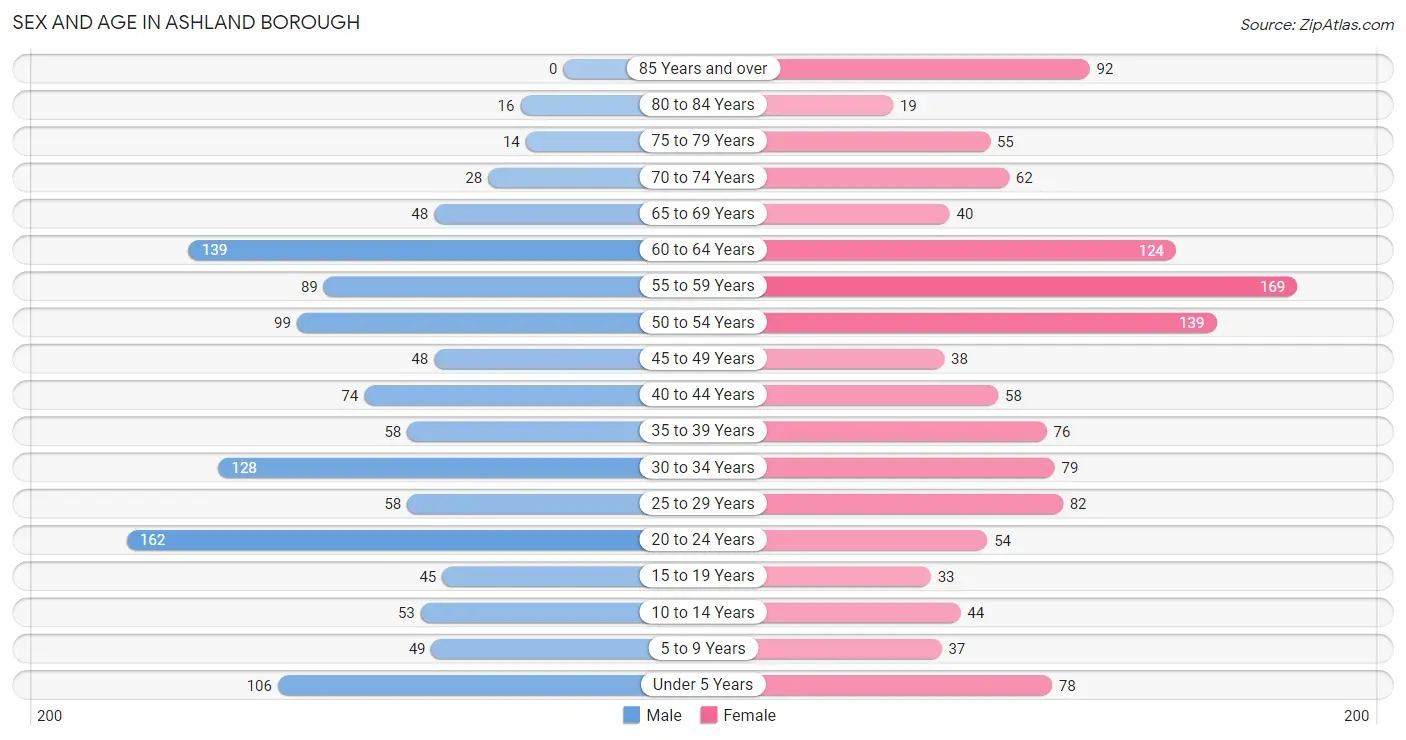
Sex and Age in Ashland borough
Sex and Age in Ashland borough
The most populous age groups in Ashland borough are 20 to 24 Years (162 | 13.3%) for men and 55 to 59 Years (169 | 13.2%) for women.
| Age Bracket | Male | Female |
| Under 5 Years | 106 (8.7%) | 78 (6.1%) |
| 5 to 9 Years | 49 (4.0%) | 37 (2.9%) |
| 10 to 14 Years | 53 (4.4%) | 44 (3.4%) |
| 15 to 19 Years | 45 (3.7%) | 33 (2.6%) |
| 20 to 24 Years | 162 (13.3%) | 54 (4.2%) |
| 25 to 29 Years | 58 (4.8%) | 82 (6.4%) |
| 30 to 34 Years | 128 (10.5%) | 79 (6.2%) |
| 35 to 39 Years | 58 (4.8%) | 76 (5.9%) |
| 40 to 44 Years | 74 (6.1%) | 58 (4.5%) |
| 45 to 49 Years | 48 (4.0%) | 38 (3.0%) |
| 50 to 54 Years | 99 (8.2%) | 139 (10.9%) |
| 55 to 59 Years | 89 (7.3%) | 169 (13.2%) |
| 60 to 64 Years | 139 (11.5%) | 124 (9.7%) |
| 65 to 69 Years | 48 (4.0%) | 40 (3.1%) |
| 70 to 74 Years | 28 (2.3%) | 62 (4.9%) |
| 75 to 79 Years | 14 (1.1%) | 55 (4.3%) |
| 80 to 84 Years | 16 (1.3%) | 19 (1.5%) |
| 85 Years and over | 0 (0.0%) | 92 (7.2%) |
| Total | 1,214 (100.0%) | 1,279 (100.0%) |
Families and Households in Ashland borough
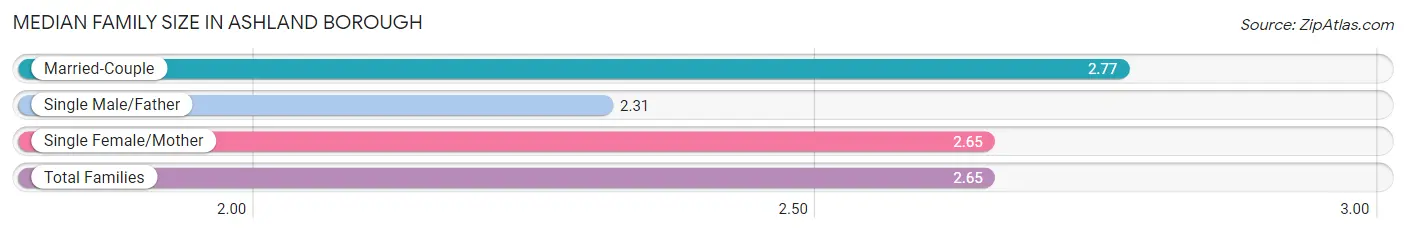
Median Family Size in Ashland borough
The median family size in Ashland borough is 2.65 persons per family, with married-couple families (373 | 62.6%) accounting for the largest median family size of 2.77 persons per family. On the other hand, single male/father families (118 | 19.8%) represent the smallest median family size with 2.31 persons per family.
| Family Type | # Families | Family Size |
| Married-Couple | 373 (62.6%) | 2.77 |
| Single Male/Father | 118 (19.8%) | 2.31 |
| Single Female/Mother | 105 (17.6%) | 2.65 |
| Total Families | 596 (100.0%) | 2.65 |
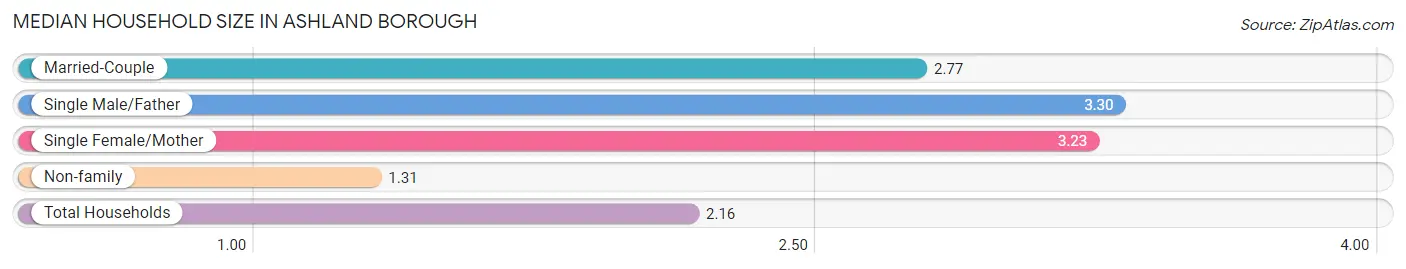
Median Household Size in Ashland borough
The median household size in Ashland borough is 2.16 persons per household, with single male/father households (118 | 10.2%) accounting for the largest median household size of 3.3 persons per household. non-family households (557 | 48.3%) represent the smallest median household size with 1.31 persons per household.
| Household Type | # Households | Household Size |
| Married-Couple | 373 (32.4%) | 2.77 |
| Single Male/Father | 118 (10.2%) | 3.30 |
| Single Female/Mother | 105 (9.1%) | 3.23 |
| Non-family | 557 (48.3%) | 1.31 |
| Total Households | 1,153 (100.0%) | 2.16 |
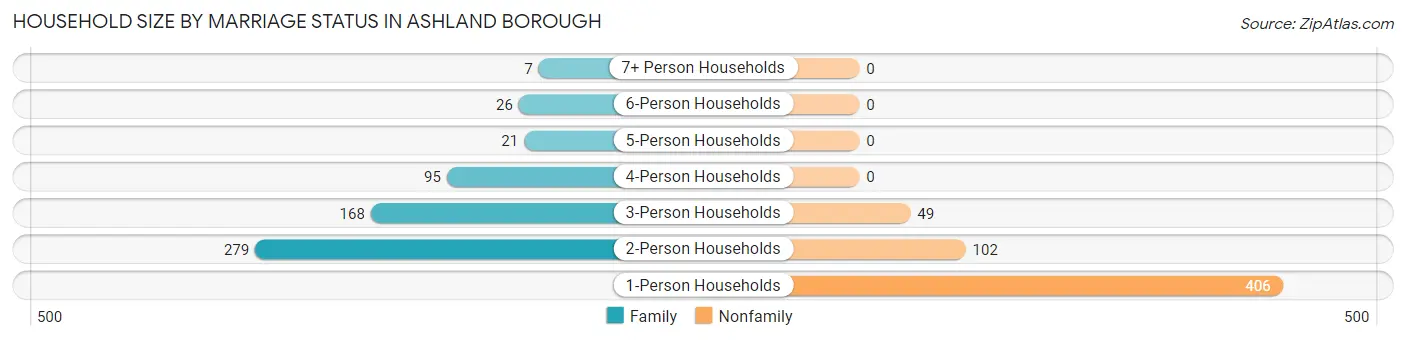
Household Size by Marriage Status in Ashland borough
Out of a total of 1,153 households in Ashland borough, 596 (51.7%) are family households, while 557 (48.3%) are nonfamily households. The most numerous type of family households are 2-person households, comprising 279, and the most common type of nonfamily households are 1-person households, comprising 406.
| Household Size | Family Households | Nonfamily Households |
| 1-Person Households | - | 406 (35.2%) |
| 2-Person Households | 279 (24.2%) | 102 (8.8%) |
| 3-Person Households | 168 (14.6%) | 49 (4.3%) |
| 4-Person Households | 95 (8.2%) | 0 (0.0%) |
| 5-Person Households | 21 (1.8%) | 0 (0.0%) |
| 6-Person Households | 26 (2.2%) | 0 (0.0%) |
| 7+ Person Households | 7 (0.6%) | 0 (0.0%) |
| Total | 596 (51.7%) | 557 (48.3%) |
Female Fertility in Ashland borough
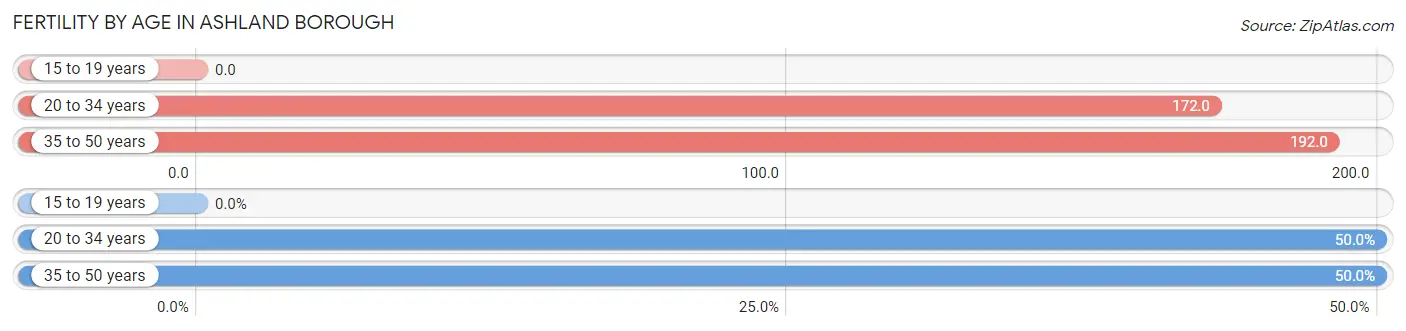
Fertility by Age in Ashland borough
Average fertility rate in Ashland borough is 168.0 births per 1,000 women. Women in the age bracket of 35 to 50 years have the highest fertility rate with 192.0 births per 1,000 women. Women in the age bracket of 20 to 34 years acount for 50.0% of all women with births.
| Age Bracket | Women with Births | Births / 1,000 Women |
| 15 to 19 years | 0 (0.0%) | 0.0 |
| 20 to 34 years | 37 (50.0%) | 172.0 |
| 35 to 50 years | 37 (50.0%) | 192.0 |
| Total | 74 (100.0%) | 168.0 |
Fertility by Age by Marriage Status in Ashland borough
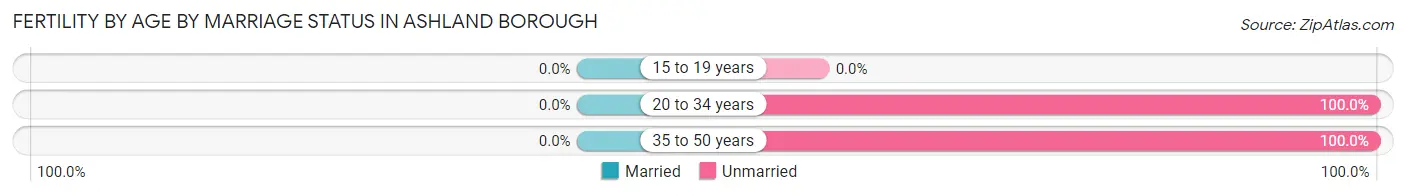
| Age Bracket | Married | Unmarried |
| 15 to 19 years | 0 (0.0%) | 0 (0.0%) |
| 20 to 34 years | 0 (0.0%) | 37 (100.0%) |
| 35 to 50 years | 0 (0.0%) | 37 (100.0%) |
| Total | 0 (0.0%) | 74 (100.0%) |
Fertility by Education in Ashland borough
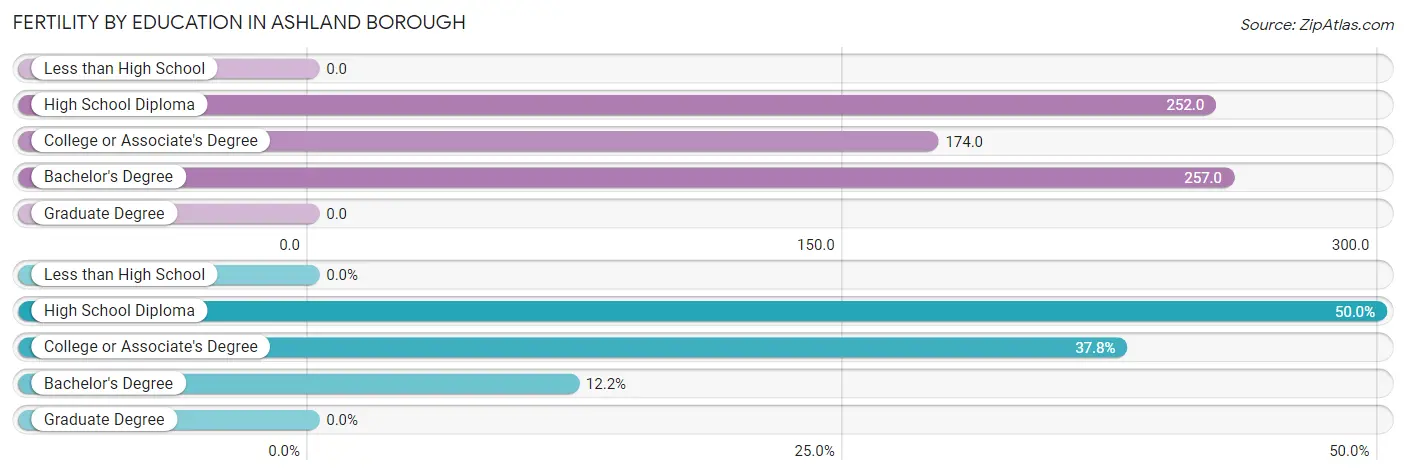
| Educational Attainment | Women with Births | Births / 1,000 Women |
| Less than High School | 0 (0.0%) | 0.0 |
| High School Diploma | 37 (50.0%) | 252.0 |
| College or Associate's Degree | 28 (37.8%) | 174.0 |
| Bachelor's Degree | 9 (12.2%) | 257.0 |
| Graduate Degree | 0 (0.0%) | 0.0 |
| Total | 74 (100.0%) | 168.0 |
Fertility by Education by Marriage Status in Ashland borough
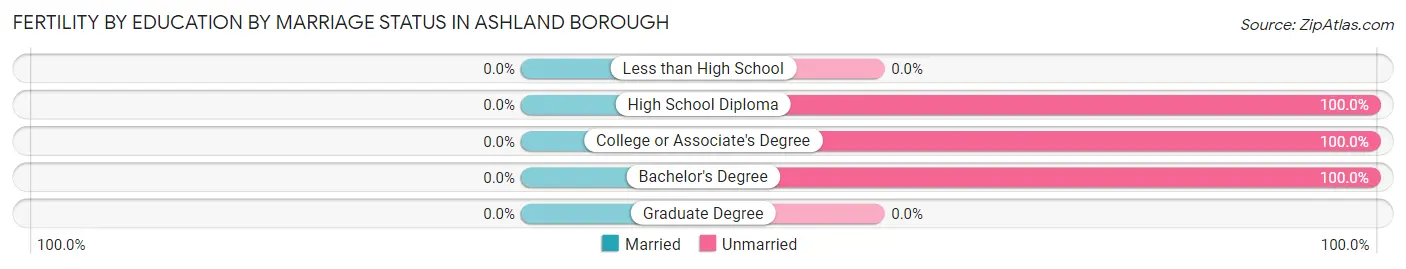
| Educational Attainment | Married | Unmarried |
| Less than High School | 0 (0.0%) | 0 (0.0%) |
| High School Diploma | 0 (0.0%) | 37 (100.0%) |
| College or Associate's Degree | 0 (0.0%) | 28 (100.0%) |
| Bachelor's Degree | 0 (0.0%) | 9 (100.0%) |
| Graduate Degree | 0 (0.0%) | 0 (0.0%) |
| Total | 0 (0.0%) | 74 (100.0%) |
Employment Characteristics in Ashland borough
Employment by Class of Employer in Ashland borough
Among the 1,107 employed individuals in Ashland borough, private company employees (807 | 72.9%), local government employees (103 | 9.3%), and not-for-profit organizations (96 | 8.7%) make up the most common classes of employment.
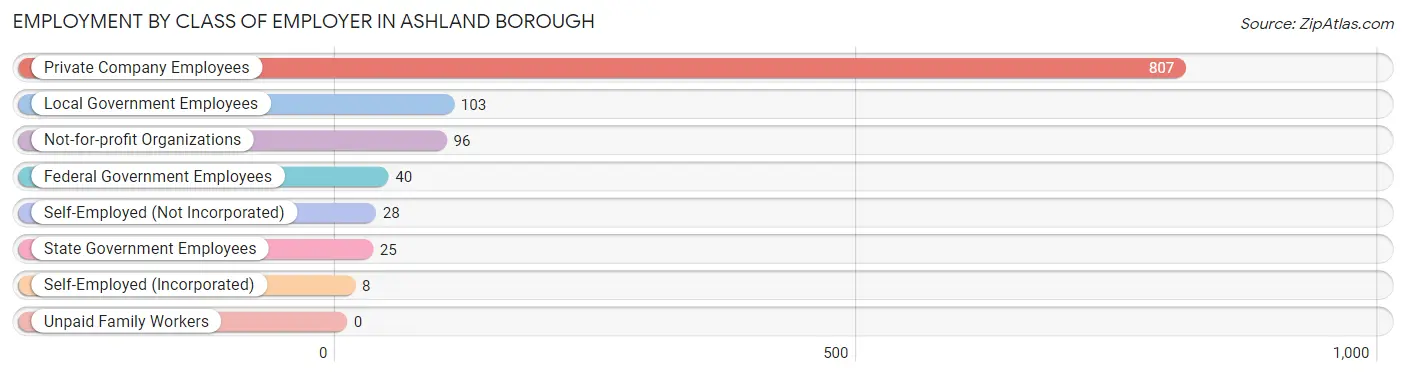
| Employer Class | # Employees | % Employees |
| Private Company Employees | 807 | 72.9% |
| Self-Employed (Incorporated) | 8 | 0.7% |
| Self-Employed (Not Incorporated) | 28 | 2.5% |
| Not-for-profit Organizations | 96 | 8.7% |
| Local Government Employees | 103 | 9.3% |
| State Government Employees | 25 | 2.3% |
| Federal Government Employees | 40 | 3.6% |
| Unpaid Family Workers | 0 | 0.0% |
| Total | 1,107 | 100.0% |
Employment Status by Age in Ashland borough
According to the labor force statistics for Ashland borough, out of the total population over 16 years of age (2,112), 57.4% or 1,212 individuals are in the labor force, with 6.0% or 73 of them unemployed. The age group with the highest labor force participation rate is 25 to 29 years, with 97.1% or 136 individuals in the labor force. Within the labor force, the 16 to 19 years age range has the highest percentage of unemployed individuals, with 31.1% or 14 of them being unemployed.
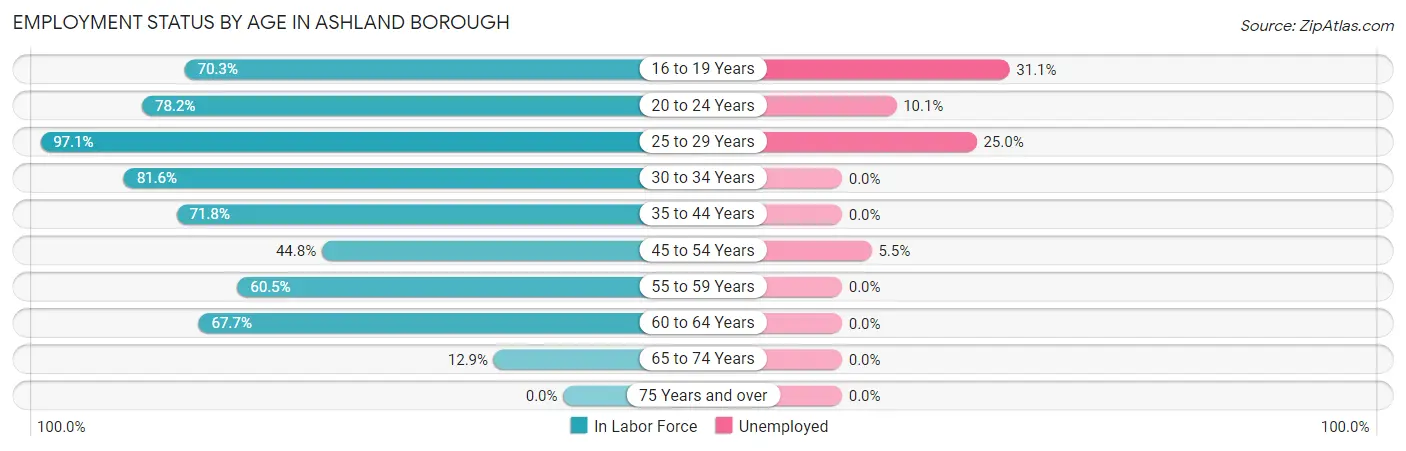
| Age Bracket | In Labor Force | Unemployed |
| 16 to 19 Years | 45 (70.3%) | 14 (31.1%) |
| 20 to 24 Years | 169 (78.2%) | 17 (10.1%) |
| 25 to 29 Years | 136 (97.1%) | 34 (25.0%) |
| 30 to 34 Years | 169 (81.6%) | 0 (0.0%) |
| 35 to 44 Years | 191 (71.8%) | 0 (0.0%) |
| 45 to 54 Years | 145 (44.8%) | 8 (5.5%) |
| 55 to 59 Years | 156 (60.5%) | 0 (0.0%) |
| 60 to 64 Years | 178 (67.7%) | 0 (0.0%) |
| 65 to 74 Years | 23 (12.9%) | 0 (0.0%) |
| 75 Years and over | 0 (0.0%) | 0 (0.0%) |
| Total | 1,212 (57.4%) | 73 (6.0%) |
Employment Status by Educational Attainment in Ashland borough
According to labor force statistics for Ashland borough, 66.9% of individuals (975) out of the total population between 25 and 64 years of age (1,458) are in the labor force, with 4.3% or 42 of them being unemployed. The group with the highest labor force participation rate are those with the educational attainment of college / associate degree, with 93.8% or 301 individuals in the labor force. Within the labor force, individuals with high school diploma education have the highest percentage of unemployment, with 10.6% or 42 of them being unemployed.
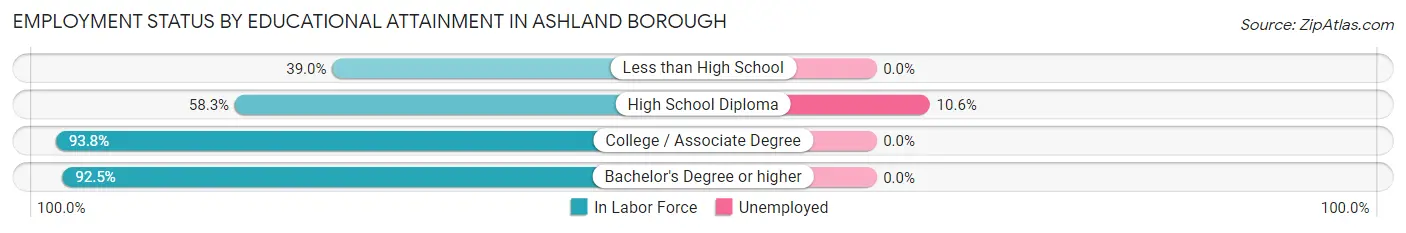
| Educational Attainment | In Labor Force | Unemployed |
| Less than High School | 106 (39.0%) | 0 (0.0%) |
| High School Diploma | 396 (58.3%) | 72 (10.6%) |
| College / Associate Degree | 301 (93.8%) | 0 (0.0%) |
| Bachelor's Degree or higher | 172 (92.5%) | 0 (0.0%) |
| Total | 975 (66.9%) | 63 (4.3%) |
Employment Occupations by Sex in Ashland borough
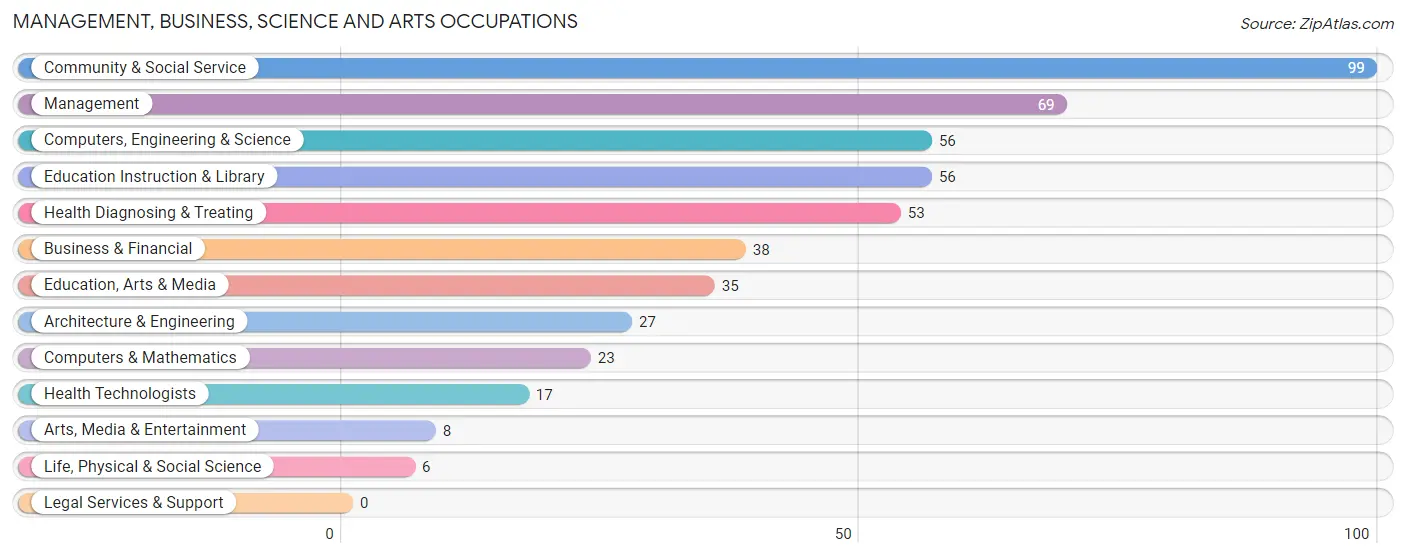
Management, Business, Science and Arts Occupations
The most common Management, Business, Science and Arts occupations in Ashland borough are Community & Social Service (99 | 8.7%), Management (69 | 6.1%), Computers, Engineering & Science (56 | 4.9%), Education Instruction & Library (56 | 4.9%), and Health Diagnosing & Treating (53 | 4.6%).
Management, Business, Science and Arts Occupations by Sex
Within the Management, Business, Science and Arts occupations in Ashland borough, the most male-oriented occupations are Architecture & Engineering (100.0%), Life, Physical & Social Science (100.0%), and Arts, Media & Entertainment (100.0%), while the most female-oriented occupations are Education, Arts & Media (100.0%), Health Diagnosing & Treating (100.0%), and Health Technologists (100.0%).
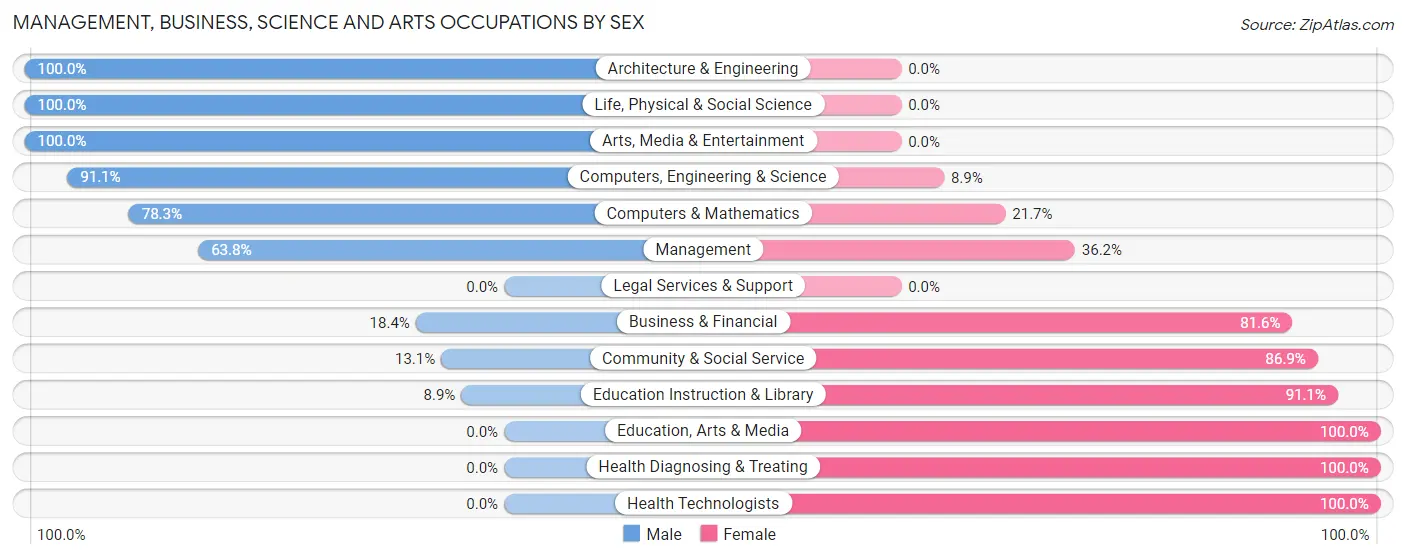
| Occupation | Male | Female |
| Management | 44 (63.8%) | 25 (36.2%) |
| Business & Financial | 7 (18.4%) | 31 (81.6%) |
| Computers, Engineering & Science | 51 (91.1%) | 5 (8.9%) |
| Computers & Mathematics | 18 (78.3%) | 5 (21.7%) |
| Architecture & Engineering | 27 (100.0%) | 0 (0.0%) |
| Life, Physical & Social Science | 6 (100.0%) | 0 (0.0%) |
| Community & Social Service | 13 (13.1%) | 86 (86.9%) |
| Education, Arts & Media | 0 (0.0%) | 35 (100.0%) |
| Legal Services & Support | 0 (0.0%) | 0 (0.0%) |
| Education Instruction & Library | 5 (8.9%) | 51 (91.1%) |
| Arts, Media & Entertainment | 8 (100.0%) | 0 (0.0%) |
| Health Diagnosing & Treating | 0 (0.0%) | 53 (100.0%) |
| Health Technologists | 0 (0.0%) | 17 (100.0%) |
| Total (Category) | 115 (36.5%) | 200 (63.5%) |
| Total (Overall) | 675 (59.3%) | 464 (40.7%) |
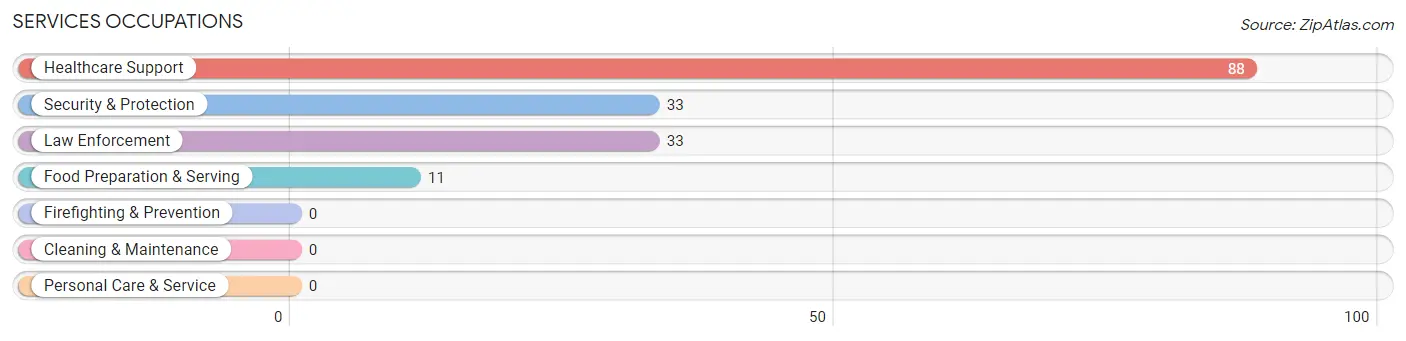
Services Occupations
The most common Services occupations in Ashland borough are Healthcare Support (88 | 7.7%), Security & Protection (33 | 2.9%), Law Enforcement (33 | 2.9%), and Food Preparation & Serving (11 | 1.0%).
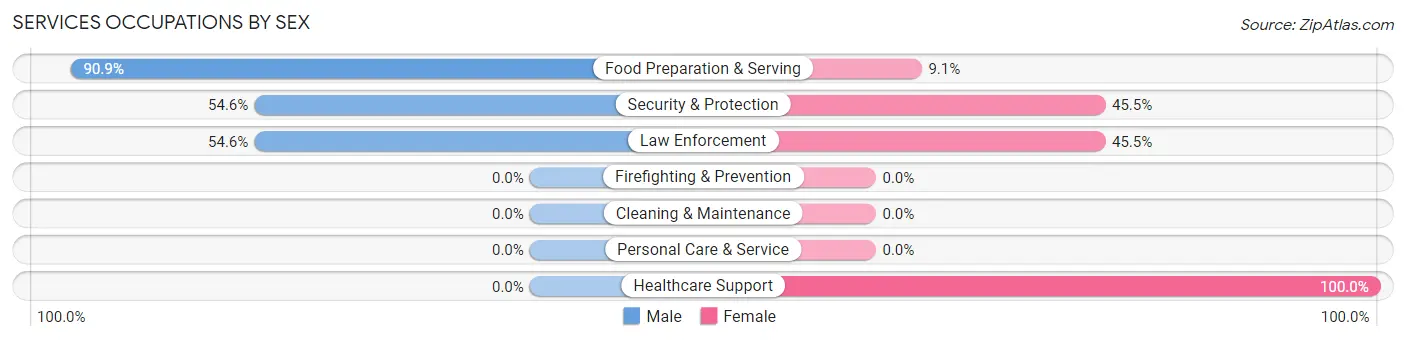
Services Occupations by Sex
Within the Services occupations in Ashland borough, the most male-oriented occupations are Food Preparation & Serving (90.9%), Security & Protection (54.5%), and Law Enforcement (54.5%), while the most female-oriented occupations are Healthcare Support (100.0%), Security & Protection (45.5%), and Law Enforcement (45.5%).
| Occupation | Male | Female |
| Healthcare Support | 0 (0.0%) | 88 (100.0%) |
| Security & Protection | 18 (54.5%) | 15 (45.5%) |
| Firefighting & Prevention | 0 (0.0%) | 0 (0.0%) |
| Law Enforcement | 18 (54.5%) | 15 (45.5%) |
| Food Preparation & Serving | 10 (90.9%) | 1 (9.1%) |
| Cleaning & Maintenance | 0 (0.0%) | 0 (0.0%) |
| Personal Care & Service | 0 (0.0%) | 0 (0.0%) |
| Total (Category) | 28 (21.2%) | 104 (78.8%) |
| Total (Overall) | 675 (59.3%) | 464 (40.7%) |
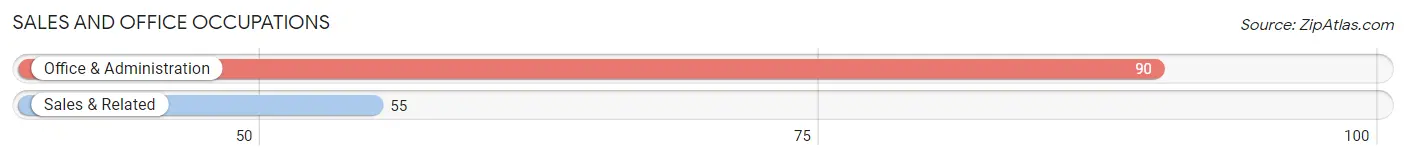
Sales and Office Occupations
The most common Sales and Office occupations in Ashland borough are Office & Administration (90 | 7.9%), and Sales & Related (55 | 4.8%).
Sales and Office Occupations by Sex
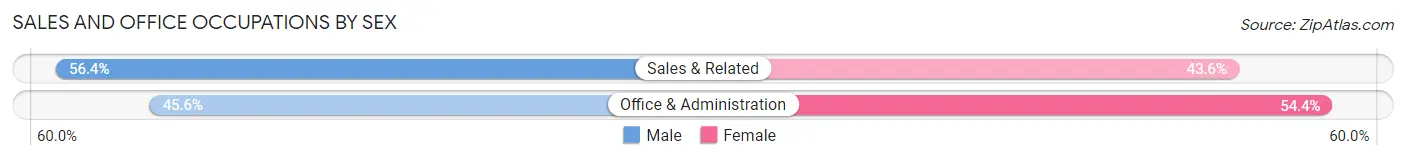
| Occupation | Male | Female |
| Sales & Related | 31 (56.4%) | 24 (43.6%) |
| Office & Administration | 41 (45.6%) | 49 (54.4%) |
| Total (Category) | 72 (49.7%) | 73 (50.3%) |
| Total (Overall) | 675 (59.3%) | 464 (40.7%) |
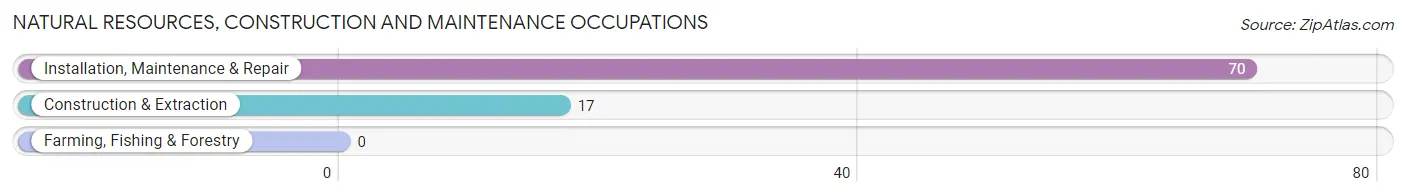
Natural Resources, Construction and Maintenance Occupations
The most common Natural Resources, Construction and Maintenance occupations in Ashland borough are Installation, Maintenance & Repair (70 | 6.1%), and Construction & Extraction (17 | 1.5%).
Natural Resources, Construction and Maintenance Occupations by Sex
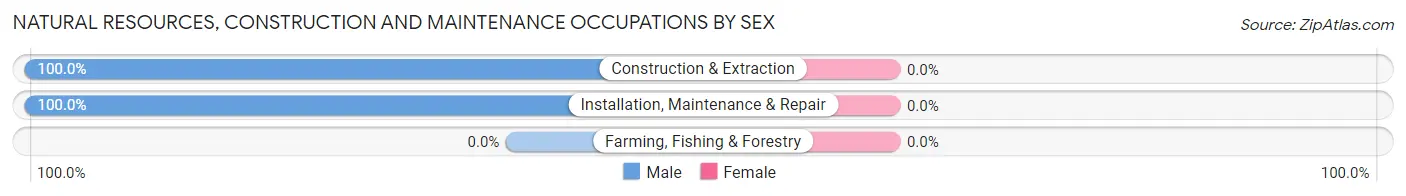
| Occupation | Male | Female |
| Farming, Fishing & Forestry | 0 (0.0%) | 0 (0.0%) |
| Construction & Extraction | 17 (100.0%) | 0 (0.0%) |
| Installation, Maintenance & Repair | 70 (100.0%) | 0 (0.0%) |
| Total (Category) | 87 (100.0%) | 0 (0.0%) |
| Total (Overall) | 675 (59.3%) | 464 (40.7%) |
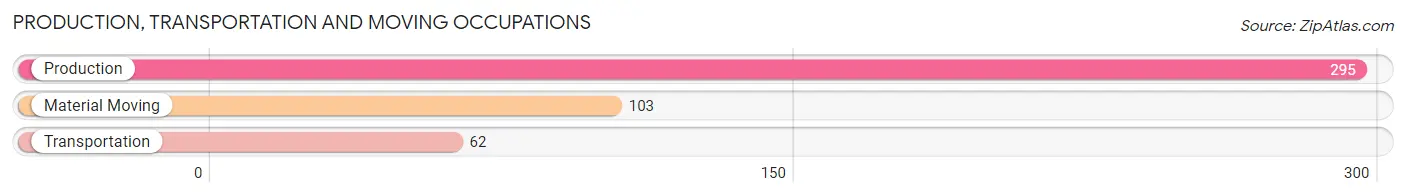
Production, Transportation and Moving Occupations
The most common Production, Transportation and Moving occupations in Ashland borough are Production (295 | 25.9%), Material Moving (103 | 9.0%), and Transportation (62 | 5.4%).
Production, Transportation and Moving Occupations by Sex
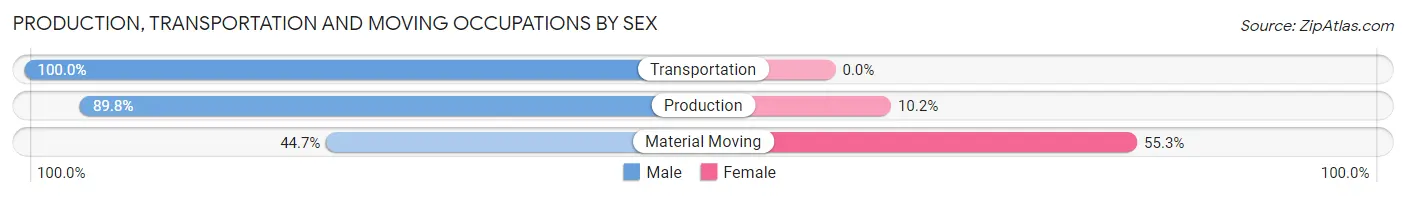
| Occupation | Male | Female |
| Production | 265 (89.8%) | 30 (10.2%) |
| Transportation | 62 (100.0%) | 0 (0.0%) |
| Material Moving | 46 (44.7%) | 57 (55.3%) |
| Total (Category) | 373 (81.1%) | 87 (18.9%) |
| Total (Overall) | 675 (59.3%) | 464 (40.7%) |
Employment Industries by Sex in Ashland borough
Employment Industries in Ashland borough
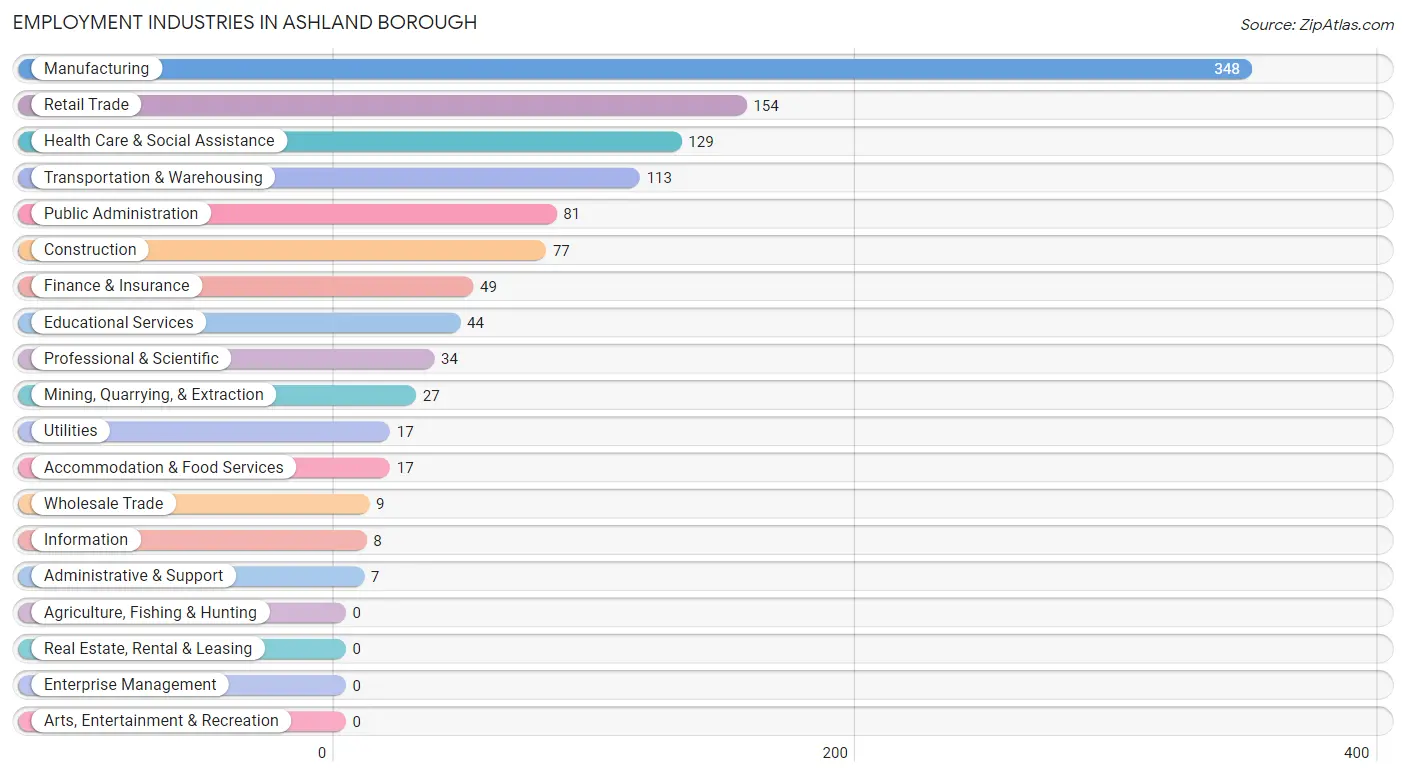
The major employment industries in Ashland borough include Manufacturing (348 | 30.5%), Retail Trade (154 | 13.5%), Health Care & Social Assistance (129 | 11.3%), Transportation & Warehousing (113 | 9.9%), and Public Administration (81 | 7.1%).
Employment Industries by Sex in Ashland borough
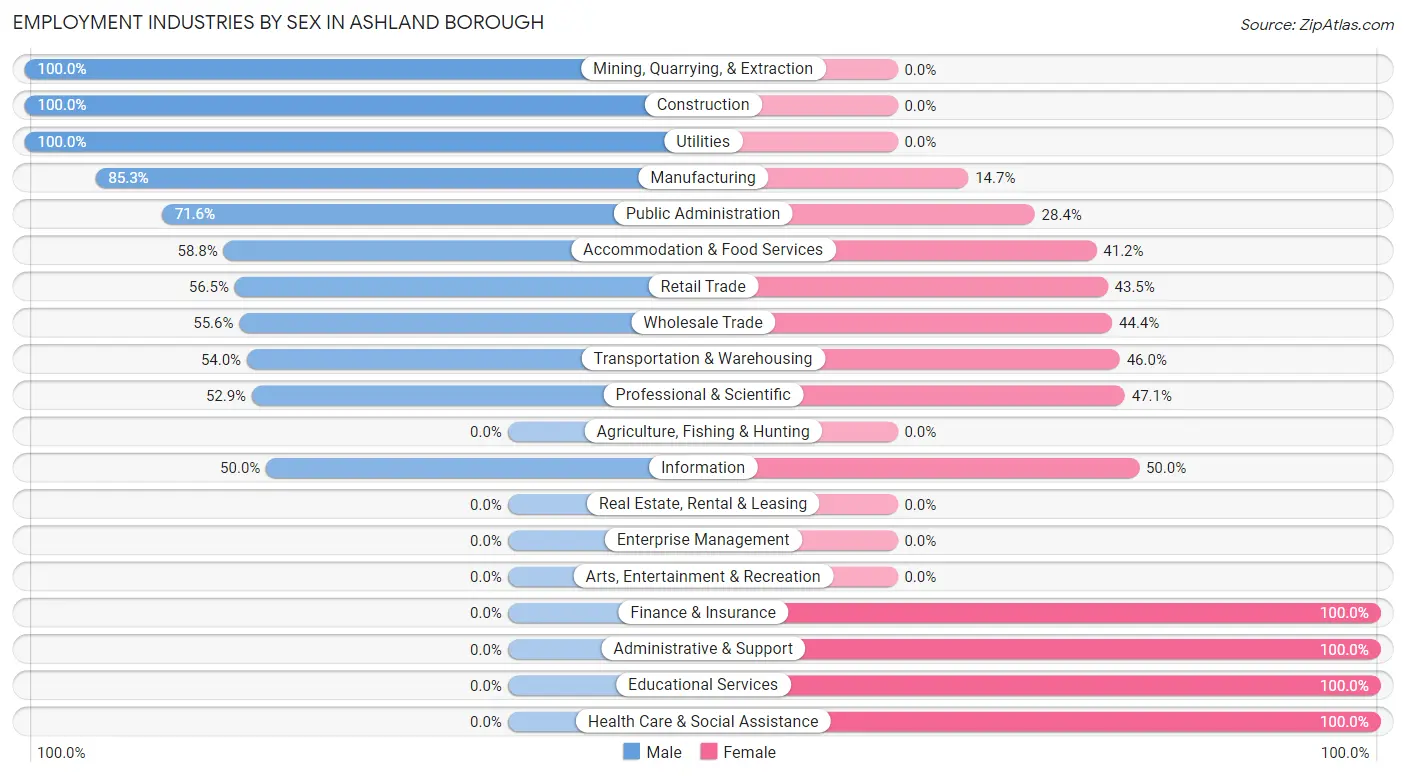
The Ashland borough industries that see more men than women are Mining, Quarrying, & Extraction (100.0%), Construction (100.0%), and Utilities (100.0%), whereas the industries that tend to have a higher number of women are Finance & Insurance (100.0%), Administrative & Support (100.0%), and Educational Services (100.0%).
| Industry | Male | Female |
| Agriculture, Fishing & Hunting | 0 (0.0%) | 0 (0.0%) |
| Mining, Quarrying, & Extraction | 27 (100.0%) | 0 (0.0%) |
| Construction | 77 (100.0%) | 0 (0.0%) |
| Manufacturing | 297 (85.3%) | 51 (14.7%) |
| Wholesale Trade | 5 (55.6%) | 4 (44.4%) |
| Retail Trade | 87 (56.5%) | 67 (43.5%) |
| Transportation & Warehousing | 61 (54.0%) | 52 (46.0%) |
| Utilities | 17 (100.0%) | 0 (0.0%) |
| Information | 4 (50.0%) | 4 (50.0%) |
| Finance & Insurance | 0 (0.0%) | 49 (100.0%) |
| Real Estate, Rental & Leasing | 0 (0.0%) | 0 (0.0%) |
| Professional & Scientific | 18 (52.9%) | 16 (47.1%) |
| Enterprise Management | 0 (0.0%) | 0 (0.0%) |
| Administrative & Support | 0 (0.0%) | 7 (100.0%) |
| Educational Services | 0 (0.0%) | 44 (100.0%) |
| Health Care & Social Assistance | 0 (0.0%) | 129 (100.0%) |
| Arts, Entertainment & Recreation | 0 (0.0%) | 0 (0.0%) |
| Accommodation & Food Services | 10 (58.8%) | 7 (41.2%) |
| Public Administration | 58 (71.6%) | 23 (28.4%) |
| Total | 675 (59.3%) | 464 (40.7%) |
Education in Ashland borough
School Enrollment in Ashland borough
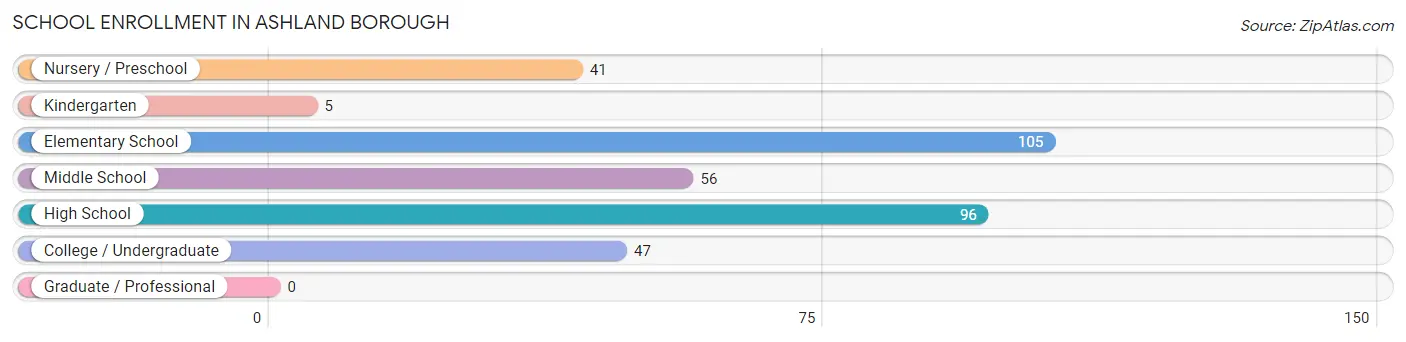
The most common levels of schooling among the 350 students in Ashland borough are elementary school (105 | 30.0%), high school (96 | 27.4%), and middle school (56 | 16.0%).
| School Level | # Students | % Students |
| Nursery / Preschool | 41 | 11.7% |
| Kindergarten | 5 | 1.4% |
| Elementary School | 105 | 30.0% |
| Middle School | 56 | 16.0% |
| High School | 96 | 27.4% |
| College / Undergraduate | 47 | 13.4% |
| Graduate / Professional | 0 | 0.0% |
| Total | 350 | 100.0% |
School Enrollment by Age by Funding Source in Ashland borough
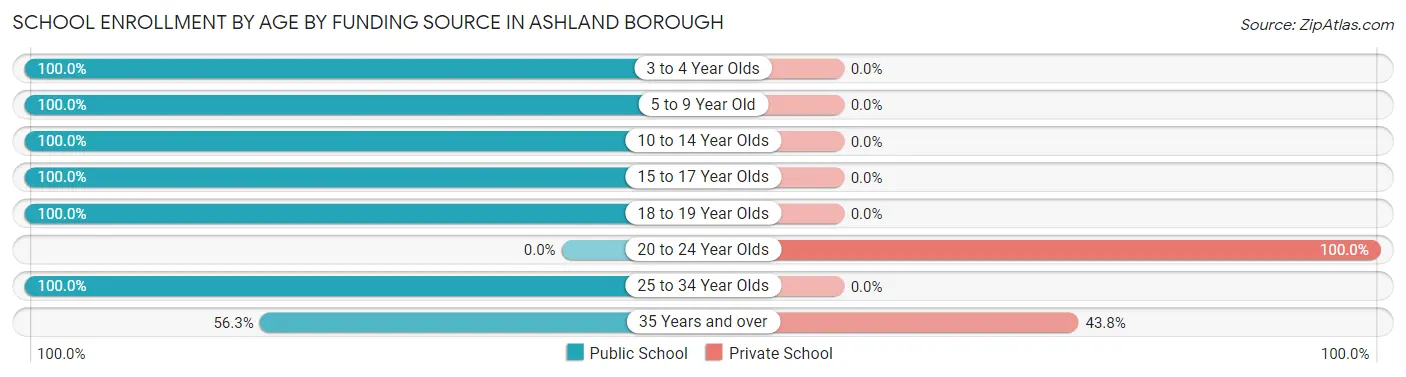
Out of a total of 350 students who are enrolled in schools in Ashland borough, 15 (4.3%) attend a private institution, while the remaining 335 (95.7%) are enrolled in public schools. The age group of 20 to 24 year olds has the highest likelihood of being enrolled in private schools, with 8 (100.0% in the age bracket) enrolled. Conversely, the age group of 3 to 4 year olds has the lowest likelihood of being enrolled in a private school, with 41 (100.0% in the age bracket) attending a public institution.
| Age Bracket | Public School | Private School |
| 3 to 4 Year Olds | 41 (100.0%) | 0 (0.0%) |
| 5 to 9 Year Old | 86 (100.0%) | 0 (0.0%) |
| 10 to 14 Year Olds | 97 (100.0%) | 0 (0.0%) |
| 15 to 17 Year Olds | 41 (100.0%) | 0 (0.0%) |
| 18 to 19 Year Olds | 37 (100.0%) | 0 (0.0%) |
| 20 to 24 Year Olds | 0 (0.0%) | 8 (100.0%) |
| 25 to 34 Year Olds | 24 (100.0%) | 0 (0.0%) |
| 35 Years and over | 9 (56.2%) | 7 (43.8%) |
| Total | 335 (95.7%) | 15 (4.3%) |
Educational Attainment by Field of Study in Ashland borough
Education (79 | 37.1%), business (36 | 16.9%), bio, nature & agricultural (26 | 12.2%), physical & health sciences (18 | 8.5%), and arts & humanities (18 | 8.5%) are the most common fields of study among 213 individuals in Ashland borough who have obtained a bachelor's degree or higher.
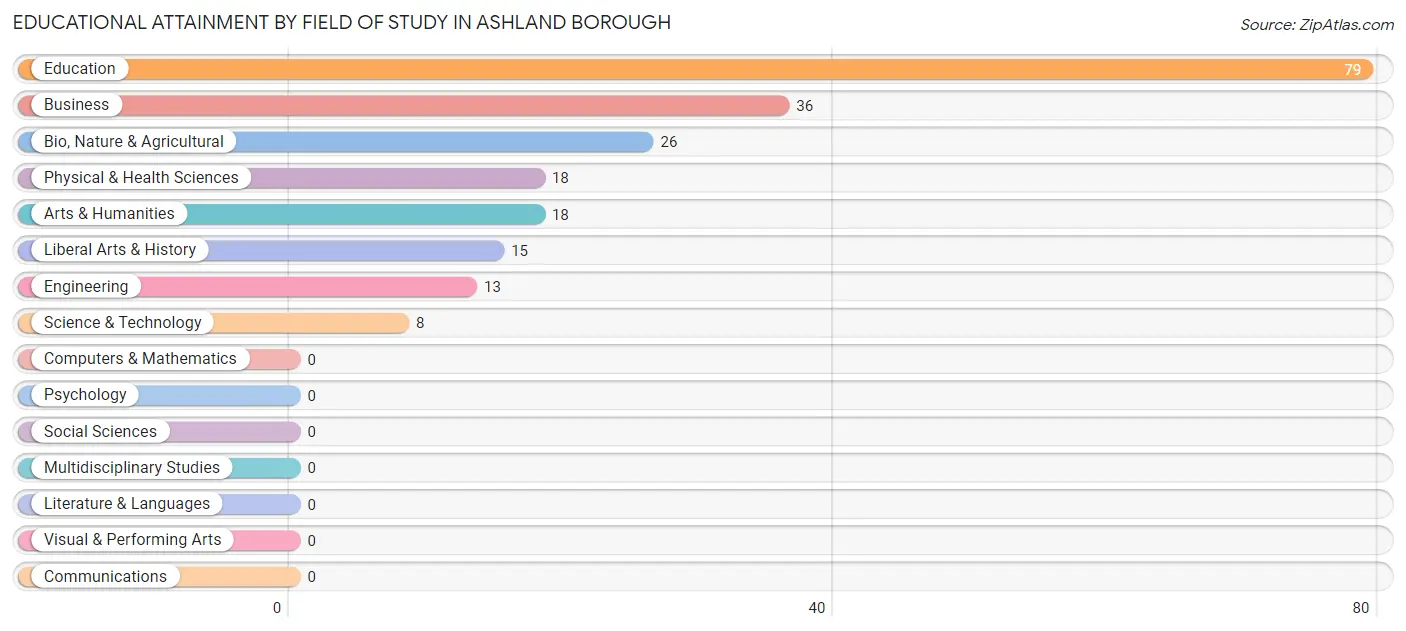
| Field of Study | # Graduates | % Graduates |
| Computers & Mathematics | 0 | 0.0% |
| Bio, Nature & Agricultural | 26 | 12.2% |
| Physical & Health Sciences | 18 | 8.5% |
| Psychology | 0 | 0.0% |
| Social Sciences | 0 | 0.0% |
| Engineering | 13 | 6.1% |
| Multidisciplinary Studies | 0 | 0.0% |
| Science & Technology | 8 | 3.8% |
| Business | 36 | 16.9% |
| Education | 79 | 37.1% |
| Literature & Languages | 0 | 0.0% |
| Liberal Arts & History | 15 | 7.0% |
| Visual & Performing Arts | 0 | 0.0% |
| Communications | 0 | 0.0% |
| Arts & Humanities | 18 | 8.5% |
| Total | 213 | 100.0% |
Transportation & Commute in Ashland borough
Vehicle Availability by Sex in Ashland borough
The most prevalent vehicle ownership categories in Ashland borough are males with 2 vehicles (365, accounting for 55.2%) and females with 2 vehicles (212, making up 82.0%).
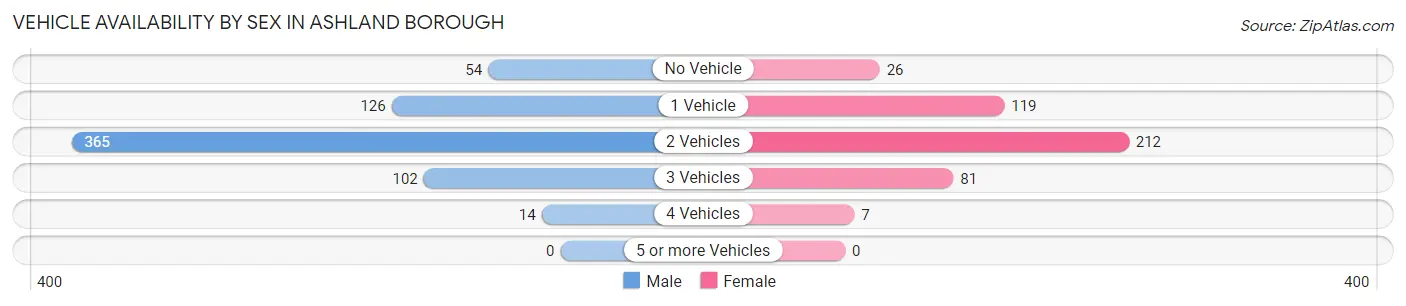
| Vehicles Available | Male | Female |
| No Vehicle | 54 (8.2%) | 26 (5.8%) |
| 1 Vehicle | 126 (19.1%) | 119 (26.7%) |
| 2 Vehicles | 365 (55.2%) | 212 (47.6%) |
| 3 Vehicles | 102 (15.4%) | 81 (18.2%) |
| 4 Vehicles | 14 (2.1%) | 7 (1.6%) |
| 5 or more Vehicles | 0 (0.0%) | 0 (0.0%) |
| Total | 661 (100.0%) | 445 (100.0%) |
Commute Time in Ashland borough
The most frequently occuring commute durations in Ashland borough are 25 to 29 minutes (201 commuters, 18.2%), 15 to 19 minutes (199 commuters, 18.0%), and 30 to 34 minutes (164 commuters, 14.8%).
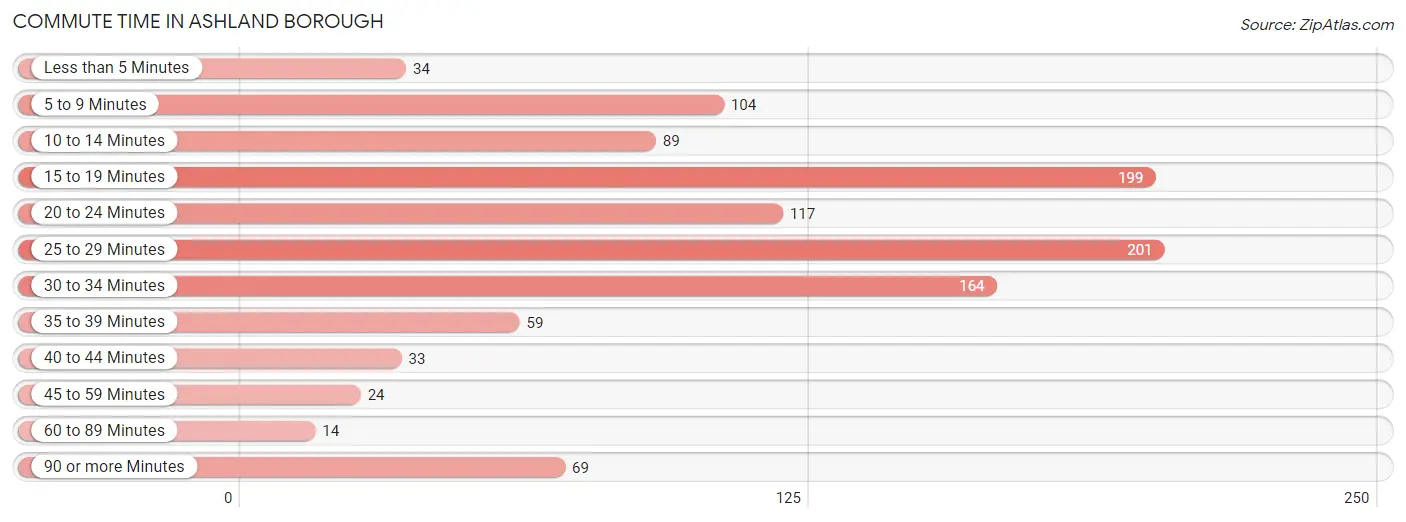
| Commute Time | # Commuters | % Commuters |
| Less than 5 Minutes | 34 | 3.1% |
| 5 to 9 Minutes | 104 | 9.4% |
| 10 to 14 Minutes | 89 | 8.0% |
| 15 to 19 Minutes | 199 | 18.0% |
| 20 to 24 Minutes | 117 | 10.6% |
| 25 to 29 Minutes | 201 | 18.2% |
| 30 to 34 Minutes | 164 | 14.8% |
| 35 to 39 Minutes | 59 | 5.3% |
| 40 to 44 Minutes | 33 | 3.0% |
| 45 to 59 Minutes | 24 | 2.2% |
| 60 to 89 Minutes | 14 | 1.3% |
| 90 or more Minutes | 69 | 6.2% |
Commute Time by Sex in Ashland borough
The most common commute times in Ashland borough are 25 to 29 minutes (201 commuters, 30.4%) for males and 15 to 19 minutes (118 commuters, 26.5%) for females.
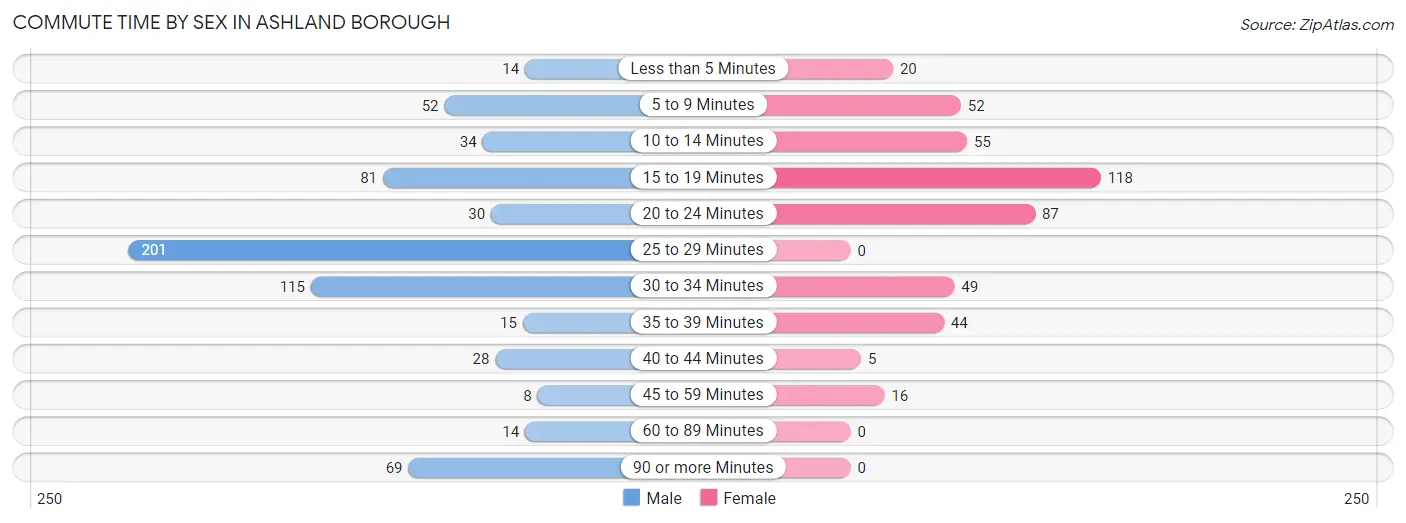
| Commute Time | Male | Female |
| Less than 5 Minutes | 14 (2.1%) | 20 (4.5%) |
| 5 to 9 Minutes | 52 (7.9%) | 52 (11.7%) |
| 10 to 14 Minutes | 34 (5.1%) | 55 (12.3%) |
| 15 to 19 Minutes | 81 (12.2%) | 118 (26.5%) |
| 20 to 24 Minutes | 30 (4.5%) | 87 (19.5%) |
| 25 to 29 Minutes | 201 (30.4%) | 0 (0.0%) |
| 30 to 34 Minutes | 115 (17.4%) | 49 (11.0%) |
| 35 to 39 Minutes | 15 (2.3%) | 44 (9.9%) |
| 40 to 44 Minutes | 28 (4.2%) | 5 (1.1%) |
| 45 to 59 Minutes | 8 (1.2%) | 16 (3.6%) |
| 60 to 89 Minutes | 14 (2.1%) | 0 (0.0%) |
| 90 or more Minutes | 69 (10.4%) | 0 (0.0%) |
Time of Departure to Work by Sex in Ashland borough
The most frequent times of departure to work in Ashland borough are 5:00 AM to 5:29 AM (190, 28.7%) for males and 7:00 AM to 7:29 AM (92, 20.6%) for females.
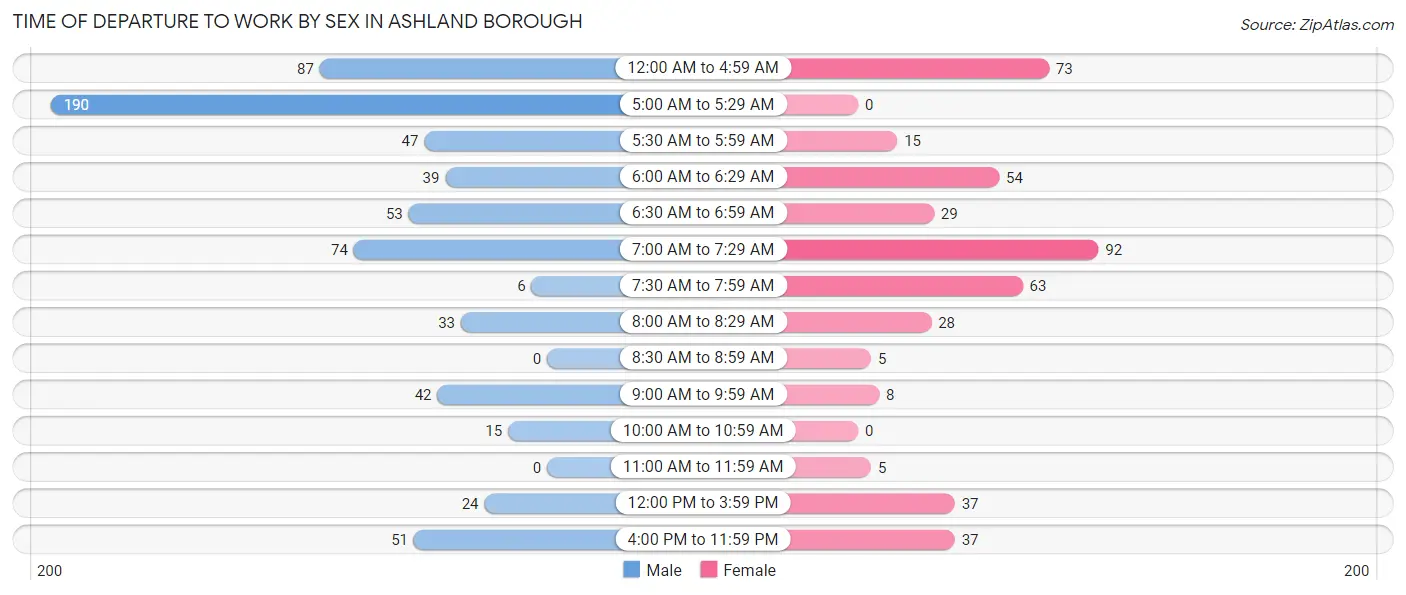
| Time of Departure | Male | Female |
| 12:00 AM to 4:59 AM | 87 (13.2%) | 73 (16.4%) |
| 5:00 AM to 5:29 AM | 190 (28.7%) | 0 (0.0%) |
| 5:30 AM to 5:59 AM | 47 (7.1%) | 15 (3.4%) |
| 6:00 AM to 6:29 AM | 39 (5.9%) | 54 (12.1%) |
| 6:30 AM to 6:59 AM | 53 (8.0%) | 29 (6.5%) |
| 7:00 AM to 7:29 AM | 74 (11.2%) | 92 (20.6%) |
| 7:30 AM to 7:59 AM | 6 (0.9%) | 63 (14.1%) |
| 8:00 AM to 8:29 AM | 33 (5.0%) | 28 (6.3%) |
| 8:30 AM to 8:59 AM | 0 (0.0%) | 5 (1.1%) |
| 9:00 AM to 9:59 AM | 42 (6.4%) | 8 (1.8%) |
| 10:00 AM to 10:59 AM | 15 (2.3%) | 0 (0.0%) |
| 11:00 AM to 11:59 AM | 0 (0.0%) | 5 (1.1%) |
| 12:00 PM to 3:59 PM | 24 (3.6%) | 37 (8.3%) |
| 4:00 PM to 11:59 PM | 51 (7.7%) | 37 (8.3%) |
| Total | 661 (100.0%) | 446 (100.0%) |
Housing Occupancy in Ashland borough
Occupancy by Ownership in Ashland borough
Of the total 1,153 dwellings in Ashland borough, owner-occupied units account for 726 (63.0%), while renter-occupied units make up 427 (37.0%).
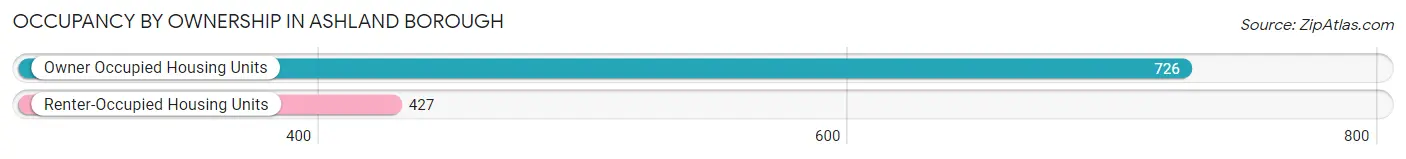
| Occupancy | # Housing Units | % Housing Units |
| Owner Occupied Housing Units | 726 | 63.0% |
| Renter-Occupied Housing Units | 427 | 37.0% |
| Total Occupied Housing Units | 1,153 | 100.0% |
Occupancy by Household Size in Ashland borough
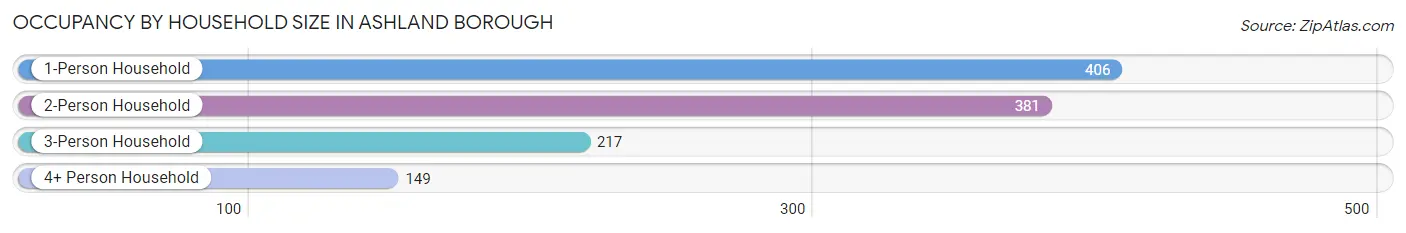
| Household Size | # Housing Units | % Housing Units |
| 1-Person Household | 406 | 35.2% |
| 2-Person Household | 381 | 33.0% |
| 3-Person Household | 217 | 18.8% |
| 4+ Person Household | 149 | 12.9% |
| Total Housing Units | 1,153 | 100.0% |
Occupancy by Ownership by Household Size in Ashland borough
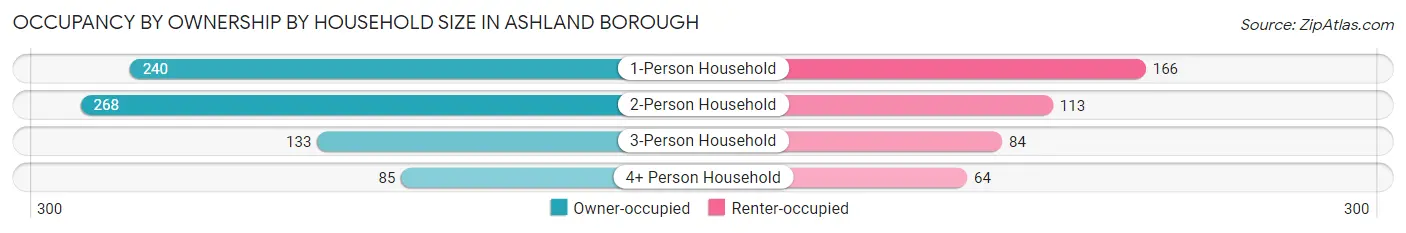
| Household Size | Owner-occupied | Renter-occupied |
| 1-Person Household | 240 (59.1%) | 166 (40.9%) |
| 2-Person Household | 268 (70.3%) | 113 (29.7%) |
| 3-Person Household | 133 (61.3%) | 84 (38.7%) |
| 4+ Person Household | 85 (57.1%) | 64 (42.9%) |
| Total Housing Units | 726 (63.0%) | 427 (37.0%) |
Occupancy by Educational Attainment in Ashland borough
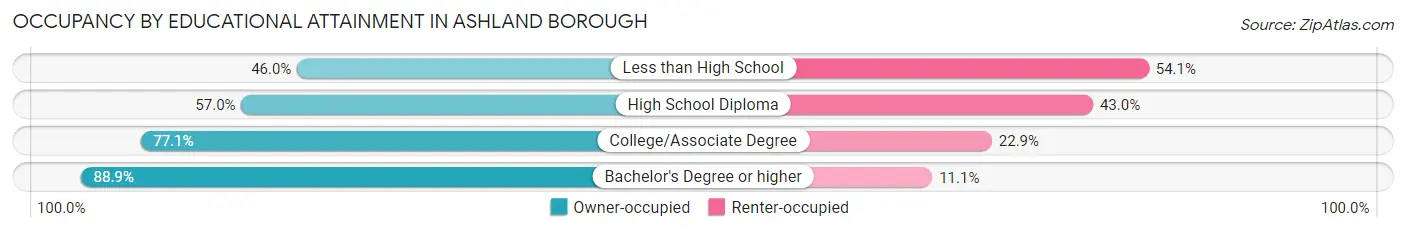
| Household Size | Owner-occupied | Renter-occupied |
| Less than High School | 102 (46.0%) | 120 (54.0%) |
| High School Diploma | 305 (57.0%) | 230 (43.0%) |
| College/Associate Degree | 215 (77.1%) | 64 (22.9%) |
| Bachelor's Degree or higher | 104 (88.9%) | 13 (11.1%) |
Occupancy by Age of Householder in Ashland borough
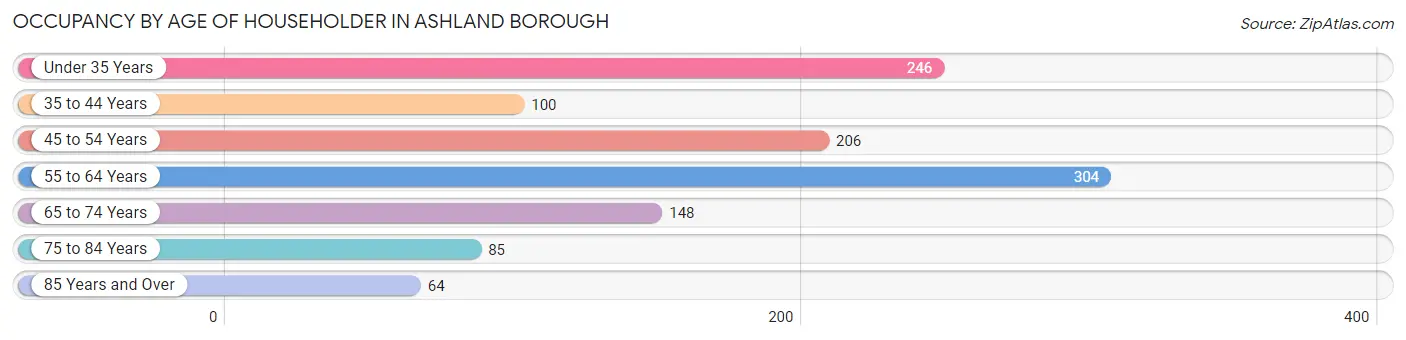
| Age Bracket | # Households | % Households |
| Under 35 Years | 246 | 21.3% |
| 35 to 44 Years | 100 | 8.7% |
| 45 to 54 Years | 206 | 17.9% |
| 55 to 64 Years | 304 | 26.4% |
| 65 to 74 Years | 148 | 12.8% |
| 75 to 84 Years | 85 | 7.4% |
| 85 Years and Over | 64 | 5.6% |
| Total | 1,153 | 100.0% |
Housing Finances in Ashland borough
Median Income by Occupancy in Ashland borough
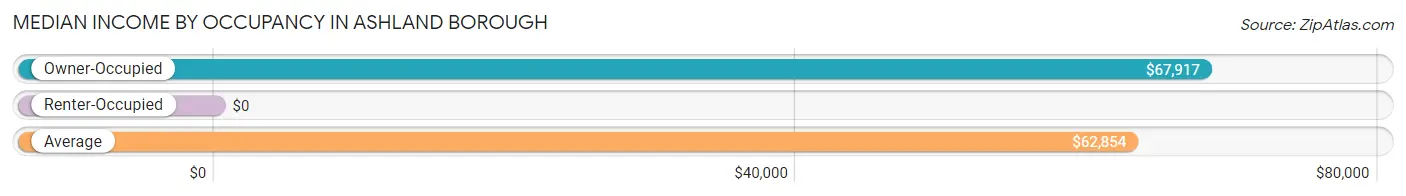
| Occupancy Type | # Households | Median Income |
| Owner-Occupied | 726 (63.0%) | $67,917 |
| Renter-Occupied | 427 (37.0%) | $0 |
| Average | 1,153 (100.0%) | $62,854 |
Occupancy by Householder Income Bracket in Ashland borough
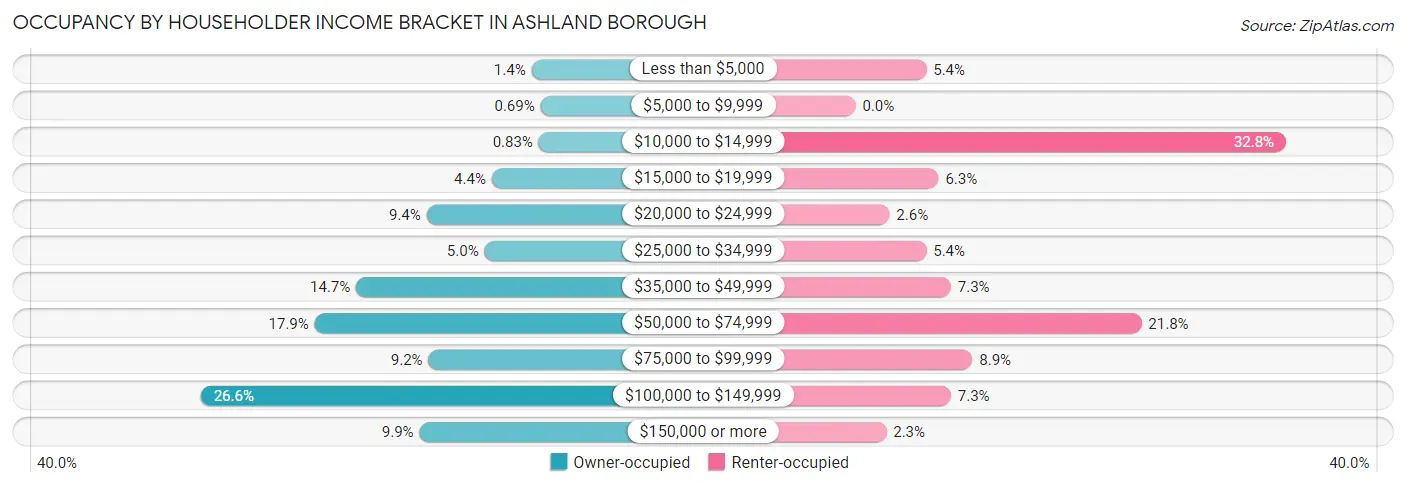
| Income Bracket | Owner-occupied | Renter-occupied |
| Less than $5,000 | 10 (1.4%) | 23 (5.4%) |
| $5,000 to $9,999 | 5 (0.7%) | 0 (0.0%) |
| $10,000 to $14,999 | 6 (0.8%) | 140 (32.8%) |
| $15,000 to $19,999 | 32 (4.4%) | 27 (6.3%) |
| $20,000 to $24,999 | 68 (9.4%) | 11 (2.6%) |
| $25,000 to $34,999 | 36 (5.0%) | 23 (5.4%) |
| $35,000 to $49,999 | 107 (14.7%) | 31 (7.3%) |
| $50,000 to $74,999 | 130 (17.9%) | 93 (21.8%) |
| $75,000 to $99,999 | 67 (9.2%) | 38 (8.9%) |
| $100,000 to $149,999 | 193 (26.6%) | 31 (7.3%) |
| $150,000 or more | 72 (9.9%) | 10 (2.3%) |
| Total | 726 (100.0%) | 427 (100.0%) |
Monthly Housing Cost Tiers in Ashland borough
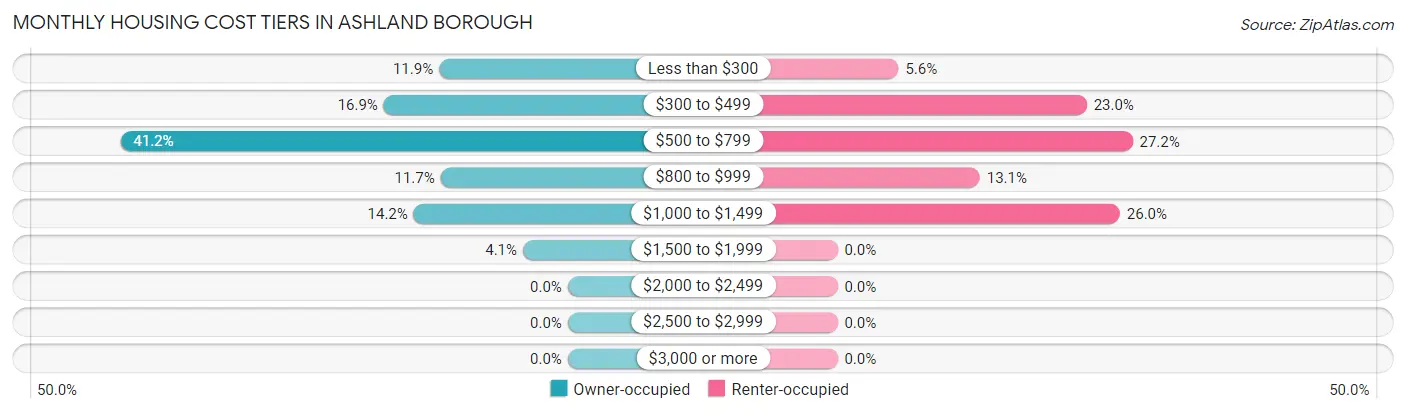
| Monthly Cost | Owner-occupied | Renter-occupied |
| Less than $300 | 86 (11.8%) | 24 (5.6%) |
| $300 to $499 | 123 (16.9%) | 98 (23.0%) |
| $500 to $799 | 299 (41.2%) | 116 (27.2%) |
| $800 to $999 | 85 (11.7%) | 56 (13.1%) |
| $1,000 to $1,499 | 103 (14.2%) | 111 (26.0%) |
| $1,500 to $1,999 | 30 (4.1%) | 0 (0.0%) |
| $2,000 to $2,499 | 0 (0.0%) | 0 (0.0%) |
| $2,500 to $2,999 | 0 (0.0%) | 0 (0.0%) |
| $3,000 or more | 0 (0.0%) | 0 (0.0%) |
| Total | 726 (100.0%) | 427 (100.0%) |
Physical Housing Characteristics in Ashland borough
Housing Structures in Ashland borough
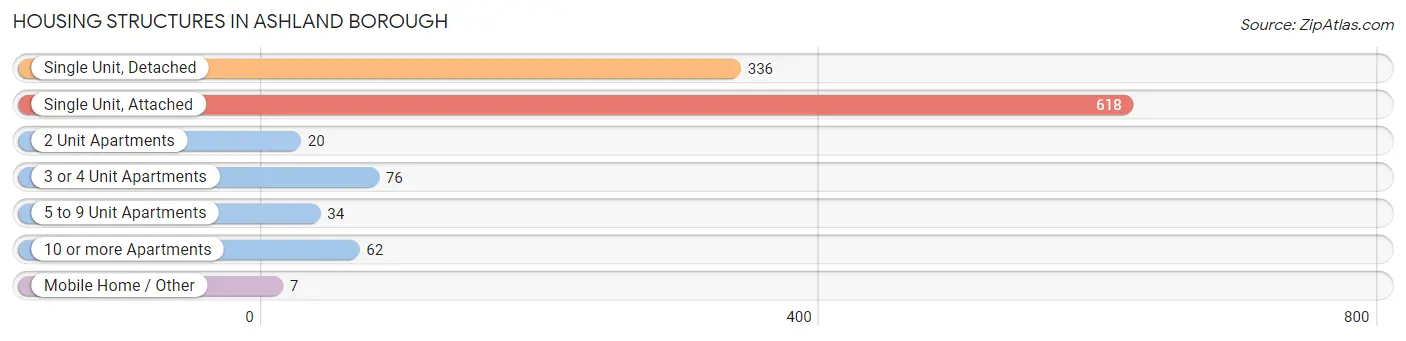
| Structure Type | # Housing Units | % Housing Units |
| Single Unit, Detached | 336 | 29.1% |
| Single Unit, Attached | 618 | 53.6% |
| 2 Unit Apartments | 20 | 1.7% |
| 3 or 4 Unit Apartments | 76 | 6.6% |
| 5 to 9 Unit Apartments | 34 | 2.9% |
| 10 or more Apartments | 62 | 5.4% |
| Mobile Home / Other | 7 | 0.6% |
| Total | 1,153 | 100.0% |
Housing Structures by Occupancy in Ashland borough
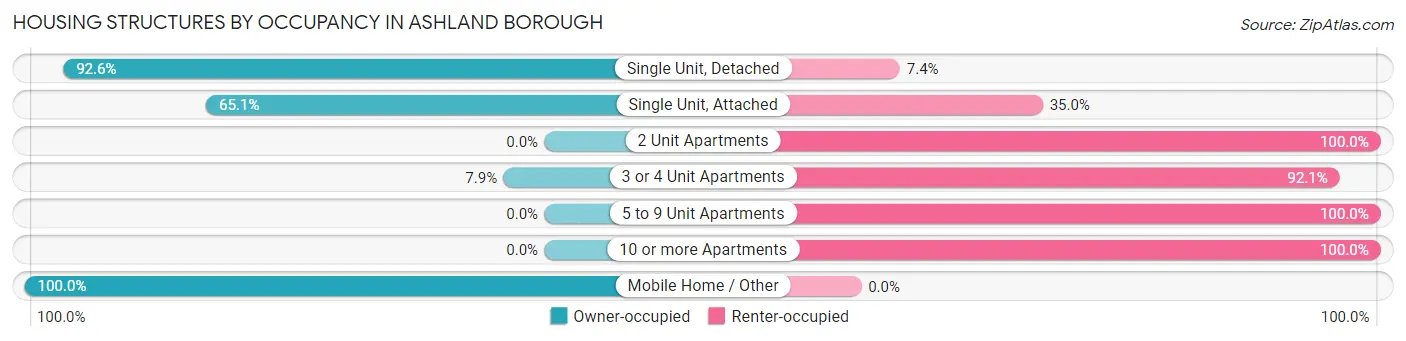
| Structure Type | Owner-occupied | Renter-occupied |
| Single Unit, Detached | 311 (92.6%) | 25 (7.4%) |
| Single Unit, Attached | 402 (65.0%) | 216 (34.9%) |
| 2 Unit Apartments | 0 (0.0%) | 20 (100.0%) |
| 3 or 4 Unit Apartments | 6 (7.9%) | 70 (92.1%) |
| 5 to 9 Unit Apartments | 0 (0.0%) | 34 (100.0%) |
| 10 or more Apartments | 0 (0.0%) | 62 (100.0%) |
| Mobile Home / Other | 7 (100.0%) | 0 (0.0%) |
| Total | 726 (63.0%) | 427 (37.0%) |
Housing Structures by Number of Rooms in Ashland borough
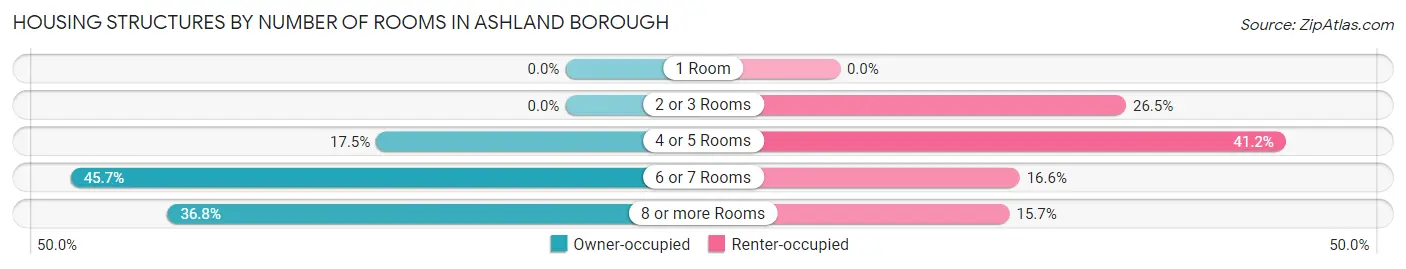
| Number of Rooms | Owner-occupied | Renter-occupied |
| 1 Room | 0 (0.0%) | 0 (0.0%) |
| 2 or 3 Rooms | 0 (0.0%) | 113 (26.5%) |
| 4 or 5 Rooms | 127 (17.5%) | 176 (41.2%) |
| 6 or 7 Rooms | 332 (45.7%) | 71 (16.6%) |
| 8 or more Rooms | 267 (36.8%) | 67 (15.7%) |
| Total | 726 (100.0%) | 427 (100.0%) |
Housing Structure by Heating Type in Ashland borough
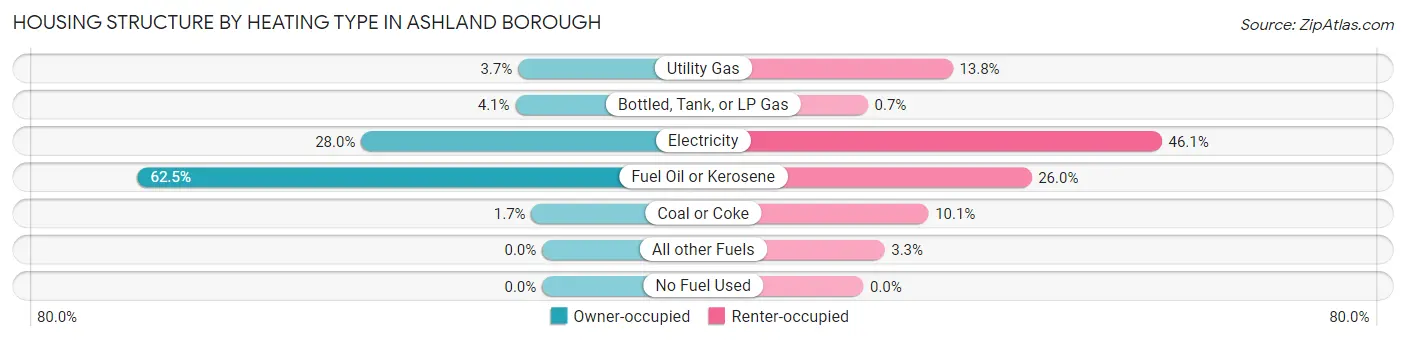
| Heating Type | Owner-occupied | Renter-occupied |
| Utility Gas | 27 (3.7%) | 59 (13.8%) |
| Bottled, Tank, or LP Gas | 30 (4.1%) | 3 (0.7%) |
| Electricity | 203 (28.0%) | 197 (46.1%) |
| Fuel Oil or Kerosene | 454 (62.5%) | 111 (26.0%) |
| Coal or Coke | 12 (1.7%) | 43 (10.1%) |
| All other Fuels | 0 (0.0%) | 14 (3.3%) |
| No Fuel Used | 0 (0.0%) | 0 (0.0%) |
| Total | 726 (100.0%) | 427 (100.0%) |
Household Vehicle Usage in Ashland borough
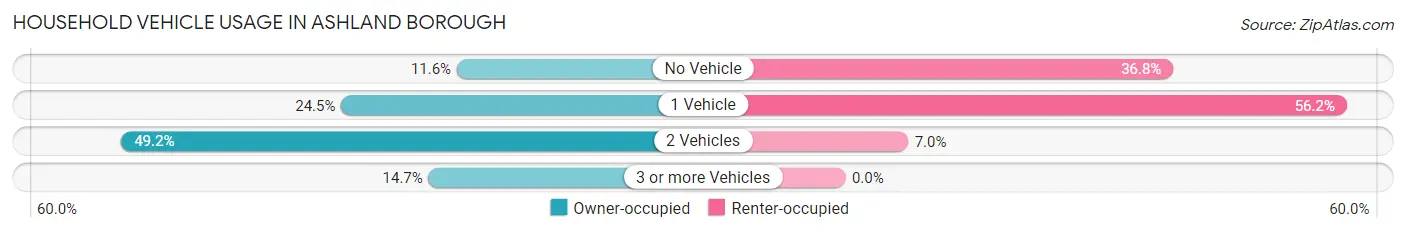
| Vehicles per Household | Owner-occupied | Renter-occupied |
| No Vehicle | 84 (11.6%) | 157 (36.8%) |
| 1 Vehicle | 178 (24.5%) | 240 (56.2%) |
| 2 Vehicles | 357 (49.2%) | 30 (7.0%) |
| 3 or more Vehicles | 107 (14.7%) | 0 (0.0%) |
| Total | 726 (100.0%) | 427 (100.0%) |
Real Estate & Mortgages in Ashland borough
Real Estate and Mortgage Overview in Ashland borough
| Characteristic | Without Mortgage | With Mortgage |
| Housing Units | 411 | 315 |
| Median Property Value | $45,800 | $73,900 |
| Median Household Income | $65,729 | $34 |
| Monthly Housing Costs | $495 | $0 |
| Real Estate Taxes | $1,408 | $6 |
Property Value by Mortgage Status in Ashland borough
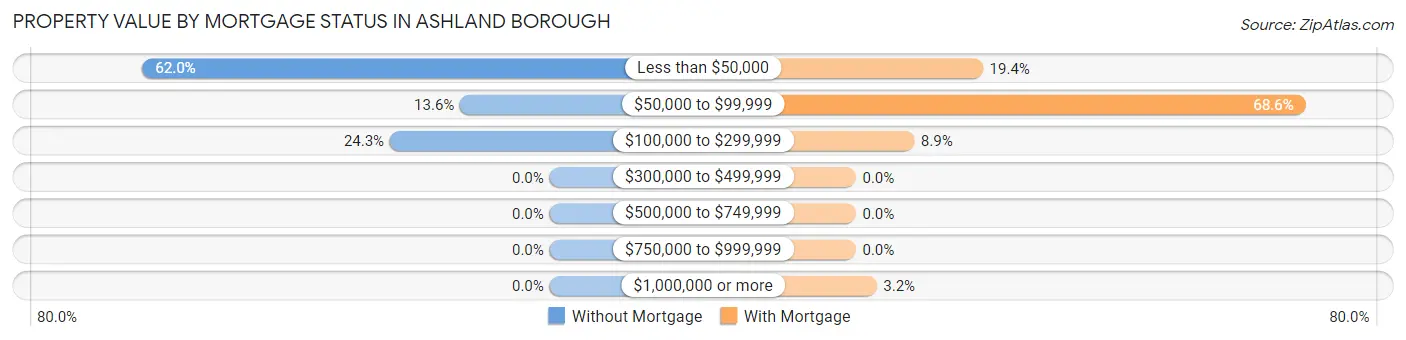
| Property Value | Without Mortgage | With Mortgage |
| Less than $50,000 | 255 (62.0%) | 61 (19.4%) |
| $50,000 to $99,999 | 56 (13.6%) | 216 (68.6%) |
| $100,000 to $299,999 | 100 (24.3%) | 28 (8.9%) |
| $300,000 to $499,999 | 0 (0.0%) | 0 (0.0%) |
| $500,000 to $749,999 | 0 (0.0%) | 0 (0.0%) |
| $750,000 to $999,999 | 0 (0.0%) | 0 (0.0%) |
| $1,000,000 or more | 0 (0.0%) | 10 (3.2%) |
| Total | 411 (100.0%) | 315 (100.0%) |
Household Income by Mortgage Status in Ashland borough
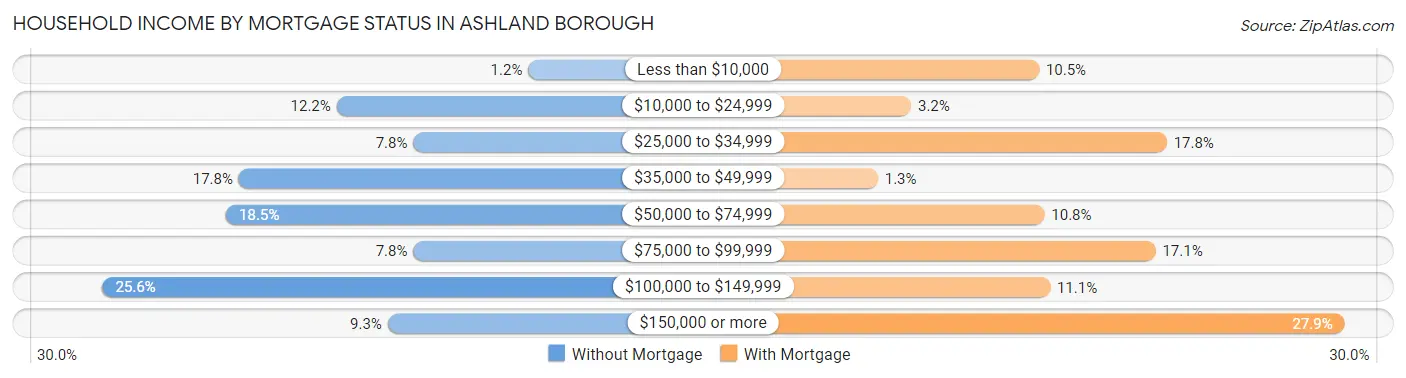
| Household Income | Without Mortgage | With Mortgage |
| Less than $10,000 | 5 (1.2%) | 33 (10.5%) |
| $10,000 to $24,999 | 50 (12.2%) | 10 (3.2%) |
| $25,000 to $34,999 | 32 (7.8%) | 56 (17.8%) |
| $35,000 to $49,999 | 73 (17.8%) | 4 (1.3%) |
| $50,000 to $74,999 | 76 (18.5%) | 34 (10.8%) |
| $75,000 to $99,999 | 32 (7.8%) | 54 (17.1%) |
| $100,000 to $149,999 | 105 (25.6%) | 35 (11.1%) |
| $150,000 or more | 38 (9.2%) | 88 (27.9%) |
| Total | 411 (100.0%) | 315 (100.0%) |
Property Value to Household Income Ratio in Ashland borough
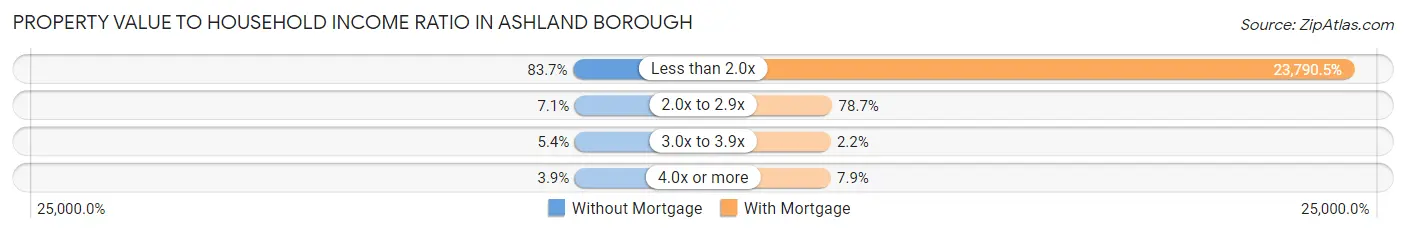
| Value-to-Income Ratio | Without Mortgage | With Mortgage |
| Less than 2.0x | 344 (83.7%) | 74,940 (23,790.5%) |
| 2.0x to 2.9x | 29 (7.1%) | 248 (78.7%) |
| 3.0x to 3.9x | 22 (5.3%) | 7 (2.2%) |
| 4.0x or more | 16 (3.9%) | 25 (7.9%) |
| Total | 411 (100.0%) | 315 (100.0%) |
Real Estate Taxes by Mortgage Status in Ashland borough
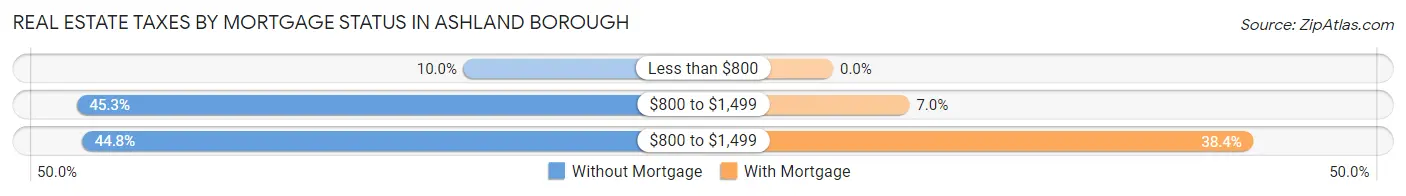
| Property Taxes | Without Mortgage | With Mortgage |
| Less than $800 | 41 (10.0%) | 0 (0.0%) |
| $800 to $1,499 | 186 (45.3%) | 22 (7.0%) |
| $800 to $1,499 | 184 (44.8%) | 121 (38.4%) |
| Total | 411 (100.0%) | 315 (100.0%) |
Health & Disability in Ashland borough
Health Insurance Coverage by Age in Ashland borough
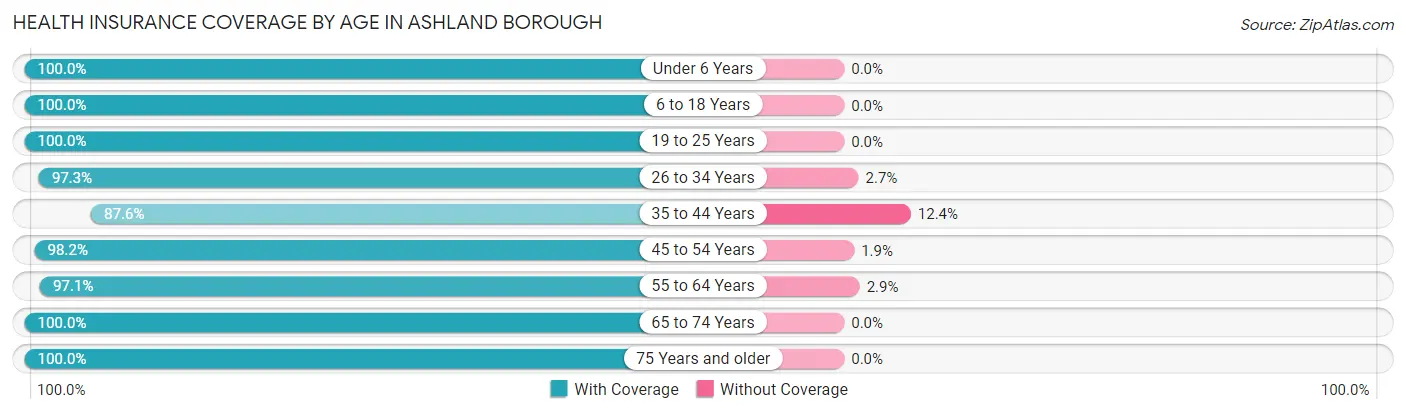
| Age Bracket | With Coverage | Without Coverage |
| Under 6 Years | 189 (100.0%) | 0 (0.0%) |
| 6 to 18 Years | 248 (100.0%) | 0 (0.0%) |
| 19 to 25 Years | 233 (100.0%) | 0 (0.0%) |
| 26 to 34 Years | 329 (97.3%) | 9 (2.7%) |
| 35 to 44 Years | 233 (87.6%) | 33 (12.4%) |
| 45 to 54 Years | 318 (98.2%) | 6 (1.8%) |
| 55 to 64 Years | 506 (97.1%) | 15 (2.9%) |
| 65 to 74 Years | 178 (100.0%) | 0 (0.0%) |
| 75 Years and older | 196 (100.0%) | 0 (0.0%) |
| Total | 2,430 (97.5%) | 63 (2.5%) |
Health Insurance Coverage by Citizenship Status in Ashland borough
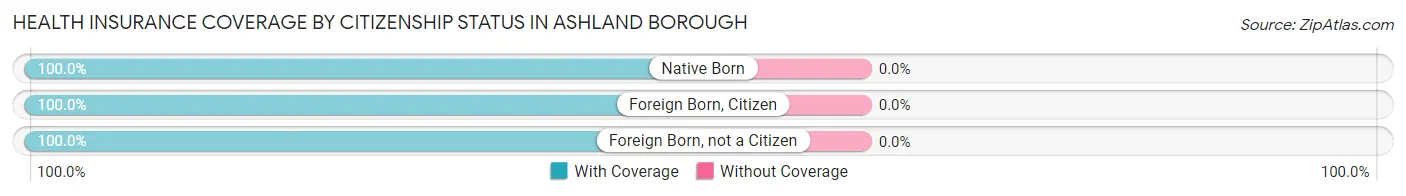
| Citizenship Status | With Coverage | Without Coverage |
| Native Born | 189 (100.0%) | 0 (0.0%) |
| Foreign Born, Citizen | 248 (100.0%) | 0 (0.0%) |
| Foreign Born, not a Citizen | 233 (100.0%) | 0 (0.0%) |
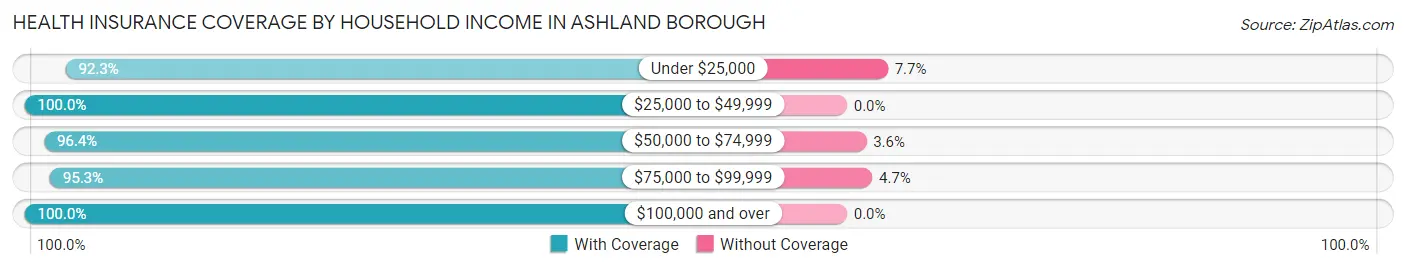
Health Insurance Coverage by Household Income in Ashland borough
| Household Income | With Coverage | Without Coverage |
| Under $25,000 | 398 (92.3%) | 33 (7.7%) |
| $25,000 to $49,999 | 421 (100.0%) | 0 (0.0%) |
| $50,000 to $74,999 | 478 (96.4%) | 18 (3.6%) |
| $75,000 to $99,999 | 241 (95.3%) | 12 (4.7%) |
| $100,000 and over | 891 (100.0%) | 0 (0.0%) |
Public vs Private Health Insurance Coverage by Age in Ashland borough
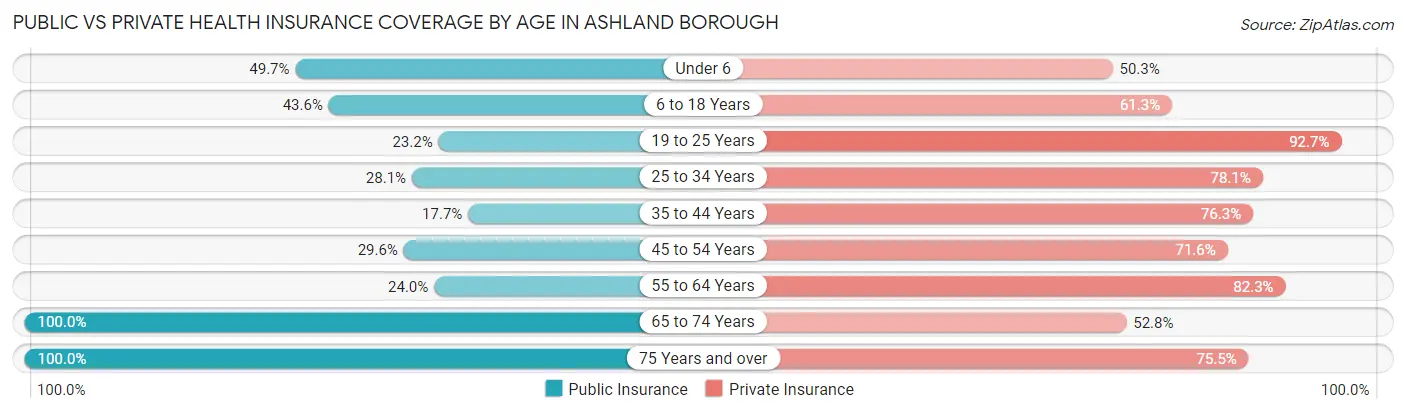
| Age Bracket | Public Insurance | Private Insurance |
| Under 6 | 94 (49.7%) | 95 (50.3%) |
| 6 to 18 Years | 108 (43.5%) | 152 (61.3%) |
| 19 to 25 Years | 54 (23.2%) | 216 (92.7%) |
| 25 to 34 Years | 95 (28.1%) | 264 (78.1%) |
| 35 to 44 Years | 47 (17.7%) | 203 (76.3%) |
| 45 to 54 Years | 96 (29.6%) | 232 (71.6%) |
| 55 to 64 Years | 125 (24.0%) | 429 (82.3%) |
| 65 to 74 Years | 178 (100.0%) | 94 (52.8%) |
| 75 Years and over | 196 (100.0%) | 148 (75.5%) |
| Total | 993 (39.8%) | 1,833 (73.5%) |
Disability Status by Sex by Age in Ashland borough
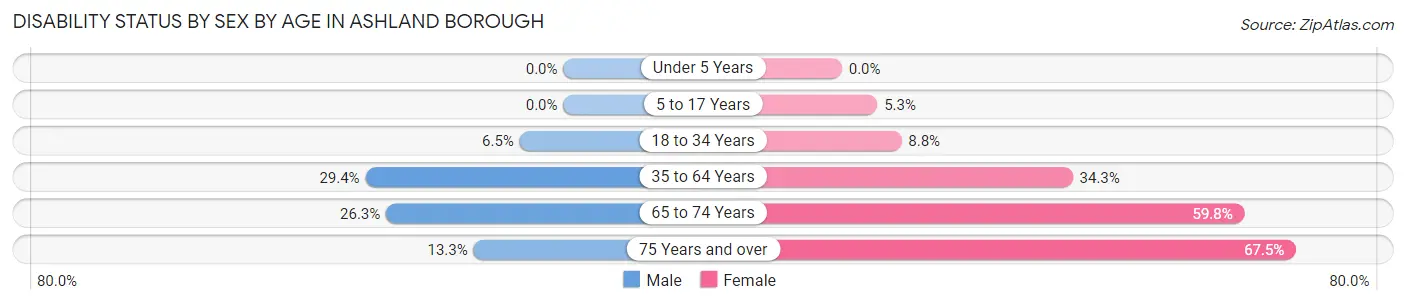
| Age Bracket | Male | Female |
| Under 5 Years | 0 (0.0%) | 0 (0.0%) |
| 5 to 17 Years | 0 (0.0%) | 6 (5.3%) |
| 18 to 34 Years | 25 (6.5%) | 19 (8.8%) |
| 35 to 64 Years | 149 (29.4%) | 207 (34.3%) |
| 65 to 74 Years | 20 (26.3%) | 61 (59.8%) |
| 75 Years and over | 4 (13.3%) | 112 (67.5%) |
Disability Class by Sex by Age in Ashland borough
Disability Class: Hearing Difficulty
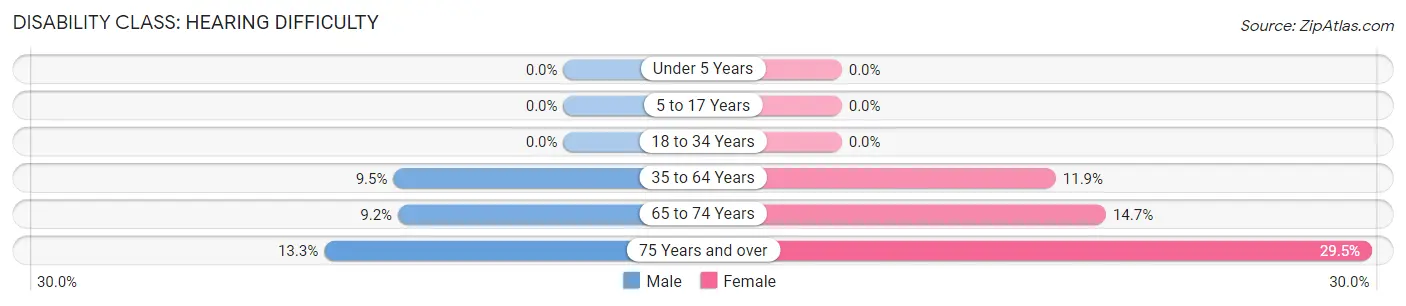
| Age Bracket | Male | Female |
| Under 5 Years | 0 (0.0%) | 0 (0.0%) |
| 5 to 17 Years | 0 (0.0%) | 0 (0.0%) |
| 18 to 34 Years | 0 (0.0%) | 0 (0.0%) |
| 35 to 64 Years | 48 (9.5%) | 72 (11.9%) |
| 65 to 74 Years | 7 (9.2%) | 15 (14.7%) |
| 75 Years and over | 4 (13.3%) | 49 (29.5%) |
Disability Class: Vision Difficulty
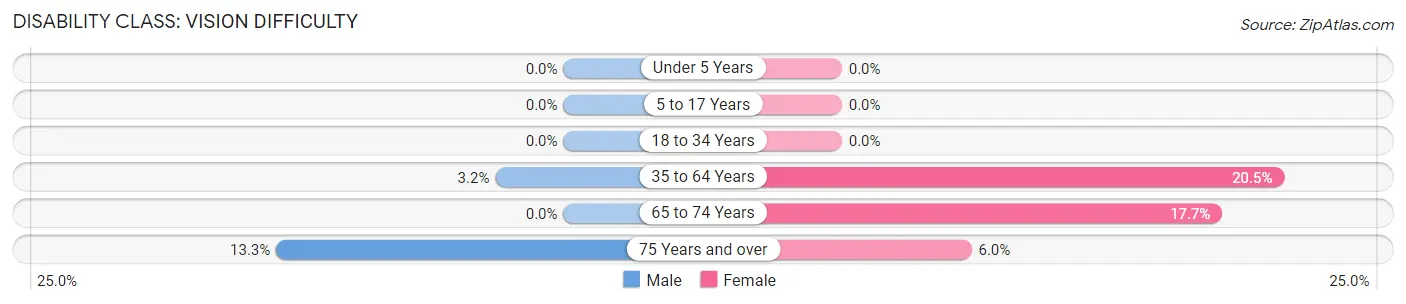
| Age Bracket | Male | Female |
| Under 5 Years | 0 (0.0%) | 0 (0.0%) |
| 5 to 17 Years | 0 (0.0%) | 0 (0.0%) |
| 18 to 34 Years | 0 (0.0%) | 0 (0.0%) |
| 35 to 64 Years | 16 (3.2%) | 124 (20.5%) |
| 65 to 74 Years | 0 (0.0%) | 18 (17.6%) |
| 75 Years and over | 4 (13.3%) | 10 (6.0%) |
Disability Class: Cognitive Difficulty
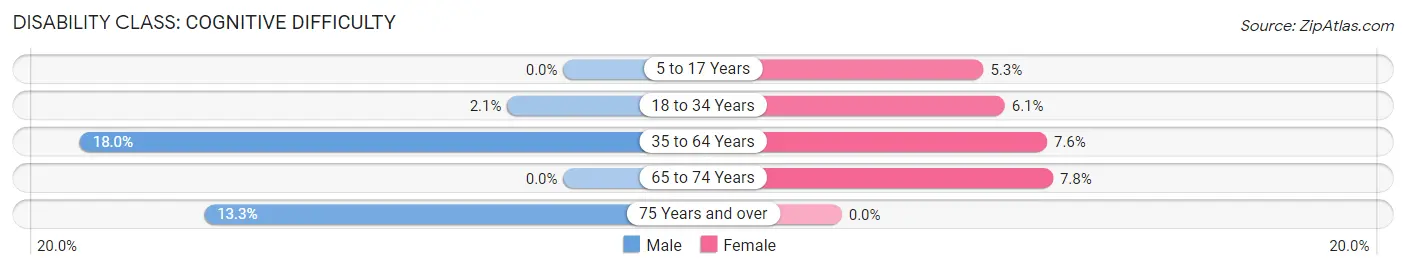
| Age Bracket | Male | Female |
| 5 to 17 Years | 0 (0.0%) | 6 (5.3%) |
| 18 to 34 Years | 8 (2.1%) | 13 (6.0%) |
| 35 to 64 Years | 91 (17.9%) | 46 (7.6%) |
| 65 to 74 Years | 0 (0.0%) | 8 (7.8%) |
| 75 Years and over | 4 (13.3%) | 0 (0.0%) |
Disability Class: Ambulatory Difficulty
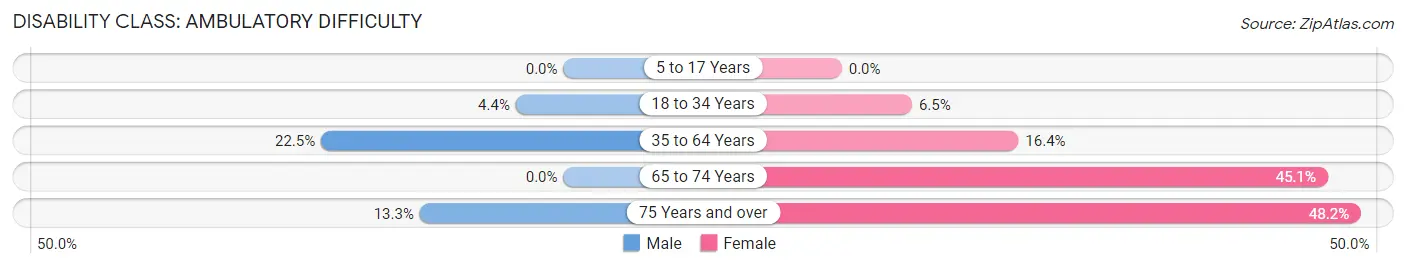
| Age Bracket | Male | Female |
| 5 to 17 Years | 0 (0.0%) | 0 (0.0%) |
| 18 to 34 Years | 17 (4.4%) | 14 (6.5%) |
| 35 to 64 Years | 114 (22.5%) | 99 (16.4%) |
| 65 to 74 Years | 0 (0.0%) | 46 (45.1%) |
| 75 Years and over | 4 (13.3%) | 80 (48.2%) |
Disability Class: Self-Care Difficulty
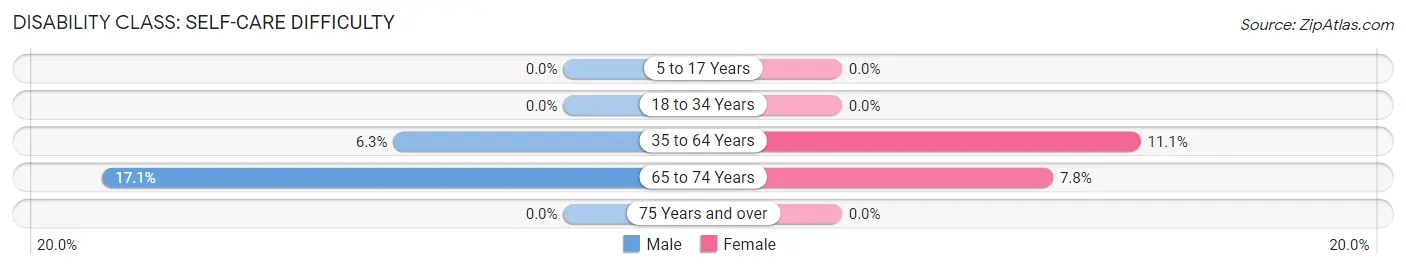
| Age Bracket | Male | Female |
| 5 to 17 Years | 0 (0.0%) | 0 (0.0%) |
| 18 to 34 Years | 0 (0.0%) | 0 (0.0%) |
| 35 to 64 Years | 32 (6.3%) | 67 (11.1%) |
| 65 to 74 Years | 13 (17.1%) | 8 (7.8%) |
| 75 Years and over | 0 (0.0%) | 0 (0.0%) |
Technology Access in Ashland borough
Computing Device Access in Ashland borough
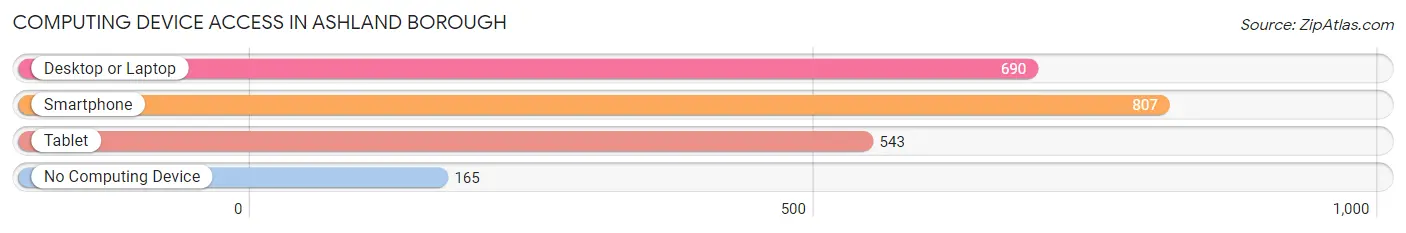
| Device Type | # Households | % Households |
| Desktop or Laptop | 690 | 59.8% |
| Smartphone | 807 | 70.0% |
| Tablet | 543 | 47.1% |
| No Computing Device | 165 | 14.3% |
| Total | 1,153 | 100.0% |
Internet Access in Ashland borough
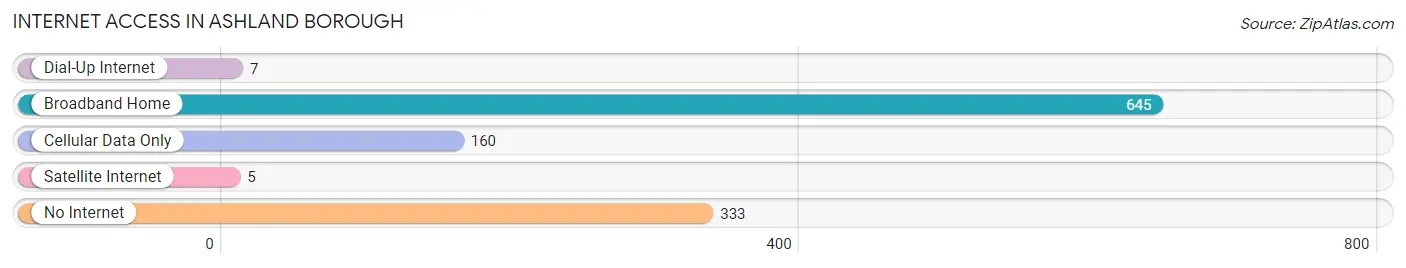
| Internet Type | # Households | % Households |
| Dial-Up Internet | 7 | 0.6% |
| Broadband Home | 645 | 55.9% |
| Cellular Data Only | 160 | 13.9% |
| Satellite Internet | 5 | 0.4% |
| No Internet | 333 | 28.9% |
| Total | 1,153 | 100.0% |
Ashland borough Summary
Ashland Borough is a small borough located in Schuylkill County, Pennsylvania. It is situated in the southern part of the county, approximately 10 miles south of Pottsville. The borough is bordered by the townships of North Manheim, West Brunswick, and East Brunswick. The population of Ashland Borough was 2,845 at the 2010 census.
History
The area that is now Ashland Borough was first settled in the late 1700s by German immigrants. The town was originally known as “Mudtown” due to the muddy roads that were common in the area. In 1854, the town was officially incorporated as Ashland Borough. The name was chosen to honor the hometown of one of the founders, Henry Clay of Ashland, Kentucky.
The town grew rapidly in the late 1800s and early 1900s due to the coal mining industry. The town was home to several coal mines, including the Ashland Colliery, which was the largest in the area. The coal industry provided jobs and economic stability to the town, and it was a major contributor to the local economy.
The town was also home to several other industries, including a brickyard, a tannery, and a brewery. The town also had a thriving retail sector, with several stores and shops.
Geography
Ashland Borough is located in the southern part of Schuylkill County, approximately 10 miles south of Pottsville. The borough is bordered by the townships of North Manheim, West Brunswick, and East Brunswick. The borough is situated in the Appalachian Mountains, and the terrain is mostly hilly.
The borough is located in the Schuylkill River watershed. The Schuylkill River flows through the borough, and there are several creeks and streams in the area. The borough is also home to several parks, including Ashland Park, which is located in the center of town.
Economy
The economy of Ashland Borough is largely based on the coal mining industry. The town was home to several coal mines, including the Ashland Colliery, which was the largest in the area. The coal industry provided jobs and economic stability to the town, and it was a major contributor to the local economy.
The town was also home to several other industries, including a brickyard, a tannery, and a brewery. The town also had a thriving retail sector, with several stores and shops.
Demographics
As of the 2010 census, the population of Ashland Borough was 2,845. The racial makeup of the borough was 97.3% White, 0.7% African American, 0.2% Native American, 0.3% Asian, 0.1% from other races, and 1.4% from two or more races. Hispanic or Latino of any race were 0.9% of the population.
The median income for a household in the borough was $37,917, and the median income for a family was $45,000. The per capita income for the borough was $18,945. About 11.2% of families and 13.2% of the population were below the poverty line, including 17.2% of those under age 18 and 8.2% of those age 65 or over.
Common Questions
What is Per Capita Income in Ashland borough?
Per Capita income in Ashland borough is $35,072.
What is the Median Family Income in Ashland borough?
Median Family Income in Ashland borough is $73,676.
What is the Median Household income in Ashland borough?
Median Household Income in Ashland borough is $62,854.
What is Income or Wage Gap in Ashland borough?
Income or Wage Gap in Ashland borough is 33.4%.
Women in Ashland borough earn 66.6 cents for every dollar earned by a man.
What is Inequality or Gini Index in Ashland borough?
Inequality or Gini Index in Ashland borough is 0.47.
What is the Total Population of Ashland borough?
Total Population of Ashland borough is 2,493.
What is the Total Male Population of Ashland borough?
Total Male Population of Ashland borough is 1,214.
What is the Total Female Population of Ashland borough?
Total Female Population of Ashland borough is 1,279.
What is the Ratio of Males per 100 Females in Ashland borough?
There are 94.92 Males per 100 Females in Ashland borough.
What is the Ratio of Females per 100 Males in Ashland borough?
There are 105.35 Females per 100 Males in Ashland borough.
What is the Median Population Age in Ashland borough?
Median Population Age in Ashland borough is 42.8 Years.
What is the Average Family Size in Ashland borough
Average Family Size in Ashland borough is 2.6 People.
What is the Average Household Size in Ashland borough
Average Household Size in Ashland borough is 2.2 People.
How Large is the Labor Force in Ashland borough?
There are 1,212 People in the Labor Forcein in Ashland borough.
What is the Percentage of People in the Labor Force in Ashland borough?
57.4% of People are in the Labor Force in Ashland borough.
What is the Unemployment Rate in Ashland borough?
Unemployment Rate in Ashland borough is 6.0%.