Bowmanstown borough, PA Map & Demographics
Bowmanstown borough Overview
$32,091
PER CAPITA INCOME
$56,818
AVG FAMILY INCOME
$51,544
AVG HOUSEHOLD INCOME
0.6%
WAGE / INCOME GAP [ % ]
99.4¢/ $1
WAGE / INCOME GAP [ $ ]
0.43
INEQUALITY / GINI INDEX
1,140
TOTAL POPULATION
476
MALE POPULATION
664
FEMALE POPULATION
71.69
MALES / 100 FEMALES
139.50
FEMALES / 100 MALES
37.9
MEDIAN AGE
3.3
AVG FAMILY SIZE
2.4
AVG HOUSEHOLD SIZE
701
LABOR FORCE [ PEOPLE ]
70.2%
PERCENT IN LABOR FORCE
16.1%
UNEMPLOYMENT RATE
Income in Bowmanstown borough
Income Overview in Bowmanstown borough
Per Capita Income in Bowmanstown borough is $32,091, while median incomes of families and households are $56,818 and $51,544 respectively.
| Characteristic | Number | Measure |
| Per Capita Income | 1,140 | $32,091 |
| Median Family Income | 236 | $56,818 |
| Mean Family Income | 236 | $83,287 |
| Median Household Income | 477 | $51,544 |
| Mean Household Income | 477 | $70,220 |
| Income Deficit | 236 | $0 |
| Wage / Income Gap (%) | 1,140 | 0.64% |
| Wage / Income Gap ($) | 1,140 | 99.36¢ per $1 |
| Gini / Inequality Index | 1,140 | 0.43 |
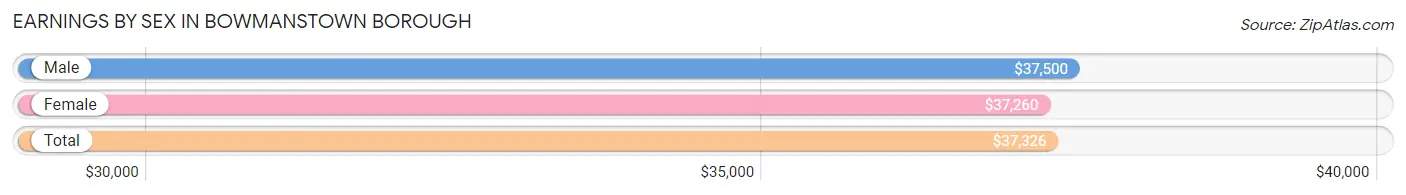
Earnings by Sex in Bowmanstown borough
Average Earnings in Bowmanstown borough are $37,326, $37,500 for men and $37,260 for women, a difference of 0.6%.
| Sex | Number | Average Earnings |
| Male | 302 (46.1%) | $37,500 |
| Female | 353 (53.9%) | $37,260 |
| Total | 655 (100.0%) | $37,326 |
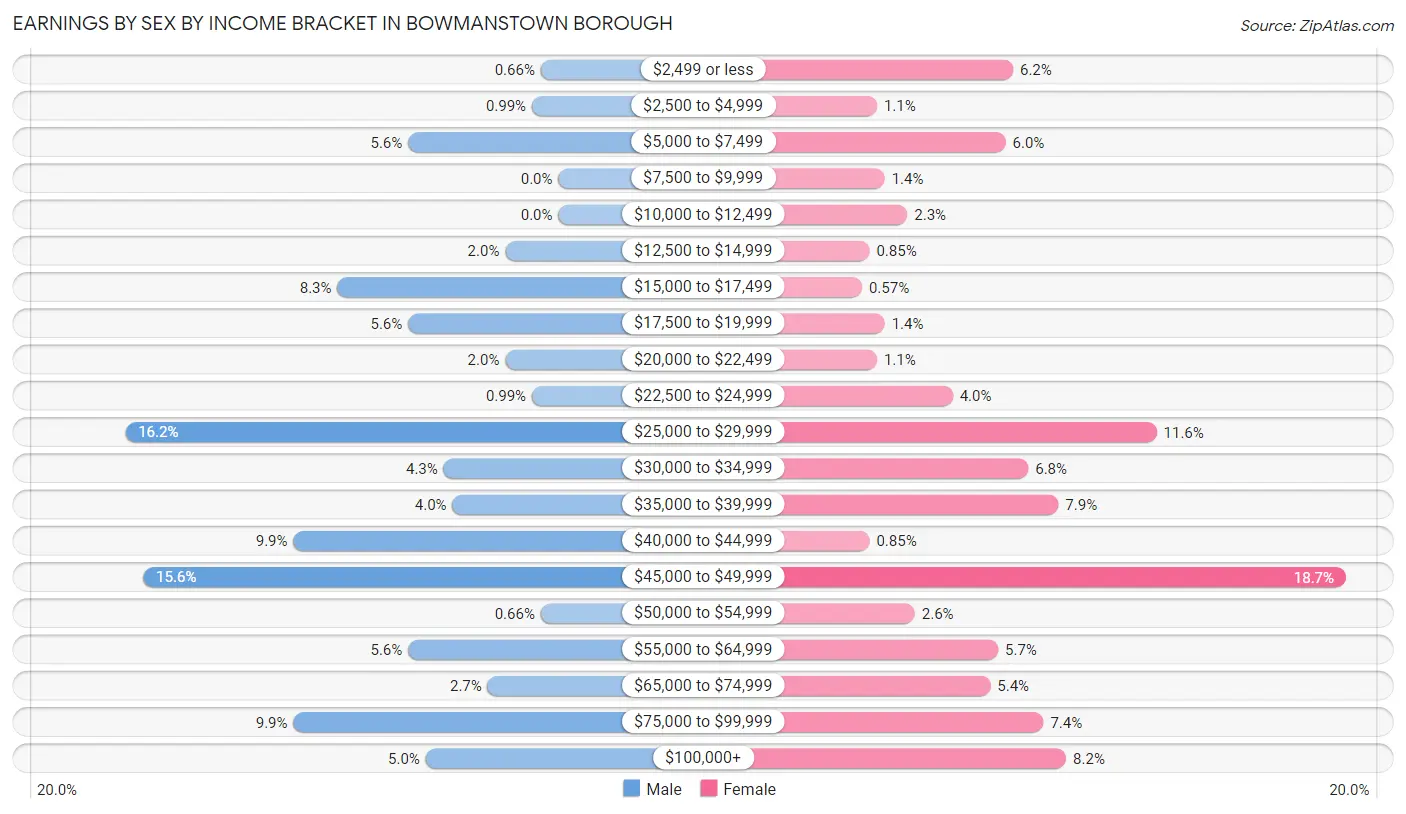
Earnings by Sex by Income Bracket in Bowmanstown borough
The most common earnings brackets in Bowmanstown borough are $25,000 to $29,999 for men (49 | 16.2%) and $45,000 to $49,999 for women (66 | 18.7%).
| Income | Male | Female |
| $2,499 or less | 2 (0.7%) | 22 (6.2%) |
| $2,500 to $4,999 | 3 (1.0%) | 4 (1.1%) |
| $5,000 to $7,499 | 17 (5.6%) | 21 (5.9%) |
| $7,500 to $9,999 | 0 (0.0%) | 5 (1.4%) |
| $10,000 to $12,499 | 0 (0.0%) | 8 (2.3%) |
| $12,500 to $14,999 | 6 (2.0%) | 3 (0.9%) |
| $15,000 to $17,499 | 25 (8.3%) | 2 (0.6%) |
| $17,500 to $19,999 | 17 (5.6%) | 5 (1.4%) |
| $20,000 to $22,499 | 6 (2.0%) | 4 (1.1%) |
| $22,500 to $24,999 | 3 (1.0%) | 14 (4.0%) |
| $25,000 to $29,999 | 49 (16.2%) | 41 (11.6%) |
| $30,000 to $34,999 | 13 (4.3%) | 24 (6.8%) |
| $35,000 to $39,999 | 12 (4.0%) | 28 (7.9%) |
| $40,000 to $44,999 | 30 (9.9%) | 3 (0.9%) |
| $45,000 to $49,999 | 47 (15.6%) | 66 (18.7%) |
| $50,000 to $54,999 | 2 (0.7%) | 9 (2.5%) |
| $55,000 to $64,999 | 17 (5.6%) | 20 (5.7%) |
| $65,000 to $74,999 | 8 (2.6%) | 19 (5.4%) |
| $75,000 to $99,999 | 30 (9.9%) | 26 (7.4%) |
| $100,000+ | 15 (5.0%) | 29 (8.2%) |
| Total | 302 (100.0%) | 353 (100.0%) |
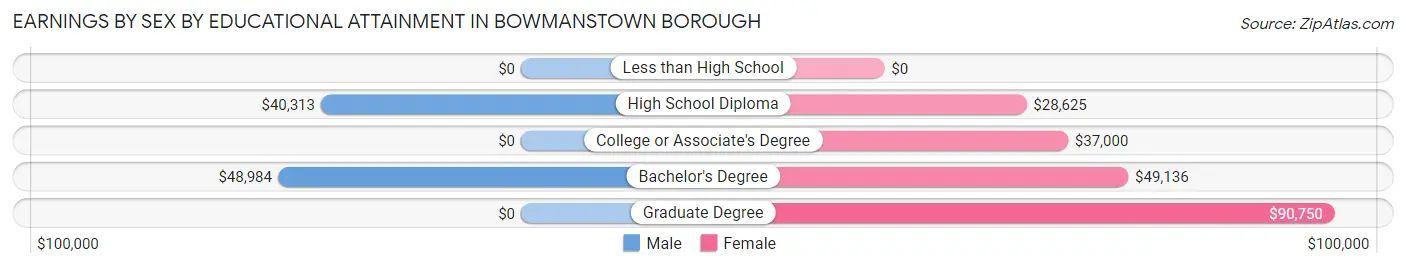
Earnings by Sex by Educational Attainment in Bowmanstown borough
Average earnings in Bowmanstown borough are $43,250 for men and $47,688 for women, a difference of 9.3%. Men with an educational attainment of bachelor's degree enjoy the highest average annual earnings of $48,984, while those with high school diploma education earn the least with $40,313. Women with an educational attainment of graduate degree earn the most with the average annual earnings of $90,750, while those with high school diploma education have the smallest earnings of $28,625.
| Educational Attainment | Male Income | Female Income |
| Less than High School | - | - |
| High School Diploma | $40,313 | $28,625 |
| College or Associate's Degree | - | - |
| Bachelor's Degree | $48,984 | $49,136 |
| Graduate Degree | - | - |
| Total | $43,250 | $47,688 |
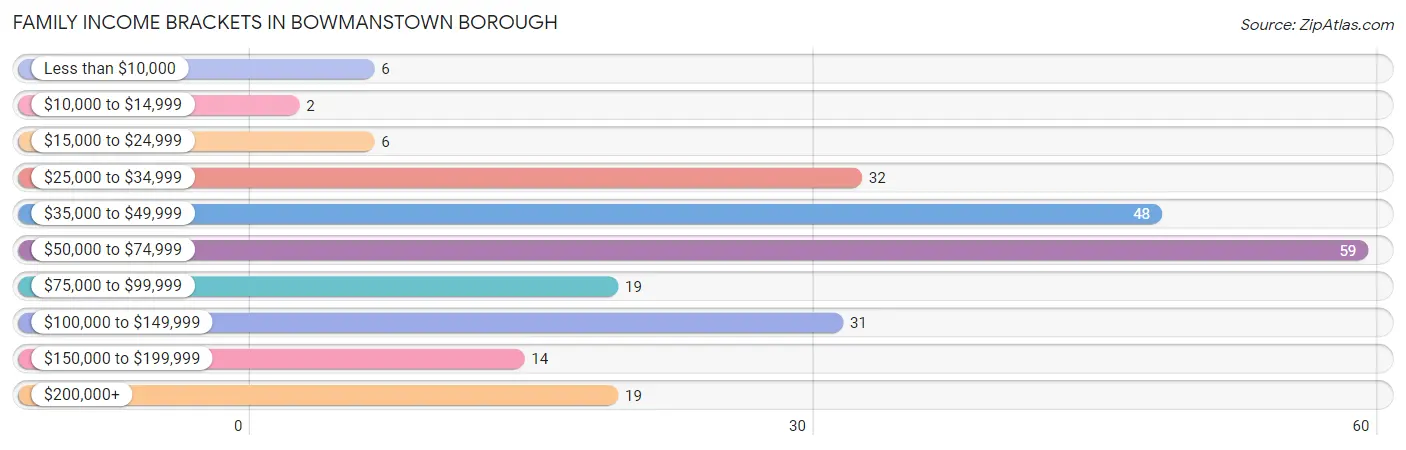
Family Income in Bowmanstown borough
Family Income Brackets in Bowmanstown borough
According to the Bowmanstown borough family income data, there are 59 families falling into the $50,000 to $74,999 income range, which is the most common income bracket and makes up 25.0% of all families. Conversely, the $10,000 to $14,999 income bracket is the least frequent group with only 2 families (0.9%) belonging to this category.
| Income Bracket | # Families | % Families |
| Less than $10,000 | 6 | 2.5% |
| $10,000 to $14,999 | 2 | 0.8% |
| $15,000 to $24,999 | 6 | 2.5% |
| $25,000 to $34,999 | 32 | 13.6% |
| $35,000 to $49,999 | 48 | 20.3% |
| $50,000 to $74,999 | 59 | 25.0% |
| $75,000 to $99,999 | 19 | 8.1% |
| $100,000 to $149,999 | 31 | 13.1% |
| $150,000 to $199,999 | 14 | 5.9% |
| $200,000+ | 19 | 8.1% |
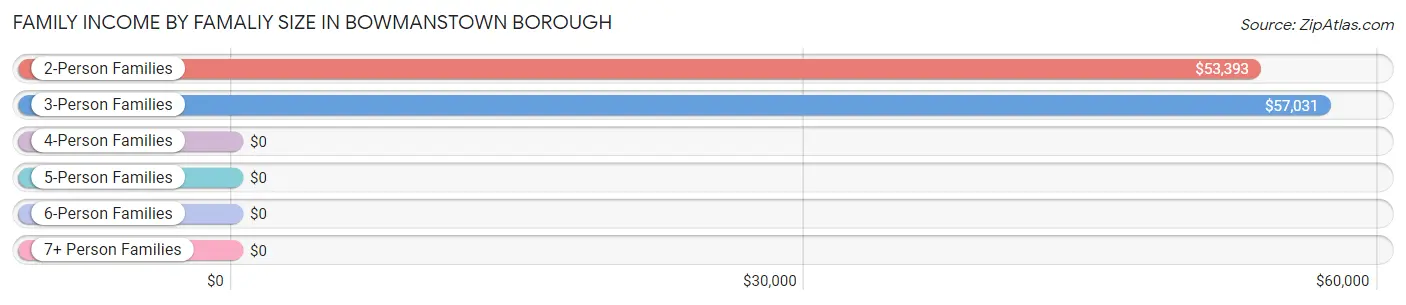
Family Income by Famaliy Size in Bowmanstown borough
3-person families (61 | 25.9%) account for the highest median family income in Bowmanstown borough with $57,031 per family, while 2-person families (109 | 46.2%) have the highest median income of $26,696 per family member.
| Income Bracket | # Families | Median Income |
| 2-Person Families | 109 (46.2%) | $53,393 |
| 3-Person Families | 61 (25.9%) | $57,031 |
| 4-Person Families | 37 (15.7%) | $0 |
| 5-Person Families | 26 (11.0%) | $0 |
| 6-Person Families | 3 (1.3%) | $0 |
| 7+ Person Families | 0 (0.0%) | $0 |
| Total | 236 (100.0%) | $56,818 |
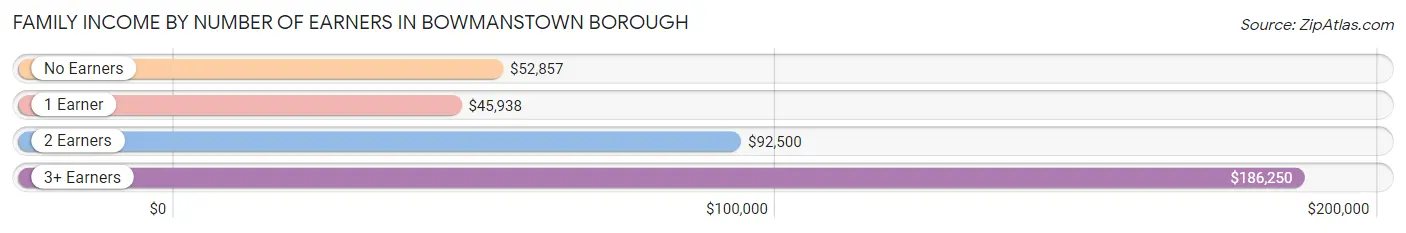
Family Income by Number of Earners in Bowmanstown borough
The median family income in Bowmanstown borough is $56,818, with families comprising 3+ earners (33) having the highest median family income of $186,250, while families with 1 earner (113) have the lowest median family income of $45,938, accounting for 14.0% and 47.9% of families, respectively.
| Number of Earners | # Families | Median Income |
| No Earners | 28 (11.9%) | $52,857 |
| 1 Earner | 113 (47.9%) | $45,938 |
| 2 Earners | 62 (26.3%) | $92,500 |
| 3+ Earners | 33 (14.0%) | $186,250 |
| Total | 236 (100.0%) | $56,818 |
Household Income in Bowmanstown borough
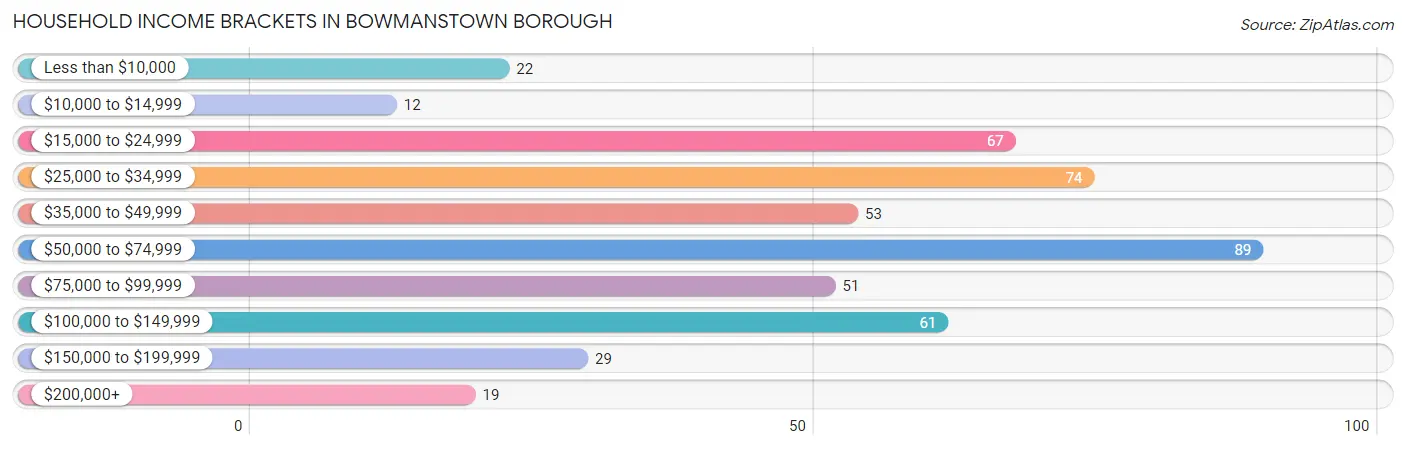
Household Income Brackets in Bowmanstown borough
With 89 households falling in the category, the $50,000 to $74,999 income range is the most frequent in Bowmanstown borough, accounting for 18.7% of all households. In contrast, only 12 households (2.5%) fall into the $10,000 to $14,999 income bracket, making it the least populous group.
| Income Bracket | # Households | % Households |
| Less than $10,000 | 22 | 4.6% |
| $10,000 to $14,999 | 12 | 2.5% |
| $15,000 to $24,999 | 67 | 14.0% |
| $25,000 to $34,999 | 74 | 15.5% |
| $35,000 to $49,999 | 53 | 11.1% |
| $50,000 to $74,999 | 89 | 18.7% |
| $75,000 to $99,999 | 51 | 10.7% |
| $100,000 to $149,999 | 61 | 12.8% |
| $150,000 to $199,999 | 29 | 6.1% |
| $200,000+ | 19 | 4.0% |
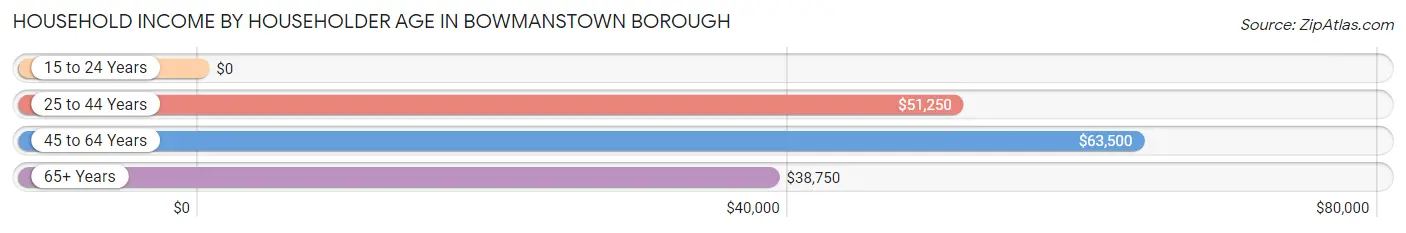
Household Income by Householder Age in Bowmanstown borough
The median household income in Bowmanstown borough is $51,544, with the highest median household income of $63,500 found in the 45 to 64 years age bracket for the primary householder. A total of 166 households (34.8%) fall into this category. Meanwhile, the 15 to 24 years age bracket for the primary householder has the lowest median household income of $0, with 1 households (0.2%) in this group.
| Income Bracket | # Households | Median Income |
| 15 to 24 Years | 1 (0.2%) | $0 |
| 25 to 44 Years | 218 (45.7%) | $51,250 |
| 45 to 64 Years | 166 (34.8%) | $63,500 |
| 65+ Years | 92 (19.3%) | $38,750 |
| Total | 477 (100.0%) | $51,544 |
Poverty in Bowmanstown borough
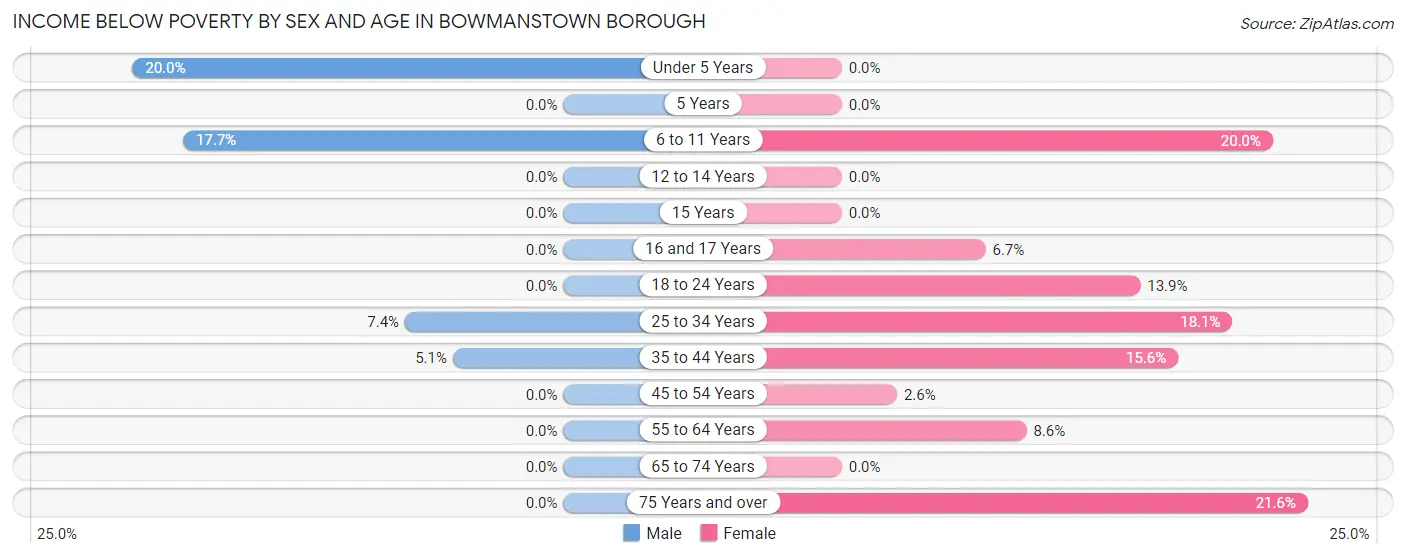
Income Below Poverty by Sex and Age in Bowmanstown borough
With 4.0% poverty level for males and 11.1% for females among the residents of Bowmanstown borough, under 5 year old males and 75 year old and over females are the most vulnerable to poverty, with 2 males (20.0%) and 8 females (21.6%) in their respective age groups living below the poverty level.
| Age Bracket | Male | Female |
| Under 5 Years | 2 (20.0%) | 0 (0.0%) |
| 5 Years | 0 (0.0%) | 0 (0.0%) |
| 6 to 11 Years | 6 (17.6%) | 3 (20.0%) |
| 12 to 14 Years | 0 (0.0%) | 0 (0.0%) |
| 15 Years | 0 (0.0%) | 0 (0.0%) |
| 16 and 17 Years | 0 (0.0%) | 2 (6.7%) |
| 18 to 24 Years | 0 (0.0%) | 9 (13.9%) |
| 25 to 34 Years | 5 (7.3%) | 27 (18.1%) |
| 35 to 44 Years | 6 (5.1%) | 17 (15.6%) |
| 45 to 54 Years | 0 (0.0%) | 2 (2.6%) |
| 55 to 64 Years | 0 (0.0%) | 6 (8.6%) |
| 65 to 74 Years | 0 (0.0%) | 0 (0.0%) |
| 75 Years and over | 0 (0.0%) | 8 (21.6%) |
| Total | 19 (4.0%) | 74 (11.1%) |
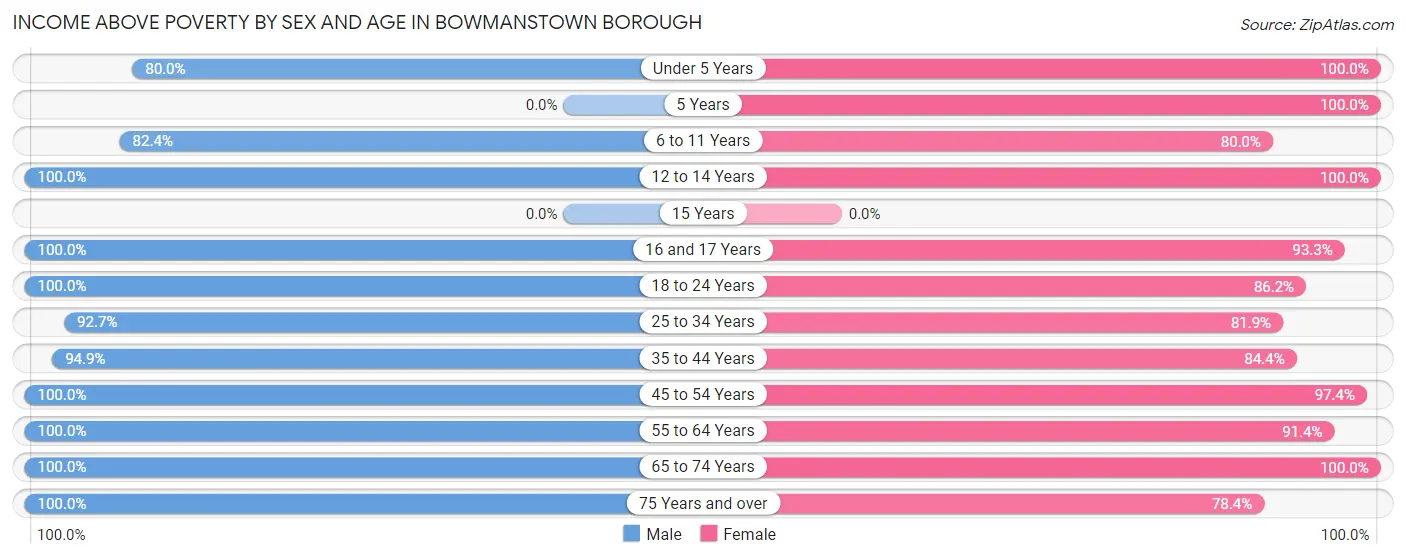
Income Above Poverty by Sex and Age in Bowmanstown borough
According to the poverty statistics in Bowmanstown borough, males aged 12 to 14 years and females aged under 5 years are the age groups that are most secure financially, with 100.0% of males and 100.0% of females in these age groups living above the poverty line.
| Age Bracket | Male | Female |
| Under 5 Years | 8 (80.0%) | 34 (100.0%) |
| 5 Years | 0 (0.0%) | 10 (100.0%) |
| 6 to 11 Years | 28 (82.4%) | 12 (80.0%) |
| 12 to 14 Years | 14 (100.0%) | 24 (100.0%) |
| 15 Years | 0 (0.0%) | 0 (0.0%) |
| 16 and 17 Years | 2 (100.0%) | 28 (93.3%) |
| 18 to 24 Years | 64 (100.0%) | 56 (86.2%) |
| 25 to 34 Years | 63 (92.6%) | 122 (81.9%) |
| 35 to 44 Years | 111 (94.9%) | 92 (84.4%) |
| 45 to 54 Years | 28 (100.0%) | 76 (97.4%) |
| 55 to 64 Years | 80 (100.0%) | 64 (91.4%) |
| 65 to 74 Years | 33 (100.0%) | 43 (100.0%) |
| 75 Years and over | 26 (100.0%) | 29 (78.4%) |
| Total | 457 (96.0%) | 590 (88.9%) |
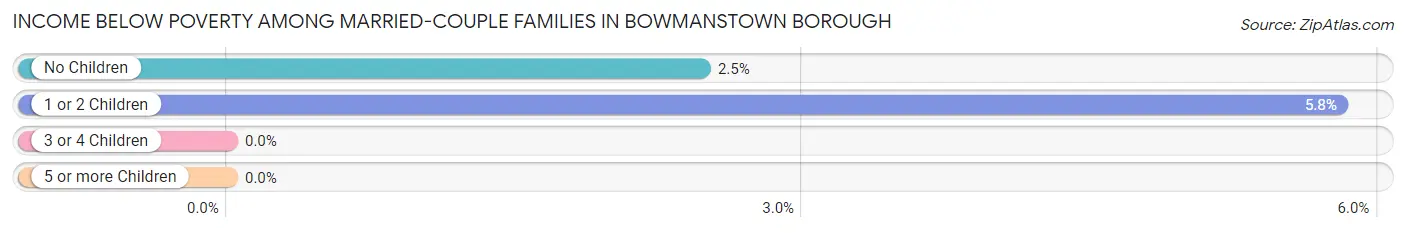
Income Below Poverty Among Married-Couple Families in Bowmanstown borough
The poverty statistics for married-couple families in Bowmanstown borough show that 3.7% or 6 of the total 161 families live below the poverty line. Families with 1 or 2 children have the highest poverty rate of 5.8%, comprising of 4 families. On the other hand, families with 3 or 4 children have the lowest poverty rate of 0.0%, which includes 0 families.
| Children | Above Poverty | Below Poverty |
| No Children | 79 (97.5%) | 2 (2.5%) |
| 1 or 2 Children | 65 (94.2%) | 4 (5.8%) |
| 3 or 4 Children | 11 (100.0%) | 0 (0.0%) |
| 5 or more Children | 0 (0.0%) | 0 (0.0%) |
| Total | 155 (96.3%) | 6 (3.7%) |
Income Below Poverty Among Single-Parent Households in Bowmanstown borough
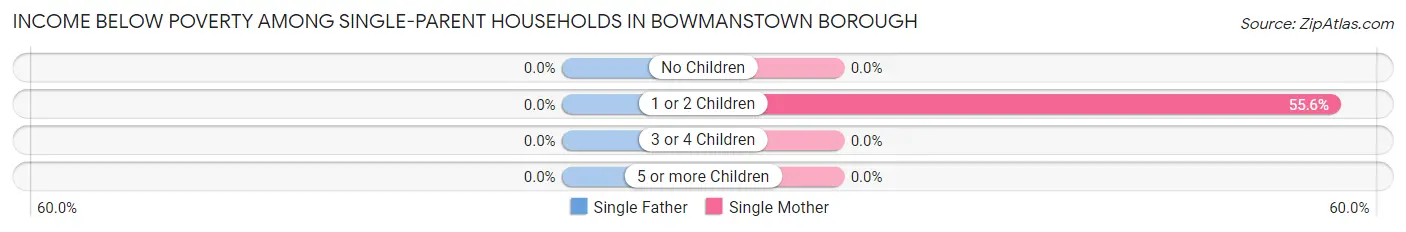
| Children | Single Father | Single Mother |
| No Children | 0 (0.0%) | 0 (0.0%) |
| 1 or 2 Children | 0 (0.0%) | 5 (55.6%) |
| 3 or 4 Children | 0 (0.0%) | 0 (0.0%) |
| 5 or more Children | 0 (0.0%) | 0 (0.0%) |
| Total | 0 (0.0%) | 5 (9.4%) |
Income Below Poverty Among Married-Couple vs Single-Parent Households in Bowmanstown borough
The poverty data for Bowmanstown borough shows that 6 of the married-couple family households (3.7%) and 5 of the single-parent households (6.7%) are living below the poverty level. Within the married-couple family households, those with 1 or 2 children have the highest poverty rate, with 4 households (5.8%) falling below the poverty line. Among the single-parent households, those with 1 or 2 children have the highest poverty rate, with 5 household (20.8%) living below poverty.
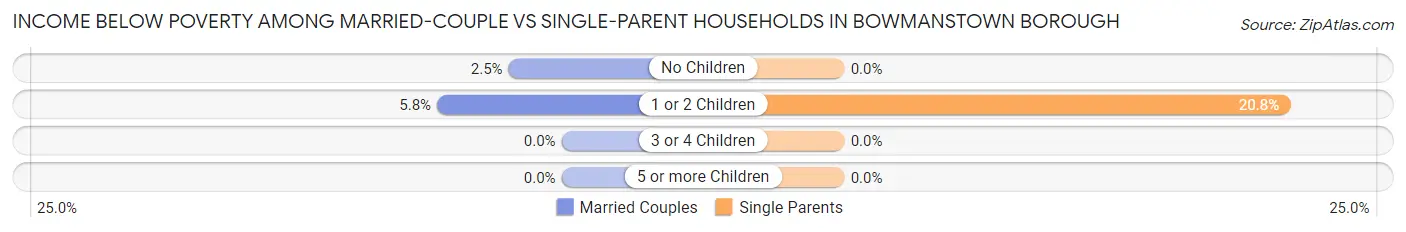
| Children | Married-Couple Families | Single-Parent Households |
| No Children | 2 (2.5%) | 0 (0.0%) |
| 1 or 2 Children | 4 (5.8%) | 5 (20.8%) |
| 3 or 4 Children | 0 (0.0%) | 0 (0.0%) |
| 5 or more Children | 0 (0.0%) | 0 (0.0%) |
| Total | 6 (3.7%) | 5 (6.7%) |
Race in Bowmanstown borough
The most populous races in Bowmanstown borough are White / Caucasian (1,091 | 95.7%), Hispanic or Latino (83 | 7.3%), and Two or more Races (25 | 2.2%).
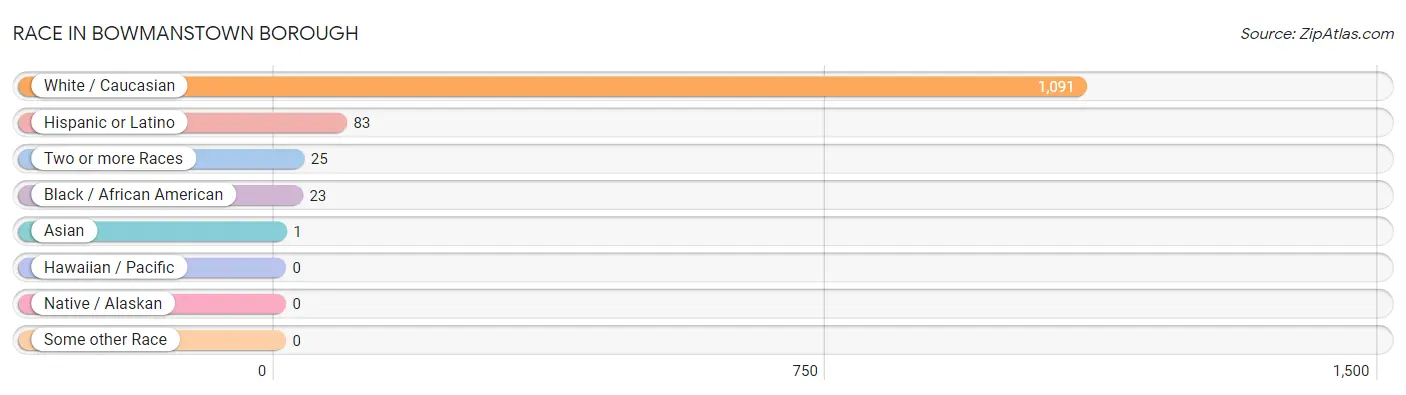
| Race | # Population | % Population |
| Asian | 1 | 0.1% |
| Black / African American | 23 | 2.0% |
| Hawaiian / Pacific | 0 | 0.0% |
| Hispanic or Latino | 83 | 7.3% |
| Native / Alaskan | 0 | 0.0% |
| White / Caucasian | 1,091 | 95.7% |
| Two or more Races | 25 | 2.2% |
| Some other Race | 0 | 0.0% |
| Total | 1,140 | 100.0% |
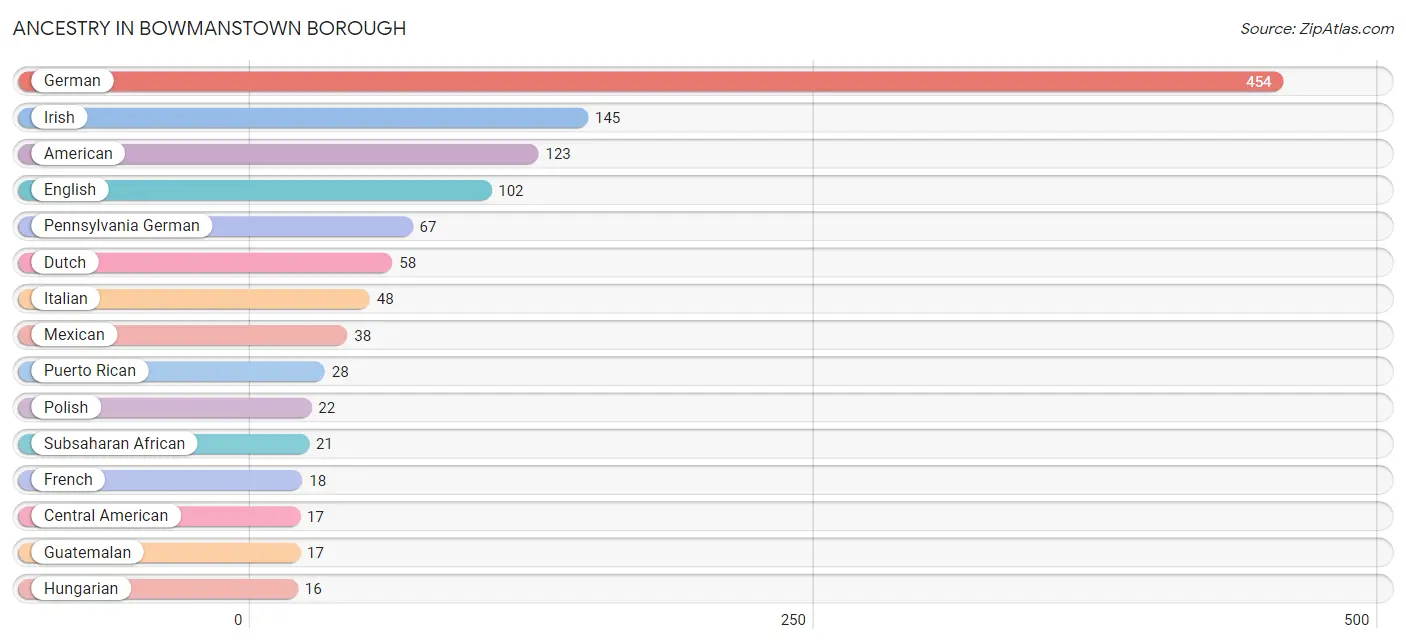
Ancestry in Bowmanstown borough
The most populous ancestries reported in Bowmanstown borough are German (454 | 39.8%), Irish (145 | 12.7%), American (123 | 10.8%), English (102 | 8.9%), and Pennsylvania German (67 | 5.9%), together accounting for 78.2% of all Bowmanstown borough residents.
| Ancestry | # Population | % Population |
| African | 6 | 0.5% |
| American | 123 | 10.8% |
| Austrian | 2 | 0.2% |
| British | 8 | 0.7% |
| Central American | 17 | 1.5% |
| Dutch | 58 | 5.1% |
| Eastern European | 14 | 1.2% |
| English | 102 | 8.9% |
| European | 2 | 0.2% |
| French | 18 | 1.6% |
| French Canadian | 8 | 0.7% |
| German | 454 | 39.8% |
| Greek | 9 | 0.8% |
| Guatemalan | 17 | 1.5% |
| Haitian | 15 | 1.3% |
| Hungarian | 16 | 1.4% |
| Indian (Asian) | 4 | 0.4% |
| Irish | 145 | 12.7% |
| Italian | 48 | 4.2% |
| Kenyan | 15 | 1.3% |
| Mexican | 38 | 3.3% |
| Norwegian | 3 | 0.3% |
| Pennsylvania German | 67 | 5.9% |
| Polish | 22 | 1.9% |
| Puerto Rican | 28 | 2.5% |
| Russian | 8 | 0.7% |
| Scotch-Irish | 2 | 0.2% |
| Scottish | 3 | 0.3% |
| Serbian | 1 | 0.1% |
| Slovak | 12 | 1.1% |
| Subsaharan African | 21 | 1.8% |
| Trinidadian and Tobagonian | 4 | 0.4% |
| Ukrainian | 9 | 0.8% |
| Welsh | 13 | 1.1% |
| West Indian | 15 | 1.3% | View All 35 Rows |
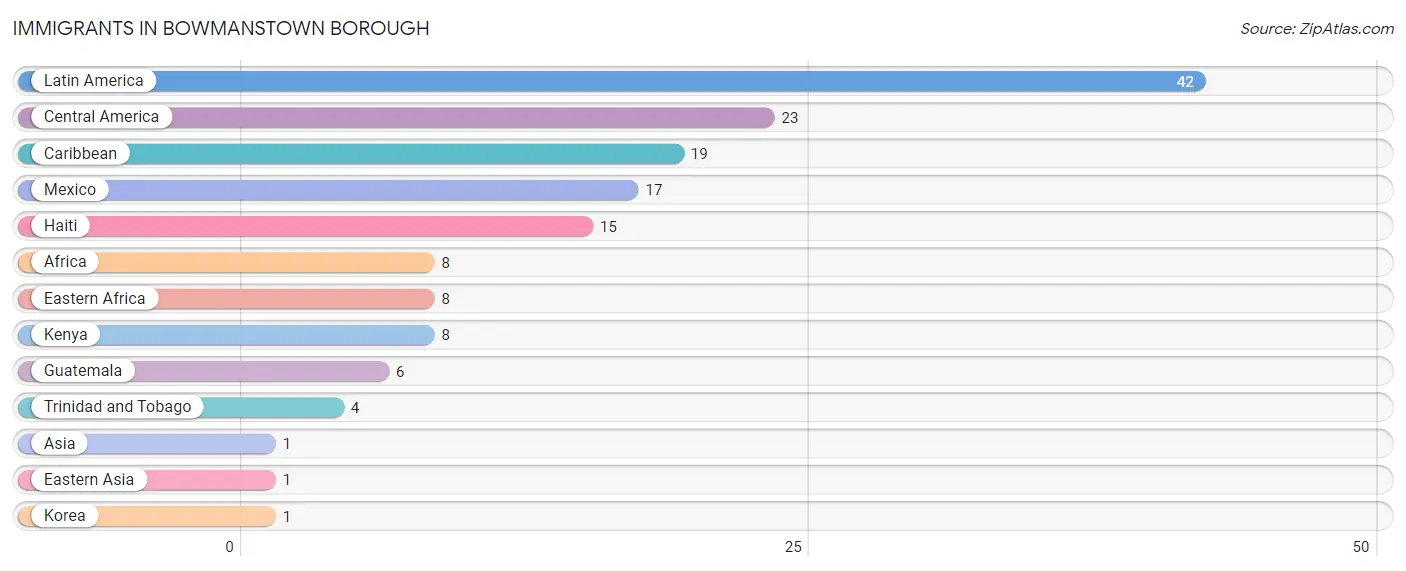
Immigrants in Bowmanstown borough
The most numerous immigrant groups reported in Bowmanstown borough came from Latin America (42 | 3.7%), Central America (23 | 2.0%), Caribbean (19 | 1.7%), Mexico (17 | 1.5%), and Haiti (15 | 1.3%), together accounting for 10.2% of all Bowmanstown borough residents.
| Immigration Origin | # Population | % Population |
| Africa | 8 | 0.7% |
| Asia | 1 | 0.1% |
| Caribbean | 19 | 1.7% |
| Central America | 23 | 2.0% |
| Eastern Africa | 8 | 0.7% |
| Eastern Asia | 1 | 0.1% |
| Guatemala | 6 | 0.5% |
| Haiti | 15 | 1.3% |
| Kenya | 8 | 0.7% |
| Korea | 1 | 0.1% |
| Latin America | 42 | 3.7% |
| Mexico | 17 | 1.5% |
| Trinidad and Tobago | 4 | 0.4% | View All 13 Rows |
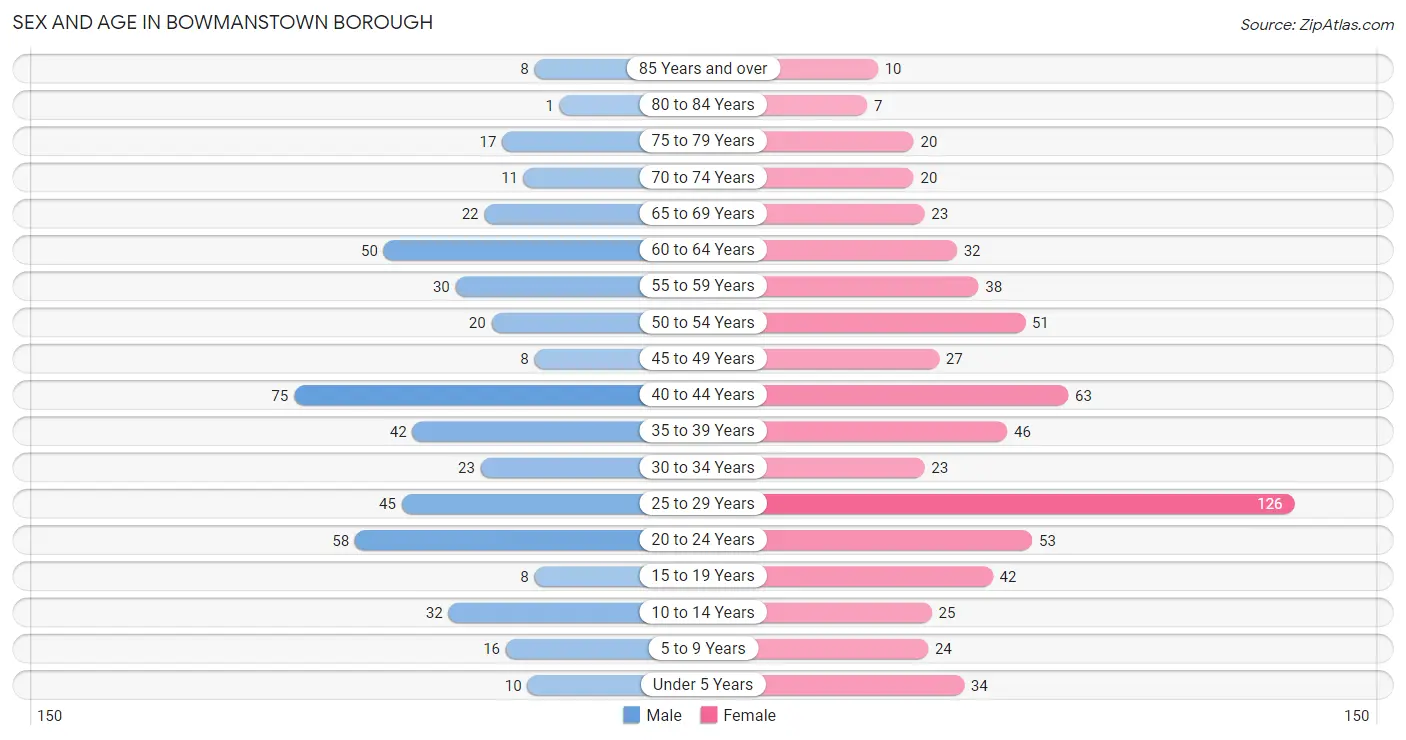
Sex and Age in Bowmanstown borough
Sex and Age in Bowmanstown borough
The most populous age groups in Bowmanstown borough are 40 to 44 Years (75 | 15.8%) for men and 25 to 29 Years (126 | 19.0%) for women.
| Age Bracket | Male | Female |
| Under 5 Years | 10 (2.1%) | 34 (5.1%) |
| 5 to 9 Years | 16 (3.4%) | 24 (3.6%) |
| 10 to 14 Years | 32 (6.7%) | 25 (3.8%) |
| 15 to 19 Years | 8 (1.7%) | 42 (6.3%) |
| 20 to 24 Years | 58 (12.2%) | 53 (8.0%) |
| 25 to 29 Years | 45 (9.5%) | 126 (19.0%) |
| 30 to 34 Years | 23 (4.8%) | 23 (3.5%) |
| 35 to 39 Years | 42 (8.8%) | 46 (6.9%) |
| 40 to 44 Years | 75 (15.8%) | 63 (9.5%) |
| 45 to 49 Years | 8 (1.7%) | 27 (4.1%) |
| 50 to 54 Years | 20 (4.2%) | 51 (7.7%) |
| 55 to 59 Years | 30 (6.3%) | 38 (5.7%) |
| 60 to 64 Years | 50 (10.5%) | 32 (4.8%) |
| 65 to 69 Years | 22 (4.6%) | 23 (3.5%) |
| 70 to 74 Years | 11 (2.3%) | 20 (3.0%) |
| 75 to 79 Years | 17 (3.6%) | 20 (3.0%) |
| 80 to 84 Years | 1 (0.2%) | 7 (1.1%) |
| 85 Years and over | 8 (1.7%) | 10 (1.5%) |
| Total | 476 (100.0%) | 664 (100.0%) |
Families and Households in Bowmanstown borough
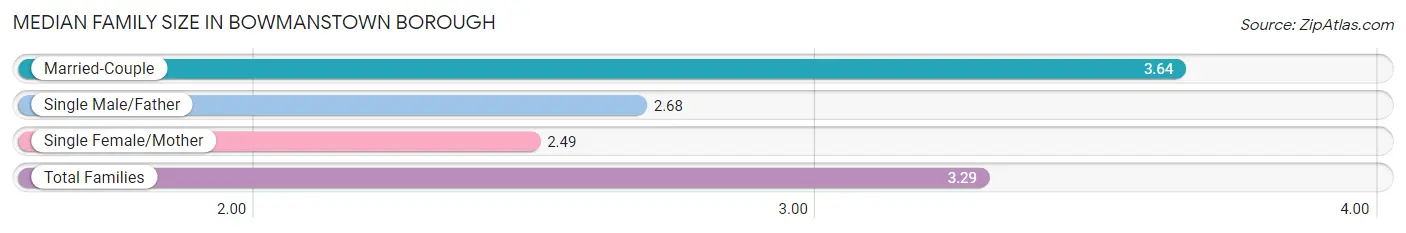
Median Family Size in Bowmanstown borough
The median family size in Bowmanstown borough is 3.29 persons per family, with married-couple families (161 | 68.2%) accounting for the largest median family size of 3.64 persons per family. On the other hand, single female/mother families (53 | 22.5%) represent the smallest median family size with 2.49 persons per family.
| Family Type | # Families | Family Size |
| Married-Couple | 161 (68.2%) | 3.64 |
| Single Male/Father | 22 (9.3%) | 2.68 |
| Single Female/Mother | 53 (22.5%) | 2.49 |
| Total Families | 236 (100.0%) | 3.29 |
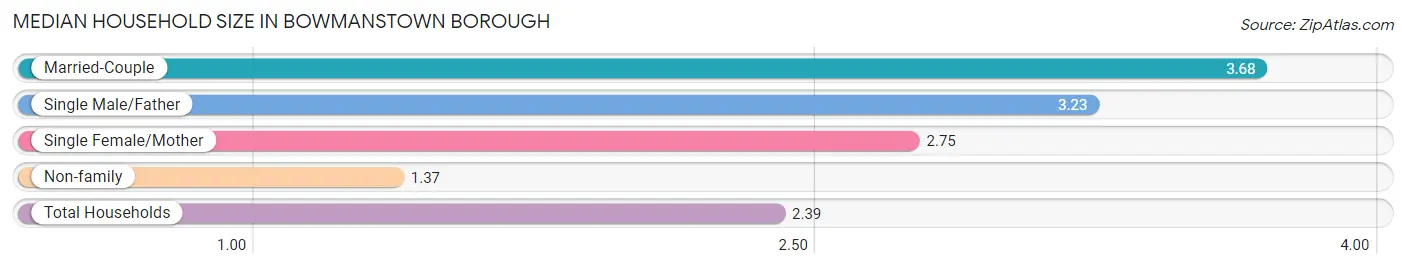
Median Household Size in Bowmanstown borough
The median household size in Bowmanstown borough is 2.39 persons per household, with married-couple households (161 | 33.8%) accounting for the largest median household size of 3.68 persons per household. non-family households (241 | 50.5%) represent the smallest median household size with 1.37 persons per household.
| Household Type | # Households | Household Size |
| Married-Couple | 161 (33.8%) | 3.68 |
| Single Male/Father | 22 (4.6%) | 3.23 |
| Single Female/Mother | 53 (11.1%) | 2.75 |
| Non-family | 241 (50.5%) | 1.37 |
| Total Households | 477 (100.0%) | 2.39 |
Household Size by Marriage Status in Bowmanstown borough
Out of a total of 477 households in Bowmanstown borough, 236 (49.5%) are family households, while 241 (50.5%) are nonfamily households. The most numerous type of family households are 3-person households, comprising 85, and the most common type of nonfamily households are 1-person households, comprising 158.

| Household Size | Family Households | Nonfamily Households |
| 1-Person Households | - | 158 (33.1%) |
| 2-Person Households | 83 (17.4%) | 83 (17.4%) |
| 3-Person Households | 85 (17.8%) | 0 (0.0%) |
| 4-Person Households | 39 (8.2%) | 0 (0.0%) |
| 5-Person Households | 26 (5.4%) | 0 (0.0%) |
| 6-Person Households | 3 (0.6%) | 0 (0.0%) |
| 7+ Person Households | 0 (0.0%) | 0 (0.0%) |
| Total | 236 (49.5%) | 241 (50.5%) |
Female Fertility in Bowmanstown borough
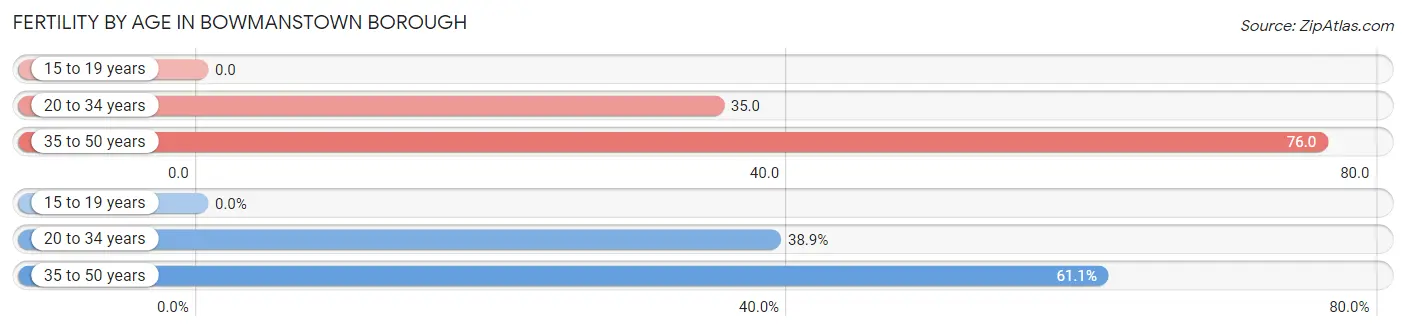
Fertility by Age in Bowmanstown borough
Average fertility rate in Bowmanstown borough is 46.0 births per 1,000 women. Women in the age bracket of 35 to 50 years have the highest fertility rate with 76.0 births per 1,000 women. Women in the age bracket of 35 to 50 years acount for 61.1% of all women with births.
| Age Bracket | Women with Births | Births / 1,000 Women |
| 15 to 19 years | 0 (0.0%) | 0.0 |
| 20 to 34 years | 7 (38.9%) | 35.0 |
| 35 to 50 years | 11 (61.1%) | 76.0 |
| Total | 18 (100.0%) | 46.0 |
Fertility by Age by Marriage Status in Bowmanstown borough
83.3% of women with births (18) in Bowmanstown borough are married. The highest percentage of unmarried women with births falls into 20 to 34 years age bracket with 42.9% of them unmarried at the time of birth, while the lowest percentage of unmarried women with births belong to 35 to 50 years age bracket with 0.0% of them unmarried.
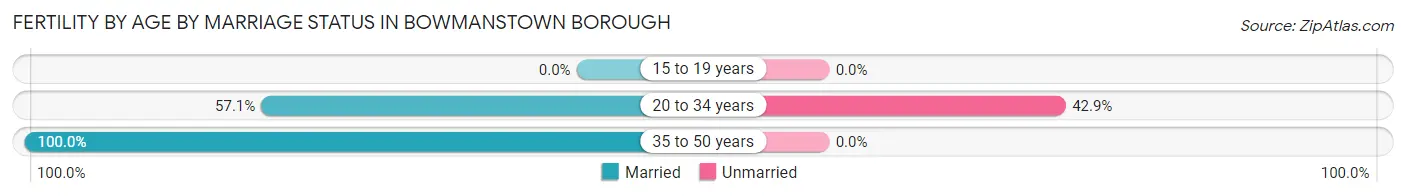
| Age Bracket | Married | Unmarried |
| 15 to 19 years | 0 (0.0%) | 0 (0.0%) |
| 20 to 34 years | 4 (57.1%) | 3 (42.9%) |
| 35 to 50 years | 11 (100.0%) | 0 (0.0%) |
| Total | 15 (83.3%) | 3 (16.7%) |
Fertility by Education in Bowmanstown borough
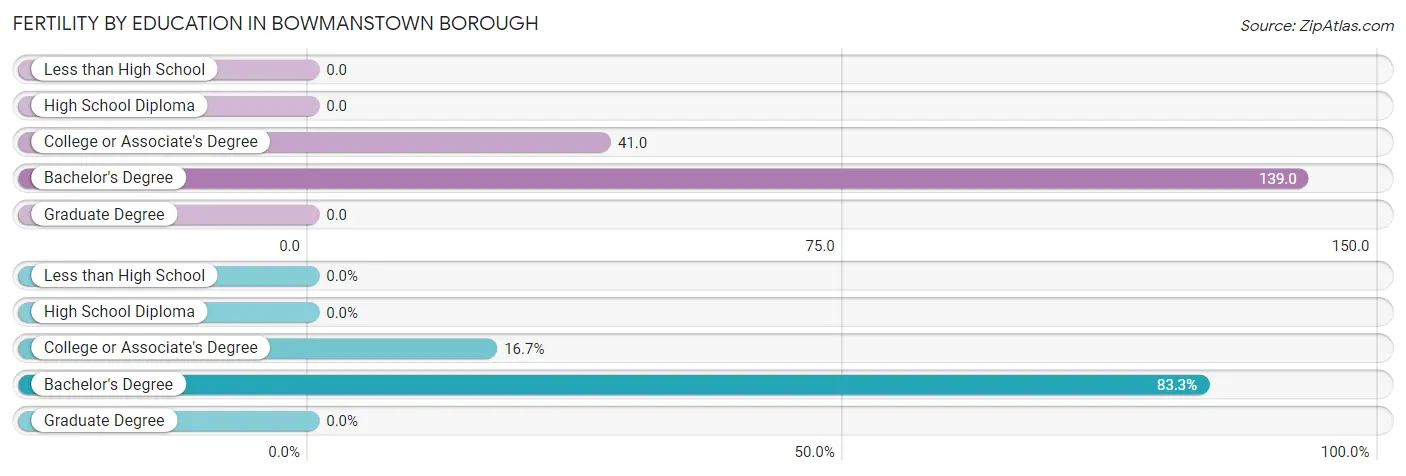
| Educational Attainment | Women with Births | Births / 1,000 Women |
| Less than High School | 0 (0.0%) | 0.0 |
| High School Diploma | 0 (0.0%) | 0.0 |
| College or Associate's Degree | 3 (16.7%) | 41.0 |
| Bachelor's Degree | 15 (83.3%) | 139.0 |
| Graduate Degree | 0 (0.0%) | 0.0 |
| Total | 18 (100.0%) | 46.0 |
Fertility by Education by Marriage Status in Bowmanstown borough
16.7% of women with births in Bowmanstown borough are unmarried. Women with the educational attainment of bachelor's degree are most likely to be married with 100.0% of them married at childbirth, while women with the educational attainment of college or associate's degree are least likely to be married with 100.0% of them unmarried at childbirth.
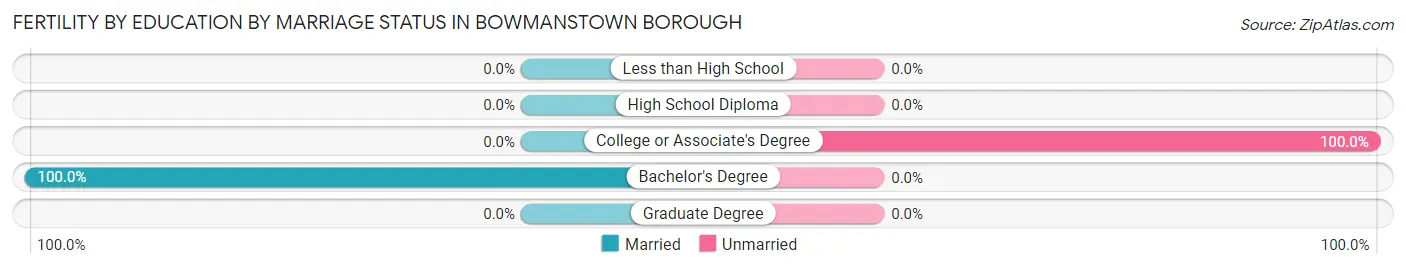
| Educational Attainment | Married | Unmarried |
| Less than High School | 0 (0.0%) | 0 (0.0%) |
| High School Diploma | 0 (0.0%) | 0 (0.0%) |
| College or Associate's Degree | 0 (0.0%) | 3 (100.0%) |
| Bachelor's Degree | 15 (100.0%) | 0 (0.0%) |
| Graduate Degree | 0 (0.0%) | 0 (0.0%) |
| Total | 15 (83.3%) | 3 (16.7%) |
Employment Characteristics in Bowmanstown borough
Employment by Class of Employer in Bowmanstown borough
Among the 580 employed individuals in Bowmanstown borough, private company employees (459 | 79.1%), not-for-profit organizations (57 | 9.8%), and local government employees (28 | 4.8%) make up the most common classes of employment.
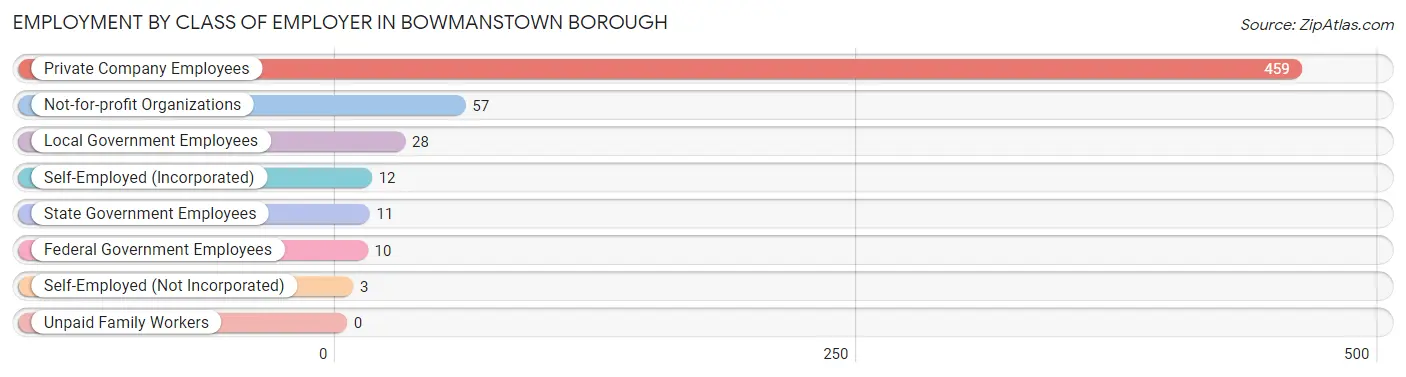
| Employer Class | # Employees | % Employees |
| Private Company Employees | 459 | 79.1% |
| Self-Employed (Incorporated) | 12 | 2.1% |
| Self-Employed (Not Incorporated) | 3 | 0.5% |
| Not-for-profit Organizations | 57 | 9.8% |
| Local Government Employees | 28 | 4.8% |
| State Government Employees | 11 | 1.9% |
| Federal Government Employees | 10 | 1.7% |
| Unpaid Family Workers | 0 | 0.0% |
| Total | 580 | 100.0% |
Employment Status by Age in Bowmanstown borough
According to the labor force statistics for Bowmanstown borough, out of the total population over 16 years of age (999), 70.2% or 701 individuals are in the labor force, with 16.1% or 113 of them unemployed. The age group with the highest labor force participation rate is 20 to 24 years, with 98.2% or 109 individuals in the labor force. Within the labor force, the 30 to 34 years age range has the highest percentage of unemployed individuals, with 54.8% or 23 of them being unemployed.
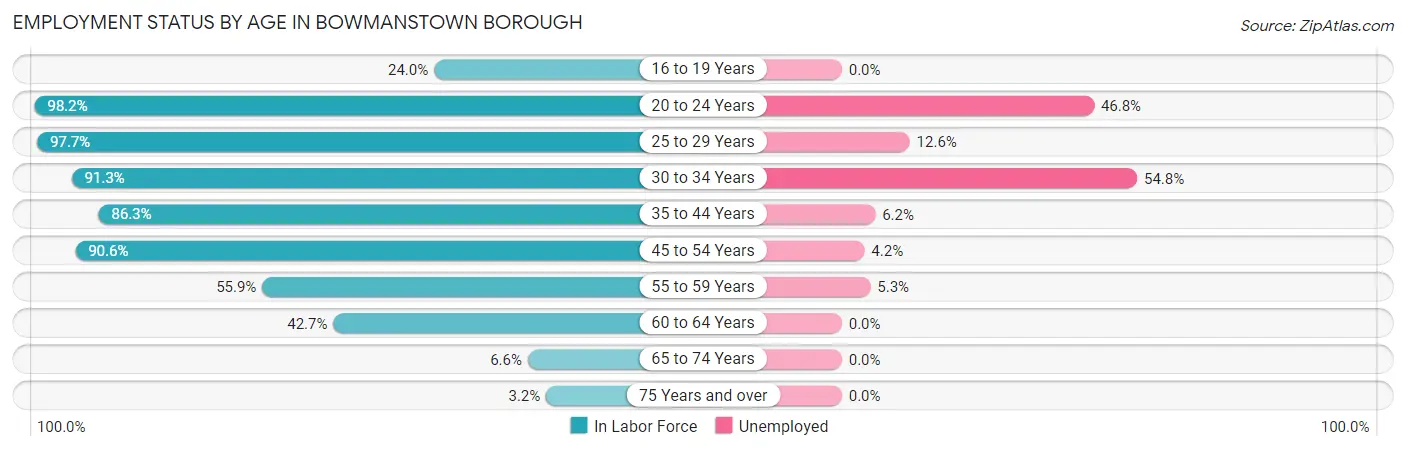
| Age Bracket | In Labor Force | Unemployed |
| 16 to 19 Years | 12 (24.0%) | 0 (0.0%) |
| 20 to 24 Years | 109 (98.2%) | 51 (46.8%) |
| 25 to 29 Years | 167 (97.7%) | 21 (12.6%) |
| 30 to 34 Years | 42 (91.3%) | 23 (54.8%) |
| 35 to 44 Years | 195 (86.3%) | 12 (6.2%) |
| 45 to 54 Years | 96 (90.6%) | 4 (4.2%) |
| 55 to 59 Years | 38 (55.9%) | 2 (5.3%) |
| 60 to 64 Years | 35 (42.7%) | 0 (0.0%) |
| 65 to 74 Years | 5 (6.6%) | 0 (0.0%) |
| 75 Years and over | 2 (3.2%) | 0 (0.0%) |
| Total | 701 (70.2%) | 113 (16.1%) |
Employment Status by Educational Attainment in Bowmanstown borough
According to labor force statistics for Bowmanstown borough, 82.0% of individuals (573) out of the total population between 25 and 64 years of age (699) are in the labor force, with 10.8% or 62 of them being unemployed. The group with the highest labor force participation rate are those with the educational attainment of bachelor's degree or higher, with 97.0% or 197 individuals in the labor force. Within the labor force, individuals with high school diploma education have the highest percentage of unemployment, with 20.2% or 38 of them being unemployed.
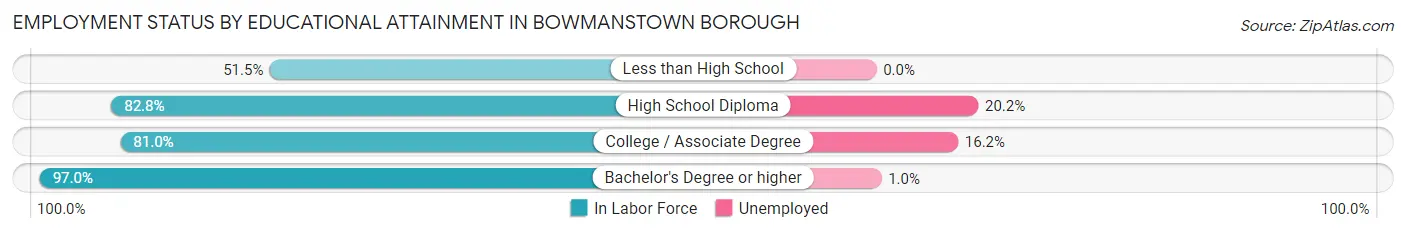
| Educational Attainment | In Labor Force | Unemployed |
| Less than High School | 52 (51.5%) | 0 (0.0%) |
| High School Diploma | 188 (82.8%) | 46 (20.2%) |
| College / Associate Degree | 136 (81.0%) | 27 (16.2%) |
| Bachelor's Degree or higher | 197 (97.0%) | 2 (1.0%) |
| Total | 573 (82.0%) | 75 (10.8%) |
Employment Occupations by Sex in Bowmanstown borough
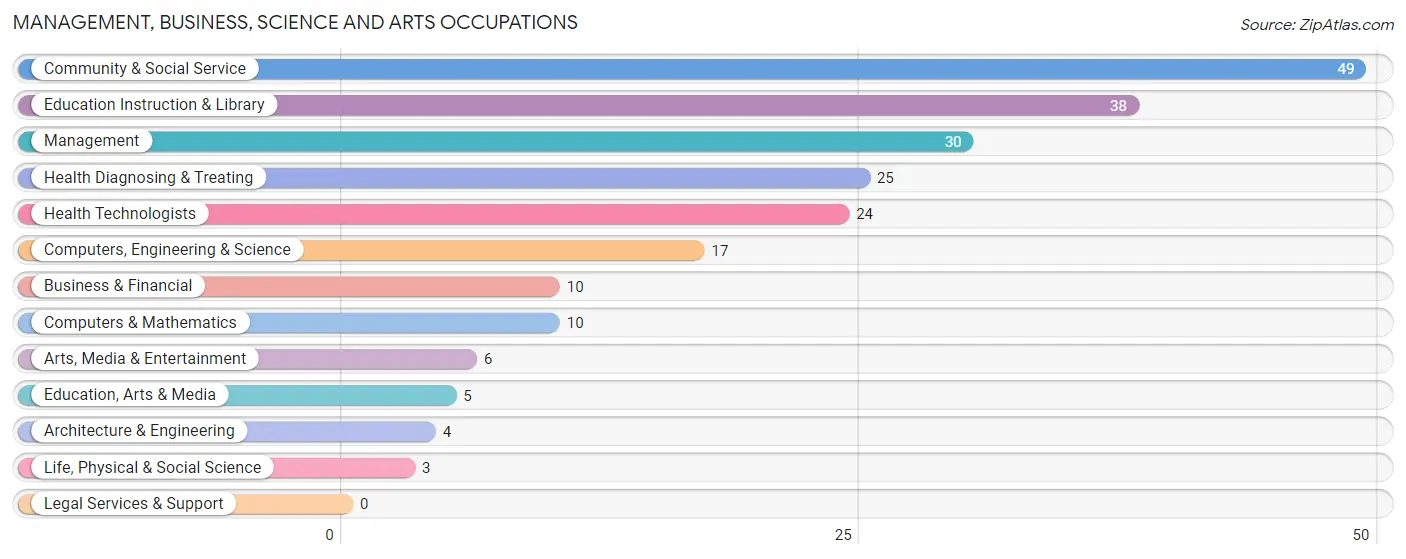
Management, Business, Science and Arts Occupations
The most common Management, Business, Science and Arts occupations in Bowmanstown borough are Community & Social Service (49 | 8.3%), Education Instruction & Library (38 | 6.5%), Management (30 | 5.1%), Health Diagnosing & Treating (25 | 4.3%), and Health Technologists (24 | 4.1%).
Management, Business, Science and Arts Occupations by Sex
Within the Management, Business, Science and Arts occupations in Bowmanstown borough, the most male-oriented occupations are Computers & Mathematics (100.0%), Life, Physical & Social Science (100.0%), and Computers, Engineering & Science (76.5%), while the most female-oriented occupations are Architecture & Engineering (100.0%), Education, Arts & Media (100.0%), and Health Diagnosing & Treating (100.0%).
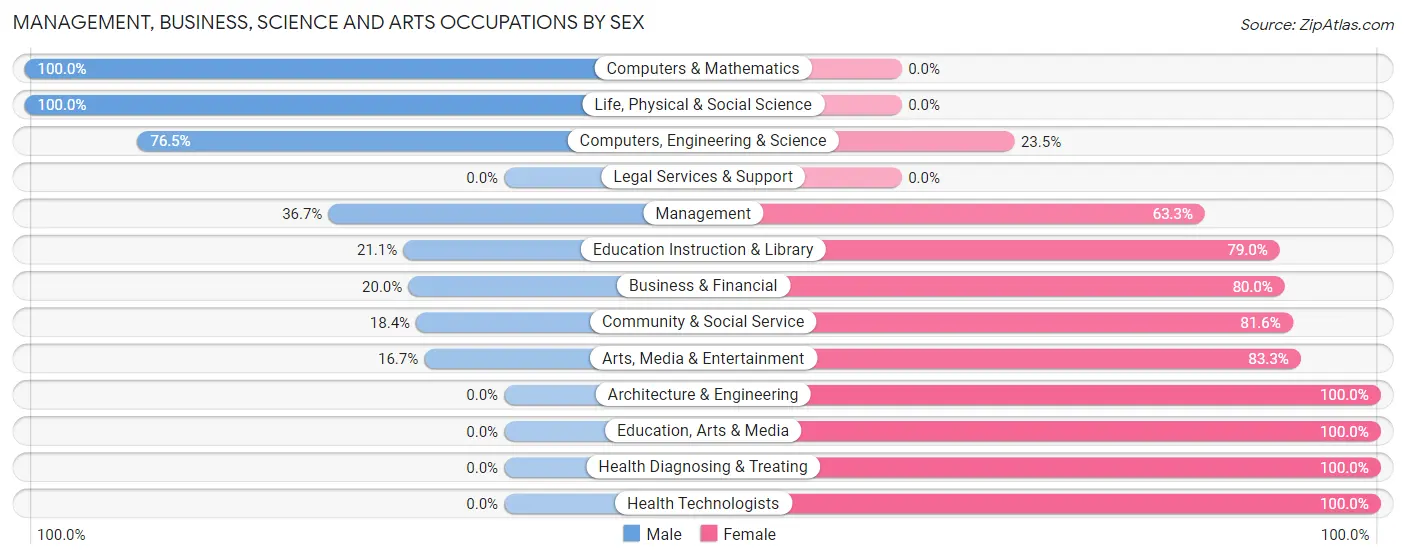
| Occupation | Male | Female |
| Management | 11 (36.7%) | 19 (63.3%) |
| Business & Financial | 2 (20.0%) | 8 (80.0%) |
| Computers, Engineering & Science | 13 (76.5%) | 4 (23.5%) |
| Computers & Mathematics | 10 (100.0%) | 0 (0.0%) |
| Architecture & Engineering | 0 (0.0%) | 4 (100.0%) |
| Life, Physical & Social Science | 3 (100.0%) | 0 (0.0%) |
| Community & Social Service | 9 (18.4%) | 40 (81.6%) |
| Education, Arts & Media | 0 (0.0%) | 5 (100.0%) |
| Legal Services & Support | 0 (0.0%) | 0 (0.0%) |
| Education Instruction & Library | 8 (21.0%) | 30 (78.9%) |
| Arts, Media & Entertainment | 1 (16.7%) | 5 (83.3%) |
| Health Diagnosing & Treating | 0 (0.0%) | 25 (100.0%) |
| Health Technologists | 0 (0.0%) | 24 (100.0%) |
| Total (Category) | 35 (26.7%) | 96 (73.3%) |
| Total (Overall) | 266 (45.2%) | 322 (54.8%) |
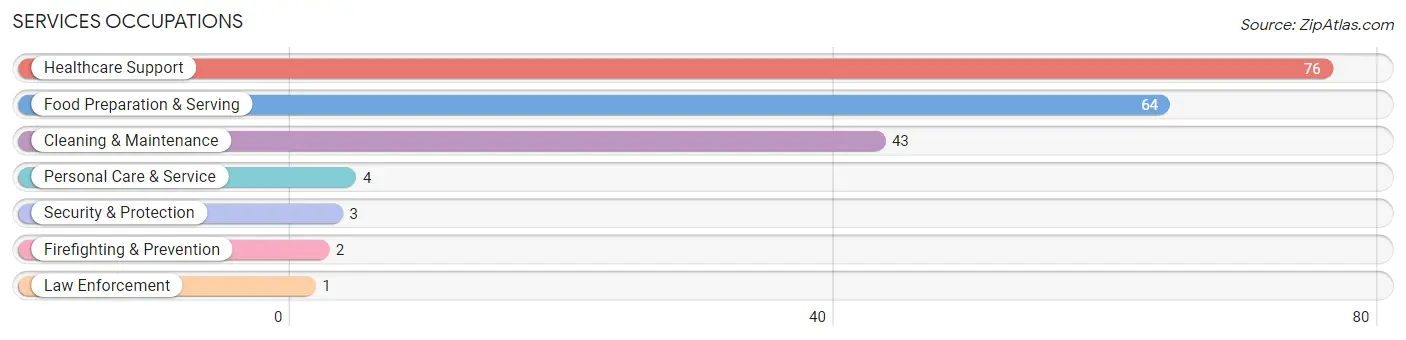
Services Occupations
The most common Services occupations in Bowmanstown borough are Healthcare Support (76 | 12.9%), Food Preparation & Serving (64 | 10.9%), Cleaning & Maintenance (43 | 7.3%), Personal Care & Service (4 | 0.7%), and Security & Protection (3 | 0.5%).
Services Occupations by Sex
Within the Services occupations in Bowmanstown borough, the most male-oriented occupations are Security & Protection (100.0%), Firefighting & Prevention (100.0%), and Law Enforcement (100.0%), while the most female-oriented occupations are Personal Care & Service (100.0%), Healthcare Support (97.4%), and Food Preparation & Serving (48.4%).
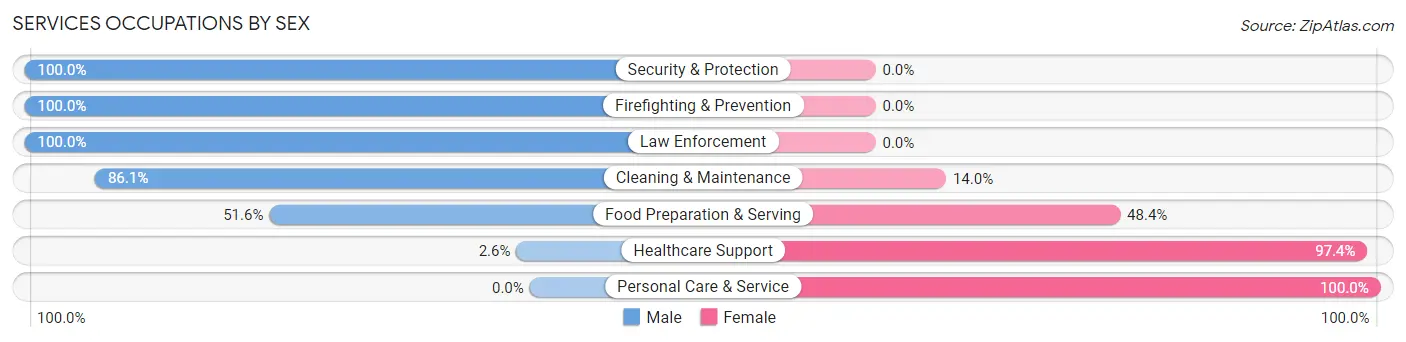
| Occupation | Male | Female |
| Healthcare Support | 2 (2.6%) | 74 (97.4%) |
| Security & Protection | 3 (100.0%) | 0 (0.0%) |
| Firefighting & Prevention | 2 (100.0%) | 0 (0.0%) |
| Law Enforcement | 1 (100.0%) | 0 (0.0%) |
| Food Preparation & Serving | 33 (51.6%) | 31 (48.4%) |
| Cleaning & Maintenance | 37 (86.1%) | 6 (14.0%) |
| Personal Care & Service | 0 (0.0%) | 4 (100.0%) |
| Total (Category) | 75 (39.5%) | 115 (60.5%) |
| Total (Overall) | 266 (45.2%) | 322 (54.8%) |
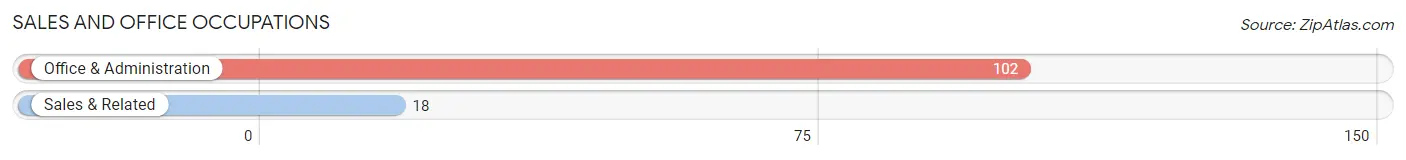
Sales and Office Occupations
The most common Sales and Office occupations in Bowmanstown borough are Office & Administration (102 | 17.3%), and Sales & Related (18 | 3.1%).
Sales and Office Occupations by Sex
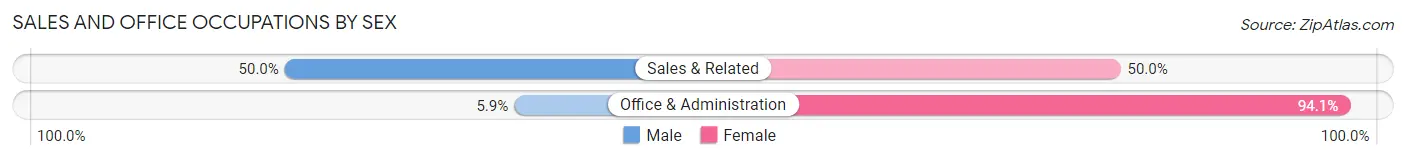
| Occupation | Male | Female |
| Sales & Related | 9 (50.0%) | 9 (50.0%) |
| Office & Administration | 6 (5.9%) | 96 (94.1%) |
| Total (Category) | 15 (12.5%) | 105 (87.5%) |
| Total (Overall) | 266 (45.2%) | 322 (54.8%) |
Natural Resources, Construction and Maintenance Occupations
The most common Natural Resources, Construction and Maintenance occupations in Bowmanstown borough are Construction & Extraction (48 | 8.2%), Farming, Fishing & Forestry (13 | 2.2%), and Installation, Maintenance & Repair (12 | 2.0%).
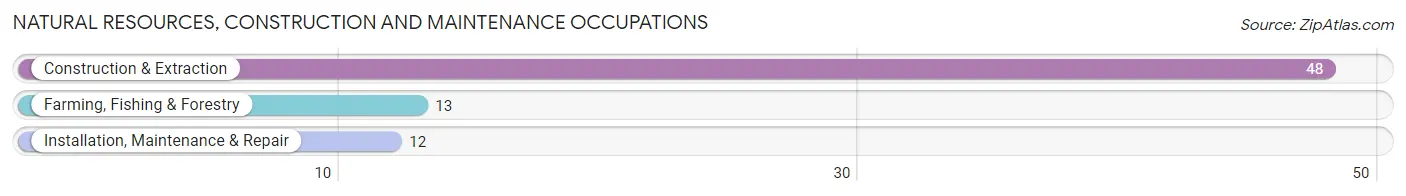
Natural Resources, Construction and Maintenance Occupations by Sex
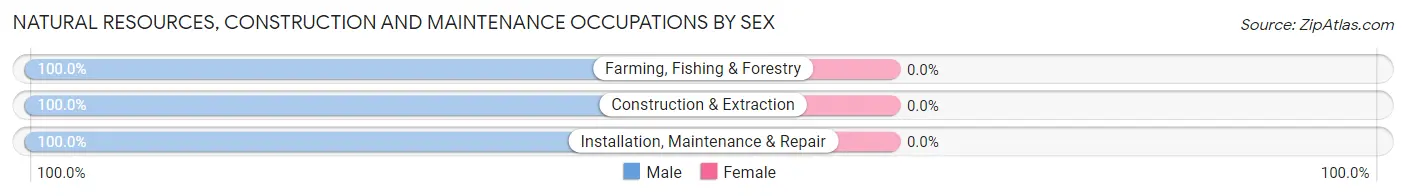
| Occupation | Male | Female |
| Farming, Fishing & Forestry | 13 (100.0%) | 0 (0.0%) |
| Construction & Extraction | 48 (100.0%) | 0 (0.0%) |
| Installation, Maintenance & Repair | 12 (100.0%) | 0 (0.0%) |
| Total (Category) | 73 (100.0%) | 0 (0.0%) |
| Total (Overall) | 266 (45.2%) | 322 (54.8%) |
Production, Transportation and Moving Occupations
The most common Production, Transportation and Moving occupations in Bowmanstown borough are Production (31 | 5.3%), Material Moving (30 | 5.1%), and Transportation (13 | 2.2%).
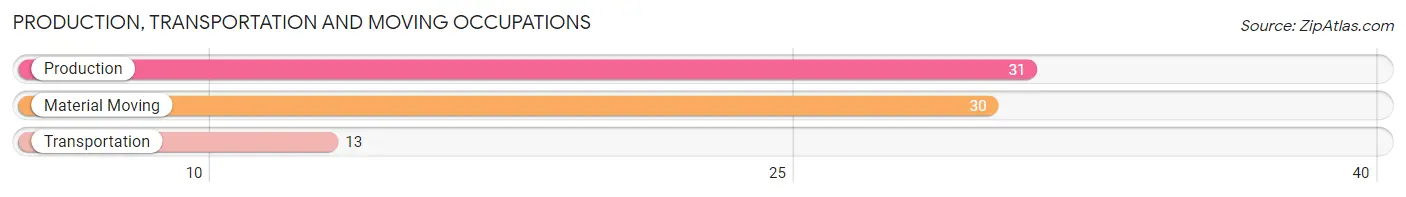
Production, Transportation and Moving Occupations by Sex
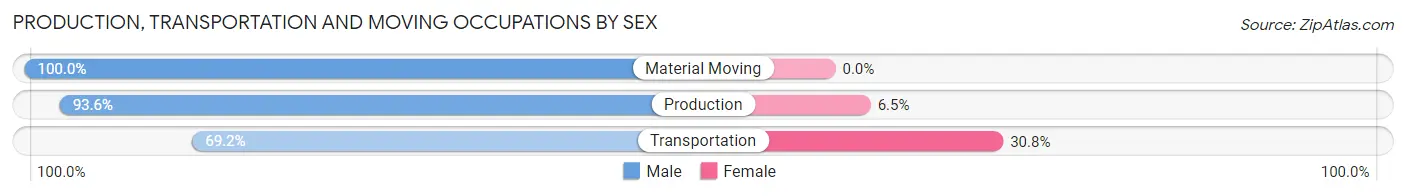
| Occupation | Male | Female |
| Production | 29 (93.5%) | 2 (6.5%) |
| Transportation | 9 (69.2%) | 4 (30.8%) |
| Material Moving | 30 (100.0%) | 0 (0.0%) |
| Total (Category) | 68 (91.9%) | 6 (8.1%) |
| Total (Overall) | 266 (45.2%) | 322 (54.8%) |
Employment Industries by Sex in Bowmanstown borough
Employment Industries in Bowmanstown borough
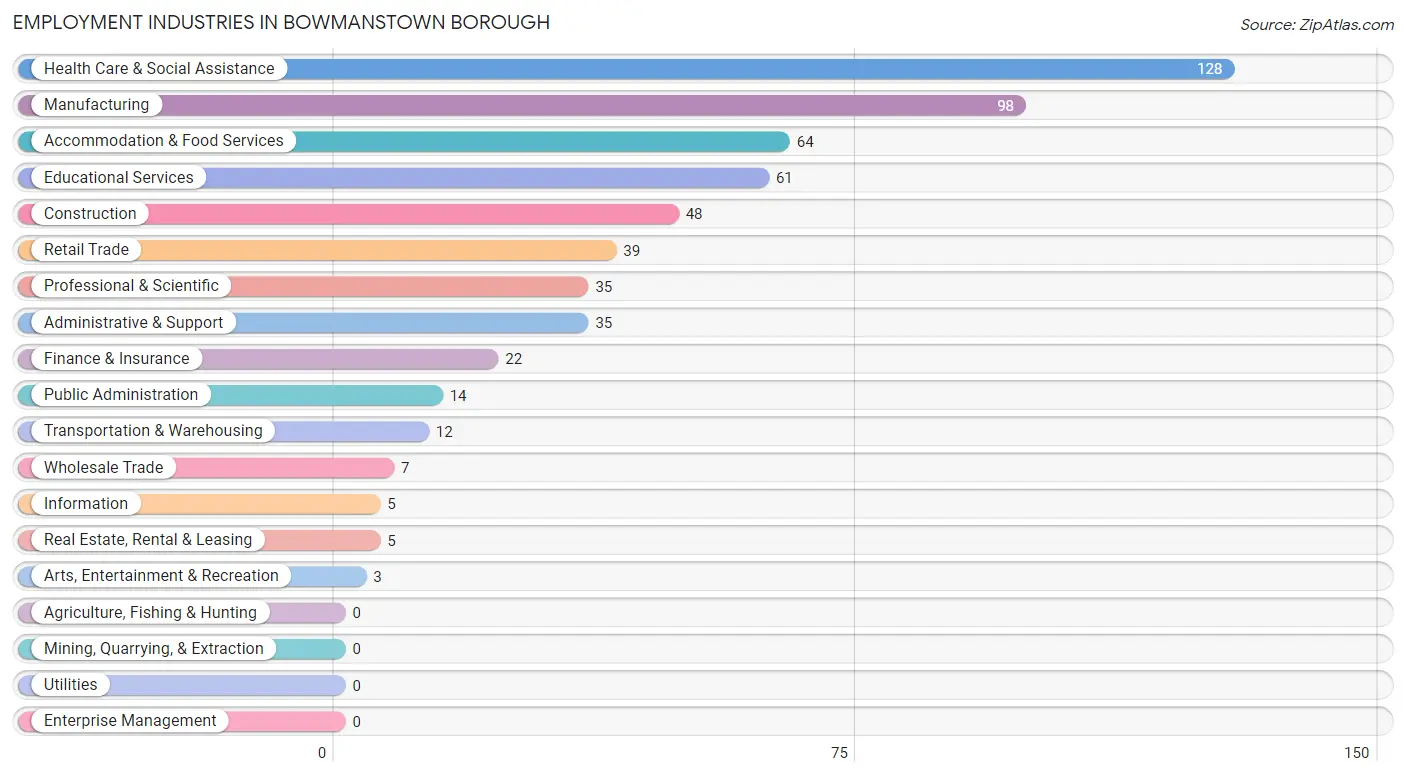
The major employment industries in Bowmanstown borough include Health Care & Social Assistance (128 | 21.8%), Manufacturing (98 | 16.7%), Accommodation & Food Services (64 | 10.9%), Educational Services (61 | 10.4%), and Construction (48 | 8.2%).
Employment Industries by Sex in Bowmanstown borough
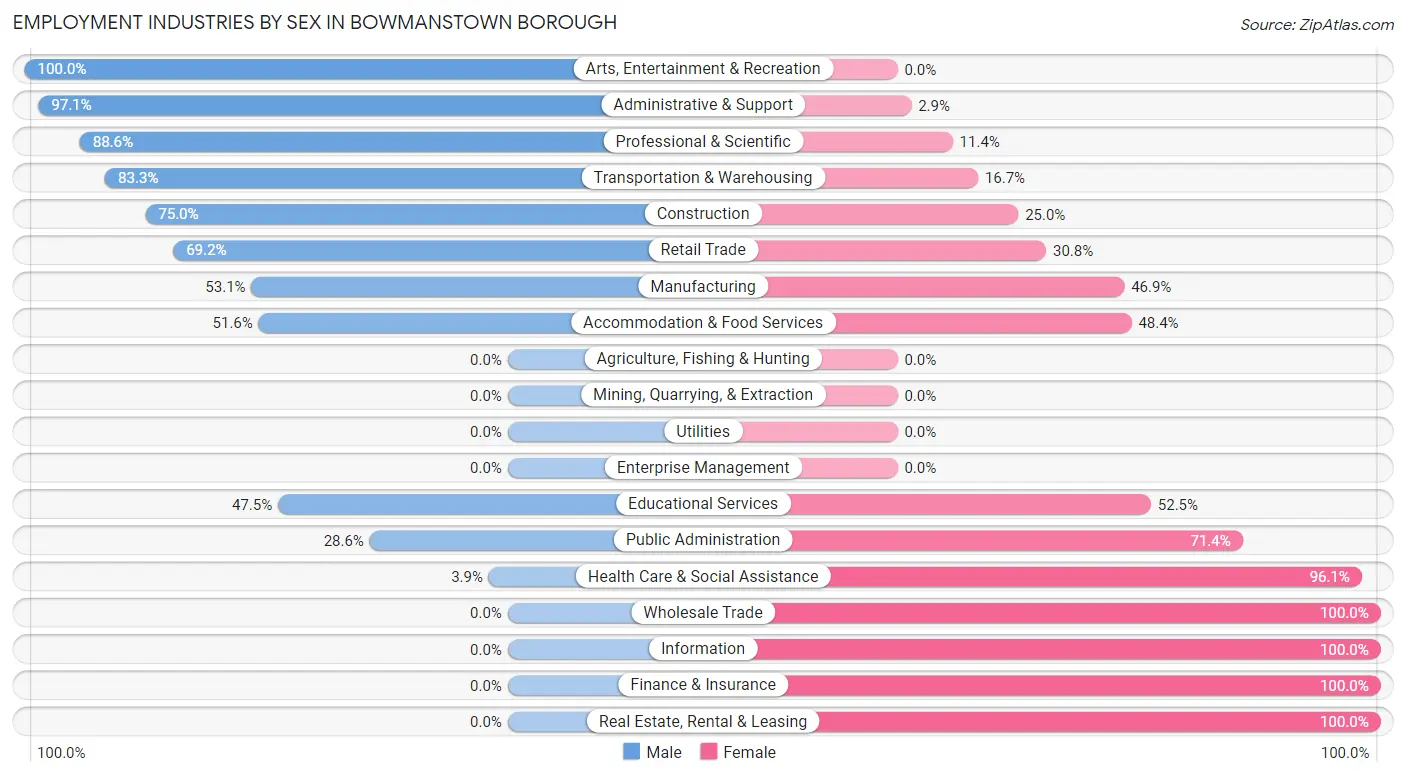
The Bowmanstown borough industries that see more men than women are Arts, Entertainment & Recreation (100.0%), Administrative & Support (97.1%), and Professional & Scientific (88.6%), whereas the industries that tend to have a higher number of women are Wholesale Trade (100.0%), Information (100.0%), and Finance & Insurance (100.0%).
| Industry | Male | Female |
| Agriculture, Fishing & Hunting | 0 (0.0%) | 0 (0.0%) |
| Mining, Quarrying, & Extraction | 0 (0.0%) | 0 (0.0%) |
| Construction | 36 (75.0%) | 12 (25.0%) |
| Manufacturing | 52 (53.1%) | 46 (46.9%) |
| Wholesale Trade | 0 (0.0%) | 7 (100.0%) |
| Retail Trade | 27 (69.2%) | 12 (30.8%) |
| Transportation & Warehousing | 10 (83.3%) | 2 (16.7%) |
| Utilities | 0 (0.0%) | 0 (0.0%) |
| Information | 0 (0.0%) | 5 (100.0%) |
| Finance & Insurance | 0 (0.0%) | 22 (100.0%) |
| Real Estate, Rental & Leasing | 0 (0.0%) | 5 (100.0%) |
| Professional & Scientific | 31 (88.6%) | 4 (11.4%) |
| Enterprise Management | 0 (0.0%) | 0 (0.0%) |
| Administrative & Support | 34 (97.1%) | 1 (2.9%) |
| Educational Services | 29 (47.5%) | 32 (52.5%) |
| Health Care & Social Assistance | 5 (3.9%) | 123 (96.1%) |
| Arts, Entertainment & Recreation | 3 (100.0%) | 0 (0.0%) |
| Accommodation & Food Services | 33 (51.6%) | 31 (48.4%) |
| Public Administration | 4 (28.6%) | 10 (71.4%) |
| Total | 266 (45.2%) | 322 (54.8%) |
Education in Bowmanstown borough
School Enrollment in Bowmanstown borough
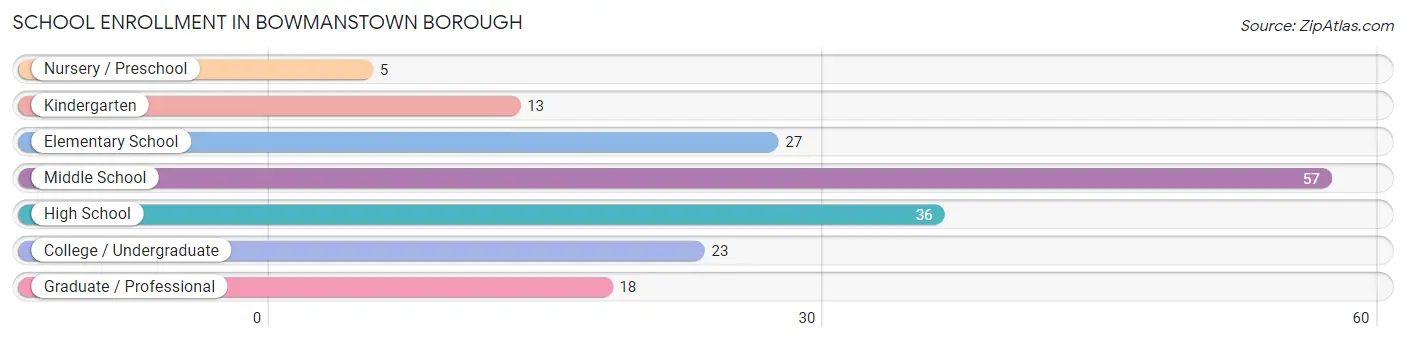
The most common levels of schooling among the 179 students in Bowmanstown borough are middle school (57 | 31.8%), high school (36 | 20.1%), and elementary school (27 | 15.1%).
| School Level | # Students | % Students |
| Nursery / Preschool | 5 | 2.8% |
| Kindergarten | 13 | 7.3% |
| Elementary School | 27 | 15.1% |
| Middle School | 57 | 31.8% |
| High School | 36 | 20.1% |
| College / Undergraduate | 23 | 12.9% |
| Graduate / Professional | 18 | 10.1% |
| Total | 179 | 100.0% |
School Enrollment by Age by Funding Source in Bowmanstown borough
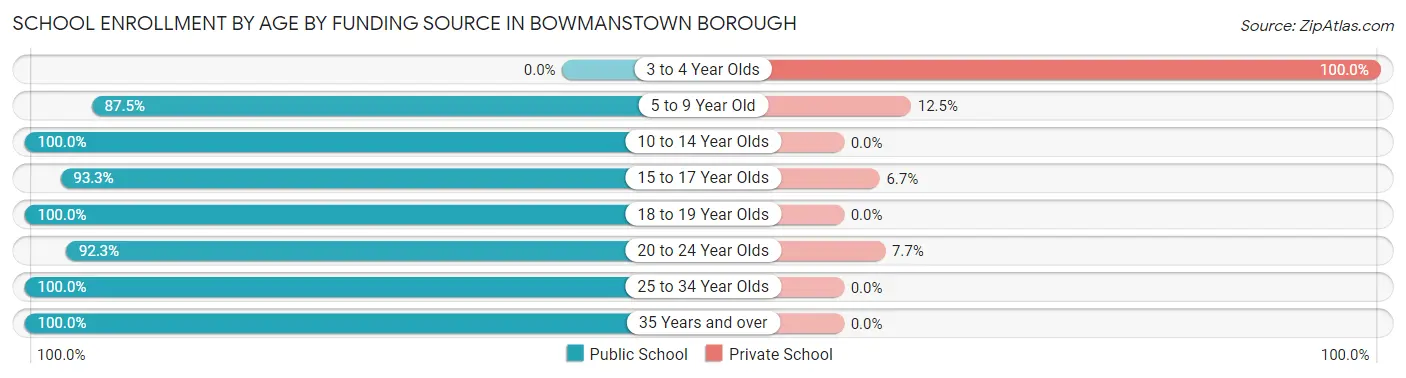
Out of a total of 179 students who are enrolled in schools in Bowmanstown borough, 13 (7.3%) attend a private institution, while the remaining 166 (92.7%) are enrolled in public schools. The age group of 3 to 4 year olds has the highest likelihood of being enrolled in private schools, with 5 (100.0% in the age bracket) enrolled. Conversely, the age group of 10 to 14 year olds has the lowest likelihood of being enrolled in a private school, with 57 (100.0% in the age bracket) attending a public institution.
| Age Bracket | Public School | Private School |
| 3 to 4 Year Olds | 0 (0.0%) | 5 (100.0%) |
| 5 to 9 Year Old | 35 (87.5%) | 5 (12.5%) |
| 10 to 14 Year Olds | 57 (100.0%) | 0 (0.0%) |
| 15 to 17 Year Olds | 28 (93.3%) | 2 (6.7%) |
| 18 to 19 Year Olds | 10 (100.0%) | 0 (0.0%) |
| 20 to 24 Year Olds | 12 (92.3%) | 1 (7.7%) |
| 25 to 34 Year Olds | 11 (100.0%) | 0 (0.0%) |
| 35 Years and over | 13 (100.0%) | 0 (0.0%) |
| Total | 166 (92.7%) | 13 (7.3%) |
Educational Attainment by Field of Study in Bowmanstown borough
Arts & humanities (60 | 27.9%), education (41 | 19.1%), bio, nature & agricultural (24 | 11.2%), multidisciplinary studies (16 | 7.4%), and social sciences (15 | 7.0%) are the most common fields of study among 215 individuals in Bowmanstown borough who have obtained a bachelor's degree or higher.
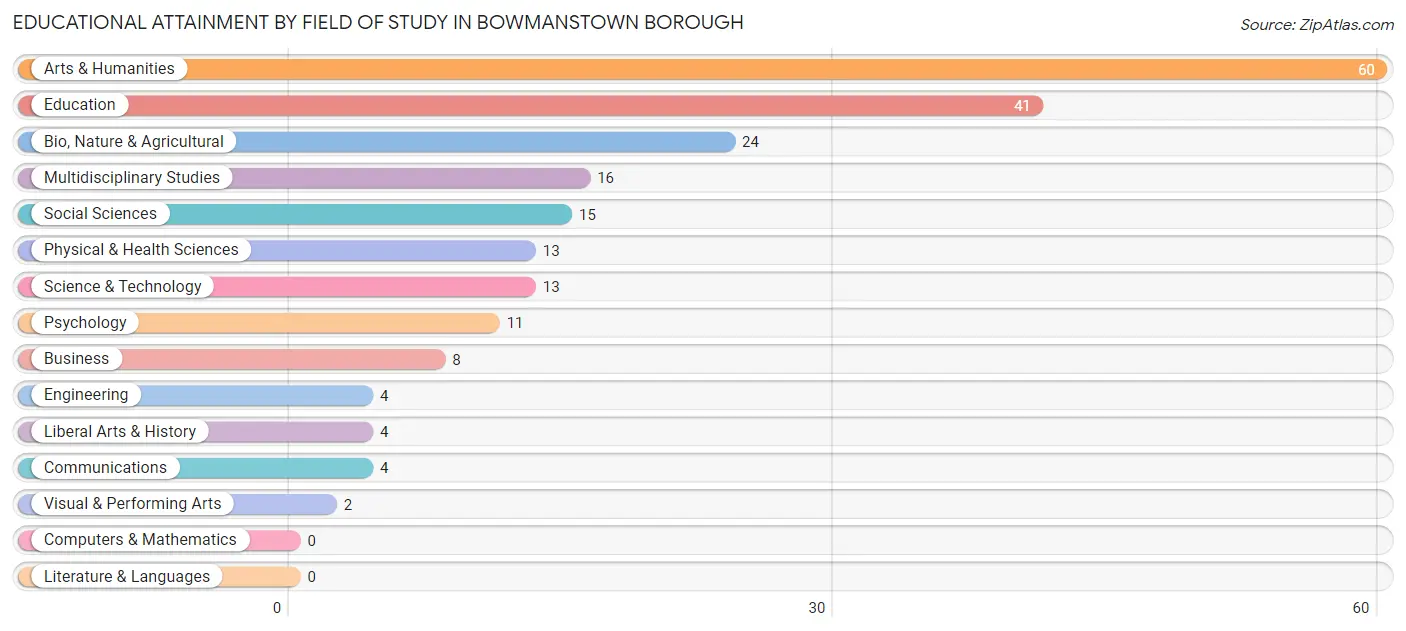
| Field of Study | # Graduates | % Graduates |
| Computers & Mathematics | 0 | 0.0% |
| Bio, Nature & Agricultural | 24 | 11.2% |
| Physical & Health Sciences | 13 | 6.0% |
| Psychology | 11 | 5.1% |
| Social Sciences | 15 | 7.0% |
| Engineering | 4 | 1.9% |
| Multidisciplinary Studies | 16 | 7.4% |
| Science & Technology | 13 | 6.0% |
| Business | 8 | 3.7% |
| Education | 41 | 19.1% |
| Literature & Languages | 0 | 0.0% |
| Liberal Arts & History | 4 | 1.9% |
| Visual & Performing Arts | 2 | 0.9% |
| Communications | 4 | 1.9% |
| Arts & Humanities | 60 | 27.9% |
| Total | 215 | 100.0% |
Transportation & Commute in Bowmanstown borough
Vehicle Availability by Sex in Bowmanstown borough
The most prevalent vehicle ownership categories in Bowmanstown borough are males with 1 vehicle (78, accounting for 29.5%) and females with 1 vehicle (106, making up 24.7%).
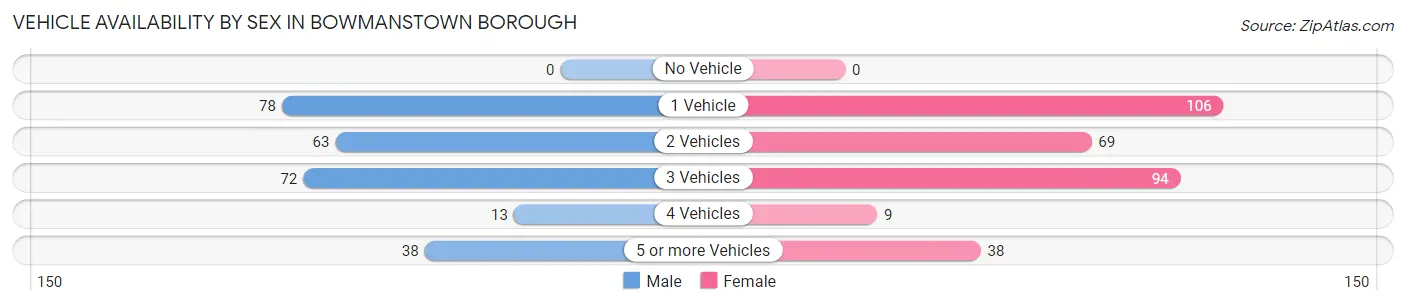
| Vehicles Available | Male | Female |
| No Vehicle | 0 (0.0%) | 0 (0.0%) |
| 1 Vehicle | 78 (29.5%) | 106 (33.5%) |
| 2 Vehicles | 63 (23.9%) | 69 (21.8%) |
| 3 Vehicles | 72 (27.3%) | 94 (29.7%) |
| 4 Vehicles | 13 (4.9%) | 9 (2.9%) |
| 5 or more Vehicles | 38 (14.4%) | 38 (12.0%) |
| Total | 264 (100.0%) | 316 (100.0%) |
Commute Time in Bowmanstown borough
The most frequently occuring commute durations in Bowmanstown borough are 45 to 59 minutes (108 commuters, 19.3%), 10 to 14 minutes (90 commuters, 16.1%), and 15 to 19 minutes (78 commuters, 14.0%).
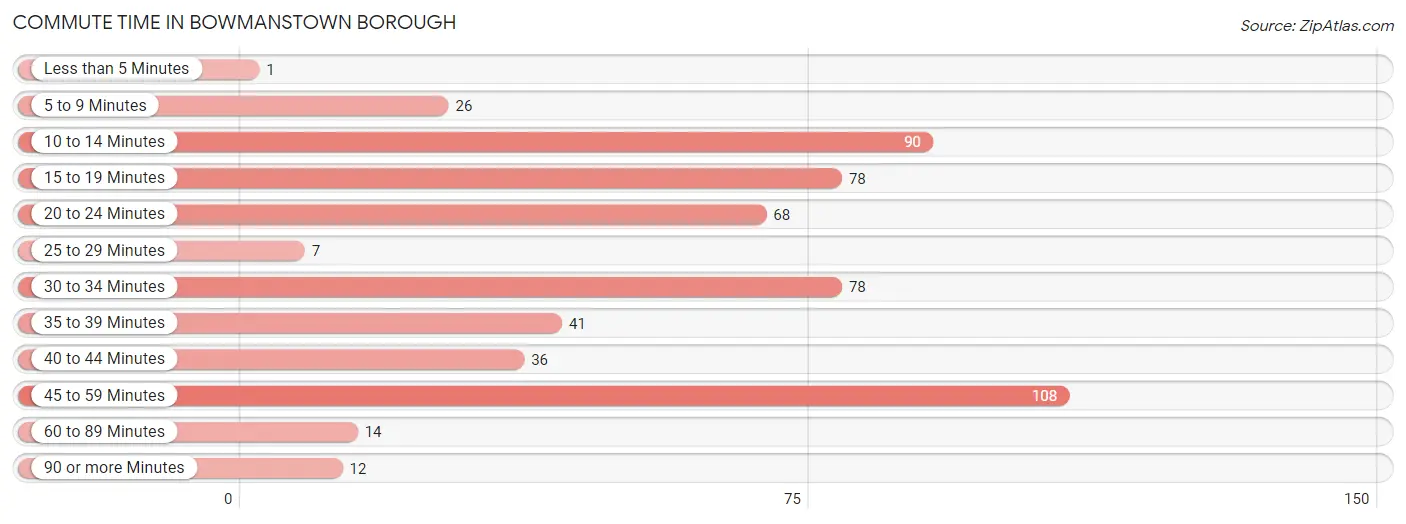
| Commute Time | # Commuters | % Commuters |
| Less than 5 Minutes | 1 | 0.2% |
| 5 to 9 Minutes | 26 | 4.6% |
| 10 to 14 Minutes | 90 | 16.1% |
| 15 to 19 Minutes | 78 | 14.0% |
| 20 to 24 Minutes | 68 | 12.2% |
| 25 to 29 Minutes | 7 | 1.3% |
| 30 to 34 Minutes | 78 | 14.0% |
| 35 to 39 Minutes | 41 | 7.3% |
| 40 to 44 Minutes | 36 | 6.4% |
| 45 to 59 Minutes | 108 | 19.3% |
| 60 to 89 Minutes | 14 | 2.5% |
| 90 or more Minutes | 12 | 2.1% |
Commute Time by Sex in Bowmanstown borough
The most common commute times in Bowmanstown borough are 30 to 34 minutes (55 commuters, 21.1%) for males and 15 to 19 minutes (69 commuters, 23.2%) for females.
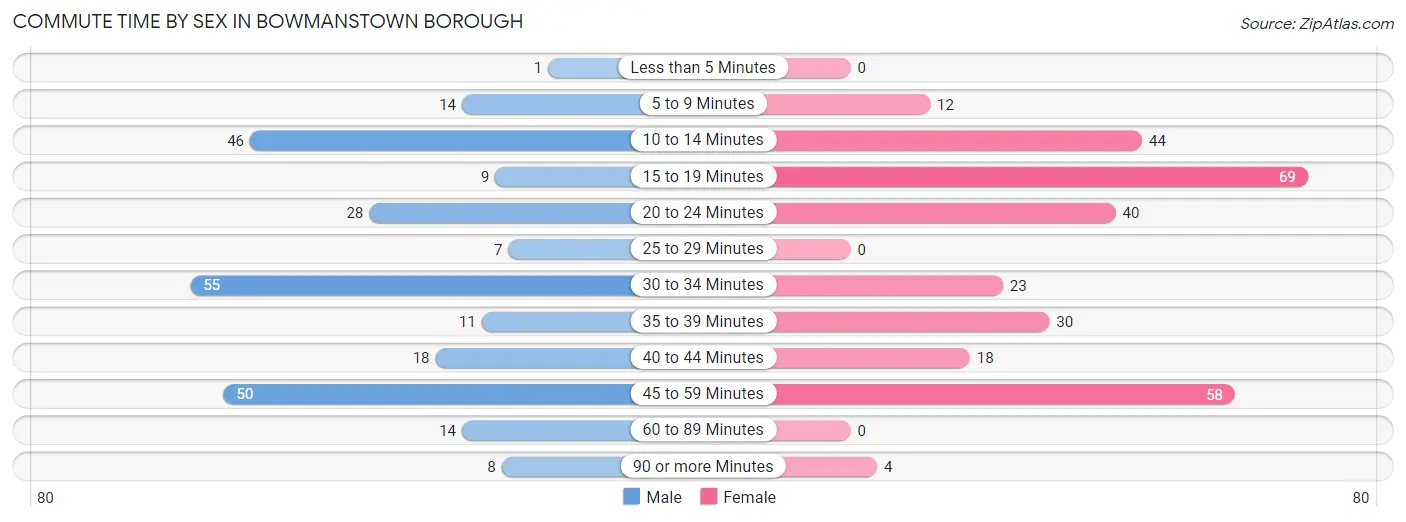
| Commute Time | Male | Female |
| Less than 5 Minutes | 1 (0.4%) | 0 (0.0%) |
| 5 to 9 Minutes | 14 (5.4%) | 12 (4.0%) |
| 10 to 14 Minutes | 46 (17.6%) | 44 (14.8%) |
| 15 to 19 Minutes | 9 (3.5%) | 69 (23.2%) |
| 20 to 24 Minutes | 28 (10.7%) | 40 (13.4%) |
| 25 to 29 Minutes | 7 (2.7%) | 0 (0.0%) |
| 30 to 34 Minutes | 55 (21.1%) | 23 (7.7%) |
| 35 to 39 Minutes | 11 (4.2%) | 30 (10.1%) |
| 40 to 44 Minutes | 18 (6.9%) | 18 (6.0%) |
| 45 to 59 Minutes | 50 (19.2%) | 58 (19.5%) |
| 60 to 89 Minutes | 14 (5.4%) | 0 (0.0%) |
| 90 or more Minutes | 8 (3.1%) | 4 (1.3%) |
Time of Departure to Work by Sex in Bowmanstown borough
The most frequent times of departure to work in Bowmanstown borough are 7:00 AM to 7:29 AM (101, 38.7%) for males and 7:00 AM to 7:29 AM (111, 37.2%) for females.
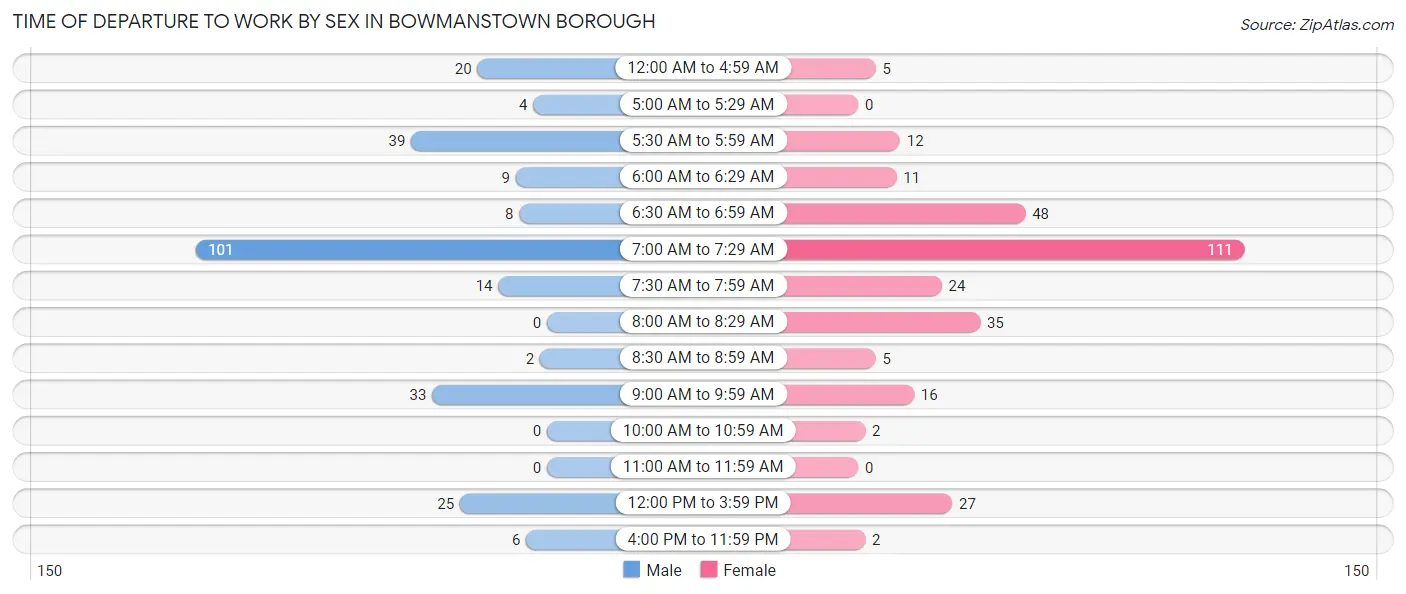
| Time of Departure | Male | Female |
| 12:00 AM to 4:59 AM | 20 (7.7%) | 5 (1.7%) |
| 5:00 AM to 5:29 AM | 4 (1.5%) | 0 (0.0%) |
| 5:30 AM to 5:59 AM | 39 (14.9%) | 12 (4.0%) |
| 6:00 AM to 6:29 AM | 9 (3.5%) | 11 (3.7%) |
| 6:30 AM to 6:59 AM | 8 (3.1%) | 48 (16.1%) |
| 7:00 AM to 7:29 AM | 101 (38.7%) | 111 (37.2%) |
| 7:30 AM to 7:59 AM | 14 (5.4%) | 24 (8.1%) |
| 8:00 AM to 8:29 AM | 0 (0.0%) | 35 (11.7%) |
| 8:30 AM to 8:59 AM | 2 (0.8%) | 5 (1.7%) |
| 9:00 AM to 9:59 AM | 33 (12.6%) | 16 (5.4%) |
| 10:00 AM to 10:59 AM | 0 (0.0%) | 2 (0.7%) |
| 11:00 AM to 11:59 AM | 0 (0.0%) | 0 (0.0%) |
| 12:00 PM to 3:59 PM | 25 (9.6%) | 27 (9.1%) |
| 4:00 PM to 11:59 PM | 6 (2.3%) | 2 (0.7%) |
| Total | 261 (100.0%) | 298 (100.0%) |
Housing Occupancy in Bowmanstown borough
Occupancy by Ownership in Bowmanstown borough
Of the total 477 dwellings in Bowmanstown borough, owner-occupied units account for 256 (53.7%), while renter-occupied units make up 221 (46.3%).
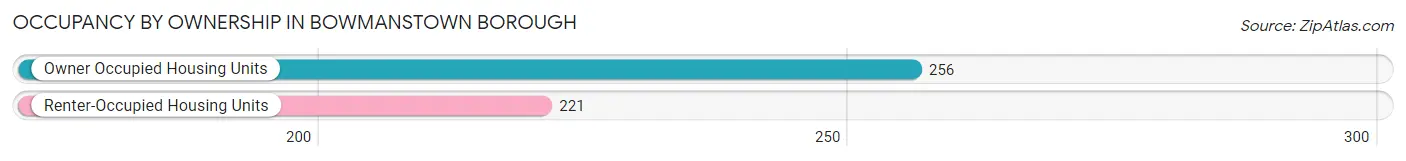
| Occupancy | # Housing Units | % Housing Units |
| Owner Occupied Housing Units | 256 | 53.7% |
| Renter-Occupied Housing Units | 221 | 46.3% |
| Total Occupied Housing Units | 477 | 100.0% |
Occupancy by Household Size in Bowmanstown borough
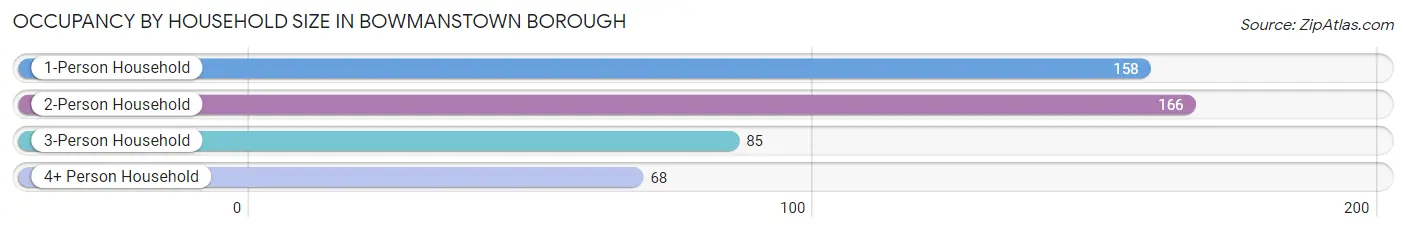
| Household Size | # Housing Units | % Housing Units |
| 1-Person Household | 158 | 33.1% |
| 2-Person Household | 166 | 34.8% |
| 3-Person Household | 85 | 17.8% |
| 4+ Person Household | 68 | 14.3% |
| Total Housing Units | 477 | 100.0% |
Occupancy by Ownership by Household Size in Bowmanstown borough
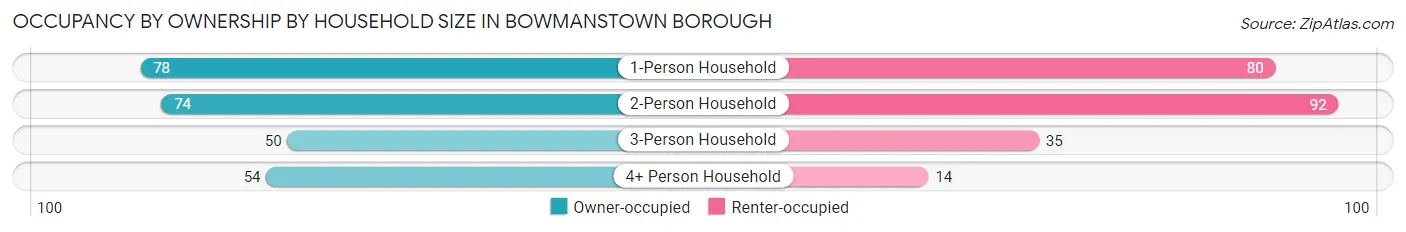
| Household Size | Owner-occupied | Renter-occupied |
| 1-Person Household | 78 (49.4%) | 80 (50.6%) |
| 2-Person Household | 74 (44.6%) | 92 (55.4%) |
| 3-Person Household | 50 (58.8%) | 35 (41.2%) |
| 4+ Person Household | 54 (79.4%) | 14 (20.6%) |
| Total Housing Units | 256 (53.7%) | 221 (46.3%) |
Occupancy by Educational Attainment in Bowmanstown borough
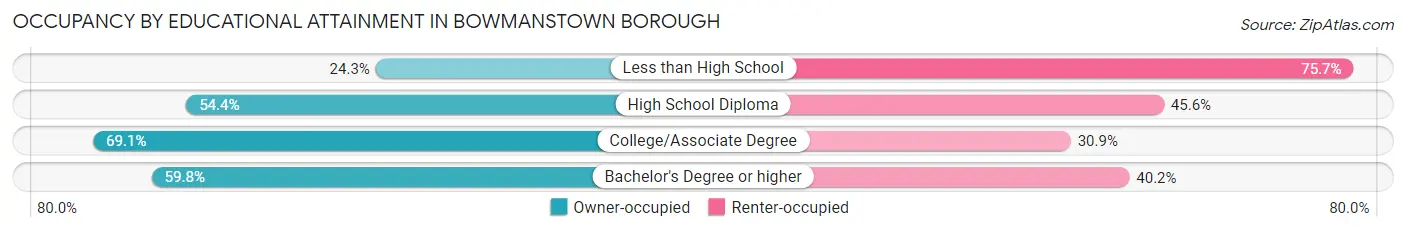
| Household Size | Owner-occupied | Renter-occupied |
| Less than High School | 18 (24.3%) | 56 (75.7%) |
| High School Diploma | 106 (54.4%) | 89 (45.6%) |
| College/Associate Degree | 56 (69.1%) | 25 (30.9%) |
| Bachelor's Degree or higher | 76 (59.8%) | 51 (40.2%) |
Occupancy by Age of Householder in Bowmanstown borough
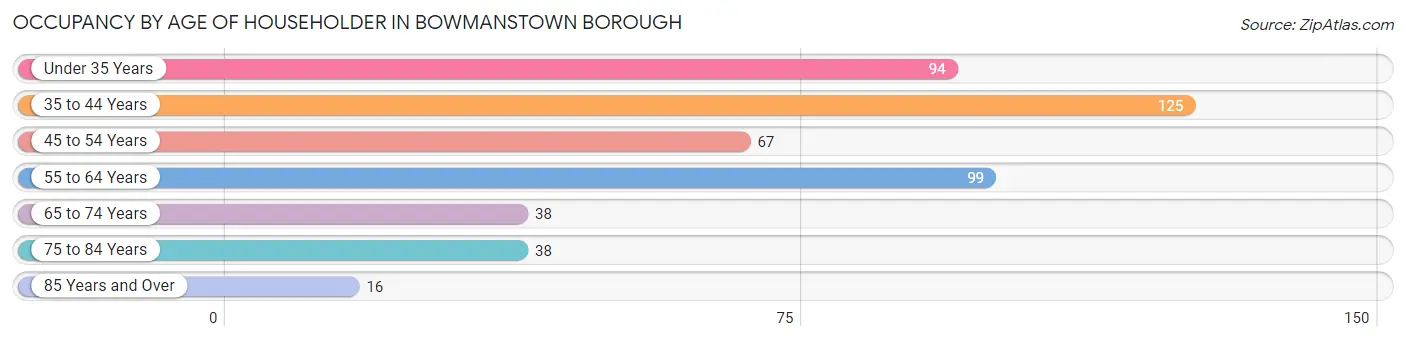
| Age Bracket | # Households | % Households |
| Under 35 Years | 94 | 19.7% |
| 35 to 44 Years | 125 | 26.2% |
| 45 to 54 Years | 67 | 14.1% |
| 55 to 64 Years | 99 | 20.7% |
| 65 to 74 Years | 38 | 8.0% |
| 75 to 84 Years | 38 | 8.0% |
| 85 Years and Over | 16 | 3.4% |
| Total | 477 | 100.0% |
Housing Finances in Bowmanstown borough
Median Income by Occupancy in Bowmanstown borough
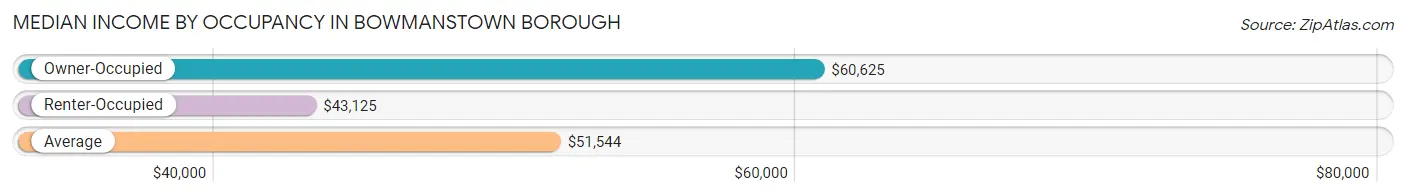
| Occupancy Type | # Households | Median Income |
| Owner-Occupied | 256 (53.7%) | $60,625 |
| Renter-Occupied | 221 (46.3%) | $43,125 |
| Average | 477 (100.0%) | $51,544 |
Occupancy by Householder Income Bracket in Bowmanstown borough
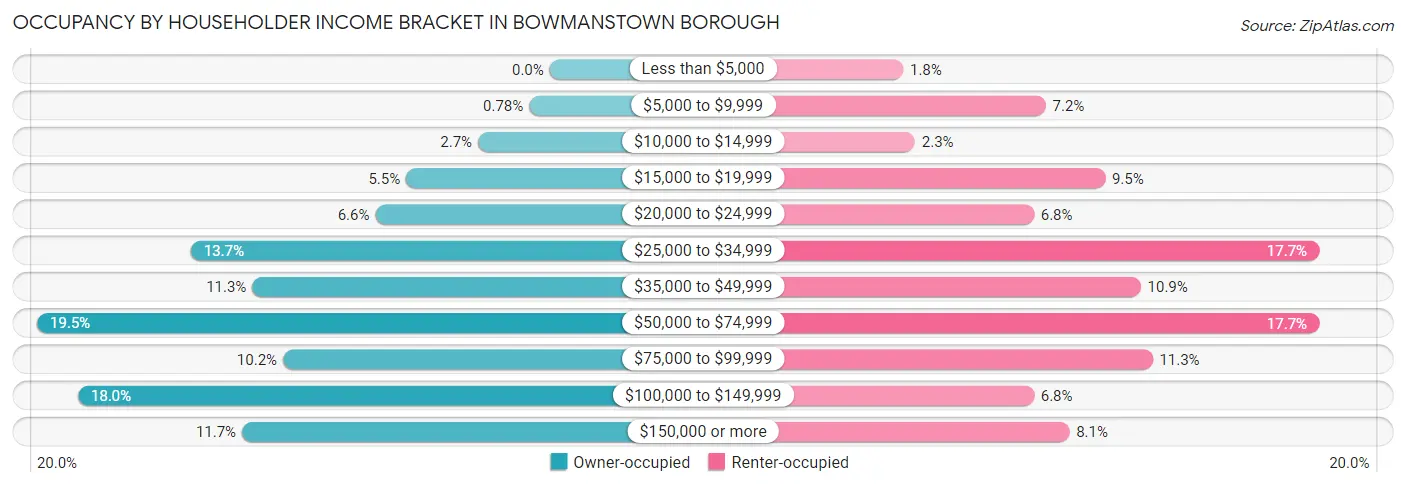
| Income Bracket | Owner-occupied | Renter-occupied |
| Less than $5,000 | 0 (0.0%) | 4 (1.8%) |
| $5,000 to $9,999 | 2 (0.8%) | 16 (7.2%) |
| $10,000 to $14,999 | 7 (2.7%) | 5 (2.3%) |
| $15,000 to $19,999 | 14 (5.5%) | 21 (9.5%) |
| $20,000 to $24,999 | 17 (6.6%) | 15 (6.8%) |
| $25,000 to $34,999 | 35 (13.7%) | 39 (17.6%) |
| $35,000 to $49,999 | 29 (11.3%) | 24 (10.9%) |
| $50,000 to $74,999 | 50 (19.5%) | 39 (17.6%) |
| $75,000 to $99,999 | 26 (10.2%) | 25 (11.3%) |
| $100,000 to $149,999 | 46 (18.0%) | 15 (6.8%) |
| $150,000 or more | 30 (11.7%) | 18 (8.1%) |
| Total | 256 (100.0%) | 221 (100.0%) |
Monthly Housing Cost Tiers in Bowmanstown borough
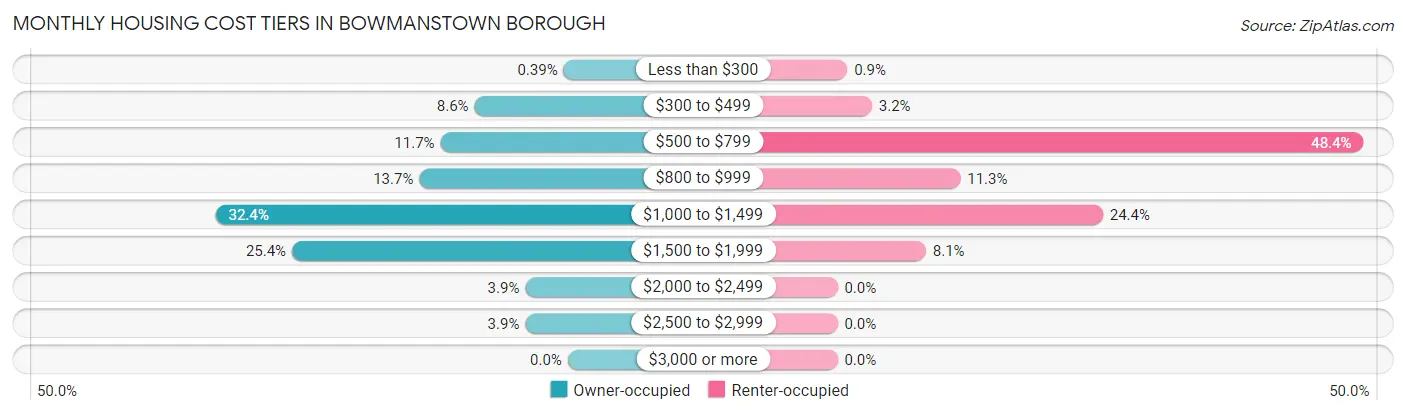
| Monthly Cost | Owner-occupied | Renter-occupied |
| Less than $300 | 1 (0.4%) | 2 (0.9%) |
| $300 to $499 | 22 (8.6%) | 7 (3.2%) |
| $500 to $799 | 30 (11.7%) | 107 (48.4%) |
| $800 to $999 | 35 (13.7%) | 25 (11.3%) |
| $1,000 to $1,499 | 83 (32.4%) | 54 (24.4%) |
| $1,500 to $1,999 | 65 (25.4%) | 18 (8.1%) |
| $2,000 to $2,499 | 10 (3.9%) | 0 (0.0%) |
| $2,500 to $2,999 | 10 (3.9%) | 0 (0.0%) |
| $3,000 or more | 0 (0.0%) | 0 (0.0%) |
| Total | 256 (100.0%) | 221 (100.0%) |
Physical Housing Characteristics in Bowmanstown borough
Housing Structures in Bowmanstown borough
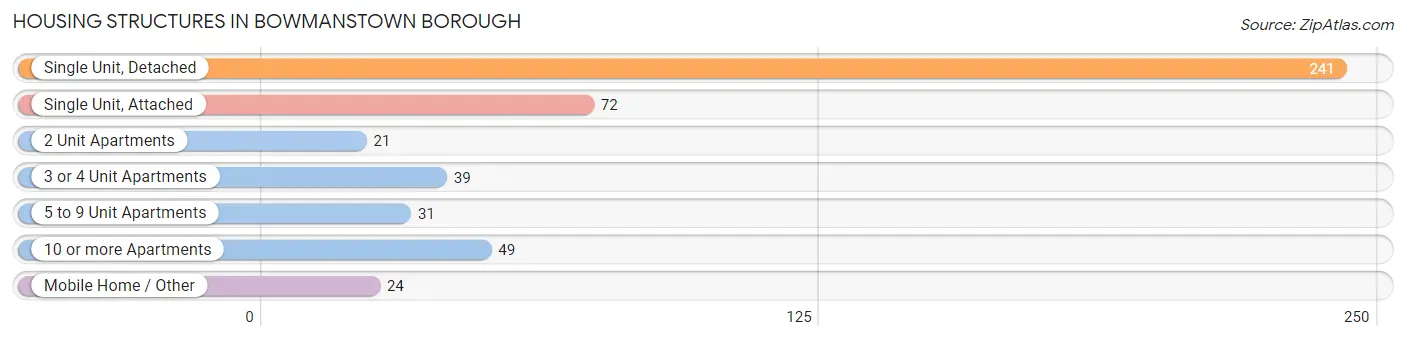
| Structure Type | # Housing Units | % Housing Units |
| Single Unit, Detached | 241 | 50.5% |
| Single Unit, Attached | 72 | 15.1% |
| 2 Unit Apartments | 21 | 4.4% |
| 3 or 4 Unit Apartments | 39 | 8.2% |
| 5 to 9 Unit Apartments | 31 | 6.5% |
| 10 or more Apartments | 49 | 10.3% |
| Mobile Home / Other | 24 | 5.0% |
| Total | 477 | 100.0% |
Housing Structures by Occupancy in Bowmanstown borough
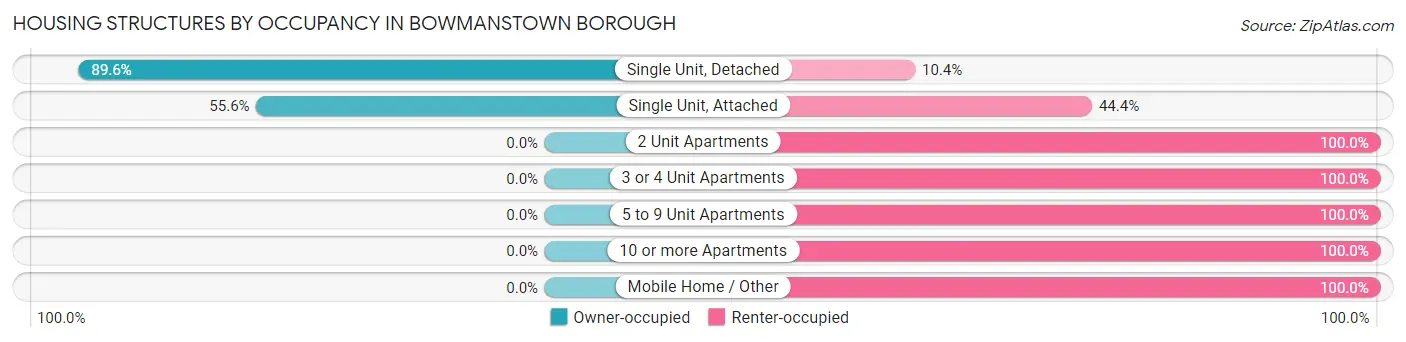
| Structure Type | Owner-occupied | Renter-occupied |
| Single Unit, Detached | 216 (89.6%) | 25 (10.4%) |
| Single Unit, Attached | 40 (55.6%) | 32 (44.4%) |
| 2 Unit Apartments | 0 (0.0%) | 21 (100.0%) |
| 3 or 4 Unit Apartments | 0 (0.0%) | 39 (100.0%) |
| 5 to 9 Unit Apartments | 0 (0.0%) | 31 (100.0%) |
| 10 or more Apartments | 0 (0.0%) | 49 (100.0%) |
| Mobile Home / Other | 0 (0.0%) | 24 (100.0%) |
| Total | 256 (53.7%) | 221 (46.3%) |
Housing Structures by Number of Rooms in Bowmanstown borough
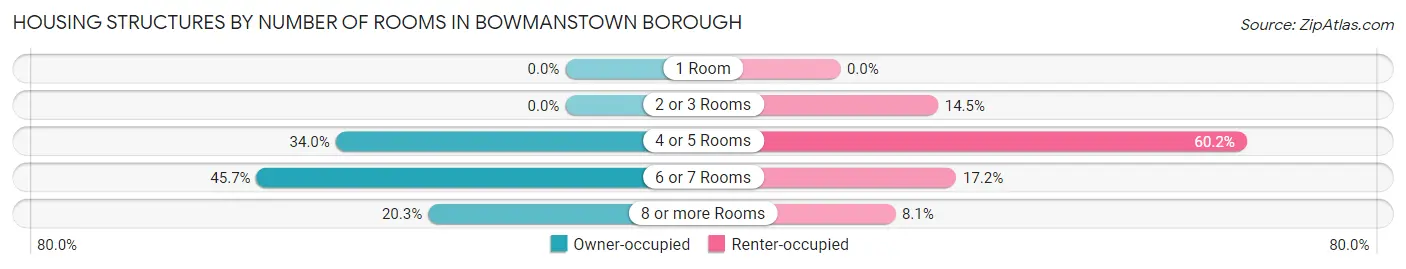
| Number of Rooms | Owner-occupied | Renter-occupied |
| 1 Room | 0 (0.0%) | 0 (0.0%) |
| 2 or 3 Rooms | 0 (0.0%) | 32 (14.5%) |
| 4 or 5 Rooms | 87 (34.0%) | 133 (60.2%) |
| 6 or 7 Rooms | 117 (45.7%) | 38 (17.2%) |
| 8 or more Rooms | 52 (20.3%) | 18 (8.1%) |
| Total | 256 (100.0%) | 221 (100.0%) |
Housing Structure by Heating Type in Bowmanstown borough
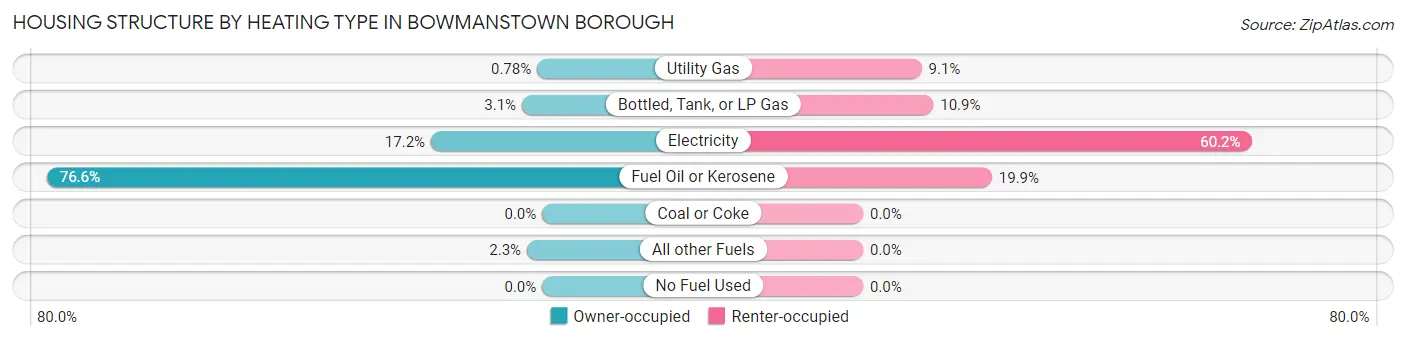
| Heating Type | Owner-occupied | Renter-occupied |
| Utility Gas | 2 (0.8%) | 20 (9.0%) |
| Bottled, Tank, or LP Gas | 8 (3.1%) | 24 (10.9%) |
| Electricity | 44 (17.2%) | 133 (60.2%) |
| Fuel Oil or Kerosene | 196 (76.6%) | 44 (19.9%) |
| Coal or Coke | 0 (0.0%) | 0 (0.0%) |
| All other Fuels | 6 (2.3%) | 0 (0.0%) |
| No Fuel Used | 0 (0.0%) | 0 (0.0%) |
| Total | 256 (100.0%) | 221 (100.0%) |
Household Vehicle Usage in Bowmanstown borough
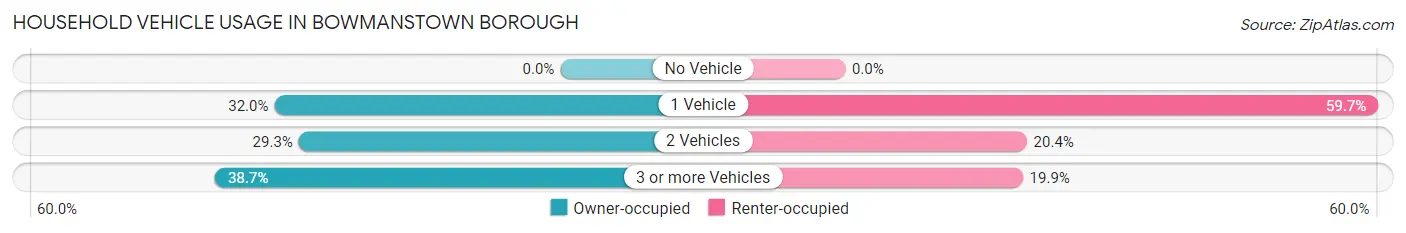
| Vehicles per Household | Owner-occupied | Renter-occupied |
| No Vehicle | 0 (0.0%) | 0 (0.0%) |
| 1 Vehicle | 82 (32.0%) | 132 (59.7%) |
| 2 Vehicles | 75 (29.3%) | 45 (20.4%) |
| 3 or more Vehicles | 99 (38.7%) | 44 (19.9%) |
| Total | 256 (100.0%) | 221 (100.0%) |
Real Estate & Mortgages in Bowmanstown borough
Real Estate and Mortgage Overview in Bowmanstown borough
| Characteristic | Without Mortgage | With Mortgage |
| Housing Units | 59 | 197 |
| Median Property Value | $137,500 | $163,200 |
| Median Household Income | $55,750 | $28 |
| Monthly Housing Costs | $623 | $0 |
| Real Estate Taxes | $3,104 | $4 |
Property Value by Mortgage Status in Bowmanstown borough
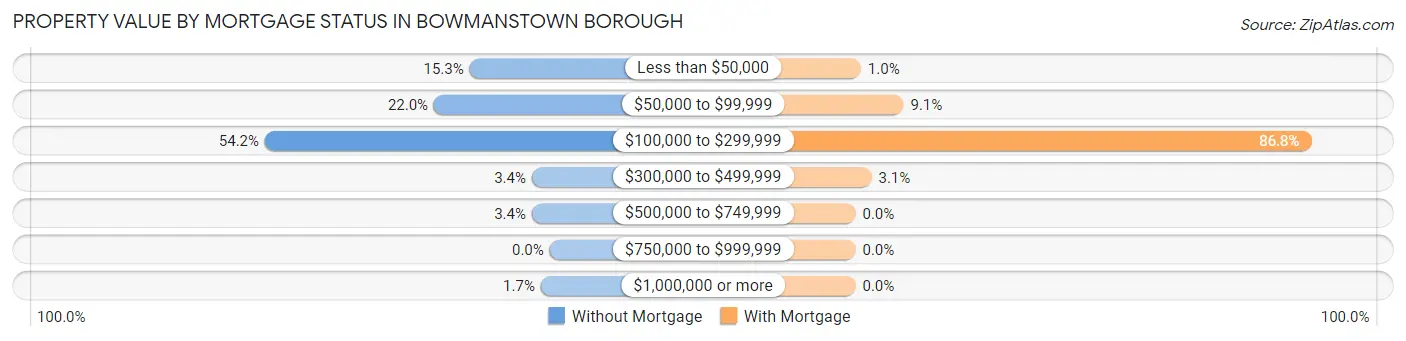
| Property Value | Without Mortgage | With Mortgage |
| Less than $50,000 | 9 (15.2%) | 2 (1.0%) |
| $50,000 to $99,999 | 13 (22.0%) | 18 (9.1%) |
| $100,000 to $299,999 | 32 (54.2%) | 171 (86.8%) |
| $300,000 to $499,999 | 2 (3.4%) | 6 (3.0%) |
| $500,000 to $749,999 | 2 (3.4%) | 0 (0.0%) |
| $750,000 to $999,999 | 0 (0.0%) | 0 (0.0%) |
| $1,000,000 or more | 1 (1.7%) | 0 (0.0%) |
| Total | 59 (100.0%) | 197 (100.0%) |
Household Income by Mortgage Status in Bowmanstown borough
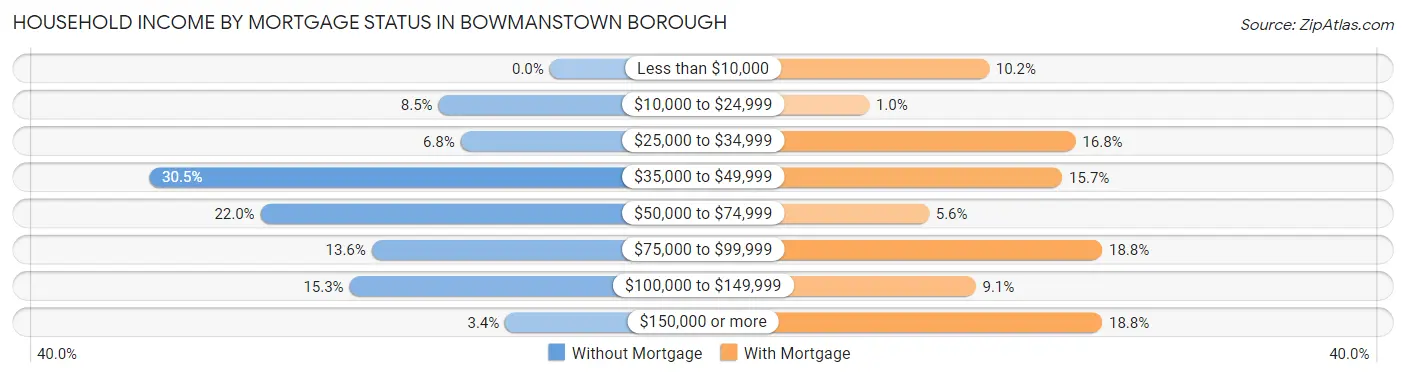
| Household Income | Without Mortgage | With Mortgage |
| Less than $10,000 | 0 (0.0%) | 20 (10.2%) |
| $10,000 to $24,999 | 5 (8.5%) | 2 (1.0%) |
| $25,000 to $34,999 | 4 (6.8%) | 33 (16.8%) |
| $35,000 to $49,999 | 18 (30.5%) | 31 (15.7%) |
| $50,000 to $74,999 | 13 (22.0%) | 11 (5.6%) |
| $75,000 to $99,999 | 8 (13.6%) | 37 (18.8%) |
| $100,000 to $149,999 | 9 (15.2%) | 18 (9.1%) |
| $150,000 or more | 2 (3.4%) | 37 (18.8%) |
| Total | 59 (100.0%) | 197 (100.0%) |
Property Value to Household Income Ratio in Bowmanstown borough
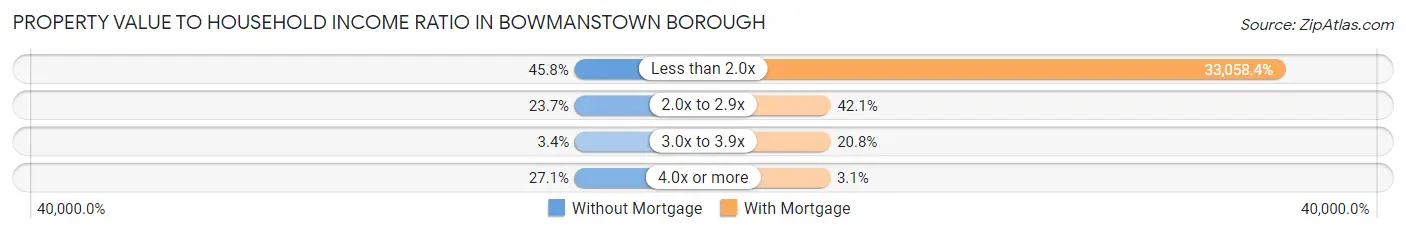
| Value-to-Income Ratio | Without Mortgage | With Mortgage |
| Less than 2.0x | 27 (45.8%) | 65,125 (33,058.4%) |
| 2.0x to 2.9x | 14 (23.7%) | 83 (42.1%) |
| 3.0x to 3.9x | 2 (3.4%) | 41 (20.8%) |
| 4.0x or more | 16 (27.1%) | 6 (3.0%) |
| Total | 59 (100.0%) | 197 (100.0%) |
Real Estate Taxes by Mortgage Status in Bowmanstown borough
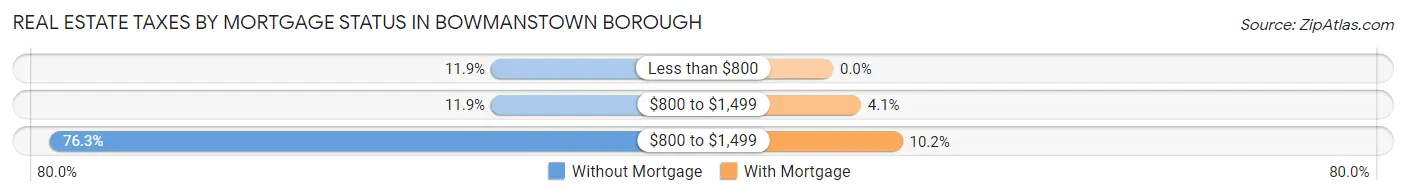
| Property Taxes | Without Mortgage | With Mortgage |
| Less than $800 | 7 (11.9%) | 0 (0.0%) |
| $800 to $1,499 | 7 (11.9%) | 8 (4.1%) |
| $800 to $1,499 | 45 (76.3%) | 20 (10.2%) |
| Total | 59 (100.0%) | 197 (100.0%) |
Health & Disability in Bowmanstown borough
Health Insurance Coverage by Age in Bowmanstown borough
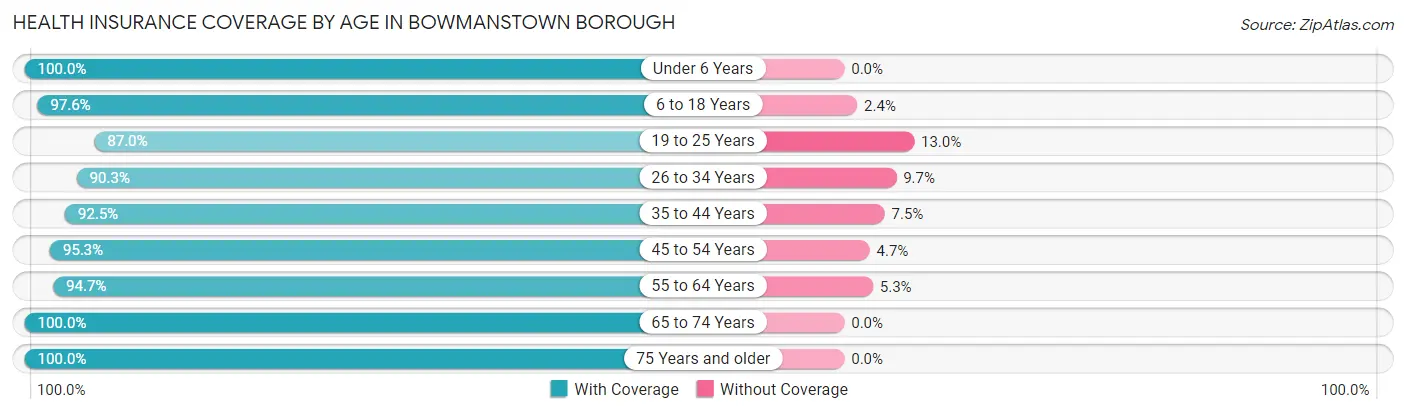
| Age Bracket | With Coverage | Without Coverage |
| Under 6 Years | 54 (100.0%) | 0 (0.0%) |
| 6 to 18 Years | 122 (97.6%) | 3 (2.4%) |
| 19 to 25 Years | 107 (87.0%) | 16 (13.0%) |
| 26 to 34 Years | 196 (90.3%) | 21 (9.7%) |
| 35 to 44 Years | 209 (92.5%) | 17 (7.5%) |
| 45 to 54 Years | 101 (95.3%) | 5 (4.7%) |
| 55 to 64 Years | 142 (94.7%) | 8 (5.3%) |
| 65 to 74 Years | 76 (100.0%) | 0 (0.0%) |
| 75 Years and older | 63 (100.0%) | 0 (0.0%) |
| Total | 1,070 (93.9%) | 70 (6.1%) |
Health Insurance Coverage by Citizenship Status in Bowmanstown borough
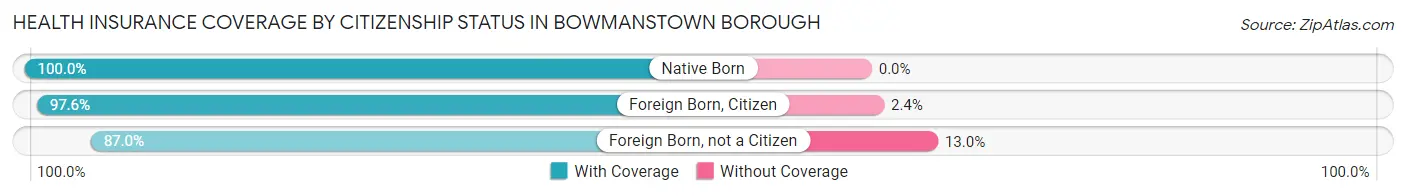
| Citizenship Status | With Coverage | Without Coverage |
| Native Born | 54 (100.0%) | 0 (0.0%) |
| Foreign Born, Citizen | 122 (97.6%) | 3 (2.4%) |
| Foreign Born, not a Citizen | 107 (87.0%) | 16 (13.0%) |
Health Insurance Coverage by Household Income in Bowmanstown borough
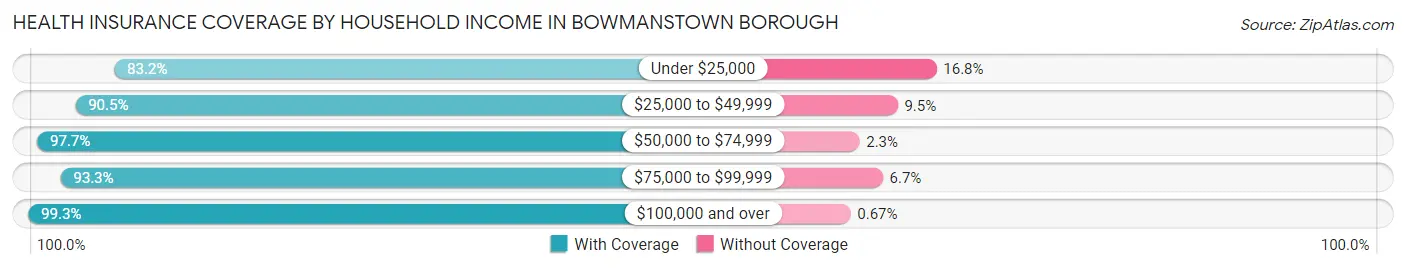
| Household Income | With Coverage | Without Coverage |
| Under $25,000 | 119 (83.2%) | 24 (16.8%) |
| $25,000 to $49,999 | 267 (90.5%) | 28 (9.5%) |
| $50,000 to $74,999 | 250 (97.7%) | 6 (2.3%) |
| $75,000 to $99,999 | 139 (93.3%) | 10 (6.7%) |
| $100,000 and over | 295 (99.3%) | 2 (0.7%) |
Public vs Private Health Insurance Coverage by Age in Bowmanstown borough
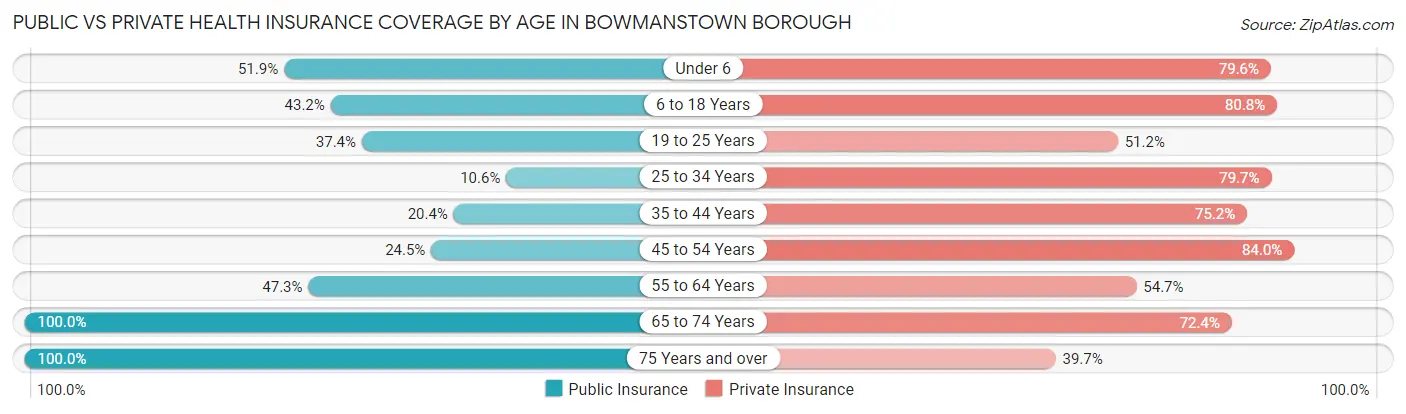
| Age Bracket | Public Insurance | Private Insurance |
| Under 6 | 28 (51.8%) | 43 (79.6%) |
| 6 to 18 Years | 54 (43.2%) | 101 (80.8%) |
| 19 to 25 Years | 46 (37.4%) | 63 (51.2%) |
| 25 to 34 Years | 23 (10.6%) | 173 (79.7%) |
| 35 to 44 Years | 46 (20.3%) | 170 (75.2%) |
| 45 to 54 Years | 26 (24.5%) | 89 (84.0%) |
| 55 to 64 Years | 71 (47.3%) | 82 (54.7%) |
| 65 to 74 Years | 76 (100.0%) | 55 (72.4%) |
| 75 Years and over | 63 (100.0%) | 25 (39.7%) |
| Total | 433 (38.0%) | 801 (70.3%) |
Disability Status by Sex by Age in Bowmanstown borough
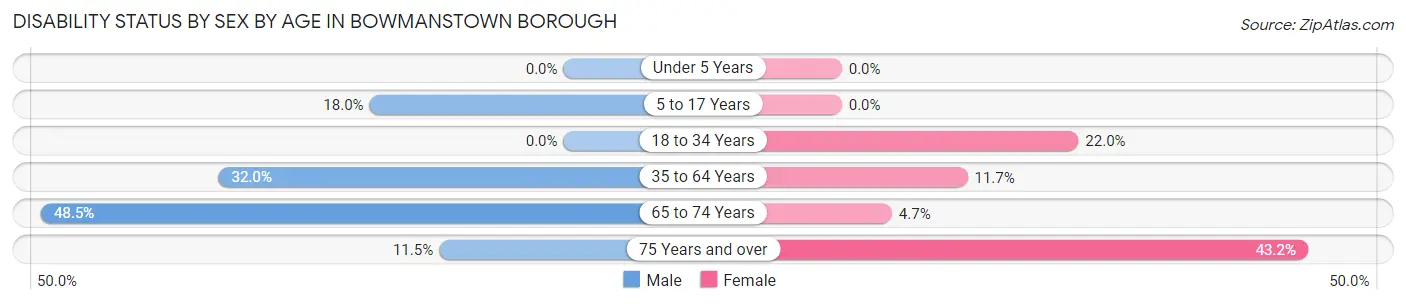
| Age Bracket | Male | Female |
| Under 5 Years | 0 (0.0%) | 0 (0.0%) |
| 5 to 17 Years | 9 (18.0%) | 0 (0.0%) |
| 18 to 34 Years | 0 (0.0%) | 47 (22.0%) |
| 35 to 64 Years | 72 (32.0%) | 30 (11.7%) |
| 65 to 74 Years | 16 (48.5%) | 2 (4.6%) |
| 75 Years and over | 3 (11.5%) | 16 (43.2%) |
Disability Class by Sex by Age in Bowmanstown borough
Disability Class: Hearing Difficulty
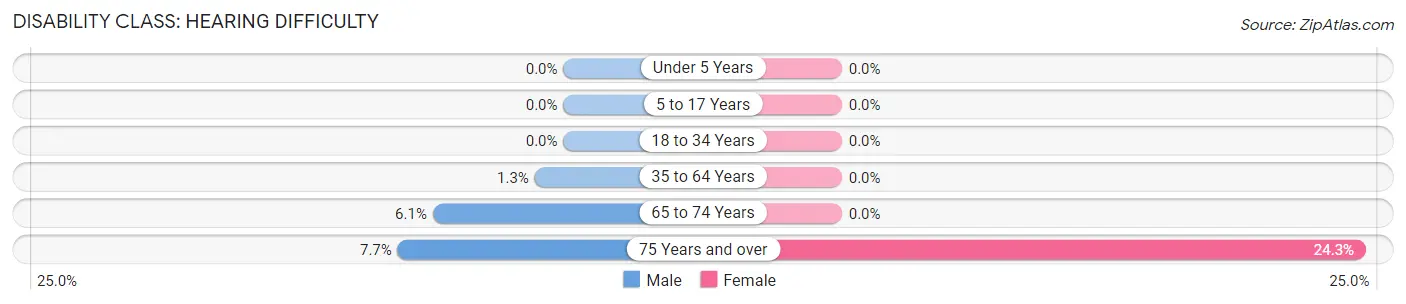
| Age Bracket | Male | Female |
| Under 5 Years | 0 (0.0%) | 0 (0.0%) |
| 5 to 17 Years | 0 (0.0%) | 0 (0.0%) |
| 18 to 34 Years | 0 (0.0%) | 0 (0.0%) |
| 35 to 64 Years | 3 (1.3%) | 0 (0.0%) |
| 65 to 74 Years | 2 (6.1%) | 0 (0.0%) |
| 75 Years and over | 2 (7.7%) | 9 (24.3%) |
Disability Class: Vision Difficulty
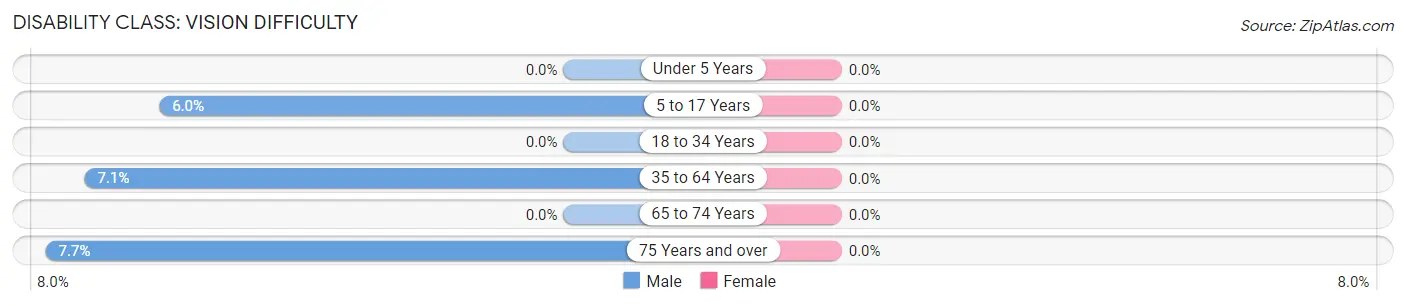
| Age Bracket | Male | Female |
| Under 5 Years | 0 (0.0%) | 0 (0.0%) |
| 5 to 17 Years | 3 (6.0%) | 0 (0.0%) |
| 18 to 34 Years | 0 (0.0%) | 0 (0.0%) |
| 35 to 64 Years | 16 (7.1%) | 0 (0.0%) |
| 65 to 74 Years | 0 (0.0%) | 0 (0.0%) |
| 75 Years and over | 2 (7.7%) | 0 (0.0%) |
Disability Class: Cognitive Difficulty
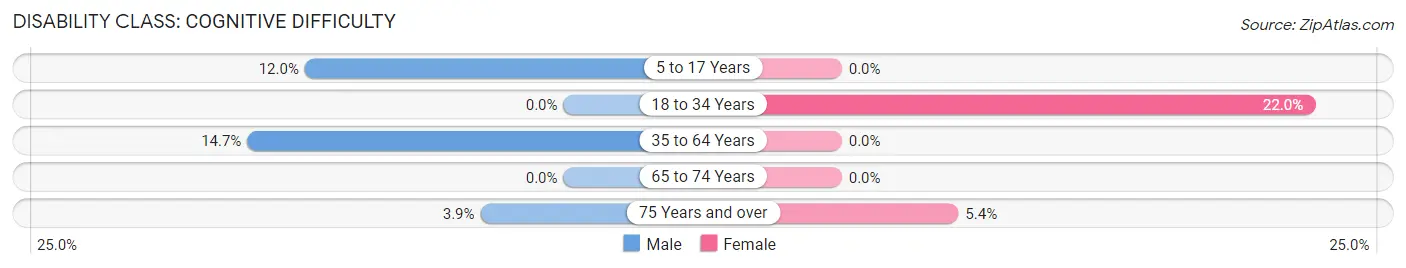
| Age Bracket | Male | Female |
| 5 to 17 Years | 6 (12.0%) | 0 (0.0%) |
| 18 to 34 Years | 0 (0.0%) | 47 (22.0%) |
| 35 to 64 Years | 33 (14.7%) | 0 (0.0%) |
| 65 to 74 Years | 0 (0.0%) | 0 (0.0%) |
| 75 Years and over | 1 (3.8%) | 2 (5.4%) |
Disability Class: Ambulatory Difficulty
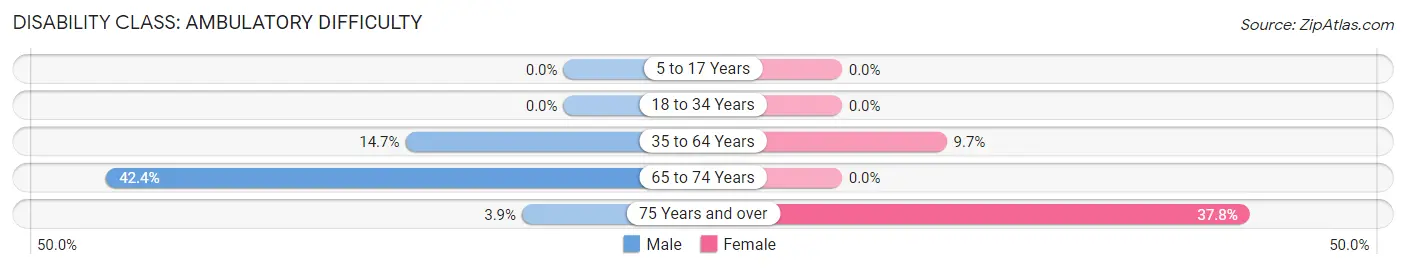
| Age Bracket | Male | Female |
| 5 to 17 Years | 0 (0.0%) | 0 (0.0%) |
| 18 to 34 Years | 0 (0.0%) | 0 (0.0%) |
| 35 to 64 Years | 33 (14.7%) | 25 (9.7%) |
| 65 to 74 Years | 14 (42.4%) | 0 (0.0%) |
| 75 Years and over | 1 (3.8%) | 14 (37.8%) |
Disability Class: Self-Care Difficulty
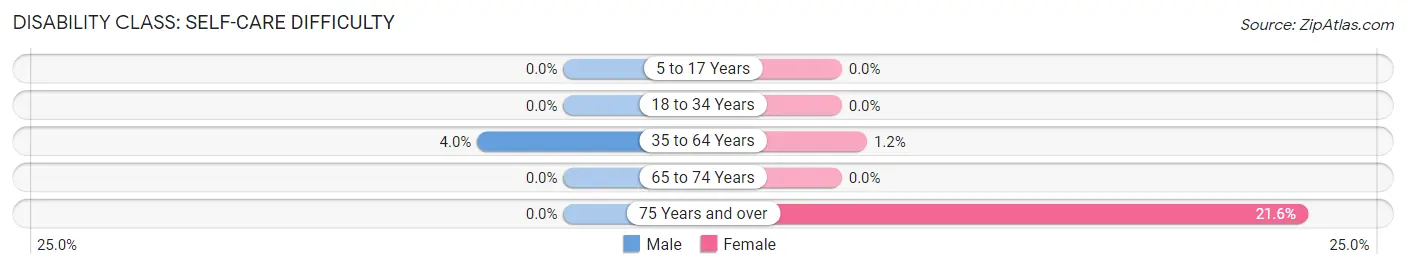
| Age Bracket | Male | Female |
| 5 to 17 Years | 0 (0.0%) | 0 (0.0%) |
| 18 to 34 Years | 0 (0.0%) | 0 (0.0%) |
| 35 to 64 Years | 9 (4.0%) | 3 (1.2%) |
| 65 to 74 Years | 0 (0.0%) | 0 (0.0%) |
| 75 Years and over | 0 (0.0%) | 8 (21.6%) |
Technology Access in Bowmanstown borough
Computing Device Access in Bowmanstown borough
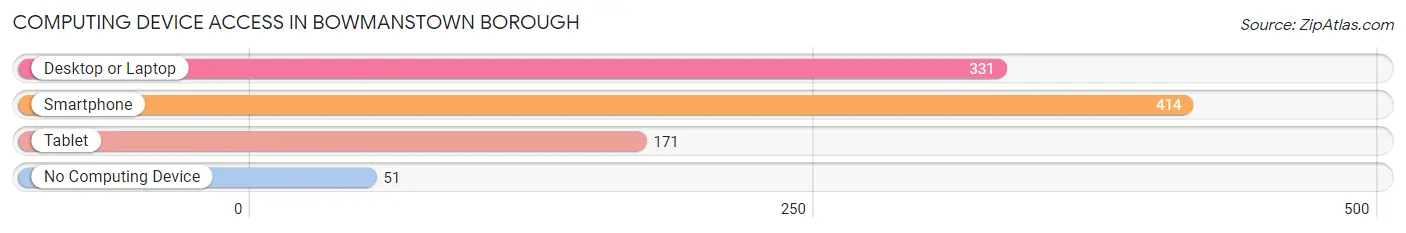
| Device Type | # Households | % Households |
| Desktop or Laptop | 331 | 69.4% |
| Smartphone | 414 | 86.8% |
| Tablet | 171 | 35.8% |
| No Computing Device | 51 | 10.7% |
| Total | 477 | 100.0% |
Internet Access in Bowmanstown borough
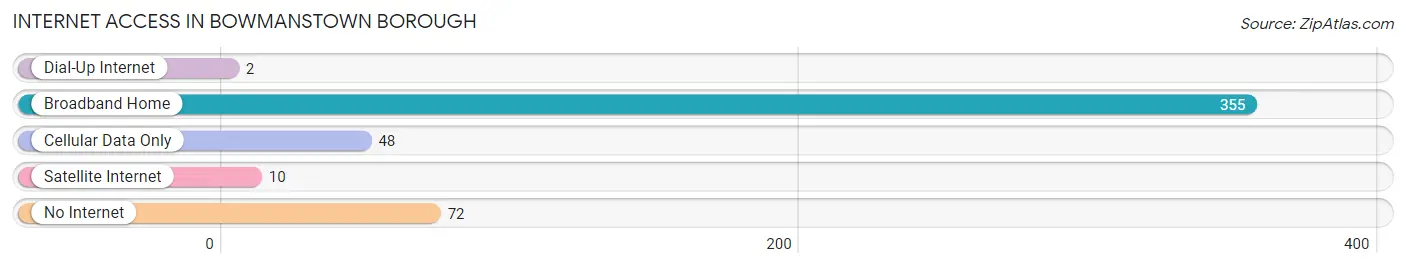
| Internet Type | # Households | % Households |
| Dial-Up Internet | 2 | 0.4% |
| Broadband Home | 355 | 74.4% |
| Cellular Data Only | 48 | 10.1% |
| Satellite Internet | 10 | 2.1% |
| No Internet | 72 | 15.1% |
| Total | 477 | 100.0% |
Bowmanstown borough Summary
Bowmanstown Borough is a small borough located in Carbon County, Pennsylvania. It is situated in the Lehigh Valley region of the state, and is part of the Allentown-Bethlehem-Easton metropolitan area. The borough has a population of 1,093 as of the 2010 census, and covers an area of 0.3 square miles.
History
The area that is now Bowmanstown Borough was first settled in the late 1700s by German immigrants. The borough was officially incorporated in 1876, and was named after the Bowman family, who were among the first settlers in the area. The borough was originally a farming community, and the main industry was the production of charcoal. In the late 1800s, the borough began to develop into a small industrial center, with several factories and mills being built in the area.
Geography
Bowmanstown Borough is located in Carbon County, Pennsylvania, in the Lehigh Valley region of the state. It is situated in the western part of the county, and is bordered by East Penn Township to the north, Palmerton Borough to the east, and Lower Towamensing Township to the south and west. The borough covers an area of 0.3 square miles, and has a total population of 1,093 as of the 2010 census.
The borough is located in the Appalachian Mountains, and is surrounded by rolling hills and forests. The Lehigh River runs through the borough, and there are several small creeks and streams in the area. The borough is located in the humid continental climate zone, and has warm summers and cold winters.
Economy
The economy of Bowmanstown Borough is largely based on tourism and manufacturing. The borough is home to several small businesses, including restaurants, shops, and other services. The borough is also home to several manufacturing companies, including a paper mill and a metal fabrication plant. The borough is also home to several tourist attractions, including the Bowmanstown Covered Bridge and the Bowmanstown Historic District.
Demographics
As of the 2010 census, the population of Bowmanstown Borough was 1,093. The racial makeup of the borough was 97.2% White, 0.7% African American, 0.4% Native American, 0.2% Asian, 0.1% Pacific Islander, 0.7% from other races, and 0.7% from two or more races. Hispanic or Latino of any race were 1.7% of the population.
The median household income in the borough was $41,250, and the median family income was $48,750. The per capita income was $20,945. About 11.2% of the population was below the poverty line. The largest employers in the borough were the paper mill, the metal fabrication plant, and the local government.
Common Questions
What is Per Capita Income in Bowmanstown borough?
Per Capita income in Bowmanstown borough is $32,091.
What is the Median Family Income in Bowmanstown borough?
Median Family Income in Bowmanstown borough is $56,818.
What is the Median Household income in Bowmanstown borough?
Median Household Income in Bowmanstown borough is $51,544.
What is Income or Wage Gap in Bowmanstown borough?
Income or Wage Gap in Bowmanstown borough is 0.6%.
Women in Bowmanstown borough earn 99.4 cents for every dollar earned by a man.
What is Inequality or Gini Index in Bowmanstown borough?
Inequality or Gini Index in Bowmanstown borough is 0.43.
What is the Total Population of Bowmanstown borough?
Total Population of Bowmanstown borough is 1,140.
What is the Total Male Population of Bowmanstown borough?
Total Male Population of Bowmanstown borough is 476.
What is the Total Female Population of Bowmanstown borough?
Total Female Population of Bowmanstown borough is 664.
What is the Ratio of Males per 100 Females in Bowmanstown borough?
There are 71.69 Males per 100 Females in Bowmanstown borough.
What is the Ratio of Females per 100 Males in Bowmanstown borough?
There are 139.50 Females per 100 Males in Bowmanstown borough.
What is the Median Population Age in Bowmanstown borough?
Median Population Age in Bowmanstown borough is 37.9 Years.
What is the Average Family Size in Bowmanstown borough
Average Family Size in Bowmanstown borough is 3.3 People.
What is the Average Household Size in Bowmanstown borough
Average Household Size in Bowmanstown borough is 2.4 People.
How Large is the Labor Force in Bowmanstown borough?
There are 701 People in the Labor Forcein in Bowmanstown borough.
What is the Percentage of People in the Labor Force in Bowmanstown borough?
70.2% of People are in the Labor Force in Bowmanstown borough.
What is the Unemployment Rate in Bowmanstown borough?
Unemployment Rate in Bowmanstown borough is 16.1%.