Downingtown borough, PA Map & Demographics
Downingtown borough Overview
$41,247
PER CAPITA INCOME
$89,072
AVG FAMILY INCOME
$74,323
AVG HOUSEHOLD INCOME
8.4%
WAGE / INCOME GAP [ % ]
91.6¢/ $1
WAGE / INCOME GAP [ $ ]
$8,579
FAMILY INCOME DEFICIT
0.37
INEQUALITY / GINI INDEX
8,088
TOTAL POPULATION
3,772
MALE POPULATION
4,316
FEMALE POPULATION
87.40
MALES / 100 FEMALES
114.42
FEMALES / 100 MALES
38.9
MEDIAN AGE
2.9
AVG FAMILY SIZE
2.3
AVG HOUSEHOLD SIZE
5,144
LABOR FORCE [ PEOPLE ]
75.7%
PERCENT IN LABOR FORCE
4.1%
UNEMPLOYMENT RATE
Income in Downingtown borough
Income Overview in Downingtown borough
Per Capita Income in Downingtown borough is $41,247, while median incomes of families and households are $89,072 and $74,323 respectively.
| Characteristic | Number | Measure |
| Per Capita Income | 8,088 | $41,247 |
| Median Family Income | 2,220 | $89,072 |
| Mean Family Income | 2,220 | $104,314 |
| Median Household Income | 3,393 | $74,323 |
| Mean Household Income | 3,393 | $94,059 |
| Income Deficit | 2,220 | $8,579 |
| Wage / Income Gap (%) | 8,088 | 8.38% |
| Wage / Income Gap ($) | 8,088 | 91.62¢ per $1 |
| Gini / Inequality Index | 8,088 | 0.37 |
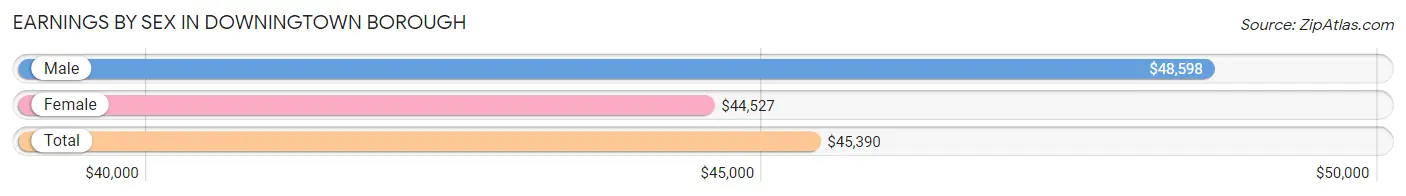
Earnings by Sex in Downingtown borough
Average Earnings in Downingtown borough are $45,390, $48,598 for men and $44,527 for women, a difference of 8.4%.
| Sex | Number | Average Earnings |
| Male | 2,525 (47.2%) | $48,598 |
| Female | 2,820 (52.8%) | $44,527 |
| Total | 5,345 (100.0%) | $45,390 |
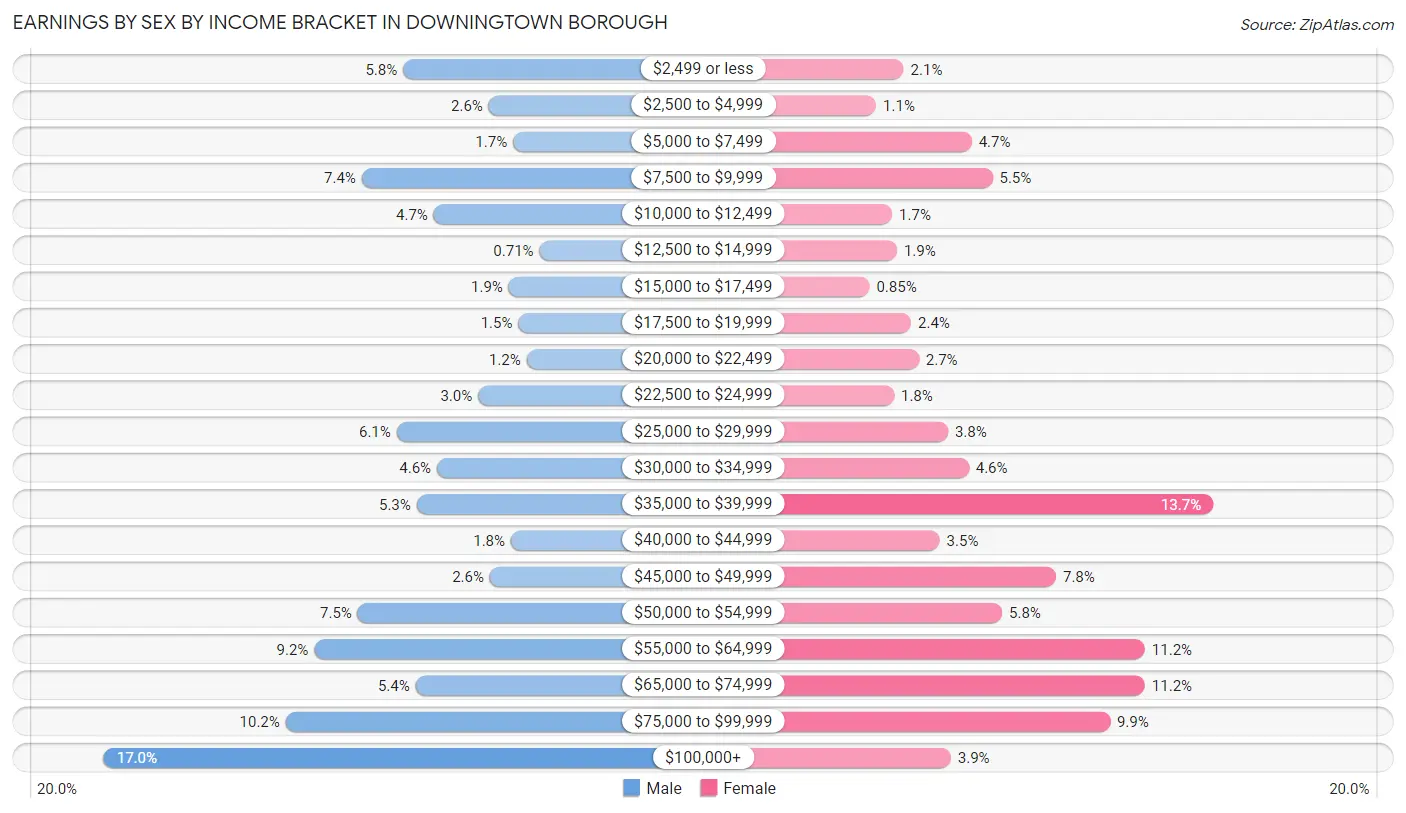
Earnings by Sex by Income Bracket in Downingtown borough
The most common earnings brackets in Downingtown borough are $100,000+ for men (430 | 17.0%) and $35,000 to $39,999 for women (387 | 13.7%).
| Income | Male | Female |
| $2,499 or less | 147 (5.8%) | 60 (2.1%) |
| $2,500 to $4,999 | 66 (2.6%) | 31 (1.1%) |
| $5,000 to $7,499 | 43 (1.7%) | 132 (4.7%) |
| $7,500 to $9,999 | 186 (7.4%) | 154 (5.5%) |
| $10,000 to $12,499 | 118 (4.7%) | 48 (1.7%) |
| $12,500 to $14,999 | 18 (0.7%) | 53 (1.9%) |
| $15,000 to $17,499 | 47 (1.9%) | 24 (0.9%) |
| $17,500 to $19,999 | 38 (1.5%) | 68 (2.4%) |
| $20,000 to $22,499 | 30 (1.2%) | 76 (2.7%) |
| $22,500 to $24,999 | 76 (3.0%) | 50 (1.8%) |
| $25,000 to $29,999 | 153 (6.1%) | 107 (3.8%) |
| $30,000 to $34,999 | 115 (4.5%) | 129 (4.6%) |
| $35,000 to $39,999 | 134 (5.3%) | 387 (13.7%) |
| $40,000 to $44,999 | 45 (1.8%) | 98 (3.5%) |
| $45,000 to $49,999 | 65 (2.6%) | 221 (7.8%) |
| $50,000 to $54,999 | 190 (7.5%) | 164 (5.8%) |
| $55,000 to $64,999 | 231 (9.1%) | 315 (11.2%) |
| $65,000 to $74,999 | 135 (5.3%) | 315 (11.2%) |
| $75,000 to $99,999 | 258 (10.2%) | 278 (9.9%) |
| $100,000+ | 430 (17.0%) | 110 (3.9%) |
| Total | 2,525 (100.0%) | 2,820 (100.0%) |
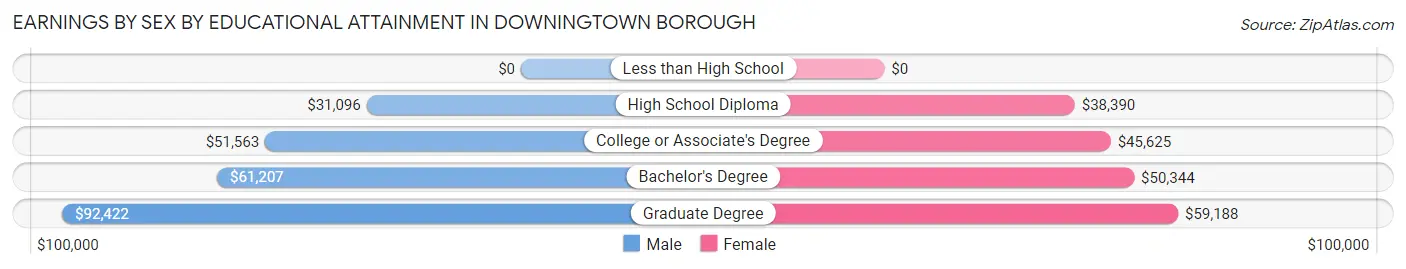
Earnings by Sex by Educational Attainment in Downingtown borough
Average earnings in Downingtown borough are $52,378 for men and $46,256 for women, a difference of 11.7%. Men with an educational attainment of graduate degree enjoy the highest average annual earnings of $92,422, while those with high school diploma education earn the least with $31,096. Women with an educational attainment of graduate degree earn the most with the average annual earnings of $59,188, while those with high school diploma education have the smallest earnings of $38,390.
| Educational Attainment | Male Income | Female Income |
| Less than High School | - | - |
| High School Diploma | $31,096 | $38,390 |
| College or Associate's Degree | $51,563 | $45,625 |
| Bachelor's Degree | $61,207 | $50,344 |
| Graduate Degree | $92,422 | $59,188 |
| Total | $52,378 | $46,256 |
Family Income in Downingtown borough
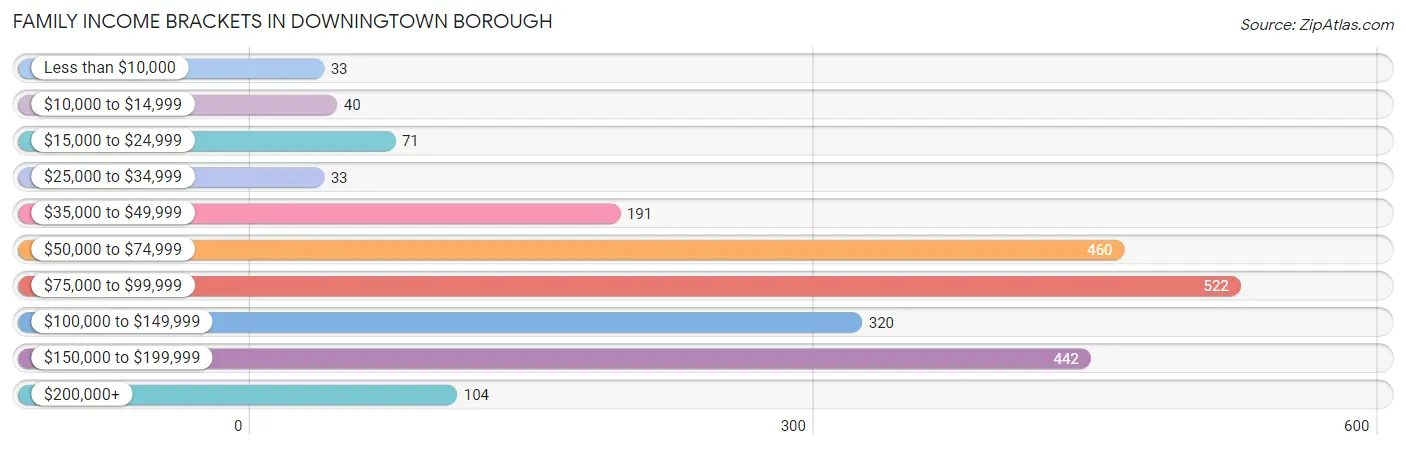
Family Income Brackets in Downingtown borough
According to the Downingtown borough family income data, there are 522 families falling into the $75,000 to $99,999 income range, which is the most common income bracket and makes up 23.5% of all families. Conversely, the less than $10,000 income bracket is the least frequent group with only 33 families (1.5%) belonging to this category.
| Income Bracket | # Families | % Families |
| Less than $10,000 | 33 | 1.5% |
| $10,000 to $14,999 | 40 | 1.8% |
| $15,000 to $24,999 | 71 | 3.2% |
| $25,000 to $34,999 | 33 | 1.5% |
| $35,000 to $49,999 | 191 | 8.6% |
| $50,000 to $74,999 | 460 | 20.7% |
| $75,000 to $99,999 | 522 | 23.5% |
| $100,000 to $149,999 | 320 | 14.4% |
| $150,000 to $199,999 | 442 | 19.9% |
| $200,000+ | 104 | 4.7% |
Family Income by Famaliy Size in Downingtown borough
6-person families (29 | 1.3%) account for the highest median family income in Downingtown borough with $159,141 per family, while 2-person families (1,201 | 54.1%) have the highest median income of $40,762 per family member.
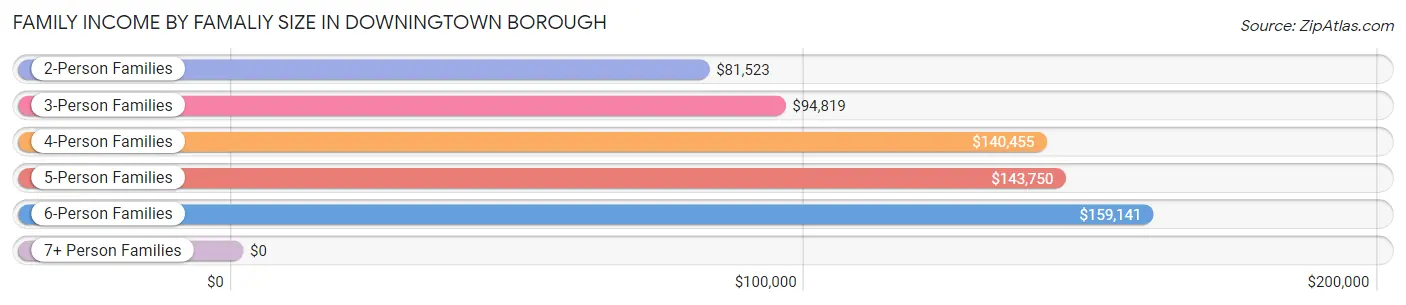
| Income Bracket | # Families | Median Income |
| 2-Person Families | 1,201 (54.1%) | $81,523 |
| 3-Person Families | 446 (20.1%) | $94,819 |
| 4-Person Families | 418 (18.8%) | $140,455 |
| 5-Person Families | 110 (5.0%) | $143,750 |
| 6-Person Families | 29 (1.3%) | $159,141 |
| 7+ Person Families | 16 (0.7%) | $0 |
| Total | 2,220 (100.0%) | $89,072 |
Family Income by Number of Earners in Downingtown borough
The median family income in Downingtown borough is $89,072, with families comprising 3+ earners (213) having the highest median family income of $151,583, while families with 1 earner (504) have the lowest median family income of $59,583, accounting for 9.6% and 22.7% of families, respectively.
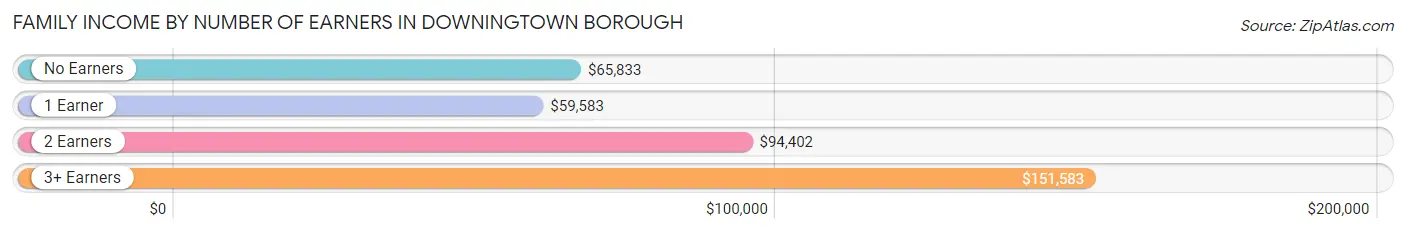
| Number of Earners | # Families | Median Income |
| No Earners | 136 (6.1%) | $65,833 |
| 1 Earner | 504 (22.7%) | $59,583 |
| 2 Earners | 1,367 (61.6%) | $94,402 |
| 3+ Earners | 213 (9.6%) | $151,583 |
| Total | 2,220 (100.0%) | $89,072 |
Household Income in Downingtown borough
Household Income Brackets in Downingtown borough
With 875 households falling in the category, the $50,000 to $74,999 income range is the most frequent in Downingtown borough, accounting for 25.8% of all households. In contrast, only 51 households (1.5%) fall into the $10,000 to $14,999 income bracket, making it the least populous group.
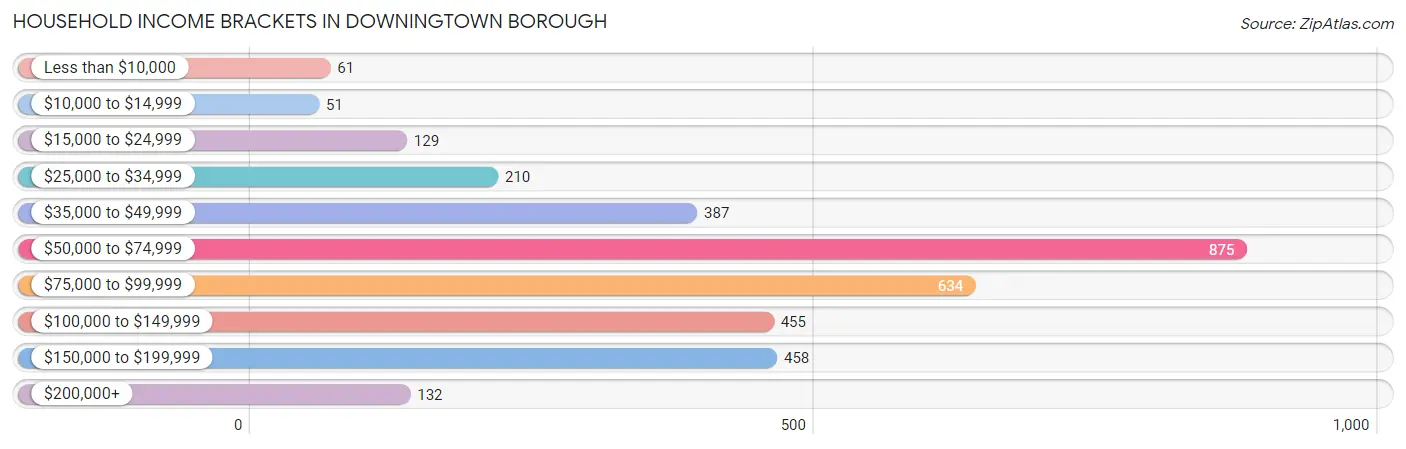
| Income Bracket | # Households | % Households |
| Less than $10,000 | 61 | 1.8% |
| $10,000 to $14,999 | 51 | 1.5% |
| $15,000 to $24,999 | 129 | 3.8% |
| $25,000 to $34,999 | 210 | 6.2% |
| $35,000 to $49,999 | 387 | 11.4% |
| $50,000 to $74,999 | 875 | 25.8% |
| $75,000 to $99,999 | 634 | 18.7% |
| $100,000 to $149,999 | 455 | 13.4% |
| $150,000 to $199,999 | 458 | 13.5% |
| $200,000+ | 132 | 3.9% |
Household Income by Householder Age in Downingtown borough
The median household income in Downingtown borough is $74,323, with the highest median household income of $88,156 found in the 45 to 64 years age bracket for the primary householder. A total of 1,514 households (44.6%) fall into this category. Meanwhile, the 15 to 24 years age bracket for the primary householder has the lowest median household income of $0, with 39 households (1.1%) in this group.
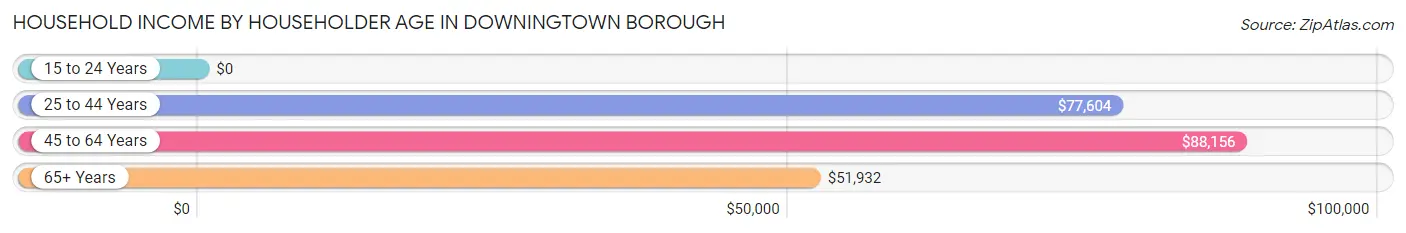
| Income Bracket | # Households | Median Income |
| 15 to 24 Years | 39 (1.1%) | $0 |
| 25 to 44 Years | 1,205 (35.5%) | $77,604 |
| 45 to 64 Years | 1,514 (44.6%) | $88,156 |
| 65+ Years | 635 (18.7%) | $51,932 |
| Total | 3,393 (100.0%) | $74,323 |
Poverty in Downingtown borough
Income Below Poverty by Sex and Age in Downingtown borough
With 4.1% poverty level for males and 6.1% for females among the residents of Downingtown borough, 5 year old males and 75 year old and over females are the most vulnerable to poverty, with 12 males (21.0%) and 30 females (22.2%) in their respective age groups living below the poverty level.
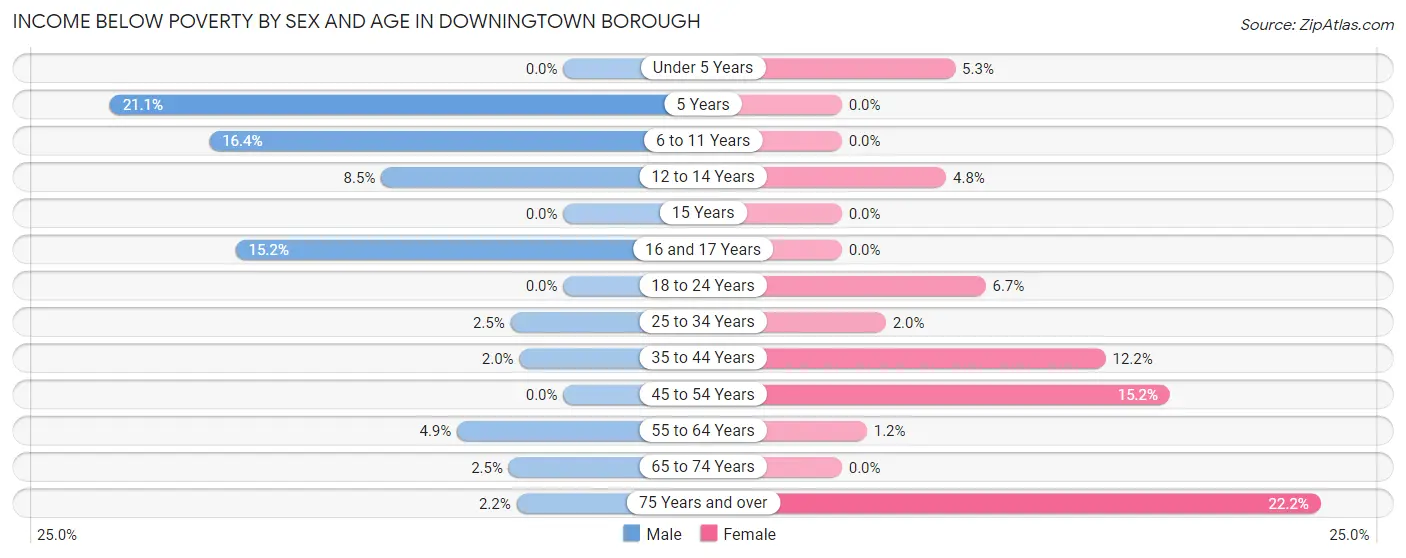
| Age Bracket | Male | Female |
| Under 5 Years | 0 (0.0%) | 14 (5.3%) |
| 5 Years | 12 (21.0%) | 0 (0.0%) |
| 6 to 11 Years | 34 (16.4%) | 0 (0.0%) |
| 12 to 14 Years | 6 (8.5%) | 6 (4.8%) |
| 15 Years | 0 (0.0%) | 0 (0.0%) |
| 16 and 17 Years | 33 (15.2%) | 0 (0.0%) |
| 18 to 24 Years | 0 (0.0%) | 18 (6.7%) |
| 25 to 34 Years | 17 (2.5%) | 16 (2.0%) |
| 35 to 44 Years | 10 (2.0%) | 99 (12.2%) |
| 45 to 54 Years | 0 (0.0%) | 70 (15.2%) |
| 55 to 64 Years | 28 (4.9%) | 8 (1.2%) |
| 65 to 74 Years | 8 (2.5%) | 0 (0.0%) |
| 75 Years and over | 3 (2.2%) | 30 (22.2%) |
| Total | 151 (4.1%) | 261 (6.1%) |
Income Above Poverty by Sex and Age in Downingtown borough
According to the poverty statistics in Downingtown borough, males aged under 5 years and females aged 5 years are the age groups that are most secure financially, with 100.0% of males and 100.0% of females in these age groups living above the poverty line.
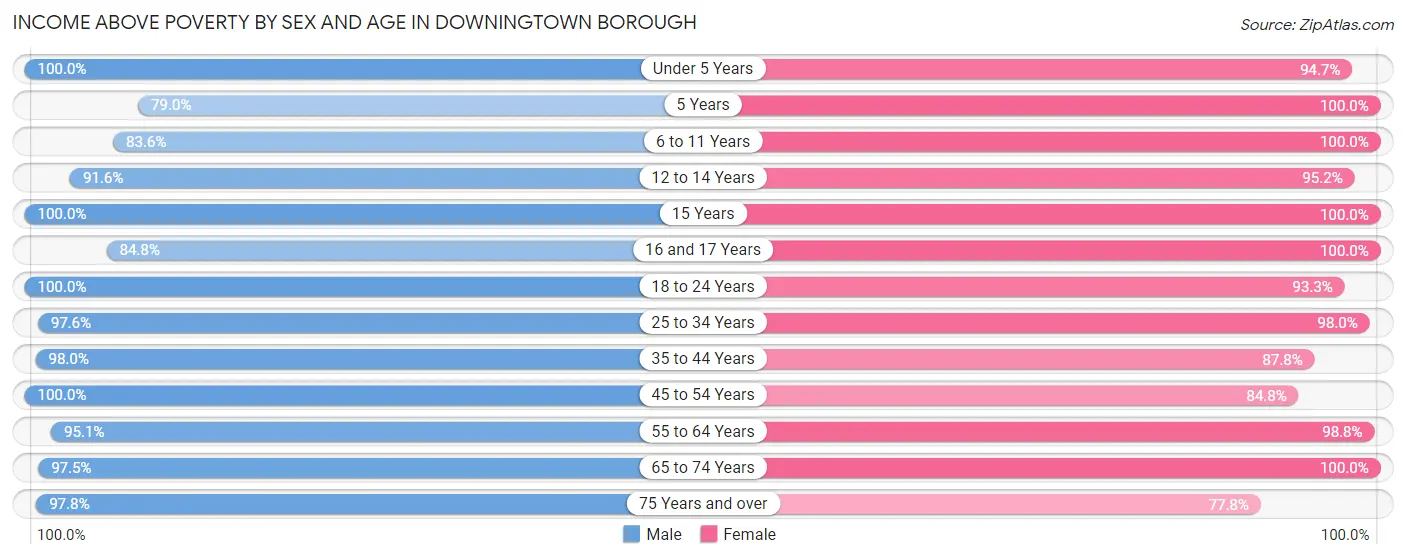
| Age Bracket | Male | Female |
| Under 5 Years | 130 (100.0%) | 252 (94.7%) |
| 5 Years | 45 (78.9%) | 37 (100.0%) |
| 6 to 11 Years | 173 (83.6%) | 311 (100.0%) |
| 12 to 14 Years | 65 (91.5%) | 118 (95.2%) |
| 15 Years | 55 (100.0%) | 18 (100.0%) |
| 16 and 17 Years | 184 (84.8%) | 18 (100.0%) |
| 18 to 24 Years | 269 (100.0%) | 252 (93.3%) |
| 25 to 34 Years | 678 (97.6%) | 767 (98.0%) |
| 35 to 44 Years | 481 (98.0%) | 710 (87.8%) |
| 45 to 54 Years | 464 (100.0%) | 390 (84.8%) |
| 55 to 64 Years | 540 (95.1%) | 681 (98.8%) |
| 65 to 74 Years | 308 (97.5%) | 340 (100.0%) |
| 75 Years and over | 135 (97.8%) | 105 (77.8%) |
| Total | 3,527 (95.9%) | 3,999 (93.9%) |
Income Below Poverty Among Married-Couple Families in Downingtown borough
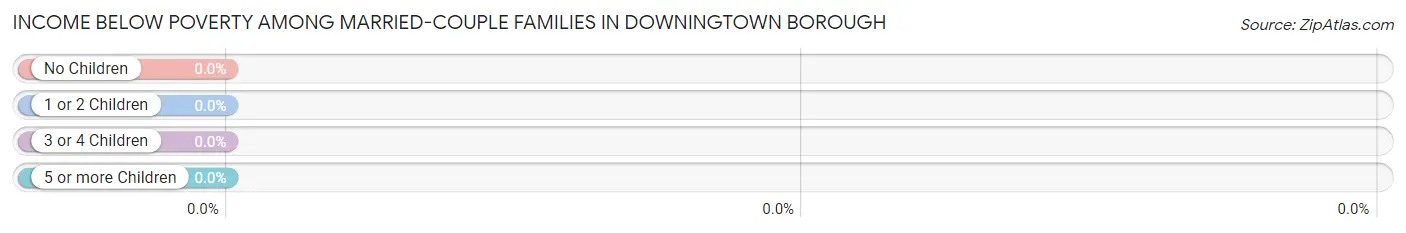
| Children | Above Poverty | Below Poverty |
| No Children | 684 (100.0%) | 0 (0.0%) |
| 1 or 2 Children | 600 (100.0%) | 0 (0.0%) |
| 3 or 4 Children | 98 (100.0%) | 0 (0.0%) |
| 5 or more Children | 0 (0.0%) | 0 (0.0%) |
| Total | 1,382 (100.0%) | 0 (0.0%) |
Income Below Poverty Among Single-Parent Households in Downingtown borough
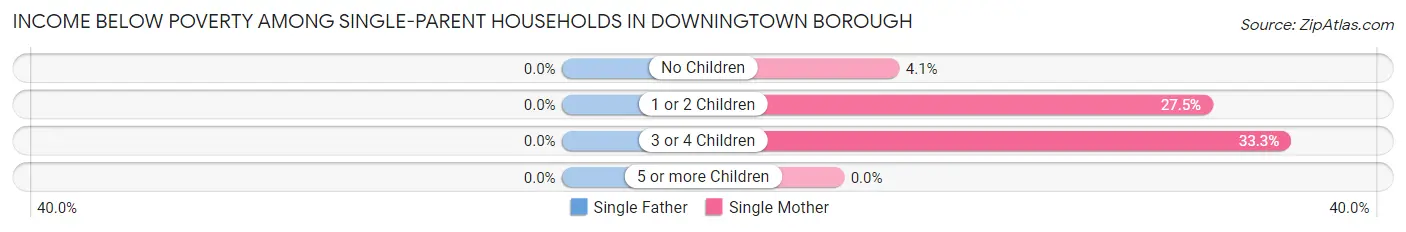
| Children | Single Father | Single Mother |
| No Children | 0 (0.0%) | 18 (4.1%) |
| 1 or 2 Children | 0 (0.0%) | 74 (27.5%) |
| 3 or 4 Children | 0 (0.0%) | 4 (33.3%) |
| 5 or more Children | 0 (0.0%) | 0 (0.0%) |
| Total | 0 (0.0%) | 96 (13.4%) |
Income Below Poverty Among Married-Couple vs Single-Parent Households in Downingtown borough
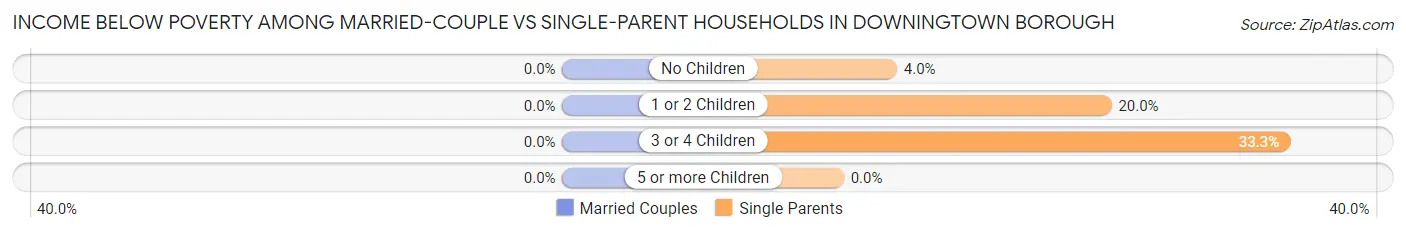
| Children | Married-Couple Families | Single-Parent Households |
| No Children | 0 (0.0%) | 18 (4.0%) |
| 1 or 2 Children | 0 (0.0%) | 74 (20.0%) |
| 3 or 4 Children | 0 (0.0%) | 4 (33.3%) |
| 5 or more Children | 0 (0.0%) | 0 (0.0%) |
| Total | 0 (0.0%) | 96 (11.5%) |
Race in Downingtown borough
The most populous races in Downingtown borough are White / Caucasian (5,843 | 72.2%), Black / African American (1,018 | 12.6%), and Asian (592 | 7.3%).
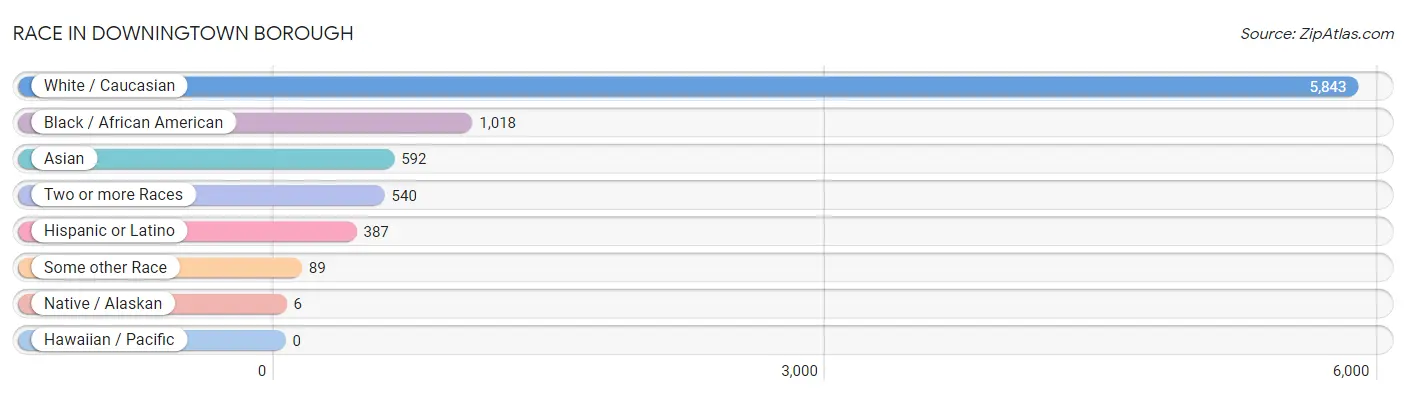
| Race | # Population | % Population |
| Asian | 592 | 7.3% |
| Black / African American | 1,018 | 12.6% |
| Hawaiian / Pacific | 0 | 0.0% |
| Hispanic or Latino | 387 | 4.8% |
| Native / Alaskan | 6 | 0.1% |
| White / Caucasian | 5,843 | 72.2% |
| Two or more Races | 540 | 6.7% |
| Some other Race | 89 | 1.1% |
| Total | 8,088 | 100.0% |
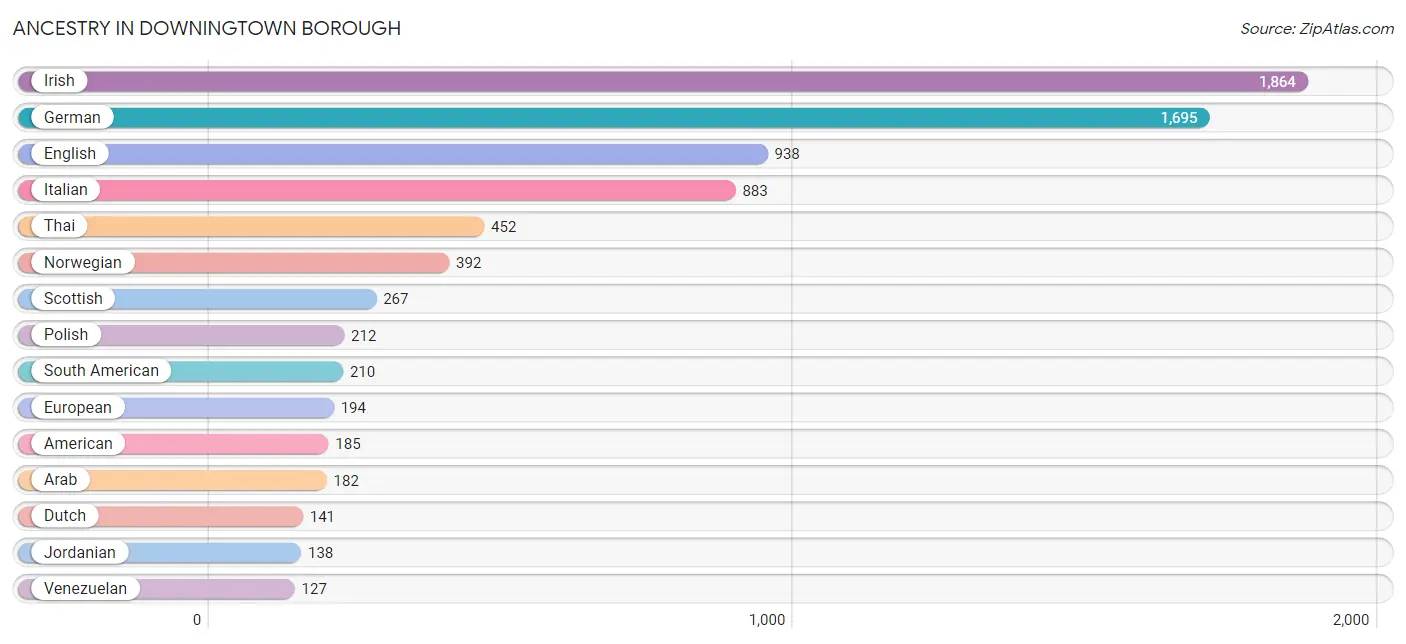
Ancestry in Downingtown borough
The most populous ancestries reported in Downingtown borough are Irish (1,864 | 23.1%), German (1,695 | 21.0%), English (938 | 11.6%), Italian (883 | 10.9%), and Thai (452 | 5.6%), together accounting for 72.1% of all Downingtown borough residents.
| Ancestry | # Population | % Population |
| American | 185 | 2.3% |
| Apache | 47 | 0.6% |
| Arab | 182 | 2.2% |
| Austrian | 113 | 1.4% |
| Belgian | 12 | 0.2% |
| British | 67 | 0.8% |
| Burmese | 36 | 0.4% |
| Central American | 6 | 0.1% |
| Central American Indian | 6 | 0.1% |
| Chilean | 23 | 0.3% |
| Colombian | 60 | 0.7% |
| Czech | 16 | 0.2% |
| Danish | 17 | 0.2% |
| Dutch | 141 | 1.7% |
| Eastern European | 12 | 0.2% |
| English | 938 | 11.6% |
| European | 194 | 2.4% |
| French | 85 | 1.1% |
| French Canadian | 9 | 0.1% |
| German | 1,695 | 21.0% |
| Greek | 31 | 0.4% |
| Guatemalan | 6 | 0.1% |
| Hungarian | 99 | 1.2% |
| Icelander | 18 | 0.2% |
| Indian (Asian) | 76 | 0.9% |
| Irish | 1,864 | 23.1% |
| Italian | 883 | 10.9% |
| Jordanian | 138 | 1.7% |
| Korean | 69 | 0.9% |
| Laotian | 12 | 0.2% |
| Lebanese | 35 | 0.4% |
| Mexican | 22 | 0.3% |
| Mexican American Indian | 22 | 0.3% |
| Moroccan | 9 | 0.1% |
| Northern European | 11 | 0.1% |
| Norwegian | 392 | 4.9% |
| Pakistani | 24 | 0.3% |
| Pennsylvania German | 23 | 0.3% |
| Polish | 212 | 2.6% |
| Portuguese | 47 | 0.6% |
| Puerto Rican | 110 | 1.4% |
| Russian | 92 | 1.1% |
| Scandinavian | 13 | 0.2% |
| Scotch-Irish | 43 | 0.5% |
| Scottish | 267 | 3.3% |
| Seminole | 85 | 1.1% |
| South American | 210 | 2.6% |
| Sri Lankan | 58 | 0.7% |
| Swedish | 26 | 0.3% |
| Swiss | 33 | 0.4% |
| Thai | 452 | 5.6% |
| Ukrainian | 25 | 0.3% |
| Venezuelan | 127 | 1.6% |
| Welsh | 72 | 0.9% | View All 54 Rows |
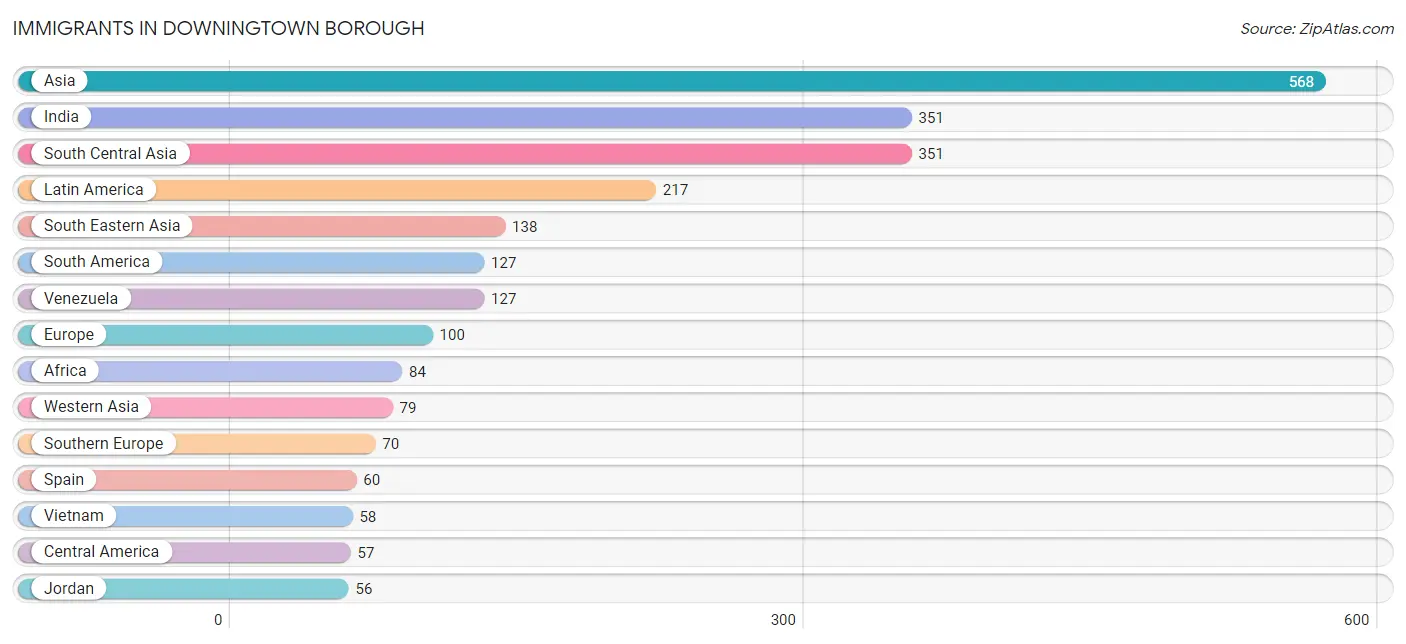
Immigrants in Downingtown borough
The most numerous immigrant groups reported in Downingtown borough came from Asia (568 | 7.0%), India (351 | 4.3%), South Central Asia (351 | 4.3%), Latin America (217 | 2.7%), and South Eastern Asia (138 | 1.7%), together accounting for 20.1% of all Downingtown borough residents.
| Immigration Origin | # Population | % Population |
| Africa | 84 | 1.0% |
| Asia | 568 | 7.0% |
| Canada | 4 | 0.1% |
| Caribbean | 33 | 0.4% |
| Central America | 57 | 0.7% |
| Eastern Africa | 29 | 0.4% |
| Europe | 100 | 1.2% |
| Germany | 5 | 0.1% |
| Greece | 10 | 0.1% |
| Guatemala | 6 | 0.1% |
| Haiti | 33 | 0.4% |
| India | 351 | 4.3% |
| Indonesia | 12 | 0.2% |
| Jordan | 56 | 0.7% |
| Kenya | 29 | 0.4% |
| Latin America | 217 | 2.7% |
| Lebanon | 23 | 0.3% |
| Mexico | 51 | 0.6% |
| Morocco | 4 | 0.1% |
| Northern Africa | 4 | 0.1% |
| Northern Europe | 25 | 0.3% |
| Philippines | 44 | 0.5% |
| Scotland | 13 | 0.2% |
| South Africa | 51 | 0.6% |
| South America | 127 | 1.6% |
| South Central Asia | 351 | 4.3% |
| South Eastern Asia | 138 | 1.7% |
| Southern Europe | 70 | 0.9% |
| Spain | 60 | 0.7% |
| Thailand | 24 | 0.3% |
| Venezuela | 127 | 1.6% |
| Vietnam | 58 | 0.7% |
| Western Asia | 79 | 1.0% |
| Western Europe | 5 | 0.1% | View All 34 Rows |
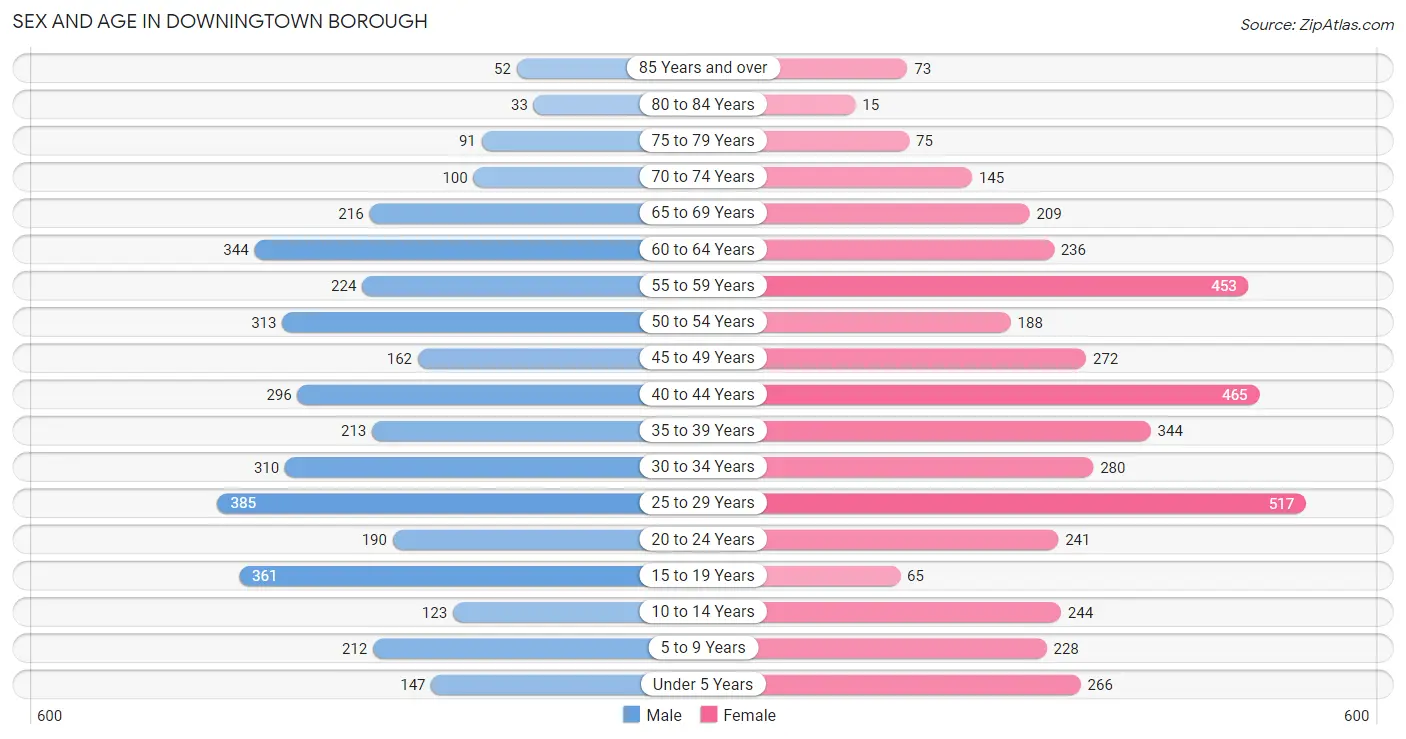
Sex and Age in Downingtown borough
Sex and Age in Downingtown borough
The most populous age groups in Downingtown borough are 25 to 29 Years (385 | 10.2%) for men and 25 to 29 Years (517 | 12.0%) for women.
| Age Bracket | Male | Female |
| Under 5 Years | 147 (3.9%) | 266 (6.2%) |
| 5 to 9 Years | 212 (5.6%) | 228 (5.3%) |
| 10 to 14 Years | 123 (3.3%) | 244 (5.7%) |
| 15 to 19 Years | 361 (9.6%) | 65 (1.5%) |
| 20 to 24 Years | 190 (5.0%) | 241 (5.6%) |
| 25 to 29 Years | 385 (10.2%) | 517 (12.0%) |
| 30 to 34 Years | 310 (8.2%) | 280 (6.5%) |
| 35 to 39 Years | 213 (5.7%) | 344 (8.0%) |
| 40 to 44 Years | 296 (7.9%) | 465 (10.8%) |
| 45 to 49 Years | 162 (4.3%) | 272 (6.3%) |
| 50 to 54 Years | 313 (8.3%) | 188 (4.4%) |
| 55 to 59 Years | 224 (5.9%) | 453 (10.5%) |
| 60 to 64 Years | 344 (9.1%) | 236 (5.5%) |
| 65 to 69 Years | 216 (5.7%) | 209 (4.8%) |
| 70 to 74 Years | 100 (2.6%) | 145 (3.4%) |
| 75 to 79 Years | 91 (2.4%) | 75 (1.7%) |
| 80 to 84 Years | 33 (0.9%) | 15 (0.4%) |
| 85 Years and over | 52 (1.4%) | 73 (1.7%) |
| Total | 3,772 (100.0%) | 4,316 (100.0%) |
Families and Households in Downingtown borough
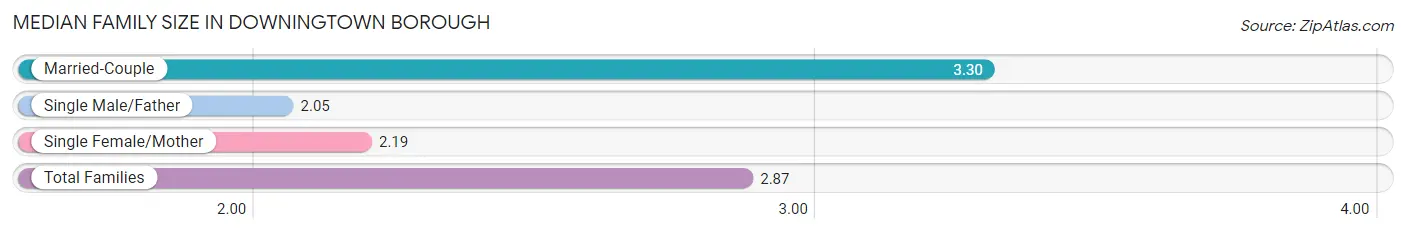
Median Family Size in Downingtown borough
The median family size in Downingtown borough is 2.87 persons per family, with married-couple families (1,382 | 62.3%) accounting for the largest median family size of 3.3 persons per family. On the other hand, single male/father families (119 | 5.4%) represent the smallest median family size with 2.05 persons per family.
| Family Type | # Families | Family Size |
| Married-Couple | 1,382 (62.3%) | 3.30 |
| Single Male/Father | 119 (5.4%) | 2.05 |
| Single Female/Mother | 719 (32.4%) | 2.19 |
| Total Families | 2,220 (100.0%) | 2.87 |
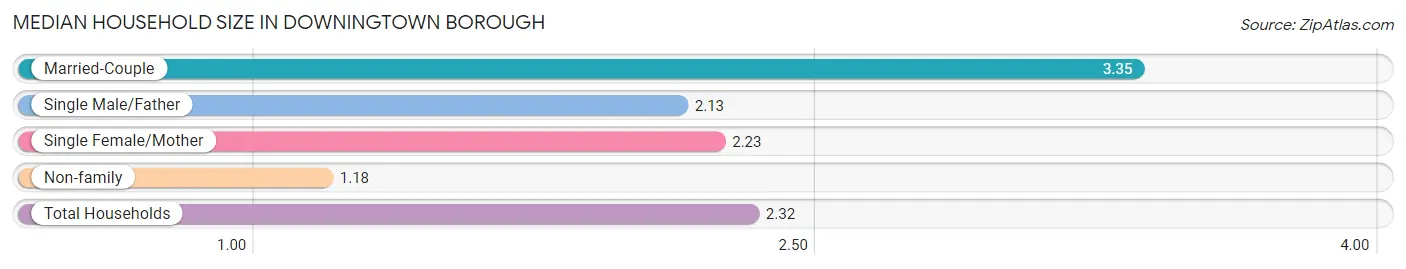
Median Household Size in Downingtown borough
The median household size in Downingtown borough is 2.32 persons per household, with married-couple households (1,382 | 40.7%) accounting for the largest median household size of 3.35 persons per household. non-family households (1,173 | 34.6%) represent the smallest median household size with 1.18 persons per household.
| Household Type | # Households | Household Size |
| Married-Couple | 1,382 (40.7%) | 3.35 |
| Single Male/Father | 119 (3.5%) | 2.13 |
| Single Female/Mother | 719 (21.2%) | 2.23 |
| Non-family | 1,173 (34.6%) | 1.18 |
| Total Households | 3,393 (100.0%) | 2.32 |
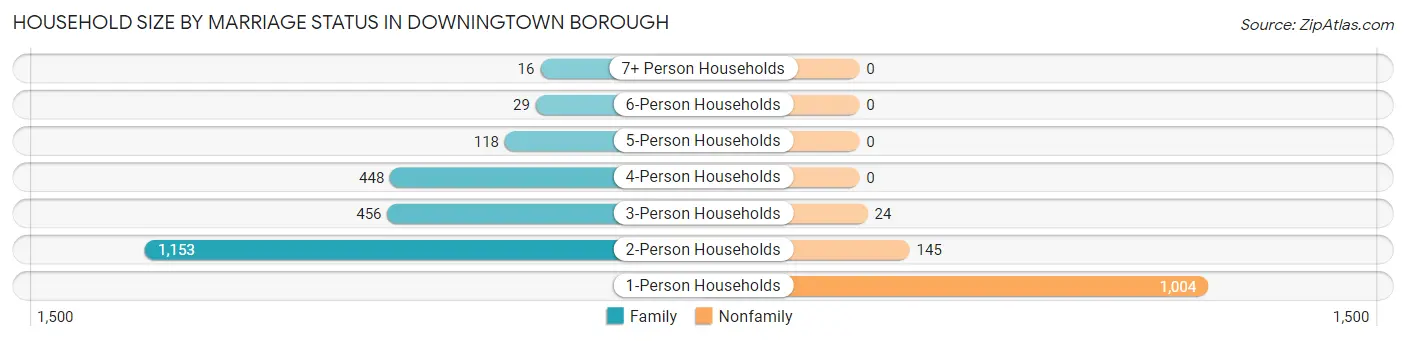
Household Size by Marriage Status in Downingtown borough
Out of a total of 3,393 households in Downingtown borough, 2,220 (65.4%) are family households, while 1,173 (34.6%) are nonfamily households. The most numerous type of family households are 2-person households, comprising 1,153, and the most common type of nonfamily households are 1-person households, comprising 1,004.
| Household Size | Family Households | Nonfamily Households |
| 1-Person Households | - | 1,004 (29.6%) |
| 2-Person Households | 1,153 (34.0%) | 145 (4.3%) |
| 3-Person Households | 456 (13.4%) | 24 (0.7%) |
| 4-Person Households | 448 (13.2%) | 0 (0.0%) |
| 5-Person Households | 118 (3.5%) | 0 (0.0%) |
| 6-Person Households | 29 (0.9%) | 0 (0.0%) |
| 7+ Person Households | 16 (0.5%) | 0 (0.0%) |
| Total | 2,220 (65.4%) | 1,173 (34.6%) |
Female Fertility in Downingtown borough
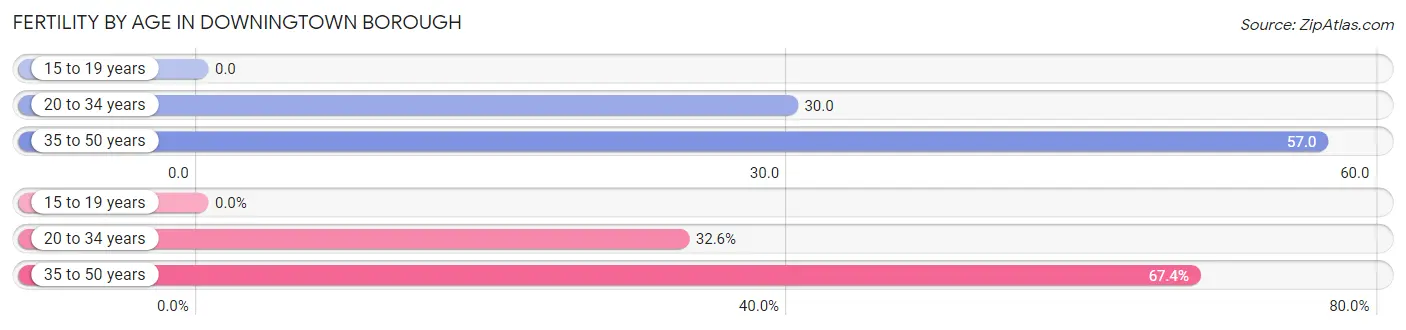
Fertility by Age in Downingtown borough
Average fertility rate in Downingtown borough is 43.0 births per 1,000 women. Women in the age bracket of 35 to 50 years have the highest fertility rate with 57.0 births per 1,000 women. Women in the age bracket of 35 to 50 years acount for 67.4% of all women with births.
| Age Bracket | Women with Births | Births / 1,000 Women |
| 15 to 19 years | 0 (0.0%) | 0.0 |
| 20 to 34 years | 31 (32.6%) | 30.0 |
| 35 to 50 years | 64 (67.4%) | 57.0 |
| Total | 95 (100.0%) | 43.0 |
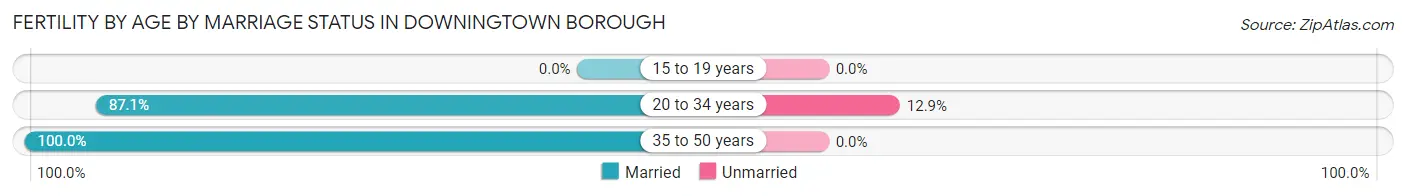
Fertility by Age by Marriage Status in Downingtown borough
95.8% of women with births (95) in Downingtown borough are married. The highest percentage of unmarried women with births falls into 20 to 34 years age bracket with 12.9% of them unmarried at the time of birth, while the lowest percentage of unmarried women with births belong to 35 to 50 years age bracket with 0.0% of them unmarried.
| Age Bracket | Married | Unmarried |
| 15 to 19 years | 0 (0.0%) | 0 (0.0%) |
| 20 to 34 years | 27 (87.1%) | 4 (12.9%) |
| 35 to 50 years | 64 (100.0%) | 0 (0.0%) |
| Total | 91 (95.8%) | 4 (4.2%) |
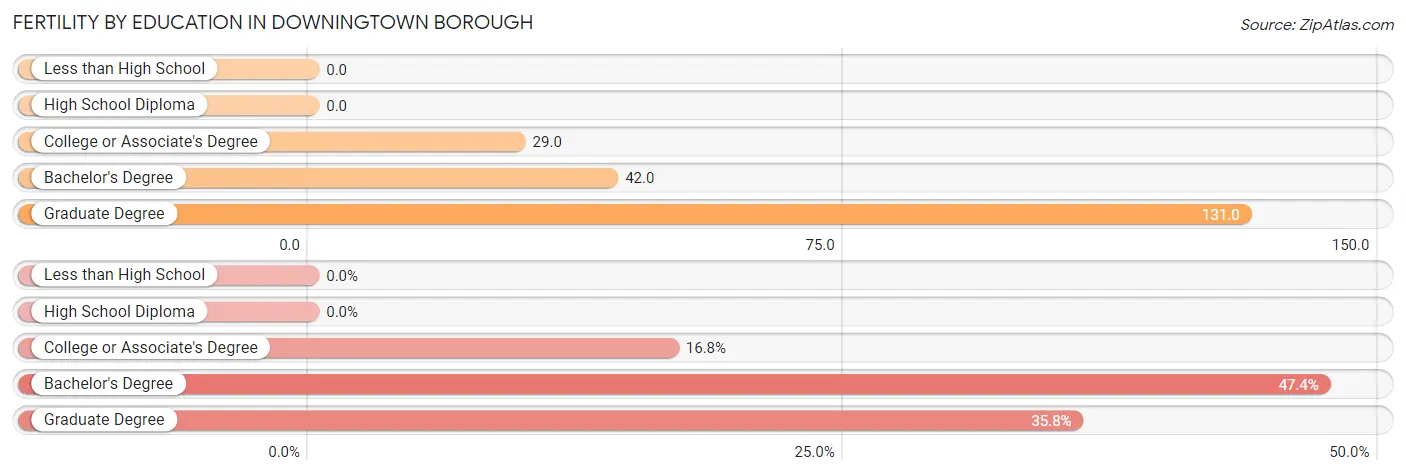
Fertility by Education in Downingtown borough
| Educational Attainment | Women with Births | Births / 1,000 Women |
| Less than High School | 0 (0.0%) | 0.0 |
| High School Diploma | 0 (0.0%) | 0.0 |
| College or Associate's Degree | 16 (16.8%) | 29.0 |
| Bachelor's Degree | 45 (47.4%) | 42.0 |
| Graduate Degree | 34 (35.8%) | 131.0 |
| Total | 95 (100.0%) | 43.0 |
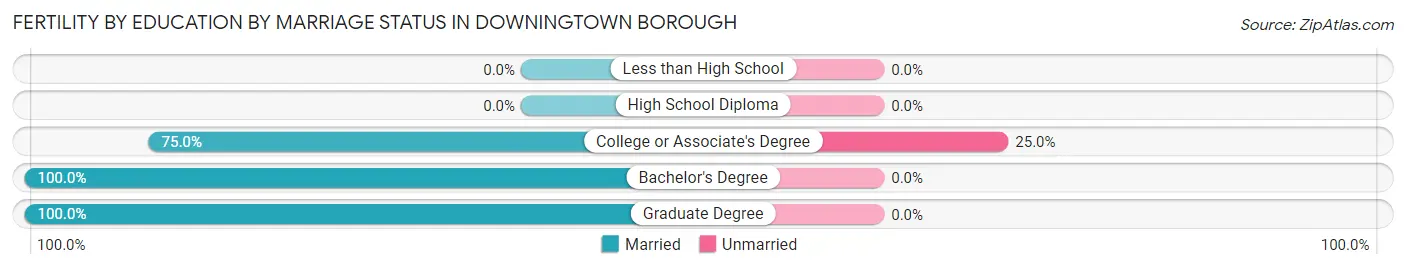
Fertility by Education by Marriage Status in Downingtown borough
4.2% of women with births in Downingtown borough are unmarried. Women with the educational attainment of bachelor's degree are most likely to be married with 100.0% of them married at childbirth, while women with the educational attainment of college or associate's degree are least likely to be married with 25.0% of them unmarried at childbirth.
| Educational Attainment | Married | Unmarried |
| Less than High School | 0 (0.0%) | 0 (0.0%) |
| High School Diploma | 0 (0.0%) | 0 (0.0%) |
| College or Associate's Degree | 12 (75.0%) | 4 (25.0%) |
| Bachelor's Degree | 45 (100.0%) | 0 (0.0%) |
| Graduate Degree | 34 (100.0%) | 0 (0.0%) |
| Total | 91 (95.8%) | 4 (4.2%) |
Employment Characteristics in Downingtown borough
Employment by Class of Employer in Downingtown borough
Among the 4,769 employed individuals in Downingtown borough, private company employees (3,357 | 70.4%), local government employees (522 | 11.0%), and not-for-profit organizations (338 | 7.1%) make up the most common classes of employment.
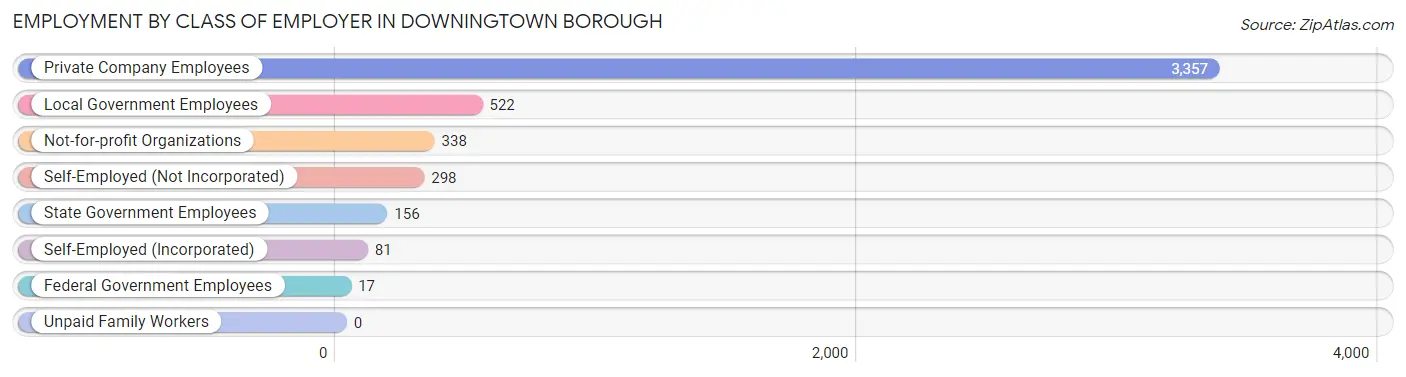
| Employer Class | # Employees | % Employees |
| Private Company Employees | 3,357 | 70.4% |
| Self-Employed (Incorporated) | 81 | 1.7% |
| Self-Employed (Not Incorporated) | 298 | 6.2% |
| Not-for-profit Organizations | 338 | 7.1% |
| Local Government Employees | 522 | 11.0% |
| State Government Employees | 156 | 3.3% |
| Federal Government Employees | 17 | 0.4% |
| Unpaid Family Workers | 0 | 0.0% |
| Total | 4,769 | 100.0% |
Employment Status by Age in Downingtown borough
According to the labor force statistics for Downingtown borough, out of the total population over 16 years of age (6,795), 75.7% or 5,144 individuals are in the labor force, with 4.1% or 211 of them unemployed. The age group with the highest labor force participation rate is 25 to 29 years, with 94.2% or 850 individuals in the labor force. Within the labor force, the 20 to 24 years age range has the highest percentage of unemployed individuals, with 15.3% or 49 of them being unemployed.
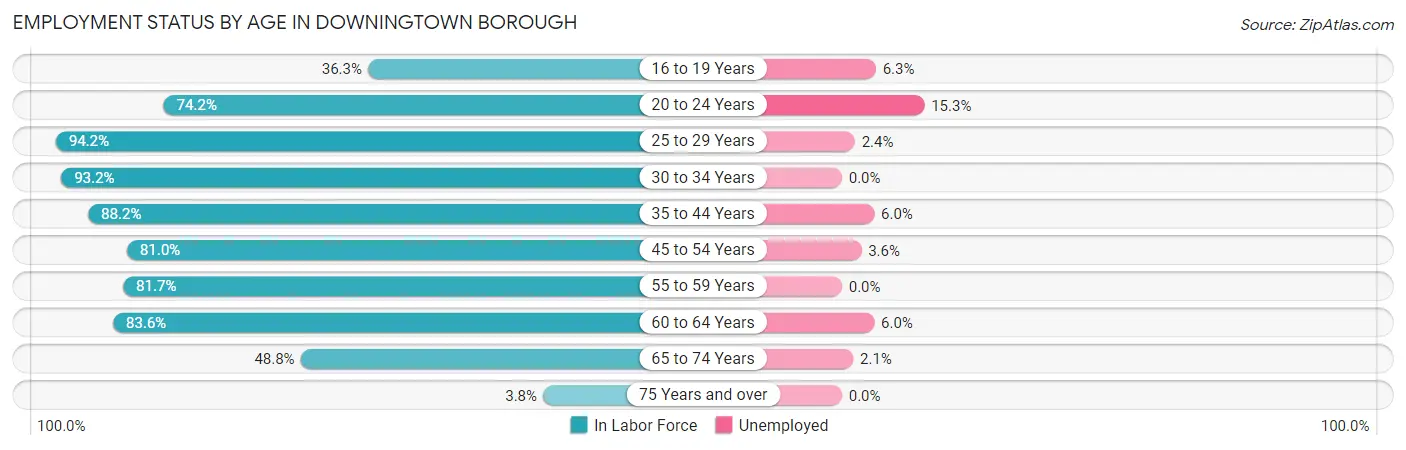
| Age Bracket | In Labor Force | Unemployed |
| 16 to 19 Years | 128 (36.3%) | 8 (6.3%) |
| 20 to 24 Years | 320 (74.2%) | 49 (15.3%) |
| 25 to 29 Years | 850 (94.2%) | 20 (2.4%) |
| 30 to 34 Years | 550 (93.2%) | 0 (0.0%) |
| 35 to 44 Years | 1,162 (88.2%) | 70 (6.0%) |
| 45 to 54 Years | 757 (81.0%) | 27 (3.6%) |
| 55 to 59 Years | 553 (81.7%) | 0 (0.0%) |
| 60 to 64 Years | 485 (83.6%) | 29 (6.0%) |
| 65 to 74 Years | 327 (48.8%) | 7 (2.1%) |
| 75 Years and over | 13 (3.8%) | 0 (0.0%) |
| Total | 5,144 (75.7%) | 211 (4.1%) |
Employment Status by Educational Attainment in Downingtown borough
According to labor force statistics for Downingtown borough, 87.1% of individuals (4,357) out of the total population between 25 and 64 years of age (5,002) are in the labor force, with 3.4% or 148 of them being unemployed. The group with the highest labor force participation rate are those with the educational attainment of bachelor's degree or higher, with 91.8% or 2,110 individuals in the labor force. Within the labor force, individuals with high school diploma education have the highest percentage of unemployment, with 6.0% or 61 of them being unemployed.
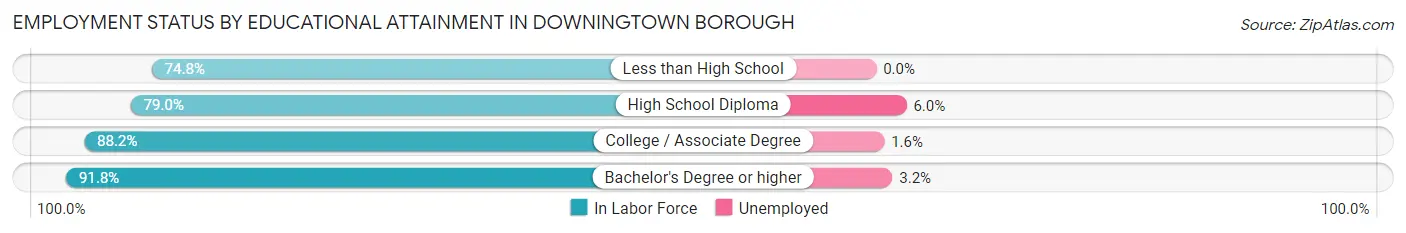
| Educational Attainment | In Labor Force | Unemployed |
| Less than High School | 95 (74.8%) | 0 (0.0%) |
| High School Diploma | 1,022 (79.0%) | 78 (6.0%) |
| College / Associate Degree | 1,132 (88.2%) | 21 (1.6%) |
| Bachelor's Degree or higher | 2,110 (91.8%) | 74 (3.2%) |
| Total | 4,357 (87.1%) | 170 (3.4%) |
Employment Occupations by Sex in Downingtown borough
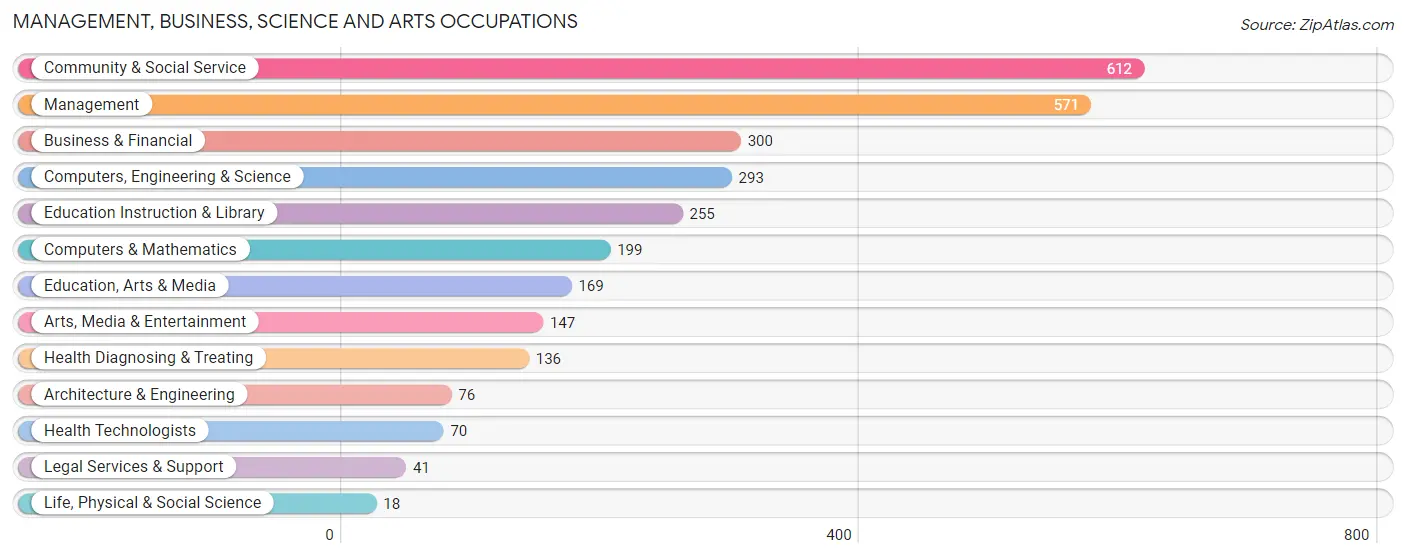
Management, Business, Science and Arts Occupations
The most common Management, Business, Science and Arts occupations in Downingtown borough are Community & Social Service (612 | 12.4%), Management (571 | 11.6%), Business & Financial (300 | 6.1%), Computers, Engineering & Science (293 | 5.9%), and Education Instruction & Library (255 | 5.2%).
Management, Business, Science and Arts Occupations by Sex
Within the Management, Business, Science and Arts occupations in Downingtown borough, the most male-oriented occupations are Education, Arts & Media (71.0%), Computers & Mathematics (68.3%), and Legal Services & Support (63.4%), while the most female-oriented occupations are Arts, Media & Entertainment (100.0%), Health Diagnosing & Treating (100.0%), and Health Technologists (100.0%).
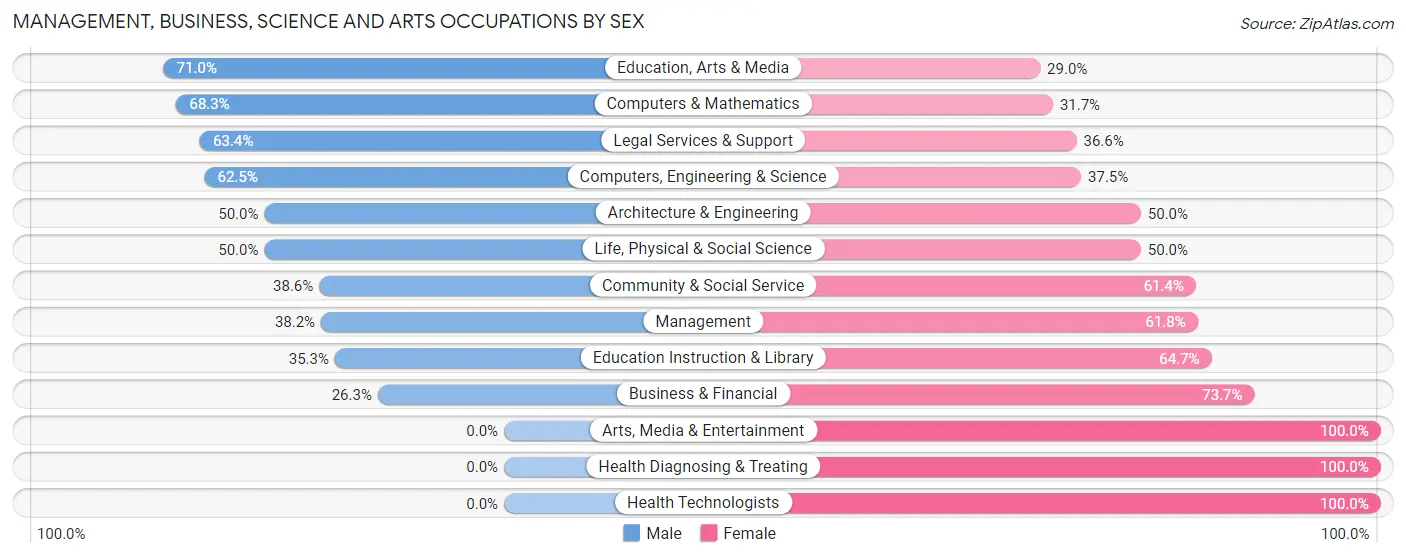
| Occupation | Male | Female |
| Management | 218 (38.2%) | 353 (61.8%) |
| Business & Financial | 79 (26.3%) | 221 (73.7%) |
| Computers, Engineering & Science | 183 (62.5%) | 110 (37.5%) |
| Computers & Mathematics | 136 (68.3%) | 63 (31.7%) |
| Architecture & Engineering | 38 (50.0%) | 38 (50.0%) |
| Life, Physical & Social Science | 9 (50.0%) | 9 (50.0%) |
| Community & Social Service | 236 (38.6%) | 376 (61.4%) |
| Education, Arts & Media | 120 (71.0%) | 49 (29.0%) |
| Legal Services & Support | 26 (63.4%) | 15 (36.6%) |
| Education Instruction & Library | 90 (35.3%) | 165 (64.7%) |
| Arts, Media & Entertainment | 0 (0.0%) | 147 (100.0%) |
| Health Diagnosing & Treating | 0 (0.0%) | 136 (100.0%) |
| Health Technologists | 0 (0.0%) | 70 (100.0%) |
| Total (Category) | 716 (37.4%) | 1,196 (62.5%) |
| Total (Overall) | 2,363 (47.9%) | 2,573 (52.1%) |
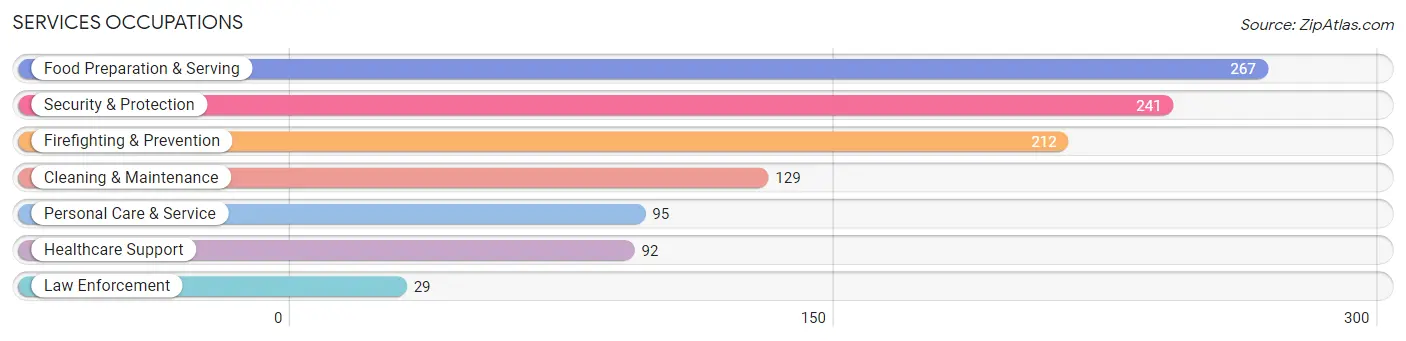
Services Occupations
The most common Services occupations in Downingtown borough are Food Preparation & Serving (267 | 5.4%), Security & Protection (241 | 4.9%), Firefighting & Prevention (212 | 4.3%), Cleaning & Maintenance (129 | 2.6%), and Personal Care & Service (95 | 1.9%).
Services Occupations by Sex
Within the Services occupations in Downingtown borough, the most male-oriented occupations are Firefighting & Prevention (92.0%), Security & Protection (88.8%), and Cleaning & Maintenance (85.3%), while the most female-oriented occupations are Healthcare Support (79.3%), Personal Care & Service (63.2%), and Food Preparation & Serving (46.1%).
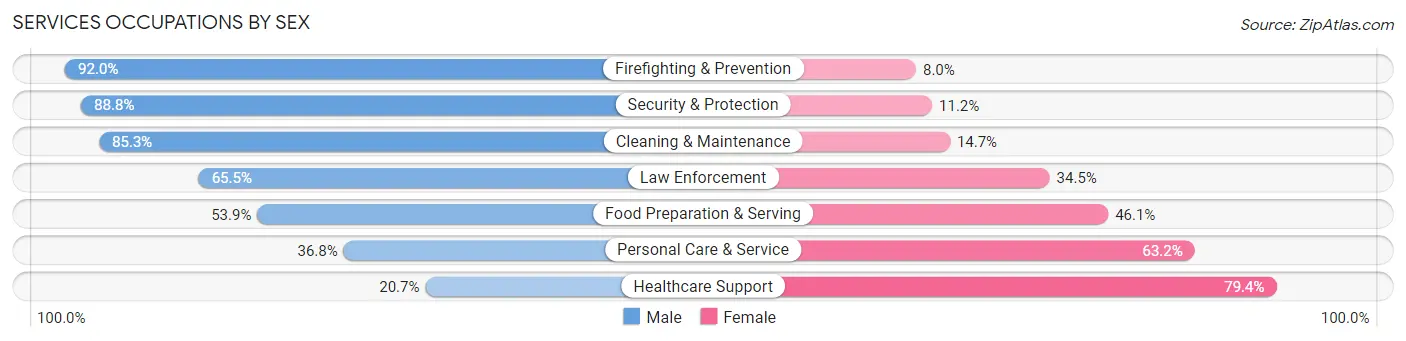
| Occupation | Male | Female |
| Healthcare Support | 19 (20.6%) | 73 (79.3%) |
| Security & Protection | 214 (88.8%) | 27 (11.2%) |
| Firefighting & Prevention | 195 (92.0%) | 17 (8.0%) |
| Law Enforcement | 19 (65.5%) | 10 (34.5%) |
| Food Preparation & Serving | 144 (53.9%) | 123 (46.1%) |
| Cleaning & Maintenance | 110 (85.3%) | 19 (14.7%) |
| Personal Care & Service | 35 (36.8%) | 60 (63.2%) |
| Total (Category) | 522 (63.3%) | 302 (36.6%) |
| Total (Overall) | 2,363 (47.9%) | 2,573 (52.1%) |
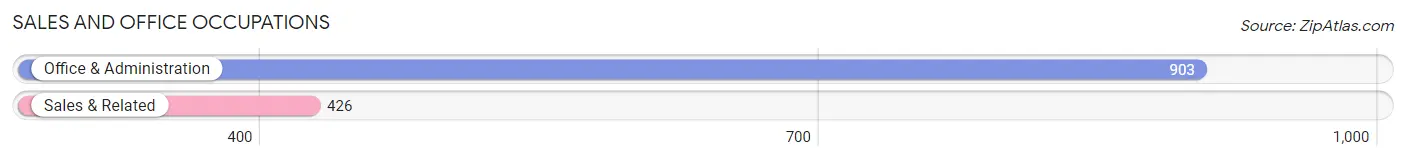
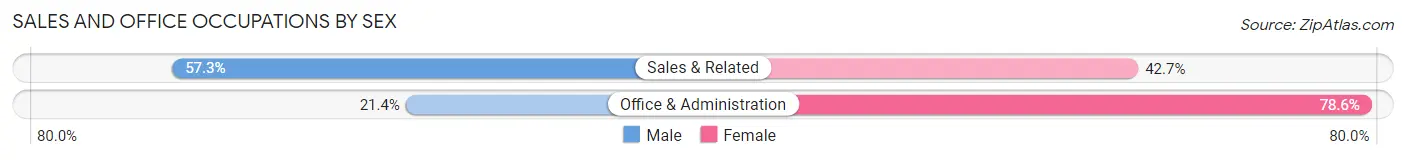
Sales and Office Occupations
The most common Sales and Office occupations in Downingtown borough are Office & Administration (903 | 18.3%), and Sales & Related (426 | 8.6%).
Sales and Office Occupations by Sex
| Occupation | Male | Female |
| Sales & Related | 244 (57.3%) | 182 (42.7%) |
| Office & Administration | 193 (21.4%) | 710 (78.6%) |
| Total (Category) | 437 (32.9%) | 892 (67.1%) |
| Total (Overall) | 2,363 (47.9%) | 2,573 (52.1%) |
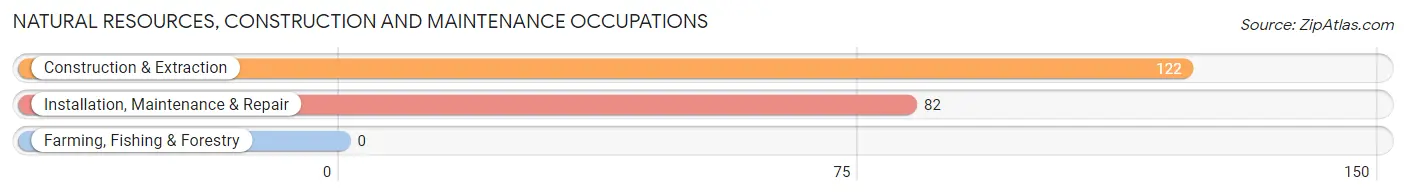
Natural Resources, Construction and Maintenance Occupations
The most common Natural Resources, Construction and Maintenance occupations in Downingtown borough are Construction & Extraction (122 | 2.5%), and Installation, Maintenance & Repair (82 | 1.7%).
Natural Resources, Construction and Maintenance Occupations by Sex
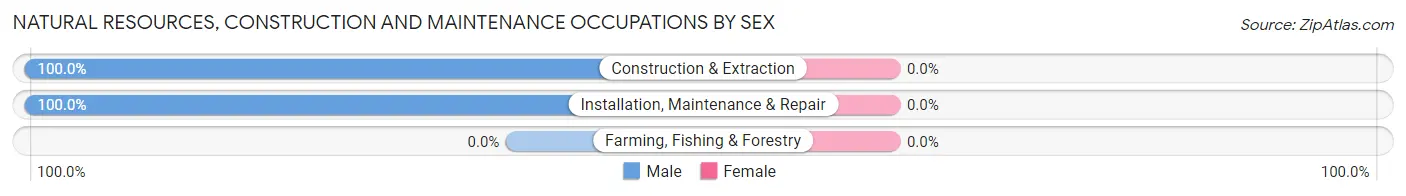
| Occupation | Male | Female |
| Farming, Fishing & Forestry | 0 (0.0%) | 0 (0.0%) |
| Construction & Extraction | 122 (100.0%) | 0 (0.0%) |
| Installation, Maintenance & Repair | 82 (100.0%) | 0 (0.0%) |
| Total (Category) | 204 (100.0%) | 0 (0.0%) |
| Total (Overall) | 2,363 (47.9%) | 2,573 (52.1%) |
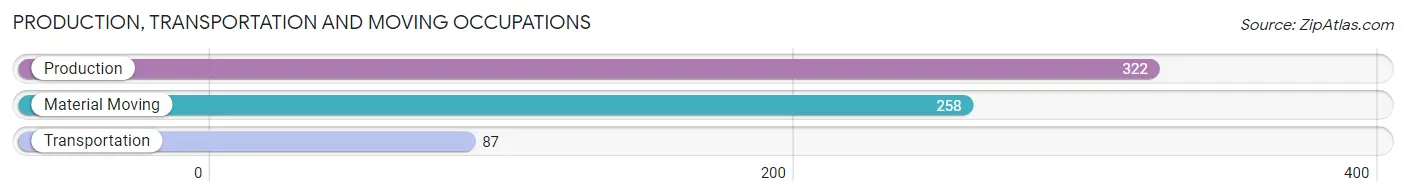
Production, Transportation and Moving Occupations
The most common Production, Transportation and Moving occupations in Downingtown borough are Production (322 | 6.5%), Material Moving (258 | 5.2%), and Transportation (87 | 1.8%).
Production, Transportation and Moving Occupations by Sex
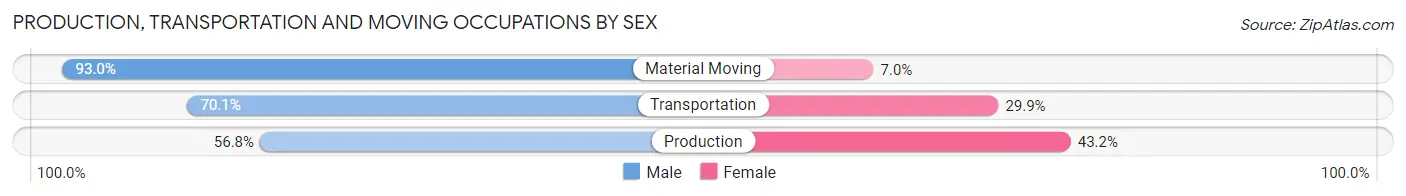
| Occupation | Male | Female |
| Production | 183 (56.8%) | 139 (43.2%) |
| Transportation | 61 (70.1%) | 26 (29.9%) |
| Material Moving | 240 (93.0%) | 18 (7.0%) |
| Total (Category) | 484 (72.6%) | 183 (27.4%) |
| Total (Overall) | 2,363 (47.9%) | 2,573 (52.1%) |
Employment Industries by Sex in Downingtown borough
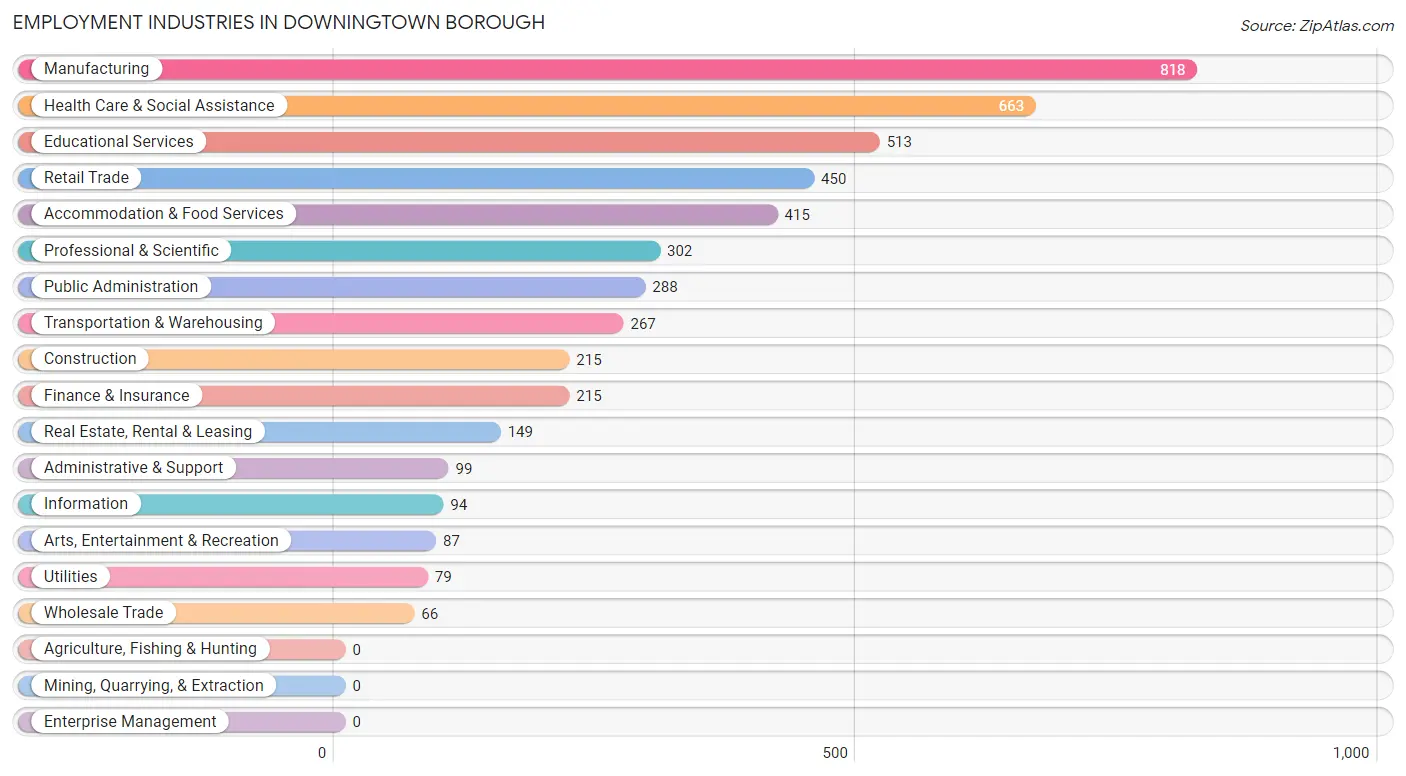
Employment Industries in Downingtown borough
The major employment industries in Downingtown borough include Manufacturing (818 | 16.6%), Health Care & Social Assistance (663 | 13.4%), Educational Services (513 | 10.4%), Retail Trade (450 | 9.1%), and Accommodation & Food Services (415 | 8.4%).
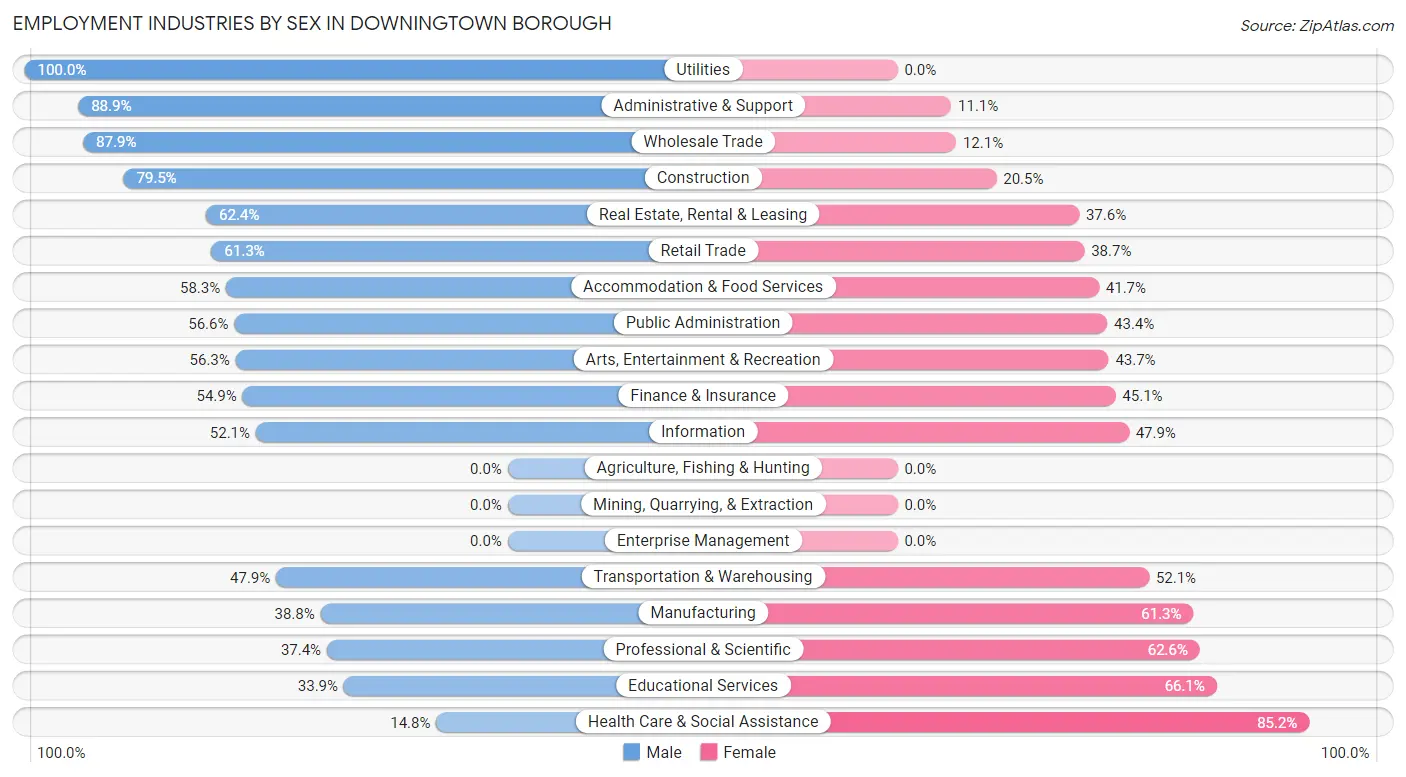
Employment Industries by Sex in Downingtown borough
The Downingtown borough industries that see more men than women are Utilities (100.0%), Administrative & Support (88.9%), and Wholesale Trade (87.9%), whereas the industries that tend to have a higher number of women are Health Care & Social Assistance (85.2%), Educational Services (66.1%), and Professional & Scientific (62.6%).
| Industry | Male | Female |
| Agriculture, Fishing & Hunting | 0 (0.0%) | 0 (0.0%) |
| Mining, Quarrying, & Extraction | 0 (0.0%) | 0 (0.0%) |
| Construction | 171 (79.5%) | 44 (20.5%) |
| Manufacturing | 317 (38.8%) | 501 (61.3%) |
| Wholesale Trade | 58 (87.9%) | 8 (12.1%) |
| Retail Trade | 276 (61.3%) | 174 (38.7%) |
| Transportation & Warehousing | 128 (47.9%) | 139 (52.1%) |
| Utilities | 79 (100.0%) | 0 (0.0%) |
| Information | 49 (52.1%) | 45 (47.9%) |
| Finance & Insurance | 118 (54.9%) | 97 (45.1%) |
| Real Estate, Rental & Leasing | 93 (62.4%) | 56 (37.6%) |
| Professional & Scientific | 113 (37.4%) | 189 (62.6%) |
| Enterprise Management | 0 (0.0%) | 0 (0.0%) |
| Administrative & Support | 88 (88.9%) | 11 (11.1%) |
| Educational Services | 174 (33.9%) | 339 (66.1%) |
| Health Care & Social Assistance | 98 (14.8%) | 565 (85.2%) |
| Arts, Entertainment & Recreation | 49 (56.3%) | 38 (43.7%) |
| Accommodation & Food Services | 242 (58.3%) | 173 (41.7%) |
| Public Administration | 163 (56.6%) | 125 (43.4%) |
| Total | 2,363 (47.9%) | 2,573 (52.1%) |
Education in Downingtown borough
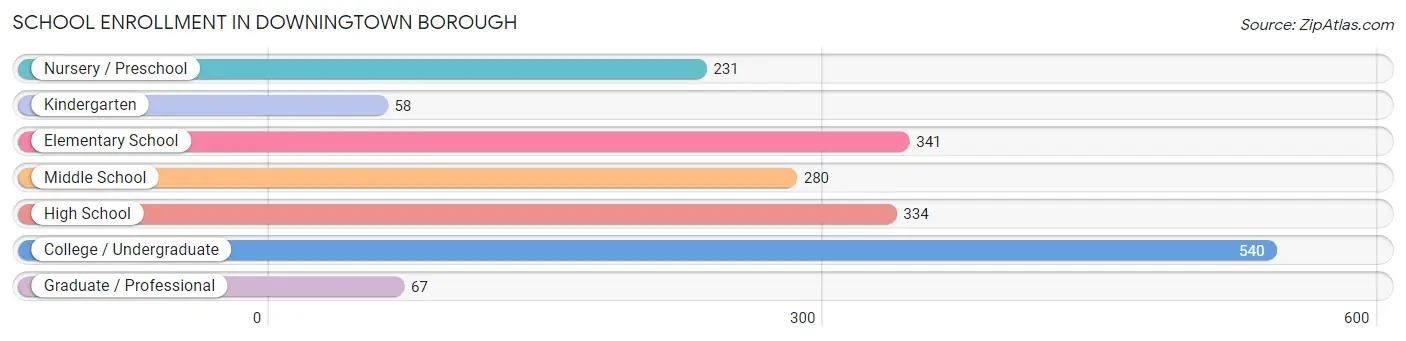
School Enrollment in Downingtown borough
The most common levels of schooling among the 1,851 students in Downingtown borough are college / undergraduate (540 | 29.2%), elementary school (341 | 18.4%), and high school (334 | 18.0%).
| School Level | # Students | % Students |
| Nursery / Preschool | 231 | 12.5% |
| Kindergarten | 58 | 3.1% |
| Elementary School | 341 | 18.4% |
| Middle School | 280 | 15.1% |
| High School | 334 | 18.0% |
| College / Undergraduate | 540 | 29.2% |
| Graduate / Professional | 67 | 3.6% |
| Total | 1,851 | 100.0% |
School Enrollment by Age by Funding Source in Downingtown borough
Out of a total of 1,851 students who are enrolled in schools in Downingtown borough, 292 (15.8%) attend a private institution, while the remaining 1,559 (84.2%) are enrolled in public schools. The age group of 3 to 4 year olds has the highest likelihood of being enrolled in private schools, with 111 (72.1% in the age bracket) enrolled. Conversely, the age group of 18 to 19 year olds has the lowest likelihood of being enrolled in a private school, with 54 (100.0% in the age bracket) attending a public institution.
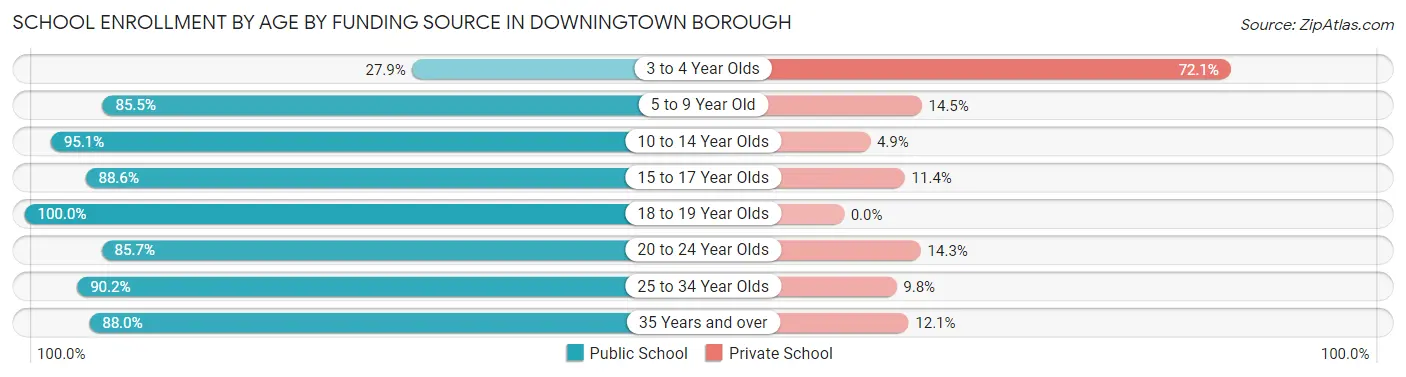
| Age Bracket | Public School | Private School |
| 3 to 4 Year Olds | 43 (27.9%) | 111 (72.1%) |
| 5 to 9 Year Old | 365 (85.5%) | 62 (14.5%) |
| 10 to 14 Year Olds | 349 (95.1%) | 18 (4.9%) |
| 15 to 17 Year Olds | 273 (88.6%) | 35 (11.4%) |
| 18 to 19 Year Olds | 54 (100.0%) | 0 (0.0%) |
| 20 to 24 Year Olds | 209 (85.7%) | 35 (14.3%) |
| 25 to 34 Year Olds | 193 (90.2%) | 21 (9.8%) |
| 35 Years and over | 73 (87.9%) | 10 (12.0%) |
| Total | 1,559 (84.2%) | 292 (15.8%) |
Educational Attainment by Field of Study in Downingtown borough
Business (622 | 21.9%), education (353 | 12.4%), communications (328 | 11.6%), visual & performing arts (264 | 9.3%), and arts & humanities (188 | 6.6%) are the most common fields of study among 2,838 individuals in Downingtown borough who have obtained a bachelor's degree or higher.
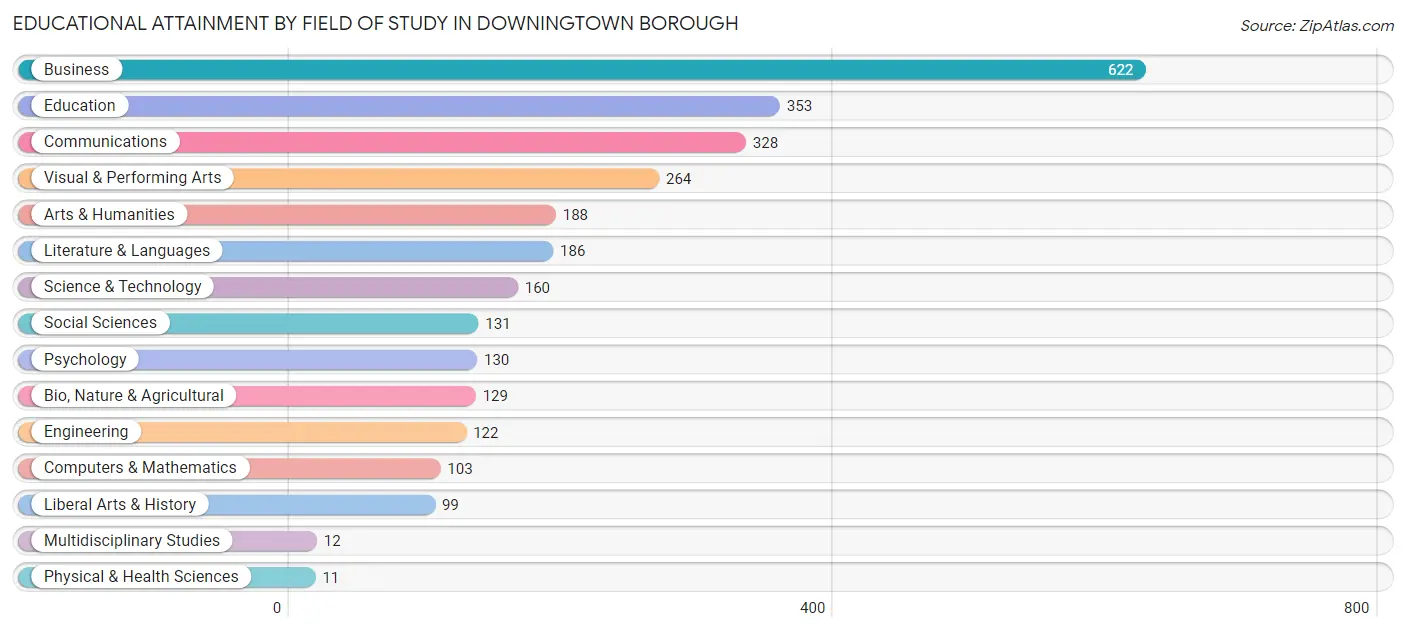
| Field of Study | # Graduates | % Graduates |
| Computers & Mathematics | 103 | 3.6% |
| Bio, Nature & Agricultural | 129 | 4.5% |
| Physical & Health Sciences | 11 | 0.4% |
| Psychology | 130 | 4.6% |
| Social Sciences | 131 | 4.6% |
| Engineering | 122 | 4.3% |
| Multidisciplinary Studies | 12 | 0.4% |
| Science & Technology | 160 | 5.6% |
| Business | 622 | 21.9% |
| Education | 353 | 12.4% |
| Literature & Languages | 186 | 6.6% |
| Liberal Arts & History | 99 | 3.5% |
| Visual & Performing Arts | 264 | 9.3% |
| Communications | 328 | 11.6% |
| Arts & Humanities | 188 | 6.6% |
| Total | 2,838 | 100.0% |
Transportation & Commute in Downingtown borough
Vehicle Availability by Sex in Downingtown borough
The most prevalent vehicle ownership categories in Downingtown borough are males with 2 vehicles (1,251, accounting for 56.0%) and females with 2 vehicles (1,585, making up 49.5%).
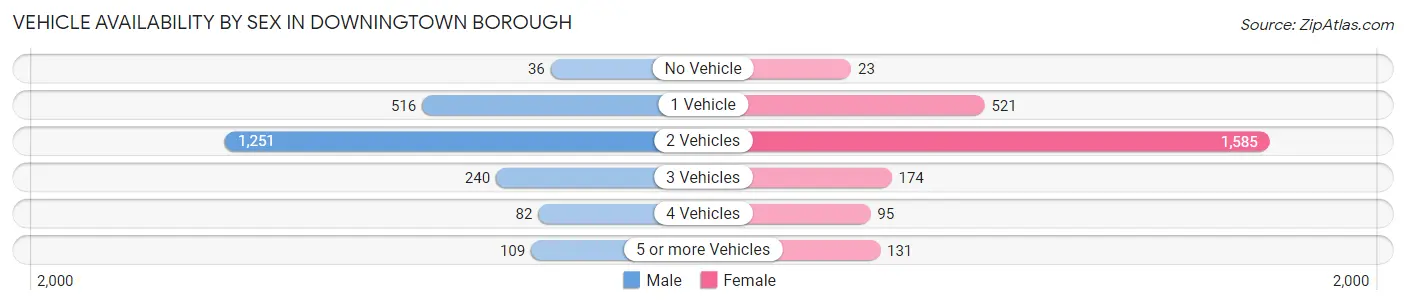
| Vehicles Available | Male | Female |
| No Vehicle | 36 (1.6%) | 23 (0.9%) |
| 1 Vehicle | 516 (23.1%) | 521 (20.6%) |
| 2 Vehicles | 1,251 (56.0%) | 1,585 (62.7%) |
| 3 Vehicles | 240 (10.7%) | 174 (6.9%) |
| 4 Vehicles | 82 (3.7%) | 95 (3.8%) |
| 5 or more Vehicles | 109 (4.9%) | 131 (5.2%) |
| Total | 2,234 (100.0%) | 2,529 (100.0%) |
Commute Time in Downingtown borough
The most frequently occuring commute durations in Downingtown borough are 15 to 19 minutes (813 commuters, 19.8%), 20 to 24 minutes (797 commuters, 19.4%), and 10 to 14 minutes (544 commuters, 13.2%).
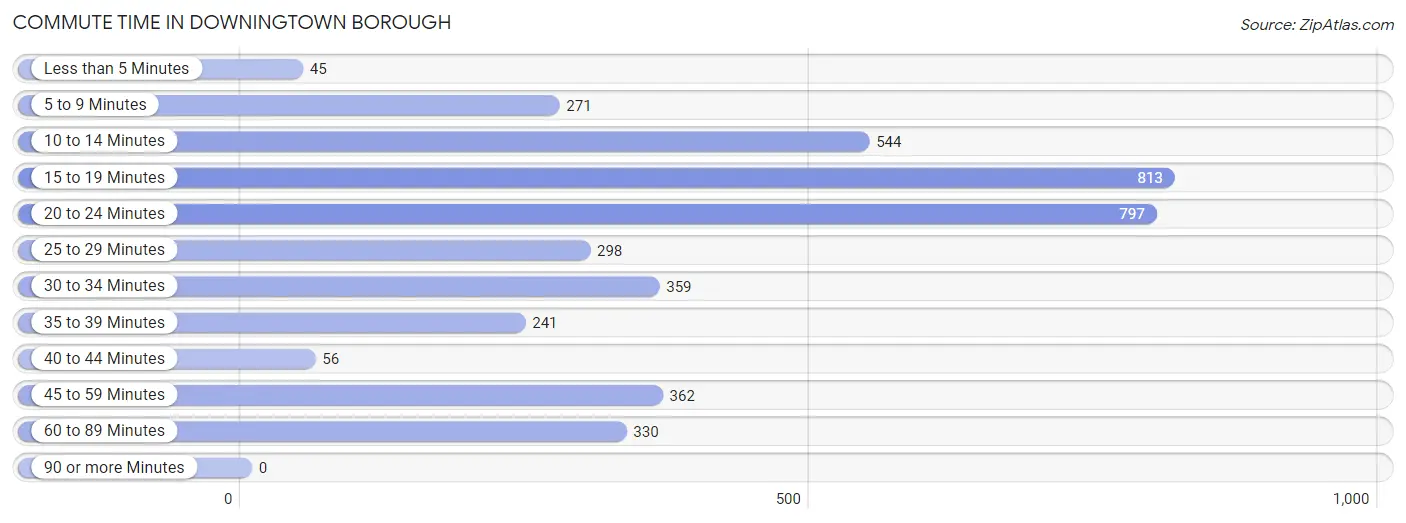
| Commute Time | # Commuters | % Commuters |
| Less than 5 Minutes | 45 | 1.1% |
| 5 to 9 Minutes | 271 | 6.6% |
| 10 to 14 Minutes | 544 | 13.2% |
| 15 to 19 Minutes | 813 | 19.8% |
| 20 to 24 Minutes | 797 | 19.4% |
| 25 to 29 Minutes | 298 | 7.2% |
| 30 to 34 Minutes | 359 | 8.7% |
| 35 to 39 Minutes | 241 | 5.9% |
| 40 to 44 Minutes | 56 | 1.4% |
| 45 to 59 Minutes | 362 | 8.8% |
| 60 to 89 Minutes | 330 | 8.0% |
| 90 or more Minutes | 0 | 0.0% |
Commute Time by Sex in Downingtown borough
The most common commute times in Downingtown borough are 15 to 19 minutes (443 commuters, 22.2%) for males and 20 to 24 minutes (557 commuters, 26.3%) for females.
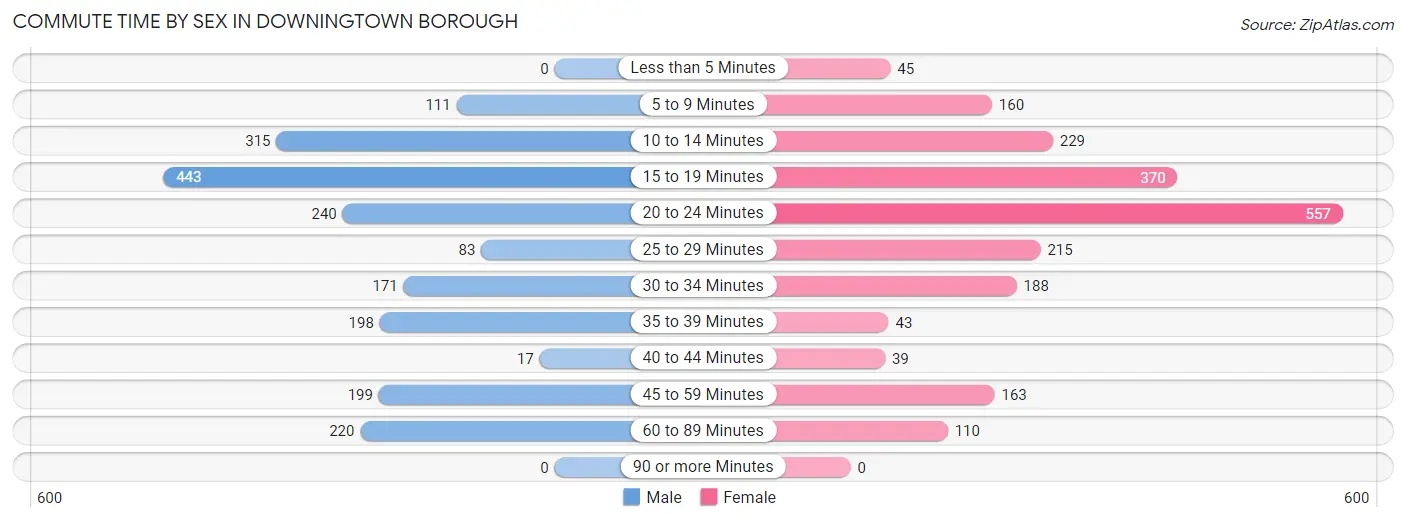
| Commute Time | Male | Female |
| Less than 5 Minutes | 0 (0.0%) | 45 (2.1%) |
| 5 to 9 Minutes | 111 (5.6%) | 160 (7.5%) |
| 10 to 14 Minutes | 315 (15.8%) | 229 (10.8%) |
| 15 to 19 Minutes | 443 (22.2%) | 370 (17.5%) |
| 20 to 24 Minutes | 240 (12.0%) | 557 (26.3%) |
| 25 to 29 Minutes | 83 (4.2%) | 215 (10.2%) |
| 30 to 34 Minutes | 171 (8.6%) | 188 (8.9%) |
| 35 to 39 Minutes | 198 (9.9%) | 43 (2.0%) |
| 40 to 44 Minutes | 17 (0.9%) | 39 (1.8%) |
| 45 to 59 Minutes | 199 (10.0%) | 163 (7.7%) |
| 60 to 89 Minutes | 220 (11.0%) | 110 (5.2%) |
| 90 or more Minutes | 0 (0.0%) | 0 (0.0%) |
Time of Departure to Work by Sex in Downingtown borough
The most frequent times of departure to work in Downingtown borough are 8:00 AM to 8:29 AM (385, 19.3%) for males and 7:30 AM to 7:59 AM (658, 31.0%) for females.
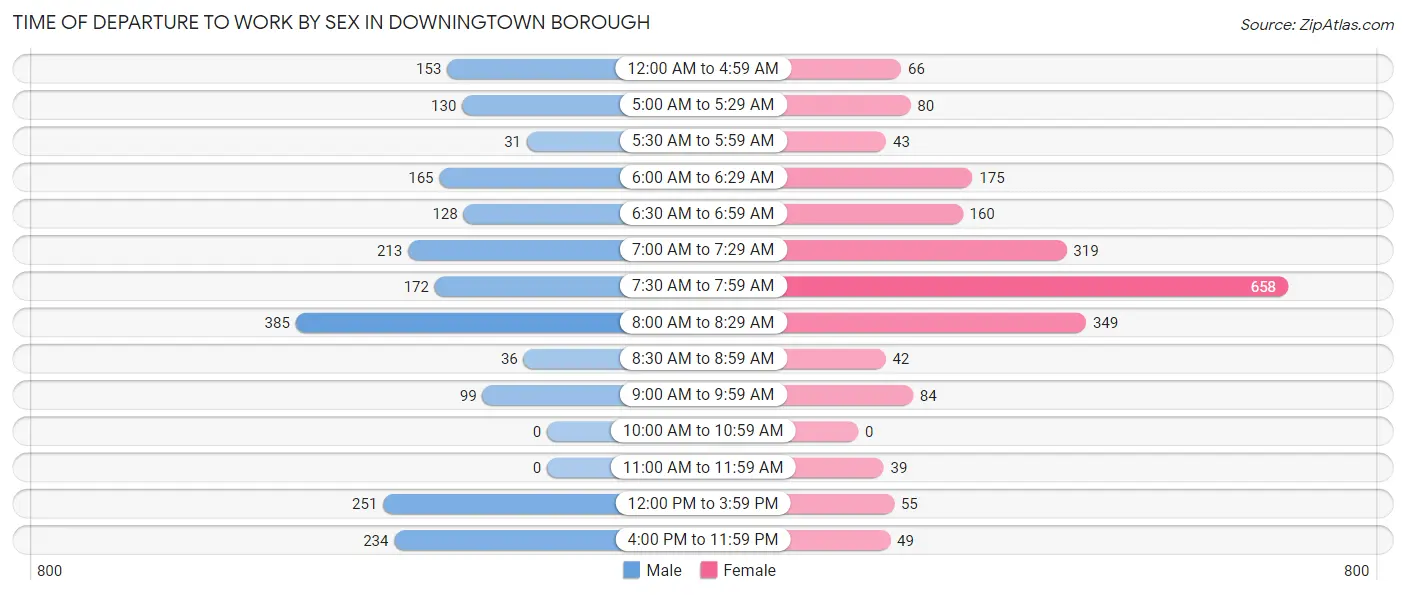
| Time of Departure | Male | Female |
| 12:00 AM to 4:59 AM | 153 (7.7%) | 66 (3.1%) |
| 5:00 AM to 5:29 AM | 130 (6.5%) | 80 (3.8%) |
| 5:30 AM to 5:59 AM | 31 (1.5%) | 43 (2.0%) |
| 6:00 AM to 6:29 AM | 165 (8.3%) | 175 (8.3%) |
| 6:30 AM to 6:59 AM | 128 (6.4%) | 160 (7.5%) |
| 7:00 AM to 7:29 AM | 213 (10.7%) | 319 (15.0%) |
| 7:30 AM to 7:59 AM | 172 (8.6%) | 658 (31.0%) |
| 8:00 AM to 8:29 AM | 385 (19.3%) | 349 (16.5%) |
| 8:30 AM to 8:59 AM | 36 (1.8%) | 42 (2.0%) |
| 9:00 AM to 9:59 AM | 99 (5.0%) | 84 (4.0%) |
| 10:00 AM to 10:59 AM | 0 (0.0%) | 0 (0.0%) |
| 11:00 AM to 11:59 AM | 0 (0.0%) | 39 (1.8%) |
| 12:00 PM to 3:59 PM | 251 (12.6%) | 55 (2.6%) |
| 4:00 PM to 11:59 PM | 234 (11.7%) | 49 (2.3%) |
| Total | 1,997 (100.0%) | 2,119 (100.0%) |
Housing Occupancy in Downingtown borough
Occupancy by Ownership in Downingtown borough
Of the total 3,393 dwellings in Downingtown borough, owner-occupied units account for 1,796 (52.9%), while renter-occupied units make up 1,597 (47.1%).
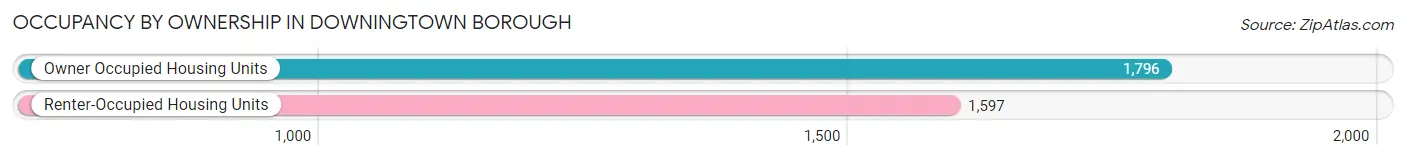
| Occupancy | # Housing Units | % Housing Units |
| Owner Occupied Housing Units | 1,796 | 52.9% |
| Renter-Occupied Housing Units | 1,597 | 47.1% |
| Total Occupied Housing Units | 3,393 | 100.0% |
Occupancy by Household Size in Downingtown borough
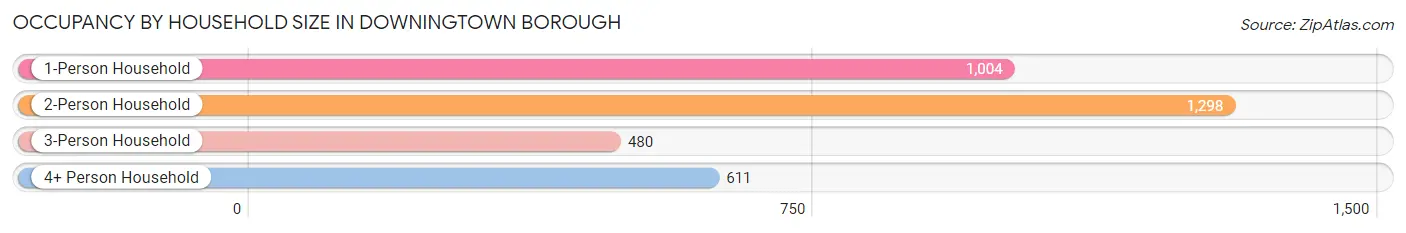
| Household Size | # Housing Units | % Housing Units |
| 1-Person Household | 1,004 | 29.6% |
| 2-Person Household | 1,298 | 38.3% |
| 3-Person Household | 480 | 14.1% |
| 4+ Person Household | 611 | 18.0% |
| Total Housing Units | 3,393 | 100.0% |
Occupancy by Ownership by Household Size in Downingtown borough
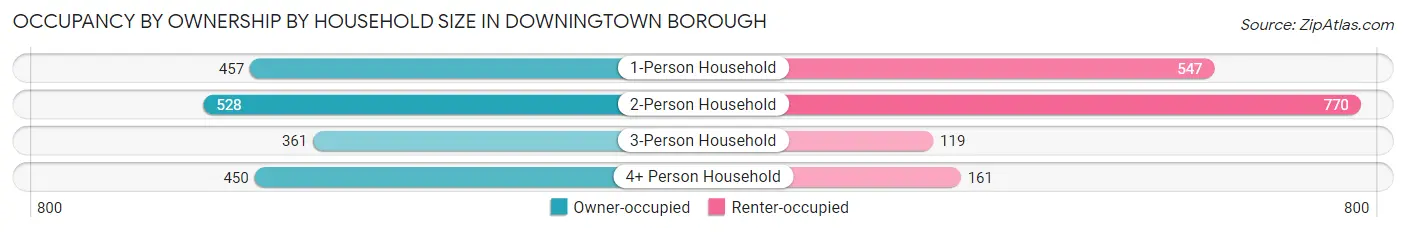
| Household Size | Owner-occupied | Renter-occupied |
| 1-Person Household | 457 (45.5%) | 547 (54.5%) |
| 2-Person Household | 528 (40.7%) | 770 (59.3%) |
| 3-Person Household | 361 (75.2%) | 119 (24.8%) |
| 4+ Person Household | 450 (73.7%) | 161 (26.4%) |
| Total Housing Units | 1,796 (52.9%) | 1,597 (47.1%) |
Occupancy by Educational Attainment in Downingtown borough
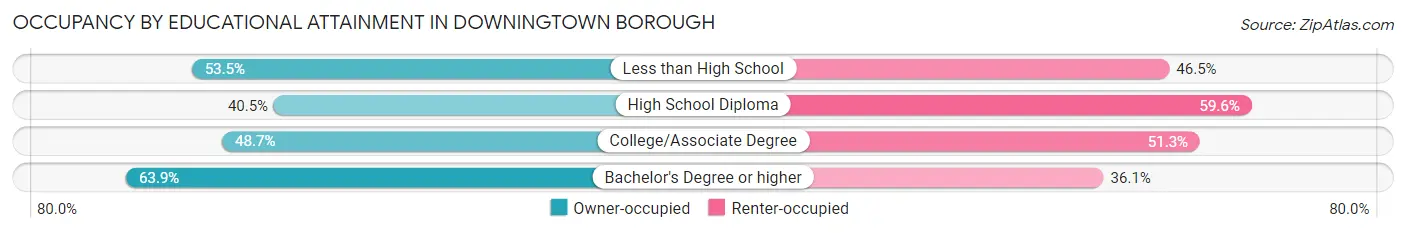
| Household Size | Owner-occupied | Renter-occupied |
| Less than High School | 46 (53.5%) | 40 (46.5%) |
| High School Diploma | 392 (40.5%) | 577 (59.6%) |
| College/Associate Degree | 435 (48.7%) | 459 (51.3%) |
| Bachelor's Degree or higher | 923 (63.9%) | 521 (36.1%) |
Occupancy by Age of Householder in Downingtown borough
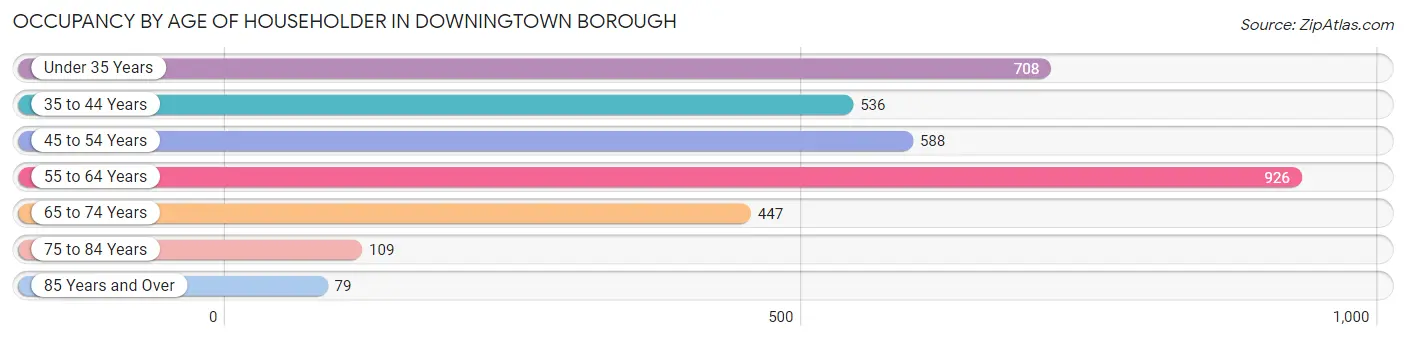
| Age Bracket | # Households | % Households |
| Under 35 Years | 708 | 20.9% |
| 35 to 44 Years | 536 | 15.8% |
| 45 to 54 Years | 588 | 17.3% |
| 55 to 64 Years | 926 | 27.3% |
| 65 to 74 Years | 447 | 13.2% |
| 75 to 84 Years | 109 | 3.2% |
| 85 Years and Over | 79 | 2.3% |
| Total | 3,393 | 100.0% |
Housing Finances in Downingtown borough
Median Income by Occupancy in Downingtown borough
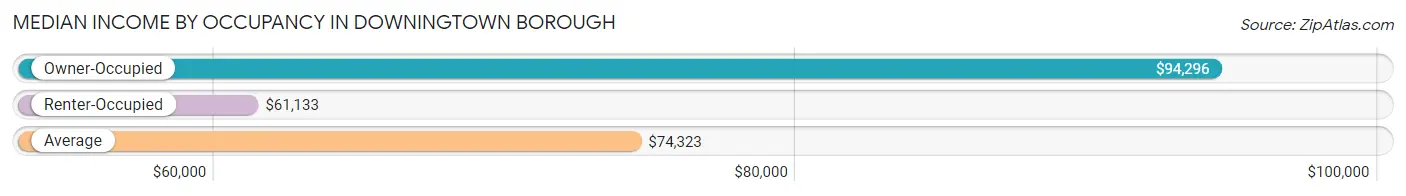
| Occupancy Type | # Households | Median Income |
| Owner-Occupied | 1,796 (52.9%) | $94,296 |
| Renter-Occupied | 1,597 (47.1%) | $61,133 |
| Average | 3,393 (100.0%) | $74,323 |
Occupancy by Householder Income Bracket in Downingtown borough
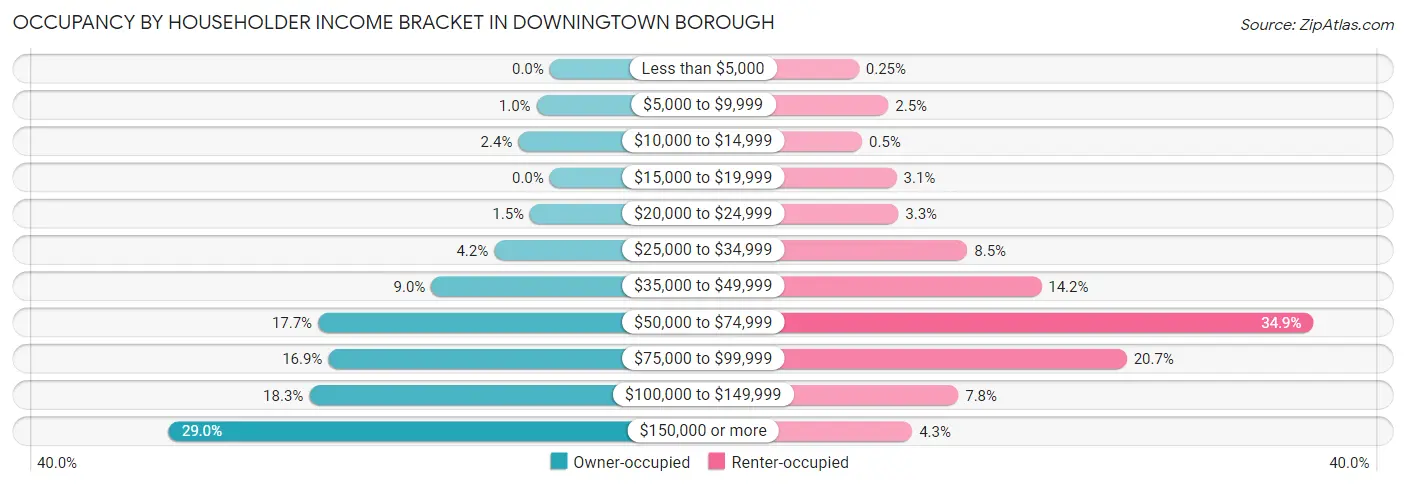
| Income Bracket | Owner-occupied | Renter-occupied |
| Less than $5,000 | 0 (0.0%) | 4 (0.3%) |
| $5,000 to $9,999 | 18 (1.0%) | 40 (2.5%) |
| $10,000 to $14,999 | 43 (2.4%) | 8 (0.5%) |
| $15,000 to $19,999 | 0 (0.0%) | 50 (3.1%) |
| $20,000 to $24,999 | 27 (1.5%) | 52 (3.3%) |
| $25,000 to $34,999 | 76 (4.2%) | 136 (8.5%) |
| $35,000 to $49,999 | 162 (9.0%) | 226 (14.1%) |
| $50,000 to $74,999 | 317 (17.6%) | 557 (34.9%) |
| $75,000 to $99,999 | 303 (16.9%) | 330 (20.7%) |
| $100,000 to $149,999 | 329 (18.3%) | 125 (7.8%) |
| $150,000 or more | 521 (29.0%) | 69 (4.3%) |
| Total | 1,796 (100.0%) | 1,597 (100.0%) |
Monthly Housing Cost Tiers in Downingtown borough
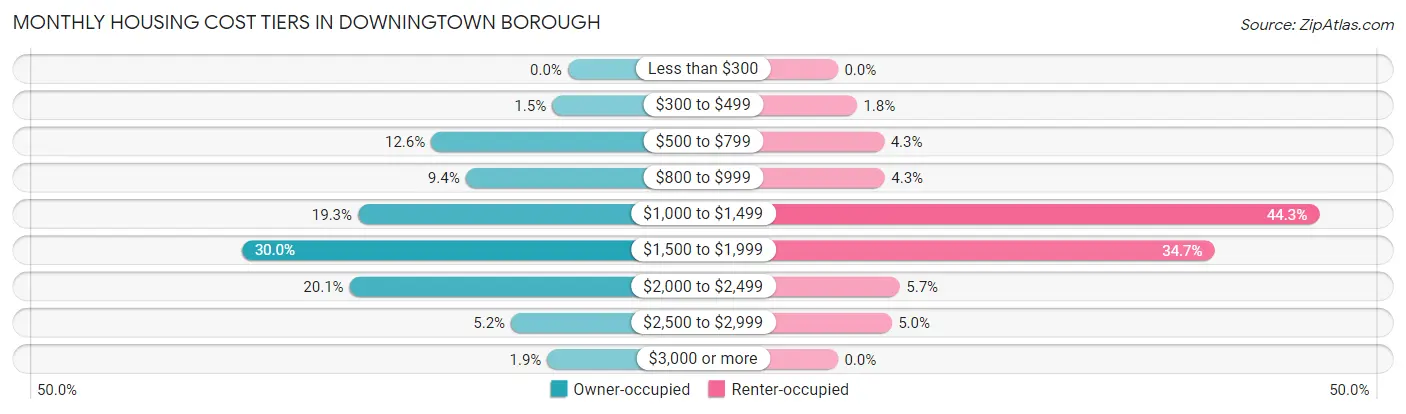
| Monthly Cost | Owner-occupied | Renter-occupied |
| Less than $300 | 0 (0.0%) | 0 (0.0%) |
| $300 to $499 | 26 (1.5%) | 28 (1.8%) |
| $500 to $799 | 226 (12.6%) | 68 (4.3%) |
| $800 to $999 | 169 (9.4%) | 69 (4.3%) |
| $1,000 to $1,499 | 347 (19.3%) | 708 (44.3%) |
| $1,500 to $1,999 | 539 (30.0%) | 554 (34.7%) |
| $2,000 to $2,499 | 361 (20.1%) | 91 (5.7%) |
| $2,500 to $2,999 | 94 (5.2%) | 79 (5.0%) |
| $3,000 or more | 34 (1.9%) | 0 (0.0%) |
| Total | 1,796 (100.0%) | 1,597 (100.0%) |
Physical Housing Characteristics in Downingtown borough
Housing Structures in Downingtown borough
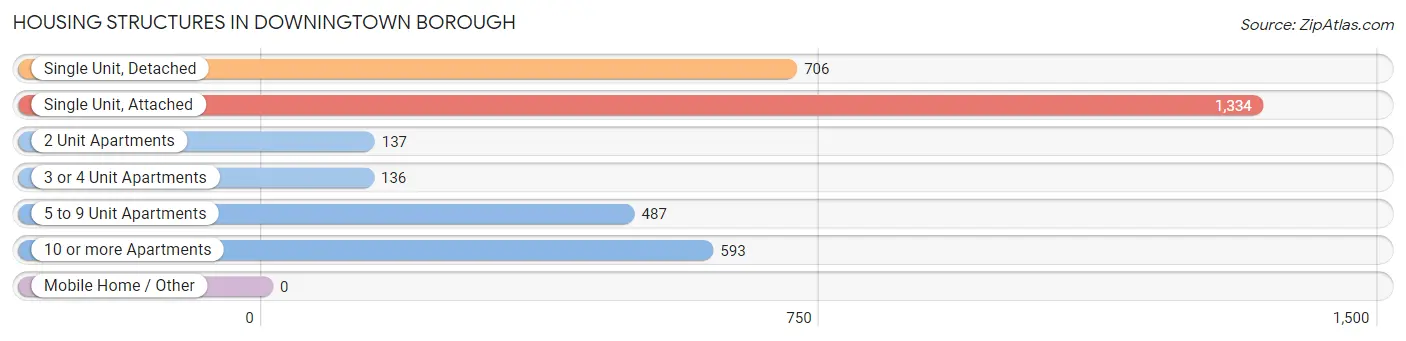
| Structure Type | # Housing Units | % Housing Units |
| Single Unit, Detached | 706 | 20.8% |
| Single Unit, Attached | 1,334 | 39.3% |
| 2 Unit Apartments | 137 | 4.0% |
| 3 or 4 Unit Apartments | 136 | 4.0% |
| 5 to 9 Unit Apartments | 487 | 14.3% |
| 10 or more Apartments | 593 | 17.5% |
| Mobile Home / Other | 0 | 0.0% |
| Total | 3,393 | 100.0% |
Housing Structures by Occupancy in Downingtown borough
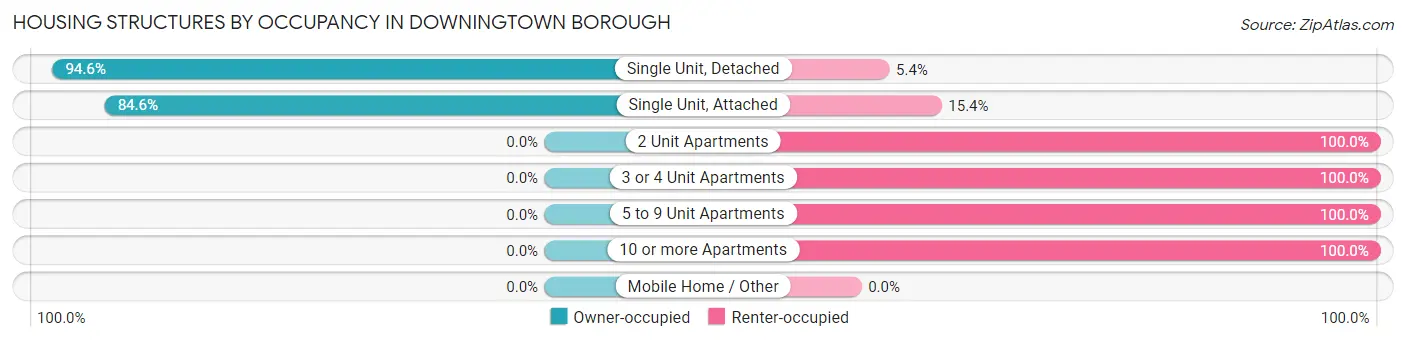
| Structure Type | Owner-occupied | Renter-occupied |
| Single Unit, Detached | 668 (94.6%) | 38 (5.4%) |
| Single Unit, Attached | 1,128 (84.6%) | 206 (15.4%) |
| 2 Unit Apartments | 0 (0.0%) | 137 (100.0%) |
| 3 or 4 Unit Apartments | 0 (0.0%) | 136 (100.0%) |
| 5 to 9 Unit Apartments | 0 (0.0%) | 487 (100.0%) |
| 10 or more Apartments | 0 (0.0%) | 593 (100.0%) |
| Mobile Home / Other | 0 (0.0%) | 0 (0.0%) |
| Total | 1,796 (52.9%) | 1,597 (47.1%) |
Housing Structures by Number of Rooms in Downingtown borough
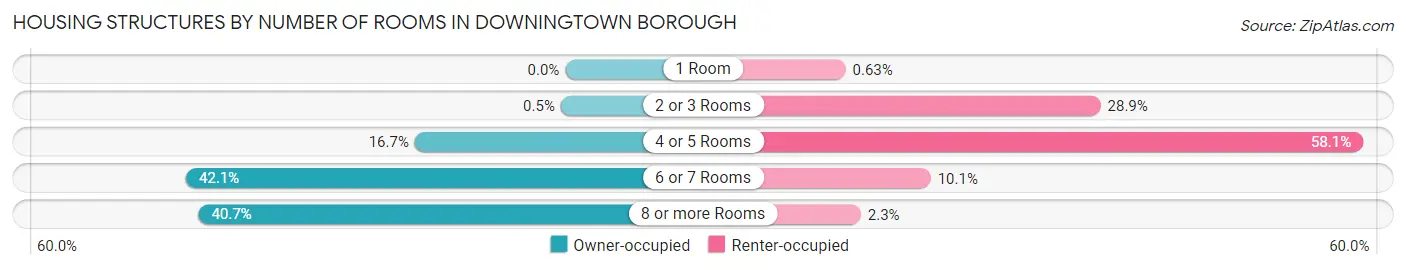
| Number of Rooms | Owner-occupied | Renter-occupied |
| 1 Room | 0 (0.0%) | 10 (0.6%) |
| 2 or 3 Rooms | 9 (0.5%) | 462 (28.9%) |
| 4 or 5 Rooms | 300 (16.7%) | 927 (58.1%) |
| 6 or 7 Rooms | 756 (42.1%) | 161 (10.1%) |
| 8 or more Rooms | 731 (40.7%) | 37 (2.3%) |
| Total | 1,796 (100.0%) | 1,597 (100.0%) |
Housing Structure by Heating Type in Downingtown borough
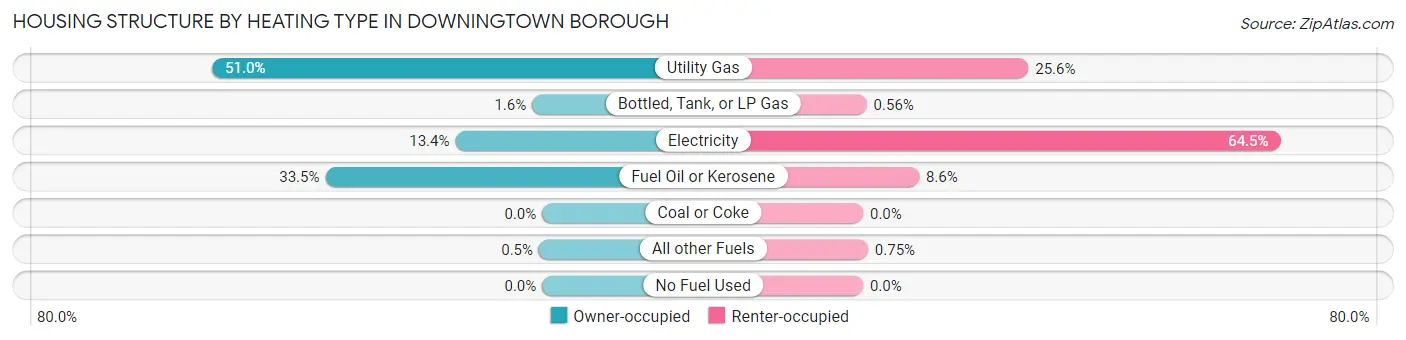
| Heating Type | Owner-occupied | Renter-occupied |
| Utility Gas | 916 (51.0%) | 408 (25.6%) |
| Bottled, Tank, or LP Gas | 28 (1.6%) | 9 (0.6%) |
| Electricity | 241 (13.4%) | 1,030 (64.5%) |
| Fuel Oil or Kerosene | 602 (33.5%) | 138 (8.6%) |
| Coal or Coke | 0 (0.0%) | 0 (0.0%) |
| All other Fuels | 9 (0.5%) | 12 (0.7%) |
| No Fuel Used | 0 (0.0%) | 0 (0.0%) |
| Total | 1,796 (100.0%) | 1,597 (100.0%) |
Household Vehicle Usage in Downingtown borough
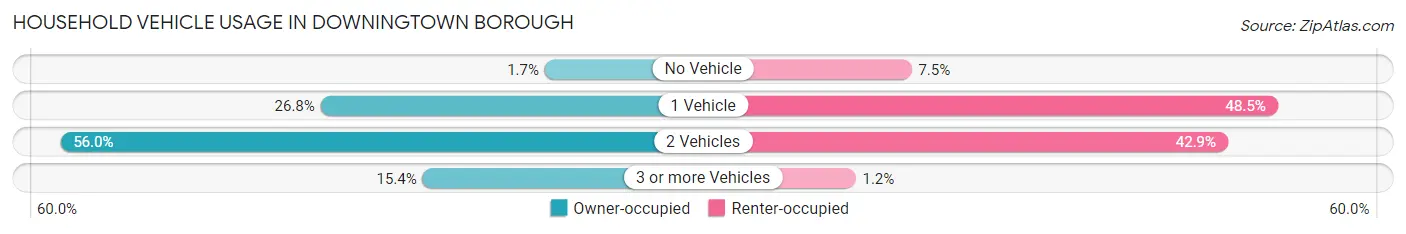
| Vehicles per Household | Owner-occupied | Renter-occupied |
| No Vehicle | 31 (1.7%) | 119 (7.4%) |
| 1 Vehicle | 482 (26.8%) | 774 (48.5%) |
| 2 Vehicles | 1,006 (56.0%) | 685 (42.9%) |
| 3 or more Vehicles | 277 (15.4%) | 19 (1.2%) |
| Total | 1,796 (100.0%) | 1,597 (100.0%) |
Real Estate & Mortgages in Downingtown borough
Real Estate and Mortgage Overview in Downingtown borough
| Characteristic | Without Mortgage | With Mortgage |
| Housing Units | 511 | 1,285 |
| Median Property Value | $351,100 | $282,300 |
| Median Household Income | $66,679 | $443 |
| Monthly Housing Costs | $823 | $34 |
| Real Estate Taxes | $4,572 | $61 |
Property Value by Mortgage Status in Downingtown borough
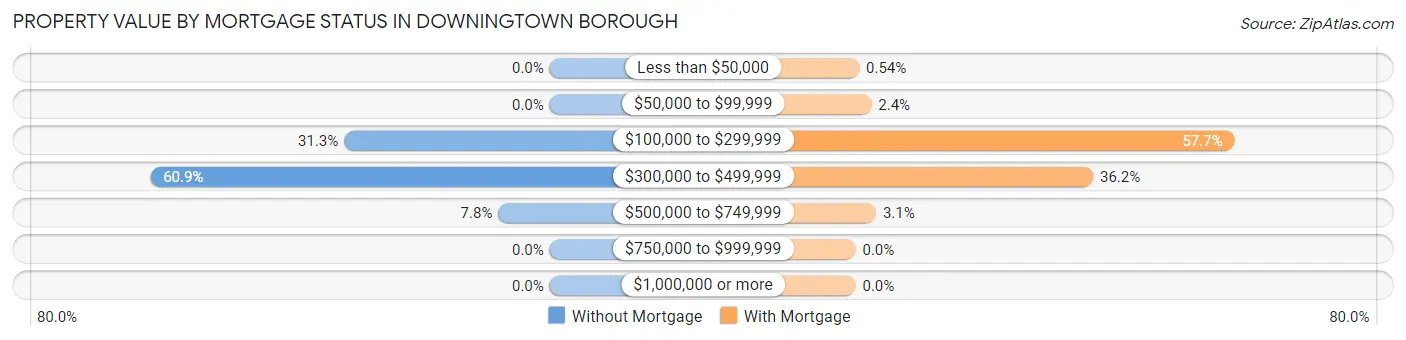
| Property Value | Without Mortgage | With Mortgage |
| Less than $50,000 | 0 (0.0%) | 7 (0.5%) |
| $50,000 to $99,999 | 0 (0.0%) | 31 (2.4%) |
| $100,000 to $299,999 | 160 (31.3%) | 742 (57.7%) |
| $300,000 to $499,999 | 311 (60.9%) | 465 (36.2%) |
| $500,000 to $749,999 | 40 (7.8%) | 40 (3.1%) |
| $750,000 to $999,999 | 0 (0.0%) | 0 (0.0%) |
| $1,000,000 or more | 0 (0.0%) | 0 (0.0%) |
| Total | 511 (100.0%) | 1,285 (100.0%) |
Household Income by Mortgage Status in Downingtown borough
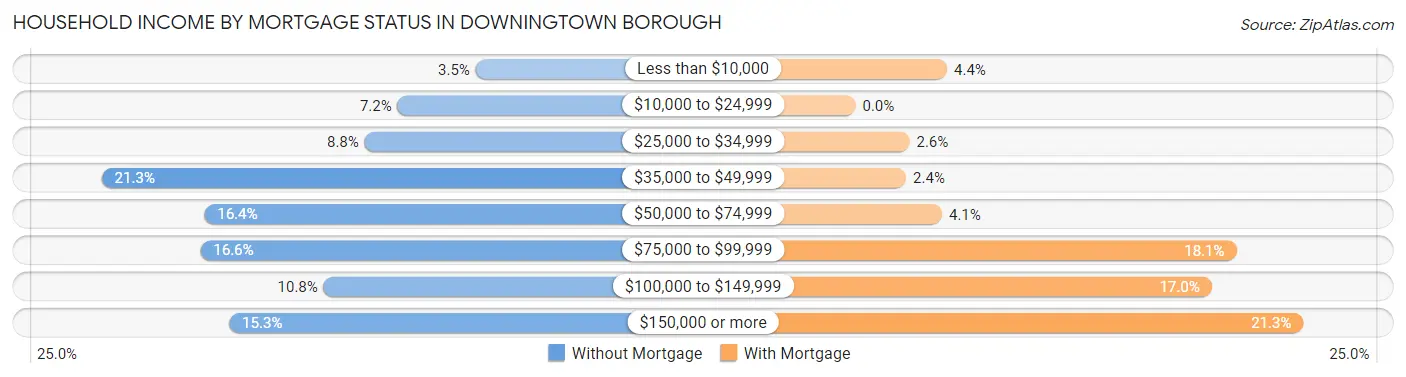
| Household Income | Without Mortgage | With Mortgage |
| Less than $10,000 | 18 (3.5%) | 56 (4.4%) |
| $10,000 to $24,999 | 37 (7.2%) | 0 (0.0%) |
| $25,000 to $34,999 | 45 (8.8%) | 33 (2.6%) |
| $35,000 to $49,999 | 109 (21.3%) | 31 (2.4%) |
| $50,000 to $74,999 | 84 (16.4%) | 53 (4.1%) |
| $75,000 to $99,999 | 85 (16.6%) | 233 (18.1%) |
| $100,000 to $149,999 | 55 (10.8%) | 218 (17.0%) |
| $150,000 or more | 78 (15.3%) | 274 (21.3%) |
| Total | 511 (100.0%) | 1,285 (100.0%) |
Property Value to Household Income Ratio in Downingtown borough
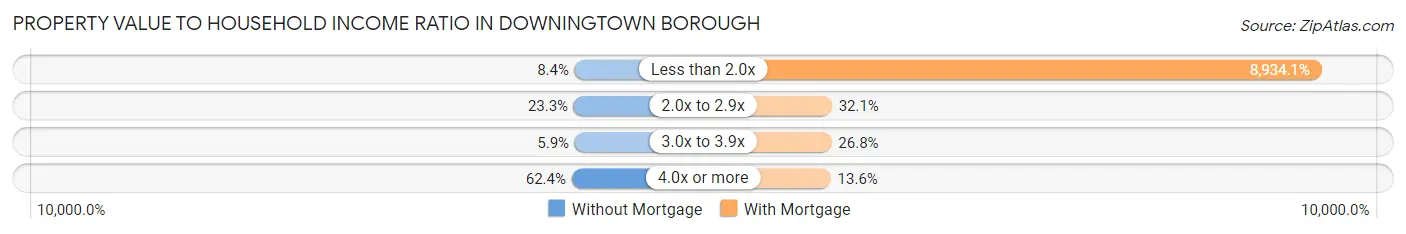
| Value-to-Income Ratio | Without Mortgage | With Mortgage |
| Less than 2.0x | 43 (8.4%) | 114,803 (8,934.1%) |
| 2.0x to 2.9x | 119 (23.3%) | 412 (32.1%) |
| 3.0x to 3.9x | 30 (5.9%) | 344 (26.8%) |
| 4.0x or more | 319 (62.4%) | 175 (13.6%) |
| Total | 511 (100.0%) | 1,285 (100.0%) |
Real Estate Taxes by Mortgage Status in Downingtown borough
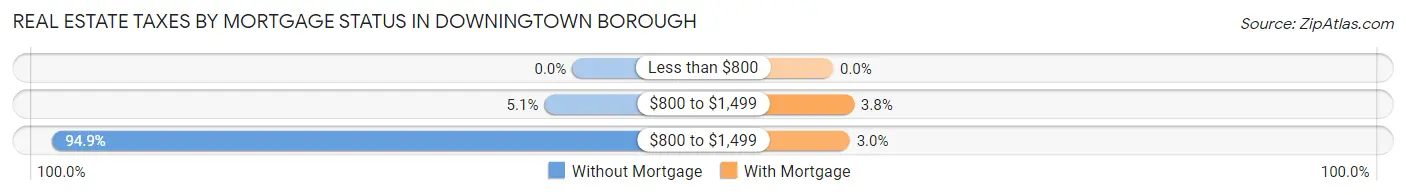
| Property Taxes | Without Mortgage | With Mortgage |
| Less than $800 | 0 (0.0%) | 0 (0.0%) |
| $800 to $1,499 | 26 (5.1%) | 49 (3.8%) |
| $800 to $1,499 | 485 (94.9%) | 39 (3.0%) |
| Total | 511 (100.0%) | 1,285 (100.0%) |
Health & Disability in Downingtown borough
Health Insurance Coverage by Age in Downingtown borough
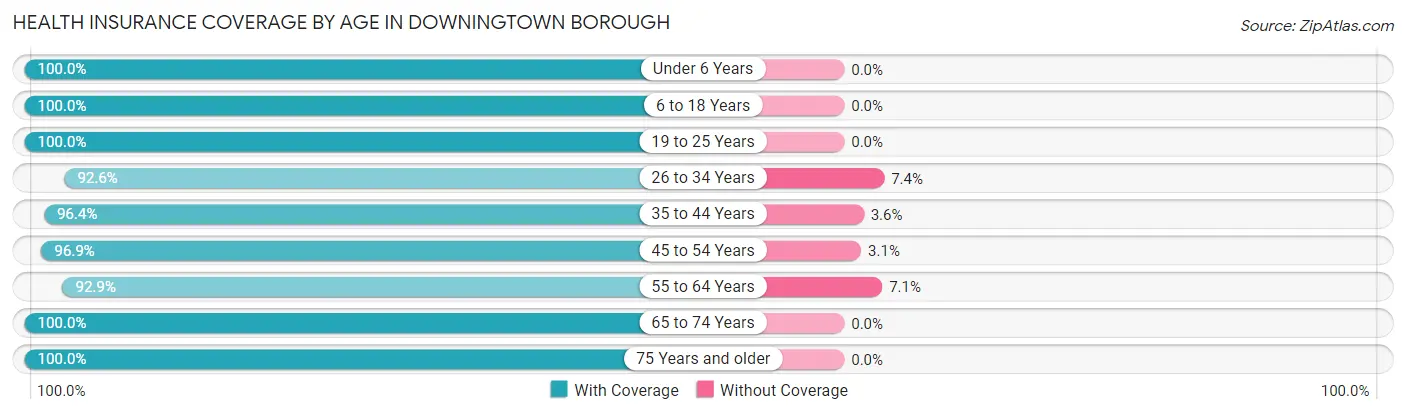
| Age Bracket | With Coverage | Without Coverage |
| Under 6 Years | 507 (100.0%) | 0 (0.0%) |
| 6 to 18 Years | 1,061 (100.0%) | 0 (0.0%) |
| 19 to 25 Years | 647 (100.0%) | 0 (0.0%) |
| 26 to 34 Years | 1,231 (92.6%) | 99 (7.4%) |
| 35 to 44 Years | 1,253 (96.4%) | 47 (3.6%) |
| 45 to 54 Years | 895 (96.9%) | 29 (3.1%) |
| 55 to 64 Years | 1,168 (92.9%) | 89 (7.1%) |
| 65 to 74 Years | 656 (100.0%) | 0 (0.0%) |
| 75 Years and older | 273 (100.0%) | 0 (0.0%) |
| Total | 7,691 (96.7%) | 264 (3.3%) |
Health Insurance Coverage by Citizenship Status in Downingtown borough
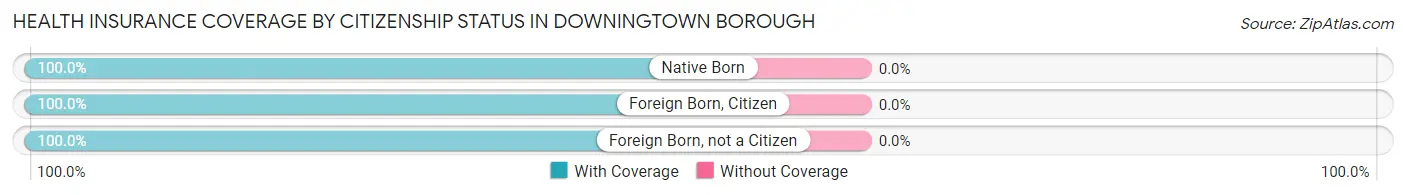
| Citizenship Status | With Coverage | Without Coverage |
| Native Born | 507 (100.0%) | 0 (0.0%) |
| Foreign Born, Citizen | 1,061 (100.0%) | 0 (0.0%) |
| Foreign Born, not a Citizen | 647 (100.0%) | 0 (0.0%) |
Health Insurance Coverage by Household Income in Downingtown borough
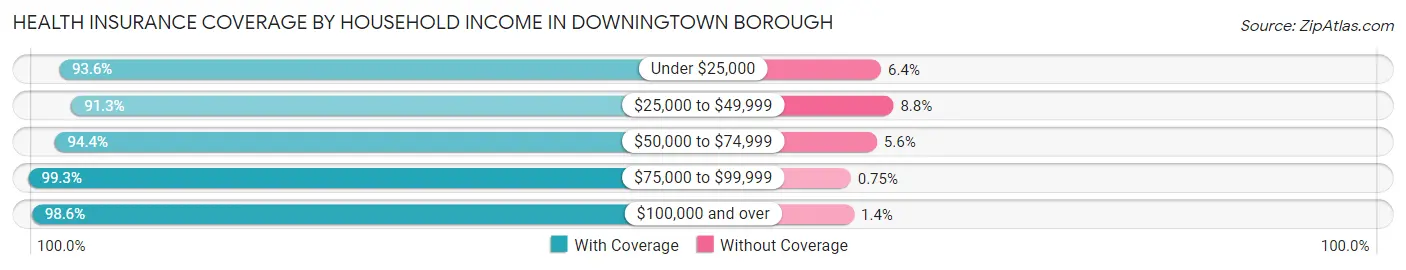
| Household Income | With Coverage | Without Coverage |
| Under $25,000 | 363 (93.6%) | 25 (6.4%) |
| $25,000 to $49,999 | 834 (91.2%) | 80 (8.7%) |
| $50,000 to $74,999 | 1,724 (94.4%) | 103 (5.6%) |
| $75,000 to $99,999 | 1,456 (99.3%) | 11 (0.7%) |
| $100,000 and over | 3,230 (98.6%) | 45 (1.4%) |
Public vs Private Health Insurance Coverage by Age in Downingtown borough
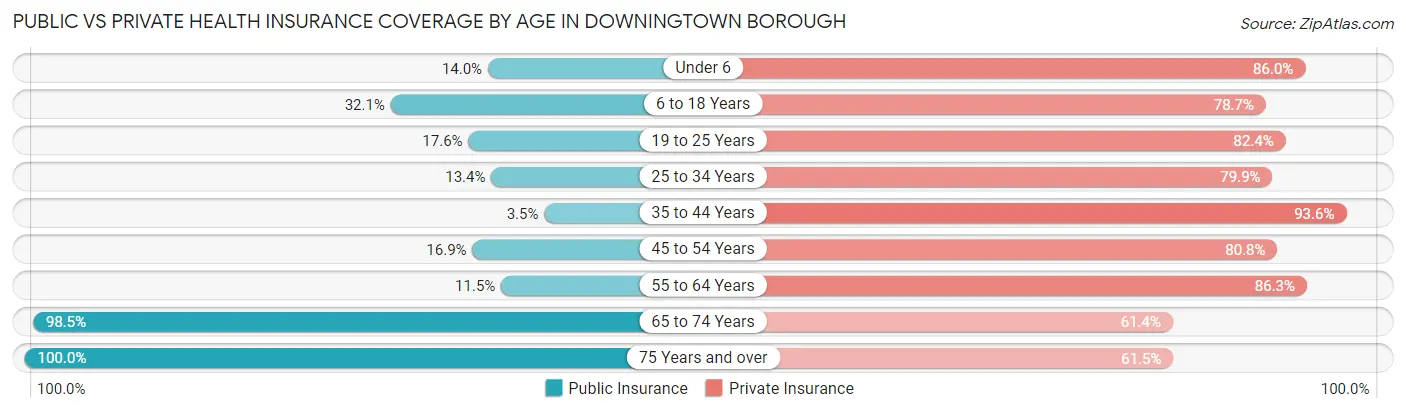
| Age Bracket | Public Insurance | Private Insurance |
| Under 6 | 71 (14.0%) | 436 (86.0%) |
| 6 to 18 Years | 340 (32.1%) | 835 (78.7%) |
| 19 to 25 Years | 114 (17.6%) | 533 (82.4%) |
| 25 to 34 Years | 178 (13.4%) | 1,063 (79.9%) |
| 35 to 44 Years | 46 (3.5%) | 1,217 (93.6%) |
| 45 to 54 Years | 156 (16.9%) | 747 (80.8%) |
| 55 to 64 Years | 145 (11.5%) | 1,085 (86.3%) |
| 65 to 74 Years | 646 (98.5%) | 403 (61.4%) |
| 75 Years and over | 273 (100.0%) | 168 (61.5%) |
| Total | 1,969 (24.7%) | 6,487 (81.6%) |
Disability Status by Sex by Age in Downingtown borough
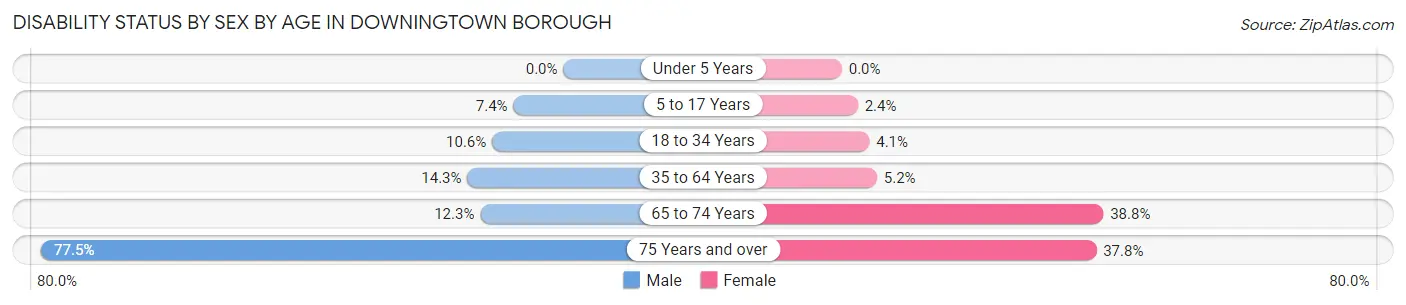
| Age Bracket | Male | Female |
| Under 5 Years | 0 (0.0%) | 0 (0.0%) |
| 5 to 17 Years | 45 (7.4%) | 12 (2.4%) |
| 18 to 34 Years | 102 (10.6%) | 43 (4.1%) |
| 35 to 64 Years | 217 (14.2%) | 102 (5.2%) |
| 65 to 74 Years | 39 (12.3%) | 132 (38.8%) |
| 75 Years and over | 107 (77.5%) | 51 (37.8%) |
Disability Class by Sex by Age in Downingtown borough
Disability Class: Hearing Difficulty
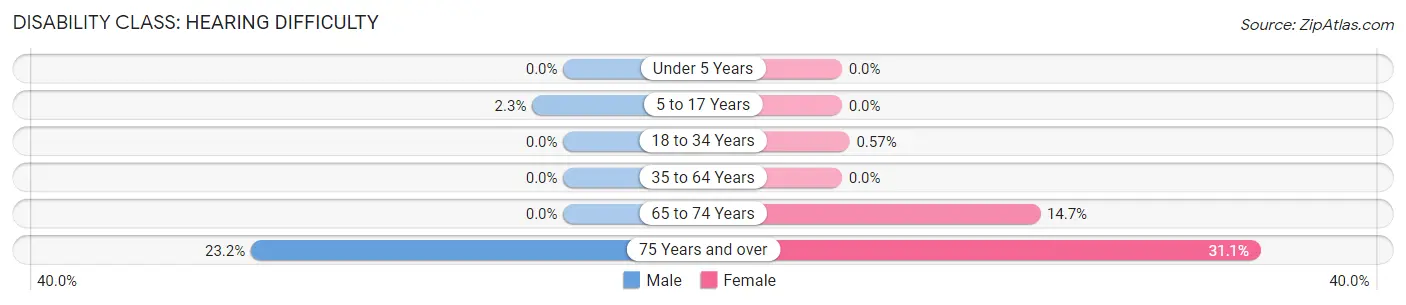
| Age Bracket | Male | Female |
| Under 5 Years | 0 (0.0%) | 0 (0.0%) |
| 5 to 17 Years | 14 (2.3%) | 0 (0.0%) |
| 18 to 34 Years | 0 (0.0%) | 6 (0.6%) |
| 35 to 64 Years | 0 (0.0%) | 0 (0.0%) |
| 65 to 74 Years | 0 (0.0%) | 50 (14.7%) |
| 75 Years and over | 32 (23.2%) | 42 (31.1%) |
Disability Class: Vision Difficulty
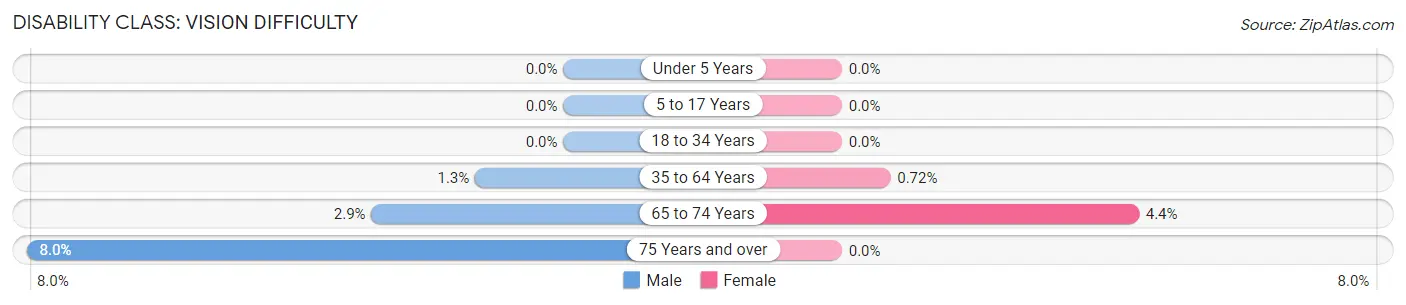
| Age Bracket | Male | Female |
| Under 5 Years | 0 (0.0%) | 0 (0.0%) |
| 5 to 17 Years | 0 (0.0%) | 0 (0.0%) |
| 18 to 34 Years | 0 (0.0%) | 0 (0.0%) |
| 35 to 64 Years | 20 (1.3%) | 14 (0.7%) |
| 65 to 74 Years | 9 (2.9%) | 15 (4.4%) |
| 75 Years and over | 11 (8.0%) | 0 (0.0%) |
Disability Class: Cognitive Difficulty
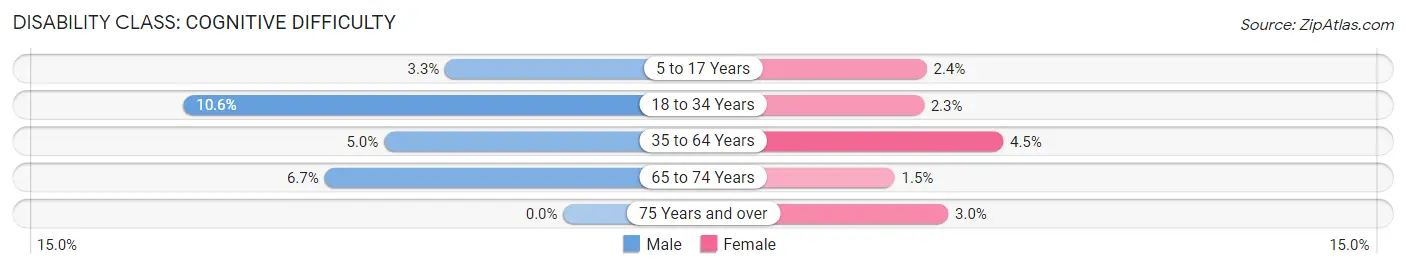
| Age Bracket | Male | Female |
| 5 to 17 Years | 20 (3.3%) | 12 (2.4%) |
| 18 to 34 Years | 102 (10.6%) | 24 (2.3%) |
| 35 to 64 Years | 76 (5.0%) | 88 (4.5%) |
| 65 to 74 Years | 21 (6.7%) | 5 (1.5%) |
| 75 Years and over | 0 (0.0%) | 4 (3.0%) |
Disability Class: Ambulatory Difficulty
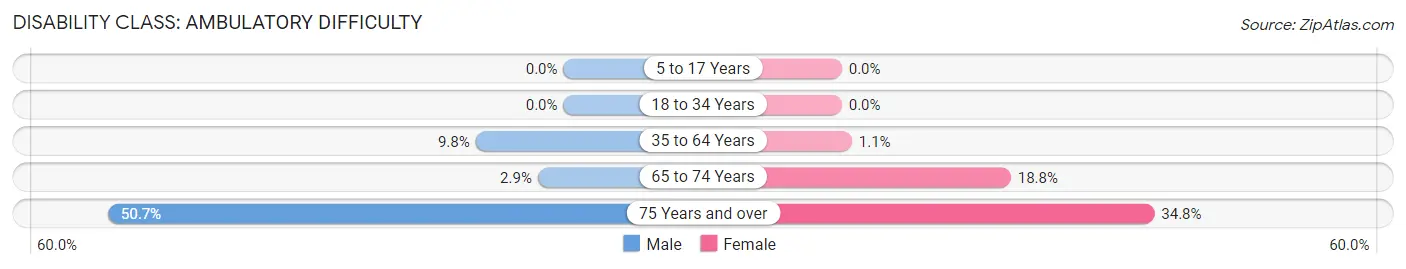
| Age Bracket | Male | Female |
| 5 to 17 Years | 0 (0.0%) | 0 (0.0%) |
| 18 to 34 Years | 0 (0.0%) | 0 (0.0%) |
| 35 to 64 Years | 149 (9.8%) | 22 (1.1%) |
| 65 to 74 Years | 9 (2.9%) | 64 (18.8%) |
| 75 Years and over | 70 (50.7%) | 47 (34.8%) |
Disability Class: Self-Care Difficulty
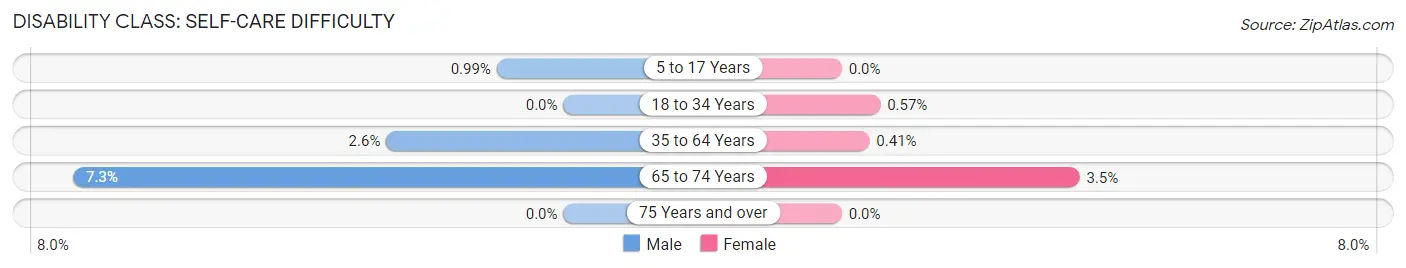
| Age Bracket | Male | Female |
| 5 to 17 Years | 6 (1.0%) | 0 (0.0%) |
| 18 to 34 Years | 0 (0.0%) | 6 (0.6%) |
| 35 to 64 Years | 40 (2.6%) | 8 (0.4%) |
| 65 to 74 Years | 23 (7.3%) | 12 (3.5%) |
| 75 Years and over | 0 (0.0%) | 0 (0.0%) |
Technology Access in Downingtown borough
Computing Device Access in Downingtown borough
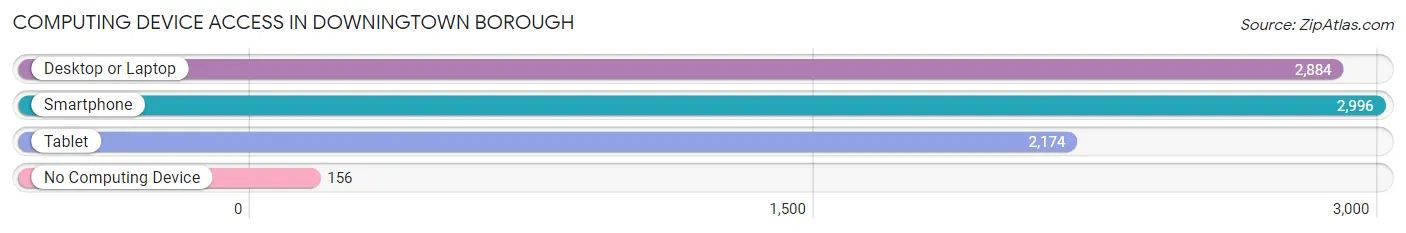
| Device Type | # Households | % Households |
| Desktop or Laptop | 2,884 | 85.0% |
| Smartphone | 2,996 | 88.3% |
| Tablet | 2,174 | 64.1% |
| No Computing Device | 156 | 4.6% |
| Total | 3,393 | 100.0% |
Internet Access in Downingtown borough
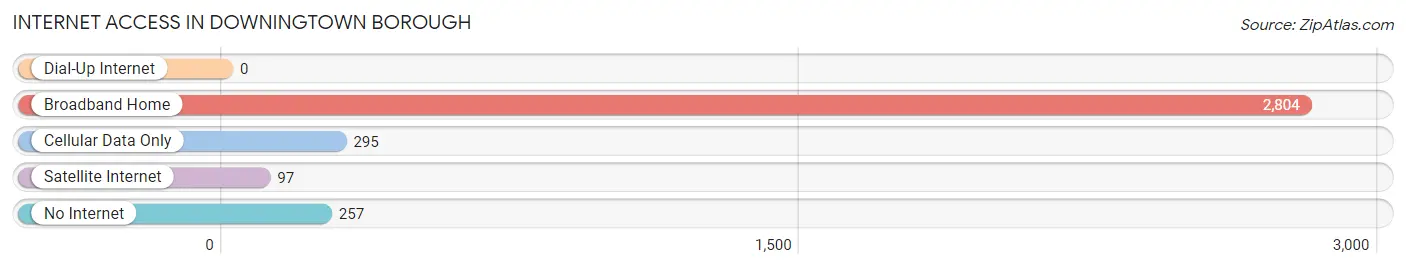
| Internet Type | # Households | % Households |
| Dial-Up Internet | 0 | 0.0% |
| Broadband Home | 2,804 | 82.6% |
| Cellular Data Only | 295 | 8.7% |
| Satellite Internet | 97 | 2.9% |
| No Internet | 257 | 7.6% |
| Total | 3,393 | 100.0% |
Downingtown borough Summary
Downingtown Borough is a borough located in Chester County, Pennsylvania, United States. The population was 7,891 at the 2010 census. Downingtown is located in the heart of Chester County, approximately 33 miles west of Philadelphia and 20 miles east of Lancaster. It is part of the Philadelphia metropolitan area and is considered a suburb of Philadelphia.
History
Downingtown was founded in 1717 by William Penn's son Thomas Penn. The town was named after Thomas' friend and political ally, Sir George Downing. The town was originally a farming community, but it quickly grew into a bustling industrial center. The town was home to several mills, including a paper mill, a grist mill, and a saw mill. The town also had a tannery, a brewery, and a distillery.
In the late 19th century, the town began to experience a period of growth and development. The Pennsylvania Railroad opened a station in Downingtown in 1871, which helped to spur the growth of the town. The town was incorporated as a borough in 1885.
Geography
Downingtown is located at 40°2′2″N 75°45′17″W (40.033462, -75.754717). According to the United States Census Bureau, the borough has a total area of 1.7 square miles (4.4 km2), all of it land.
Economy
Downingtown is home to several large employers, including the Downingtown Area School District, the Downingtown Area Public Library, and the Downingtown Area Senior Center. The borough is also home to several small businesses, including restaurants, retail stores, and professional services.
Demographics
As of the 2010 census, there were 7,891 people, 3,093 households, and 2,072 families residing in the borough. The population density was 4,619.3 people per square mile (1,783.2/km2). There were 3,309 housing units at an average density of 1,945.3 per square mile (750.2/km2). The racial makeup of the borough was 87.2% White, 5.3% African American, 0.2% Native American, 4.2% Asian, 0.7% from other races, and 2.4% from two or more races. Hispanic or Latino of any race were 3.2% of the population.
There were 3,093 households, out of which 33.2% had children under the age of 18 living with them, 51.2% were married couples living together, 11.7% had a female householder with no husband present, and 32.2% were non-families. 26.2% of all households were made up of individuals, and 9.2% had someone living alone who was 65 years of age or older. The average household size was 2.55 and the average family size was 3.12.
In the borough, the population was spread out, with 25.2% under the age of 18, 7.2% from 18 to 24, 33.2% from 25 to 44, 21.7% from 45 to 64, and 12.7% who were 65 years of age or older. The median age was 36 years. For every 100 females, there were 94.2 males. For every 100 females age 18 and over, there were 91.2 males.
The median income for a household in the borough was $60,945, and the median income for a family was $71,912. Males had a median income of $50,917 versus $37,917 for females. The per capita income for the borough was $27,945. About 3.2% of families and 4.7% of the population were below the poverty line, including 5.2% of those under age 18 and 4.2% of those age 65 or over.
Common Questions
What is Per Capita Income in Downingtown borough?
Per Capita income in Downingtown borough is $41,247.
What is the Median Family Income in Downingtown borough?
Median Family Income in Downingtown borough is $89,072.
What is the Median Household income in Downingtown borough?
Median Household Income in Downingtown borough is $74,323.
What is Income or Wage Gap in Downingtown borough?
Income or Wage Gap in Downingtown borough is 8.4%.
Women in Downingtown borough earn 91.6 cents for every dollar earned by a man.
What is Family Income Deficit in Downingtown borough?
Family Income Deficit in Downingtown borough is $8,579.
Families that are below poverty line in Downingtown borough earn $8,579 less on average than the poverty threshold level.
What is Inequality or Gini Index in Downingtown borough?
Inequality or Gini Index in Downingtown borough is 0.37.
What is the Total Population of Downingtown borough?
Total Population of Downingtown borough is 8,088.
What is the Total Male Population of Downingtown borough?
Total Male Population of Downingtown borough is 3,772.
What is the Total Female Population of Downingtown borough?
Total Female Population of Downingtown borough is 4,316.
What is the Ratio of Males per 100 Females in Downingtown borough?
There are 87.40 Males per 100 Females in Downingtown borough.
What is the Ratio of Females per 100 Males in Downingtown borough?
There are 114.42 Females per 100 Males in Downingtown borough.
What is the Median Population Age in Downingtown borough?
Median Population Age in Downingtown borough is 38.9 Years.
What is the Average Family Size in Downingtown borough
Average Family Size in Downingtown borough is 2.9 People.
What is the Average Household Size in Downingtown borough
Average Household Size in Downingtown borough is 2.3 People.
How Large is the Labor Force in Downingtown borough?
There are 5,144 People in the Labor Forcein in Downingtown borough.
What is the Percentage of People in the Labor Force in Downingtown borough?
75.7% of People are in the Labor Force in Downingtown borough.
What is the Unemployment Rate in Downingtown borough?
Unemployment Rate in Downingtown borough is 4.1%.