Dunmore borough, PA Map & Demographics
Dunmore borough Overview
$36,107
PER CAPITA INCOME
$89,276
AVG FAMILY INCOME
$72,821
AVG HOUSEHOLD INCOME
23.8%
WAGE / INCOME GAP [ % ]
76.2¢/ $1
WAGE / INCOME GAP [ $ ]
0.40
INEQUALITY / GINI INDEX
14,082
TOTAL POPULATION
6,836
MALE POPULATION
7,246
FEMALE POPULATION
94.34
MALES / 100 FEMALES
106.00
FEMALES / 100 MALES
40.1
MEDIAN AGE
3.0
AVG FAMILY SIZE
2.2
AVG HOUSEHOLD SIZE
7,261
LABOR FORCE [ PEOPLE ]
62.2%
PERCENT IN LABOR FORCE
4.8%
UNEMPLOYMENT RATE
Income in Dunmore borough
Income Overview in Dunmore borough
Per Capita Income in Dunmore borough is $36,107, while median incomes of families and households are $89,276 and $72,821 respectively.
| Characteristic | Number | Measure |
| Per Capita Income | 14,082 | $36,107 |
| Median Family Income | 3,264 | $89,276 |
| Mean Family Income | 3,264 | $102,957 |
| Median Household Income | 5,885 | $72,821 |
| Mean Household Income | 5,885 | $85,151 |
| Income Deficit | 3,264 | $0 |
| Wage / Income Gap (%) | 14,082 | 23.84% |
| Wage / Income Gap ($) | 14,082 | 76.16¢ per $1 |
| Gini / Inequality Index | 14,082 | 0.40 |
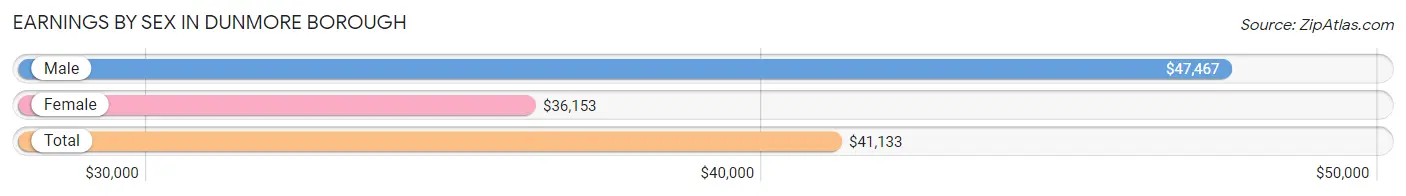
Earnings by Sex in Dunmore borough
Average Earnings in Dunmore borough are $41,133, $47,467 for men and $36,153 for women, a difference of 23.8%.
| Sex | Number | Average Earnings |
| Male | 4,282 (55.1%) | $47,467 |
| Female | 3,491 (44.9%) | $36,153 |
| Total | 7,773 (100.0%) | $41,133 |
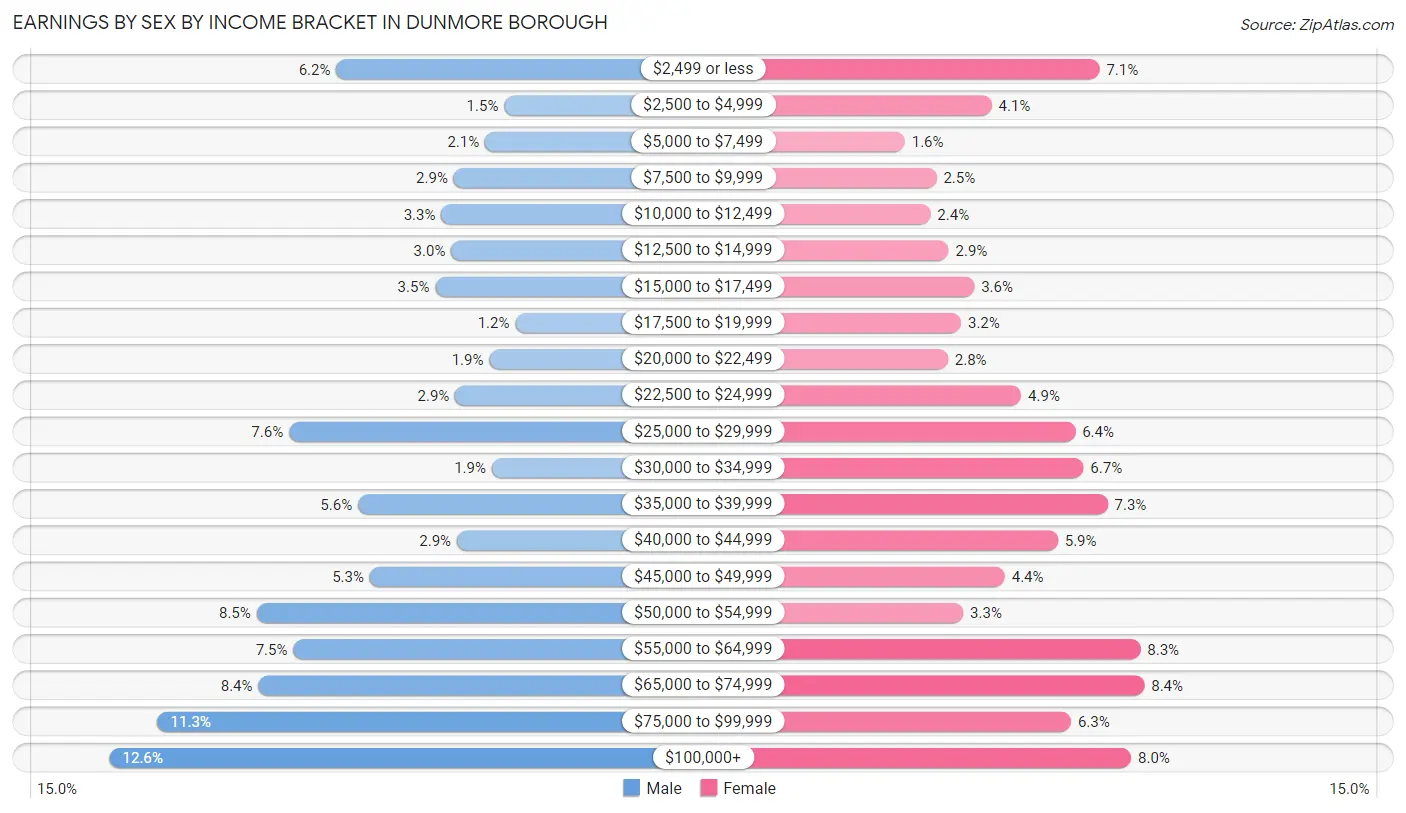
Earnings by Sex by Income Bracket in Dunmore borough
The most common earnings brackets in Dunmore borough are $100,000+ for men (540 | 12.6%) and $65,000 to $74,999 for women (292 | 8.4%).
| Income | Male | Female |
| $2,499 or less | 267 (6.2%) | 248 (7.1%) |
| $2,500 to $4,999 | 65 (1.5%) | 142 (4.1%) |
| $5,000 to $7,499 | 88 (2.1%) | 57 (1.6%) |
| $7,500 to $9,999 | 126 (2.9%) | 88 (2.5%) |
| $10,000 to $12,499 | 141 (3.3%) | 82 (2.4%) |
| $12,500 to $14,999 | 129 (3.0%) | 100 (2.9%) |
| $15,000 to $17,499 | 148 (3.5%) | 125 (3.6%) |
| $17,500 to $19,999 | 52 (1.2%) | 112 (3.2%) |
| $20,000 to $22,499 | 83 (1.9%) | 99 (2.8%) |
| $22,500 to $24,999 | 124 (2.9%) | 171 (4.9%) |
| $25,000 to $29,999 | 324 (7.6%) | 224 (6.4%) |
| $30,000 to $34,999 | 80 (1.9%) | 232 (6.7%) |
| $35,000 to $39,999 | 241 (5.6%) | 256 (7.3%) |
| $40,000 to $44,999 | 122 (2.9%) | 207 (5.9%) |
| $45,000 to $49,999 | 227 (5.3%) | 155 (4.4%) |
| $50,000 to $54,999 | 363 (8.5%) | 114 (3.3%) |
| $55,000 to $64,999 | 319 (7.4%) | 288 (8.3%) |
| $65,000 to $74,999 | 361 (8.4%) | 292 (8.4%) |
| $75,000 to $99,999 | 482 (11.3%) | 220 (6.3%) |
| $100,000+ | 540 (12.6%) | 279 (8.0%) |
| Total | 4,282 (100.0%) | 3,491 (100.0%) |
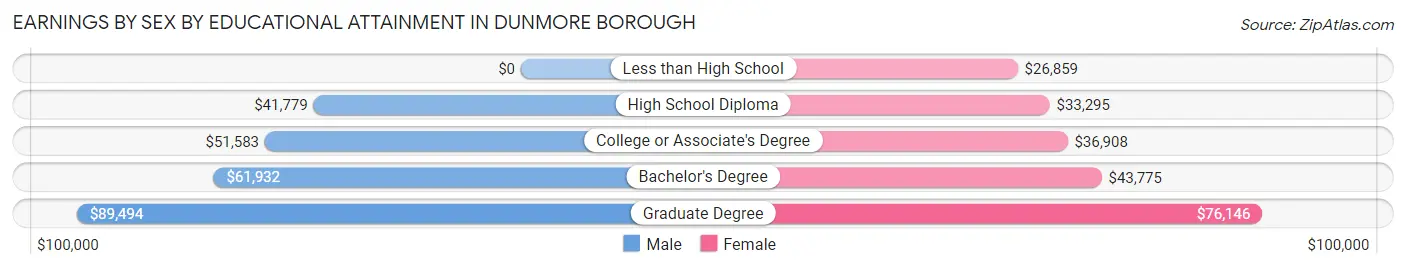
Earnings by Sex by Educational Attainment in Dunmore borough
Average earnings in Dunmore borough are $52,931 for men and $40,377 for women, a difference of 23.7%. Men with an educational attainment of graduate degree enjoy the highest average annual earnings of $89,494, while those with high school diploma education earn the least with $41,779. Women with an educational attainment of graduate degree earn the most with the average annual earnings of $76,146, while those with less than high school education have the smallest earnings of $26,859.
| Educational Attainment | Male Income | Female Income |
| Less than High School | - | - |
| High School Diploma | $41,779 | $33,295 |
| College or Associate's Degree | $51,583 | $36,908 |
| Bachelor's Degree | $61,932 | $43,775 |
| Graduate Degree | $89,494 | $76,146 |
| Total | $52,931 | $40,377 |
Family Income in Dunmore borough
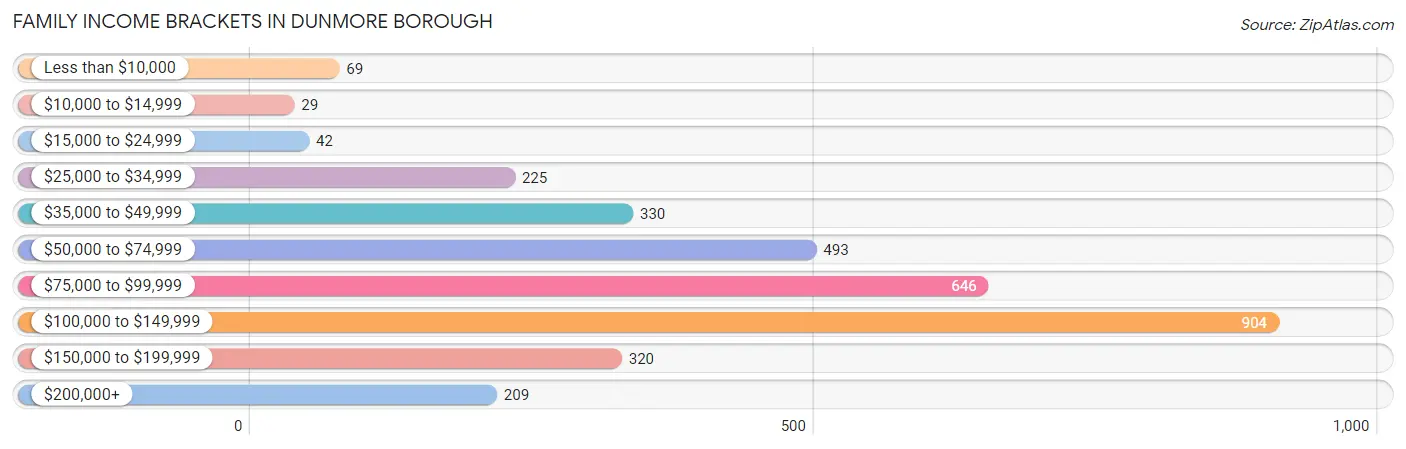
Family Income Brackets in Dunmore borough
According to the Dunmore borough family income data, there are 904 families falling into the $100,000 to $149,999 income range, which is the most common income bracket and makes up 27.7% of all families. Conversely, the $10,000 to $14,999 income bracket is the least frequent group with only 29 families (0.9%) belonging to this category.
| Income Bracket | # Families | % Families |
| Less than $10,000 | 69 | 2.1% |
| $10,000 to $14,999 | 29 | 0.9% |
| $15,000 to $24,999 | 42 | 1.3% |
| $25,000 to $34,999 | 225 | 6.9% |
| $35,000 to $49,999 | 330 | 10.1% |
| $50,000 to $74,999 | 493 | 15.1% |
| $75,000 to $99,999 | 646 | 19.8% |
| $100,000 to $149,999 | 904 | 27.7% |
| $150,000 to $199,999 | 320 | 9.8% |
| $200,000+ | 209 | 6.4% |
Family Income by Famaliy Size in Dunmore borough
5-person families (345 | 10.6%) account for the highest median family income in Dunmore borough with $121,993 per family, while 2-person families (1,679 | 51.4%) have the highest median income of $37,875 per family member.
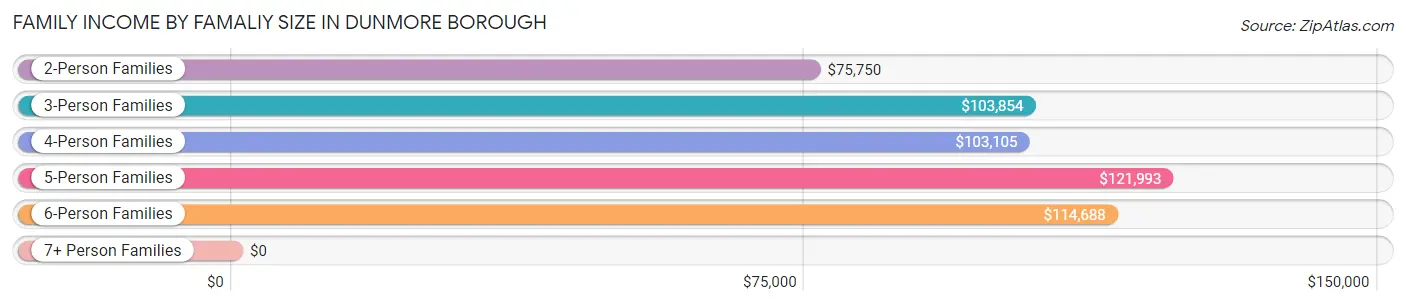
| Income Bracket | # Families | Median Income |
| 2-Person Families | 1,679 (51.4%) | $75,750 |
| 3-Person Families | 711 (21.8%) | $103,854 |
| 4-Person Families | 451 (13.8%) | $103,105 |
| 5-Person Families | 345 (10.6%) | $121,993 |
| 6-Person Families | 55 (1.7%) | $114,688 |
| 7+ Person Families | 23 (0.7%) | $0 |
| Total | 3,264 (100.0%) | $89,276 |
Family Income by Number of Earners in Dunmore borough
The median family income in Dunmore borough is $89,276, with families comprising 3+ earners (419) having the highest median family income of $144,659, while families with no earners (439) have the lowest median family income of $49,425, accounting for 12.8% and 13.5% of families, respectively.
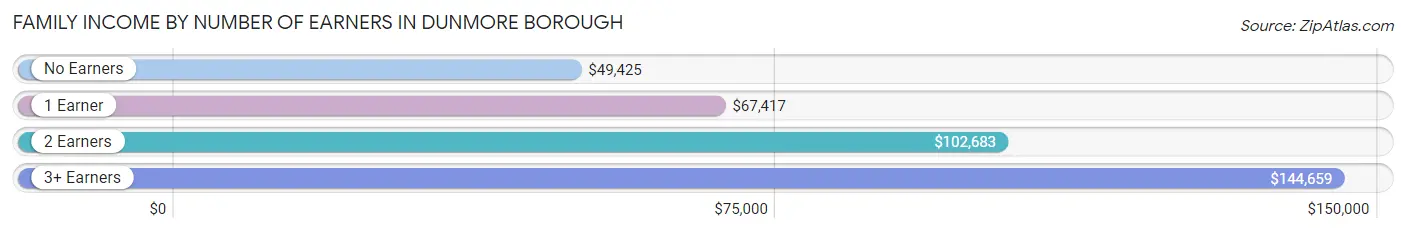
| Number of Earners | # Families | Median Income |
| No Earners | 439 (13.5%) | $49,425 |
| 1 Earner | 1,054 (32.3%) | $67,417 |
| 2 Earners | 1,352 (41.4%) | $102,683 |
| 3+ Earners | 419 (12.8%) | $144,659 |
| Total | 3,264 (100.0%) | $89,276 |
Household Income in Dunmore borough
Household Income Brackets in Dunmore borough
With 1,136 households falling in the category, the $100,000 to $149,999 income range is the most frequent in Dunmore borough, accounting for 19.3% of all households. In contrast, only 200 households (3.4%) fall into the $15,000 to $24,999 income bracket, making it the least populous group.
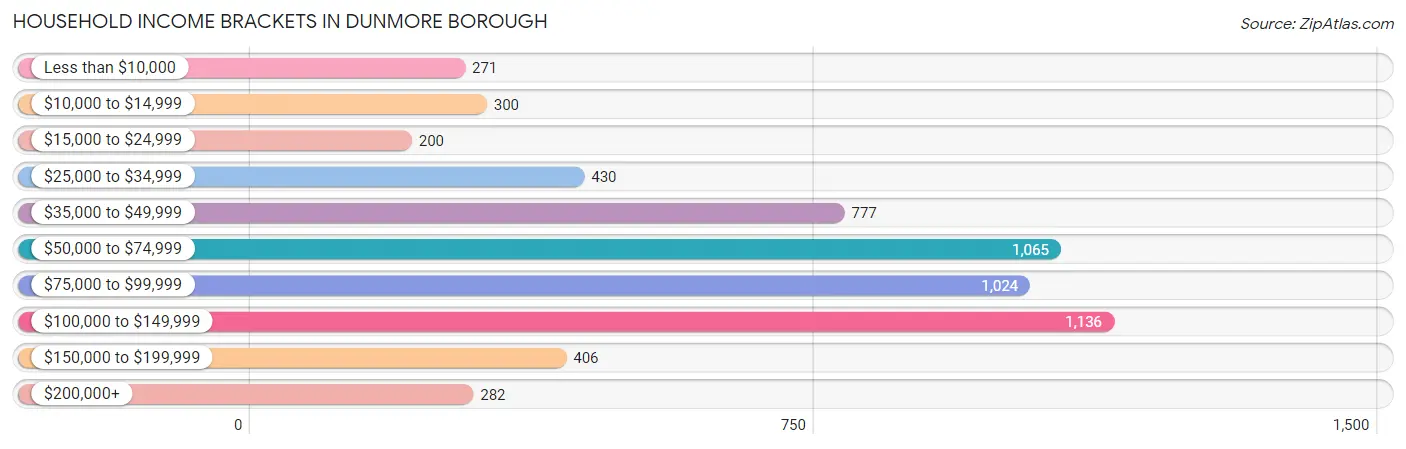
| Income Bracket | # Households | % Households |
| Less than $10,000 | 271 | 4.6% |
| $10,000 to $14,999 | 300 | 5.1% |
| $15,000 to $24,999 | 200 | 3.4% |
| $25,000 to $34,999 | 430 | 7.3% |
| $35,000 to $49,999 | 777 | 13.2% |
| $50,000 to $74,999 | 1,065 | 18.1% |
| $75,000 to $99,999 | 1,024 | 17.4% |
| $100,000 to $149,999 | 1,136 | 19.3% |
| $150,000 to $199,999 | 406 | 6.9% |
| $200,000+ | 282 | 4.8% |
Household Income by Householder Age in Dunmore borough
The median household income in Dunmore borough is $72,821, with the highest median household income of $83,087 found in the 25 to 44 years age bracket for the primary householder. A total of 2,138 households (36.3%) fall into this category. Meanwhile, the 15 to 24 years age bracket for the primary householder has the lowest median household income of $52,865, with 85 households (1.4%) in this group.
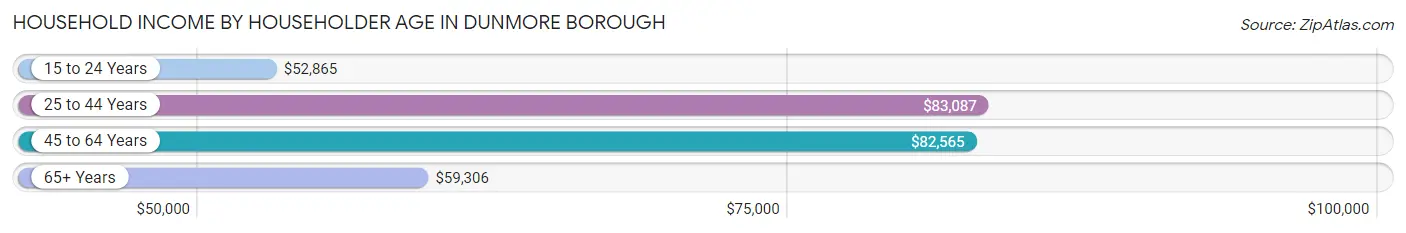
| Income Bracket | # Households | Median Income |
| 15 to 24 Years | 85 (1.4%) | $52,865 |
| 25 to 44 Years | 2,138 (36.3%) | $83,087 |
| 45 to 64 Years | 1,863 (31.7%) | $82,565 |
| 65+ Years | 1,799 (30.6%) | $59,306 |
| Total | 5,885 (100.0%) | $72,821 |
Poverty in Dunmore borough
Income Below Poverty by Sex and Age in Dunmore borough
With 7.3% poverty level for males and 11.0% for females among the residents of Dunmore borough, 15 year old males and 75 year old and over females are the most vulnerable to poverty, with 38 males (62.3%) and 219 females (25.9%) in their respective age groups living below the poverty level.
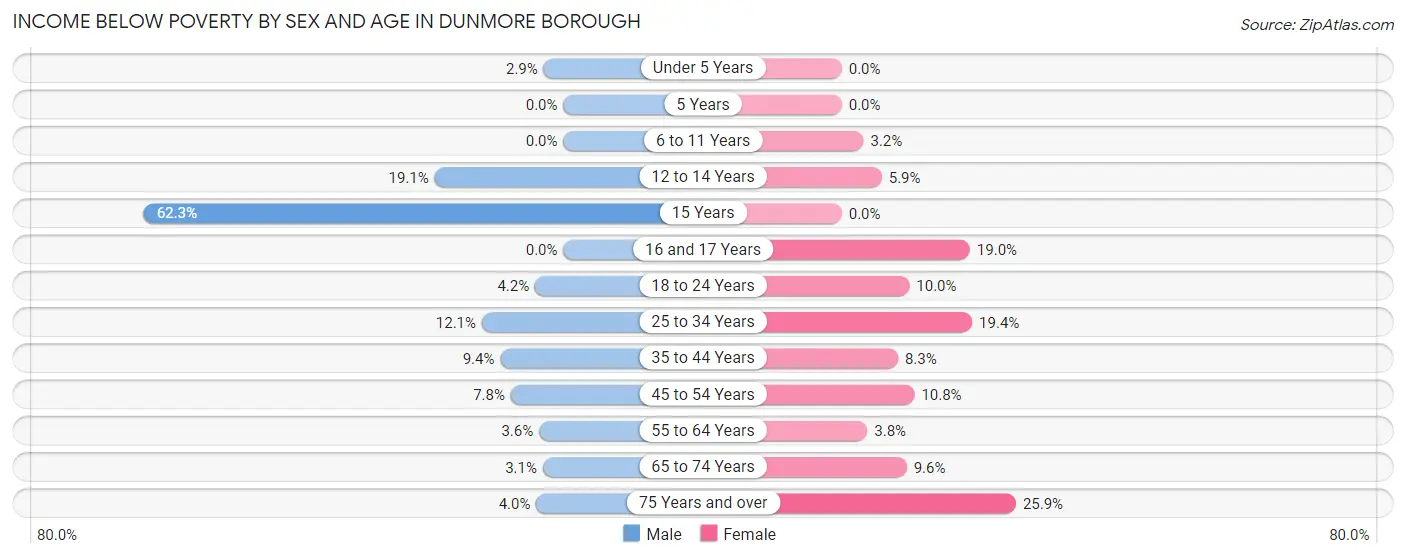
| Age Bracket | Male | Female |
| Under 5 Years | 7 (2.9%) | 0 (0.0%) |
| 5 Years | 0 (0.0%) | 0 (0.0%) |
| 6 to 11 Years | 0 (0.0%) | 13 (3.2%) |
| 12 to 14 Years | 61 (19.1%) | 17 (5.9%) |
| 15 Years | 38 (62.3%) | 0 (0.0%) |
| 16 and 17 Years | 0 (0.0%) | 31 (19.0%) |
| 18 to 24 Years | 27 (4.2%) | 31 (10.0%) |
| 25 to 34 Years | 133 (12.1%) | 176 (19.4%) |
| 35 to 44 Years | 96 (9.4%) | 74 (8.3%) |
| 45 to 54 Years | 48 (7.8%) | 71 (10.8%) |
| 55 to 64 Years | 34 (3.6%) | 37 (3.8%) |
| 65 to 74 Years | 16 (3.0%) | 81 (9.6%) |
| 75 Years and over | 19 (4.0%) | 219 (25.9%) |
| Total | 479 (7.3%) | 750 (11.0%) |
Income Above Poverty by Sex and Age in Dunmore borough
According to the poverty statistics in Dunmore borough, males aged 5 years and females aged under 5 years are the age groups that are most secure financially, with 100.0% of males and 100.0% of females in these age groups living above the poverty line.
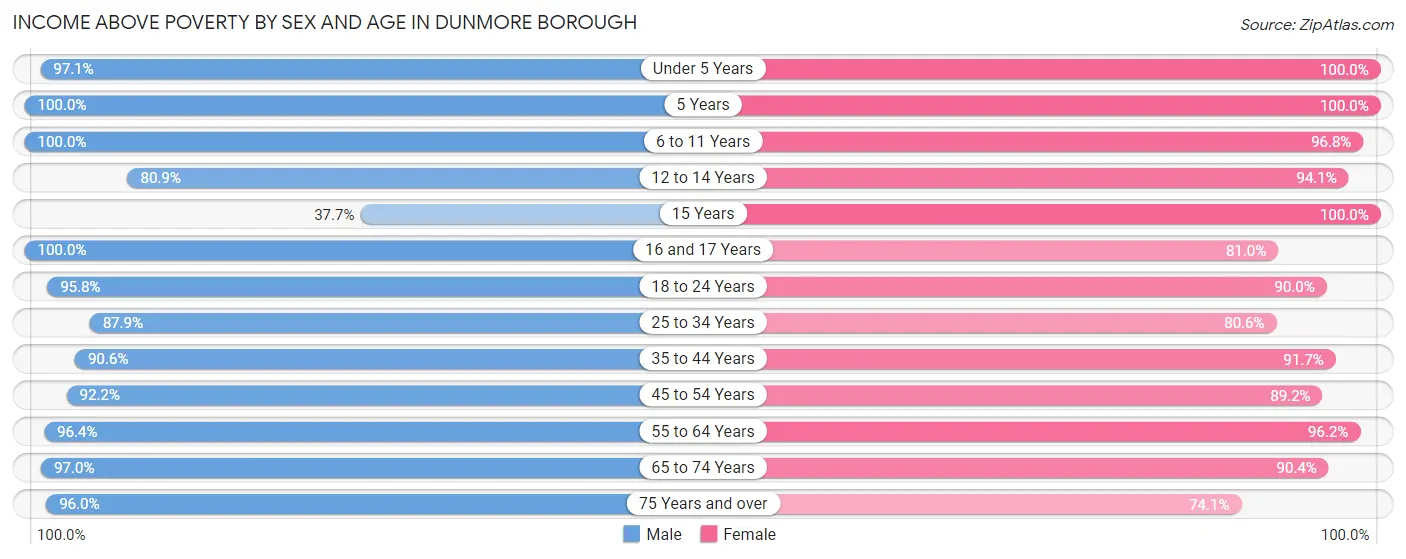
| Age Bracket | Male | Female |
| Under 5 Years | 232 (97.1%) | 410 (100.0%) |
| 5 Years | 77 (100.0%) | 27 (100.0%) |
| 6 to 11 Years | 465 (100.0%) | 390 (96.8%) |
| 12 to 14 Years | 258 (80.9%) | 269 (94.1%) |
| 15 Years | 23 (37.7%) | 111 (100.0%) |
| 16 and 17 Years | 117 (100.0%) | 132 (81.0%) |
| 18 to 24 Years | 616 (95.8%) | 278 (90.0%) |
| 25 to 34 Years | 966 (87.9%) | 733 (80.6%) |
| 35 to 44 Years | 930 (90.6%) | 813 (91.7%) |
| 45 to 54 Years | 567 (92.2%) | 587 (89.2%) |
| 55 to 64 Years | 907 (96.4%) | 939 (96.2%) |
| 65 to 74 Years | 508 (97.0%) | 759 (90.4%) |
| 75 Years and over | 454 (96.0%) | 628 (74.1%) |
| Total | 6,120 (92.7%) | 6,076 (89.0%) |
Income Below Poverty Among Married-Couple Families in Dunmore borough
The poverty statistics for married-couple families in Dunmore borough show that 1.5% or 35 of the total 2,333 families live below the poverty line. Families with 1 or 2 children have the highest poverty rate of 3.3%, comprising of 23 families. On the other hand, families with 3 or 4 children have the lowest poverty rate of 0.0%, which includes 0 families.
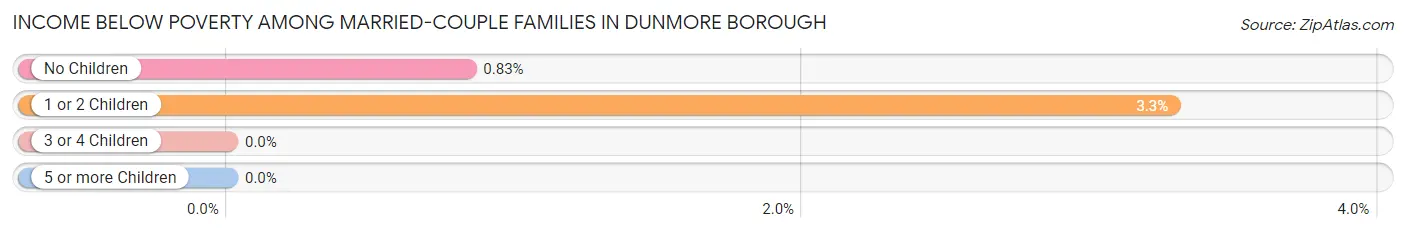
| Children | Above Poverty | Below Poverty |
| No Children | 1,440 (99.2%) | 12 (0.8%) |
| 1 or 2 Children | 679 (96.7%) | 23 (3.3%) |
| 3 or 4 Children | 156 (100.0%) | 0 (0.0%) |
| 5 or more Children | 23 (100.0%) | 0 (0.0%) |
| Total | 2,298 (98.5%) | 35 (1.5%) |
Income Below Poverty Among Single-Parent Households in Dunmore borough
According to the poverty data in Dunmore borough, 8.0% or 24 single-father households and 6.2% or 39 single-mother households are living below the poverty line. Among single-father households, those with no children have the highest poverty rate, with 24 households (17.8%) experiencing poverty. Likewise, among single-mother households, those with 1 or 2 children have the highest poverty rate, with 39 households (12.4%) falling below the poverty line.
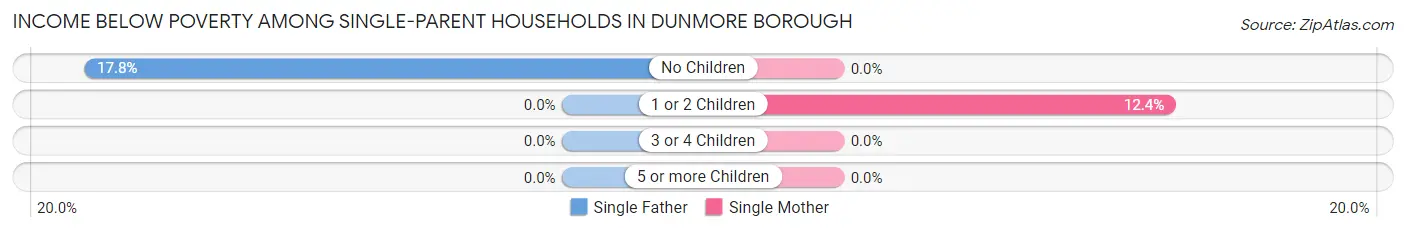
| Children | Single Father | Single Mother |
| No Children | 24 (17.8%) | 0 (0.0%) |
| 1 or 2 Children | 0 (0.0%) | 39 (12.4%) |
| 3 or 4 Children | 0 (0.0%) | 0 (0.0%) |
| 5 or more Children | 0 (0.0%) | 0 (0.0%) |
| Total | 24 (8.0%) | 39 (6.2%) |
Income Below Poverty Among Married-Couple vs Single-Parent Households in Dunmore borough
The poverty data for Dunmore borough shows that 35 of the married-couple family households (1.5%) and 63 of the single-parent households (6.8%) are living below the poverty level. Within the married-couple family households, those with 1 or 2 children have the highest poverty rate, with 23 households (3.3%) falling below the poverty line. Among the single-parent households, those with 1 or 2 children have the highest poverty rate, with 39 household (9.8%) living below poverty.
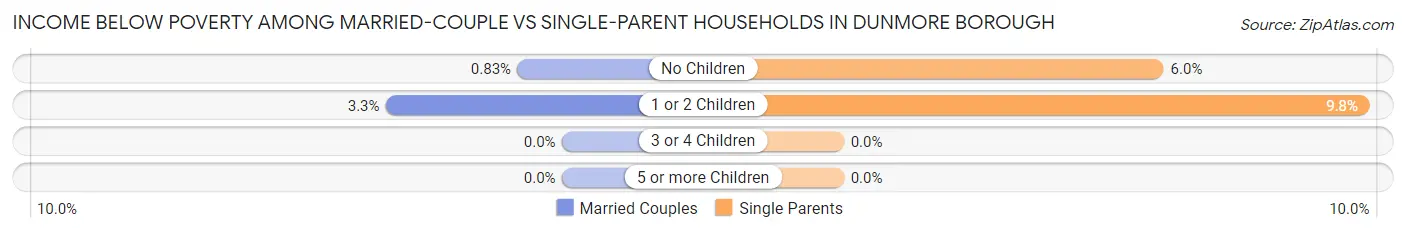
| Children | Married-Couple Families | Single-Parent Households |
| No Children | 12 (0.8%) | 24 (6.0%) |
| 1 or 2 Children | 23 (3.3%) | 39 (9.8%) |
| 3 or 4 Children | 0 (0.0%) | 0 (0.0%) |
| 5 or more Children | 0 (0.0%) | 0 (0.0%) |
| Total | 35 (1.5%) | 63 (6.8%) |
Race in Dunmore borough
The most populous races in Dunmore borough are White / Caucasian (12,425 | 88.2%), Hispanic or Latino (945 | 6.7%), and Asian (663 | 4.7%).
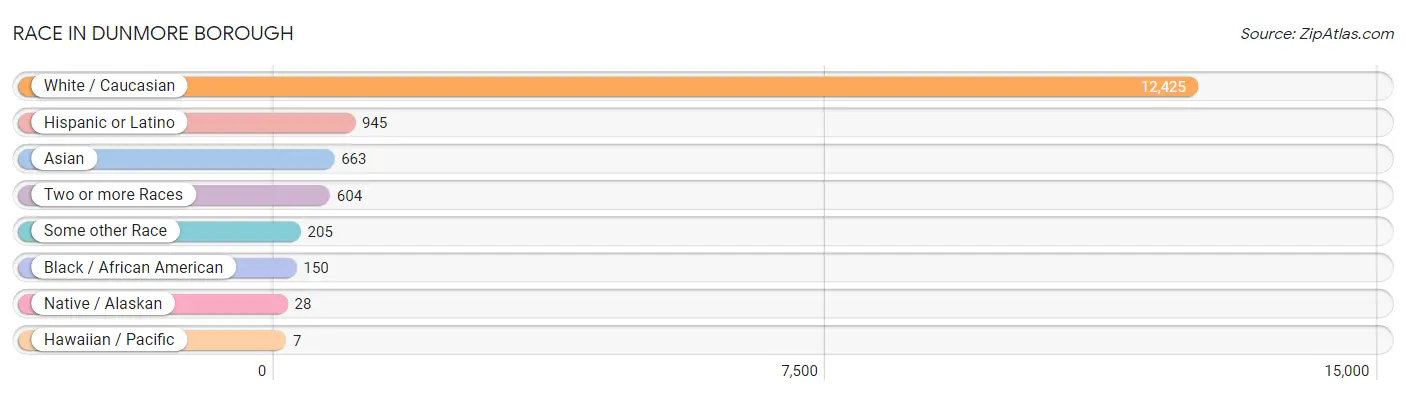
| Race | # Population | % Population |
| Asian | 663 | 4.7% |
| Black / African American | 150 | 1.1% |
| Hawaiian / Pacific | 7 | 0.1% |
| Hispanic or Latino | 945 | 6.7% |
| Native / Alaskan | 28 | 0.2% |
| White / Caucasian | 12,425 | 88.2% |
| Two or more Races | 604 | 4.3% |
| Some other Race | 205 | 1.5% |
| Total | 14,082 | 100.0% |
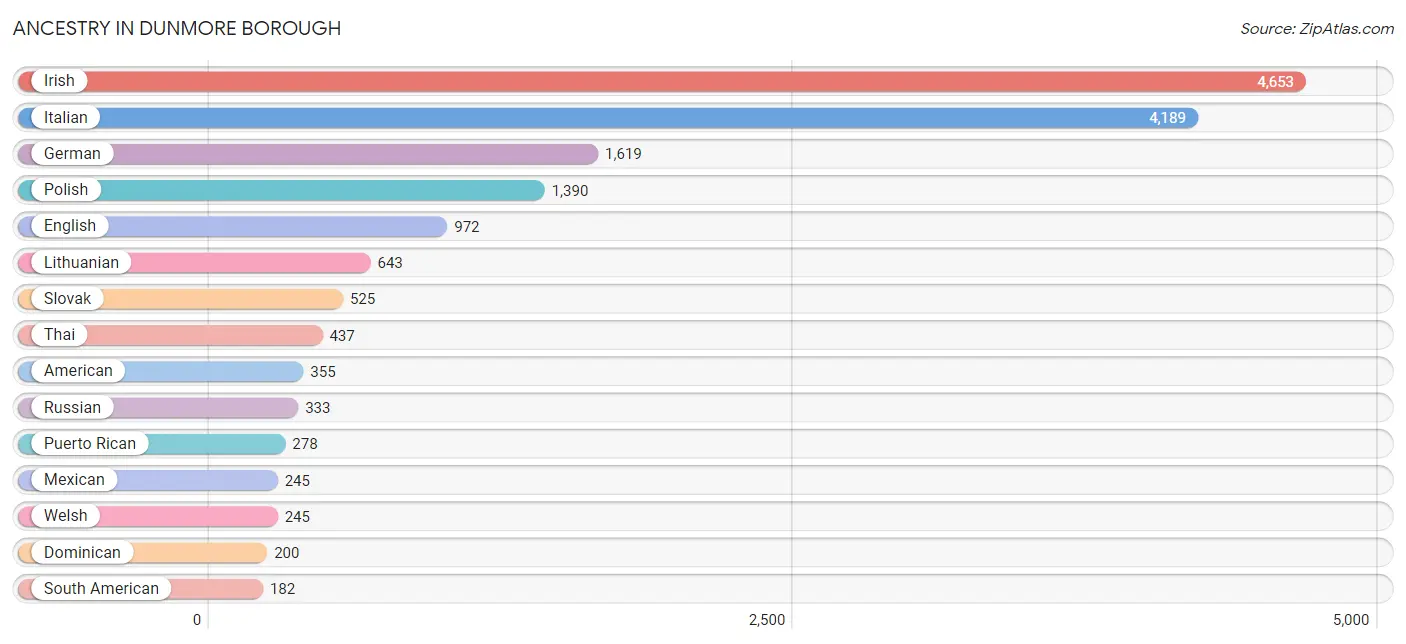
Ancestry in Dunmore borough
The most populous ancestries reported in Dunmore borough are Irish (4,653 | 33.0%), Italian (4,189 | 29.7%), German (1,619 | 11.5%), Polish (1,390 | 9.9%), and English (972 | 6.9%), together accounting for 91.1% of all Dunmore borough residents.
| Ancestry | # Population | % Population |
| American | 355 | 2.5% |
| Arab | 130 | 0.9% |
| Armenian | 23 | 0.2% |
| Australian | 14 | 0.1% |
| Austrian | 102 | 0.7% |
| Bhutanese | 15 | 0.1% |
| British | 24 | 0.2% |
| Burmese | 62 | 0.4% |
| Canadian | 20 | 0.1% |
| Central American Indian | 28 | 0.2% |
| Cherokee | 60 | 0.4% |
| Chilean | 5 | 0.0% |
| Croatian | 6 | 0.0% |
| Czech | 28 | 0.2% |
| Czechoslovakian | 33 | 0.2% |
| Dominican | 200 | 1.4% |
| Dutch | 62 | 0.4% |
| Eastern European | 20 | 0.1% |
| English | 972 | 6.9% |
| European | 9 | 0.1% |
| Finnish | 22 | 0.2% |
| French | 85 | 0.6% |
| French Canadian | 25 | 0.2% |
| German | 1,619 | 11.5% |
| Greek | 93 | 0.7% |
| Hungarian | 53 | 0.4% |
| Indian (Asian) | 93 | 0.7% |
| Irish | 4,653 | 33.0% |
| Italian | 4,189 | 29.7% |
| Korean | 114 | 0.8% |
| Lebanese | 16 | 0.1% |
| Lithuanian | 643 | 4.6% |
| Mexican | 245 | 1.7% |
| Norwegian | 36 | 0.3% |
| Pennsylvania German | 23 | 0.2% |
| Polish | 1,390 | 9.9% |
| Portuguese | 15 | 0.1% |
| Puerto Rican | 278 | 2.0% |
| Russian | 333 | 2.4% |
| Scotch-Irish | 43 | 0.3% |
| Scottish | 59 | 0.4% |
| Slovak | 525 | 3.7% |
| South African | 7 | 0.1% |
| South American | 182 | 1.3% |
| Spaniard | 19 | 0.1% |
| Sri Lankan | 8 | 0.1% |
| Subsaharan African | 7 | 0.1% |
| Swedish | 61 | 0.4% |
| Swiss | 32 | 0.2% |
| Syrian | 22 | 0.2% |
| Thai | 437 | 3.1% |
| Trinidadian and Tobagonian | 34 | 0.2% |
| Ukrainian | 83 | 0.6% |
| Uruguayan | 108 | 0.8% |
| Venezuelan | 69 | 0.5% |
| Welsh | 245 | 1.7% |
| West Indian | 34 | 0.2% |
| Yugoslavian | 9 | 0.1% | View All 58 Rows |
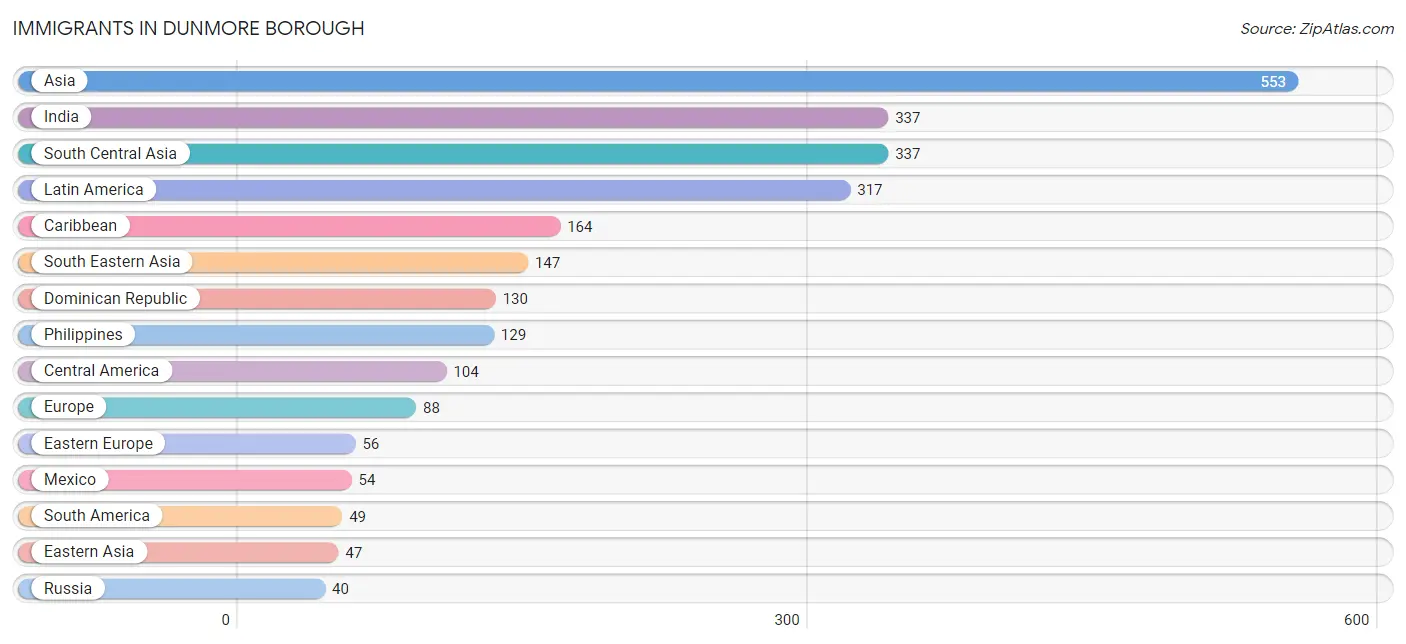
Immigrants in Dunmore borough
The most numerous immigrant groups reported in Dunmore borough came from Asia (553 | 3.9%), India (337 | 2.4%), South Central Asia (337 | 2.4%), Latin America (317 | 2.2%), and Caribbean (164 | 1.2%), together accounting for 12.1% of all Dunmore borough residents.
| Immigration Origin | # Population | % Population |
| Africa | 7 | 0.1% |
| Asia | 553 | 3.9% |
| Brazil | 15 | 0.1% |
| Caribbean | 164 | 1.2% |
| Central America | 104 | 0.7% |
| China | 6 | 0.0% |
| Dominican Republic | 130 | 0.9% |
| Eastern Asia | 47 | 0.3% |
| Eastern Europe | 56 | 0.4% |
| El Salvador | 31 | 0.2% |
| England | 10 | 0.1% |
| Europe | 88 | 0.6% |
| India | 337 | 2.4% |
| Italy | 7 | 0.1% |
| Japan | 15 | 0.1% |
| Korea | 26 | 0.2% |
| Latin America | 317 | 2.2% |
| Mexico | 54 | 0.4% |
| Northern Europe | 25 | 0.2% |
| Panama | 19 | 0.1% |
| Philippines | 129 | 0.9% |
| Poland | 16 | 0.1% |
| Russia | 40 | 0.3% |
| South Africa | 7 | 0.1% |
| South America | 49 | 0.4% |
| South Central Asia | 337 | 2.4% |
| South Eastern Asia | 147 | 1.0% |
| Southern Europe | 7 | 0.1% |
| Syria | 22 | 0.2% |
| Trinidad and Tobago | 34 | 0.2% |
| Venezuela | 34 | 0.2% |
| Vietnam | 18 | 0.1% |
| Western Asia | 22 | 0.2% | View All 33 Rows |
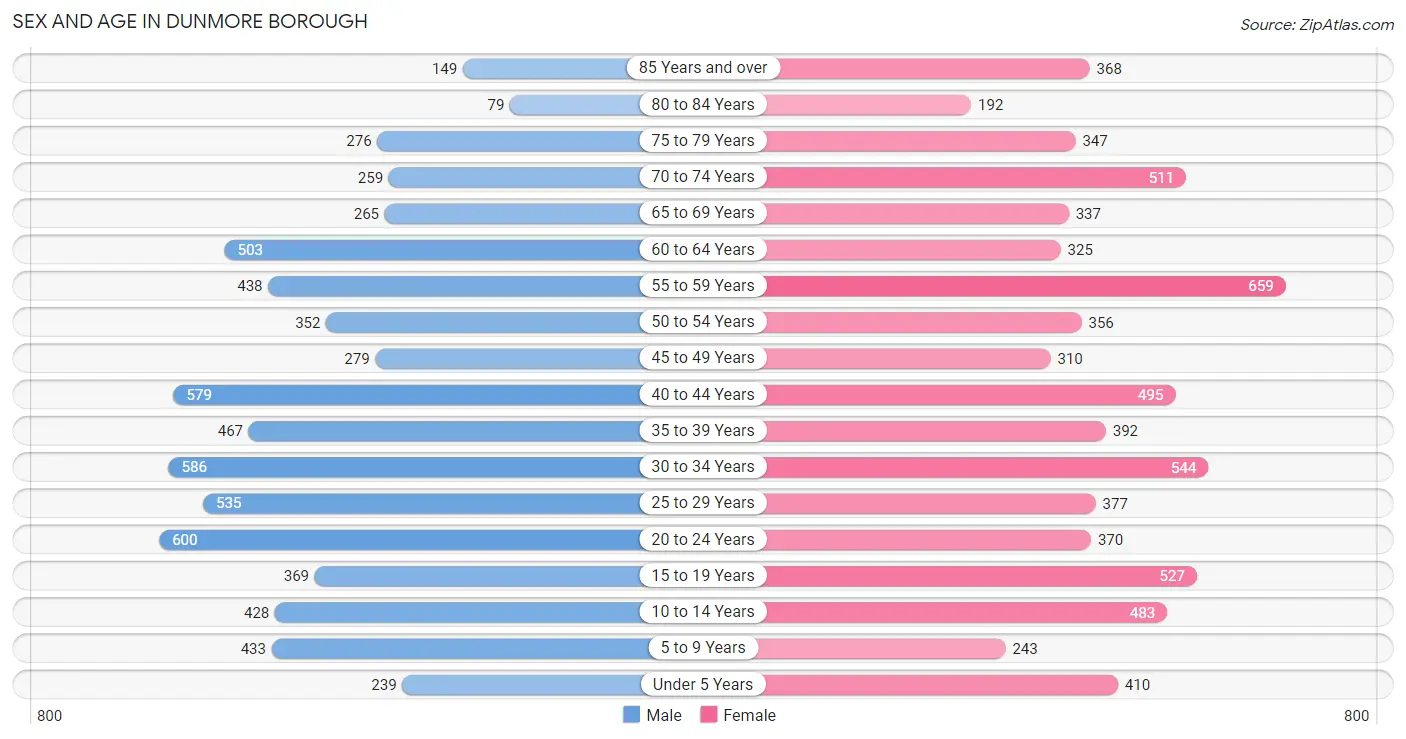
Sex and Age in Dunmore borough
Sex and Age in Dunmore borough
The most populous age groups in Dunmore borough are 20 to 24 Years (600 | 8.8%) for men and 55 to 59 Years (659 | 9.1%) for women.
| Age Bracket | Male | Female |
| Under 5 Years | 239 (3.5%) | 410 (5.7%) |
| 5 to 9 Years | 433 (6.3%) | 243 (3.4%) |
| 10 to 14 Years | 428 (6.3%) | 483 (6.7%) |
| 15 to 19 Years | 369 (5.4%) | 527 (7.3%) |
| 20 to 24 Years | 600 (8.8%) | 370 (5.1%) |
| 25 to 29 Years | 535 (7.8%) | 377 (5.2%) |
| 30 to 34 Years | 586 (8.6%) | 544 (7.5%) |
| 35 to 39 Years | 467 (6.8%) | 392 (5.4%) |
| 40 to 44 Years | 579 (8.5%) | 495 (6.8%) |
| 45 to 49 Years | 279 (4.1%) | 310 (4.3%) |
| 50 to 54 Years | 352 (5.1%) | 356 (4.9%) |
| 55 to 59 Years | 438 (6.4%) | 659 (9.1%) |
| 60 to 64 Years | 503 (7.4%) | 325 (4.5%) |
| 65 to 69 Years | 265 (3.9%) | 337 (4.6%) |
| 70 to 74 Years | 259 (3.8%) | 511 (7.0%) |
| 75 to 79 Years | 276 (4.0%) | 347 (4.8%) |
| 80 to 84 Years | 79 (1.2%) | 192 (2.6%) |
| 85 Years and over | 149 (2.2%) | 368 (5.1%) |
| Total | 6,836 (100.0%) | 7,246 (100.0%) |
Families and Households in Dunmore borough
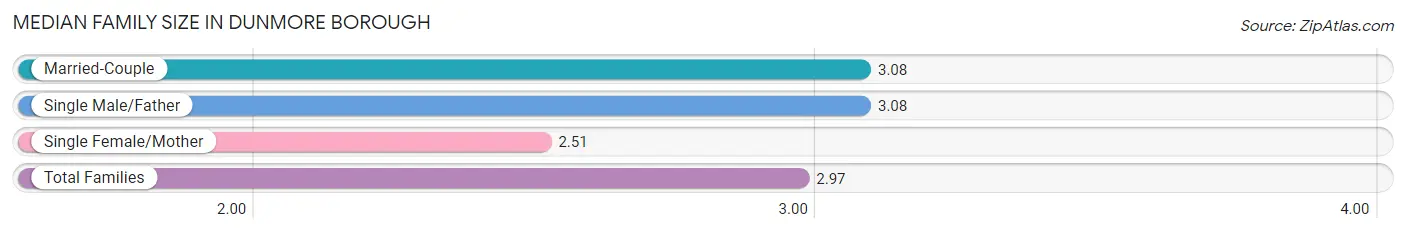
Median Family Size in Dunmore borough
The median family size in Dunmore borough is 2.97 persons per family, with married-couple families (2,333 | 71.5%) accounting for the largest median family size of 3.08 persons per family. On the other hand, single female/mother families (632 | 19.4%) represent the smallest median family size with 2.51 persons per family.
| Family Type | # Families | Family Size |
| Married-Couple | 2,333 (71.5%) | 3.08 |
| Single Male/Father | 299 (9.2%) | 3.08 |
| Single Female/Mother | 632 (19.4%) | 2.51 |
| Total Families | 3,264 (100.0%) | 2.97 |
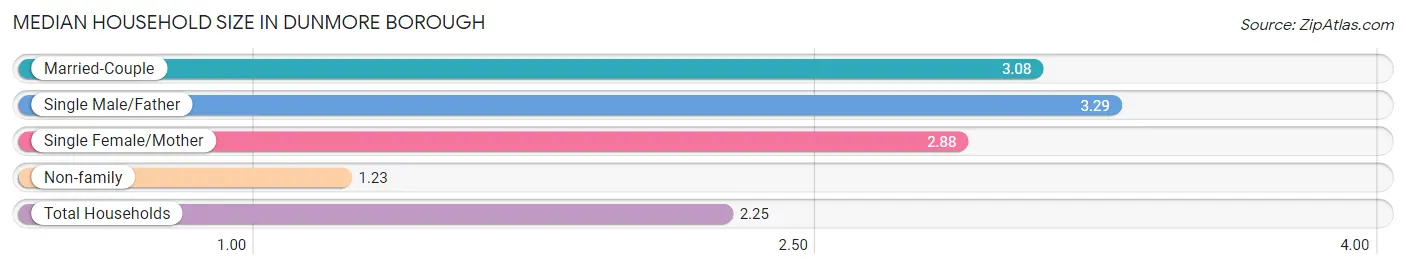
Median Household Size in Dunmore borough
The median household size in Dunmore borough is 2.25 persons per household, with single male/father households (299 | 5.1%) accounting for the largest median household size of 3.29 persons per household. non-family households (2,621 | 44.5%) represent the smallest median household size with 1.23 persons per household.
| Household Type | # Households | Household Size |
| Married-Couple | 2,333 (39.6%) | 3.08 |
| Single Male/Father | 299 (5.1%) | 3.29 |
| Single Female/Mother | 632 (10.7%) | 2.88 |
| Non-family | 2,621 (44.5%) | 1.23 |
| Total Households | 5,885 (100.0%) | 2.25 |
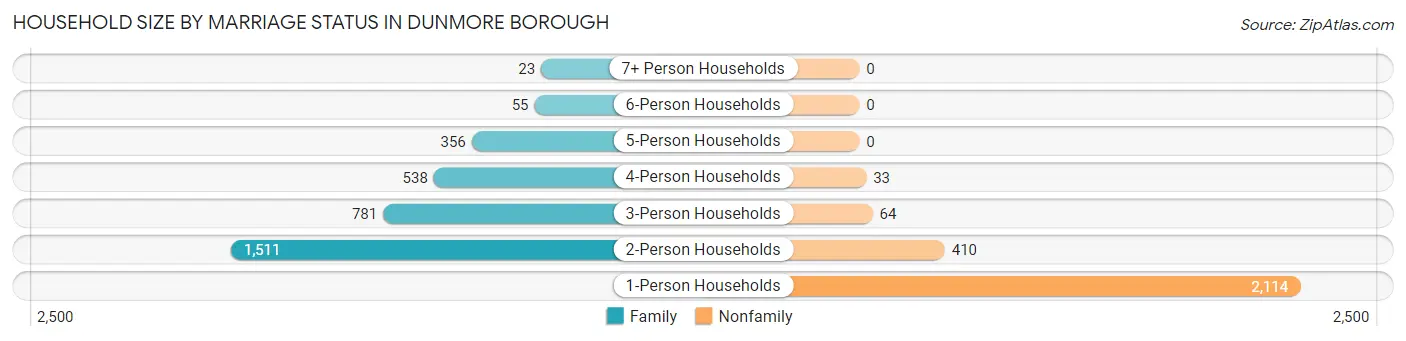
Household Size by Marriage Status in Dunmore borough
Out of a total of 5,885 households in Dunmore borough, 3,264 (55.5%) are family households, while 2,621 (44.5%) are nonfamily households. The most numerous type of family households are 2-person households, comprising 1,511, and the most common type of nonfamily households are 1-person households, comprising 2,114.
| Household Size | Family Households | Nonfamily Households |
| 1-Person Households | - | 2,114 (35.9%) |
| 2-Person Households | 1,511 (25.7%) | 410 (7.0%) |
| 3-Person Households | 781 (13.3%) | 64 (1.1%) |
| 4-Person Households | 538 (9.1%) | 33 (0.6%) |
| 5-Person Households | 356 (6.0%) | 0 (0.0%) |
| 6-Person Households | 55 (0.9%) | 0 (0.0%) |
| 7+ Person Households | 23 (0.4%) | 0 (0.0%) |
| Total | 3,264 (55.5%) | 2,621 (44.5%) |
Female Fertility in Dunmore borough
Fertility by Age in Dunmore borough
Average fertility rate in Dunmore borough is 74.0 births per 1,000 women. Women in the age bracket of 35 to 50 years have the highest fertility rate with 104.0 births per 1,000 women. Women in the age bracket of 35 to 50 years acount for 57.2% of all women with births.
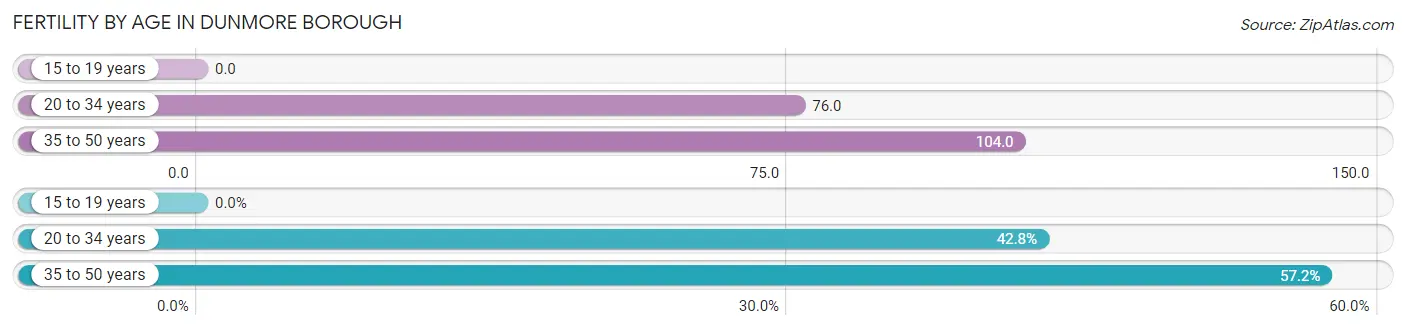
| Age Bracket | Women with Births | Births / 1,000 Women |
| 15 to 19 years | 0 (0.0%) | 0.0 |
| 20 to 34 years | 98 (42.8%) | 76.0 |
| 35 to 50 years | 131 (57.2%) | 104.0 |
| Total | 229 (100.0%) | 74.0 |
Fertility by Age by Marriage Status in Dunmore borough
85.6% of women with births (229) in Dunmore borough are married. The highest percentage of unmarried women with births falls into 20 to 34 years age bracket with 33.7% of them unmarried at the time of birth, while the lowest percentage of unmarried women with births belong to 35 to 50 years age bracket with 0.0% of them unmarried.
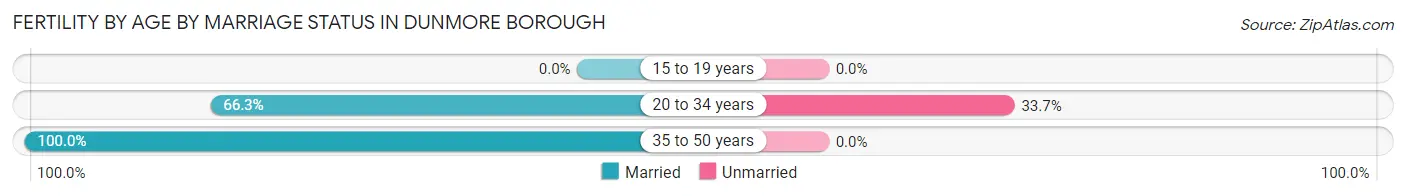
| Age Bracket | Married | Unmarried |
| 15 to 19 years | 0 (0.0%) | 0 (0.0%) |
| 20 to 34 years | 65 (66.3%) | 33 (33.7%) |
| 35 to 50 years | 131 (100.0%) | 0 (0.0%) |
| Total | 196 (85.6%) | 33 (14.4%) |
Fertility by Education in Dunmore borough
Average fertility rate in Dunmore borough is 74.0 births per 1,000 women. Women with the education attainment of high school diploma have the highest fertility rate of 171.0 births per 1,000 women, while women with the education attainment of college or associate's degree have the lowest fertility at 22.0 births per 1,000 women. Women with the education attainment of high school diploma represent 34.1% of all women with births.
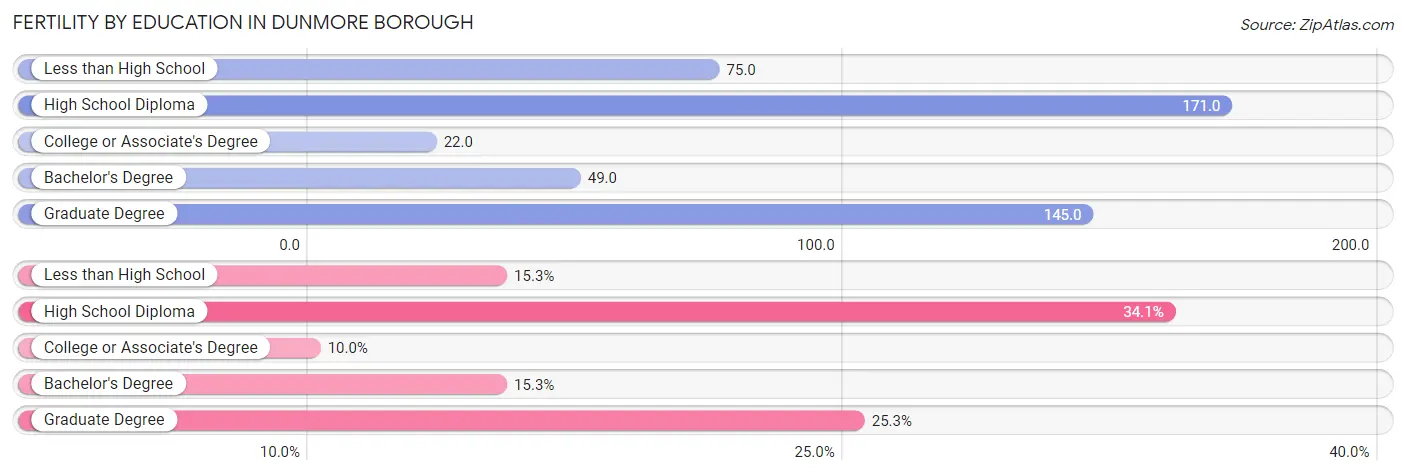
| Educational Attainment | Women with Births | Births / 1,000 Women |
| Less than High School | 35 (15.3%) | 75.0 |
| High School Diploma | 78 (34.1%) | 171.0 |
| College or Associate's Degree | 23 (10.0%) | 22.0 |
| Bachelor's Degree | 35 (15.3%) | 49.0 |
| Graduate Degree | 58 (25.3%) | 145.0 |
| Total | 229 (100.0%) | 74.0 |
Fertility by Education by Marriage Status in Dunmore borough
14.4% of women with births in Dunmore borough are unmarried. Women with the educational attainment of college or associate's degree are most likely to be married with 100.0% of them married at childbirth, while women with the educational attainment of less than high school are least likely to be married with 37.1% of them unmarried at childbirth.
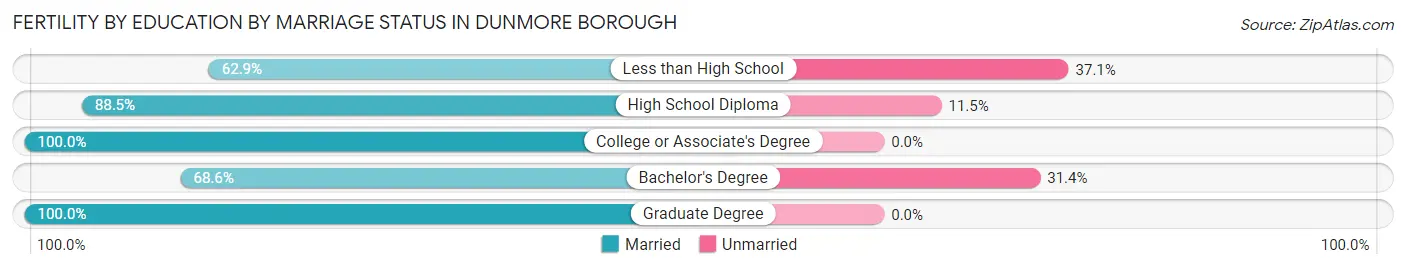
| Educational Attainment | Married | Unmarried |
| Less than High School | 22 (62.9%) | 13 (37.1%) |
| High School Diploma | 69 (88.5%) | 9 (11.5%) |
| College or Associate's Degree | 23 (100.0%) | 0 (0.0%) |
| Bachelor's Degree | 24 (68.6%) | 11 (31.4%) |
| Graduate Degree | 58 (100.0%) | 0 (0.0%) |
| Total | 196 (85.6%) | 33 (14.4%) |
Employment Characteristics in Dunmore borough
Employment by Class of Employer in Dunmore borough
Among the 6,830 employed individuals in Dunmore borough, private company employees (4,767 | 69.8%), not-for-profit organizations (913 | 13.4%), and local government employees (355 | 5.2%) make up the most common classes of employment.
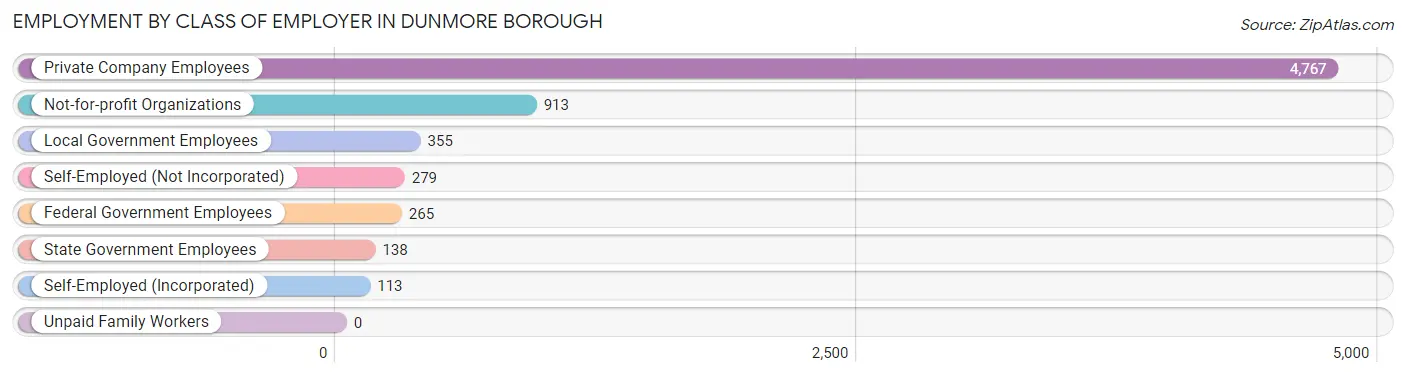
| Employer Class | # Employees | % Employees |
| Private Company Employees | 4,767 | 69.8% |
| Self-Employed (Incorporated) | 113 | 1.7% |
| Self-Employed (Not Incorporated) | 279 | 4.1% |
| Not-for-profit Organizations | 913 | 13.4% |
| Local Government Employees | 355 | 5.2% |
| State Government Employees | 138 | 2.0% |
| Federal Government Employees | 265 | 3.9% |
| Unpaid Family Workers | 0 | 0.0% |
| Total | 6,830 | 100.0% |
Employment Status by Age in Dunmore borough
According to the labor force statistics for Dunmore borough, out of the total population over 16 years of age (11,674), 62.2% or 7,261 individuals are in the labor force, with 4.8% or 349 of them unemployed. The age group with the highest labor force participation rate is 35 to 44 years, with 91.9% or 1,776 individuals in the labor force. Within the labor force, the 20 to 24 years age range has the highest percentage of unemployed individuals, with 28.6% or 178 of them being unemployed.
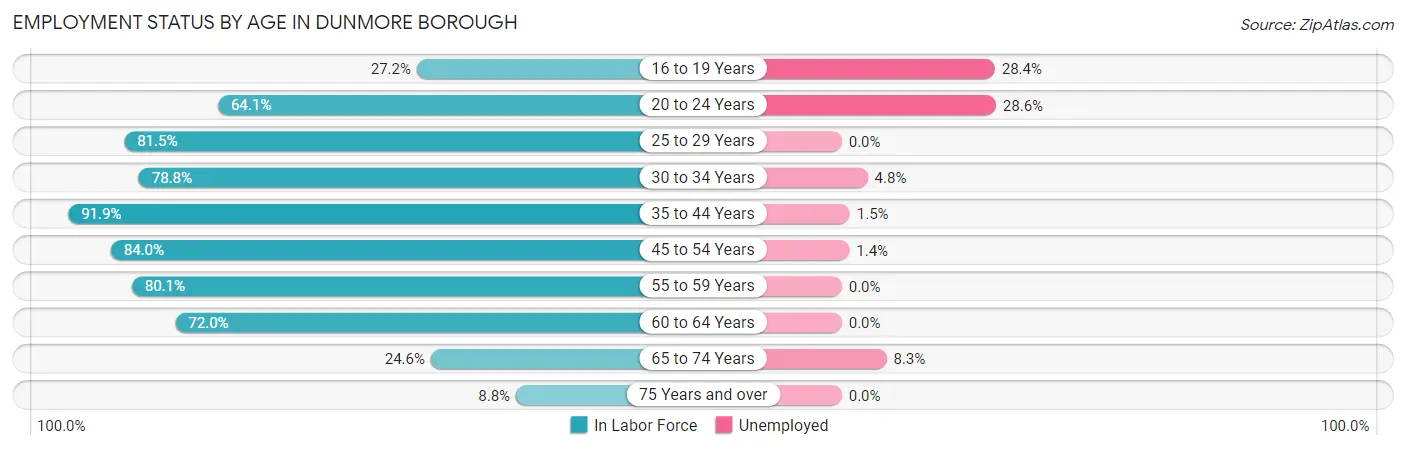
| Age Bracket | In Labor Force | Unemployed |
| 16 to 19 Years | 197 (27.2%) | 56 (28.4%) |
| 20 to 24 Years | 622 (64.1%) | 178 (28.6%) |
| 25 to 29 Years | 743 (81.5%) | 0 (0.0%) |
| 30 to 34 Years | 890 (78.8%) | 43 (4.8%) |
| 35 to 44 Years | 1,776 (91.9%) | 27 (1.5%) |
| 45 to 54 Years | 1,089 (84.0%) | 15 (1.4%) |
| 55 to 59 Years | 879 (80.1%) | 0 (0.0%) |
| 60 to 64 Years | 596 (72.0%) | 0 (0.0%) |
| 65 to 74 Years | 338 (24.6%) | 28 (8.3%) |
| 75 Years and over | 124 (8.8%) | 0 (0.0%) |
| Total | 7,261 (62.2%) | 349 (4.8%) |
Employment Status by Educational Attainment in Dunmore borough
According to labor force statistics for Dunmore borough, 83.0% of individuals (5,974) out of the total population between 25 and 64 years of age (7,197) are in the labor force, with 1.3% or 78 of them being unemployed. The group with the highest labor force participation rate are those with the educational attainment of college / associate degree, with 90.6% or 1,850 individuals in the labor force. Within the labor force, individuals with high school diploma education have the highest percentage of unemployment, with 5.0% or 64 of them being unemployed.
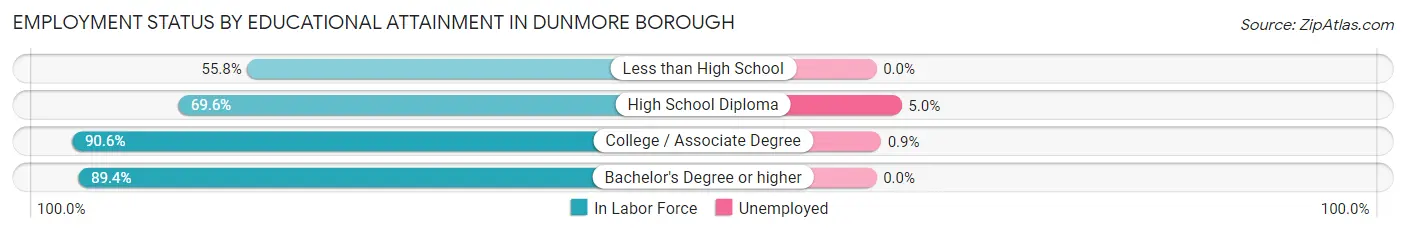
| Educational Attainment | In Labor Force | Unemployed |
| Less than High School | 201 (55.8%) | 0 (0.0%) |
| High School Diploma | 1,278 (69.6%) | 92 (5.0%) |
| College / Associate Degree | 1,850 (90.6%) | 18 (0.9%) |
| Bachelor's Degree or higher | 2,645 (89.4%) | 0 (0.0%) |
| Total | 5,974 (83.0%) | 94 (1.3%) |
Employment Occupations by Sex in Dunmore borough
Management, Business, Science and Arts Occupations
The most common Management, Business, Science and Arts occupations in Dunmore borough are Community & Social Service (992 | 14.5%), Health Diagnosing & Treating (769 | 11.3%), Management (637 | 9.3%), Health Technologists (489 | 7.2%), and Computers, Engineering & Science (447 | 6.6%).
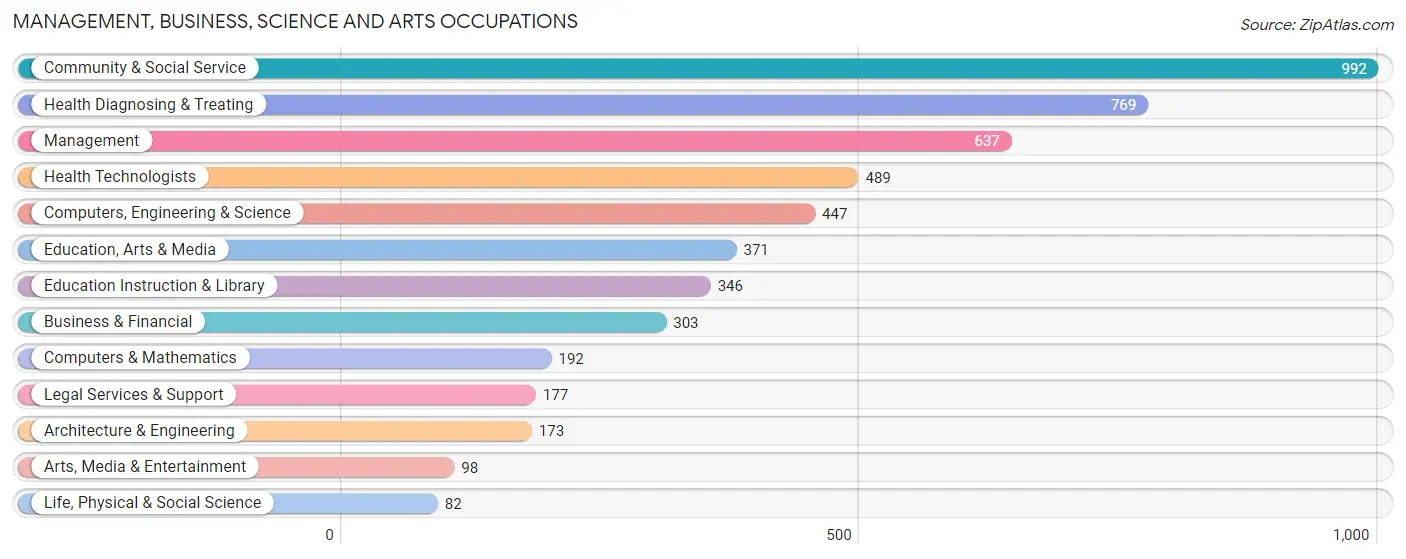
Management, Business, Science and Arts Occupations by Sex
Within the Management, Business, Science and Arts occupations in Dunmore borough, the most male-oriented occupations are Architecture & Engineering (79.8%), Computers, Engineering & Science (66.7%), and Computers & Mathematics (65.6%), while the most female-oriented occupations are Health Diagnosing & Treating (80.9%), Health Technologists (72.8%), and Education Instruction & Library (66.5%).
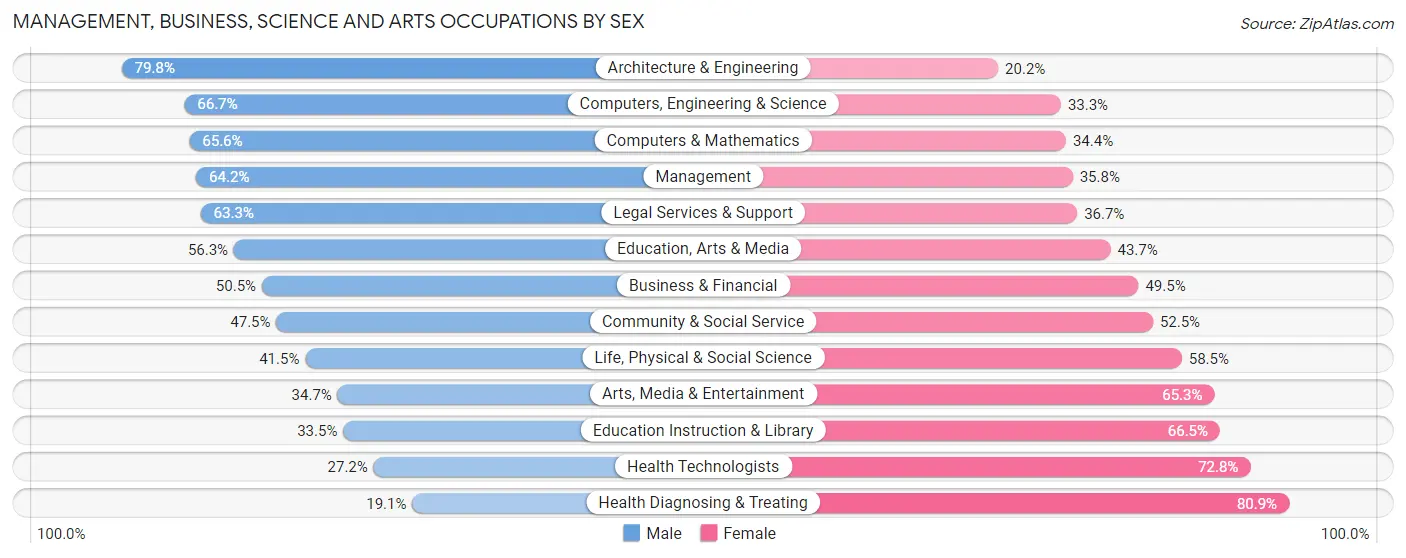
| Occupation | Male | Female |
| Management | 409 (64.2%) | 228 (35.8%) |
| Business & Financial | 153 (50.5%) | 150 (49.5%) |
| Computers, Engineering & Science | 298 (66.7%) | 149 (33.3%) |
| Computers & Mathematics | 126 (65.6%) | 66 (34.4%) |
| Architecture & Engineering | 138 (79.8%) | 35 (20.2%) |
| Life, Physical & Social Science | 34 (41.5%) | 48 (58.5%) |
| Community & Social Service | 471 (47.5%) | 521 (52.5%) |
| Education, Arts & Media | 209 (56.3%) | 162 (43.7%) |
| Legal Services & Support | 112 (63.3%) | 65 (36.7%) |
| Education Instruction & Library | 116 (33.5%) | 230 (66.5%) |
| Arts, Media & Entertainment | 34 (34.7%) | 64 (65.3%) |
| Health Diagnosing & Treating | 147 (19.1%) | 622 (80.9%) |
| Health Technologists | 133 (27.2%) | 356 (72.8%) |
| Total (Category) | 1,478 (46.9%) | 1,670 (53.0%) |
| Total (Overall) | 3,657 (53.6%) | 3,159 (46.4%) |
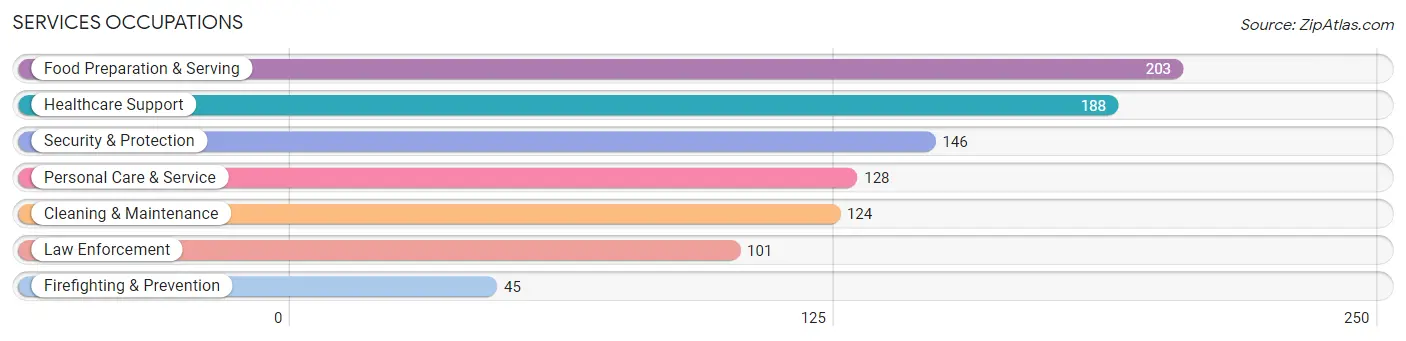
Services Occupations
The most common Services occupations in Dunmore borough are Food Preparation & Serving (203 | 3.0%), Healthcare Support (188 | 2.8%), Security & Protection (146 | 2.1%), Personal Care & Service (128 | 1.9%), and Cleaning & Maintenance (124 | 1.8%).
Services Occupations by Sex
Within the Services occupations in Dunmore borough, the most male-oriented occupations are Cleaning & Maintenance (100.0%), Law Enforcement (87.1%), and Security & Protection (81.5%), while the most female-oriented occupations are Healthcare Support (100.0%), Personal Care & Service (61.7%), and Food Preparation & Serving (33.5%).
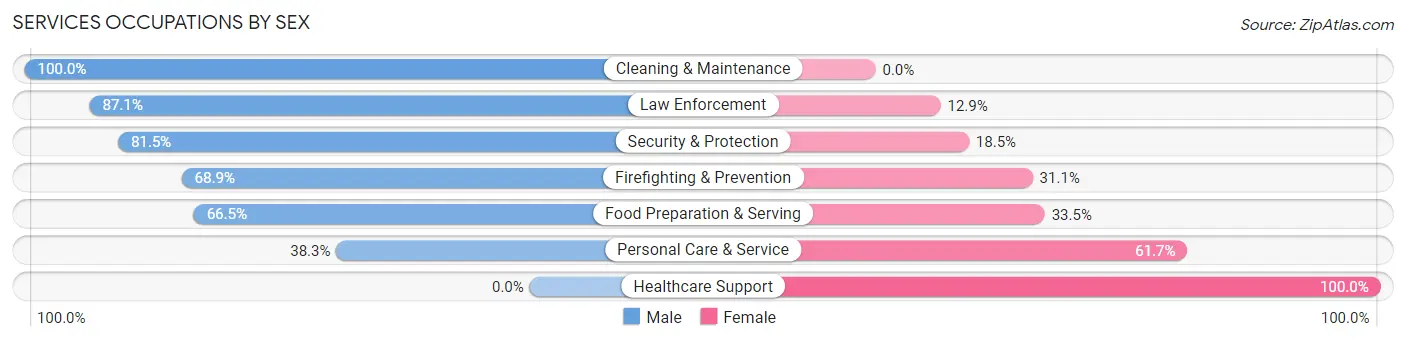
| Occupation | Male | Female |
| Healthcare Support | 0 (0.0%) | 188 (100.0%) |
| Security & Protection | 119 (81.5%) | 27 (18.5%) |
| Firefighting & Prevention | 31 (68.9%) | 14 (31.1%) |
| Law Enforcement | 88 (87.1%) | 13 (12.9%) |
| Food Preparation & Serving | 135 (66.5%) | 68 (33.5%) |
| Cleaning & Maintenance | 124 (100.0%) | 0 (0.0%) |
| Personal Care & Service | 49 (38.3%) | 79 (61.7%) |
| Total (Category) | 427 (54.1%) | 362 (45.9%) |
| Total (Overall) | 3,657 (53.6%) | 3,159 (46.4%) |
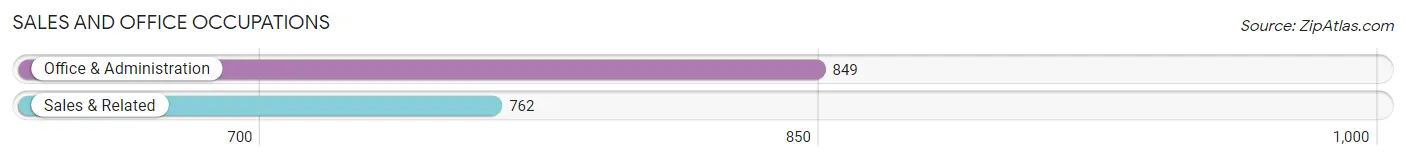
Sales and Office Occupations
The most common Sales and Office occupations in Dunmore borough are Office & Administration (849 | 12.5%), and Sales & Related (762 | 11.2%).
Sales and Office Occupations by Sex
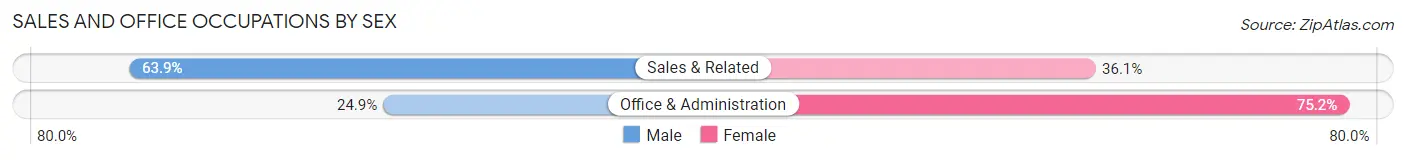
| Occupation | Male | Female |
| Sales & Related | 487 (63.9%) | 275 (36.1%) |
| Office & Administration | 211 (24.8%) | 638 (75.1%) |
| Total (Category) | 698 (43.3%) | 913 (56.7%) |
| Total (Overall) | 3,657 (53.6%) | 3,159 (46.4%) |
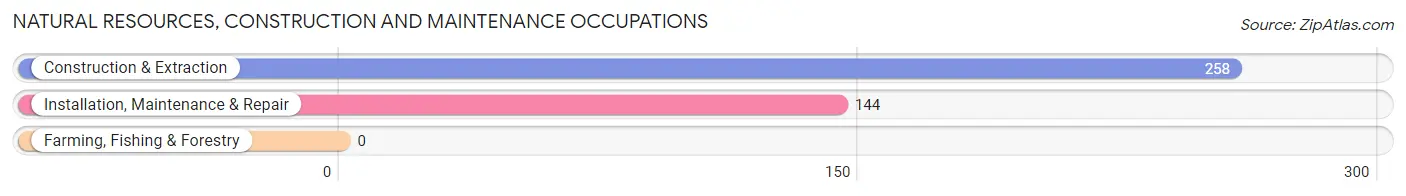
Natural Resources, Construction and Maintenance Occupations
The most common Natural Resources, Construction and Maintenance occupations in Dunmore borough are Construction & Extraction (258 | 3.8%), and Installation, Maintenance & Repair (144 | 2.1%).
Natural Resources, Construction and Maintenance Occupations by Sex
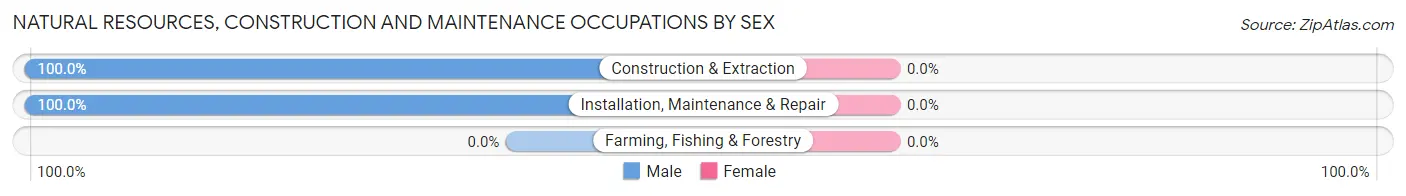
| Occupation | Male | Female |
| Farming, Fishing & Forestry | 0 (0.0%) | 0 (0.0%) |
| Construction & Extraction | 258 (100.0%) | 0 (0.0%) |
| Installation, Maintenance & Repair | 144 (100.0%) | 0 (0.0%) |
| Total (Category) | 402 (100.0%) | 0 (0.0%) |
| Total (Overall) | 3,657 (53.6%) | 3,159 (46.4%) |
Production, Transportation and Moving Occupations
The most common Production, Transportation and Moving occupations in Dunmore borough are Production (416 | 6.1%), Transportation (286 | 4.2%), and Material Moving (164 | 2.4%).
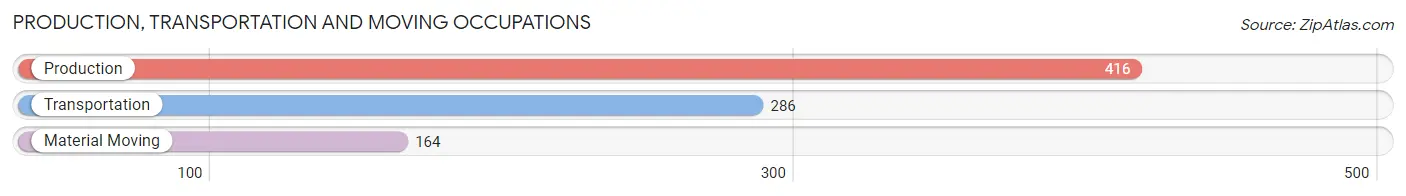
Production, Transportation and Moving Occupations by Sex
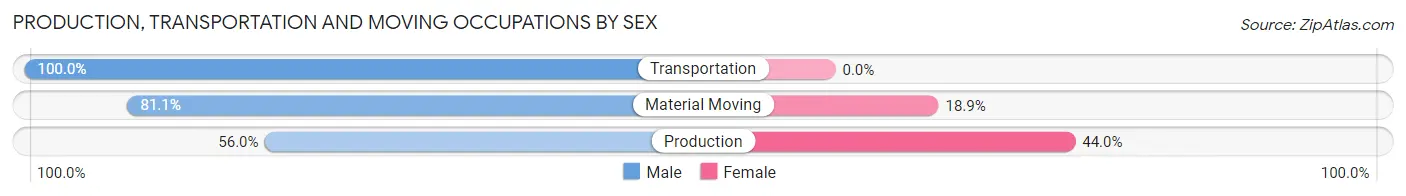
| Occupation | Male | Female |
| Production | 233 (56.0%) | 183 (44.0%) |
| Transportation | 286 (100.0%) | 0 (0.0%) |
| Material Moving | 133 (81.1%) | 31 (18.9%) |
| Total (Category) | 652 (75.3%) | 214 (24.7%) |
| Total (Overall) | 3,657 (53.6%) | 3,159 (46.4%) |
Employment Industries by Sex in Dunmore borough
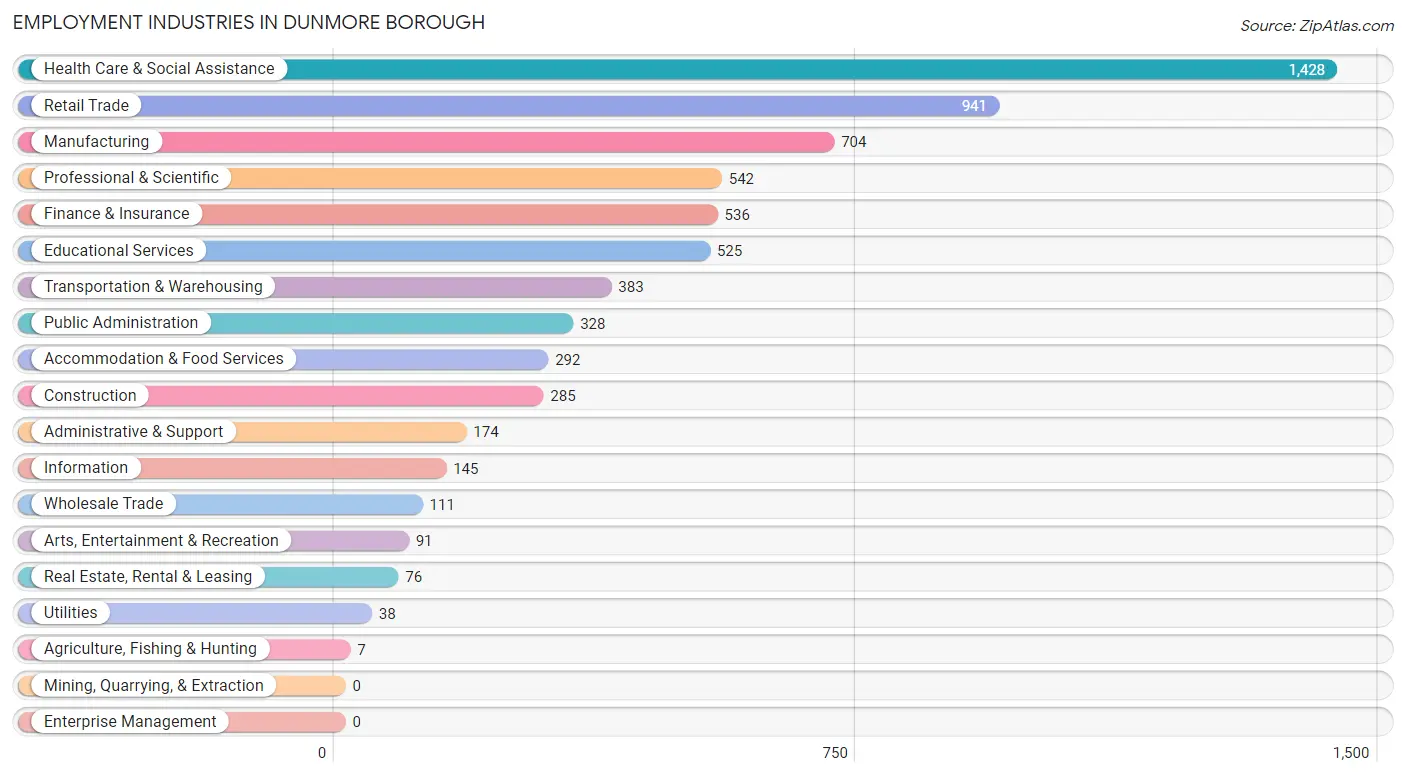
Employment Industries in Dunmore borough
The major employment industries in Dunmore borough include Health Care & Social Assistance (1,428 | 20.9%), Retail Trade (941 | 13.8%), Manufacturing (704 | 10.3%), Professional & Scientific (542 | 8.0%), and Finance & Insurance (536 | 7.9%).
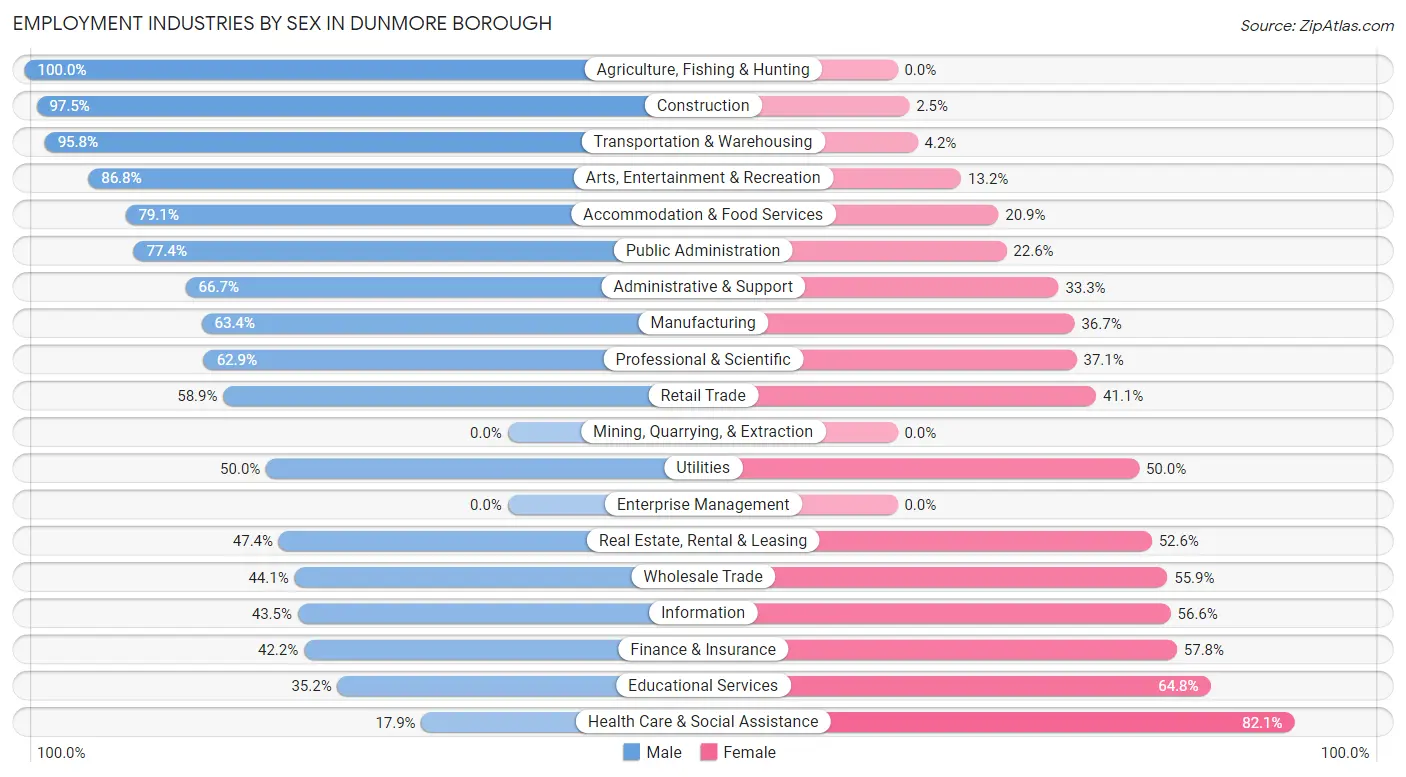
Employment Industries by Sex in Dunmore borough
The Dunmore borough industries that see more men than women are Agriculture, Fishing & Hunting (100.0%), Construction (97.5%), and Transportation & Warehousing (95.8%), whereas the industries that tend to have a higher number of women are Health Care & Social Assistance (82.1%), Educational Services (64.8%), and Finance & Insurance (57.8%).
| Industry | Male | Female |
| Agriculture, Fishing & Hunting | 7 (100.0%) | 0 (0.0%) |
| Mining, Quarrying, & Extraction | 0 (0.0%) | 0 (0.0%) |
| Construction | 278 (97.5%) | 7 (2.5%) |
| Manufacturing | 446 (63.3%) | 258 (36.6%) |
| Wholesale Trade | 49 (44.1%) | 62 (55.9%) |
| Retail Trade | 554 (58.9%) | 387 (41.1%) |
| Transportation & Warehousing | 367 (95.8%) | 16 (4.2%) |
| Utilities | 19 (50.0%) | 19 (50.0%) |
| Information | 63 (43.4%) | 82 (56.6%) |
| Finance & Insurance | 226 (42.2%) | 310 (57.8%) |
| Real Estate, Rental & Leasing | 36 (47.4%) | 40 (52.6%) |
| Professional & Scientific | 341 (62.9%) | 201 (37.1%) |
| Enterprise Management | 0 (0.0%) | 0 (0.0%) |
| Administrative & Support | 116 (66.7%) | 58 (33.3%) |
| Educational Services | 185 (35.2%) | 340 (64.8%) |
| Health Care & Social Assistance | 255 (17.9%) | 1,173 (82.1%) |
| Arts, Entertainment & Recreation | 79 (86.8%) | 12 (13.2%) |
| Accommodation & Food Services | 231 (79.1%) | 61 (20.9%) |
| Public Administration | 254 (77.4%) | 74 (22.6%) |
| Total | 3,657 (53.6%) | 3,159 (46.4%) |
Education in Dunmore borough
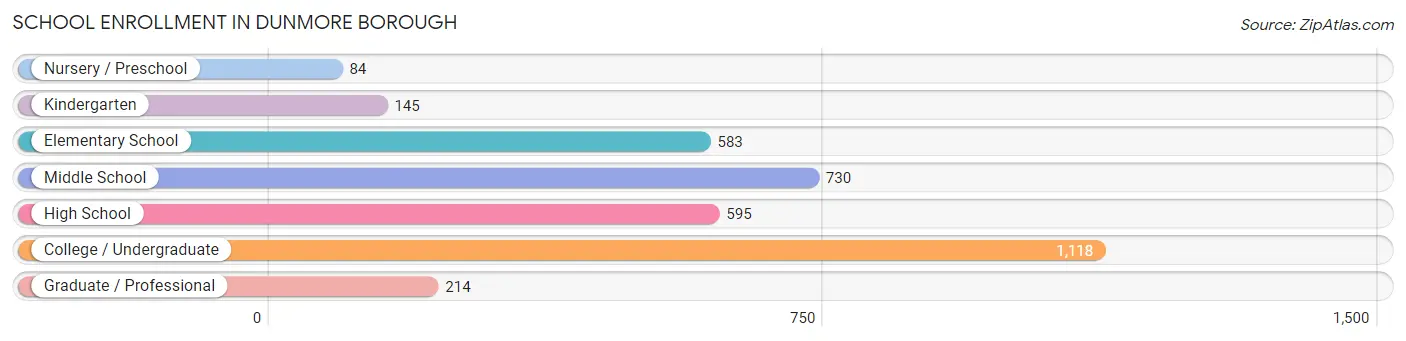
School Enrollment in Dunmore borough
The most common levels of schooling among the 3,469 students in Dunmore borough are college / undergraduate (1,118 | 32.2%), middle school (730 | 21.0%), and high school (595 | 17.2%).
| School Level | # Students | % Students |
| Nursery / Preschool | 84 | 2.4% |
| Kindergarten | 145 | 4.2% |
| Elementary School | 583 | 16.8% |
| Middle School | 730 | 21.0% |
| High School | 595 | 17.2% |
| College / Undergraduate | 1,118 | 32.2% |
| Graduate / Professional | 214 | 6.2% |
| Total | 3,469 | 100.0% |
School Enrollment by Age by Funding Source in Dunmore borough
Out of a total of 3,469 students who are enrolled in schools in Dunmore borough, 1,273 (36.7%) attend a private institution, while the remaining 2,196 (63.3%) are enrolled in public schools. The age group of 18 to 19 year olds has the highest likelihood of being enrolled in private schools, with 302 (78.2% in the age bracket) enrolled. Conversely, the age group of 5 to 9 year old has the lowest likelihood of being enrolled in a private school, with 538 (92.0% in the age bracket) attending a public institution.
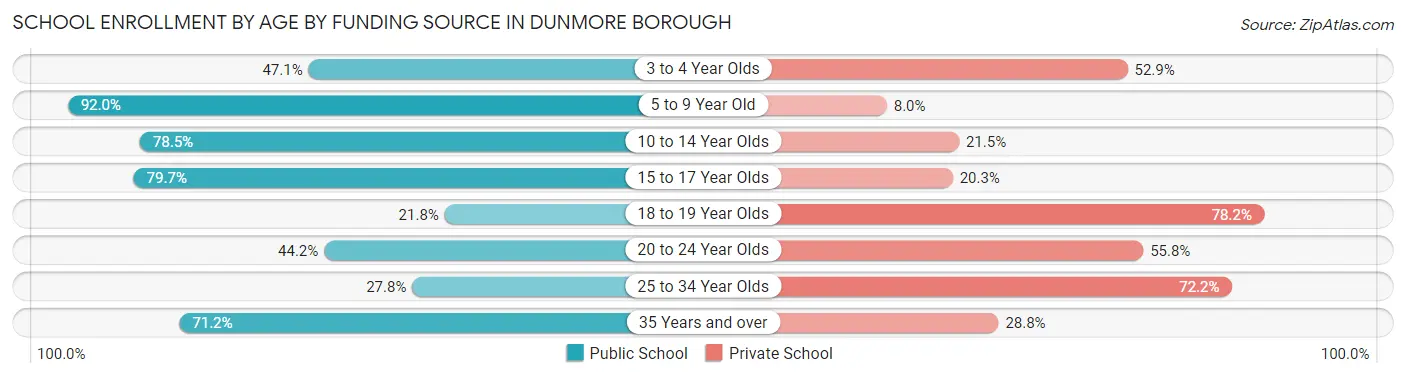
| Age Bracket | Public School | Private School |
| 3 to 4 Year Olds | 49 (47.1%) | 55 (52.9%) |
| 5 to 9 Year Old | 538 (92.0%) | 47 (8.0%) |
| 10 to 14 Year Olds | 702 (78.5%) | 192 (21.5%) |
| 15 to 17 Year Olds | 365 (79.7%) | 93 (20.3%) |
| 18 to 19 Year Olds | 84 (21.8%) | 302 (78.2%) |
| 20 to 24 Year Olds | 321 (44.2%) | 405 (55.8%) |
| 25 to 34 Year Olds | 57 (27.8%) | 148 (72.2%) |
| 35 Years and over | 79 (71.2%) | 32 (28.8%) |
| Total | 2,196 (63.3%) | 1,273 (36.7%) |
Educational Attainment by Field of Study in Dunmore borough
Business (808 | 20.1%), science & technology (484 | 12.0%), education (470 | 11.7%), arts & humanities (392 | 9.8%), and engineering (292 | 7.3%) are the most common fields of study among 4,018 individuals in Dunmore borough who have obtained a bachelor's degree or higher.
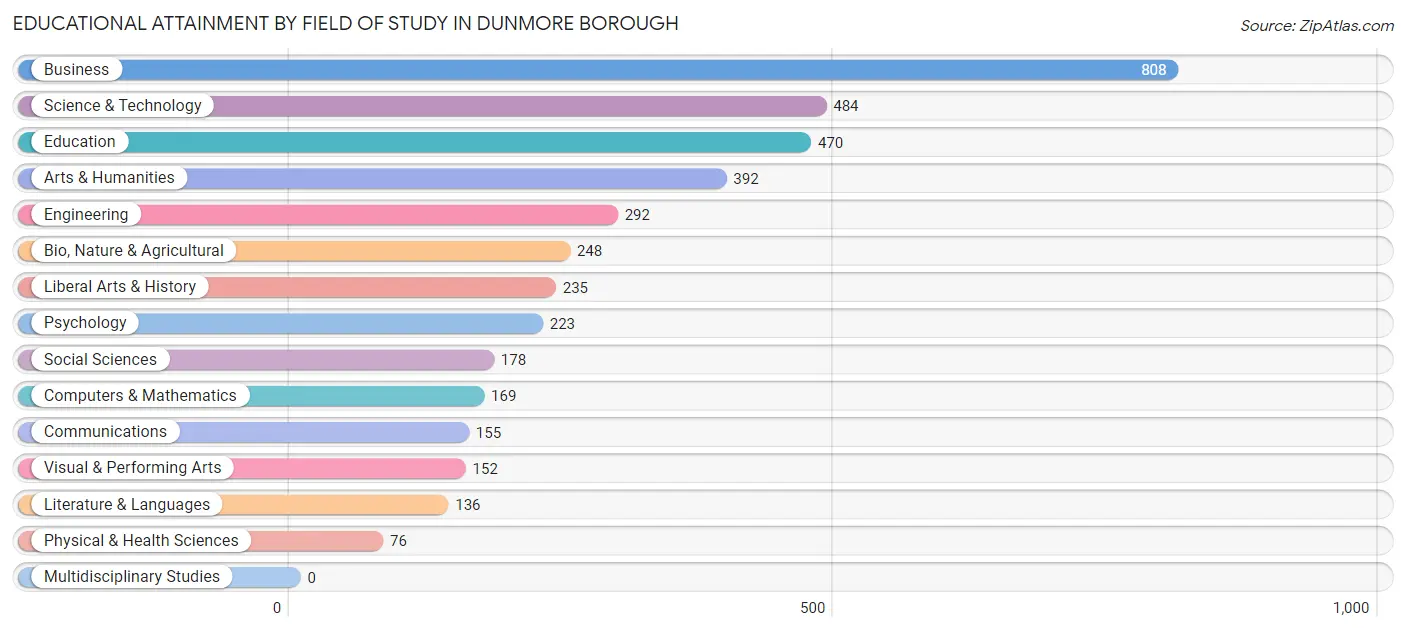
| Field of Study | # Graduates | % Graduates |
| Computers & Mathematics | 169 | 4.2% |
| Bio, Nature & Agricultural | 248 | 6.2% |
| Physical & Health Sciences | 76 | 1.9% |
| Psychology | 223 | 5.6% |
| Social Sciences | 178 | 4.4% |
| Engineering | 292 | 7.3% |
| Multidisciplinary Studies | 0 | 0.0% |
| Science & Technology | 484 | 12.0% |
| Business | 808 | 20.1% |
| Education | 470 | 11.7% |
| Literature & Languages | 136 | 3.4% |
| Liberal Arts & History | 235 | 5.9% |
| Visual & Performing Arts | 152 | 3.8% |
| Communications | 155 | 3.9% |
| Arts & Humanities | 392 | 9.8% |
| Total | 4,018 | 100.0% |
Transportation & Commute in Dunmore borough
Vehicle Availability by Sex in Dunmore borough
The most prevalent vehicle ownership categories in Dunmore borough are males with 2 vehicles (1,592, accounting for 43.5%) and females with 2 vehicles (1,418, making up 52.3%).
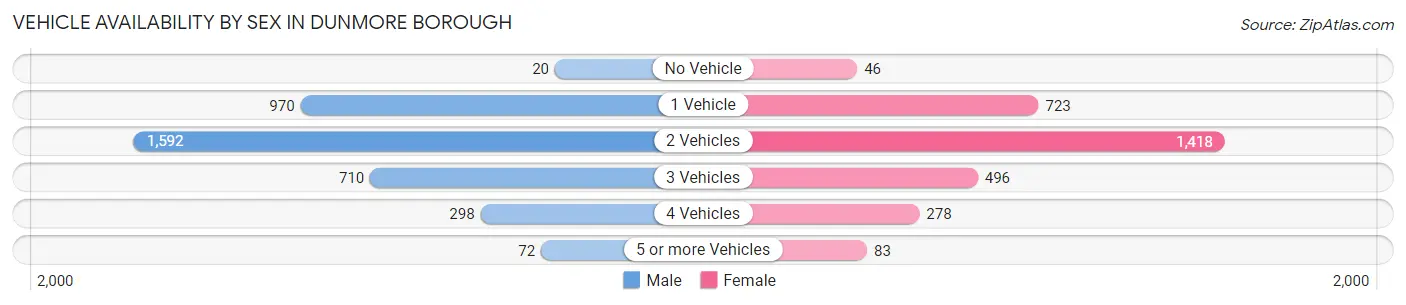
| Vehicles Available | Male | Female |
| No Vehicle | 20 (0.5%) | 46 (1.5%) |
| 1 Vehicle | 970 (26.5%) | 723 (23.7%) |
| 2 Vehicles | 1,592 (43.5%) | 1,418 (46.6%) |
| 3 Vehicles | 710 (19.4%) | 496 (16.3%) |
| 4 Vehicles | 298 (8.1%) | 278 (9.1%) |
| 5 or more Vehicles | 72 (2.0%) | 83 (2.7%) |
| Total | 3,662 (100.0%) | 3,044 (100.0%) |
Commute Time in Dunmore borough
The most frequently occuring commute durations in Dunmore borough are 10 to 14 minutes (1,824 commuters, 29.3%), 15 to 19 minutes (1,232 commuters, 19.8%), and 20 to 24 minutes (802 commuters, 12.9%).
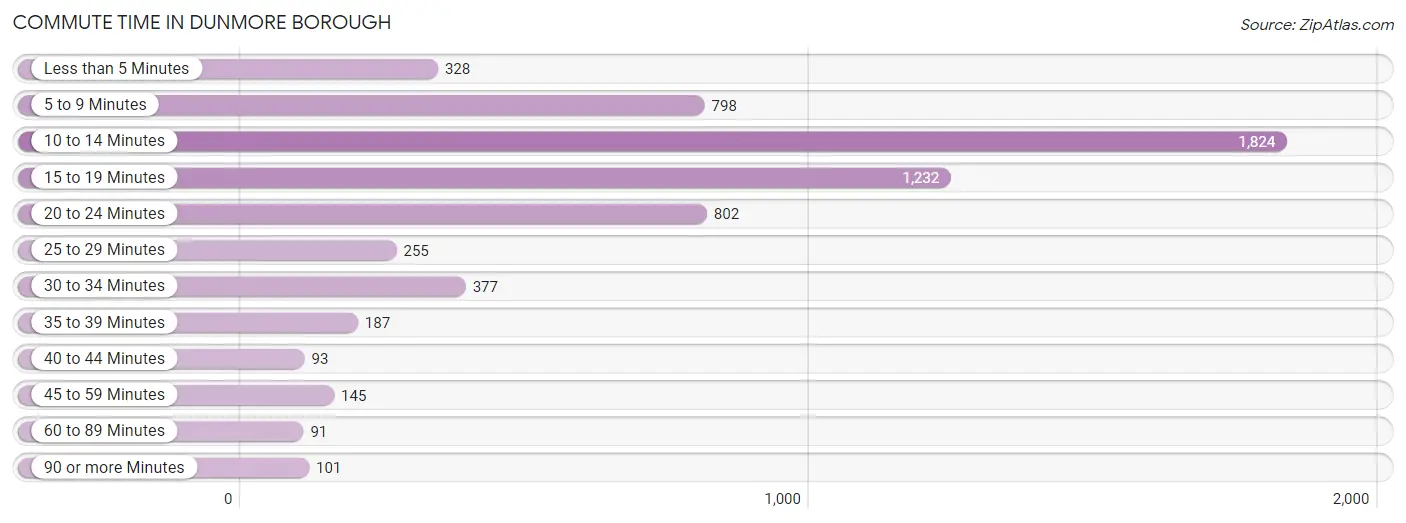
| Commute Time | # Commuters | % Commuters |
| Less than 5 Minutes | 328 | 5.3% |
| 5 to 9 Minutes | 798 | 12.8% |
| 10 to 14 Minutes | 1,824 | 29.3% |
| 15 to 19 Minutes | 1,232 | 19.8% |
| 20 to 24 Minutes | 802 | 12.9% |
| 25 to 29 Minutes | 255 | 4.1% |
| 30 to 34 Minutes | 377 | 6.0% |
| 35 to 39 Minutes | 187 | 3.0% |
| 40 to 44 Minutes | 93 | 1.5% |
| 45 to 59 Minutes | 145 | 2.3% |
| 60 to 89 Minutes | 91 | 1.5% |
| 90 or more Minutes | 101 | 1.6% |
Commute Time by Sex in Dunmore borough
The most common commute times in Dunmore borough are 10 to 14 minutes (1,013 commuters, 29.4%) for males and 10 to 14 minutes (811 commuters, 29.1%) for females.
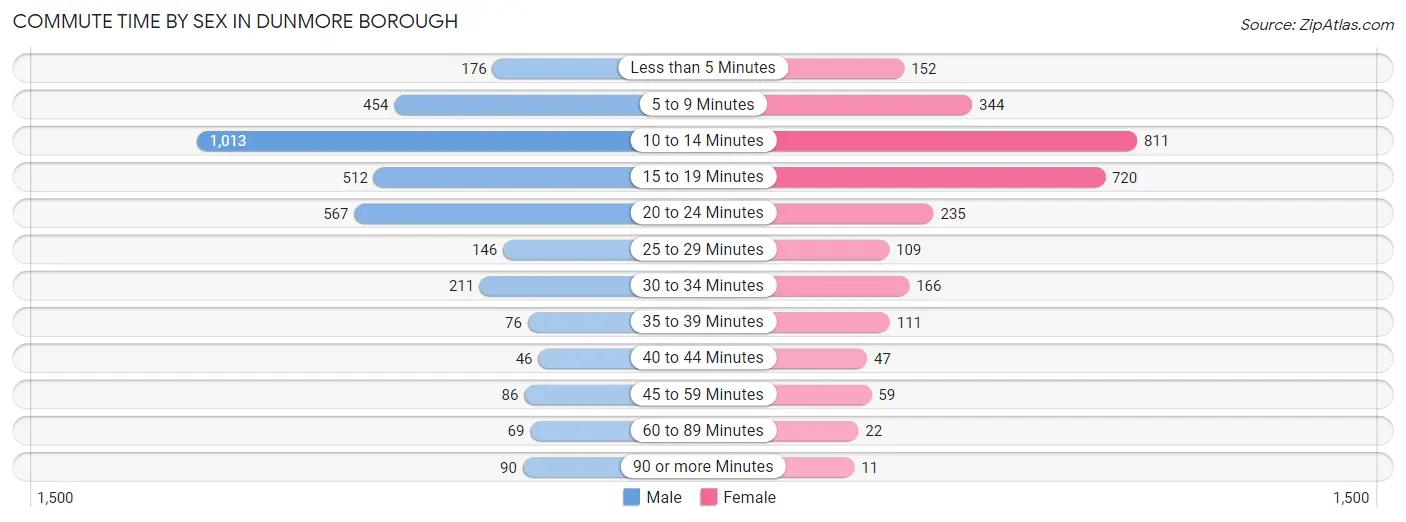
| Commute Time | Male | Female |
| Less than 5 Minutes | 176 (5.1%) | 152 (5.4%) |
| 5 to 9 Minutes | 454 (13.2%) | 344 (12.3%) |
| 10 to 14 Minutes | 1,013 (29.4%) | 811 (29.1%) |
| 15 to 19 Minutes | 512 (14.9%) | 720 (25.8%) |
| 20 to 24 Minutes | 567 (16.5%) | 235 (8.4%) |
| 25 to 29 Minutes | 146 (4.2%) | 109 (3.9%) |
| 30 to 34 Minutes | 211 (6.1%) | 166 (6.0%) |
| 35 to 39 Minutes | 76 (2.2%) | 111 (4.0%) |
| 40 to 44 Minutes | 46 (1.3%) | 47 (1.7%) |
| 45 to 59 Minutes | 86 (2.5%) | 59 (2.1%) |
| 60 to 89 Minutes | 69 (2.0%) | 22 (0.8%) |
| 90 or more Minutes | 90 (2.6%) | 11 (0.4%) |
Time of Departure to Work by Sex in Dunmore borough
The most frequent times of departure to work in Dunmore borough are 8:00 AM to 8:29 AM (553, 16.1%) for males and 8:00 AM to 8:29 AM (457, 16.4%) for females.
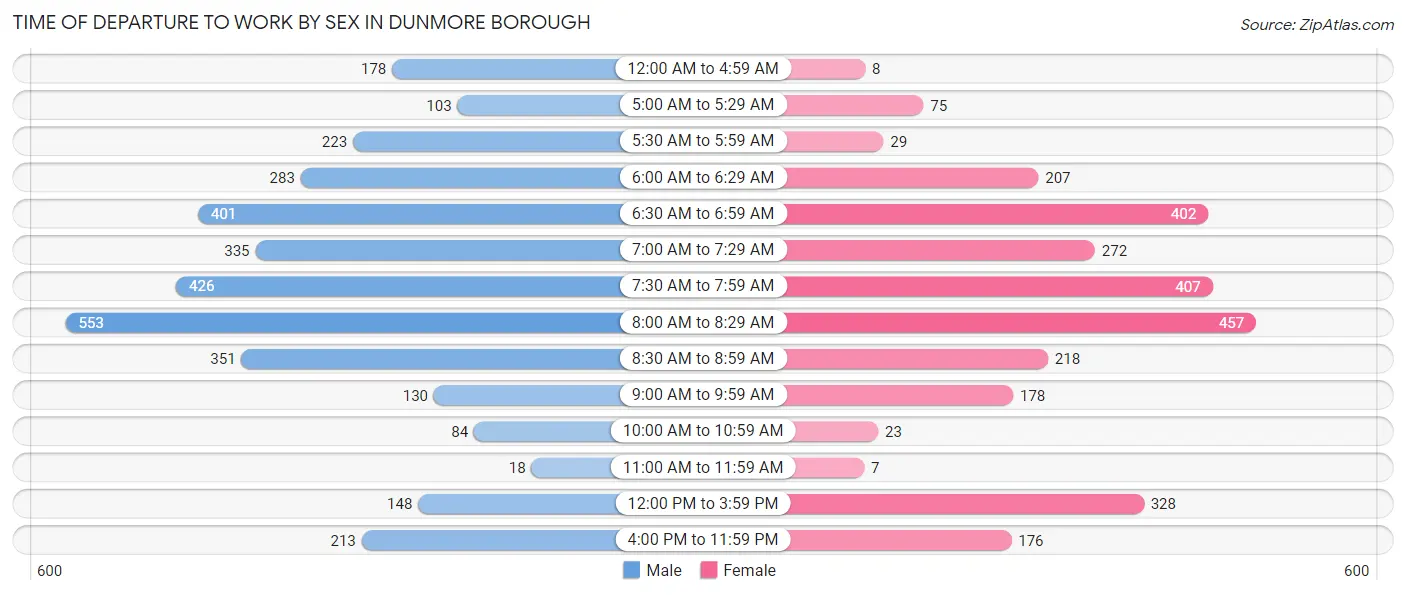
| Time of Departure | Male | Female |
| 12:00 AM to 4:59 AM | 178 (5.2%) | 8 (0.3%) |
| 5:00 AM to 5:29 AM | 103 (3.0%) | 75 (2.7%) |
| 5:30 AM to 5:59 AM | 223 (6.5%) | 29 (1.0%) |
| 6:00 AM to 6:29 AM | 283 (8.2%) | 207 (7.4%) |
| 6:30 AM to 6:59 AM | 401 (11.6%) | 402 (14.4%) |
| 7:00 AM to 7:29 AM | 335 (9.7%) | 272 (9.8%) |
| 7:30 AM to 7:59 AM | 426 (12.4%) | 407 (14.6%) |
| 8:00 AM to 8:29 AM | 553 (16.1%) | 457 (16.4%) |
| 8:30 AM to 8:59 AM | 351 (10.2%) | 218 (7.8%) |
| 9:00 AM to 9:59 AM | 130 (3.8%) | 178 (6.4%) |
| 10:00 AM to 10:59 AM | 84 (2.4%) | 23 (0.8%) |
| 11:00 AM to 11:59 AM | 18 (0.5%) | 7 (0.3%) |
| 12:00 PM to 3:59 PM | 148 (4.3%) | 328 (11.8%) |
| 4:00 PM to 11:59 PM | 213 (6.2%) | 176 (6.3%) |
| Total | 3,446 (100.0%) | 2,787 (100.0%) |
Housing Occupancy in Dunmore borough
Occupancy by Ownership in Dunmore borough
Of the total 5,885 dwellings in Dunmore borough, owner-occupied units account for 3,559 (60.5%), while renter-occupied units make up 2,326 (39.5%).
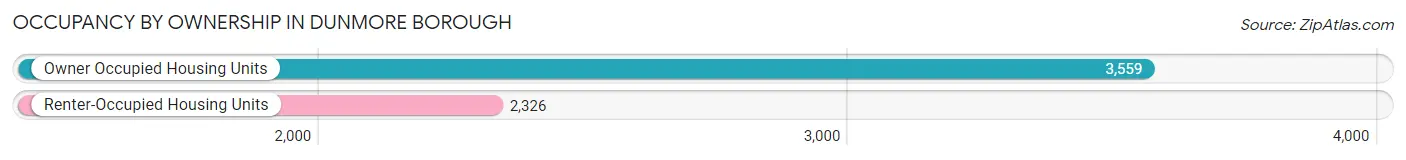
| Occupancy | # Housing Units | % Housing Units |
| Owner Occupied Housing Units | 3,559 | 60.5% |
| Renter-Occupied Housing Units | 2,326 | 39.5% |
| Total Occupied Housing Units | 5,885 | 100.0% |
Occupancy by Household Size in Dunmore borough
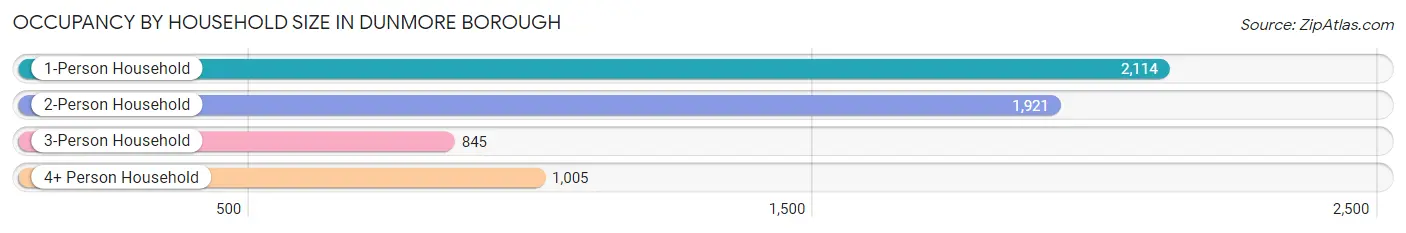
| Household Size | # Housing Units | % Housing Units |
| 1-Person Household | 2,114 | 35.9% |
| 2-Person Household | 1,921 | 32.6% |
| 3-Person Household | 845 | 14.4% |
| 4+ Person Household | 1,005 | 17.1% |
| Total Housing Units | 5,885 | 100.0% |
Occupancy by Ownership by Household Size in Dunmore borough
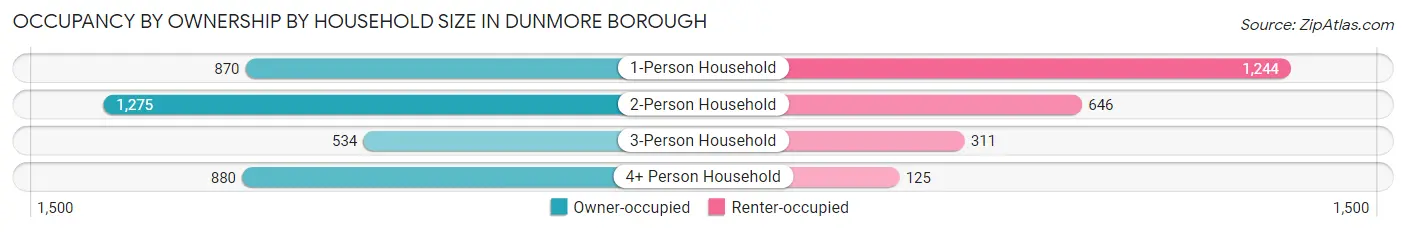
| Household Size | Owner-occupied | Renter-occupied |
| 1-Person Household | 870 (41.1%) | 1,244 (58.9%) |
| 2-Person Household | 1,275 (66.4%) | 646 (33.6%) |
| 3-Person Household | 534 (63.2%) | 311 (36.8%) |
| 4+ Person Household | 880 (87.6%) | 125 (12.4%) |
| Total Housing Units | 3,559 (60.5%) | 2,326 (39.5%) |
Occupancy by Educational Attainment in Dunmore borough
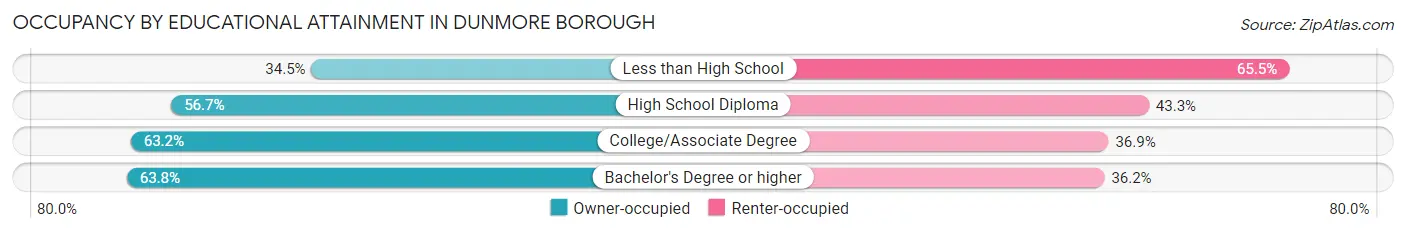
| Household Size | Owner-occupied | Renter-occupied |
| Less than High School | 88 (34.5%) | 167 (65.5%) |
| High School Diploma | 871 (56.7%) | 664 (43.3%) |
| College/Associate Degree | 1,203 (63.1%) | 702 (36.8%) |
| Bachelor's Degree or higher | 1,397 (63.8%) | 793 (36.2%) |
Occupancy by Age of Householder in Dunmore borough
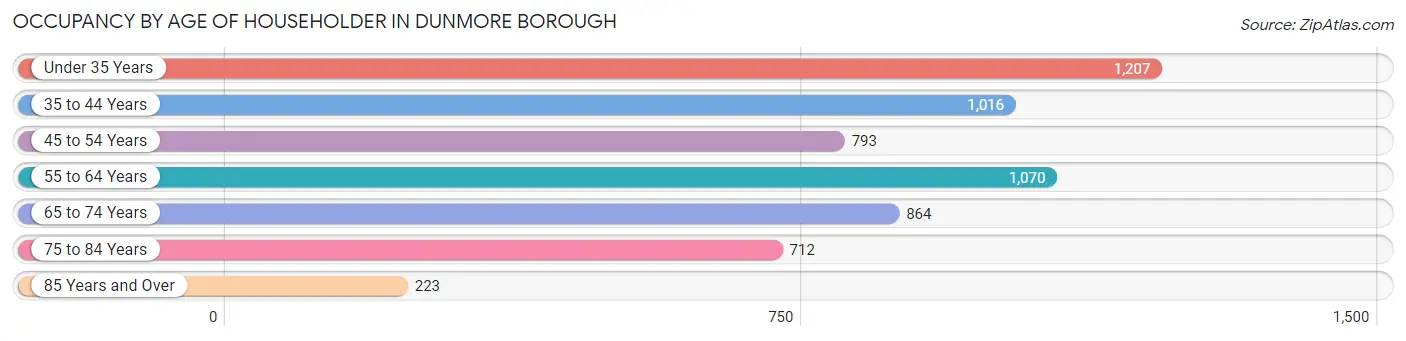
| Age Bracket | # Households | % Households |
| Under 35 Years | 1,207 | 20.5% |
| 35 to 44 Years | 1,016 | 17.3% |
| 45 to 54 Years | 793 | 13.5% |
| 55 to 64 Years | 1,070 | 18.2% |
| 65 to 74 Years | 864 | 14.7% |
| 75 to 84 Years | 712 | 12.1% |
| 85 Years and Over | 223 | 3.8% |
| Total | 5,885 | 100.0% |
Housing Finances in Dunmore borough
Median Income by Occupancy in Dunmore borough
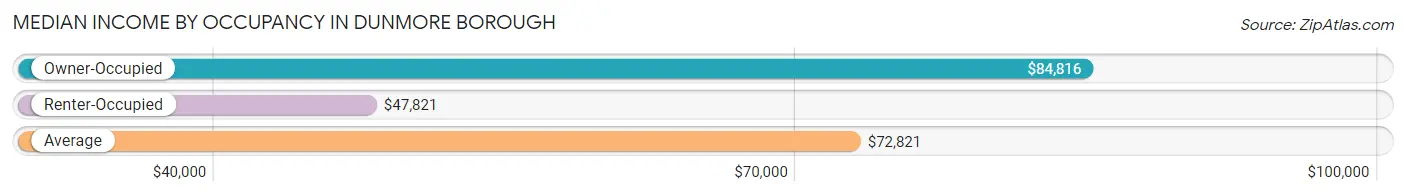
| Occupancy Type | # Households | Median Income |
| Owner-Occupied | 3,559 (60.5%) | $84,816 |
| Renter-Occupied | 2,326 (39.5%) | $47,821 |
| Average | 5,885 (100.0%) | $72,821 |
Occupancy by Householder Income Bracket in Dunmore borough
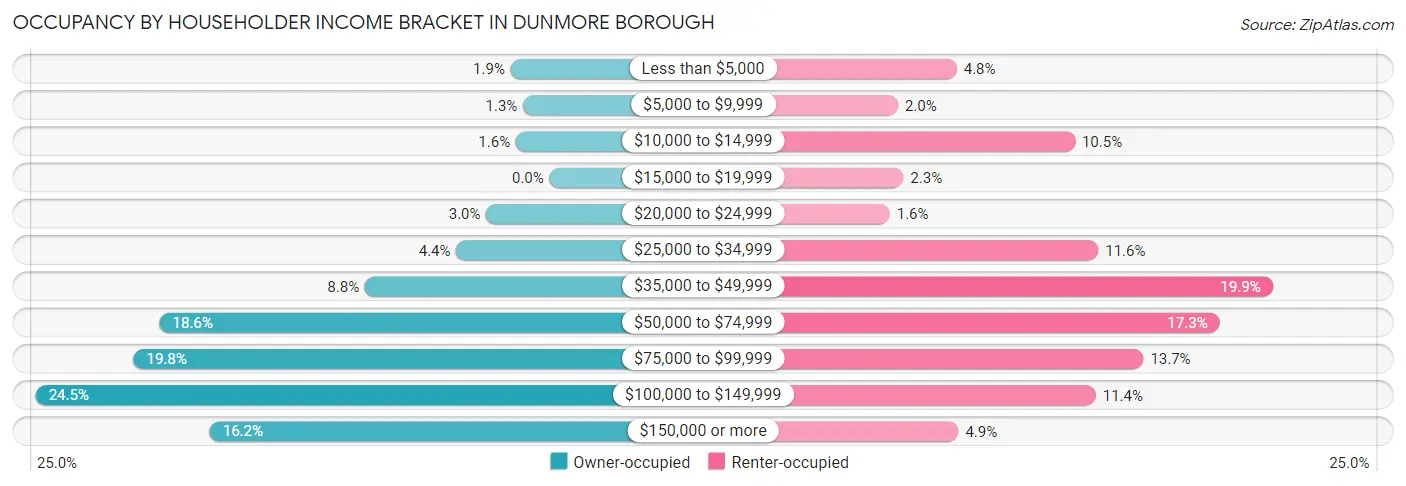
| Income Bracket | Owner-occupied | Renter-occupied |
| Less than $5,000 | 66 (1.8%) | 112 (4.8%) |
| $5,000 to $9,999 | 45 (1.3%) | 47 (2.0%) |
| $10,000 to $14,999 | 57 (1.6%) | 243 (10.4%) |
| $15,000 to $19,999 | 0 (0.0%) | 53 (2.3%) |
| $20,000 to $24,999 | 107 (3.0%) | 38 (1.6%) |
| $25,000 to $34,999 | 158 (4.4%) | 269 (11.6%) |
| $35,000 to $49,999 | 313 (8.8%) | 462 (19.9%) |
| $50,000 to $74,999 | 661 (18.6%) | 403 (17.3%) |
| $75,000 to $99,999 | 705 (19.8%) | 319 (13.7%) |
| $100,000 to $149,999 | 871 (24.5%) | 266 (11.4%) |
| $150,000 or more | 576 (16.2%) | 114 (4.9%) |
| Total | 3,559 (100.0%) | 2,326 (100.0%) |
Monthly Housing Cost Tiers in Dunmore borough
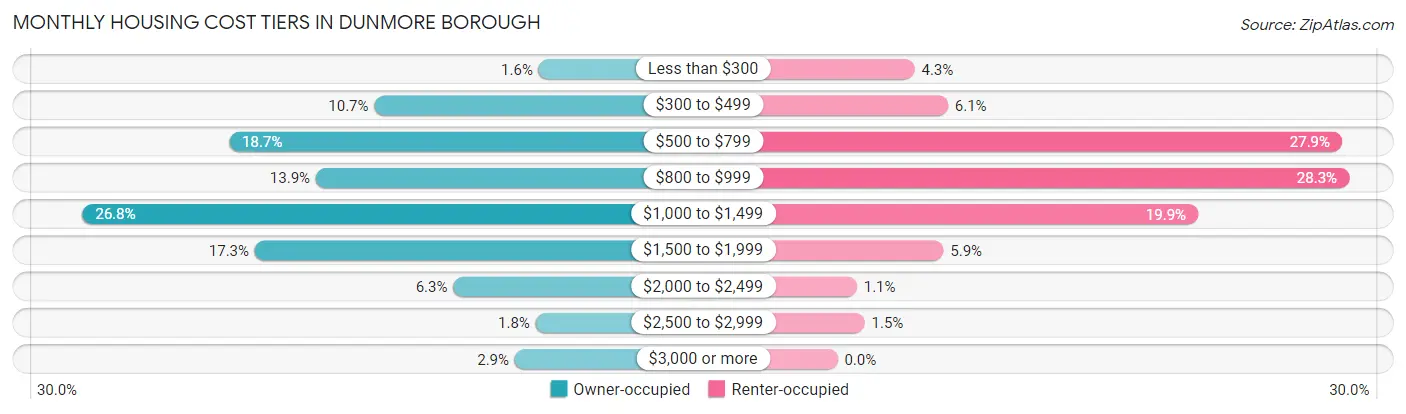
| Monthly Cost | Owner-occupied | Renter-occupied |
| Less than $300 | 57 (1.6%) | 99 (4.3%) |
| $300 to $499 | 380 (10.7%) | 142 (6.1%) |
| $500 to $799 | 666 (18.7%) | 648 (27.9%) |
| $800 to $999 | 495 (13.9%) | 657 (28.2%) |
| $1,000 to $1,499 | 954 (26.8%) | 463 (19.9%) |
| $1,500 to $1,999 | 615 (17.3%) | 136 (5.9%) |
| $2,000 to $2,499 | 225 (6.3%) | 25 (1.1%) |
| $2,500 to $2,999 | 63 (1.8%) | 35 (1.5%) |
| $3,000 or more | 104 (2.9%) | 0 (0.0%) |
| Total | 3,559 (100.0%) | 2,326 (100.0%) |
Physical Housing Characteristics in Dunmore borough
Housing Structures in Dunmore borough
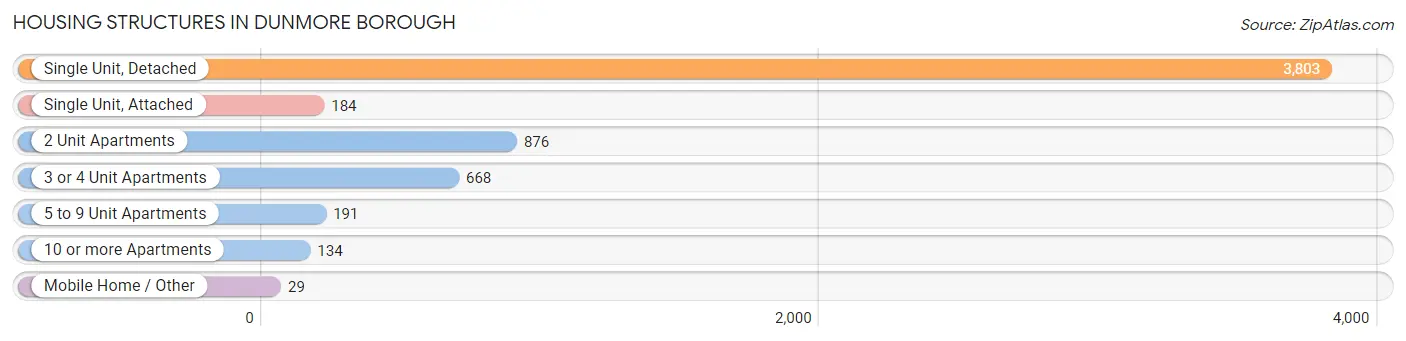
| Structure Type | # Housing Units | % Housing Units |
| Single Unit, Detached | 3,803 | 64.6% |
| Single Unit, Attached | 184 | 3.1% |
| 2 Unit Apartments | 876 | 14.9% |
| 3 or 4 Unit Apartments | 668 | 11.4% |
| 5 to 9 Unit Apartments | 191 | 3.3% |
| 10 or more Apartments | 134 | 2.3% |
| Mobile Home / Other | 29 | 0.5% |
| Total | 5,885 | 100.0% |
Housing Structures by Occupancy in Dunmore borough
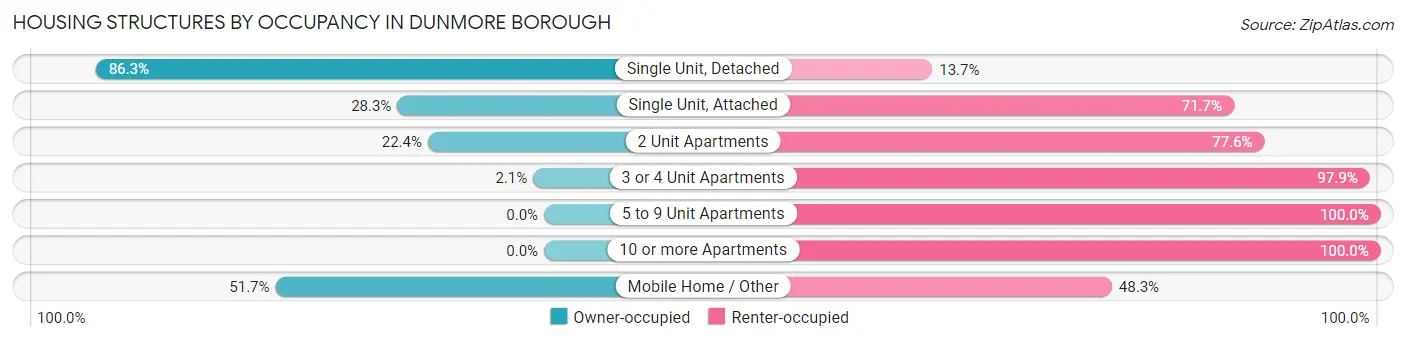
| Structure Type | Owner-occupied | Renter-occupied |
| Single Unit, Detached | 3,282 (86.3%) | 521 (13.7%) |
| Single Unit, Attached | 52 (28.3%) | 132 (71.7%) |
| 2 Unit Apartments | 196 (22.4%) | 680 (77.6%) |
| 3 or 4 Unit Apartments | 14 (2.1%) | 654 (97.9%) |
| 5 to 9 Unit Apartments | 0 (0.0%) | 191 (100.0%) |
| 10 or more Apartments | 0 (0.0%) | 134 (100.0%) |
| Mobile Home / Other | 15 (51.7%) | 14 (48.3%) |
| Total | 3,559 (60.5%) | 2,326 (39.5%) |
Housing Structures by Number of Rooms in Dunmore borough
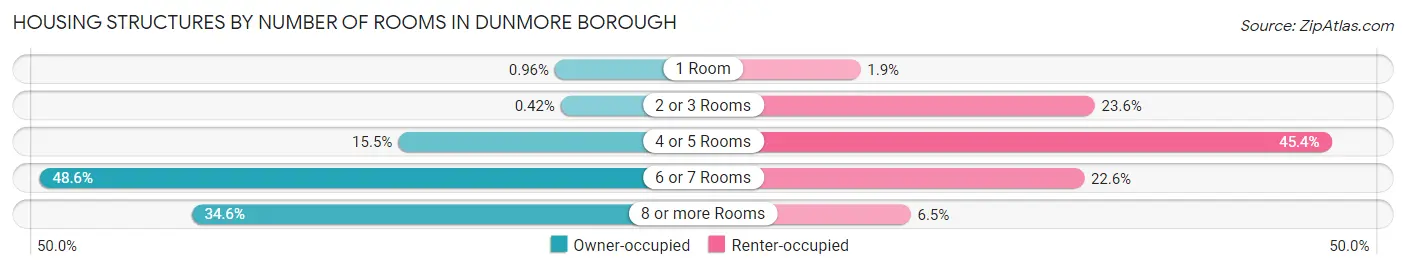
| Number of Rooms | Owner-occupied | Renter-occupied |
| 1 Room | 34 (1.0%) | 44 (1.9%) |
| 2 or 3 Rooms | 15 (0.4%) | 548 (23.6%) |
| 4 or 5 Rooms | 550 (15.4%) | 1,057 (45.4%) |
| 6 or 7 Rooms | 1,730 (48.6%) | 525 (22.6%) |
| 8 or more Rooms | 1,230 (34.6%) | 152 (6.5%) |
| Total | 3,559 (100.0%) | 2,326 (100.0%) |
Housing Structure by Heating Type in Dunmore borough
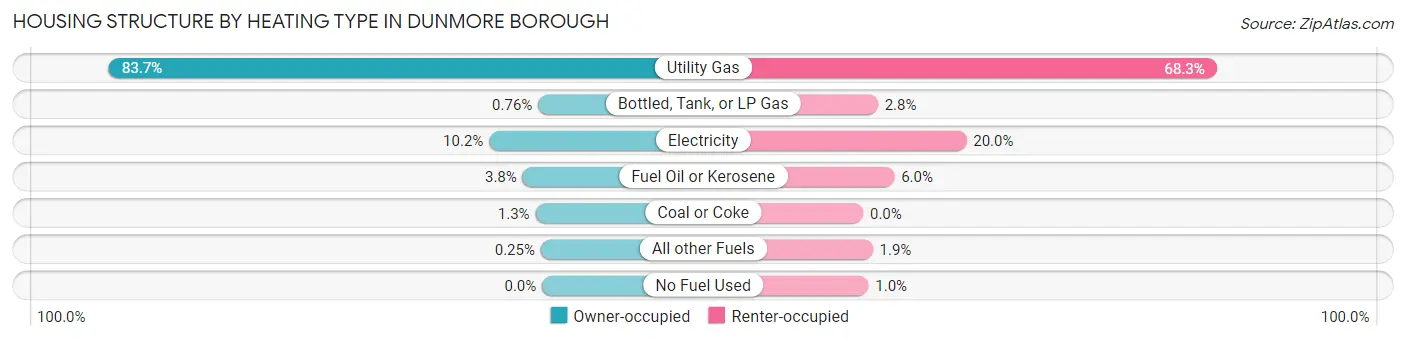
| Heating Type | Owner-occupied | Renter-occupied |
| Utility Gas | 2,979 (83.7%) | 1,589 (68.3%) |
| Bottled, Tank, or LP Gas | 27 (0.8%) | 66 (2.8%) |
| Electricity | 364 (10.2%) | 464 (20.0%) |
| Fuel Oil or Kerosene | 134 (3.8%) | 140 (6.0%) |
| Coal or Coke | 46 (1.3%) | 0 (0.0%) |
| All other Fuels | 9 (0.3%) | 43 (1.8%) |
| No Fuel Used | 0 (0.0%) | 24 (1.0%) |
| Total | 3,559 (100.0%) | 2,326 (100.0%) |
Household Vehicle Usage in Dunmore borough
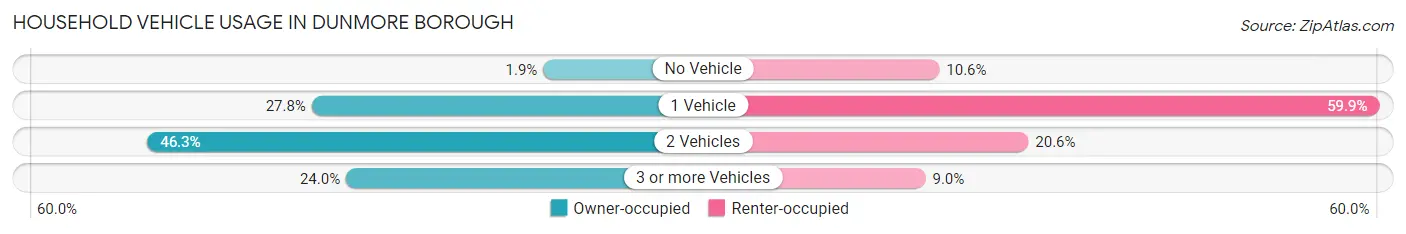
| Vehicles per Household | Owner-occupied | Renter-occupied |
| No Vehicle | 68 (1.9%) | 246 (10.6%) |
| 1 Vehicle | 991 (27.8%) | 1,392 (59.9%) |
| 2 Vehicles | 1,646 (46.3%) | 478 (20.5%) |
| 3 or more Vehicles | 854 (24.0%) | 210 (9.0%) |
| Total | 3,559 (100.0%) | 2,326 (100.0%) |
Real Estate & Mortgages in Dunmore borough
Real Estate and Mortgage Overview in Dunmore borough
| Characteristic | Without Mortgage | With Mortgage |
| Housing Units | 1,453 | 2,106 |
| Median Property Value | $185,600 | $185,100 |
| Median Household Income | $73,517 | $335 |
| Monthly Housing Costs | $667 | $104 |
| Real Estate Taxes | $2,924 | $25 |
Property Value by Mortgage Status in Dunmore borough
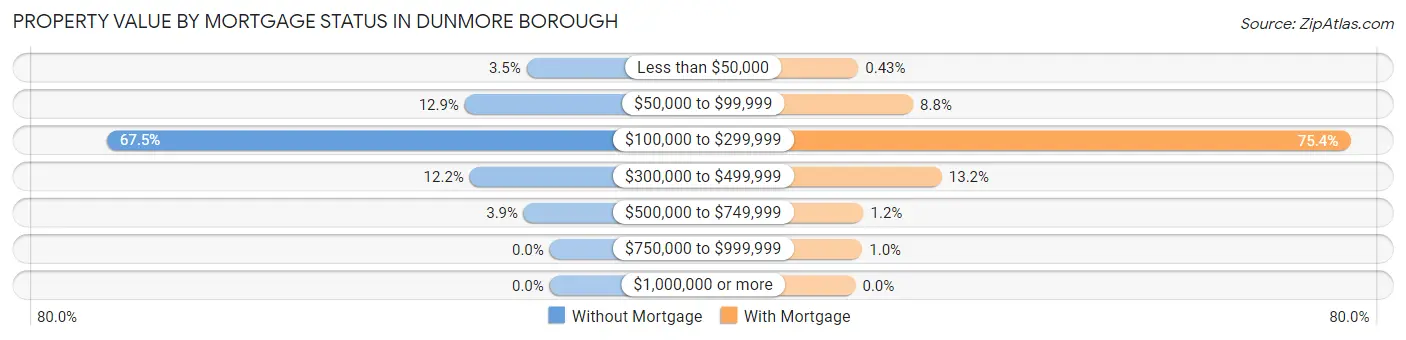
| Property Value | Without Mortgage | With Mortgage |
| Less than $50,000 | 51 (3.5%) | 9 (0.4%) |
| $50,000 to $99,999 | 188 (12.9%) | 185 (8.8%) |
| $100,000 to $299,999 | 980 (67.4%) | 1,587 (75.4%) |
| $300,000 to $499,999 | 177 (12.2%) | 277 (13.2%) |
| $500,000 to $749,999 | 57 (3.9%) | 26 (1.2%) |
| $750,000 to $999,999 | 0 (0.0%) | 22 (1.0%) |
| $1,000,000 or more | 0 (0.0%) | 0 (0.0%) |
| Total | 1,453 (100.0%) | 2,106 (100.0%) |
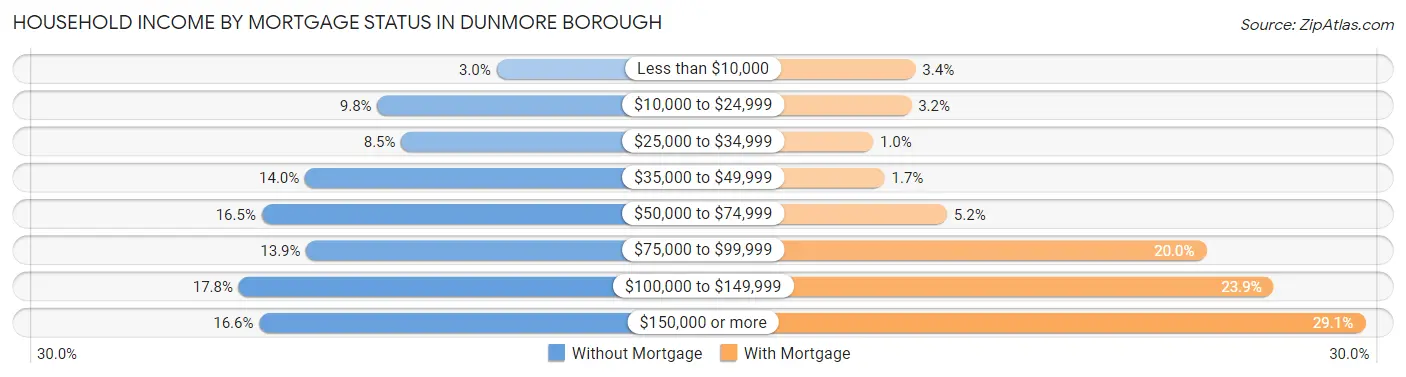
Household Income by Mortgage Status in Dunmore borough
| Household Income | Without Mortgage | With Mortgage |
| Less than $10,000 | 44 (3.0%) | 72 (3.4%) |
| $10,000 to $24,999 | 143 (9.8%) | 67 (3.2%) |
| $25,000 to $34,999 | 123 (8.5%) | 21 (1.0%) |
| $35,000 to $49,999 | 203 (14.0%) | 35 (1.7%) |
| $50,000 to $74,999 | 239 (16.5%) | 110 (5.2%) |
| $75,000 to $99,999 | 202 (13.9%) | 422 (20.0%) |
| $100,000 to $149,999 | 258 (17.8%) | 503 (23.9%) |
| $150,000 or more | 241 (16.6%) | 613 (29.1%) |
| Total | 1,453 (100.0%) | 2,106 (100.0%) |
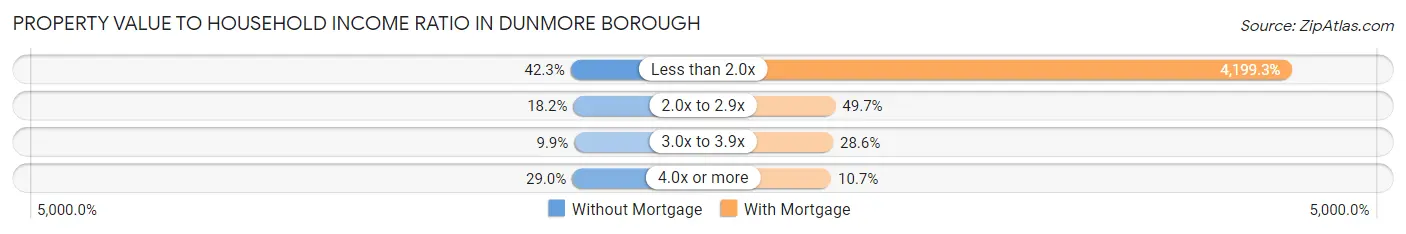
Property Value to Household Income Ratio in Dunmore borough
| Value-to-Income Ratio | Without Mortgage | With Mortgage |
| Less than 2.0x | 615 (42.3%) | 88,438 (4,199.3%) |
| 2.0x to 2.9x | 265 (18.2%) | 1,047 (49.7%) |
| 3.0x to 3.9x | 144 (9.9%) | 603 (28.6%) |
| 4.0x or more | 421 (29.0%) | 225 (10.7%) |
| Total | 1,453 (100.0%) | 2,106 (100.0%) |
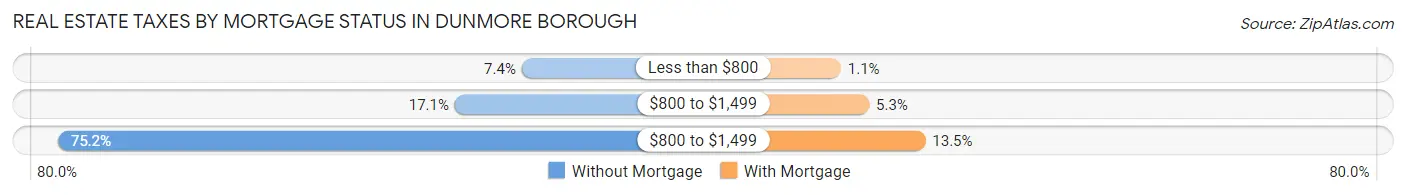
Real Estate Taxes by Mortgage Status in Dunmore borough
| Property Taxes | Without Mortgage | With Mortgage |
| Less than $800 | 107 (7.4%) | 24 (1.1%) |
| $800 to $1,499 | 249 (17.1%) | 111 (5.3%) |
| $800 to $1,499 | 1,092 (75.1%) | 284 (13.5%) |
| Total | 1,453 (100.0%) | 2,106 (100.0%) |
Health & Disability in Dunmore borough
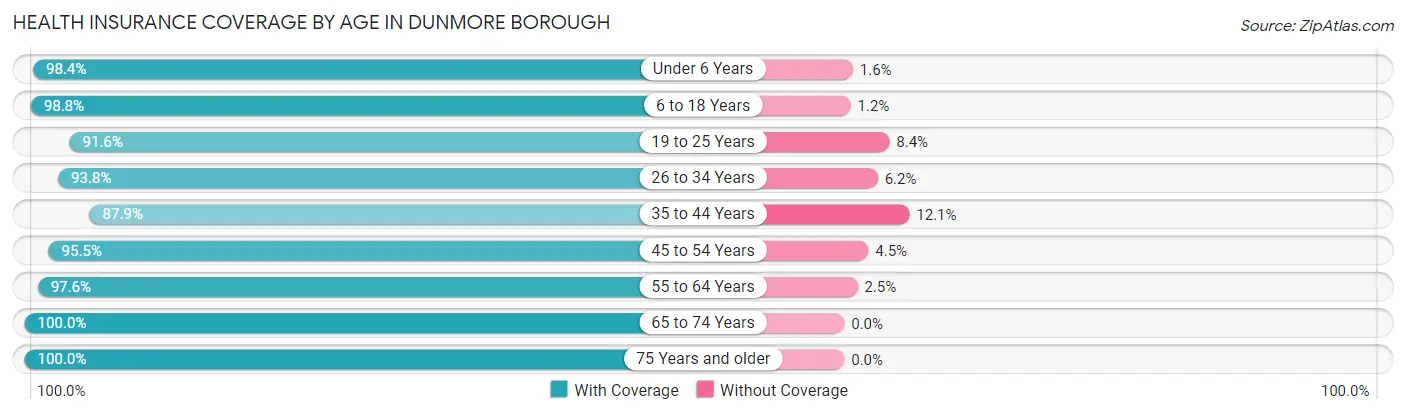
Health Insurance Coverage by Age in Dunmore borough
| Age Bracket | With Coverage | Without Coverage |
| Under 6 Years | 741 (98.4%) | 12 (1.6%) |
| 6 to 18 Years | 2,093 (98.8%) | 25 (1.2%) |
| 19 to 25 Years | 1,254 (91.6%) | 115 (8.4%) |
| 26 to 34 Years | 1,657 (93.8%) | 110 (6.2%) |
| 35 to 44 Years | 1,681 (87.9%) | 232 (12.1%) |
| 45 to 54 Years | 1,216 (95.5%) | 57 (4.5%) |
| 55 to 64 Years | 1,870 (97.6%) | 47 (2.5%) |
| 65 to 74 Years | 1,364 (100.0%) | 0 (0.0%) |
| 75 Years and older | 1,320 (100.0%) | 0 (0.0%) |
| Total | 13,196 (95.7%) | 598 (4.3%) |
Health Insurance Coverage by Citizenship Status in Dunmore borough
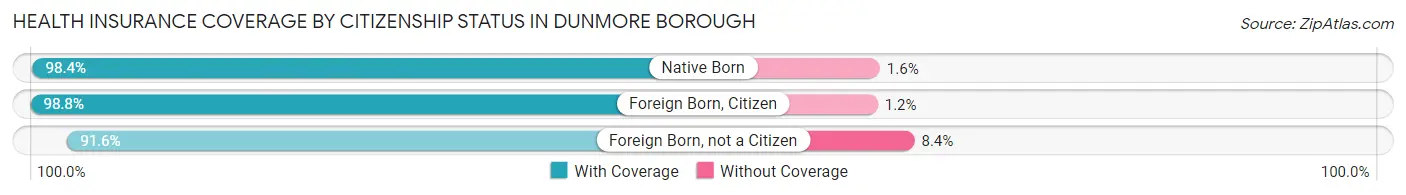
| Citizenship Status | With Coverage | Without Coverage |
| Native Born | 741 (98.4%) | 12 (1.6%) |
| Foreign Born, Citizen | 2,093 (98.8%) | 25 (1.2%) |
| Foreign Born, not a Citizen | 1,254 (91.6%) | 115 (8.4%) |
Health Insurance Coverage by Household Income in Dunmore borough
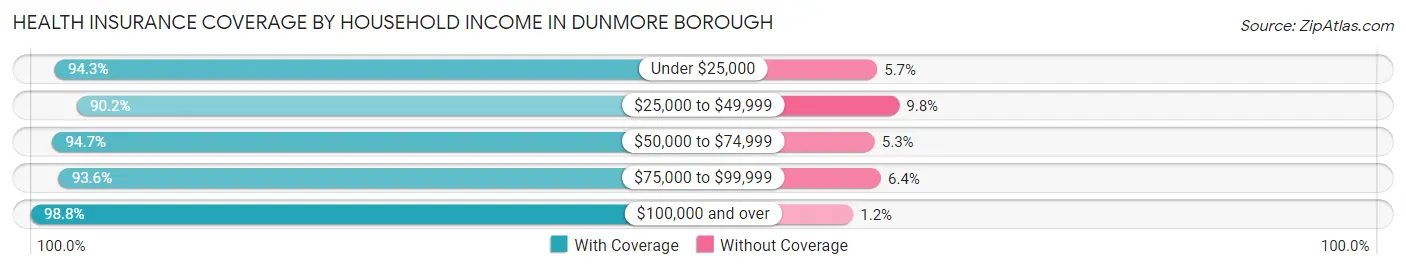
| Household Income | With Coverage | Without Coverage |
| Under $25,000 | 908 (94.3%) | 55 (5.7%) |
| $25,000 to $49,999 | 1,760 (90.2%) | 192 (9.8%) |
| $50,000 to $74,999 | 2,091 (94.7%) | 116 (5.3%) |
| $75,000 to $99,999 | 2,303 (93.6%) | 158 (6.4%) |
| $100,000 and over | 5,467 (98.8%) | 68 (1.2%) |
Public vs Private Health Insurance Coverage by Age in Dunmore borough
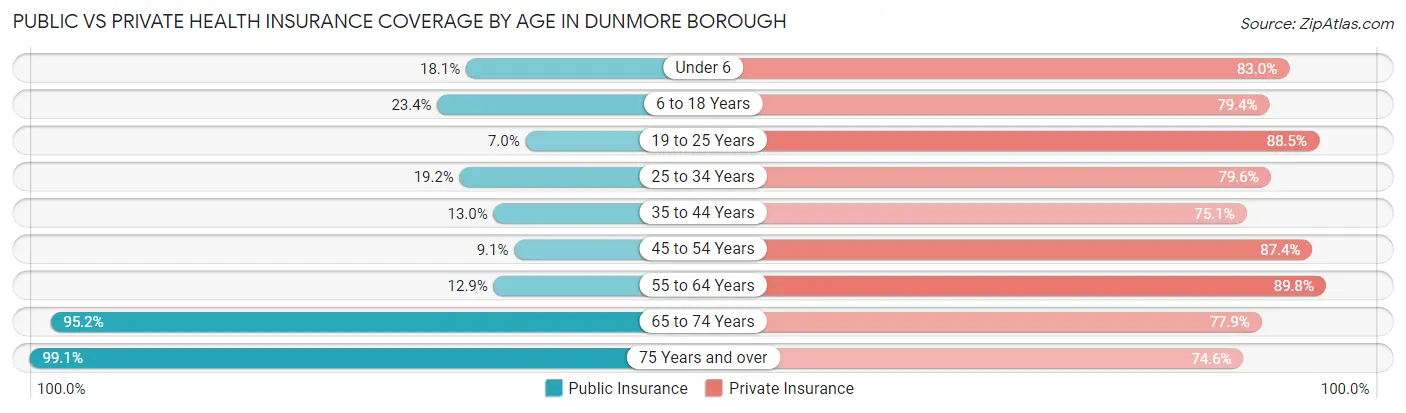
| Age Bracket | Public Insurance | Private Insurance |
| Under 6 | 136 (18.1%) | 625 (83.0%) |
| 6 to 18 Years | 495 (23.4%) | 1,681 (79.4%) |
| 19 to 25 Years | 96 (7.0%) | 1,212 (88.5%) |
| 25 to 34 Years | 340 (19.2%) | 1,406 (79.6%) |
| 35 to 44 Years | 248 (13.0%) | 1,437 (75.1%) |
| 45 to 54 Years | 116 (9.1%) | 1,112 (87.4%) |
| 55 to 64 Years | 248 (12.9%) | 1,722 (89.8%) |
| 65 to 74 Years | 1,299 (95.2%) | 1,063 (77.9%) |
| 75 Years and over | 1,308 (99.1%) | 984 (74.6%) |
| Total | 4,286 (31.1%) | 11,242 (81.5%) |
Disability Status by Sex by Age in Dunmore borough
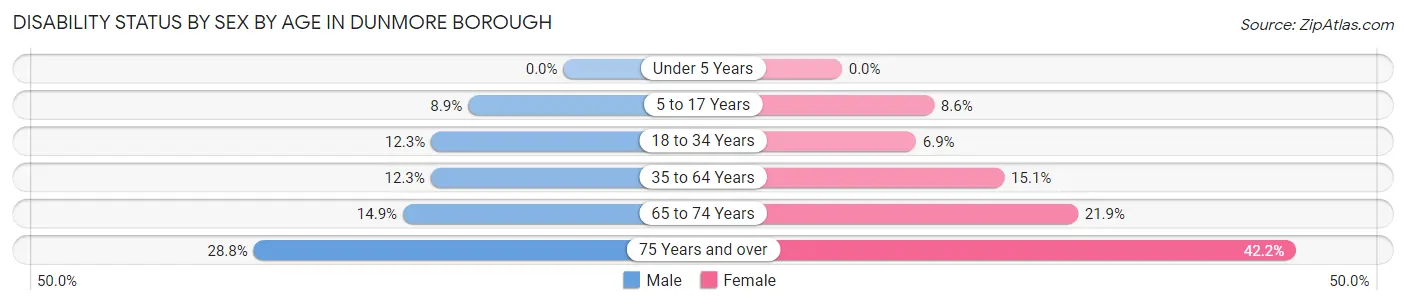
| Age Bracket | Male | Female |
| Under 5 Years | 0 (0.0%) | 0 (0.0%) |
| 5 to 17 Years | 92 (8.8%) | 86 (8.6%) |
| 18 to 34 Years | 219 (12.3%) | 105 (6.9%) |
| 35 to 64 Years | 318 (12.3%) | 380 (15.1%) |
| 65 to 74 Years | 78 (14.9%) | 184 (21.9%) |
| 75 Years and over | 136 (28.7%) | 357 (42.1%) |
Disability Class by Sex by Age in Dunmore borough
Disability Class: Hearing Difficulty
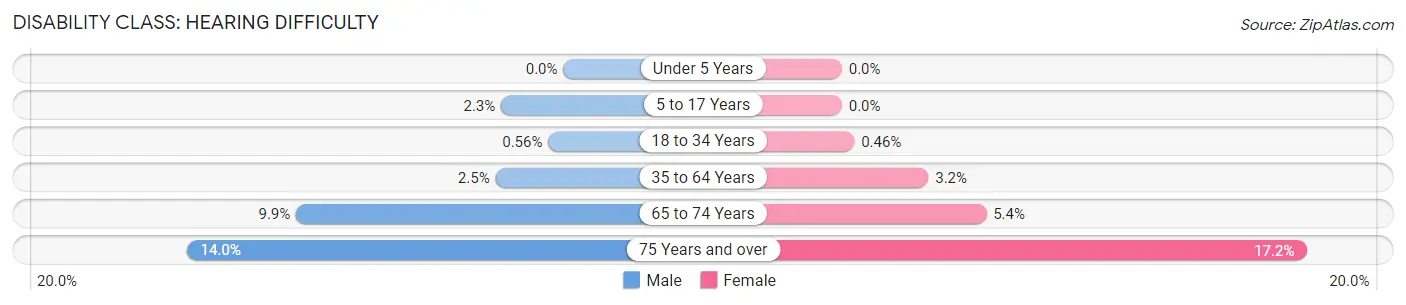
| Age Bracket | Male | Female |
| Under 5 Years | 0 (0.0%) | 0 (0.0%) |
| 5 to 17 Years | 24 (2.3%) | 0 (0.0%) |
| 18 to 34 Years | 10 (0.6%) | 7 (0.5%) |
| 35 to 64 Years | 65 (2.5%) | 81 (3.2%) |
| 65 to 74 Years | 52 (9.9%) | 45 (5.4%) |
| 75 Years and over | 66 (14.0%) | 146 (17.2%) |
Disability Class: Vision Difficulty
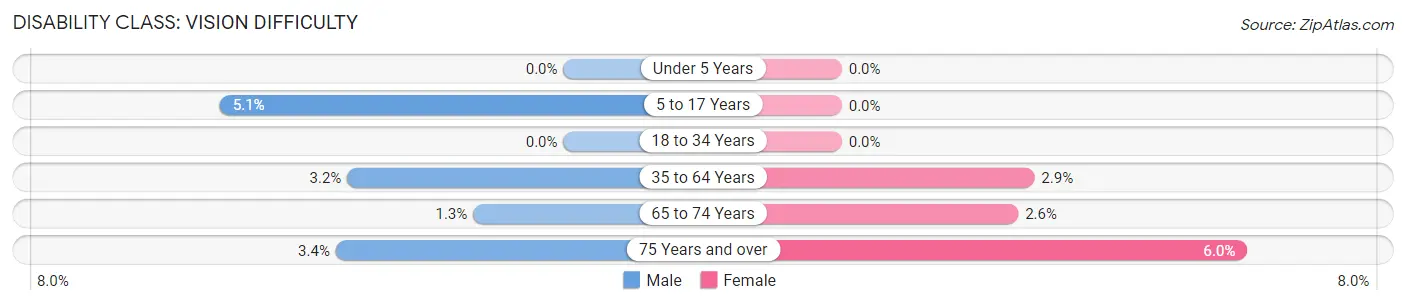
| Age Bracket | Male | Female |
| Under 5 Years | 0 (0.0%) | 0 (0.0%) |
| 5 to 17 Years | 53 (5.1%) | 0 (0.0%) |
| 18 to 34 Years | 0 (0.0%) | 0 (0.0%) |
| 35 to 64 Years | 83 (3.2%) | 72 (2.9%) |
| 65 to 74 Years | 7 (1.3%) | 22 (2.6%) |
| 75 Years and over | 16 (3.4%) | 51 (6.0%) |
Disability Class: Cognitive Difficulty
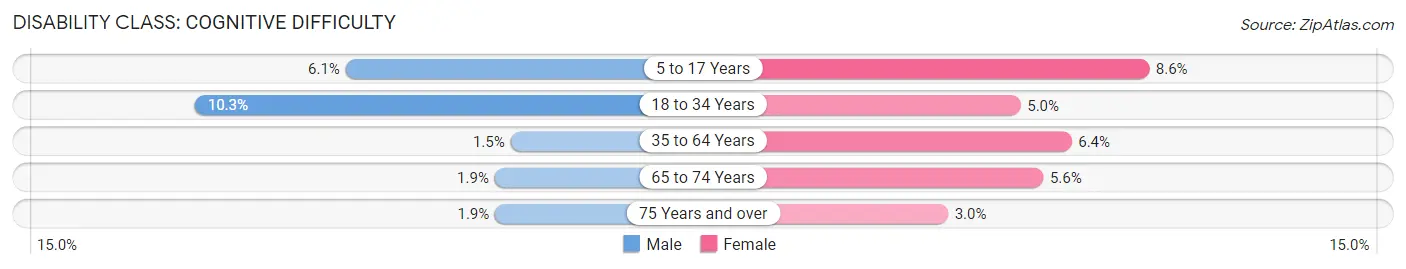
| Age Bracket | Male | Female |
| 5 to 17 Years | 63 (6.1%) | 86 (8.6%) |
| 18 to 34 Years | 183 (10.3%) | 76 (5.0%) |
| 35 to 64 Years | 38 (1.5%) | 161 (6.4%) |
| 65 to 74 Years | 10 (1.9%) | 47 (5.6%) |
| 75 Years and over | 9 (1.9%) | 25 (2.9%) |
Disability Class: Ambulatory Difficulty
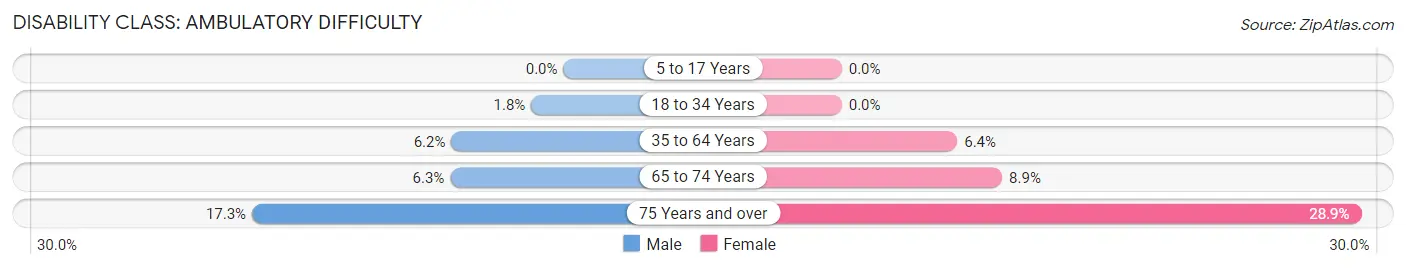
| Age Bracket | Male | Female |
| 5 to 17 Years | 0 (0.0%) | 0 (0.0%) |
| 18 to 34 Years | 32 (1.8%) | 0 (0.0%) |
| 35 to 64 Years | 161 (6.2%) | 162 (6.4%) |
| 65 to 74 Years | 33 (6.3%) | 75 (8.9%) |
| 75 Years and over | 82 (17.3%) | 245 (28.9%) |
Disability Class: Self-Care Difficulty
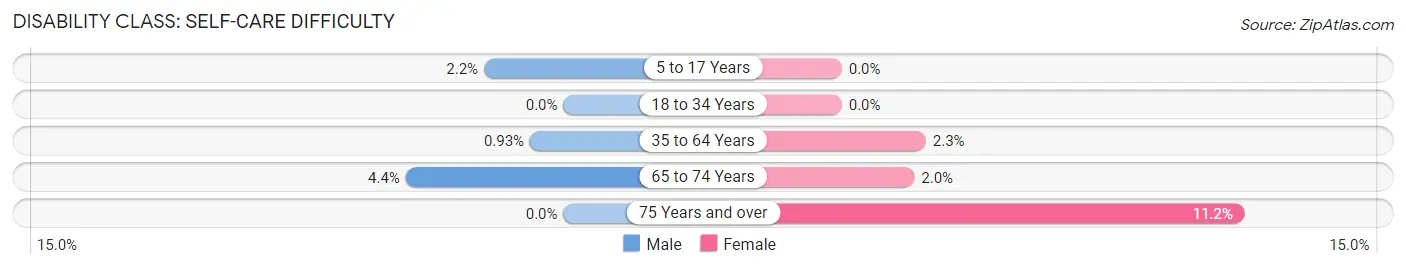
| Age Bracket | Male | Female |
| 5 to 17 Years | 23 (2.2%) | 0 (0.0%) |
| 18 to 34 Years | 0 (0.0%) | 0 (0.0%) |
| 35 to 64 Years | 24 (0.9%) | 59 (2.3%) |
| 65 to 74 Years | 23 (4.4%) | 17 (2.0%) |
| 75 Years and over | 0 (0.0%) | 95 (11.2%) |
Technology Access in Dunmore borough
Computing Device Access in Dunmore borough
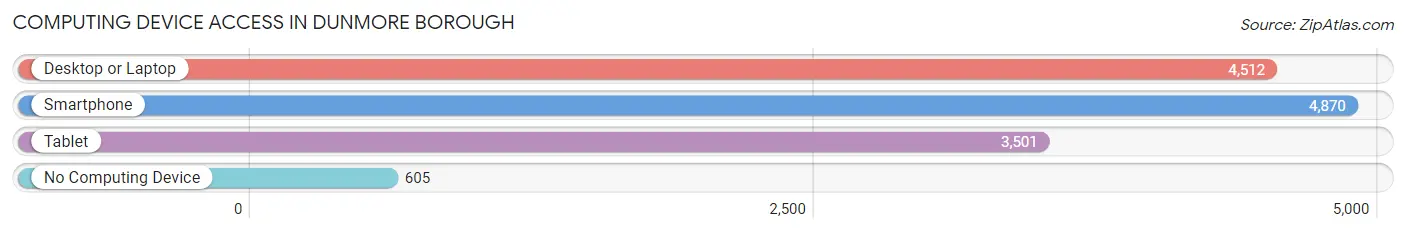
| Device Type | # Households | % Households |
| Desktop or Laptop | 4,512 | 76.7% |
| Smartphone | 4,870 | 82.8% |
| Tablet | 3,501 | 59.5% |
| No Computing Device | 605 | 10.3% |
| Total | 5,885 | 100.0% |
Internet Access in Dunmore borough
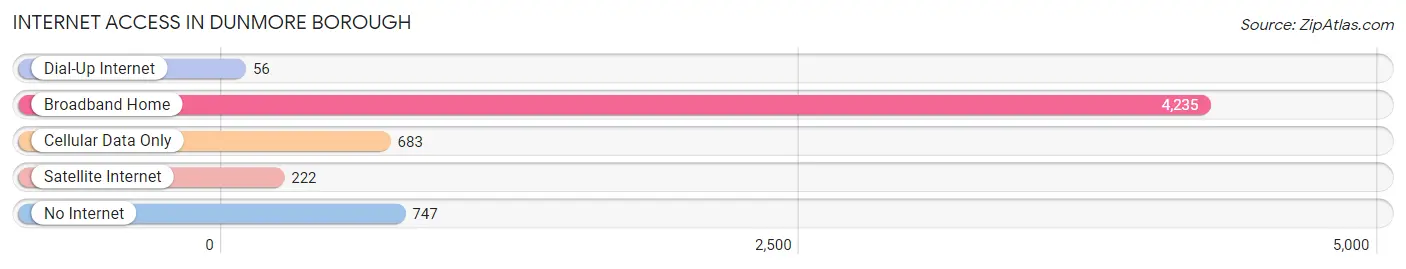
| Internet Type | # Households | % Households |
| Dial-Up Internet | 56 | 0.9% |
| Broadband Home | 4,235 | 72.0% |
| Cellular Data Only | 683 | 11.6% |
| Satellite Internet | 222 | 3.8% |
| No Internet | 747 | 12.7% |
| Total | 5,885 | 100.0% |
Dunmore borough Summary
Dunmore Borough is a small borough located in Lackawanna County, Pennsylvania. It is situated in the heart of the Pocono Mountains and is home to a population of approximately 8,000 people. The borough is bordered by the cities of Scranton and Wilkes-Barre, and is located just a few miles from the New York state border.
History
The area that is now Dunmore Borough was first settled in the late 1700s by a group of Irish immigrants. The town was originally known as “Irishtown” and was part of the larger township of Providence. In 1859, the town was officially incorporated as the Borough of Dunmore. The name “Dunmore” is derived from the Irish phrase “dun mór” which translates to “big fort”.
The borough was originally a farming community, but in the late 1800s, the town began to experience a period of industrialization. The Lackawanna Iron and Coal Company opened a steel mill in the area, and the town quickly became a major industrial center. The steel mill was the largest employer in the area, and it provided jobs for many of the town’s residents.
In the early 1900s, the town experienced a period of growth and prosperity. The population of the borough increased from 1,500 in 1900 to over 8,000 by the year 2000. The town also experienced a period of urbanization, as many of the town’s residents moved from the rural areas to the more urbanized areas of the borough.
Geography
Dunmore Borough is located in the heart of the Pocono Mountains in northeastern Pennsylvania. The borough is situated in the Lackawanna Valley, which is a part of the larger Susquehanna River Valley. The borough is bordered by the cities of Scranton and Wilkes-Barre, and is located just a few miles from the New York state border.
The borough is located at an elevation of approximately 1,000 feet above sea level. The borough is located in a hilly region, and the terrain is mostly wooded. The borough is home to several small lakes, including Lake Winola and Lake Wallenpaupack.
Economy
The economy of Dunmore Borough is largely based on the service industry. The borough is home to several small businesses, including restaurants, retail stores, and professional services. The borough is also home to several large employers, including the Lackawanna Iron and Coal Company, which is the largest employer in the area.
The borough is also home to several educational institutions, including the University of Scranton, Marywood University, and Lackawanna College. These institutions provide jobs for many of the borough’s residents.
Demographics
As of the 2010 census, the population of Dunmore Borough was 8,072. The population is largely white (94.3%), with small percentages of African American (2.2%), Asian (1.2%), and Hispanic (1.3%) residents. The median household income in the borough is $45,945, and the median home value is $125,000.
The borough is home to several churches, including the First Presbyterian Church, St. Mary’s Church, and the Church of the Good Shepherd. The borough is also home to several parks, including the Dunmore Community Park and the Lackawanna State Park.
Conclusion
Dunmore Borough is a small borough located in Lackawanna County, Pennsylvania. The borough is situated in the heart of the Pocono Mountains and is home to a population of approximately 8,000 people. The borough is bordered by the cities of Scranton and Wilkes-Barre, and is located just a few miles from the New York state border. The economy of the borough is largely based on the service industry, and the population is largely white. The borough is home to several churches, educational institutions, and parks.
Common Questions
What is Per Capita Income in Dunmore borough?
Per Capita income in Dunmore borough is $36,107.
What is the Median Family Income in Dunmore borough?
Median Family Income in Dunmore borough is $89,276.
What is the Median Household income in Dunmore borough?
Median Household Income in Dunmore borough is $72,821.
What is Income or Wage Gap in Dunmore borough?
Income or Wage Gap in Dunmore borough is 23.8%.
Women in Dunmore borough earn 76.2 cents for every dollar earned by a man.
What is Inequality or Gini Index in Dunmore borough?
Inequality or Gini Index in Dunmore borough is 0.40.
What is the Total Population of Dunmore borough?
Total Population of Dunmore borough is 14,082.
What is the Total Male Population of Dunmore borough?
Total Male Population of Dunmore borough is 6,836.
What is the Total Female Population of Dunmore borough?
Total Female Population of Dunmore borough is 7,246.
What is the Ratio of Males per 100 Females in Dunmore borough?
There are 94.34 Males per 100 Females in Dunmore borough.
What is the Ratio of Females per 100 Males in Dunmore borough?
There are 106.00 Females per 100 Males in Dunmore borough.
What is the Median Population Age in Dunmore borough?
Median Population Age in Dunmore borough is 40.1 Years.
What is the Average Family Size in Dunmore borough
Average Family Size in Dunmore borough is 3.0 People.
What is the Average Household Size in Dunmore borough
Average Household Size in Dunmore borough is 2.2 People.
How Large is the Labor Force in Dunmore borough?
There are 7,261 People in the Labor Forcein in Dunmore borough.
What is the Percentage of People in the Labor Force in Dunmore borough?
62.2% of People are in the Labor Force in Dunmore borough.
What is the Unemployment Rate in Dunmore borough?
Unemployment Rate in Dunmore borough is 4.8%.