West Kittanning borough, PA Map & Demographics
West Kittanning borough Overview
$42,582
PER CAPITA INCOME
$88,438
AVG FAMILY INCOME
$58,125
AVG HOUSEHOLD INCOME
4.0%
WAGE / INCOME GAP [ % ]
96.0¢/ $1
WAGE / INCOME GAP [ $ ]
0.45
INEQUALITY / GINI INDEX
1,243
TOTAL POPULATION
617
MALE POPULATION
626
FEMALE POPULATION
98.56
MALES / 100 FEMALES
101.46
FEMALES / 100 MALES
49.7
MEDIAN AGE
2.6
AVG FAMILY SIZE
2.1
AVG HOUSEHOLD SIZE
681
LABOR FORCE [ PEOPLE ]
65.2%
PERCENT IN LABOR FORCE
5.1%
UNEMPLOYMENT RATE
Income in West Kittanning borough
Income Overview in West Kittanning borough
Per Capita Income in West Kittanning borough is $42,582, while median incomes of families and households are $88,438 and $58,125 respectively.
| Characteristic | Number | Measure |
| Per Capita Income | 1,243 | $42,582 |
| Median Family Income | 351 | $88,438 |
| Mean Family Income | 351 | $102,734 |
| Median Household Income | 601 | $58,125 |
| Mean Household Income | 601 | $88,235 |
| Income Deficit | 351 | $0 |
| Wage / Income Gap (%) | 1,243 | 3.95% |
| Wage / Income Gap ($) | 1,243 | 96.05¢ per $1 |
| Gini / Inequality Index | 1,243 | 0.45 |
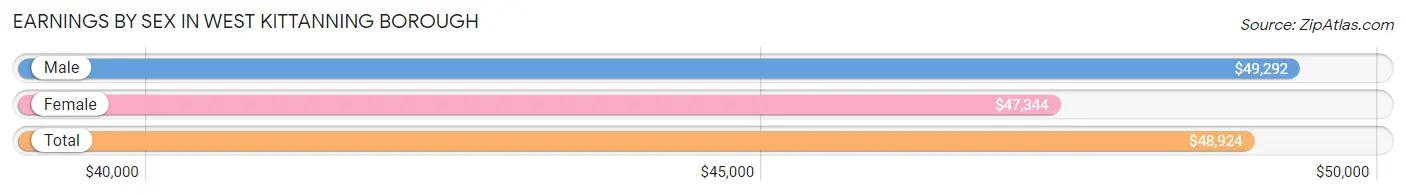
Earnings by Sex in West Kittanning borough
Average Earnings in West Kittanning borough are $48,924, $49,292 for men and $47,344 for women, a difference of 4.0%.
| Sex | Number | Average Earnings |
| Male | 375 (53.6%) | $49,292 |
| Female | 324 (46.4%) | $47,344 |
| Total | 699 (100.0%) | $48,924 |
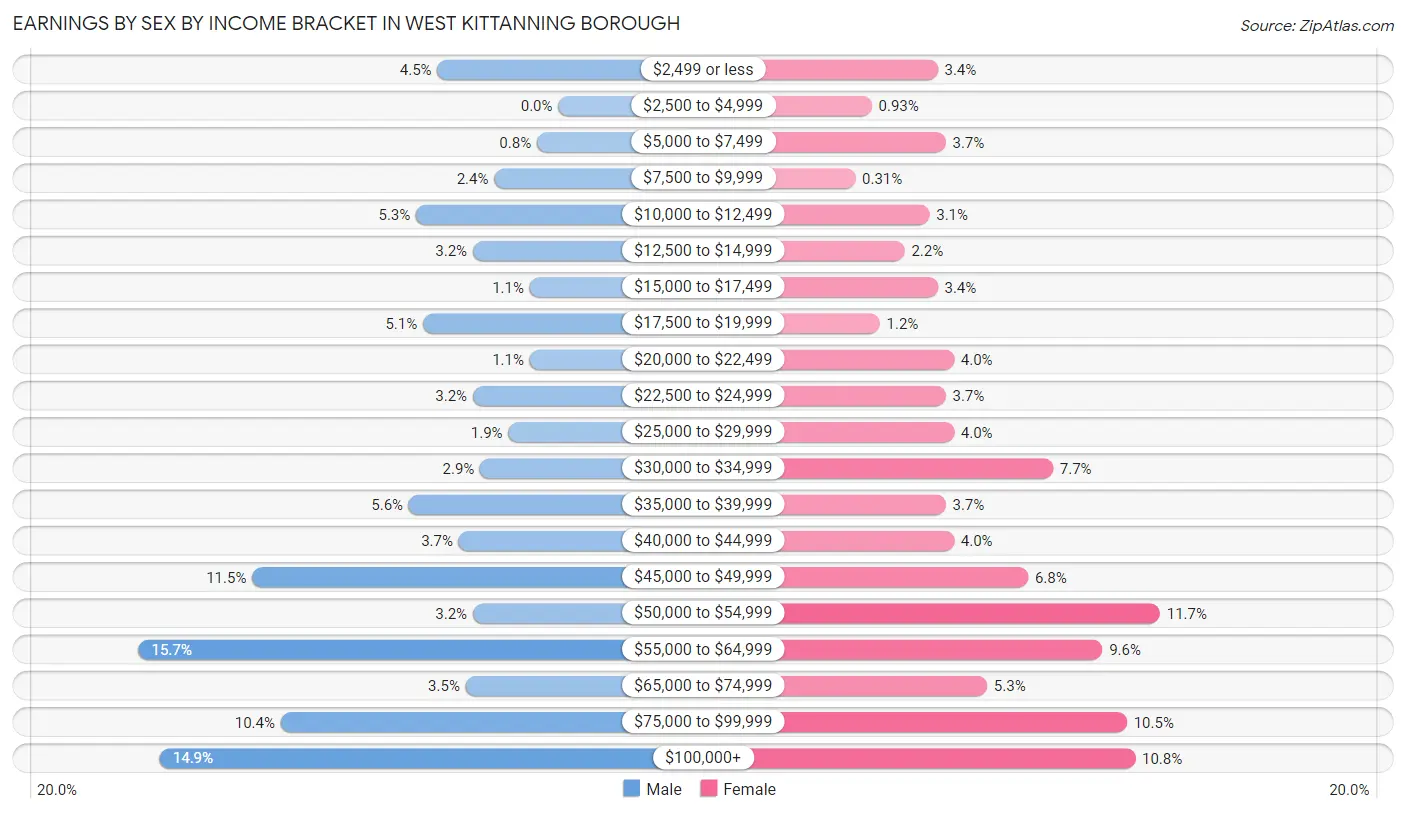
Earnings by Sex by Income Bracket in West Kittanning borough
The most common earnings brackets in West Kittanning borough are $55,000 to $64,999 for men (59 | 15.7%) and $50,000 to $54,999 for women (38 | 11.7%).
| Income | Male | Female |
| $2,499 or less | 17 (4.5%) | 11 (3.4%) |
| $2,500 to $4,999 | 0 (0.0%) | 3 (0.9%) |
| $5,000 to $7,499 | 3 (0.8%) | 12 (3.7%) |
| $7,500 to $9,999 | 9 (2.4%) | 1 (0.3%) |
| $10,000 to $12,499 | 20 (5.3%) | 10 (3.1%) |
| $12,500 to $14,999 | 12 (3.2%) | 7 (2.2%) |
| $15,000 to $17,499 | 4 (1.1%) | 11 (3.4%) |
| $17,500 to $19,999 | 19 (5.1%) | 4 (1.2%) |
| $20,000 to $22,499 | 4 (1.1%) | 13 (4.0%) |
| $22,500 to $24,999 | 12 (3.2%) | 12 (3.7%) |
| $25,000 to $29,999 | 7 (1.9%) | 13 (4.0%) |
| $30,000 to $34,999 | 11 (2.9%) | 25 (7.7%) |
| $35,000 to $39,999 | 21 (5.6%) | 12 (3.7%) |
| $40,000 to $44,999 | 14 (3.7%) | 13 (4.0%) |
| $45,000 to $49,999 | 43 (11.5%) | 22 (6.8%) |
| $50,000 to $54,999 | 12 (3.2%) | 38 (11.7%) |
| $55,000 to $64,999 | 59 (15.7%) | 31 (9.6%) |
| $65,000 to $74,999 | 13 (3.5%) | 17 (5.2%) |
| $75,000 to $99,999 | 39 (10.4%) | 34 (10.5%) |
| $100,000+ | 56 (14.9%) | 35 (10.8%) |
| Total | 375 (100.0%) | 324 (100.0%) |
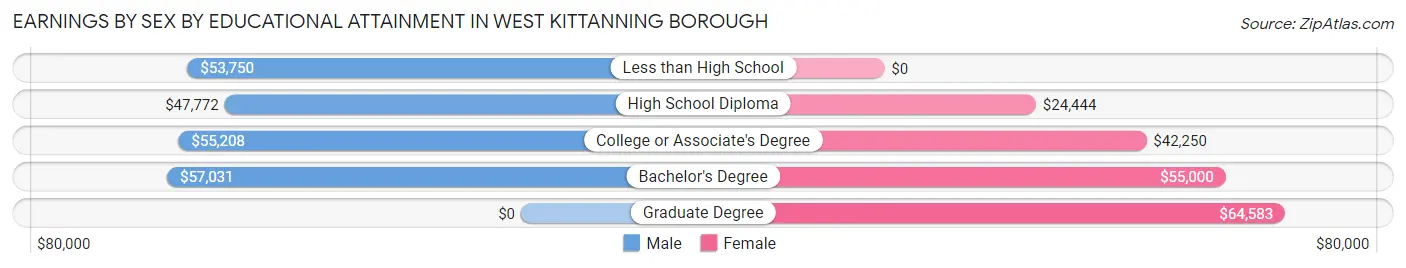
Earnings by Sex by Educational Attainment in West Kittanning borough
Average earnings in West Kittanning borough are $54,531 for men and $49,375 for women, a difference of 9.5%. Men with an educational attainment of bachelor's degree enjoy the highest average annual earnings of $57,031, while those with high school diploma education earn the least with $47,772. Women with an educational attainment of graduate degree earn the most with the average annual earnings of $64,583, while those with high school diploma education have the smallest earnings of $24,444.
| Educational Attainment | Male Income | Female Income |
| Less than High School | $53,750 | $0 |
| High School Diploma | $47,772 | $24,444 |
| College or Associate's Degree | $55,208 | $42,250 |
| Bachelor's Degree | $57,031 | $55,000 |
| Graduate Degree | - | - |
| Total | $54,531 | $49,375 |
Family Income in West Kittanning borough
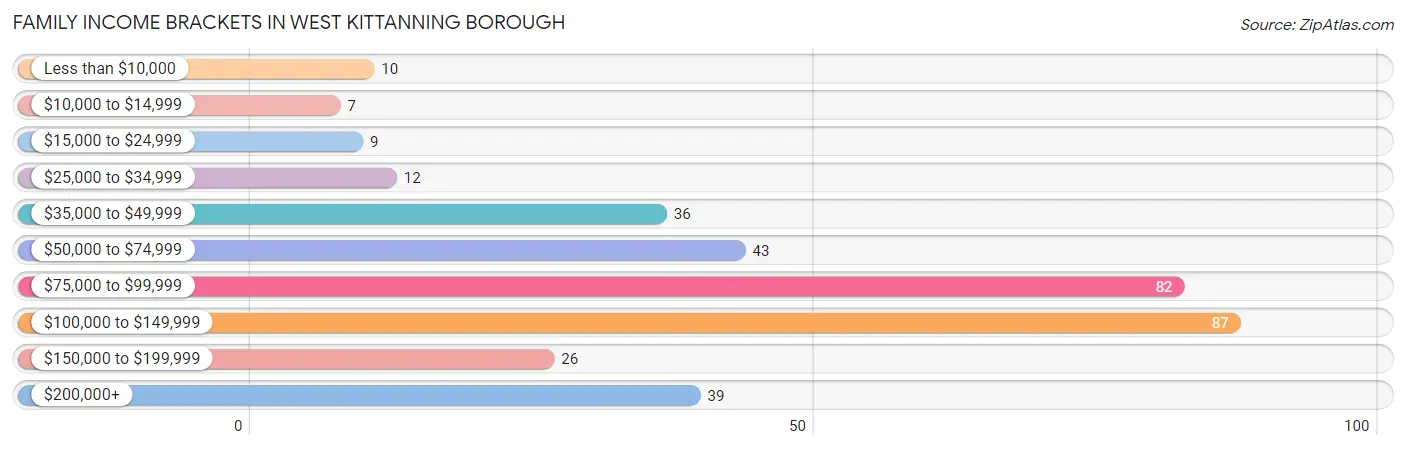
Family Income Brackets in West Kittanning borough
According to the West Kittanning borough family income data, there are 87 families falling into the $100,000 to $149,999 income range, which is the most common income bracket and makes up 24.8% of all families. Conversely, the $10,000 to $14,999 income bracket is the least frequent group with only 7 families (2.0%) belonging to this category.
| Income Bracket | # Families | % Families |
| Less than $10,000 | 10 | 2.8% |
| $10,000 to $14,999 | 7 | 2.0% |
| $15,000 to $24,999 | 9 | 2.6% |
| $25,000 to $34,999 | 12 | 3.4% |
| $35,000 to $49,999 | 36 | 10.3% |
| $50,000 to $74,999 | 43 | 12.3% |
| $75,000 to $99,999 | 82 | 23.4% |
| $100,000 to $149,999 | 87 | 24.8% |
| $150,000 to $199,999 | 26 | 7.4% |
| $200,000+ | 39 | 11.1% |
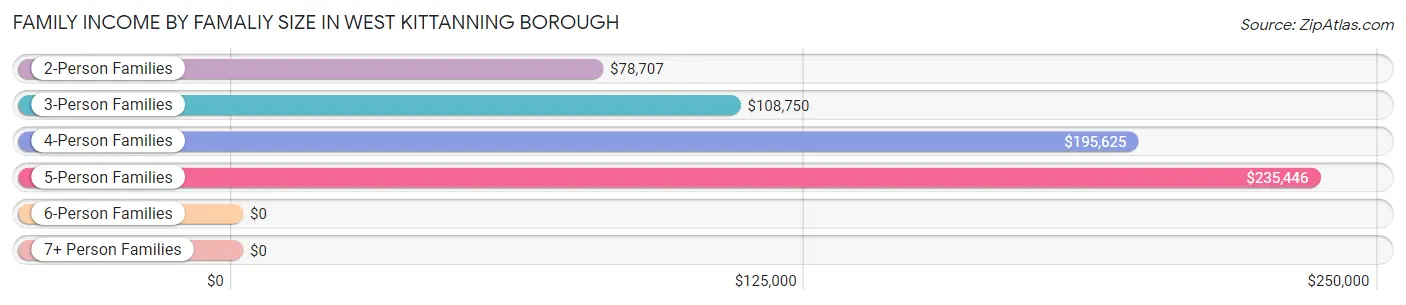
Family Income by Famaliy Size in West Kittanning borough
5-person families (23 | 6.6%) account for the highest median family income in West Kittanning borough with $235,446 per family, while 4-person families (32 | 9.1%) have the highest median income of $48,906 per family member.
| Income Bracket | # Families | Median Income |
| 2-Person Families | 234 (66.7%) | $78,707 |
| 3-Person Families | 60 (17.1%) | $108,750 |
| 4-Person Families | 32 (9.1%) | $195,625 |
| 5-Person Families | 23 (6.6%) | $235,446 |
| 6-Person Families | 0 (0.0%) | $0 |
| 7+ Person Families | 2 (0.6%) | $0 |
| Total | 351 (100.0%) | $88,438 |
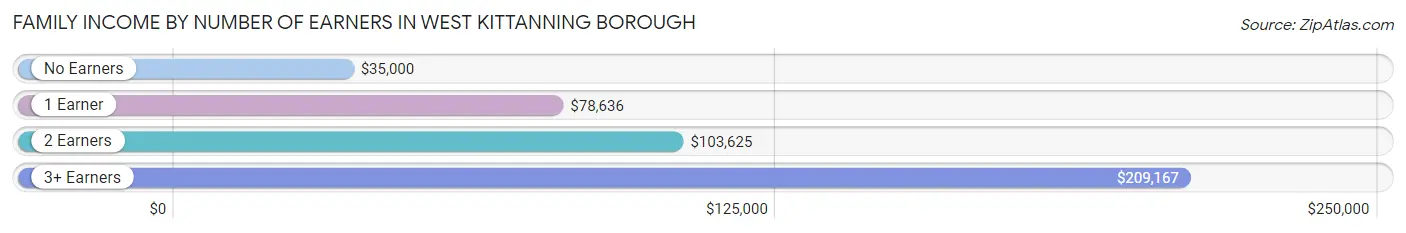
Family Income by Number of Earners in West Kittanning borough
The median family income in West Kittanning borough is $88,438, with families comprising 3+ earners (18) having the highest median family income of $209,167, while families with no earners (56) have the lowest median family income of $35,000, accounting for 5.1% and 16.0% of families, respectively.
| Number of Earners | # Families | Median Income |
| No Earners | 56 (16.0%) | $35,000 |
| 1 Earner | 114 (32.5%) | $78,636 |
| 2 Earners | 163 (46.4%) | $103,625 |
| 3+ Earners | 18 (5.1%) | $209,167 |
| Total | 351 (100.0%) | $88,438 |
Household Income in West Kittanning borough
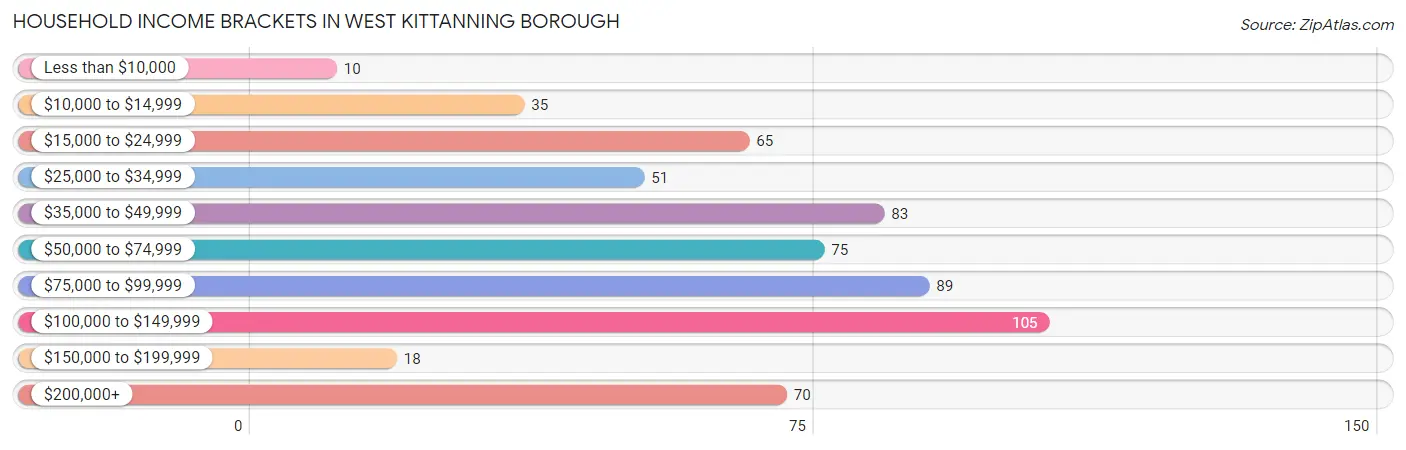
Household Income Brackets in West Kittanning borough
With 105 households falling in the category, the $100,000 to $149,999 income range is the most frequent in West Kittanning borough, accounting for 17.5% of all households. In contrast, only 10 households (1.7%) fall into the less than $10,000 income bracket, making it the least populous group.
| Income Bracket | # Households | % Households |
| Less than $10,000 | 10 | 1.7% |
| $10,000 to $14,999 | 35 | 5.8% |
| $15,000 to $24,999 | 65 | 10.8% |
| $25,000 to $34,999 | 51 | 8.5% |
| $35,000 to $49,999 | 83 | 13.8% |
| $50,000 to $74,999 | 75 | 12.5% |
| $75,000 to $99,999 | 89 | 14.8% |
| $100,000 to $149,999 | 105 | 17.5% |
| $150,000 to $199,999 | 18 | 3.0% |
| $200,000+ | 70 | 11.6% |
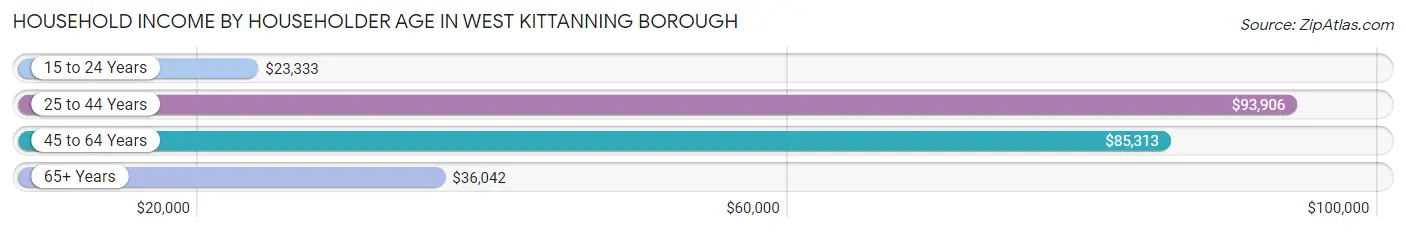
Household Income by Householder Age in West Kittanning borough
The median household income in West Kittanning borough is $58,125, with the highest median household income of $93,906 found in the 25 to 44 years age bracket for the primary householder. A total of 141 households (23.5%) fall into this category. Meanwhile, the 15 to 24 years age bracket for the primary householder has the lowest median household income of $23,333, with 16 households (2.7%) in this group.
| Income Bracket | # Households | Median Income |
| 15 to 24 Years | 16 (2.7%) | $23,333 |
| 25 to 44 Years | 141 (23.5%) | $93,906 |
| 45 to 64 Years | 257 (42.8%) | $85,313 |
| 65+ Years | 187 (31.1%) | $36,042 |
| Total | 601 (100.0%) | $58,125 |
Poverty in West Kittanning borough
Income Below Poverty by Sex and Age in West Kittanning borough
With 7.3% poverty level for males and 3.7% for females among the residents of West Kittanning borough, 45 to 54 year old males and 25 to 34 year old females are the most vulnerable to poverty, with 20 males (18.0%) and 6 females (10.2%) in their respective age groups living below the poverty level.

| Age Bracket | Male | Female |
| Under 5 Years | 1 (4.0%) | 0 (0.0%) |
| 5 Years | 0 (0.0%) | 0 (0.0%) |
| 6 to 11 Years | 4 (10.3%) | 0 (0.0%) |
| 12 to 14 Years | 0 (0.0%) | 0 (0.0%) |
| 15 Years | 0 (0.0%) | 0 (0.0%) |
| 16 and 17 Years | 0 (0.0%) | 0 (0.0%) |
| 18 to 24 Years | 2 (3.5%) | 0 (0.0%) |
| 25 to 34 Years | 0 (0.0%) | 6 (10.2%) |
| 35 to 44 Years | 4 (5.8%) | 3 (4.8%) |
| 45 to 54 Years | 20 (18.0%) | 0 (0.0%) |
| 55 to 64 Years | 3 (2.5%) | 0 (0.0%) |
| 65 to 74 Years | 3 (7.1%) | 7 (7.3%) |
| 75 Years and over | 8 (14.0%) | 7 (8.7%) |
| Total | 45 (7.3%) | 23 (3.7%) |
Income Above Poverty by Sex and Age in West Kittanning borough
According to the poverty statistics in West Kittanning borough, males aged 12 to 14 years and females aged under 5 years are the age groups that are most secure financially, with 100.0% of males and 100.0% of females in these age groups living above the poverty line.
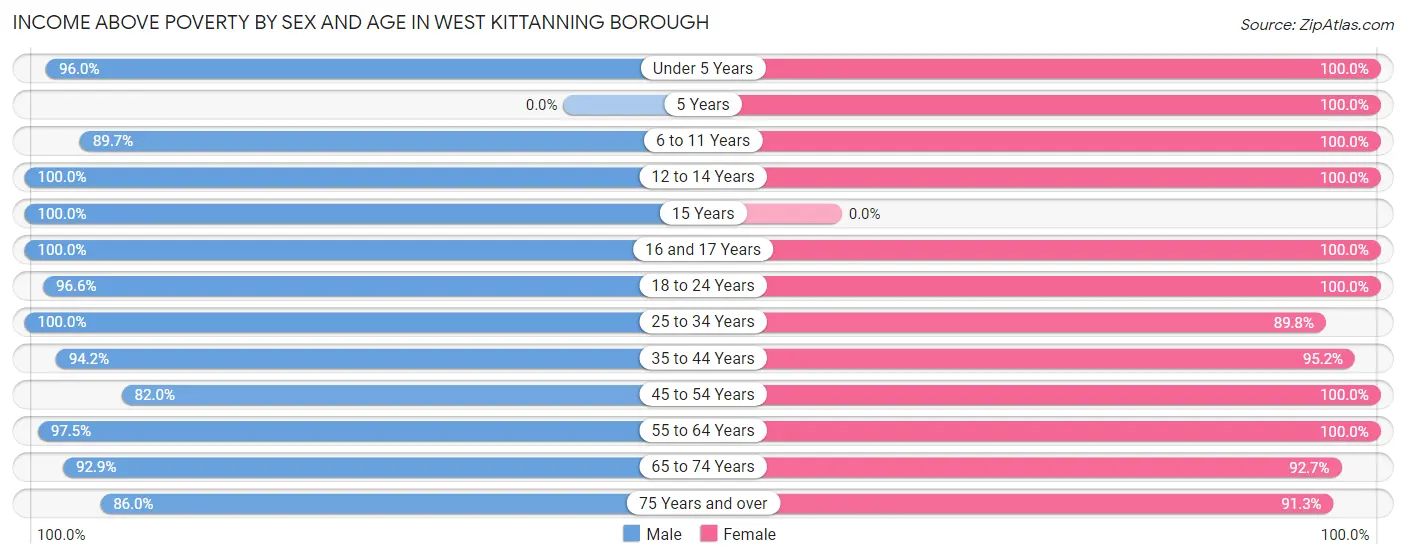
| Age Bracket | Male | Female |
| Under 5 Years | 24 (96.0%) | 25 (100.0%) |
| 5 Years | 0 (0.0%) | 29 (100.0%) |
| 6 to 11 Years | 35 (89.7%) | 33 (100.0%) |
| 12 to 14 Years | 22 (100.0%) | 17 (100.0%) |
| 15 Years | 8 (100.0%) | 0 (0.0%) |
| 16 and 17 Years | 18 (100.0%) | 10 (100.0%) |
| 18 to 24 Years | 56 (96.6%) | 8 (100.0%) |
| 25 to 34 Years | 46 (100.0%) | 53 (89.8%) |
| 35 to 44 Years | 65 (94.2%) | 60 (95.2%) |
| 45 to 54 Years | 91 (82.0%) | 89 (100.0%) |
| 55 to 64 Years | 119 (97.5%) | 117 (100.0%) |
| 65 to 74 Years | 39 (92.9%) | 89 (92.7%) |
| 75 Years and over | 49 (86.0%) | 73 (91.2%) |
| Total | 572 (92.7%) | 603 (96.3%) |
Income Below Poverty Among Married-Couple Families in West Kittanning borough
The poverty statistics for married-couple families in West Kittanning borough show that 4.4% or 11 of the total 250 families live below the poverty line. Families with no children have the highest poverty rate of 6.5%, comprising of 11 families. On the other hand, families with 1 or 2 children have the lowest poverty rate of 0.0%, which includes 0 families.
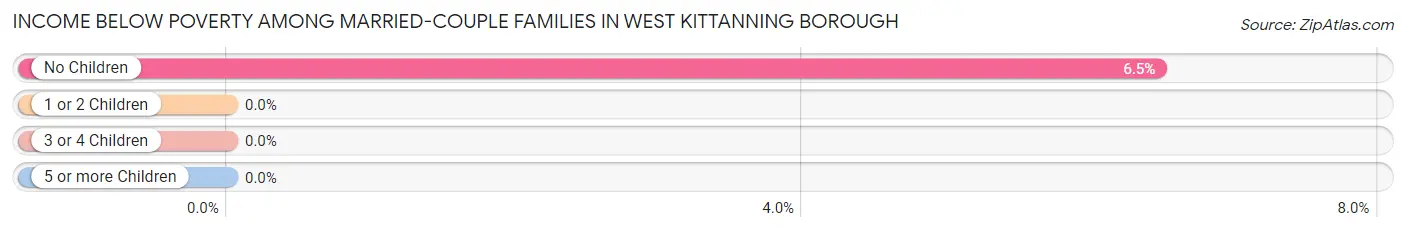
| Children | Above Poverty | Below Poverty |
| No Children | 159 (93.5%) | 11 (6.5%) |
| 1 or 2 Children | 55 (100.0%) | 0 (0.0%) |
| 3 or 4 Children | 25 (100.0%) | 0 (0.0%) |
| 5 or more Children | 0 (0.0%) | 0 (0.0%) |
| Total | 239 (95.6%) | 11 (4.4%) |
Income Below Poverty Among Single-Parent Households in West Kittanning borough
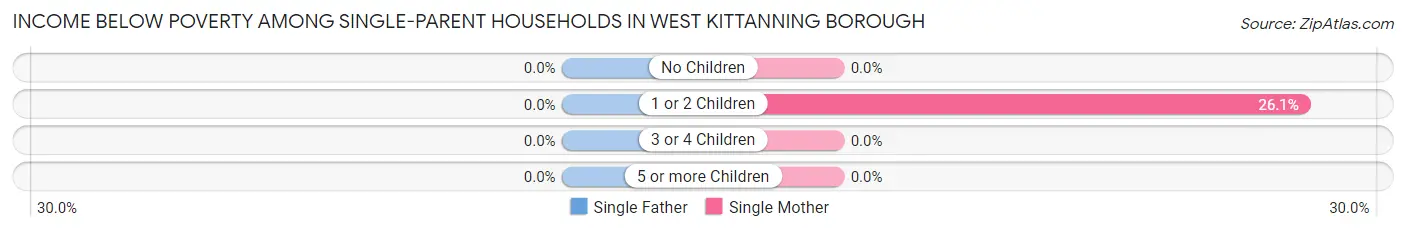
| Children | Single Father | Single Mother |
| No Children | 0 (0.0%) | 0 (0.0%) |
| 1 or 2 Children | 0 (0.0%) | 6 (26.1%) |
| 3 or 4 Children | 0 (0.0%) | 0 (0.0%) |
| 5 or more Children | 0 (0.0%) | 0 (0.0%) |
| Total | 0 (0.0%) | 6 (10.7%) |
Income Below Poverty Among Married-Couple vs Single-Parent Households in West Kittanning borough
The poverty data for West Kittanning borough shows that 11 of the married-couple family households (4.4%) and 6 of the single-parent households (5.9%) are living below the poverty level. Within the married-couple family households, those with no children have the highest poverty rate, with 11 households (6.5%) falling below the poverty line. Among the single-parent households, those with 1 or 2 children have the highest poverty rate, with 6 household (16.2%) living below poverty.
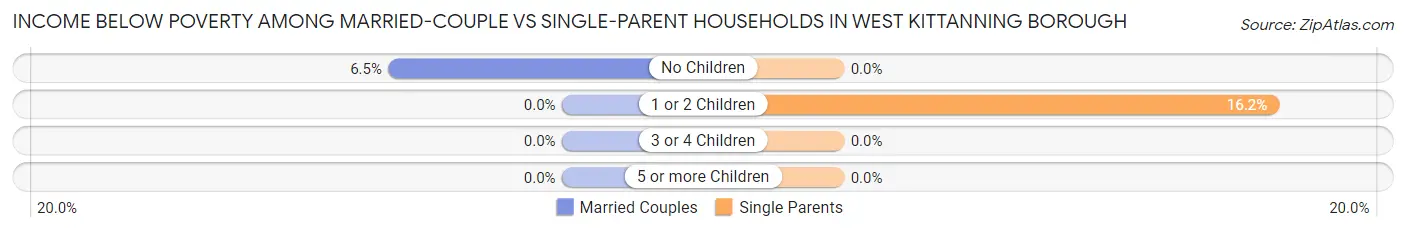
| Children | Married-Couple Families | Single-Parent Households |
| No Children | 11 (6.5%) | 0 (0.0%) |
| 1 or 2 Children | 0 (0.0%) | 6 (16.2%) |
| 3 or 4 Children | 0 (0.0%) | 0 (0.0%) |
| 5 or more Children | 0 (0.0%) | 0 (0.0%) |
| Total | 11 (4.4%) | 6 (5.9%) |
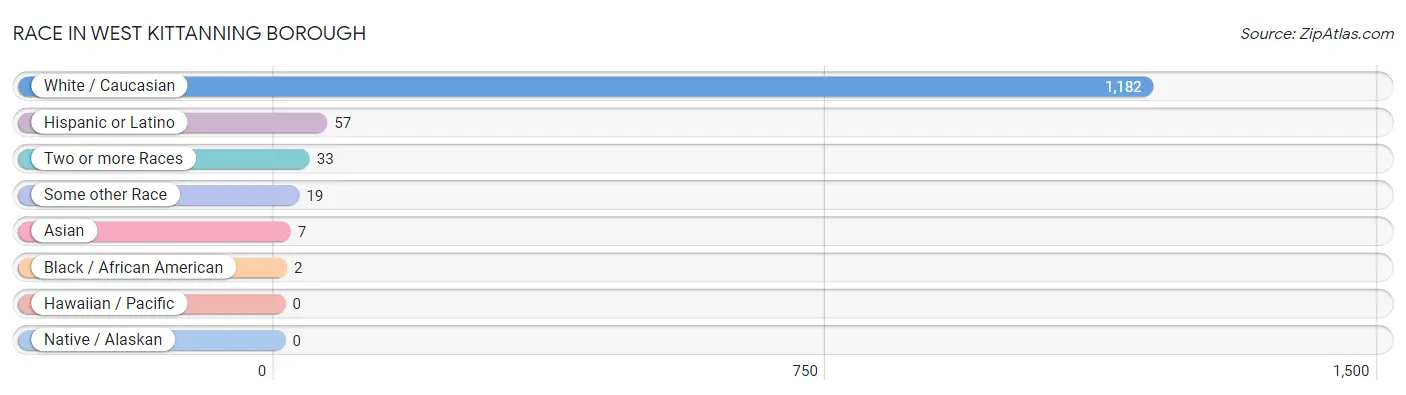
Race in West Kittanning borough
The most populous races in West Kittanning borough are White / Caucasian (1,182 | 95.1%), Hispanic or Latino (57 | 4.6%), and Two or more Races (33 | 2.6%).
| Race | # Population | % Population |
| Asian | 7 | 0.6% |
| Black / African American | 2 | 0.2% |
| Hawaiian / Pacific | 0 | 0.0% |
| Hispanic or Latino | 57 | 4.6% |
| Native / Alaskan | 0 | 0.0% |
| White / Caucasian | 1,182 | 95.1% |
| Two or more Races | 33 | 2.6% |
| Some other Race | 19 | 1.5% |
| Total | 1,243 | 100.0% |
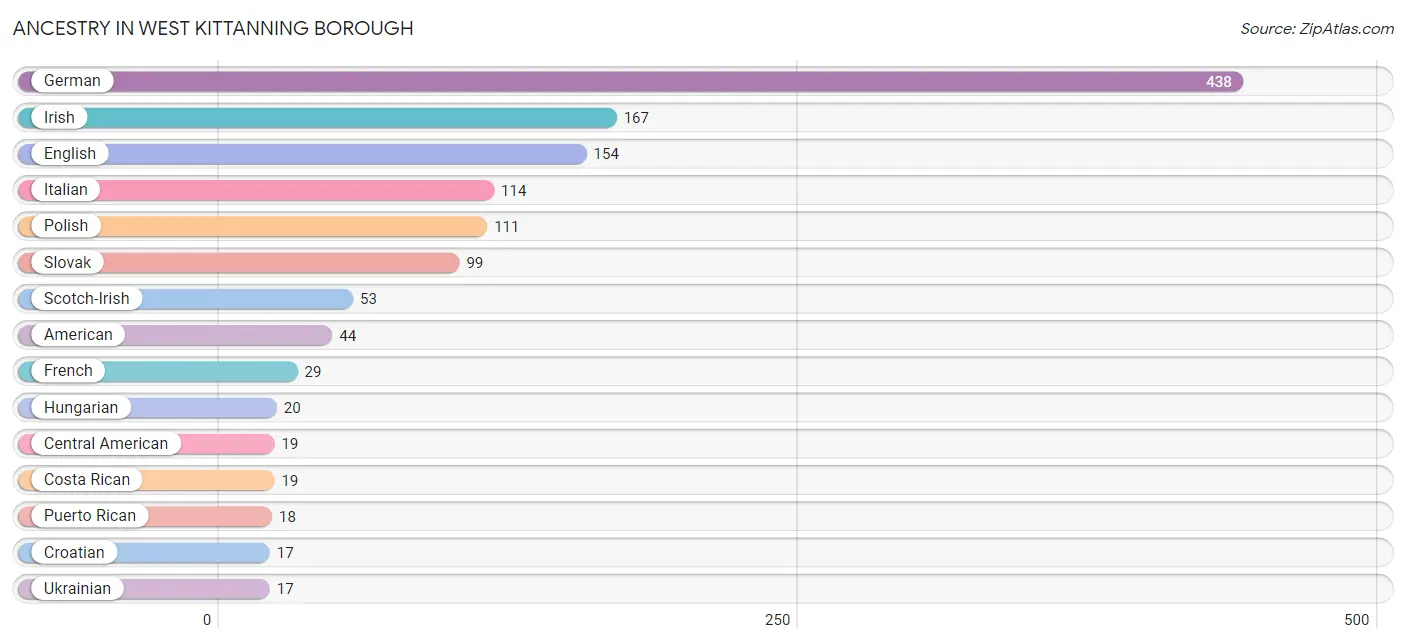
Ancestry in West Kittanning borough
The most populous ancestries reported in West Kittanning borough are German (438 | 35.2%), Irish (167 | 13.4%), English (154 | 12.4%), Italian (114 | 9.2%), and Polish (111 | 8.9%), together accounting for 79.2% of all West Kittanning borough residents.
| Ancestry | # Population | % Population |
| American | 44 | 3.5% |
| Austrian | 7 | 0.6% |
| Belgian | 3 | 0.2% |
| Brazilian | 3 | 0.2% |
| Burmese | 4 | 0.3% |
| Central American | 19 | 1.5% |
| Chinese | 1 | 0.1% |
| Costa Rican | 19 | 1.5% |
| Croatian | 17 | 1.4% |
| Czech | 3 | 0.2% |
| Dominican | 16 | 1.3% |
| Dutch | 13 | 1.1% |
| Eastern European | 3 | 0.2% |
| English | 154 | 12.4% |
| European | 4 | 0.3% |
| French | 29 | 2.3% |
| French Canadian | 3 | 0.2% |
| German | 438 | 35.2% |
| Hungarian | 20 | 1.6% |
| Irish | 167 | 13.4% |
| Iroquois | 1 | 0.1% |
| Italian | 114 | 9.2% |
| Korean | 2 | 0.2% |
| Lithuanian | 2 | 0.2% |
| Pakistani | 11 | 0.9% |
| Pennsylvania German | 16 | 1.3% |
| Polish | 111 | 8.9% |
| Portuguese | 3 | 0.2% |
| Puerto Rican | 18 | 1.5% |
| Scotch-Irish | 53 | 4.3% |
| Scottish | 13 | 1.1% |
| Slavic | 10 | 0.8% |
| Slovak | 99 | 8.0% |
| Swedish | 10 | 0.8% |
| Ukrainian | 17 | 1.4% |
| Welsh | 9 | 0.7% | View All 36 Rows |
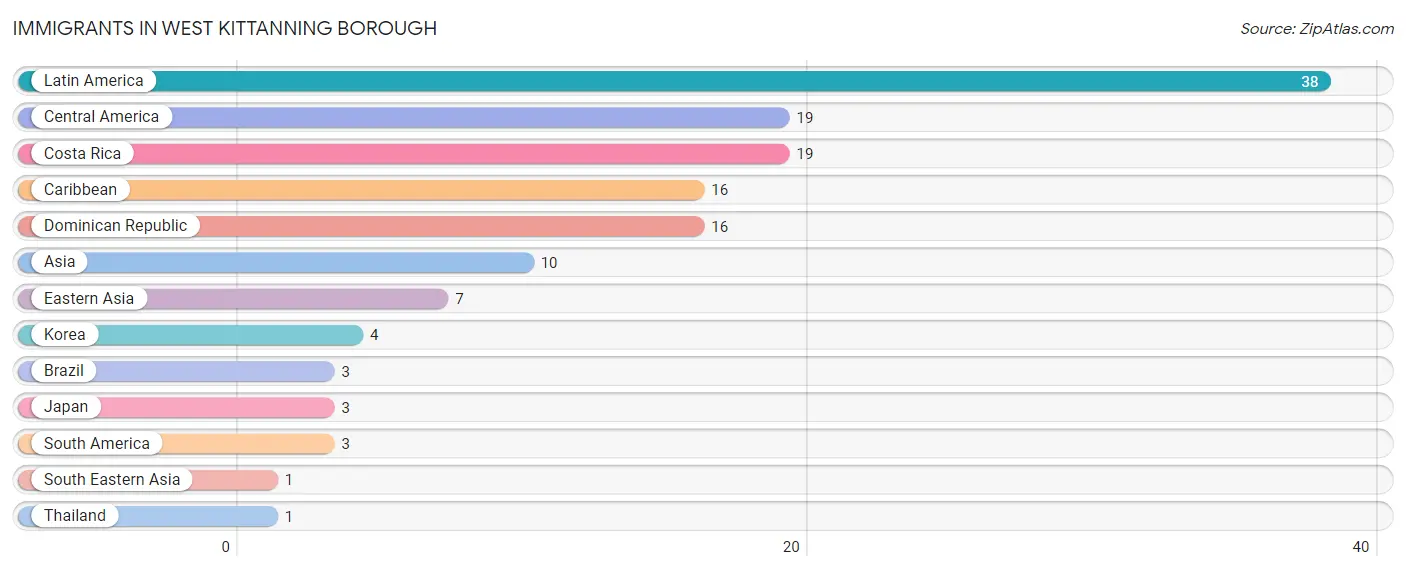
Immigrants in West Kittanning borough
The most numerous immigrant groups reported in West Kittanning borough came from Latin America (38 | 3.1%), Central America (19 | 1.5%), Costa Rica (19 | 1.5%), Caribbean (16 | 1.3%), and Dominican Republic (16 | 1.3%), together accounting for 8.7% of all West Kittanning borough residents.
| Immigration Origin | # Population | % Population |
| Asia | 10 | 0.8% |
| Brazil | 3 | 0.2% |
| Caribbean | 16 | 1.3% |
| Central America | 19 | 1.5% |
| Costa Rica | 19 | 1.5% |
| Dominican Republic | 16 | 1.3% |
| Eastern Asia | 7 | 0.6% |
| Japan | 3 | 0.2% |
| Korea | 4 | 0.3% |
| Latin America | 38 | 3.1% |
| South America | 3 | 0.2% |
| South Eastern Asia | 1 | 0.1% |
| Thailand | 1 | 0.1% | View All 13 Rows |
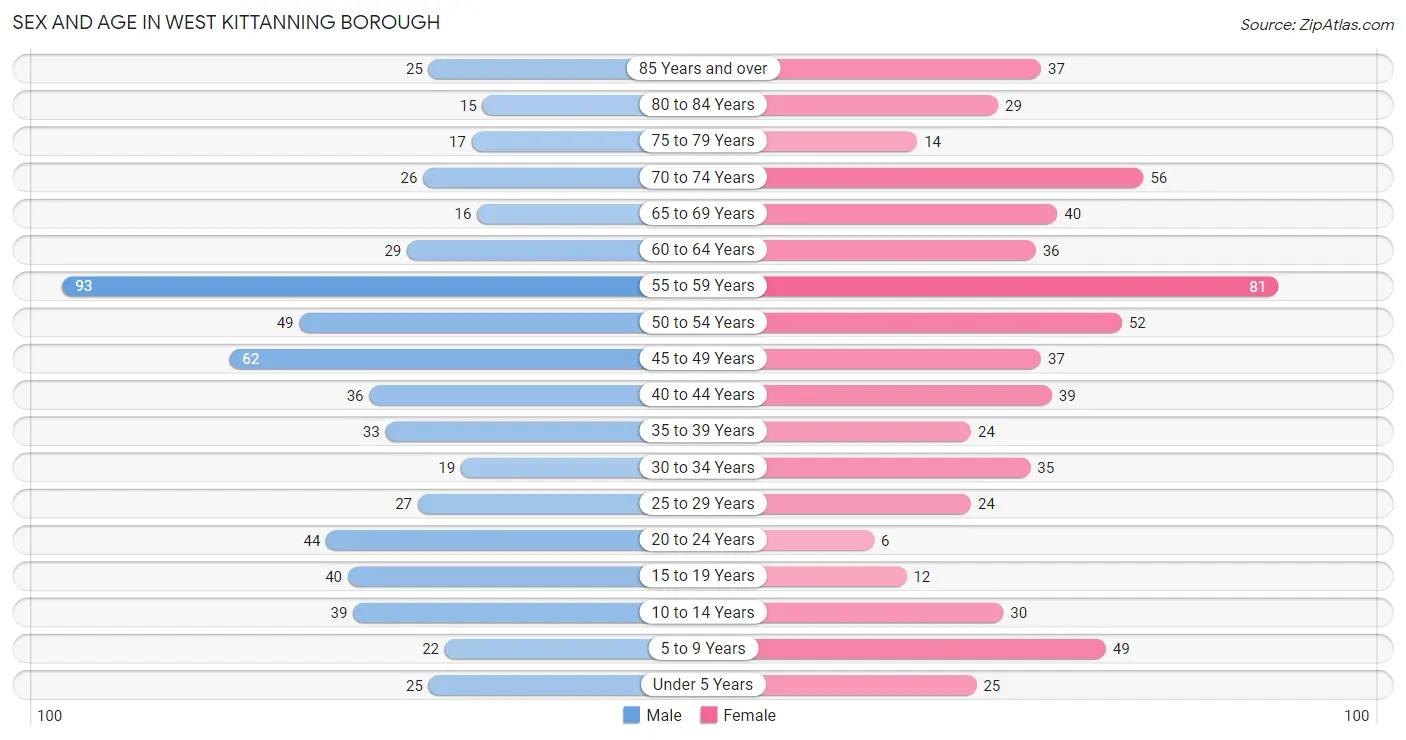
Sex and Age in West Kittanning borough
Sex and Age in West Kittanning borough
The most populous age groups in West Kittanning borough are 55 to 59 Years (93 | 15.1%) for men and 55 to 59 Years (81 | 12.9%) for women.
| Age Bracket | Male | Female |
| Under 5 Years | 25 (4.1%) | 25 (4.0%) |
| 5 to 9 Years | 22 (3.6%) | 49 (7.8%) |
| 10 to 14 Years | 39 (6.3%) | 30 (4.8%) |
| 15 to 19 Years | 40 (6.5%) | 12 (1.9%) |
| 20 to 24 Years | 44 (7.1%) | 6 (1.0%) |
| 25 to 29 Years | 27 (4.4%) | 24 (3.8%) |
| 30 to 34 Years | 19 (3.1%) | 35 (5.6%) |
| 35 to 39 Years | 33 (5.3%) | 24 (3.8%) |
| 40 to 44 Years | 36 (5.8%) | 39 (6.2%) |
| 45 to 49 Years | 62 (10.1%) | 37 (5.9%) |
| 50 to 54 Years | 49 (7.9%) | 52 (8.3%) |
| 55 to 59 Years | 93 (15.1%) | 81 (12.9%) |
| 60 to 64 Years | 29 (4.7%) | 36 (5.8%) |
| 65 to 69 Years | 16 (2.6%) | 40 (6.4%) |
| 70 to 74 Years | 26 (4.2%) | 56 (8.9%) |
| 75 to 79 Years | 17 (2.8%) | 14 (2.2%) |
| 80 to 84 Years | 15 (2.4%) | 29 (4.6%) |
| 85 Years and over | 25 (4.1%) | 37 (5.9%) |
| Total | 617 (100.0%) | 626 (100.0%) |
Families and Households in West Kittanning borough
Median Family Size in West Kittanning borough
The median family size in West Kittanning borough is 2.63 persons per family, with married-couple families (250 | 71.2%) accounting for the largest median family size of 2.76 persons per family. On the other hand, single male/father families (45 | 12.8%) represent the smallest median family size with 2.11 persons per family.
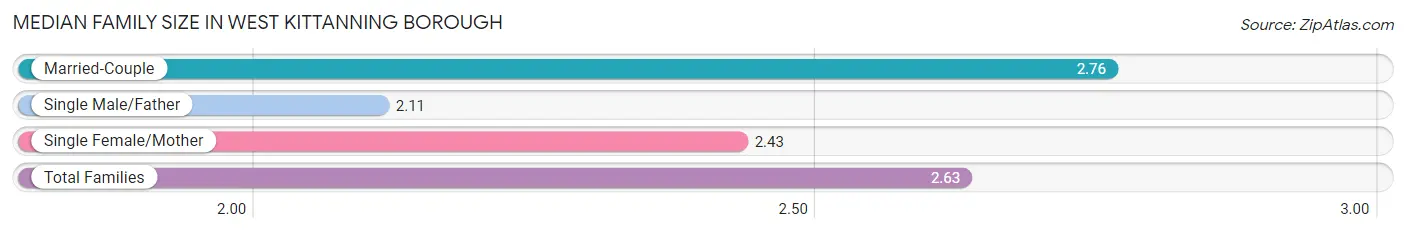
| Family Type | # Families | Family Size |
| Married-Couple | 250 (71.2%) | 2.76 |
| Single Male/Father | 45 (12.8%) | 2.11 |
| Single Female/Mother | 56 (16.0%) | 2.43 |
| Total Families | 351 (100.0%) | 2.63 |
Median Household Size in West Kittanning borough
The median household size in West Kittanning borough is 2.07 persons per household, with married-couple households (250 | 41.6%) accounting for the largest median household size of 2.76 persons per household. non-family households (250 | 41.6%) represent the smallest median household size with 1.18 persons per household.
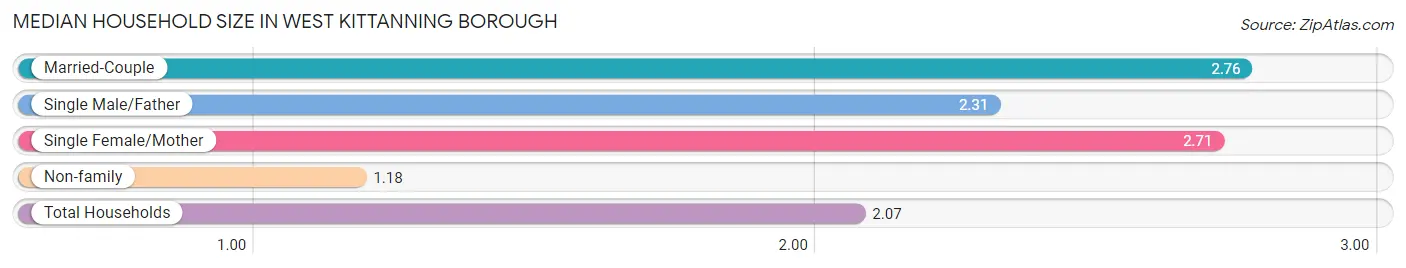
| Household Type | # Households | Household Size |
| Married-Couple | 250 (41.6%) | 2.76 |
| Single Male/Father | 45 (7.5%) | 2.31 |
| Single Female/Mother | 56 (9.3%) | 2.71 |
| Non-family | 250 (41.6%) | 1.18 |
| Total Households | 601 (100.0%) | 2.07 |
Household Size by Marriage Status in West Kittanning borough
Out of a total of 601 households in West Kittanning borough, 351 (58.4%) are family households, while 250 (41.6%) are nonfamily households. The most numerous type of family households are 2-person households, comprising 218, and the most common type of nonfamily households are 1-person households, comprising 216.
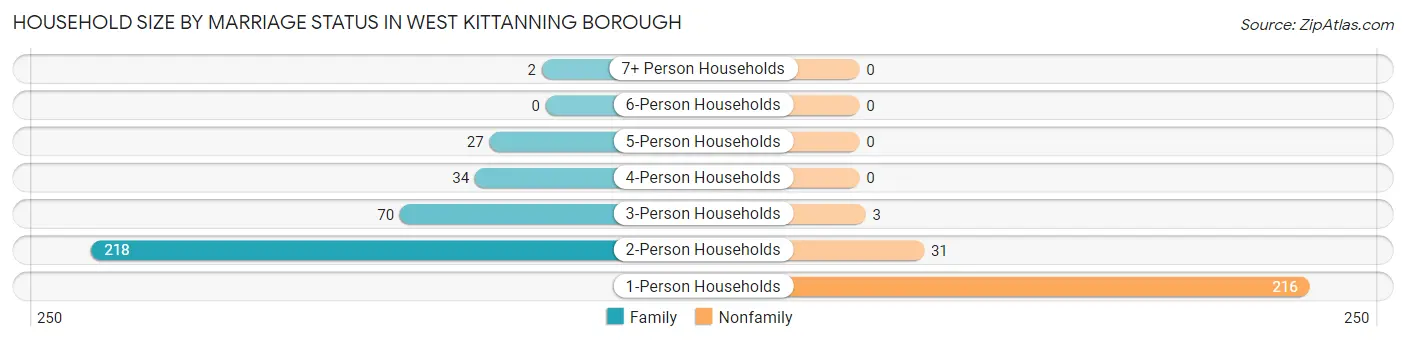
| Household Size | Family Households | Nonfamily Households |
| 1-Person Households | - | 216 (35.9%) |
| 2-Person Households | 218 (36.3%) | 31 (5.2%) |
| 3-Person Households | 70 (11.7%) | 3 (0.5%) |
| 4-Person Households | 34 (5.7%) | 0 (0.0%) |
| 5-Person Households | 27 (4.5%) | 0 (0.0%) |
| 6-Person Households | 0 (0.0%) | 0 (0.0%) |
| 7+ Person Households | 2 (0.3%) | 0 (0.0%) |
| Total | 351 (58.4%) | 250 (41.6%) |
Female Fertility in West Kittanning borough
Fertility by Age in West Kittanning borough
Average fertility rate in West Kittanning borough is 25.0 births per 1,000 women. Women in the age bracket of 20 to 34 years have the highest fertility rate with 77.0 births per 1,000 women. Women in the age bracket of 20 to 34 years acount for 100.0% of all women with births.
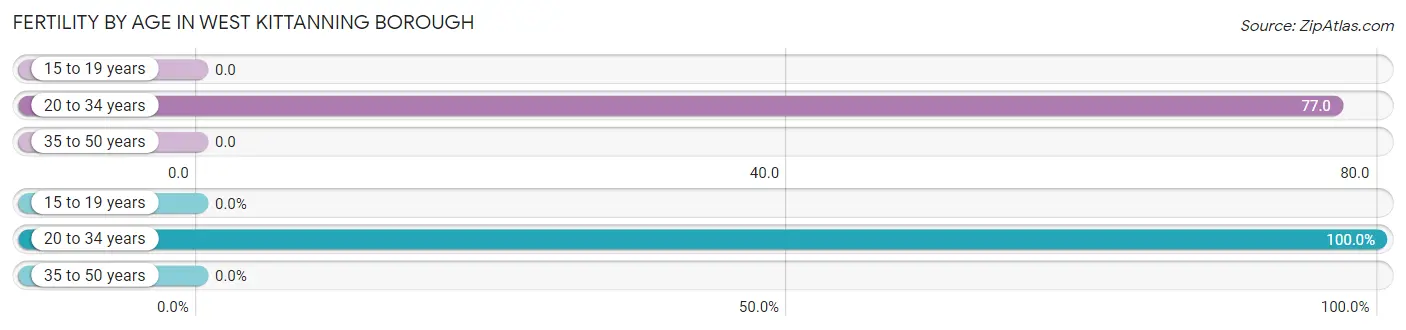
| Age Bracket | Women with Births | Births / 1,000 Women |
| 15 to 19 years | 0 (0.0%) | 0.0 |
| 20 to 34 years | 5 (100.0%) | 77.0 |
| 35 to 50 years | 0 (0.0%) | 0.0 |
| Total | 5 (100.0%) | 25.0 |
Fertility by Age by Marriage Status in West Kittanning borough
60.0% of women with births (5) in West Kittanning borough are married. The highest percentage of unmarried women with births falls into 20 to 34 years age bracket with 40.0% of them unmarried at the time of birth, while the lowest percentage of unmarried women with births belong to 20 to 34 years age bracket with 40.0% of them unmarried.
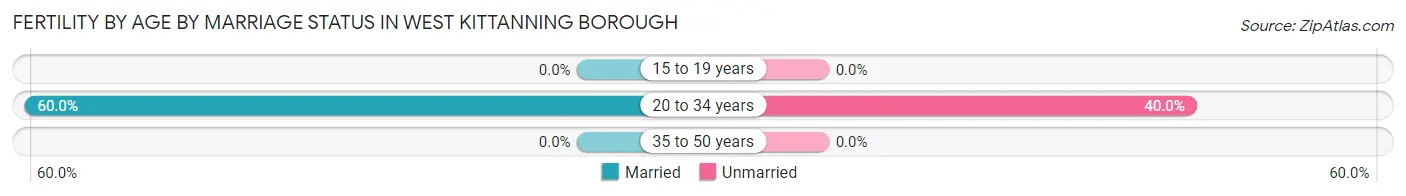
| Age Bracket | Married | Unmarried |
| 15 to 19 years | 0 (0.0%) | 0 (0.0%) |
| 20 to 34 years | 3 (60.0%) | 2 (40.0%) |
| 35 to 50 years | 0 (0.0%) | 0 (0.0%) |
| Total | 3 (60.0%) | 2 (40.0%) |
Fertility by Education in West Kittanning borough
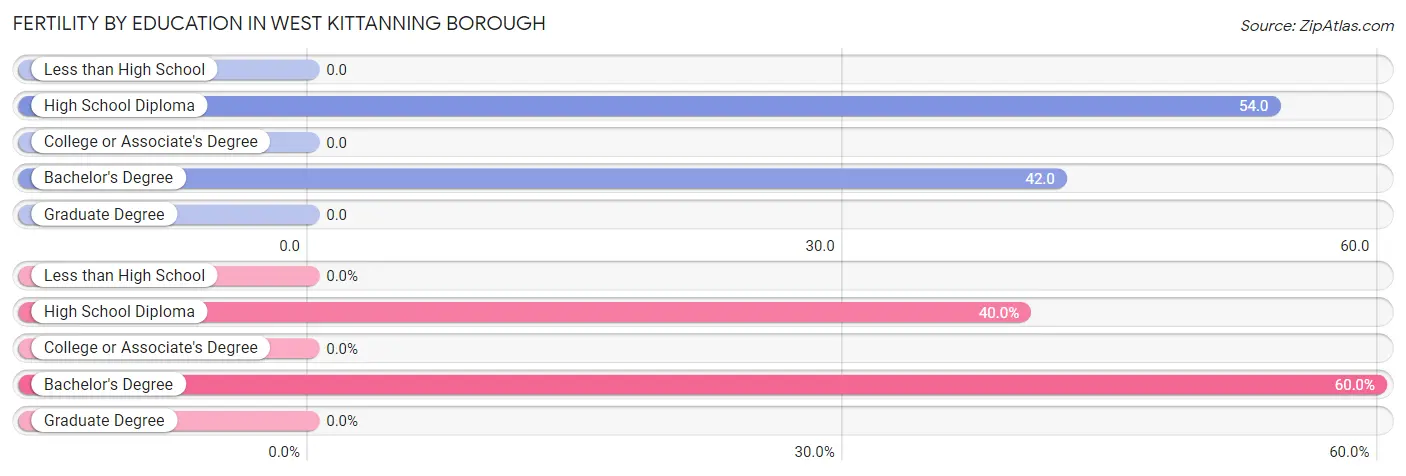
| Educational Attainment | Women with Births | Births / 1,000 Women |
| Less than High School | 0 (0.0%) | 0.0 |
| High School Diploma | 2 (40.0%) | 54.0 |
| College or Associate's Degree | 0 (0.0%) | 0.0 |
| Bachelor's Degree | 3 (60.0%) | 42.0 |
| Graduate Degree | 0 (0.0%) | 0.0 |
| Total | 5 (100.0%) | 25.0 |
Fertility by Education by Marriage Status in West Kittanning borough
40.0% of women with births in West Kittanning borough are unmarried. Women with the educational attainment of bachelor's degree are most likely to be married with 100.0% of them married at childbirth, while women with the educational attainment of high school diploma are least likely to be married with 100.0% of them unmarried at childbirth.
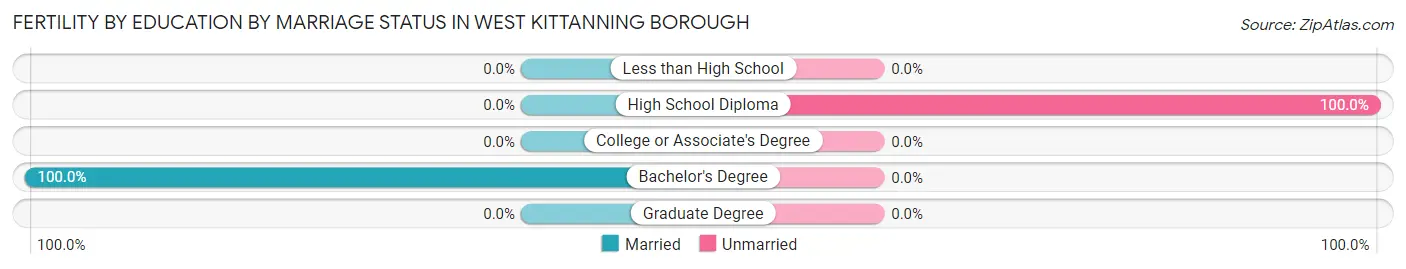
| Educational Attainment | Married | Unmarried |
| Less than High School | 0 (0.0%) | 0 (0.0%) |
| High School Diploma | 0 (0.0%) | 2 (100.0%) |
| College or Associate's Degree | 0 (0.0%) | 0 (0.0%) |
| Bachelor's Degree | 3 (100.0%) | 0 (0.0%) |
| Graduate Degree | 0 (0.0%) | 0 (0.0%) |
| Total | 3 (60.0%) | 2 (40.0%) |
Employment Characteristics in West Kittanning borough
Employment by Class of Employer in West Kittanning borough
Among the 646 employed individuals in West Kittanning borough, private company employees (465 | 72.0%), not-for-profit organizations (62 | 9.6%), and self-employed (not incorporated) (47 | 7.3%) make up the most common classes of employment.
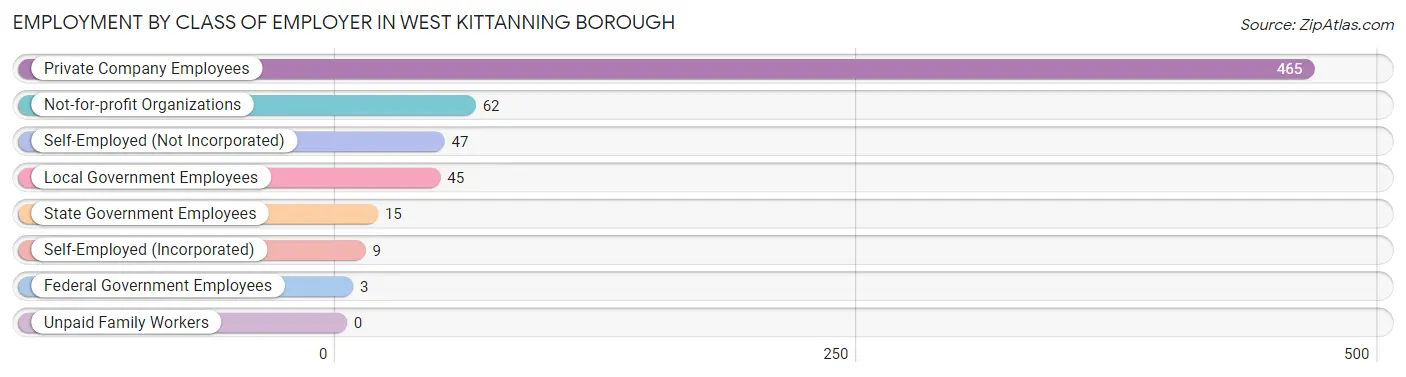
| Employer Class | # Employees | % Employees |
| Private Company Employees | 465 | 72.0% |
| Self-Employed (Incorporated) | 9 | 1.4% |
| Self-Employed (Not Incorporated) | 47 | 7.3% |
| Not-for-profit Organizations | 62 | 9.6% |
| Local Government Employees | 45 | 7.0% |
| State Government Employees | 15 | 2.3% |
| Federal Government Employees | 3 | 0.5% |
| Unpaid Family Workers | 0 | 0.0% |
| Total | 646 | 100.0% |
Employment Status by Age in West Kittanning borough
According to the labor force statistics for West Kittanning borough, out of the total population over 16 years of age (1,045), 65.2% or 681 individuals are in the labor force, with 5.1% or 35 of them unemployed. The age group with the highest labor force participation rate is 30 to 34 years, with 100.0% or 54 individuals in the labor force. Within the labor force, the 25 to 29 years age range has the highest percentage of unemployed individuals, with 21.7% or 10 of them being unemployed.
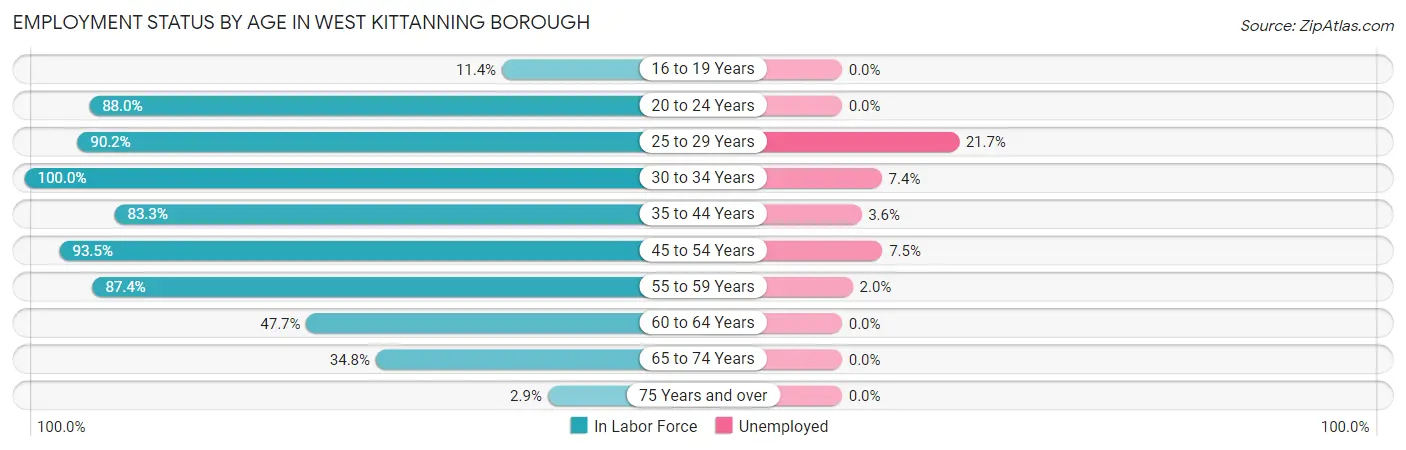
| Age Bracket | In Labor Force | Unemployed |
| 16 to 19 Years | 5 (11.4%) | 0 (0.0%) |
| 20 to 24 Years | 44 (88.0%) | 0 (0.0%) |
| 25 to 29 Years | 46 (90.2%) | 10 (21.7%) |
| 30 to 34 Years | 54 (100.0%) | 4 (7.4%) |
| 35 to 44 Years | 110 (83.3%) | 4 (3.6%) |
| 45 to 54 Years | 187 (93.5%) | 14 (7.5%) |
| 55 to 59 Years | 152 (87.4%) | 3 (2.0%) |
| 60 to 64 Years | 31 (47.7%) | 0 (0.0%) |
| 65 to 74 Years | 48 (34.8%) | 0 (0.0%) |
| 75 Years and over | 4 (2.9%) | 0 (0.0%) |
| Total | 681 (65.2%) | 35 (5.1%) |
Employment Status by Educational Attainment in West Kittanning borough
According to labor force statistics for West Kittanning borough, 85.8% of individuals (580) out of the total population between 25 and 64 years of age (676) are in the labor force, with 6.0% or 35 of them being unemployed. The group with the highest labor force participation rate are those with the educational attainment of bachelor's degree or higher, with 97.4% or 224 individuals in the labor force. Within the labor force, individuals with less than high school education have the highest percentage of unemployment, with 28.6% or 8 of them being unemployed.
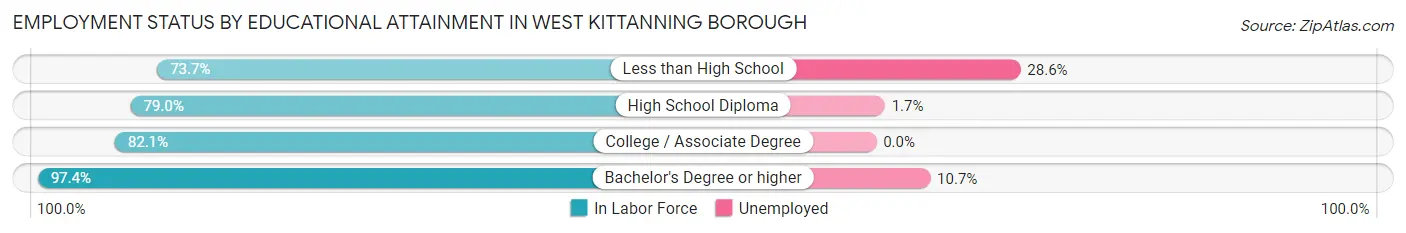
| Educational Attainment | In Labor Force | Unemployed |
| Less than High School | 28 (73.7%) | 11 (28.6%) |
| High School Diploma | 181 (79.0%) | 4 (1.7%) |
| College / Associate Degree | 147 (82.1%) | 0 (0.0%) |
| Bachelor's Degree or higher | 224 (97.4%) | 25 (10.7%) |
| Total | 580 (85.8%) | 41 (6.0%) |
Employment Occupations by Sex in West Kittanning borough
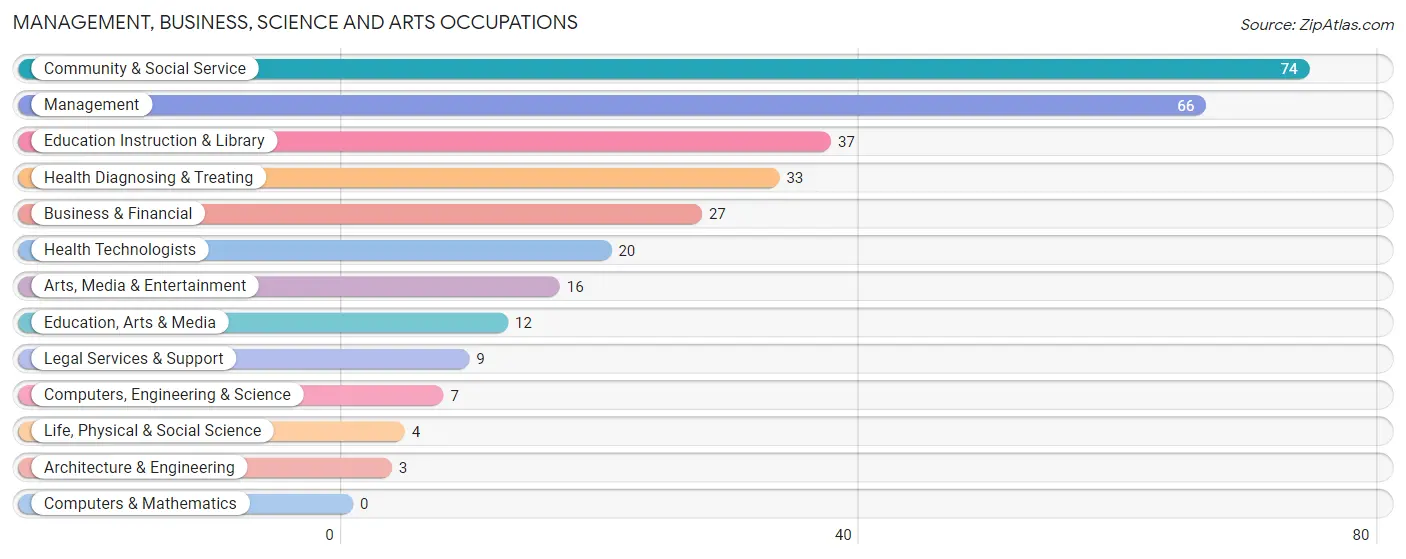
Management, Business, Science and Arts Occupations
The most common Management, Business, Science and Arts occupations in West Kittanning borough are Community & Social Service (74 | 11.5%), Management (66 | 10.2%), Education Instruction & Library (37 | 5.7%), Health Diagnosing & Treating (33 | 5.1%), and Business & Financial (27 | 4.2%).
Management, Business, Science and Arts Occupations by Sex
Within the Management, Business, Science and Arts occupations in West Kittanning borough, the most male-oriented occupations are Computers, Engineering & Science (100.0%), Architecture & Engineering (100.0%), and Life, Physical & Social Science (100.0%), while the most female-oriented occupations are Business & Financial (100.0%), Legal Services & Support (100.0%), and Education Instruction & Library (89.2%).
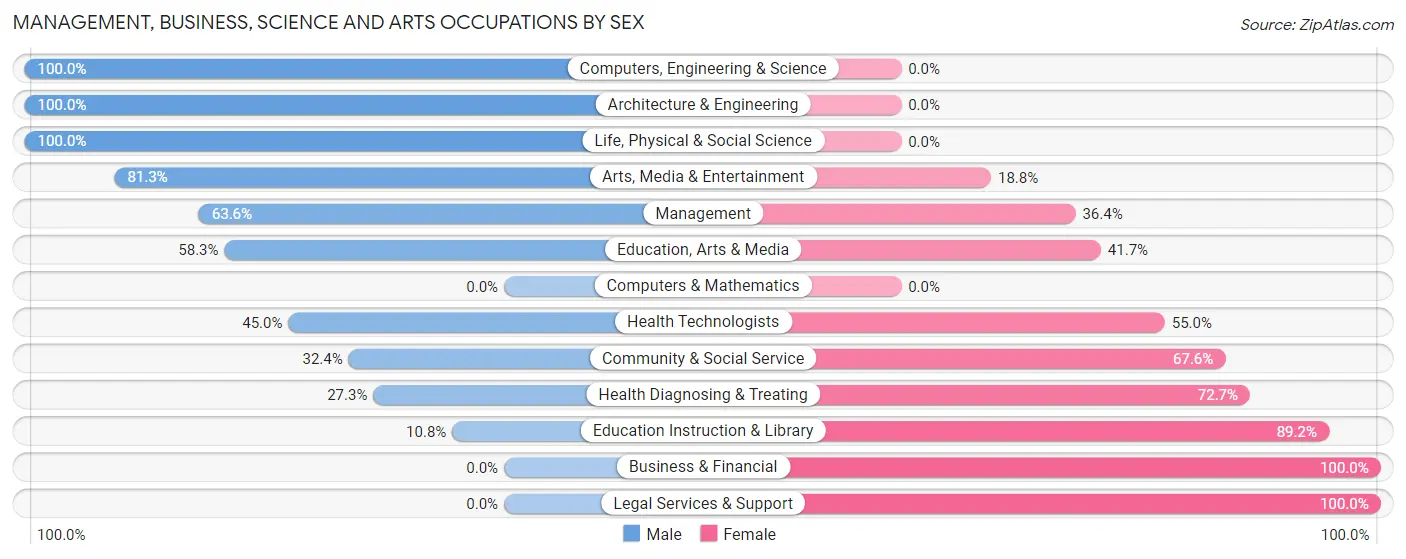
| Occupation | Male | Female |
| Management | 42 (63.6%) | 24 (36.4%) |
| Business & Financial | 0 (0.0%) | 27 (100.0%) |
| Computers, Engineering & Science | 7 (100.0%) | 0 (0.0%) |
| Computers & Mathematics | 0 (0.0%) | 0 (0.0%) |
| Architecture & Engineering | 3 (100.0%) | 0 (0.0%) |
| Life, Physical & Social Science | 4 (100.0%) | 0 (0.0%) |
| Community & Social Service | 24 (32.4%) | 50 (67.6%) |
| Education, Arts & Media | 7 (58.3%) | 5 (41.7%) |
| Legal Services & Support | 0 (0.0%) | 9 (100.0%) |
| Education Instruction & Library | 4 (10.8%) | 33 (89.2%) |
| Arts, Media & Entertainment | 13 (81.2%) | 3 (18.8%) |
| Health Diagnosing & Treating | 9 (27.3%) | 24 (72.7%) |
| Health Technologists | 9 (45.0%) | 11 (55.0%) |
| Total (Category) | 82 (39.6%) | 125 (60.4%) |
| Total (Overall) | 344 (53.2%) | 302 (46.8%) |
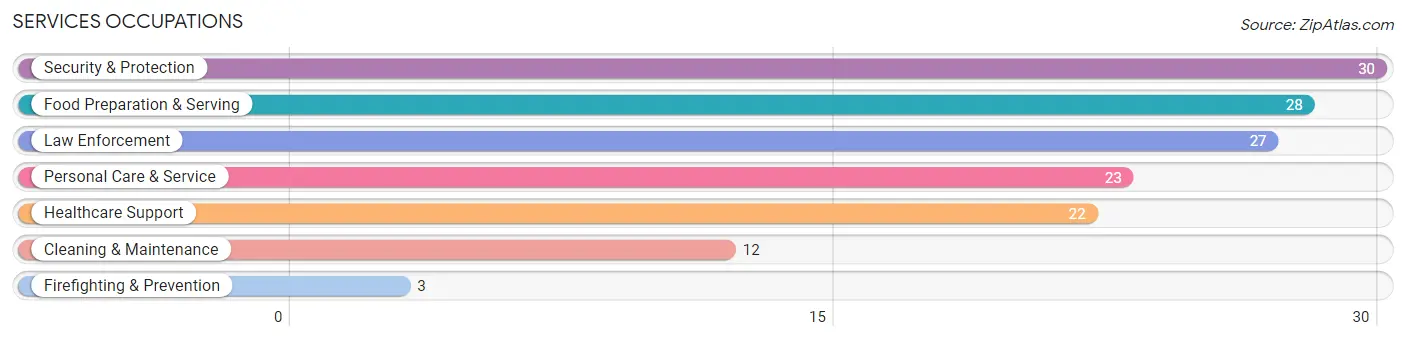
Services Occupations
The most common Services occupations in West Kittanning borough are Security & Protection (30 | 4.6%), Food Preparation & Serving (28 | 4.3%), Law Enforcement (27 | 4.2%), Personal Care & Service (23 | 3.6%), and Healthcare Support (22 | 3.4%).
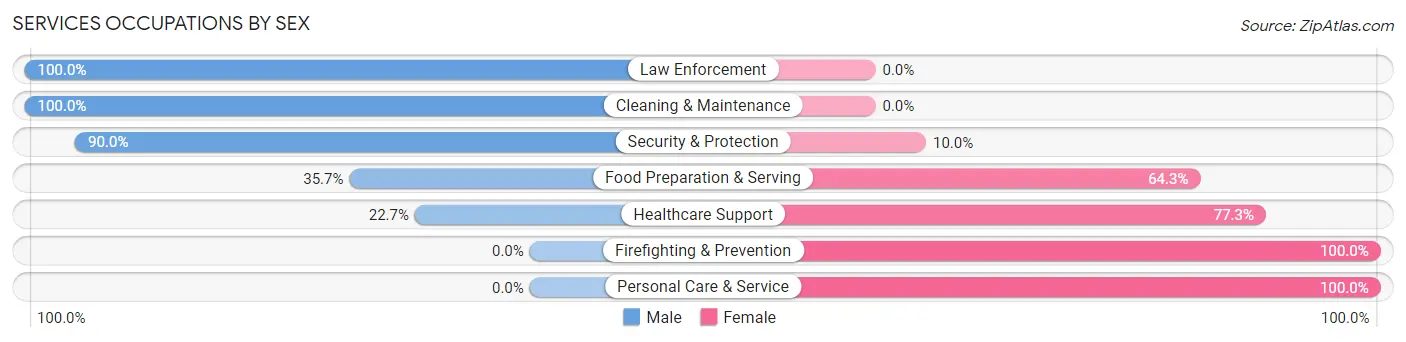
Services Occupations by Sex
Within the Services occupations in West Kittanning borough, the most male-oriented occupations are Law Enforcement (100.0%), Cleaning & Maintenance (100.0%), and Security & Protection (90.0%), while the most female-oriented occupations are Firefighting & Prevention (100.0%), Personal Care & Service (100.0%), and Healthcare Support (77.3%).
| Occupation | Male | Female |
| Healthcare Support | 5 (22.7%) | 17 (77.3%) |
| Security & Protection | 27 (90.0%) | 3 (10.0%) |
| Firefighting & Prevention | 0 (0.0%) | 3 (100.0%) |
| Law Enforcement | 27 (100.0%) | 0 (0.0%) |
| Food Preparation & Serving | 10 (35.7%) | 18 (64.3%) |
| Cleaning & Maintenance | 12 (100.0%) | 0 (0.0%) |
| Personal Care & Service | 0 (0.0%) | 23 (100.0%) |
| Total (Category) | 54 (47.0%) | 61 (53.0%) |
| Total (Overall) | 344 (53.2%) | 302 (46.8%) |
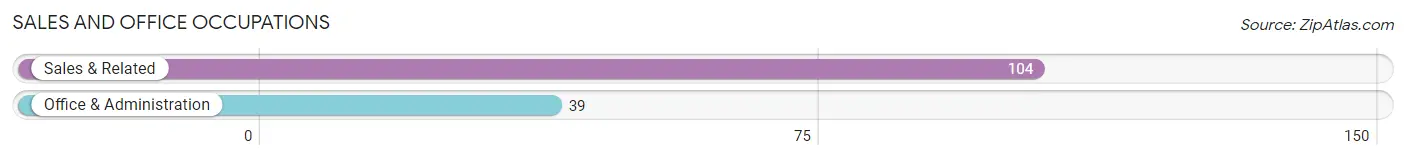
Sales and Office Occupations
The most common Sales and Office occupations in West Kittanning borough are Sales & Related (104 | 16.1%), and Office & Administration (39 | 6.0%).
Sales and Office Occupations by Sex
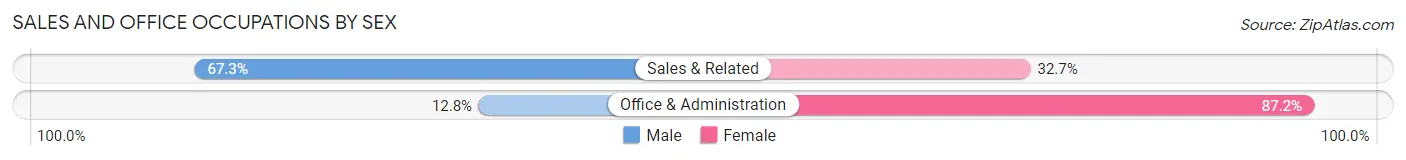
| Occupation | Male | Female |
| Sales & Related | 70 (67.3%) | 34 (32.7%) |
| Office & Administration | 5 (12.8%) | 34 (87.2%) |
| Total (Category) | 75 (52.4%) | 68 (47.5%) |
| Total (Overall) | 344 (53.2%) | 302 (46.8%) |
Natural Resources, Construction and Maintenance Occupations
The most common Natural Resources, Construction and Maintenance occupations in West Kittanning borough are Construction & Extraction (46 | 7.1%), and Installation, Maintenance & Repair (44 | 6.8%).
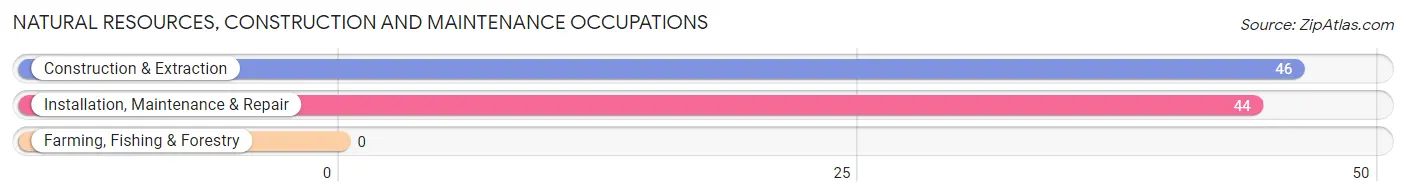
Natural Resources, Construction and Maintenance Occupations by Sex
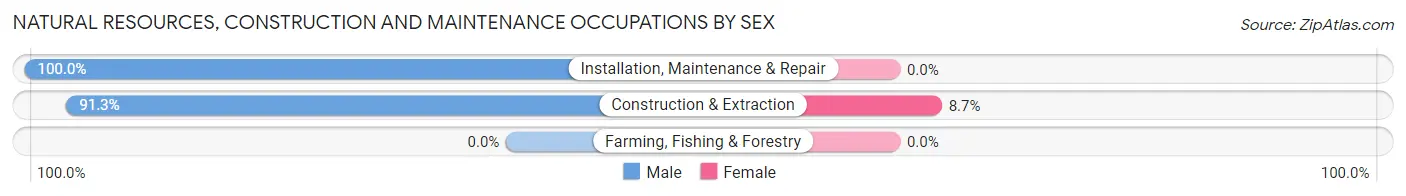
| Occupation | Male | Female |
| Farming, Fishing & Forestry | 0 (0.0%) | 0 (0.0%) |
| Construction & Extraction | 42 (91.3%) | 4 (8.7%) |
| Installation, Maintenance & Repair | 44 (100.0%) | 0 (0.0%) |
| Total (Category) | 86 (95.6%) | 4 (4.4%) |
| Total (Overall) | 344 (53.2%) | 302 (46.8%) |
Production, Transportation and Moving Occupations
The most common Production, Transportation and Moving occupations in West Kittanning borough are Production (61 | 9.4%), Material Moving (16 | 2.5%), and Transportation (14 | 2.2%).
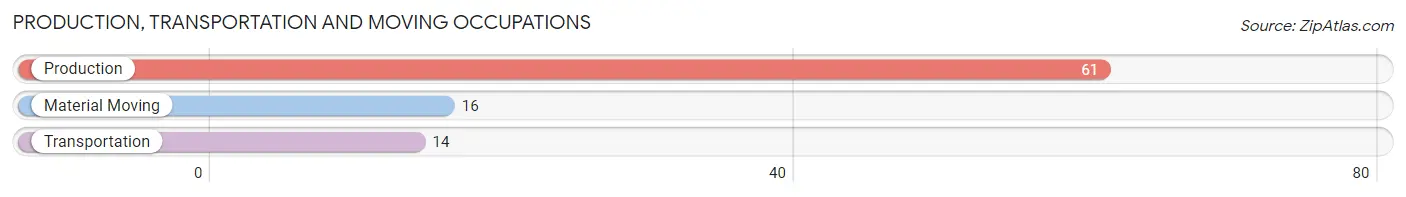
Production, Transportation and Moving Occupations by Sex
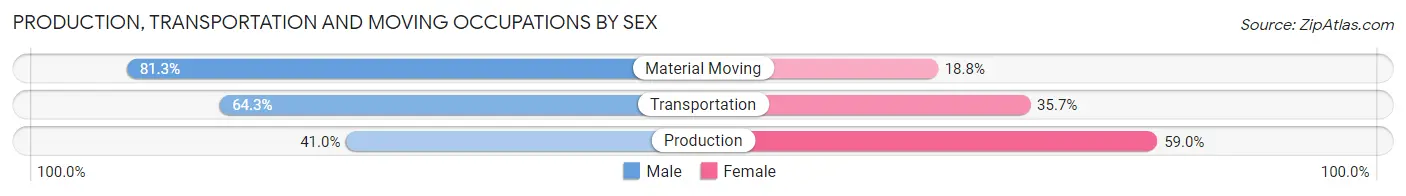
| Occupation | Male | Female |
| Production | 25 (41.0%) | 36 (59.0%) |
| Transportation | 9 (64.3%) | 5 (35.7%) |
| Material Moving | 13 (81.2%) | 3 (18.8%) |
| Total (Category) | 47 (51.6%) | 44 (48.3%) |
| Total (Overall) | 344 (53.2%) | 302 (46.8%) |
Employment Industries by Sex in West Kittanning borough
Employment Industries in West Kittanning borough
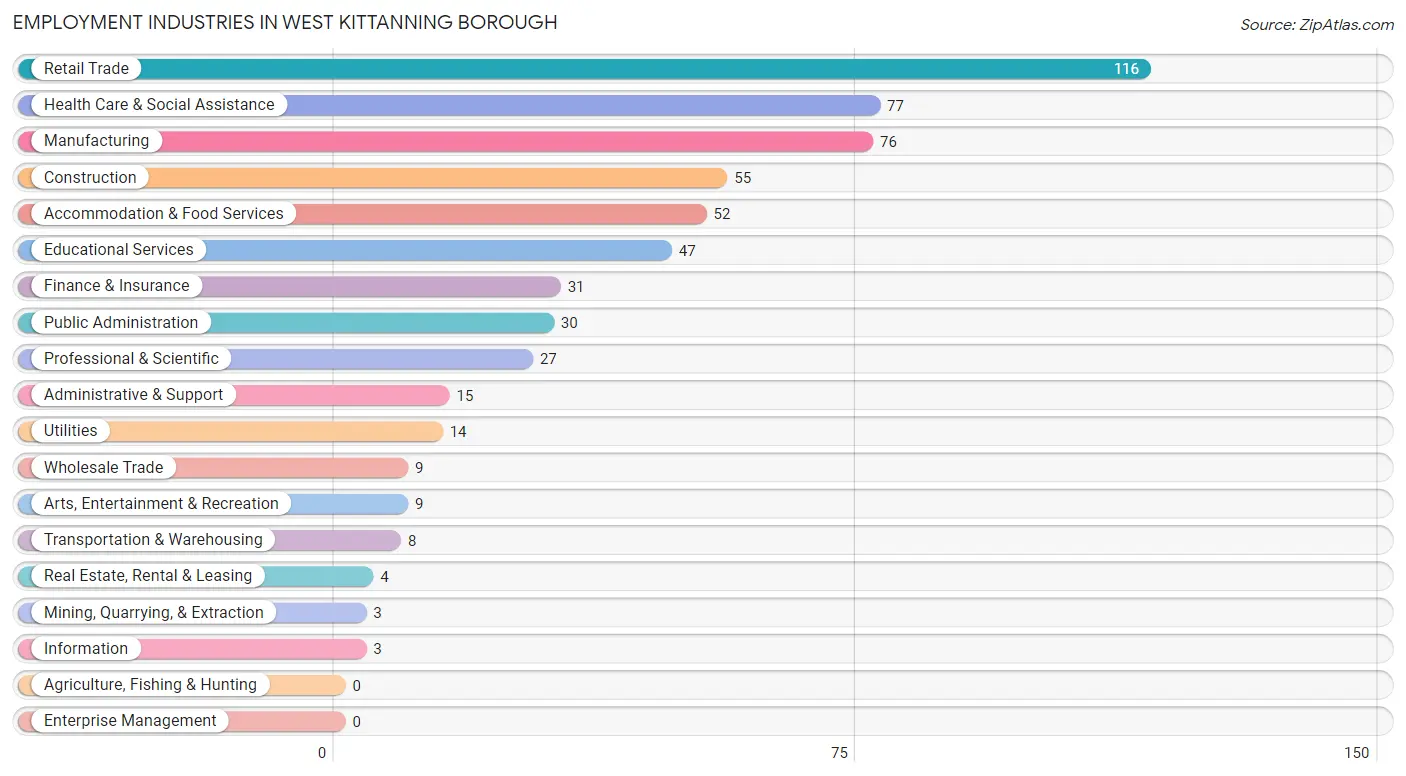
The major employment industries in West Kittanning borough include Retail Trade (116 | 18.0%), Health Care & Social Assistance (77 | 11.9%), Manufacturing (76 | 11.8%), Construction (55 | 8.5%), and Accommodation & Food Services (52 | 8.1%).
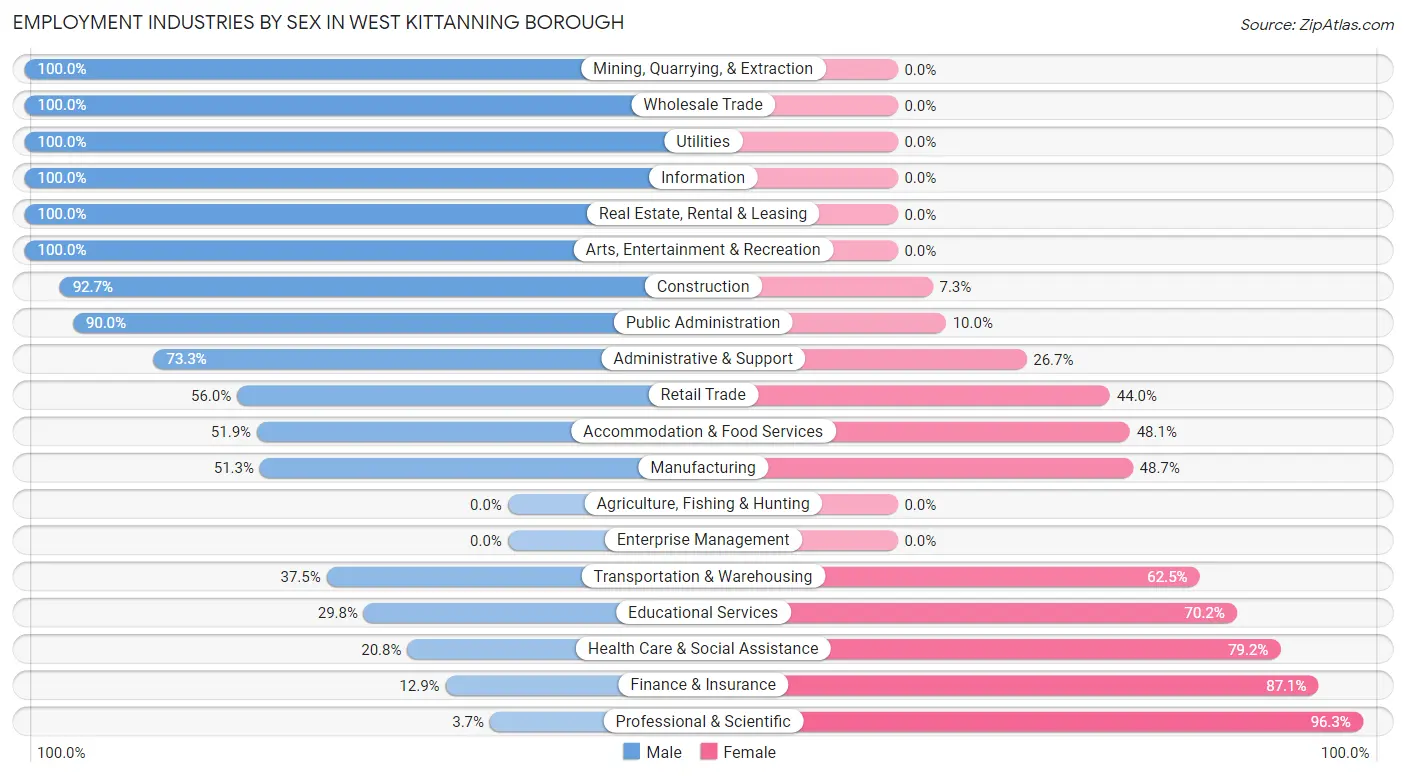
Employment Industries by Sex in West Kittanning borough
The West Kittanning borough industries that see more men than women are Mining, Quarrying, & Extraction (100.0%), Wholesale Trade (100.0%), and Utilities (100.0%), whereas the industries that tend to have a higher number of women are Professional & Scientific (96.3%), Finance & Insurance (87.1%), and Health Care & Social Assistance (79.2%).
| Industry | Male | Female |
| Agriculture, Fishing & Hunting | 0 (0.0%) | 0 (0.0%) |
| Mining, Quarrying, & Extraction | 3 (100.0%) | 0 (0.0%) |
| Construction | 51 (92.7%) | 4 (7.3%) |
| Manufacturing | 39 (51.3%) | 37 (48.7%) |
| Wholesale Trade | 9 (100.0%) | 0 (0.0%) |
| Retail Trade | 65 (56.0%) | 51 (44.0%) |
| Transportation & Warehousing | 3 (37.5%) | 5 (62.5%) |
| Utilities | 14 (100.0%) | 0 (0.0%) |
| Information | 3 (100.0%) | 0 (0.0%) |
| Finance & Insurance | 4 (12.9%) | 27 (87.1%) |
| Real Estate, Rental & Leasing | 4 (100.0%) | 0 (0.0%) |
| Professional & Scientific | 1 (3.7%) | 26 (96.3%) |
| Enterprise Management | 0 (0.0%) | 0 (0.0%) |
| Administrative & Support | 11 (73.3%) | 4 (26.7%) |
| Educational Services | 14 (29.8%) | 33 (70.2%) |
| Health Care & Social Assistance | 16 (20.8%) | 61 (79.2%) |
| Arts, Entertainment & Recreation | 9 (100.0%) | 0 (0.0%) |
| Accommodation & Food Services | 27 (51.9%) | 25 (48.1%) |
| Public Administration | 27 (90.0%) | 3 (10.0%) |
| Total | 344 (53.2%) | 302 (46.8%) |
Education in West Kittanning borough
School Enrollment in West Kittanning borough
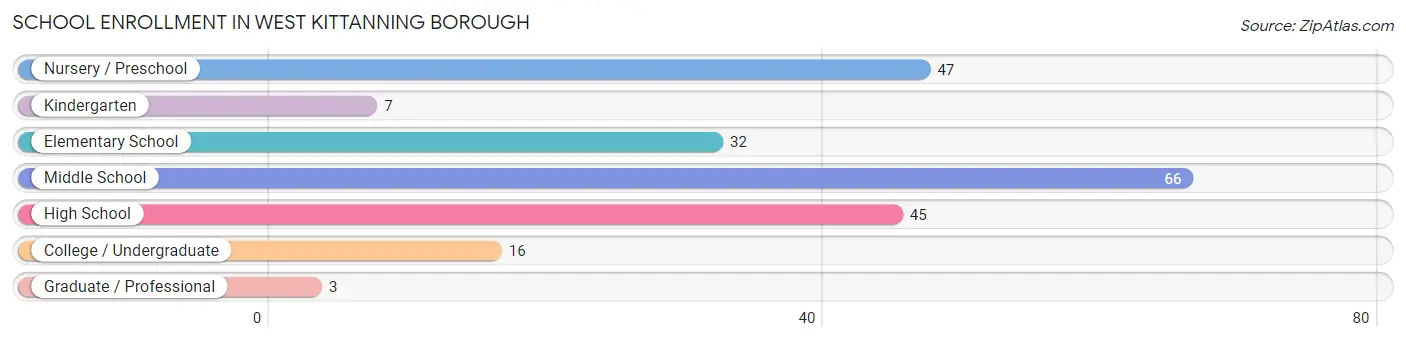
The most common levels of schooling among the 216 students in West Kittanning borough are middle school (66 | 30.6%), nursery / preschool (47 | 21.8%), and high school (45 | 20.8%).
| School Level | # Students | % Students |
| Nursery / Preschool | 47 | 21.8% |
| Kindergarten | 7 | 3.2% |
| Elementary School | 32 | 14.8% |
| Middle School | 66 | 30.6% |
| High School | 45 | 20.8% |
| College / Undergraduate | 16 | 7.4% |
| Graduate / Professional | 3 | 1.4% |
| Total | 216 | 100.0% |
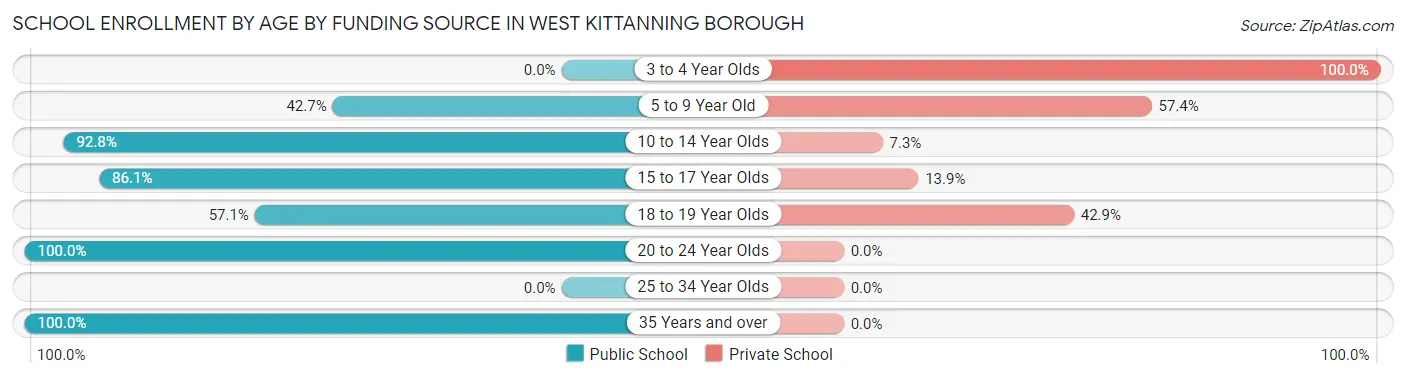
School Enrollment by Age by Funding Source in West Kittanning borough
Out of a total of 216 students who are enrolled in schools in West Kittanning borough, 73 (33.8%) attend a private institution, while the remaining 143 (66.2%) are enrolled in public schools. The age group of 3 to 4 year olds has the highest likelihood of being enrolled in private schools, with 18 (100.0% in the age bracket) enrolled. Conversely, the age group of 20 to 24 year olds has the lowest likelihood of being enrolled in a private school, with 8 (100.0% in the age bracket) attending a public institution.
| Age Bracket | Public School | Private School |
| 3 to 4 Year Olds | 0 (0.0%) | 18 (100.0%) |
| 5 to 9 Year Old | 29 (42.6%) | 39 (57.4%) |
| 10 to 14 Year Olds | 64 (92.7%) | 5 (7.2%) |
| 15 to 17 Year Olds | 31 (86.1%) | 5 (13.9%) |
| 18 to 19 Year Olds | 8 (57.1%) | 6 (42.9%) |
| 20 to 24 Year Olds | 8 (100.0%) | 0 (0.0%) |
| 25 to 34 Year Olds | 0 (0.0%) | 0 (0.0%) |
| 35 Years and over | 3 (100.0%) | 0 (0.0%) |
| Total | 143 (66.2%) | 73 (33.8%) |
Educational Attainment by Field of Study in West Kittanning borough
Business (64 | 19.9%), education (50 | 15.5%), science & technology (40 | 12.4%), social sciences (38 | 11.8%), and communications (31 | 9.6%) are the most common fields of study among 322 individuals in West Kittanning borough who have obtained a bachelor's degree or higher.
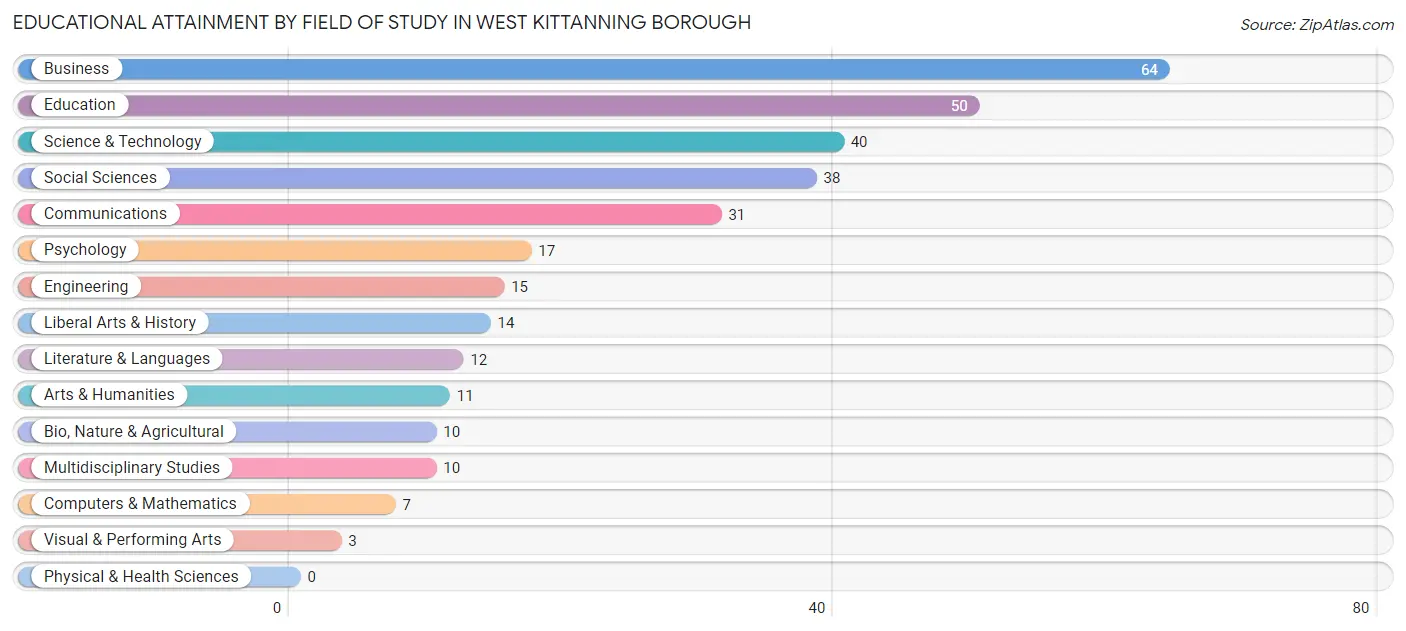
| Field of Study | # Graduates | % Graduates |
| Computers & Mathematics | 7 | 2.2% |
| Bio, Nature & Agricultural | 10 | 3.1% |
| Physical & Health Sciences | 0 | 0.0% |
| Psychology | 17 | 5.3% |
| Social Sciences | 38 | 11.8% |
| Engineering | 15 | 4.7% |
| Multidisciplinary Studies | 10 | 3.1% |
| Science & Technology | 40 | 12.4% |
| Business | 64 | 19.9% |
| Education | 50 | 15.5% |
| Literature & Languages | 12 | 3.7% |
| Liberal Arts & History | 14 | 4.3% |
| Visual & Performing Arts | 3 | 0.9% |
| Communications | 31 | 9.6% |
| Arts & Humanities | 11 | 3.4% |
| Total | 322 | 100.0% |
Transportation & Commute in West Kittanning borough
Vehicle Availability by Sex in West Kittanning borough
The most prevalent vehicle ownership categories in West Kittanning borough are males with 2 vehicles (183, accounting for 53.2%) and females with 2 vehicles (141, making up 60.6%).
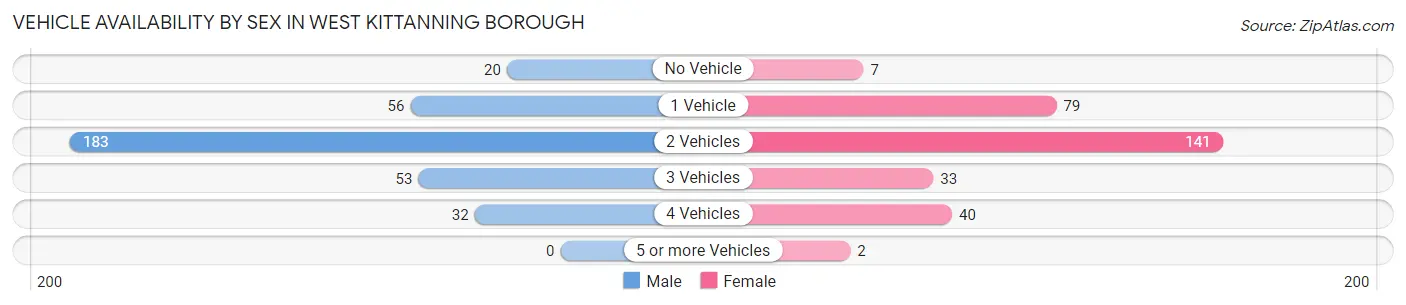
| Vehicles Available | Male | Female |
| No Vehicle | 20 (5.8%) | 7 (2.3%) |
| 1 Vehicle | 56 (16.3%) | 79 (26.2%) |
| 2 Vehicles | 183 (53.2%) | 141 (46.7%) |
| 3 Vehicles | 53 (15.4%) | 33 (10.9%) |
| 4 Vehicles | 32 (9.3%) | 40 (13.3%) |
| 5 or more Vehicles | 0 (0.0%) | 2 (0.7%) |
| Total | 344 (100.0%) | 302 (100.0%) |
Commute Time in West Kittanning borough
The most frequently occuring commute durations in West Kittanning borough are 5 to 9 minutes (120 commuters, 21.1%), 10 to 14 minutes (90 commuters, 15.8%), and less than 5 minutes (62 commuters, 10.9%).
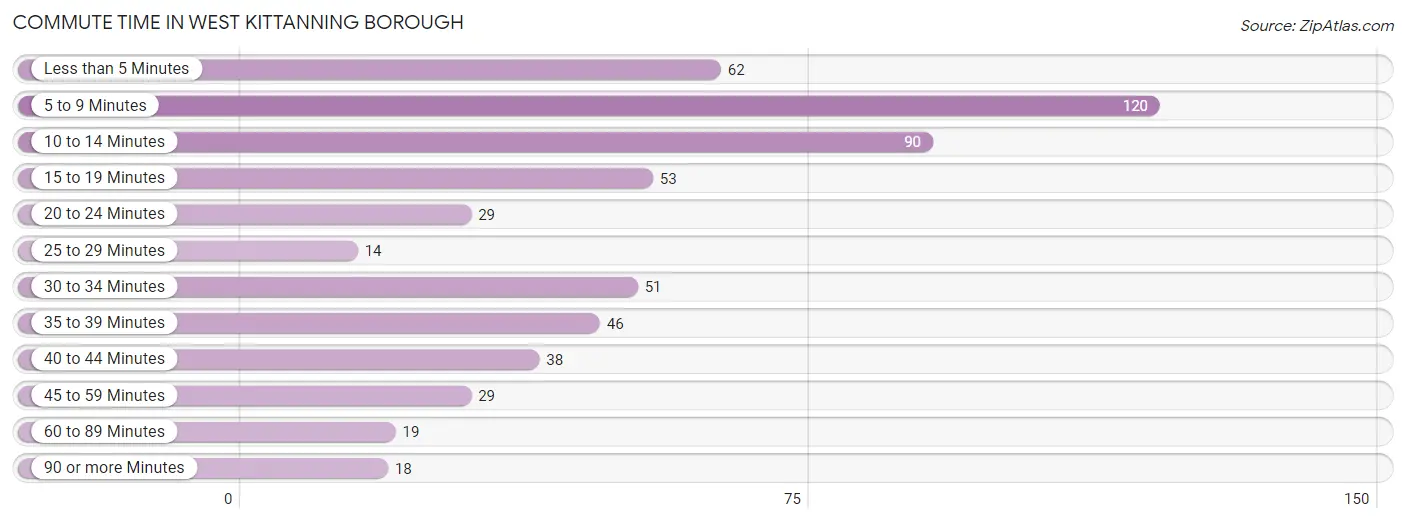
| Commute Time | # Commuters | % Commuters |
| Less than 5 Minutes | 62 | 10.9% |
| 5 to 9 Minutes | 120 | 21.1% |
| 10 to 14 Minutes | 90 | 15.8% |
| 15 to 19 Minutes | 53 | 9.3% |
| 20 to 24 Minutes | 29 | 5.1% |
| 25 to 29 Minutes | 14 | 2.5% |
| 30 to 34 Minutes | 51 | 9.0% |
| 35 to 39 Minutes | 46 | 8.1% |
| 40 to 44 Minutes | 38 | 6.7% |
| 45 to 59 Minutes | 29 | 5.1% |
| 60 to 89 Minutes | 19 | 3.3% |
| 90 or more Minutes | 18 | 3.2% |
Commute Time by Sex in West Kittanning borough
The most common commute times in West Kittanning borough are 5 to 9 minutes (74 commuters, 23.6%) for males and 5 to 9 minutes (46 commuters, 18.0%) for females.
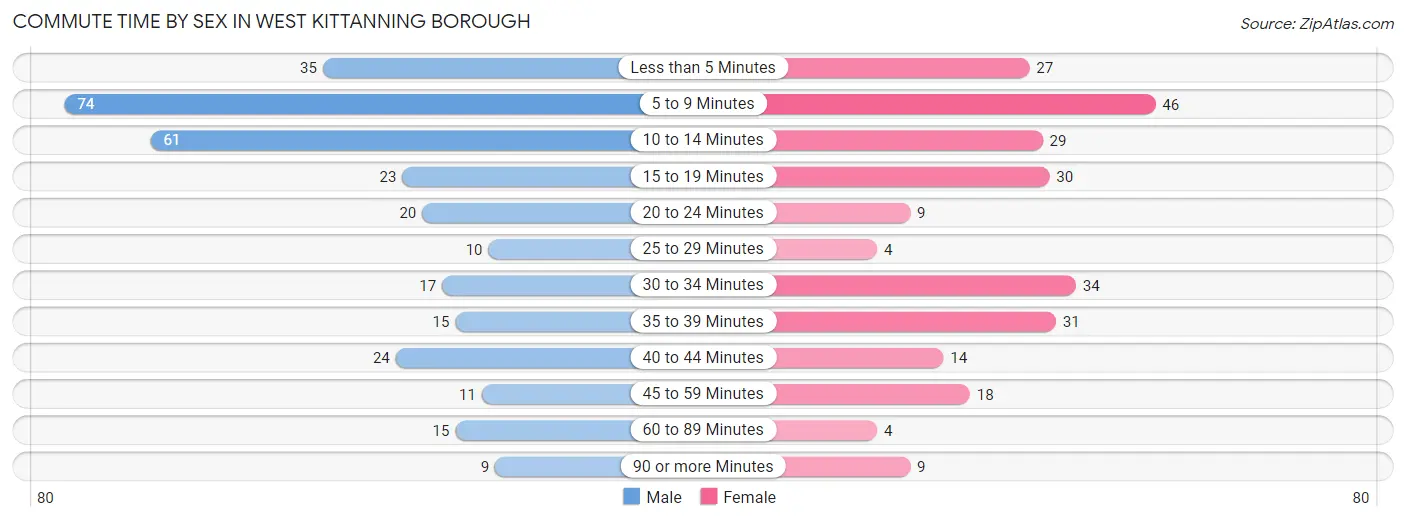
| Commute Time | Male | Female |
| Less than 5 Minutes | 35 (11.2%) | 27 (10.6%) |
| 5 to 9 Minutes | 74 (23.6%) | 46 (18.0%) |
| 10 to 14 Minutes | 61 (19.4%) | 29 (11.4%) |
| 15 to 19 Minutes | 23 (7.3%) | 30 (11.8%) |
| 20 to 24 Minutes | 20 (6.4%) | 9 (3.5%) |
| 25 to 29 Minutes | 10 (3.2%) | 4 (1.6%) |
| 30 to 34 Minutes | 17 (5.4%) | 34 (13.3%) |
| 35 to 39 Minutes | 15 (4.8%) | 31 (12.2%) |
| 40 to 44 Minutes | 24 (7.6%) | 14 (5.5%) |
| 45 to 59 Minutes | 11 (3.5%) | 18 (7.1%) |
| 60 to 89 Minutes | 15 (4.8%) | 4 (1.6%) |
| 90 or more Minutes | 9 (2.9%) | 9 (3.5%) |
Time of Departure to Work by Sex in West Kittanning borough
The most frequent times of departure to work in West Kittanning borough are 6:30 AM to 6:59 AM (54, 17.2%) for males and 7:30 AM to 7:59 AM (64, 25.1%) for females.
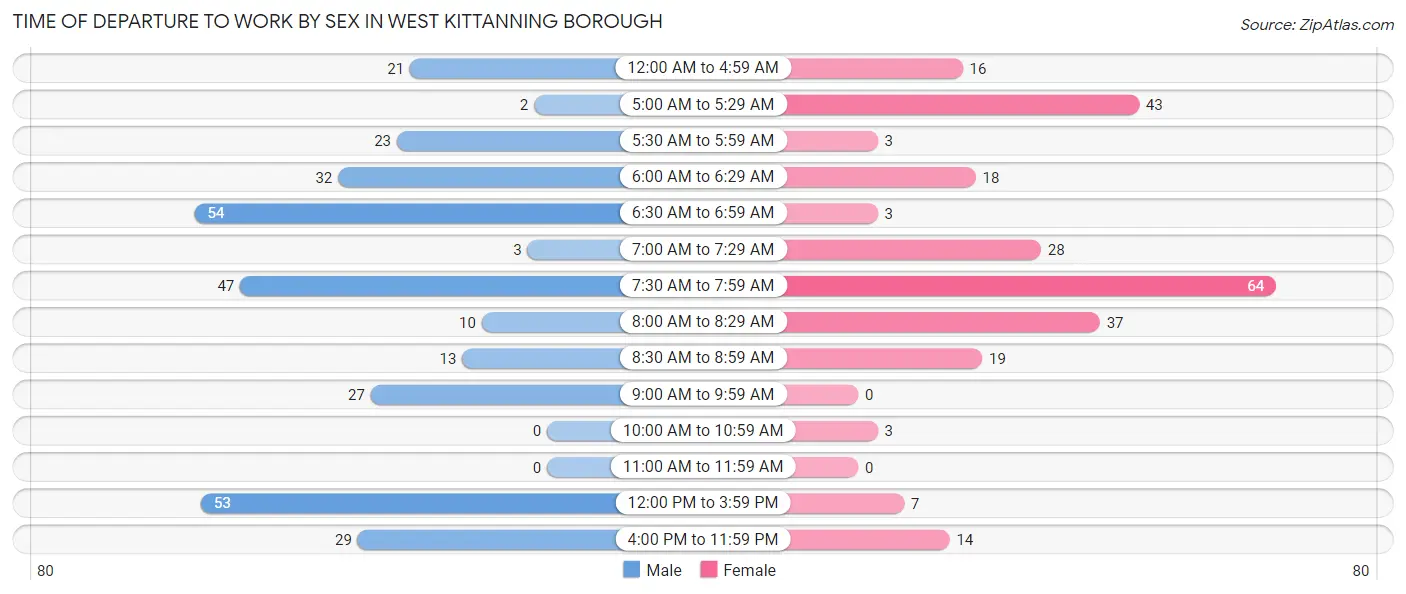
| Time of Departure | Male | Female |
| 12:00 AM to 4:59 AM | 21 (6.7%) | 16 (6.3%) |
| 5:00 AM to 5:29 AM | 2 (0.6%) | 43 (16.9%) |
| 5:30 AM to 5:59 AM | 23 (7.3%) | 3 (1.2%) |
| 6:00 AM to 6:29 AM | 32 (10.2%) | 18 (7.1%) |
| 6:30 AM to 6:59 AM | 54 (17.2%) | 3 (1.2%) |
| 7:00 AM to 7:29 AM | 3 (1.0%) | 28 (11.0%) |
| 7:30 AM to 7:59 AM | 47 (15.0%) | 64 (25.1%) |
| 8:00 AM to 8:29 AM | 10 (3.2%) | 37 (14.5%) |
| 8:30 AM to 8:59 AM | 13 (4.1%) | 19 (7.4%) |
| 9:00 AM to 9:59 AM | 27 (8.6%) | 0 (0.0%) |
| 10:00 AM to 10:59 AM | 0 (0.0%) | 3 (1.2%) |
| 11:00 AM to 11:59 AM | 0 (0.0%) | 0 (0.0%) |
| 12:00 PM to 3:59 PM | 53 (16.9%) | 7 (2.8%) |
| 4:00 PM to 11:59 PM | 29 (9.2%) | 14 (5.5%) |
| Total | 314 (100.0%) | 255 (100.0%) |
Housing Occupancy in West Kittanning borough
Occupancy by Ownership in West Kittanning borough
Of the total 601 dwellings in West Kittanning borough, owner-occupied units account for 454 (75.5%), while renter-occupied units make up 147 (24.5%).
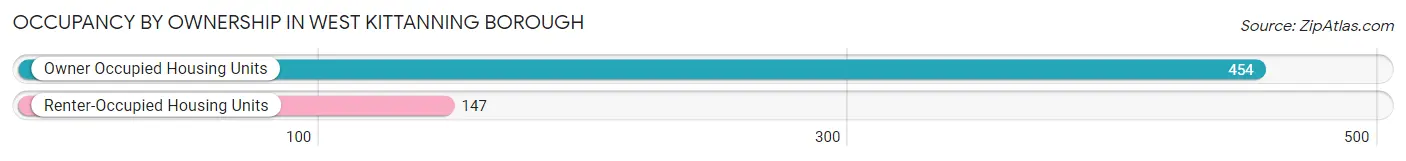
| Occupancy | # Housing Units | % Housing Units |
| Owner Occupied Housing Units | 454 | 75.5% |
| Renter-Occupied Housing Units | 147 | 24.5% |
| Total Occupied Housing Units | 601 | 100.0% |
Occupancy by Household Size in West Kittanning borough
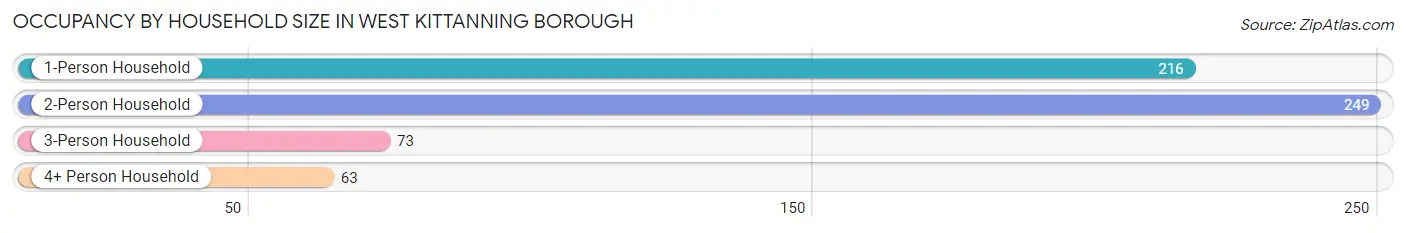
| Household Size | # Housing Units | % Housing Units |
| 1-Person Household | 216 | 35.9% |
| 2-Person Household | 249 | 41.4% |
| 3-Person Household | 73 | 12.1% |
| 4+ Person Household | 63 | 10.5% |
| Total Housing Units | 601 | 100.0% |
Occupancy by Ownership by Household Size in West Kittanning borough
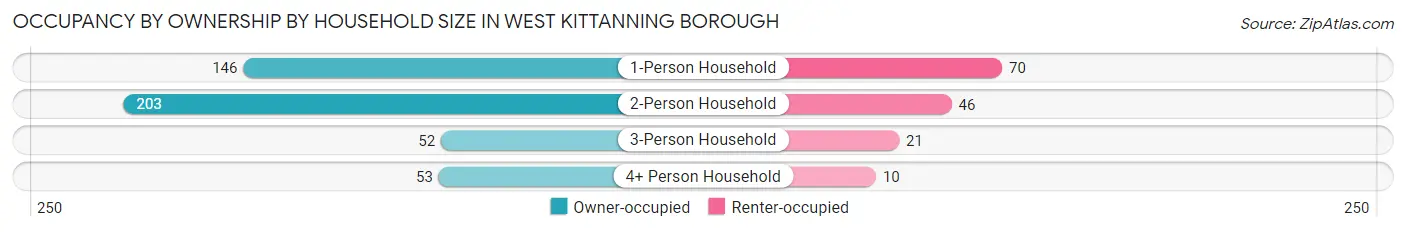
| Household Size | Owner-occupied | Renter-occupied |
| 1-Person Household | 146 (67.6%) | 70 (32.4%) |
| 2-Person Household | 203 (81.5%) | 46 (18.5%) |
| 3-Person Household | 52 (71.2%) | 21 (28.8%) |
| 4+ Person Household | 53 (84.1%) | 10 (15.9%) |
| Total Housing Units | 454 (75.5%) | 147 (24.5%) |
Occupancy by Educational Attainment in West Kittanning borough
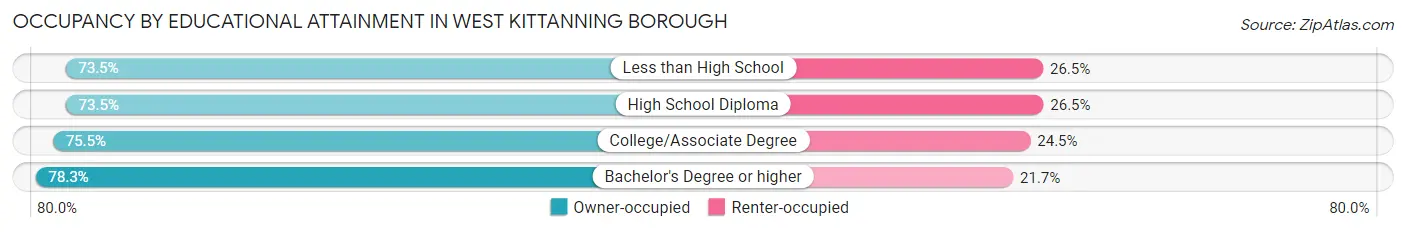
| Household Size | Owner-occupied | Renter-occupied |
| Less than High School | 25 (73.5%) | 9 (26.5%) |
| High School Diploma | 169 (73.5%) | 61 (26.5%) |
| College/Associate Degree | 105 (75.5%) | 34 (24.5%) |
| Bachelor's Degree or higher | 155 (78.3%) | 43 (21.7%) |
Occupancy by Age of Householder in West Kittanning borough
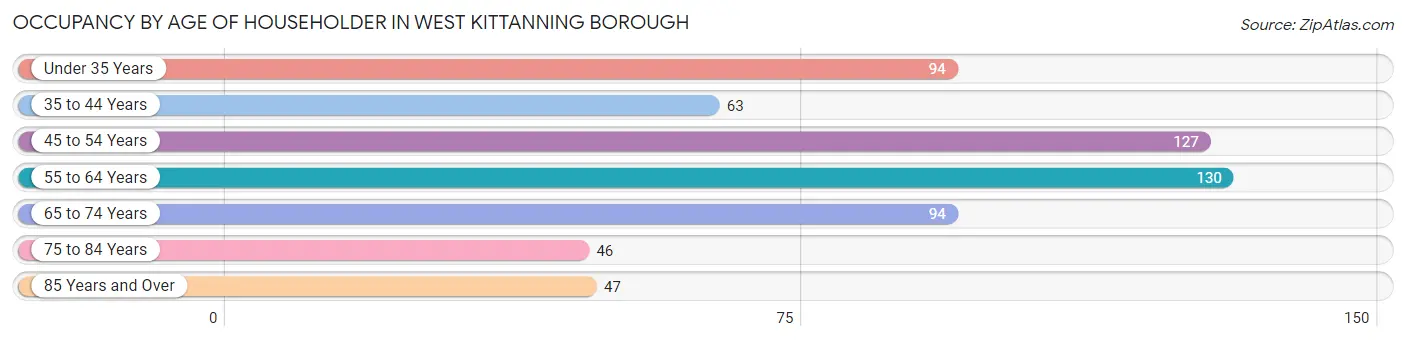
| Age Bracket | # Households | % Households |
| Under 35 Years | 94 | 15.6% |
| 35 to 44 Years | 63 | 10.5% |
| 45 to 54 Years | 127 | 21.1% |
| 55 to 64 Years | 130 | 21.6% |
| 65 to 74 Years | 94 | 15.6% |
| 75 to 84 Years | 46 | 7.6% |
| 85 Years and Over | 47 | 7.8% |
| Total | 601 | 100.0% |
Housing Finances in West Kittanning borough
Median Income by Occupancy in West Kittanning borough
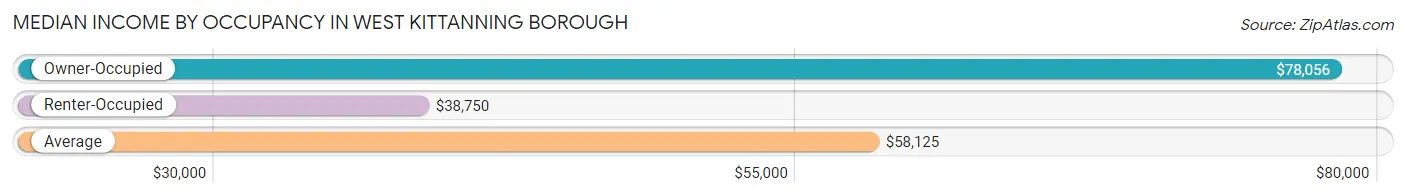
| Occupancy Type | # Households | Median Income |
| Owner-Occupied | 454 (75.5%) | $78,056 |
| Renter-Occupied | 147 (24.5%) | $38,750 |
| Average | 601 (100.0%) | $58,125 |
Occupancy by Householder Income Bracket in West Kittanning borough
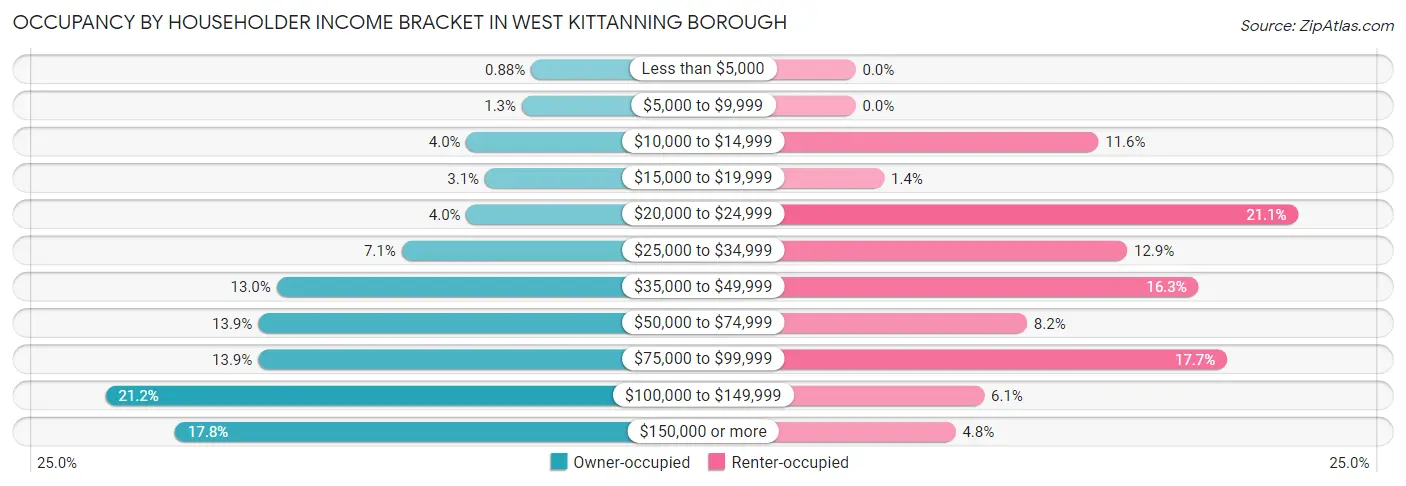
| Income Bracket | Owner-occupied | Renter-occupied |
| Less than $5,000 | 4 (0.9%) | 0 (0.0%) |
| $5,000 to $9,999 | 6 (1.3%) | 0 (0.0%) |
| $10,000 to $14,999 | 18 (4.0%) | 17 (11.6%) |
| $15,000 to $19,999 | 14 (3.1%) | 2 (1.4%) |
| $20,000 to $24,999 | 18 (4.0%) | 31 (21.1%) |
| $25,000 to $34,999 | 32 (7.0%) | 19 (12.9%) |
| $35,000 to $49,999 | 59 (13.0%) | 24 (16.3%) |
| $50,000 to $74,999 | 63 (13.9%) | 12 (8.2%) |
| $75,000 to $99,999 | 63 (13.9%) | 26 (17.7%) |
| $100,000 to $149,999 | 96 (21.1%) | 9 (6.1%) |
| $150,000 or more | 81 (17.8%) | 7 (4.8%) |
| Total | 454 (100.0%) | 147 (100.0%) |
Monthly Housing Cost Tiers in West Kittanning borough
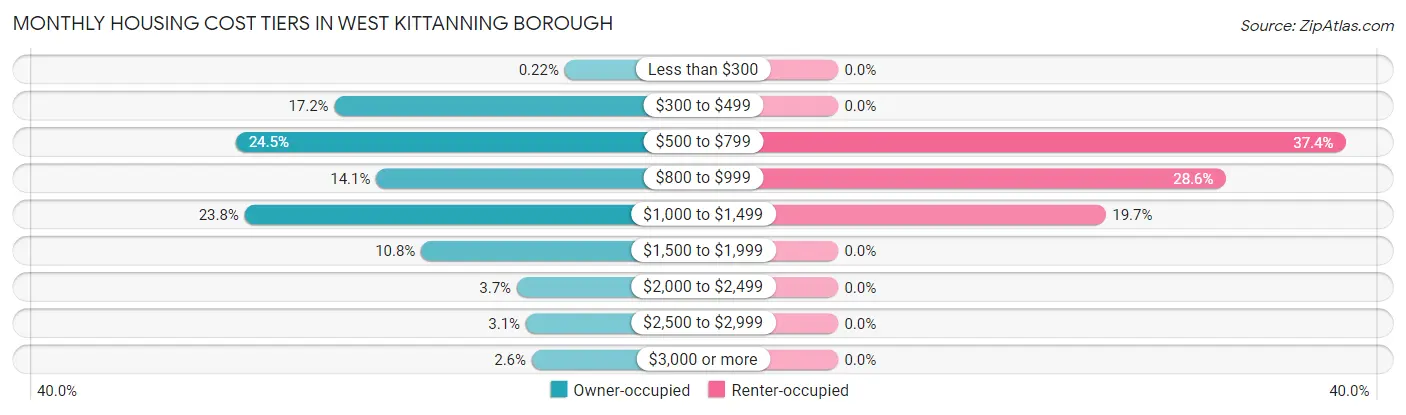
| Monthly Cost | Owner-occupied | Renter-occupied |
| Less than $300 | 1 (0.2%) | 0 (0.0%) |
| $300 to $499 | 78 (17.2%) | 0 (0.0%) |
| $500 to $799 | 111 (24.4%) | 55 (37.4%) |
| $800 to $999 | 64 (14.1%) | 42 (28.6%) |
| $1,000 to $1,499 | 108 (23.8%) | 29 (19.7%) |
| $1,500 to $1,999 | 49 (10.8%) | 0 (0.0%) |
| $2,000 to $2,499 | 17 (3.7%) | 0 (0.0%) |
| $2,500 to $2,999 | 14 (3.1%) | 0 (0.0%) |
| $3,000 or more | 12 (2.6%) | 0 (0.0%) |
| Total | 454 (100.0%) | 147 (100.0%) |
Physical Housing Characteristics in West Kittanning borough
Housing Structures in West Kittanning borough
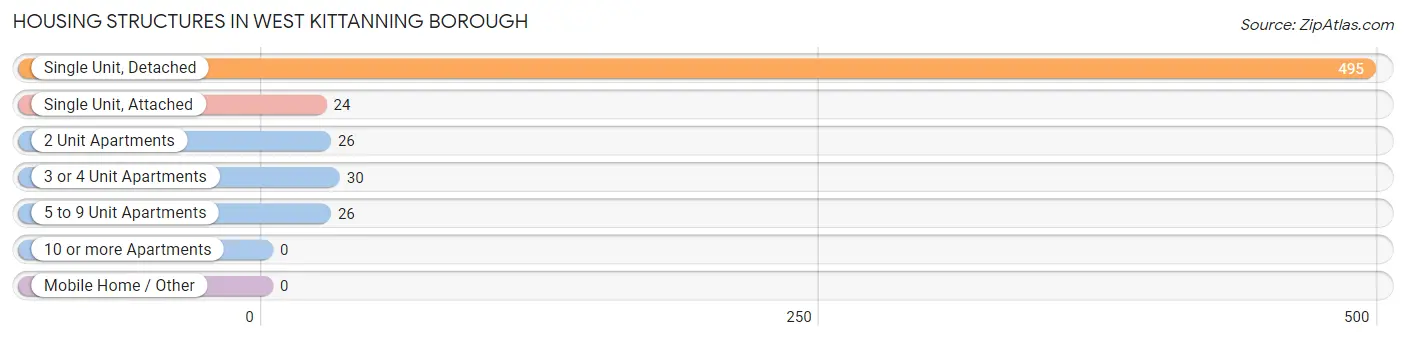
| Structure Type | # Housing Units | % Housing Units |
| Single Unit, Detached | 495 | 82.4% |
| Single Unit, Attached | 24 | 4.0% |
| 2 Unit Apartments | 26 | 4.3% |
| 3 or 4 Unit Apartments | 30 | 5.0% |
| 5 to 9 Unit Apartments | 26 | 4.3% |
| 10 or more Apartments | 0 | 0.0% |
| Mobile Home / Other | 0 | 0.0% |
| Total | 601 | 100.0% |
Housing Structures by Occupancy in West Kittanning borough
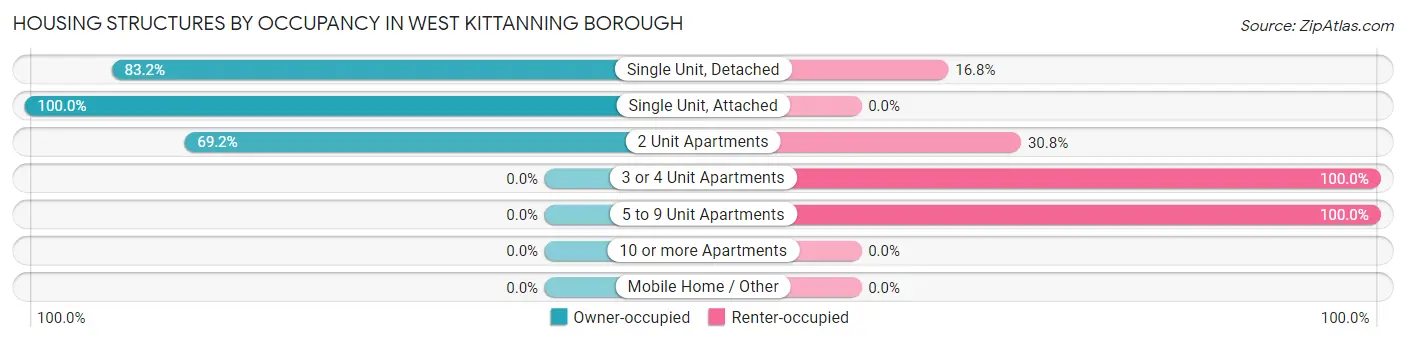
| Structure Type | Owner-occupied | Renter-occupied |
| Single Unit, Detached | 412 (83.2%) | 83 (16.8%) |
| Single Unit, Attached | 24 (100.0%) | 0 (0.0%) |
| 2 Unit Apartments | 18 (69.2%) | 8 (30.8%) |
| 3 or 4 Unit Apartments | 0 (0.0%) | 30 (100.0%) |
| 5 to 9 Unit Apartments | 0 (0.0%) | 26 (100.0%) |
| 10 or more Apartments | 0 (0.0%) | 0 (0.0%) |
| Mobile Home / Other | 0 (0.0%) | 0 (0.0%) |
| Total | 454 (75.5%) | 147 (24.5%) |
Housing Structures by Number of Rooms in West Kittanning borough
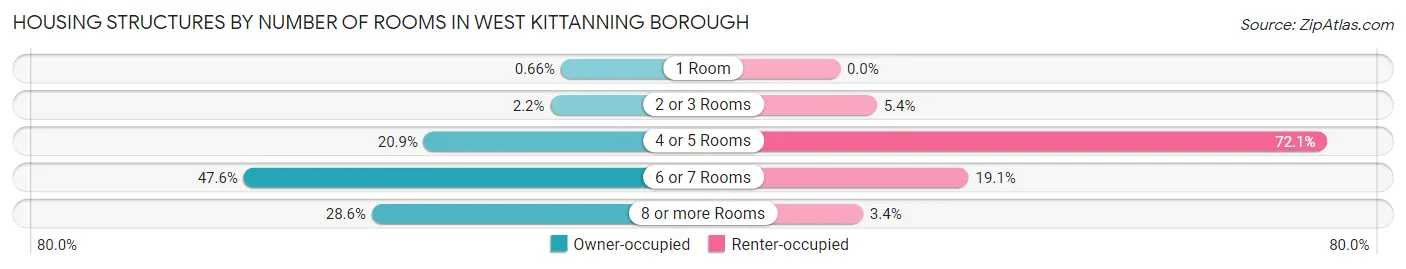
| Number of Rooms | Owner-occupied | Renter-occupied |
| 1 Room | 3 (0.7%) | 0 (0.0%) |
| 2 or 3 Rooms | 10 (2.2%) | 8 (5.4%) |
| 4 or 5 Rooms | 95 (20.9%) | 106 (72.1%) |
| 6 or 7 Rooms | 216 (47.6%) | 28 (19.1%) |
| 8 or more Rooms | 130 (28.6%) | 5 (3.4%) |
| Total | 454 (100.0%) | 147 (100.0%) |
Housing Structure by Heating Type in West Kittanning borough
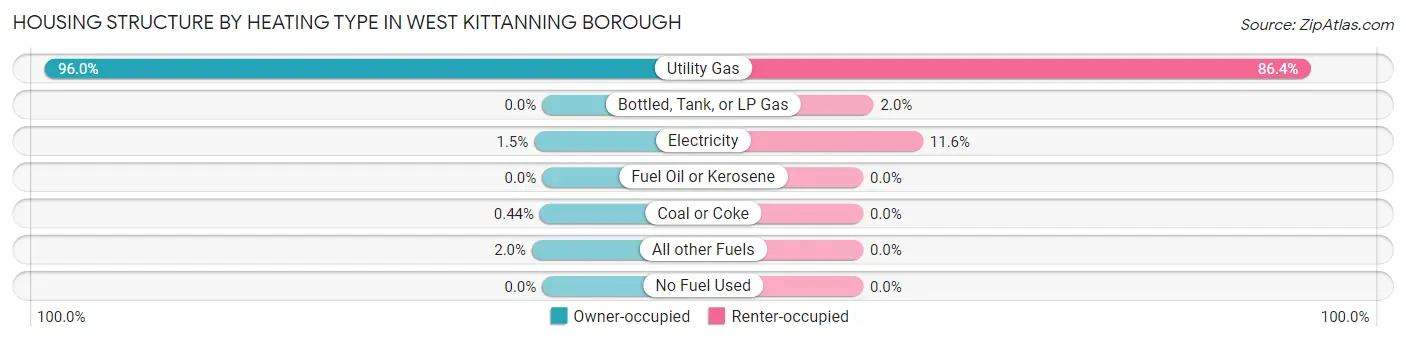
| Heating Type | Owner-occupied | Renter-occupied |
| Utility Gas | 436 (96.0%) | 127 (86.4%) |
| Bottled, Tank, or LP Gas | 0 (0.0%) | 3 (2.0%) |
| Electricity | 7 (1.5%) | 17 (11.6%) |
| Fuel Oil or Kerosene | 0 (0.0%) | 0 (0.0%) |
| Coal or Coke | 2 (0.4%) | 0 (0.0%) |
| All other Fuels | 9 (2.0%) | 0 (0.0%) |
| No Fuel Used | 0 (0.0%) | 0 (0.0%) |
| Total | 454 (100.0%) | 147 (100.0%) |
Household Vehicle Usage in West Kittanning borough
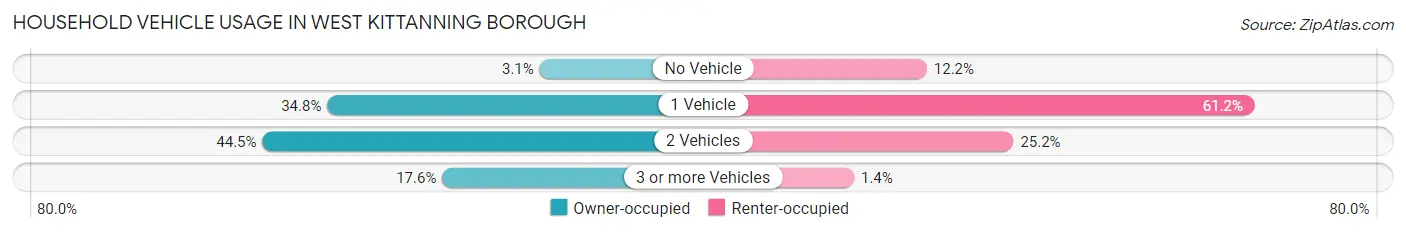
| Vehicles per Household | Owner-occupied | Renter-occupied |
| No Vehicle | 14 (3.1%) | 18 (12.2%) |
| 1 Vehicle | 158 (34.8%) | 90 (61.2%) |
| 2 Vehicles | 202 (44.5%) | 37 (25.2%) |
| 3 or more Vehicles | 80 (17.6%) | 2 (1.4%) |
| Total | 454 (100.0%) | 147 (100.0%) |
Real Estate & Mortgages in West Kittanning borough
Real Estate and Mortgage Overview in West Kittanning borough
| Characteristic | Without Mortgage | With Mortgage |
| Housing Units | 180 | 274 |
| Median Property Value | $106,700 | $147,900 |
| Median Household Income | $55,962 | $65 |
| Monthly Housing Costs | $574 | $12 |
| Real Estate Taxes | $2,404 | $0 |
Property Value by Mortgage Status in West Kittanning borough
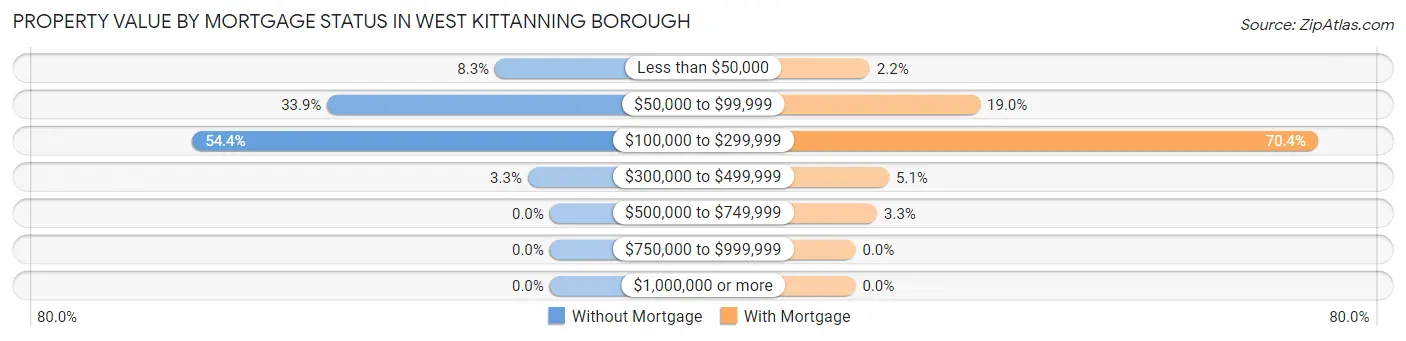
| Property Value | Without Mortgage | With Mortgage |
| Less than $50,000 | 15 (8.3%) | 6 (2.2%) |
| $50,000 to $99,999 | 61 (33.9%) | 52 (19.0%) |
| $100,000 to $299,999 | 98 (54.4%) | 193 (70.4%) |
| $300,000 to $499,999 | 6 (3.3%) | 14 (5.1%) |
| $500,000 to $749,999 | 0 (0.0%) | 9 (3.3%) |
| $750,000 to $999,999 | 0 (0.0%) | 0 (0.0%) |
| $1,000,000 or more | 0 (0.0%) | 0 (0.0%) |
| Total | 180 (100.0%) | 274 (100.0%) |
Household Income by Mortgage Status in West Kittanning borough
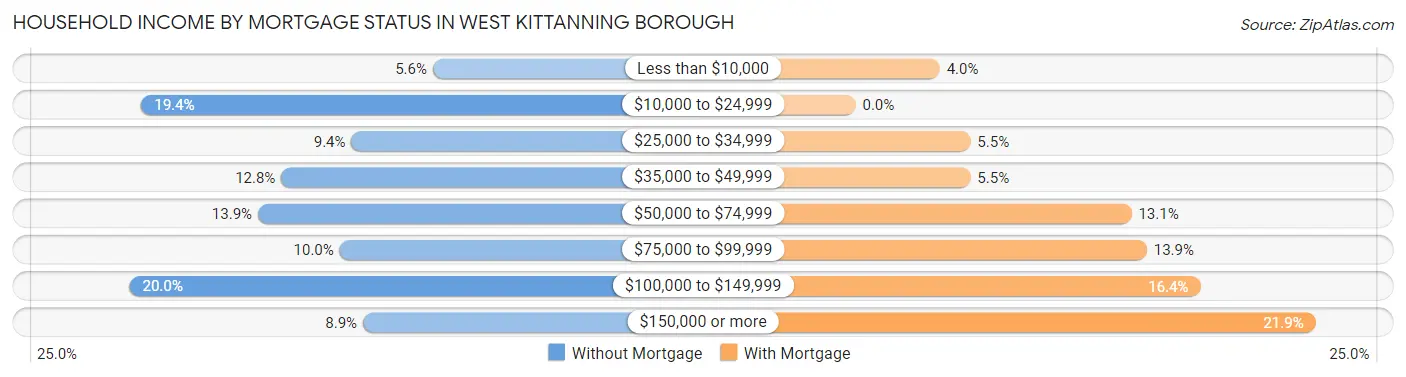
| Household Income | Without Mortgage | With Mortgage |
| Less than $10,000 | 10 (5.6%) | 11 (4.0%) |
| $10,000 to $24,999 | 35 (19.4%) | 0 (0.0%) |
| $25,000 to $34,999 | 17 (9.4%) | 15 (5.5%) |
| $35,000 to $49,999 | 23 (12.8%) | 15 (5.5%) |
| $50,000 to $74,999 | 25 (13.9%) | 36 (13.1%) |
| $75,000 to $99,999 | 18 (10.0%) | 38 (13.9%) |
| $100,000 to $149,999 | 36 (20.0%) | 45 (16.4%) |
| $150,000 or more | 16 (8.9%) | 60 (21.9%) |
| Total | 180 (100.0%) | 274 (100.0%) |
Property Value to Household Income Ratio in West Kittanning borough
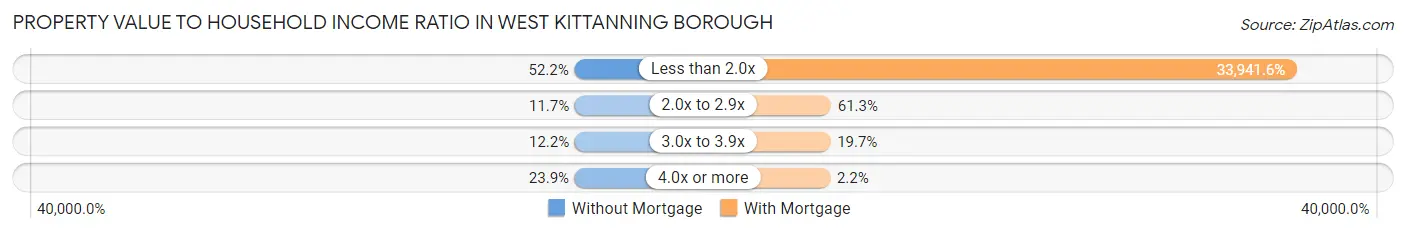
| Value-to-Income Ratio | Without Mortgage | With Mortgage |
| Less than 2.0x | 94 (52.2%) | 93,000 (33,941.6%) |
| 2.0x to 2.9x | 21 (11.7%) | 168 (61.3%) |
| 3.0x to 3.9x | 22 (12.2%) | 54 (19.7%) |
| 4.0x or more | 43 (23.9%) | 6 (2.2%) |
| Total | 180 (100.0%) | 274 (100.0%) |
Real Estate Taxes by Mortgage Status in West Kittanning borough
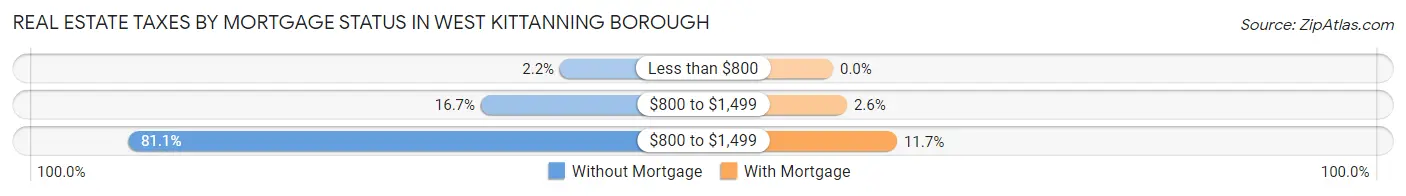
| Property Taxes | Without Mortgage | With Mortgage |
| Less than $800 | 4 (2.2%) | 0 (0.0%) |
| $800 to $1,499 | 30 (16.7%) | 7 (2.5%) |
| $800 to $1,499 | 146 (81.1%) | 32 (11.7%) |
| Total | 180 (100.0%) | 274 (100.0%) |
Health & Disability in West Kittanning borough
Health Insurance Coverage by Age in West Kittanning borough
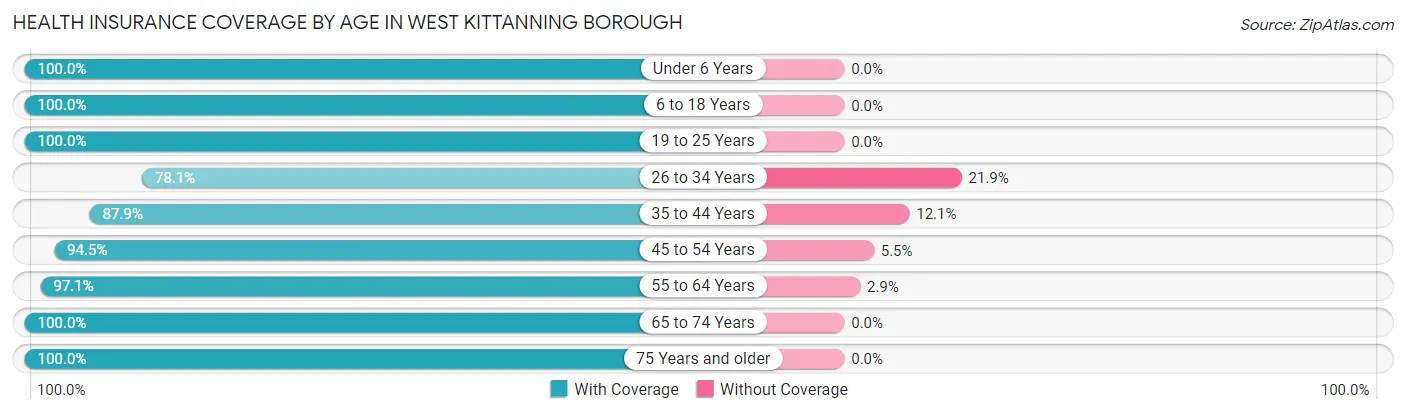
| Age Bracket | With Coverage | Without Coverage |
| Under 6 Years | 79 (100.0%) | 0 (0.0%) |
| 6 to 18 Years | 163 (100.0%) | 0 (0.0%) |
| 19 to 25 Years | 59 (100.0%) | 0 (0.0%) |
| 26 to 34 Years | 75 (78.1%) | 21 (21.9%) |
| 35 to 44 Years | 116 (87.9%) | 16 (12.1%) |
| 45 to 54 Years | 189 (94.5%) | 11 (5.5%) |
| 55 to 64 Years | 232 (97.1%) | 7 (2.9%) |
| 65 to 74 Years | 138 (100.0%) | 0 (0.0%) |
| 75 Years and older | 137 (100.0%) | 0 (0.0%) |
| Total | 1,188 (95.6%) | 55 (4.4%) |
Health Insurance Coverage by Citizenship Status in West Kittanning borough
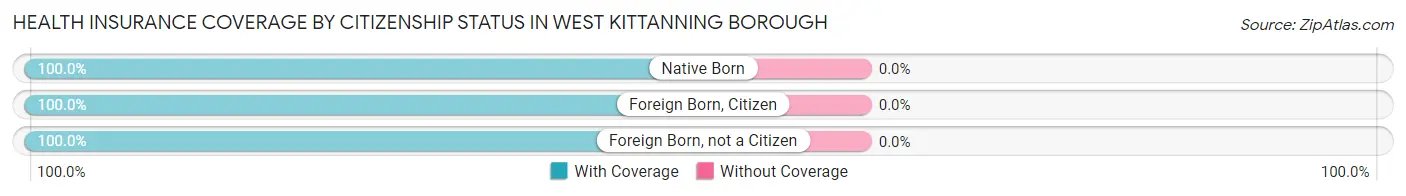
| Citizenship Status | With Coverage | Without Coverage |
| Native Born | 79 (100.0%) | 0 (0.0%) |
| Foreign Born, Citizen | 163 (100.0%) | 0 (0.0%) |
| Foreign Born, not a Citizen | 59 (100.0%) | 0 (0.0%) |
Health Insurance Coverage by Household Income in West Kittanning borough
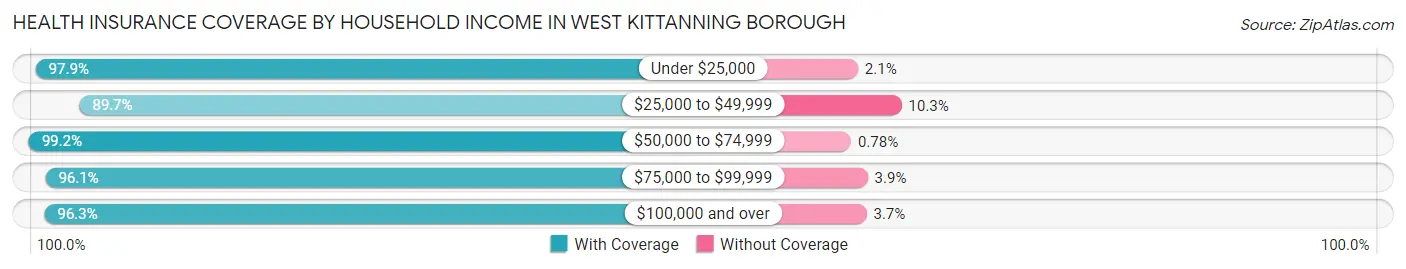
| Household Income | With Coverage | Without Coverage |
| Under $25,000 | 141 (97.9%) | 3 (2.1%) |
| $25,000 to $49,999 | 201 (89.7%) | 23 (10.3%) |
| $50,000 to $74,999 | 127 (99.2%) | 1 (0.8%) |
| $75,000 to $99,999 | 172 (96.1%) | 7 (3.9%) |
| $100,000 and over | 547 (96.3%) | 21 (3.7%) |
Public vs Private Health Insurance Coverage by Age in West Kittanning borough
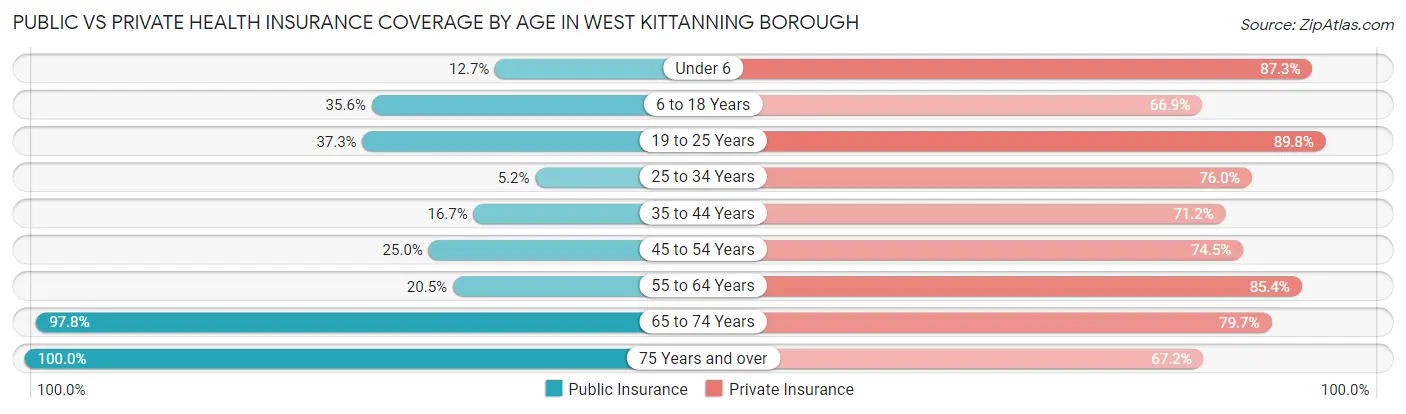
| Age Bracket | Public Insurance | Private Insurance |
| Under 6 | 10 (12.7%) | 69 (87.3%) |
| 6 to 18 Years | 58 (35.6%) | 109 (66.9%) |
| 19 to 25 Years | 22 (37.3%) | 53 (89.8%) |
| 25 to 34 Years | 5 (5.2%) | 73 (76.0%) |
| 35 to 44 Years | 22 (16.7%) | 94 (71.2%) |
| 45 to 54 Years | 50 (25.0%) | 149 (74.5%) |
| 55 to 64 Years | 49 (20.5%) | 204 (85.4%) |
| 65 to 74 Years | 135 (97.8%) | 110 (79.7%) |
| 75 Years and over | 137 (100.0%) | 92 (67.1%) |
| Total | 488 (39.3%) | 953 (76.7%) |
Disability Status by Sex by Age in West Kittanning borough
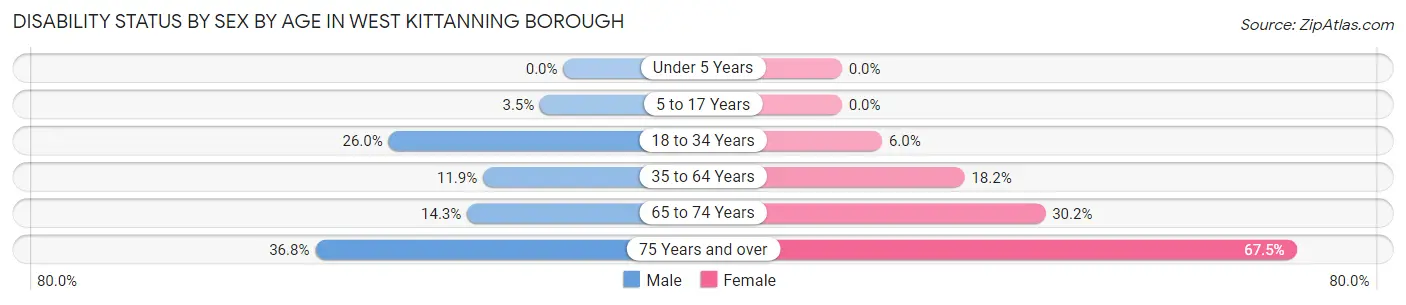
| Age Bracket | Male | Female |
| Under 5 Years | 0 (0.0%) | 0 (0.0%) |
| 5 to 17 Years | 3 (3.5%) | 0 (0.0%) |
| 18 to 34 Years | 27 (26.0%) | 4 (6.0%) |
| 35 to 64 Years | 36 (11.9%) | 49 (18.2%) |
| 65 to 74 Years | 6 (14.3%) | 29 (30.2%) |
| 75 Years and over | 21 (36.8%) | 54 (67.5%) |
Disability Class by Sex by Age in West Kittanning borough
Disability Class: Hearing Difficulty
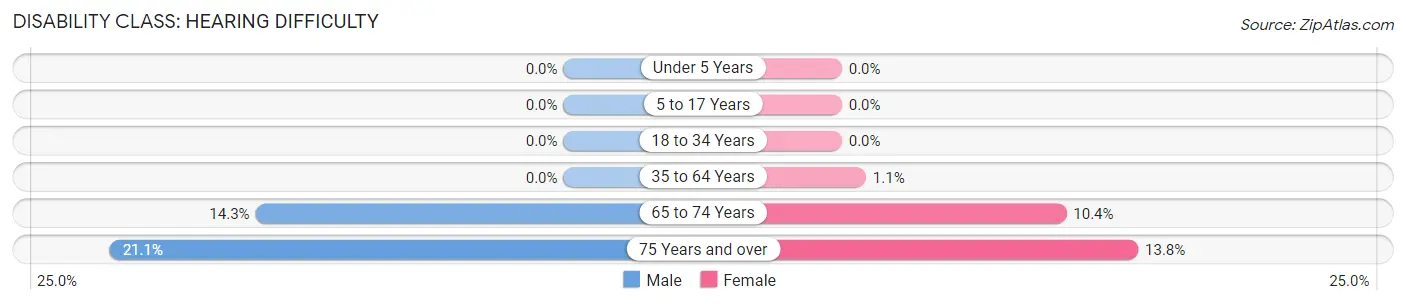
| Age Bracket | Male | Female |
| Under 5 Years | 0 (0.0%) | 0 (0.0%) |
| 5 to 17 Years | 0 (0.0%) | 0 (0.0%) |
| 18 to 34 Years | 0 (0.0%) | 0 (0.0%) |
| 35 to 64 Years | 0 (0.0%) | 3 (1.1%) |
| 65 to 74 Years | 6 (14.3%) | 10 (10.4%) |
| 75 Years and over | 12 (21.0%) | 11 (13.8%) |
Disability Class: Vision Difficulty
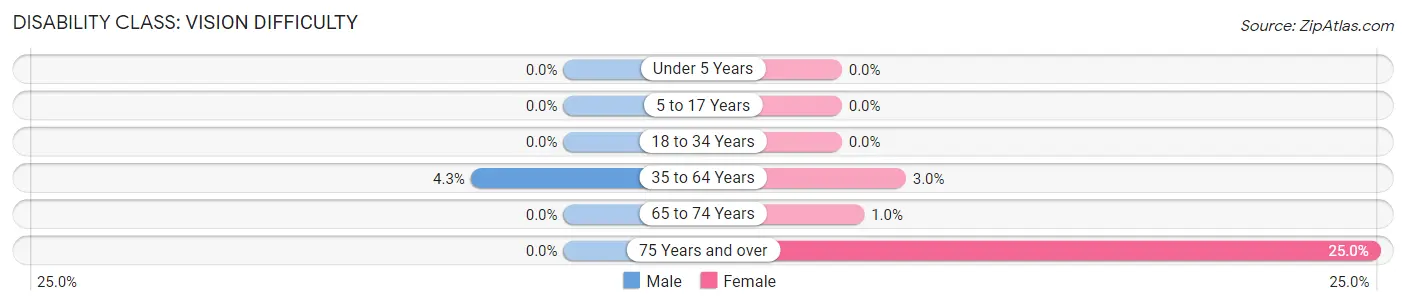
| Age Bracket | Male | Female |
| Under 5 Years | 0 (0.0%) | 0 (0.0%) |
| 5 to 17 Years | 0 (0.0%) | 0 (0.0%) |
| 18 to 34 Years | 0 (0.0%) | 0 (0.0%) |
| 35 to 64 Years | 13 (4.3%) | 8 (3.0%) |
| 65 to 74 Years | 0 (0.0%) | 1 (1.0%) |
| 75 Years and over | 0 (0.0%) | 20 (25.0%) |
Disability Class: Cognitive Difficulty
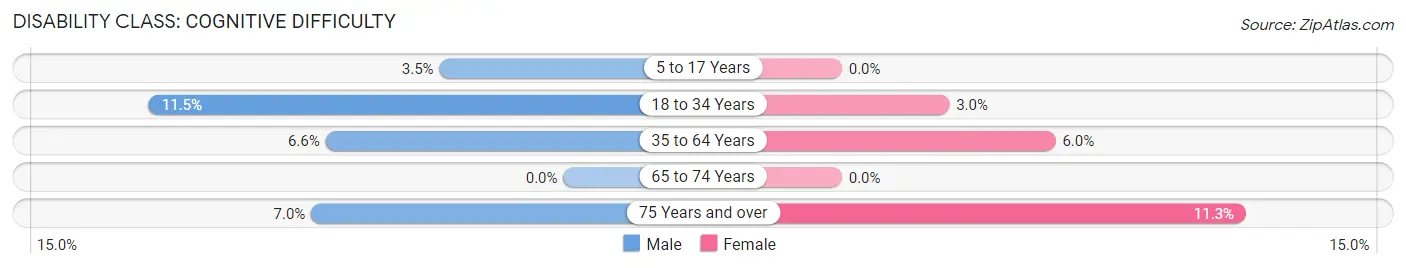
| Age Bracket | Male | Female |
| 5 to 17 Years | 3 (3.5%) | 0 (0.0%) |
| 18 to 34 Years | 12 (11.5%) | 2 (3.0%) |
| 35 to 64 Years | 20 (6.6%) | 16 (5.9%) |
| 65 to 74 Years | 0 (0.0%) | 0 (0.0%) |
| 75 Years and over | 4 (7.0%) | 9 (11.3%) |
Disability Class: Ambulatory Difficulty
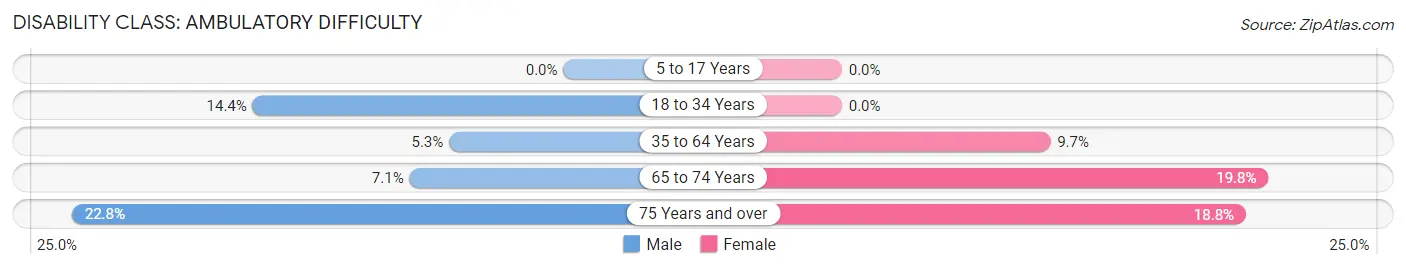
| Age Bracket | Male | Female |
| 5 to 17 Years | 0 (0.0%) | 0 (0.0%) |
| 18 to 34 Years | 15 (14.4%) | 0 (0.0%) |
| 35 to 64 Years | 16 (5.3%) | 26 (9.7%) |
| 65 to 74 Years | 3 (7.1%) | 19 (19.8%) |
| 75 Years and over | 13 (22.8%) | 15 (18.8%) |
Disability Class: Self-Care Difficulty
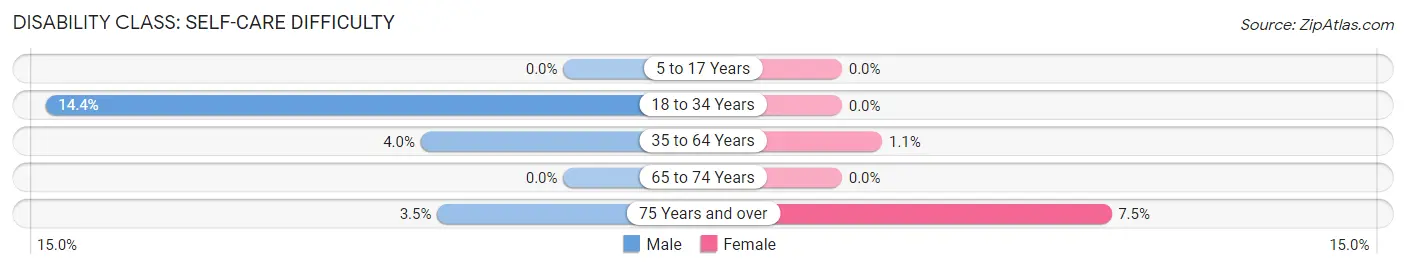
| Age Bracket | Male | Female |
| 5 to 17 Years | 0 (0.0%) | 0 (0.0%) |
| 18 to 34 Years | 15 (14.4%) | 0 (0.0%) |
| 35 to 64 Years | 12 (4.0%) | 3 (1.1%) |
| 65 to 74 Years | 0 (0.0%) | 0 (0.0%) |
| 75 Years and over | 2 (3.5%) | 6 (7.5%) |
Technology Access in West Kittanning borough
Computing Device Access in West Kittanning borough
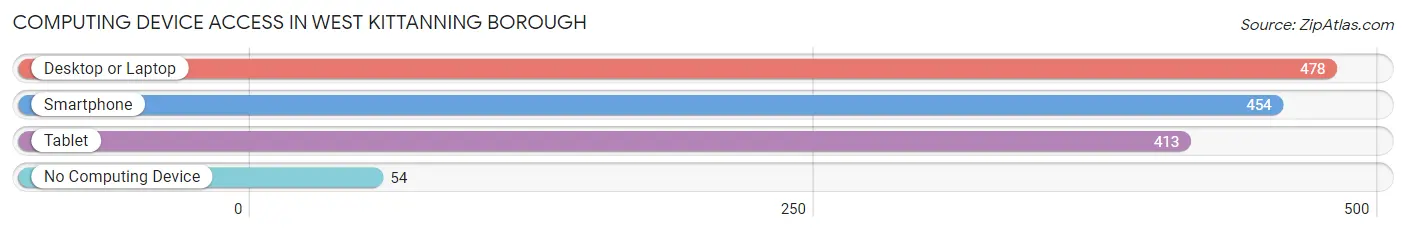
| Device Type | # Households | % Households |
| Desktop or Laptop | 478 | 79.5% |
| Smartphone | 454 | 75.5% |
| Tablet | 413 | 68.7% |
| No Computing Device | 54 | 9.0% |
| Total | 601 | 100.0% |
Internet Access in West Kittanning borough
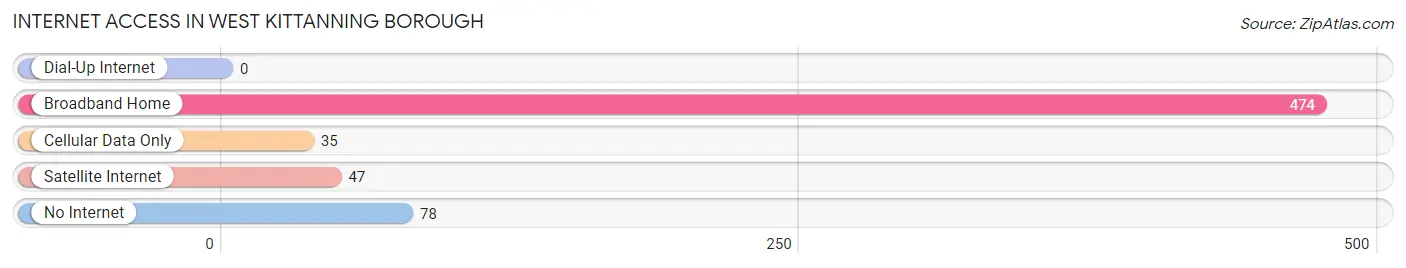
| Internet Type | # Households | % Households |
| Dial-Up Internet | 0 | 0.0% |
| Broadband Home | 474 | 78.9% |
| Cellular Data Only | 35 | 5.8% |
| Satellite Internet | 47 | 7.8% |
| No Internet | 78 | 13.0% |
| Total | 601 | 100.0% |
West Kittanning borough Summary
Kittanning Borough is a borough located in Armstrong County, Pennsylvania. It is situated along the Allegheny River, approximately 40 miles northeast of Pittsburgh. The borough was incorporated in 1851 and is the county seat of Armstrong County. The population of Kittanning Borough was 4,845 at the 2010 census.
History
Kittanning Borough was first settled in 1756 by a group of Scots-Irish immigrants led by John Armstrong. The town was named after the Native American village of Kittanning, which was located nearby. The village was destroyed by the British during the French and Indian War in 1756. The town was laid out in 1790 and incorporated as a borough in 1851.
Kittanning was an important trading center during the 19th century. It was the site of the first bridge across the Allegheny River, which was built in 1819. The bridge was destroyed during the Civil War, but was rebuilt in 1866.
Kittanning was also an important stop on the Pennsylvania Canal, which was built in the early 19th century. The canal was used to transport goods and passengers between Pittsburgh and Philadelphia. The canal was eventually replaced by the Pennsylvania Railroad in the late 19th century.
Kittanning was also the site of the first oil well in Pennsylvania. The well was drilled in 1859 and produced oil until it was abandoned in 1864.
Geography
Kittanning Borough is located at 40°51'N 79°45'W (40.851, -79.75). It is situated along the Allegheny River, approximately 40 miles northeast of Pittsburgh. The borough has a total area of 1.2 square miles, all of which is land.
The borough is located in the Allegheny Plateau region of Pennsylvania. The terrain is mostly flat, with some rolling hills. The climate is humid continental, with cold winters and hot, humid summers.
Economy
Kittanning Borough's economy is largely based on manufacturing and services. The borough is home to several manufacturing companies, including Armstrong World Industries, which produces flooring and ceiling products. Other major employers in the borough include the Armstrong County Memorial Hospital, the Armstrong County Courthouse, and the Armstrong County Jail.
Kittanning Borough also has a thriving retail sector. The borough is home to several shopping centers, including the Kittanning Mall and the Kittanning Shopping Center.
Demographics
As of the 2010 census, the population of Kittanning Borough was 4,845. The racial makeup of the borough was 97.2% White, 0.7% African American, 0.2% Native American, 0.4% Asian, 0.1% Pacific Islander, 0.3% from other races, and 1.1% from two or more races. Hispanic or Latino of any race were 1.2% of the population.
The median household income in Kittanning Borough was $37,917, and the median family income was $45,938. The per capita income was $19,945. About 11.2% of families and 14.2% of the population were below the poverty line, including 22.2% of those under age 18 and 8.2% of those age 65 or over.
Common Questions
What is Per Capita Income in West Kittanning borough?
Per Capita income in West Kittanning borough is $42,582.
What is the Median Family Income in West Kittanning borough?
Median Family Income in West Kittanning borough is $88,438.
What is the Median Household income in West Kittanning borough?
Median Household Income in West Kittanning borough is $58,125.
What is Income or Wage Gap in West Kittanning borough?
Income or Wage Gap in West Kittanning borough is 4.0%.
Women in West Kittanning borough earn 96.0 cents for every dollar earned by a man.
What is Inequality or Gini Index in West Kittanning borough?
Inequality or Gini Index in West Kittanning borough is 0.45.
What is the Total Population of West Kittanning borough?
Total Population of West Kittanning borough is 1,243.
What is the Total Male Population of West Kittanning borough?
Total Male Population of West Kittanning borough is 617.
What is the Total Female Population of West Kittanning borough?
Total Female Population of West Kittanning borough is 626.
What is the Ratio of Males per 100 Females in West Kittanning borough?
There are 98.56 Males per 100 Females in West Kittanning borough.
What is the Ratio of Females per 100 Males in West Kittanning borough?
There are 101.46 Females per 100 Males in West Kittanning borough.
What is the Median Population Age in West Kittanning borough?
Median Population Age in West Kittanning borough is 49.7 Years.
What is the Average Family Size in West Kittanning borough
Average Family Size in West Kittanning borough is 2.6 People.
What is the Average Household Size in West Kittanning borough
Average Household Size in West Kittanning borough is 2.1 People.
How Large is the Labor Force in West Kittanning borough?
There are 681 People in the Labor Forcein in West Kittanning borough.
What is the Percentage of People in the Labor Force in West Kittanning borough?
65.2% of People are in the Labor Force in West Kittanning borough.
What is the Unemployment Rate in West Kittanning borough?
Unemployment Rate in West Kittanning borough is 5.1%.