Monongahela, PA Map & Demographics
Monongahela Map
Monongahela Overview
$30,490
PER CAPITA INCOME
$71,741
AVG FAMILY INCOME
$50,000
AVG HOUSEHOLD INCOME
37.1%
WAGE / INCOME GAP [ % ]
62.9¢/ $1
WAGE / INCOME GAP [ $ ]
0.44
INEQUALITY / GINI INDEX
4,147
TOTAL POPULATION
2,019
MALE POPULATION
2,128
FEMALE POPULATION
94.88
MALES / 100 FEMALES
105.40
FEMALES / 100 MALES
42.4
MEDIAN AGE
2.9
AVG FAMILY SIZE
2.1
AVG HOUSEHOLD SIZE
2,164
LABOR FORCE [ PEOPLE ]
62.4%
PERCENT IN LABOR FORCE
7.8%
UNEMPLOYMENT RATE
Monongahela Zip Codes
Monongahela Area Codes
Income in Monongahela
Income Overview in Monongahela
Per Capita Income in Monongahela is $30,490, while median incomes of families and households are $71,741 and $50,000 respectively.
| Characteristic | Number | Measure |
| Per Capita Income | 4,147 | $30,490 |
| Median Family Income | 1,005 | $71,741 |
| Mean Family Income | 1,005 | $86,079 |
| Median Household Income | 1,932 | $50,000 |
| Mean Household Income | 1,932 | $65,758 |
| Income Deficit | 1,005 | $0 |
| Wage / Income Gap (%) | 4,147 | 37.08% |
| Wage / Income Gap ($) | 4,147 | 62.92¢ per $1 |
| Gini / Inequality Index | 4,147 | 0.44 |
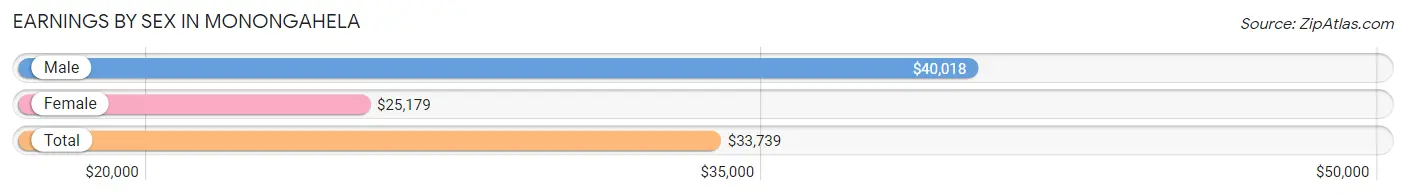
Earnings by Sex in Monongahela
Average Earnings in Monongahela are $33,739, $40,018 for men and $25,179 for women, a difference of 37.1%.
| Sex | Number | Average Earnings |
| Male | 1,057 (48.5%) | $40,018 |
| Female | 1,123 (51.5%) | $25,179 |
| Total | 2,180 (100.0%) | $33,739 |
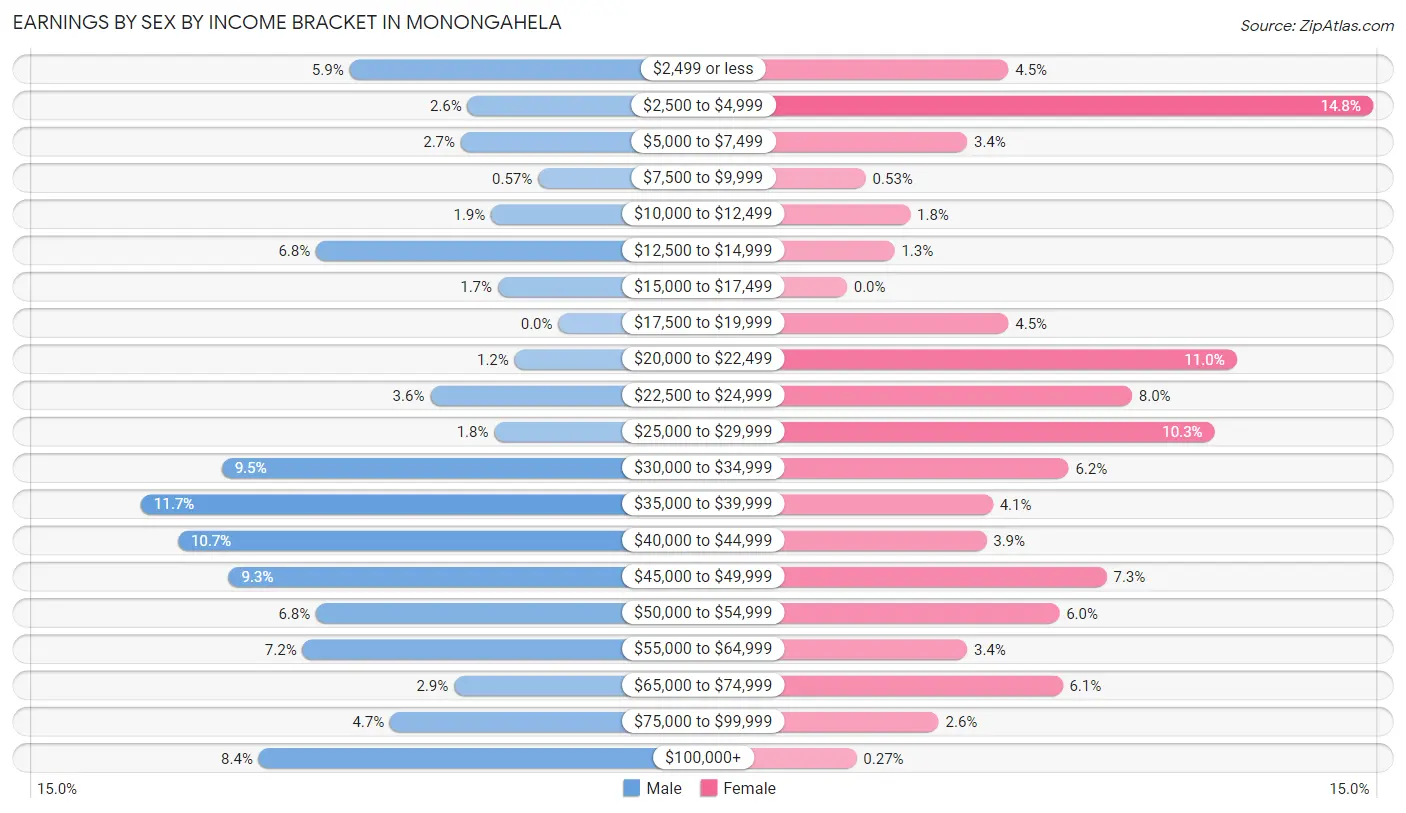
Earnings by Sex by Income Bracket in Monongahela
The most common earnings brackets in Monongahela are $35,000 to $39,999 for men (124 | 11.7%) and $2,500 to $4,999 for women (166 | 14.8%).
| Income | Male | Female |
| $2,499 or less | 62 (5.9%) | 51 (4.5%) |
| $2,500 to $4,999 | 27 (2.5%) | 166 (14.8%) |
| $5,000 to $7,499 | 29 (2.7%) | 38 (3.4%) |
| $7,500 to $9,999 | 6 (0.6%) | 6 (0.5%) |
| $10,000 to $12,499 | 20 (1.9%) | 20 (1.8%) |
| $12,500 to $14,999 | 72 (6.8%) | 15 (1.3%) |
| $15,000 to $17,499 | 18 (1.7%) | 0 (0.0%) |
| $17,500 to $19,999 | 0 (0.0%) | 51 (4.5%) |
| $20,000 to $22,499 | 13 (1.2%) | 123 (11.0%) |
| $22,500 to $24,999 | 38 (3.6%) | 90 (8.0%) |
| $25,000 to $29,999 | 19 (1.8%) | 116 (10.3%) |
| $30,000 to $34,999 | 100 (9.5%) | 70 (6.2%) |
| $35,000 to $39,999 | 124 (11.7%) | 46 (4.1%) |
| $40,000 to $44,999 | 113 (10.7%) | 44 (3.9%) |
| $45,000 to $49,999 | 98 (9.3%) | 82 (7.3%) |
| $50,000 to $54,999 | 72 (6.8%) | 67 (6.0%) |
| $55,000 to $64,999 | 76 (7.2%) | 38 (3.4%) |
| $65,000 to $74,999 | 31 (2.9%) | 68 (6.1%) |
| $75,000 to $99,999 | 50 (4.7%) | 29 (2.6%) |
| $100,000+ | 89 (8.4%) | 3 (0.3%) |
| Total | 1,057 (100.0%) | 1,123 (100.0%) |
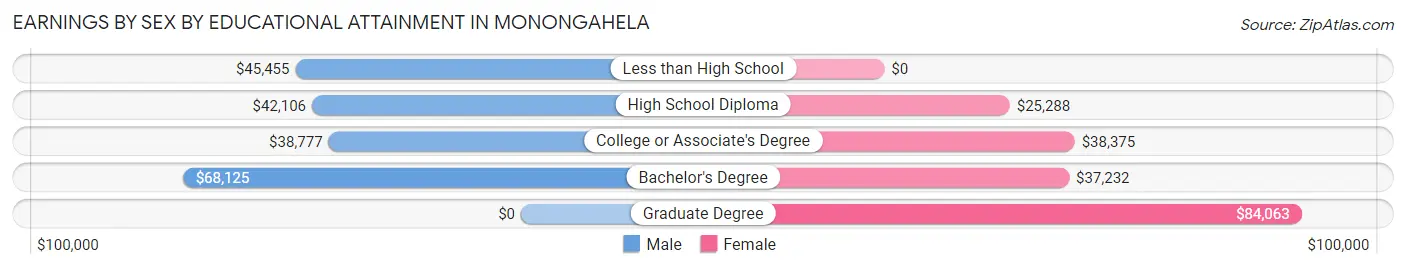
Earnings by Sex by Educational Attainment in Monongahela
Average earnings in Monongahela are $42,130 for men and $29,347 for women, a difference of 30.3%. Men with an educational attainment of bachelor's degree enjoy the highest average annual earnings of $68,125, while those with college or associate's degree education earn the least with $38,777. Women with an educational attainment of graduate degree earn the most with the average annual earnings of $84,063, while those with high school diploma education have the smallest earnings of $25,288.
| Educational Attainment | Male Income | Female Income |
| Less than High School | $45,455 | $0 |
| High School Diploma | $42,106 | $25,288 |
| College or Associate's Degree | $38,777 | $38,375 |
| Bachelor's Degree | $68,125 | $37,232 |
| Graduate Degree | - | - |
| Total | $42,130 | $29,347 |
Family Income in Monongahela
Family Income Brackets in Monongahela
According to the Monongahela family income data, there are 221 families falling into the $75,000 to $99,999 income range, which is the most common income bracket and makes up 22.0% of all families. Conversely, the $10,000 to $14,999 income bracket is the least frequent group with only 16 families (1.6%) belonging to this category.
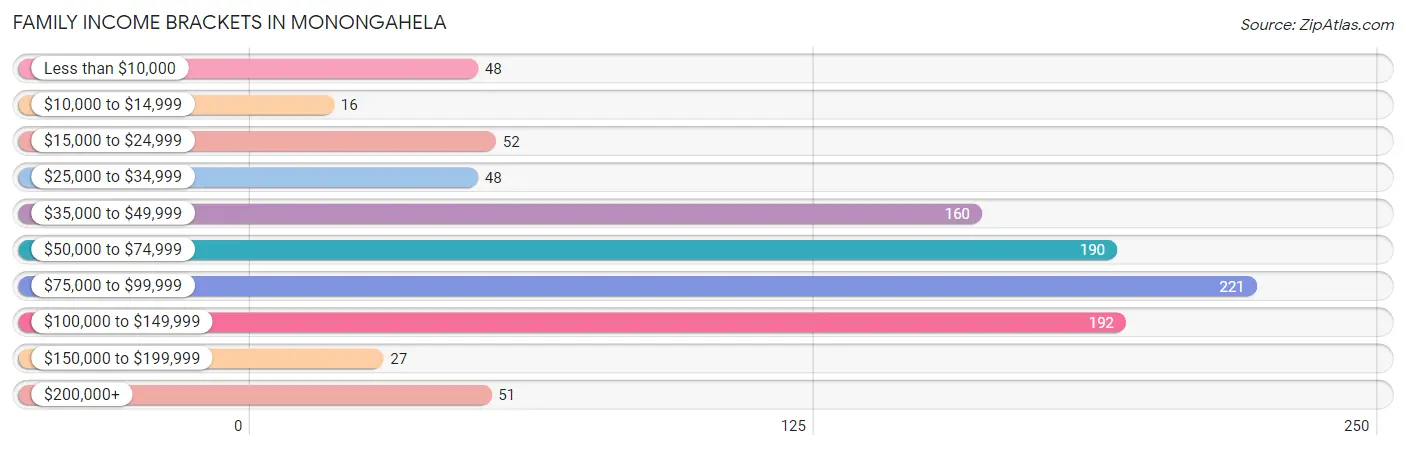
| Income Bracket | # Families | % Families |
| Less than $10,000 | 48 | 4.8% |
| $10,000 to $14,999 | 16 | 1.6% |
| $15,000 to $24,999 | 52 | 5.2% |
| $25,000 to $34,999 | 48 | 4.8% |
| $35,000 to $49,999 | 160 | 15.9% |
| $50,000 to $74,999 | 190 | 18.9% |
| $75,000 to $99,999 | 221 | 22.0% |
| $100,000 to $149,999 | 192 | 19.1% |
| $150,000 to $199,999 | 27 | 2.7% |
| $200,000+ | 51 | 5.1% |
Family Income by Famaliy Size in Monongahela
2-person families (466 | 46.4%) account for the highest median family income in Monongahela with $83,750 per family, while 2-person families (466 | 46.4%) have the highest median income of $41,875 per family member.
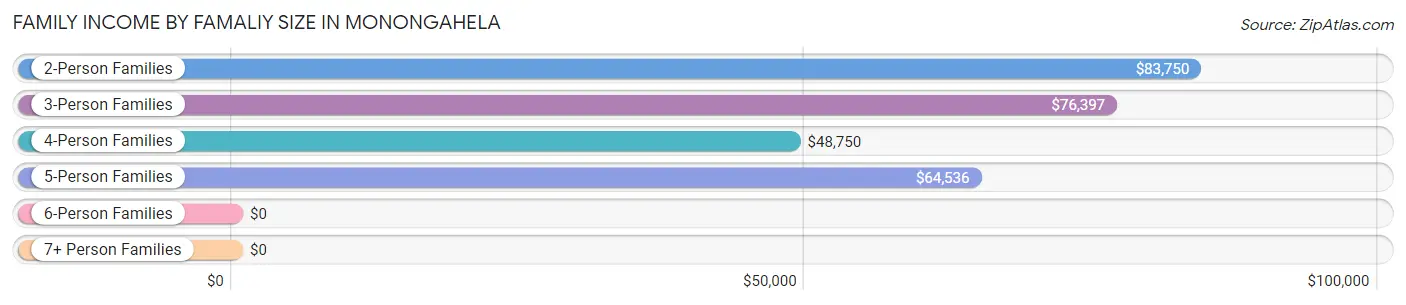
| Income Bracket | # Families | Median Income |
| 2-Person Families | 466 (46.4%) | $83,750 |
| 3-Person Families | 271 (27.0%) | $76,397 |
| 4-Person Families | 178 (17.7%) | $48,750 |
| 5-Person Families | 79 (7.9%) | $64,536 |
| 6-Person Families | 11 (1.1%) | $0 |
| 7+ Person Families | 0 (0.0%) | $0 |
| Total | 1,005 (100.0%) | $71,741 |
Family Income by Number of Earners in Monongahela
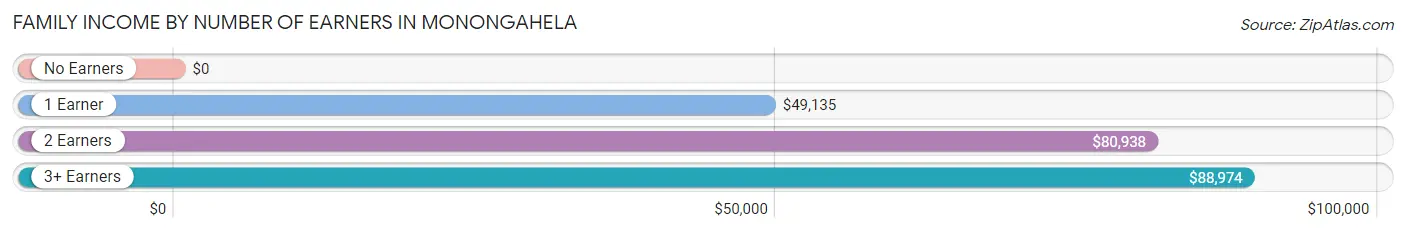
| Number of Earners | # Families | Median Income |
| No Earners | 123 (12.2%) | $0 |
| 1 Earner | 346 (34.4%) | $49,135 |
| 2 Earners | 440 (43.8%) | $80,938 |
| 3+ Earners | 96 (9.6%) | $88,974 |
| Total | 1,005 (100.0%) | $71,741 |
Household Income in Monongahela
Household Income Brackets in Monongahela
With 338 households falling in the category, the $75,000 to $99,999 income range is the most frequent in Monongahela, accounting for 17.5% of all households. In contrast, only 41 households (2.1%) fall into the $150,000 to $199,999 income bracket, making it the least populous group.
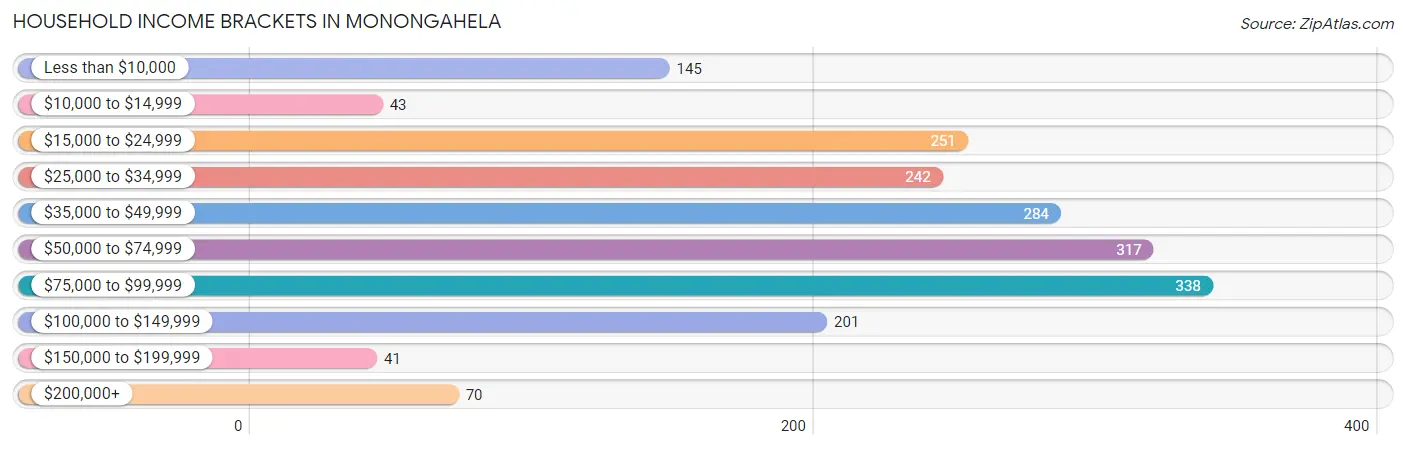
| Income Bracket | # Households | % Households |
| Less than $10,000 | 145 | 7.5% |
| $10,000 to $14,999 | 43 | 2.2% |
| $15,000 to $24,999 | 251 | 13.0% |
| $25,000 to $34,999 | 242 | 12.5% |
| $35,000 to $49,999 | 284 | 14.7% |
| $50,000 to $74,999 | 317 | 16.4% |
| $75,000 to $99,999 | 338 | 17.5% |
| $100,000 to $149,999 | 201 | 10.4% |
| $150,000 to $199,999 | 41 | 2.1% |
| $200,000+ | 70 | 3.6% |
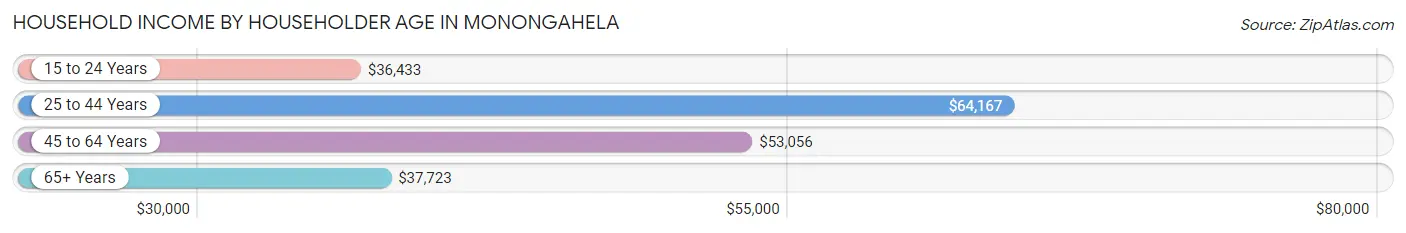
Household Income by Householder Age in Monongahela
The median household income in Monongahela is $50,000, with the highest median household income of $64,167 found in the 25 to 44 years age bracket for the primary householder. A total of 530 households (27.4%) fall into this category. Meanwhile, the 15 to 24 years age bracket for the primary householder has the lowest median household income of $36,433, with 135 households (7.0%) in this group.
| Income Bracket | # Households | Median Income |
| 15 to 24 Years | 135 (7.0%) | $36,433 |
| 25 to 44 Years | 530 (27.4%) | $64,167 |
| 45 to 64 Years | 652 (33.8%) | $53,056 |
| 65+ Years | 615 (31.8%) | $37,723 |
| Total | 1,932 (100.0%) | $50,000 |
Poverty in Monongahela
Income Below Poverty by Sex and Age in Monongahela
With 9.7% poverty level for males and 20.8% for females among the residents of Monongahela, 5 year old males and 12 to 14 year old females are the most vulnerable to poverty, with 21 males (72.4%) and 33 females (45.2%) in their respective age groups living below the poverty level.
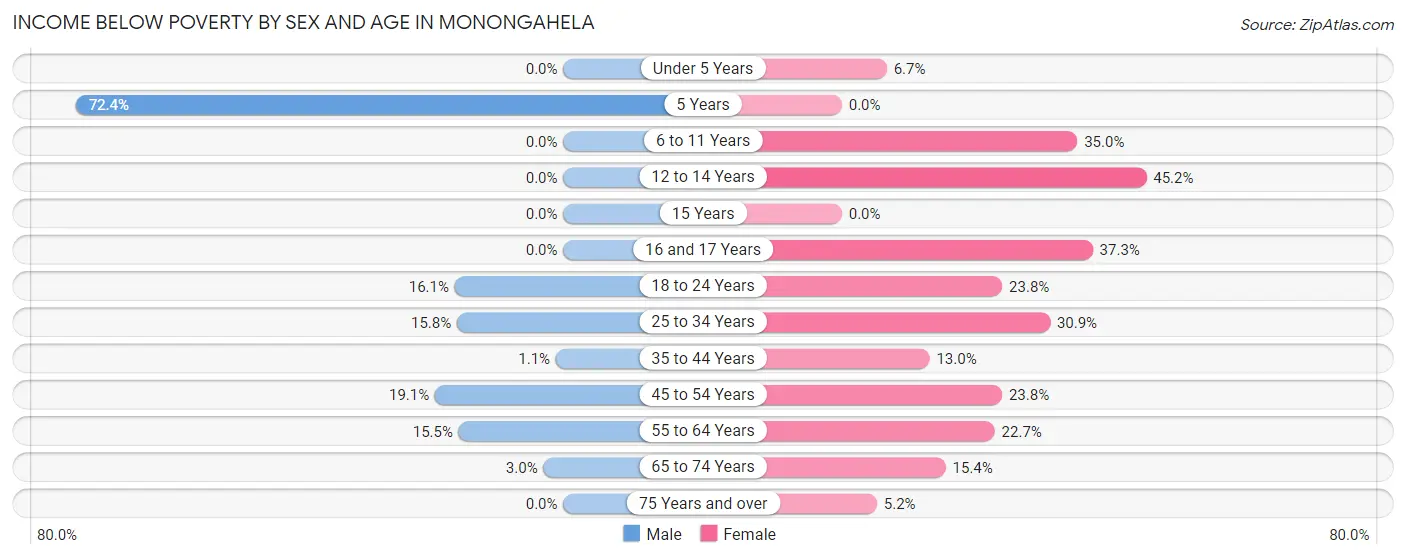
| Age Bracket | Male | Female |
| Under 5 Years | 0 (0.0%) | 3 (6.7%) |
| 5 Years | 21 (72.4%) | 0 (0.0%) |
| 6 to 11 Years | 0 (0.0%) | 43 (35.0%) |
| 12 to 14 Years | 0 (0.0%) | 33 (45.2%) |
| 15 Years | 0 (0.0%) | 0 (0.0%) |
| 16 and 17 Years | 0 (0.0%) | 19 (37.2%) |
| 18 to 24 Years | 39 (16.1%) | 60 (23.8%) |
| 25 to 34 Years | 39 (15.8%) | 51 (30.9%) |
| 35 to 44 Years | 2 (1.1%) | 50 (13.0%) |
| 45 to 54 Years | 56 (19.1%) | 54 (23.8%) |
| 55 to 64 Years | 32 (15.5%) | 79 (22.7%) |
| 65 to 74 Years | 7 (2.9%) | 37 (15.4%) |
| 75 Years and over | 0 (0.0%) | 11 (5.2%) |
| Total | 196 (9.7%) | 440 (20.8%) |
Income Above Poverty by Sex and Age in Monongahela
According to the poverty statistics in Monongahela, males aged under 5 years and females aged 75 years and over are the age groups that are most secure financially, with 100.0% of males and 94.8% of females in these age groups living above the poverty line.
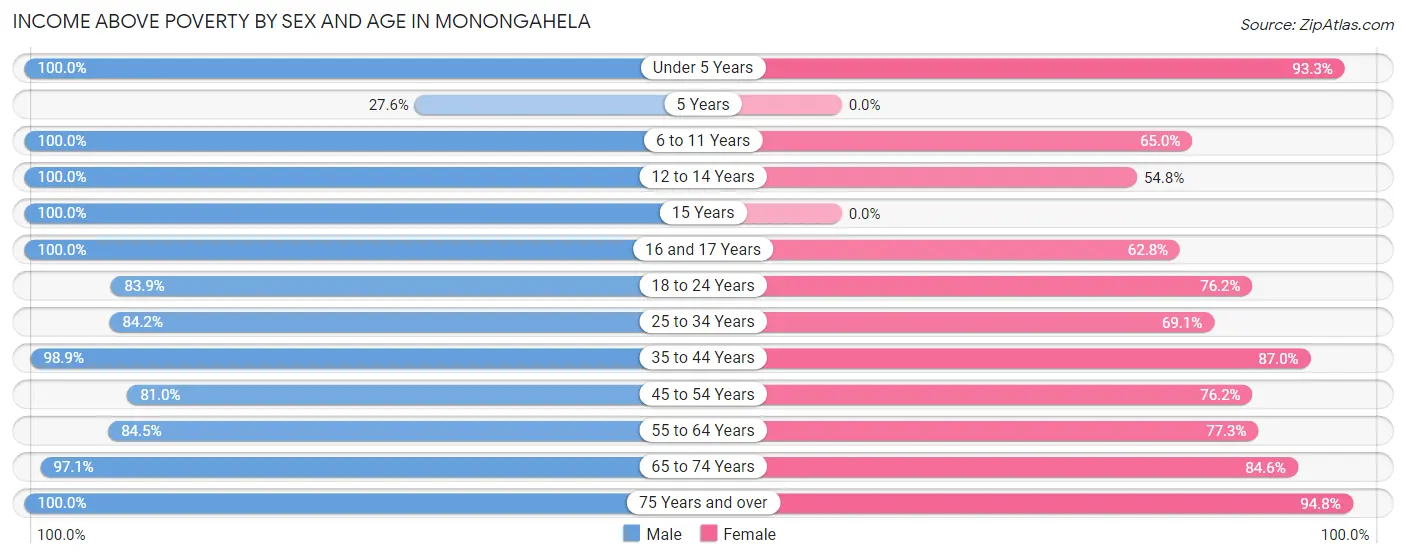
| Age Bracket | Male | Female |
| Under 5 Years | 153 (100.0%) | 42 (93.3%) |
| 5 Years | 8 (27.6%) | 0 (0.0%) |
| 6 to 11 Years | 126 (100.0%) | 80 (65.0%) |
| 12 to 14 Years | 99 (100.0%) | 40 (54.8%) |
| 15 Years | 23 (100.0%) | 0 (0.0%) |
| 16 and 17 Years | 67 (100.0%) | 32 (62.7%) |
| 18 to 24 Years | 203 (83.9%) | 192 (76.2%) |
| 25 to 34 Years | 208 (84.2%) | 114 (69.1%) |
| 35 to 44 Years | 180 (98.9%) | 334 (87.0%) |
| 45 to 54 Years | 238 (80.9%) | 173 (76.2%) |
| 55 to 64 Years | 174 (84.5%) | 269 (77.3%) |
| 65 to 74 Years | 230 (97.1%) | 203 (84.6%) |
| 75 Years and over | 114 (100.0%) | 200 (94.8%) |
| Total | 1,823 (90.3%) | 1,679 (79.2%) |
Income Below Poverty Among Married-Couple Families in Monongahela
The poverty statistics for married-couple families in Monongahela show that 0.4% or 3 of the total 736 families live below the poverty line. Families with 1 or 2 children have the highest poverty rate of 1.8%, comprising of 3 families. On the other hand, families with no children have the lowest poverty rate of 0.0%, which includes 0 families.
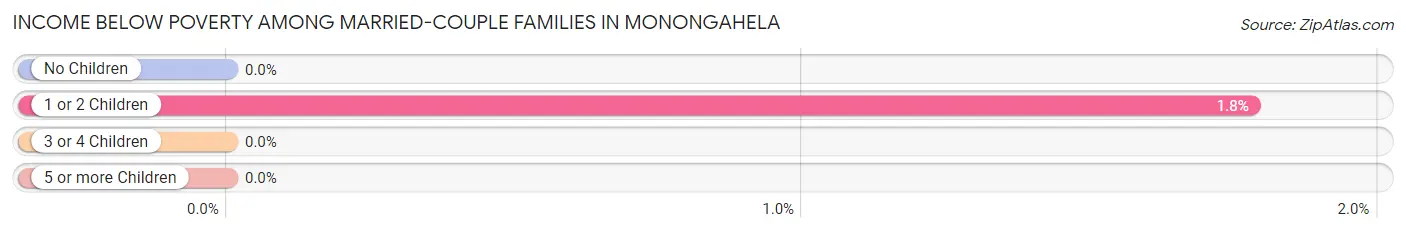
| Children | Above Poverty | Below Poverty |
| No Children | 485 (100.0%) | 0 (0.0%) |
| 1 or 2 Children | 166 (98.2%) | 3 (1.8%) |
| 3 or 4 Children | 82 (100.0%) | 0 (0.0%) |
| 5 or more Children | 0 (0.0%) | 0 (0.0%) |
| Total | 733 (99.6%) | 3 (0.4%) |
Income Below Poverty Among Single-Parent Households in Monongahela
According to the poverty data in Monongahela, 43.8% or 28 single-father households and 41.5% or 85 single-mother households are living below the poverty line. Among single-father households, those with 1 or 2 children have the highest poverty rate, with 16 households (61.5%) experiencing poverty. Likewise, among single-mother households, those with 1 or 2 children have the highest poverty rate, with 81 households (74.3%) falling below the poverty line.
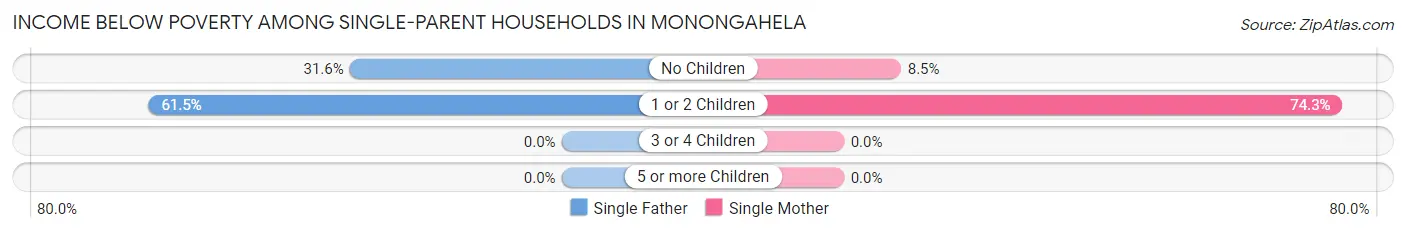
| Children | Single Father | Single Mother |
| No Children | 12 (31.6%) | 4 (8.5%) |
| 1 or 2 Children | 16 (61.5%) | 81 (74.3%) |
| 3 or 4 Children | 0 (0.0%) | 0 (0.0%) |
| 5 or more Children | 0 (0.0%) | 0 (0.0%) |
| Total | 28 (43.8%) | 85 (41.5%) |
Income Below Poverty Among Married-Couple vs Single-Parent Households in Monongahela
The poverty data for Monongahela shows that 3 of the married-couple family households (0.4%) and 113 of the single-parent households (42.0%) are living below the poverty level. Within the married-couple family households, those with 1 or 2 children have the highest poverty rate, with 3 households (1.8%) falling below the poverty line. Among the single-parent households, those with 1 or 2 children have the highest poverty rate, with 97 household (71.9%) living below poverty.
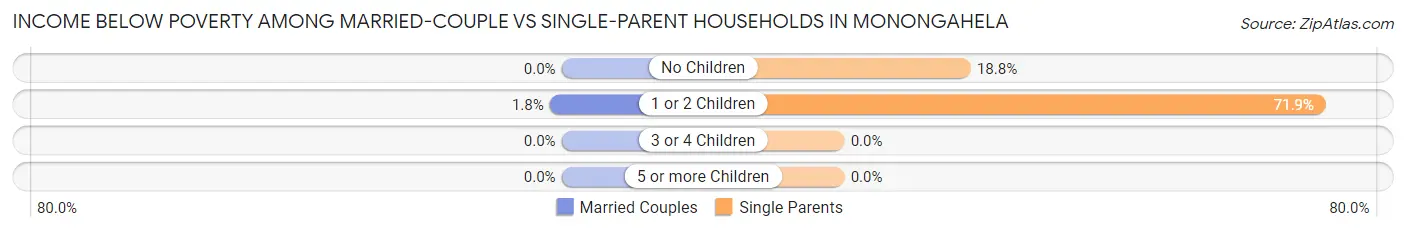
| Children | Married-Couple Families | Single-Parent Households |
| No Children | 0 (0.0%) | 16 (18.8%) |
| 1 or 2 Children | 3 (1.8%) | 97 (71.9%) |
| 3 or 4 Children | 0 (0.0%) | 0 (0.0%) |
| 5 or more Children | 0 (0.0%) | 0 (0.0%) |
| Total | 3 (0.4%) | 113 (42.0%) |
Race in Monongahela
The most populous races in Monongahela are White / Caucasian (3,872 | 93.4%), Two or more Races (175 | 4.2%), and Black / African American (85 | 2.1%).
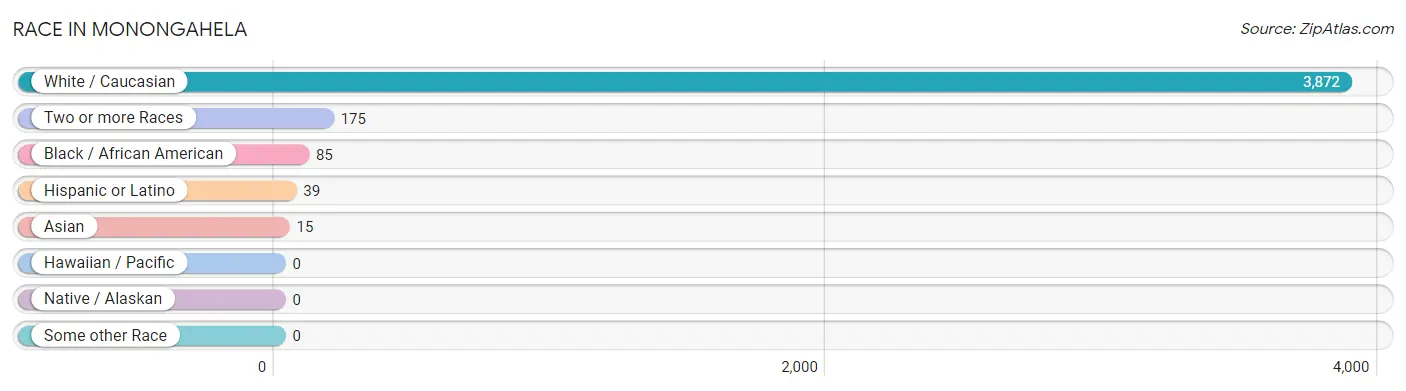
| Race | # Population | % Population |
| Asian | 15 | 0.4% |
| Black / African American | 85 | 2.1% |
| Hawaiian / Pacific | 0 | 0.0% |
| Hispanic or Latino | 39 | 0.9% |
| Native / Alaskan | 0 | 0.0% |
| White / Caucasian | 3,872 | 93.4% |
| Two or more Races | 175 | 4.2% |
| Some other Race | 0 | 0.0% |
| Total | 4,147 | 100.0% |
Ancestry in Monongahela
The most populous ancestries reported in Monongahela are German (1,108 | 26.7%), Italian (841 | 20.3%), Irish (617 | 14.9%), English (391 | 9.4%), and Polish (288 | 6.9%), together accounting for 78.3% of all Monongahela residents.
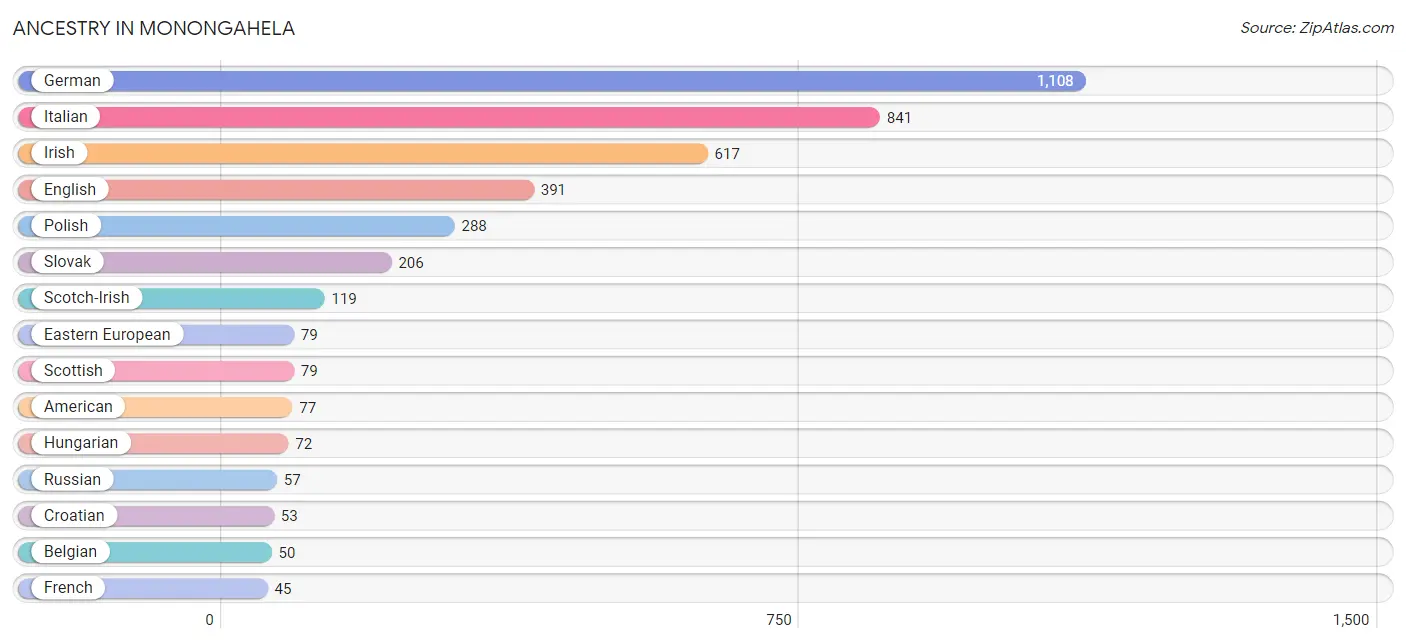
| Ancestry | # Population | % Population |
| American | 77 | 1.9% |
| Arab | 22 | 0.5% |
| Belgian | 50 | 1.2% |
| Bhutanese | 10 | 0.2% |
| British | 17 | 0.4% |
| Cherokee | 35 | 0.8% |
| Croatian | 53 | 1.3% |
| Dutch | 33 | 0.8% |
| Eastern European | 79 | 1.9% |
| English | 391 | 9.4% |
| French | 45 | 1.1% |
| French Canadian | 13 | 0.3% |
| German | 1,108 | 26.7% |
| Greek | 19 | 0.5% |
| Hungarian | 72 | 1.7% |
| Irish | 617 | 14.9% |
| Italian | 841 | 20.3% |
| Mexican | 1 | 0.0% |
| Native Hawaiian | 5 | 0.1% |
| Norwegian | 2 | 0.1% |
| Pennsylvania German | 22 | 0.5% |
| Polish | 288 | 6.9% |
| Puerto Rican | 38 | 0.9% |
| Russian | 57 | 1.4% |
| Scotch-Irish | 119 | 2.9% |
| Scottish | 79 | 1.9% |
| Serbian | 13 | 0.3% |
| Slavic | 9 | 0.2% |
| Slovak | 206 | 5.0% |
| Slovene | 22 | 0.5% |
| Swedish | 42 | 1.0% |
| Syrian | 22 | 0.5% |
| Thai | 15 | 0.4% |
| Ukrainian | 7 | 0.2% |
| Welsh | 13 | 0.3% |
| Yugoslavian | 14 | 0.3% | View All 36 Rows |
Immigrants in Monongahela
The most numerous immigrant groups reported in Monongahela came from Europe (43 | 1.0%), Eastern Europe (35 | 0.8%), Czechoslovakia (25 | 0.6%), Asia (15 | 0.4%), and India (15 | 0.4%), together accounting for 3.2% of all Monongahela residents.
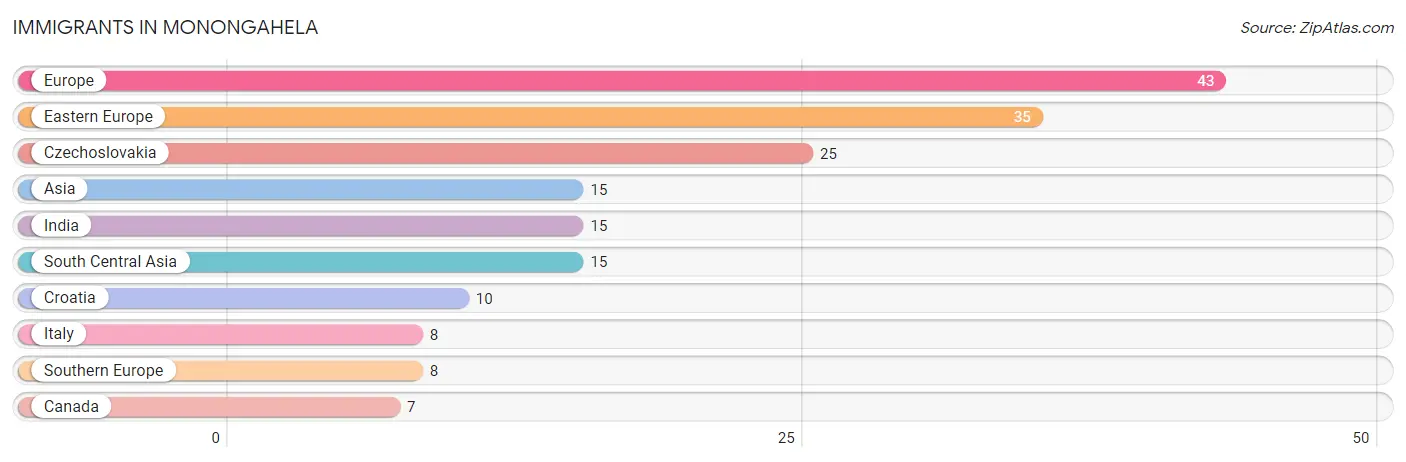
| Immigration Origin | # Population | % Population |
| Asia | 15 | 0.4% |
| Canada | 7 | 0.2% |
| Croatia | 10 | 0.2% |
| Czechoslovakia | 25 | 0.6% |
| Eastern Europe | 35 | 0.8% |
| Europe | 43 | 1.0% |
| India | 15 | 0.4% |
| Italy | 8 | 0.2% |
| South Central Asia | 15 | 0.4% |
| Southern Europe | 8 | 0.2% | View All 10 Rows |
Sex and Age in Monongahela
Sex and Age in Monongahela
The most populous age groups in Monongahela are 20 to 24 Years (233 | 11.5%) for men and 55 to 59 Years (225 | 10.6%) for women.
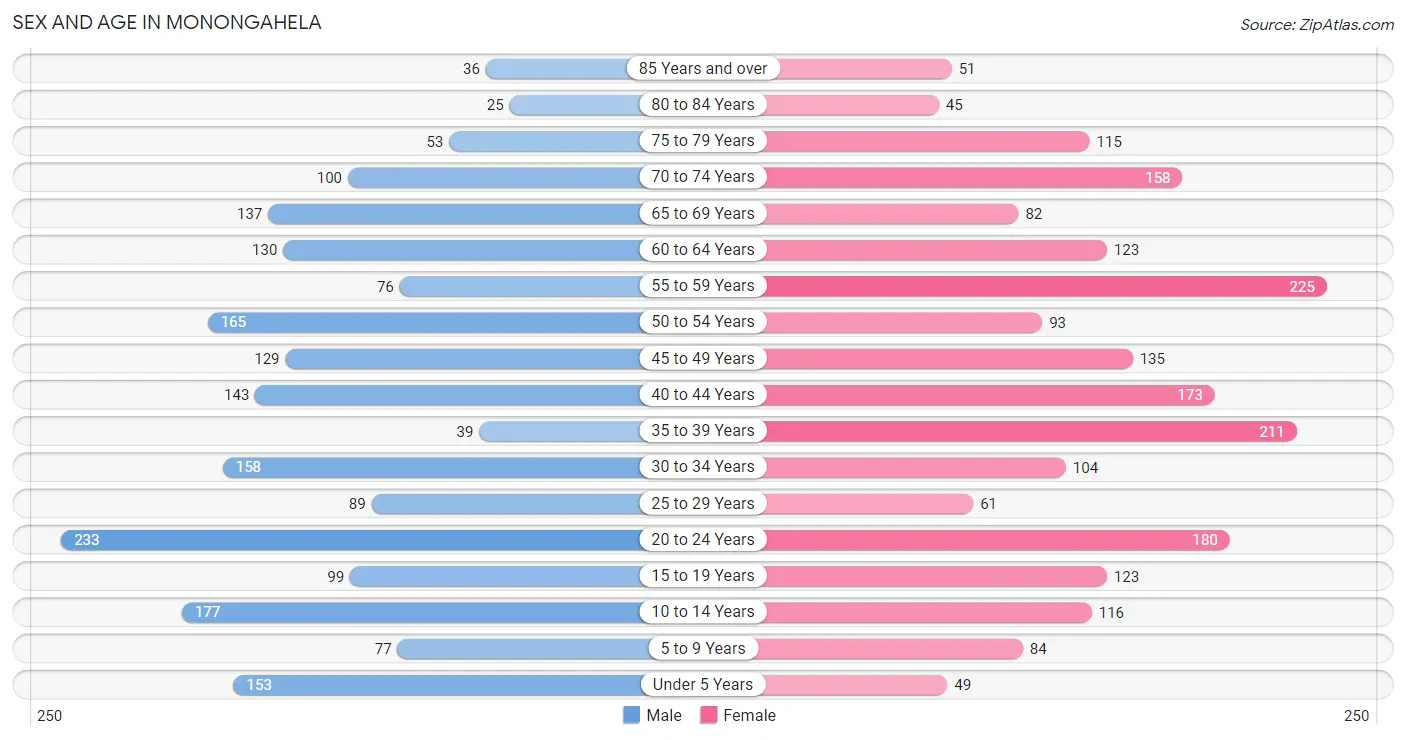
| Age Bracket | Male | Female |
| Under 5 Years | 153 (7.6%) | 49 (2.3%) |
| 5 to 9 Years | 77 (3.8%) | 84 (4.0%) |
| 10 to 14 Years | 177 (8.8%) | 116 (5.4%) |
| 15 to 19 Years | 99 (4.9%) | 123 (5.8%) |
| 20 to 24 Years | 233 (11.5%) | 180 (8.5%) |
| 25 to 29 Years | 89 (4.4%) | 61 (2.9%) |
| 30 to 34 Years | 158 (7.8%) | 104 (4.9%) |
| 35 to 39 Years | 39 (1.9%) | 211 (9.9%) |
| 40 to 44 Years | 143 (7.1%) | 173 (8.1%) |
| 45 to 49 Years | 129 (6.4%) | 135 (6.3%) |
| 50 to 54 Years | 165 (8.2%) | 93 (4.4%) |
| 55 to 59 Years | 76 (3.8%) | 225 (10.6%) |
| 60 to 64 Years | 130 (6.4%) | 123 (5.8%) |
| 65 to 69 Years | 137 (6.8%) | 82 (3.8%) |
| 70 to 74 Years | 100 (5.0%) | 158 (7.4%) |
| 75 to 79 Years | 53 (2.6%) | 115 (5.4%) |
| 80 to 84 Years | 25 (1.2%) | 45 (2.1%) |
| 85 Years and over | 36 (1.8%) | 51 (2.4%) |
| Total | 2,019 (100.0%) | 2,128 (100.0%) |
Families and Households in Monongahela
Median Family Size in Monongahela
The median family size in Monongahela is 2.92 persons per family, with single female/mother families (205 | 20.4%) accounting for the largest median family size of 3.18 persons per family. On the other hand, single male/father families (64 | 6.4%) represent the smallest median family size with 2.20 persons per family.
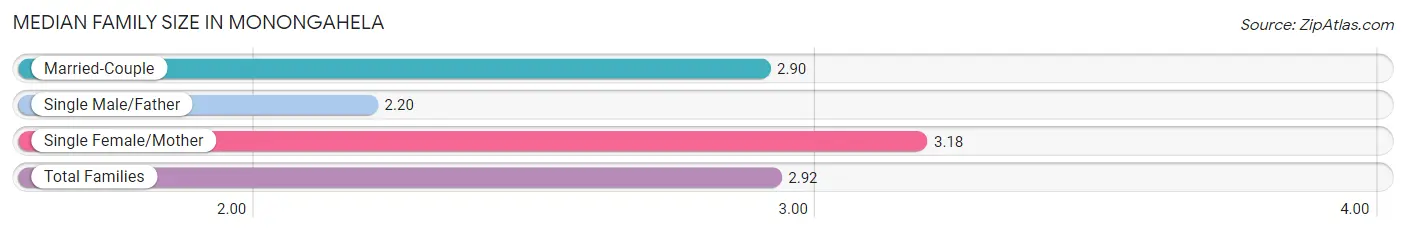
| Family Type | # Families | Family Size |
| Married-Couple | 736 (73.2%) | 2.90 |
| Single Male/Father | 64 (6.4%) | 2.20 |
| Single Female/Mother | 205 (20.4%) | 3.18 |
| Total Families | 1,005 (100.0%) | 2.92 |
Median Household Size in Monongahela
The median household size in Monongahela is 2.14 persons per household, with single female/mother households (205 | 10.6%) accounting for the largest median household size of 3.49 persons per household. non-family households (927 | 48.0%) represent the smallest median household size with 1.23 persons per household.
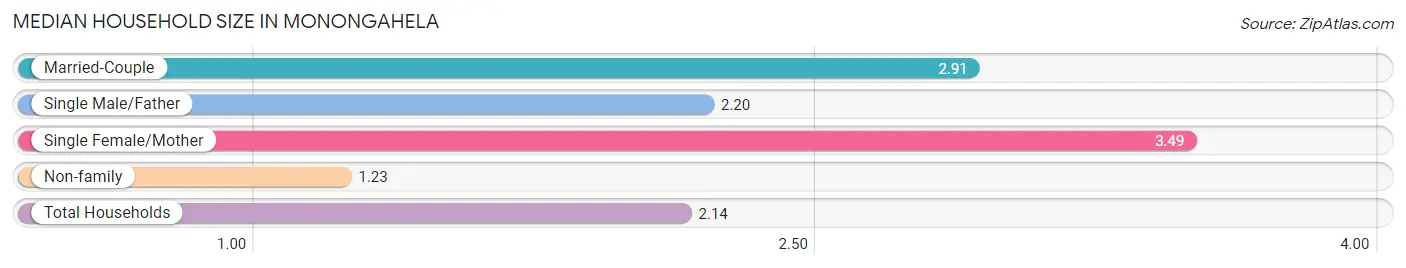
| Household Type | # Households | Household Size |
| Married-Couple | 736 (38.1%) | 2.91 |
| Single Male/Father | 64 (3.3%) | 2.20 |
| Single Female/Mother | 205 (10.6%) | 3.49 |
| Non-family | 927 (48.0%) | 1.23 |
| Total Households | 1,932 (100.0%) | 2.14 |
Household Size by Marriage Status in Monongahela
Out of a total of 1,932 households in Monongahela, 1,005 (52.0%) are family households, while 927 (48.0%) are nonfamily households. The most numerous type of family households are 2-person households, comprising 466, and the most common type of nonfamily households are 1-person households, comprising 790.
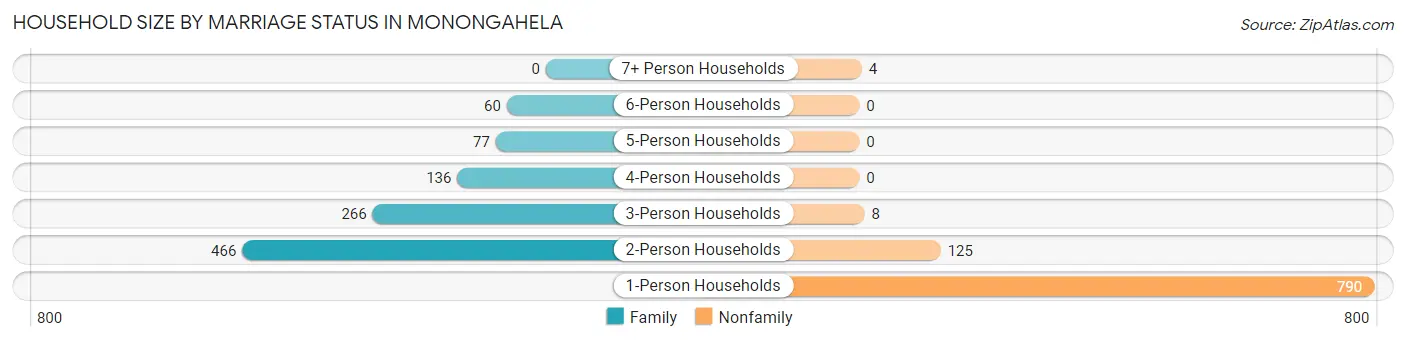
| Household Size | Family Households | Nonfamily Households |
| 1-Person Households | - | 790 (40.9%) |
| 2-Person Households | 466 (24.1%) | 125 (6.5%) |
| 3-Person Households | 266 (13.8%) | 8 (0.4%) |
| 4-Person Households | 136 (7.0%) | 0 (0.0%) |
| 5-Person Households | 77 (4.0%) | 0 (0.0%) |
| 6-Person Households | 60 (3.1%) | 0 (0.0%) |
| 7+ Person Households | 0 (0.0%) | 4 (0.2%) |
| Total | 1,005 (52.0%) | 927 (48.0%) |
Female Fertility in Monongahela
Fertility by Age in Monongahela
Average fertility rate in Monongahela is 17.0 births per 1,000 women. Women in the age bracket of 20 to 34 years have the highest fertility rate with 49.0 births per 1,000 women. Women in the age bracket of 20 to 34 years acount for 100.0% of all women with births.
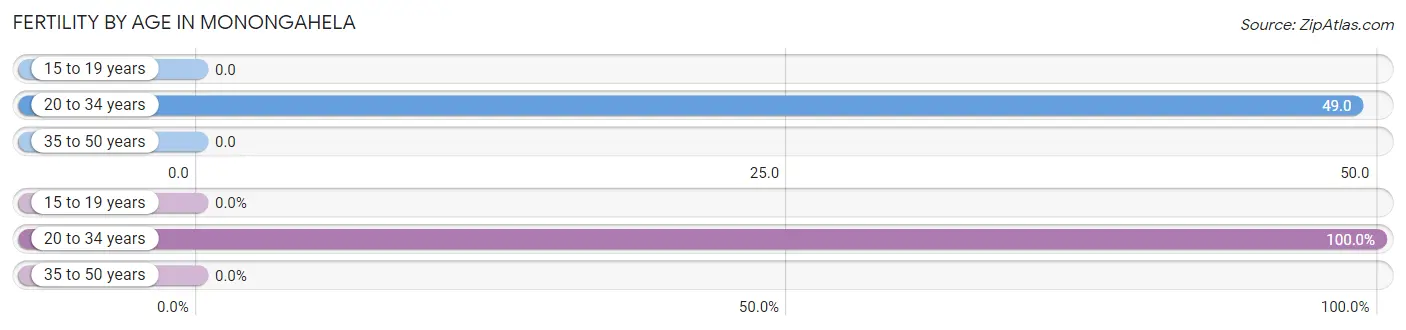
| Age Bracket | Women with Births | Births / 1,000 Women |
| 15 to 19 years | 0 (0.0%) | 0.0 |
| 20 to 34 years | 17 (100.0%) | 49.0 |
| 35 to 50 years | 0 (0.0%) | 0.0 |
| Total | 17 (100.0%) | 17.0 |
Fertility by Age by Marriage Status in Monongahela
76.5% of women with births (17) in Monongahela are married. The highest percentage of unmarried women with births falls into 20 to 34 years age bracket with 23.5% of them unmarried at the time of birth, while the lowest percentage of unmarried women with births belong to 20 to 34 years age bracket with 23.5% of them unmarried.
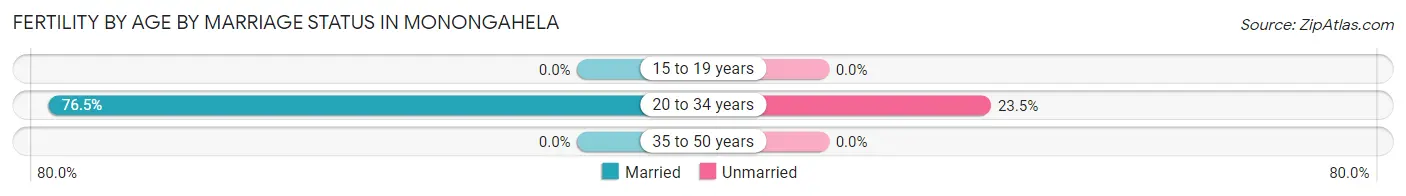
| Age Bracket | Married | Unmarried |
| 15 to 19 years | 0 (0.0%) | 0 (0.0%) |
| 20 to 34 years | 13 (76.5%) | 4 (23.5%) |
| 35 to 50 years | 0 (0.0%) | 0 (0.0%) |
| Total | 13 (76.5%) | 4 (23.5%) |
Fertility by Education in Monongahela
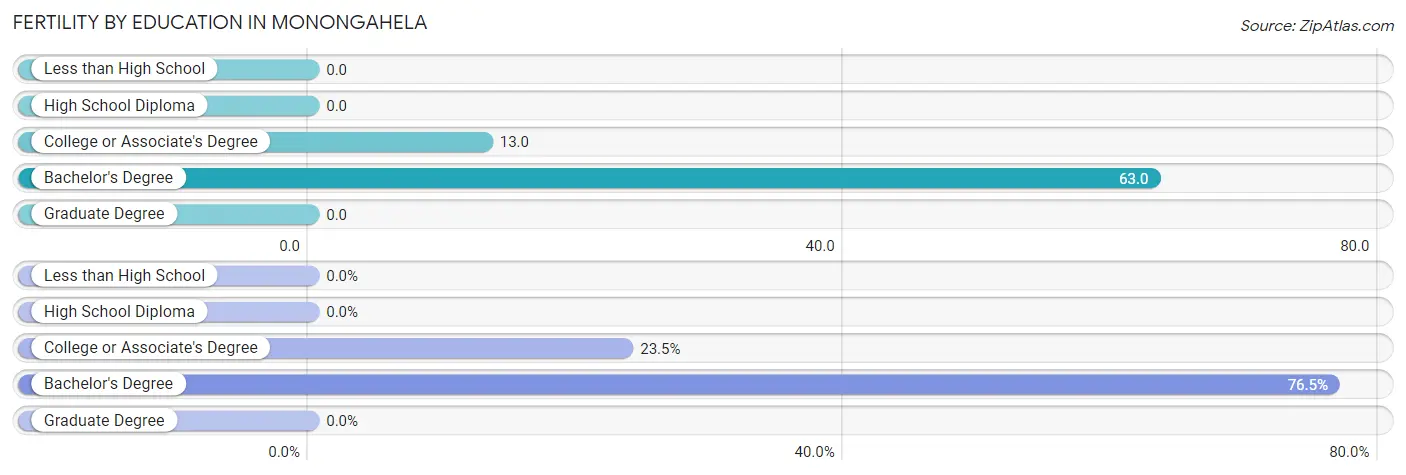
| Educational Attainment | Women with Births | Births / 1,000 Women |
| Less than High School | 0 (0.0%) | 0.0 |
| High School Diploma | 0 (0.0%) | 0.0 |
| College or Associate's Degree | 4 (23.5%) | 13.0 |
| Bachelor's Degree | 13 (76.5%) | 63.0 |
| Graduate Degree | 0 (0.0%) | 0.0 |
| Total | 17 (100.0%) | 17.0 |
Fertility by Education by Marriage Status in Monongahela
23.5% of women with births in Monongahela are unmarried. Women with the educational attainment of bachelor's degree are most likely to be married with 100.0% of them married at childbirth, while women with the educational attainment of college or associate's degree are least likely to be married with 100.0% of them unmarried at childbirth.
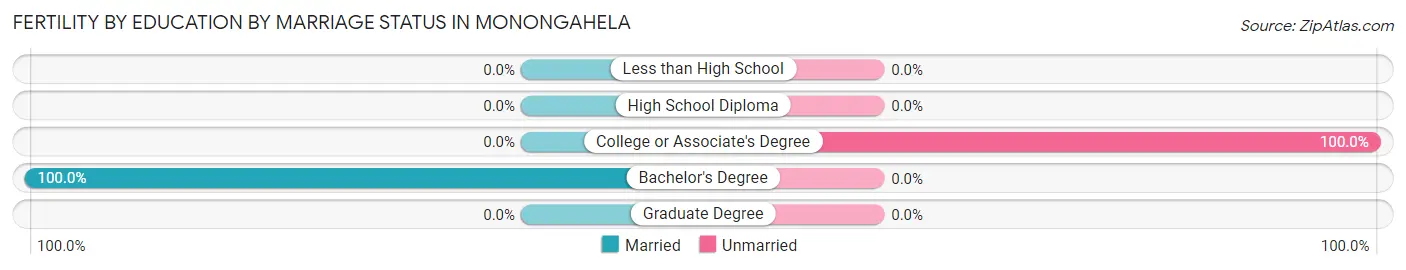
| Educational Attainment | Married | Unmarried |
| Less than High School | 0 (0.0%) | 0 (0.0%) |
| High School Diploma | 0 (0.0%) | 0 (0.0%) |
| College or Associate's Degree | 0 (0.0%) | 4 (100.0%) |
| Bachelor's Degree | 13 (100.0%) | 0 (0.0%) |
| Graduate Degree | 0 (0.0%) | 0 (0.0%) |
| Total | 13 (76.5%) | 4 (23.5%) |
Employment Characteristics in Monongahela
Employment by Class of Employer in Monongahela
Among the 1,983 employed individuals in Monongahela, private company employees (1,533 | 77.3%), not-for-profit organizations (267 | 13.5%), and local government employees (77 | 3.9%) make up the most common classes of employment.
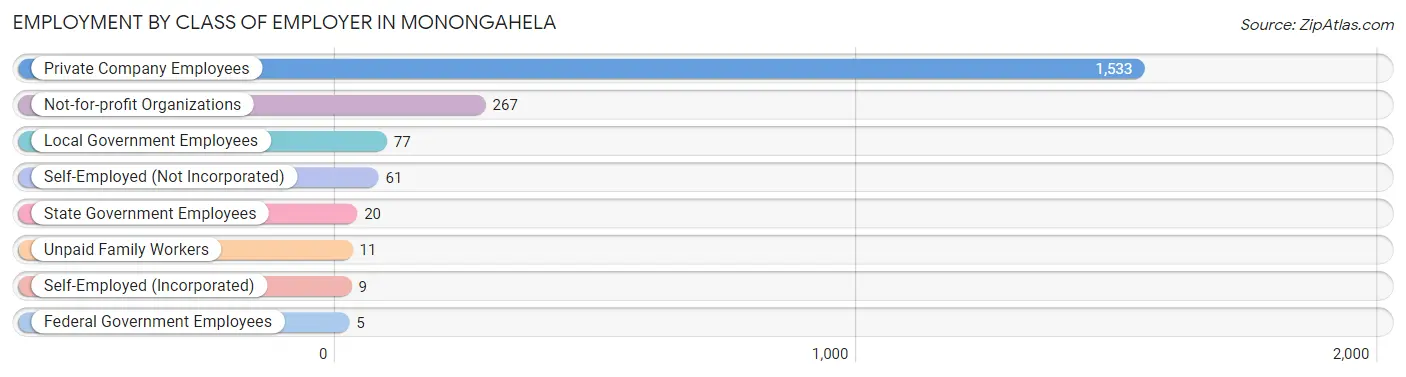
| Employer Class | # Employees | % Employees |
| Private Company Employees | 1,533 | 77.3% |
| Self-Employed (Incorporated) | 9 | 0.4% |
| Self-Employed (Not Incorporated) | 61 | 3.1% |
| Not-for-profit Organizations | 267 | 13.5% |
| Local Government Employees | 77 | 3.9% |
| State Government Employees | 20 | 1.0% |
| Federal Government Employees | 5 | 0.3% |
| Unpaid Family Workers | 11 | 0.5% |
| Total | 1,983 | 100.0% |
Employment Status by Age in Monongahela
According to the labor force statistics for Monongahela, out of the total population over 16 years of age (3,468), 62.4% or 2,164 individuals are in the labor force, with 7.8% or 169 of them unemployed. The age group with the highest labor force participation rate is 25 to 29 years, with 97.3% or 146 individuals in the labor force. Within the labor force, the 30 to 34 years age range has the highest percentage of unemployed individuals, with 20.5% or 41 of them being unemployed.
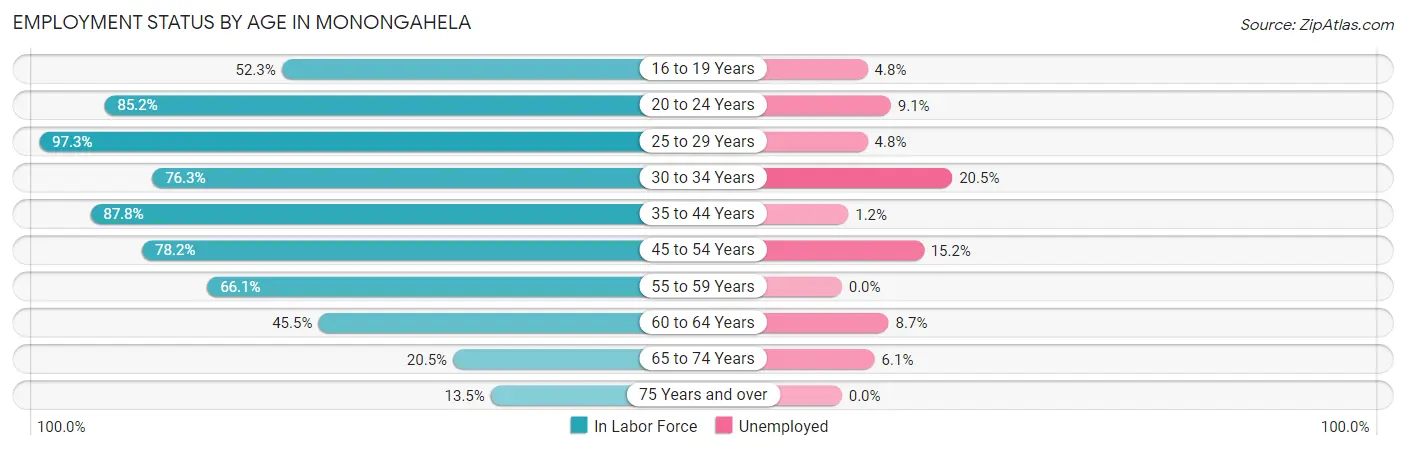
| Age Bracket | In Labor Force | Unemployed |
| 16 to 19 Years | 104 (52.3%) | 5 (4.8%) |
| 20 to 24 Years | 352 (85.2%) | 32 (9.1%) |
| 25 to 29 Years | 146 (97.3%) | 7 (4.8%) |
| 30 to 34 Years | 200 (76.3%) | 41 (20.5%) |
| 35 to 44 Years | 497 (87.8%) | 6 (1.2%) |
| 45 to 54 Years | 408 (78.2%) | 62 (15.2%) |
| 55 to 59 Years | 199 (66.1%) | 0 (0.0%) |
| 60 to 64 Years | 115 (45.5%) | 10 (8.7%) |
| 65 to 74 Years | 98 (20.5%) | 6 (6.1%) |
| 75 Years and over | 44 (13.5%) | 0 (0.0%) |
| Total | 2,164 (62.4%) | 169 (7.8%) |
Employment Status by Educational Attainment in Monongahela
According to labor force statistics for Monongahela, 76.2% of individuals (1,565) out of the total population between 25 and 64 years of age (2,054) are in the labor force, with 8.1% or 127 of them being unemployed. The group with the highest labor force participation rate are those with the educational attainment of college / associate degree, with 82.1% or 482 individuals in the labor force. Within the labor force, individuals with high school diploma education have the highest percentage of unemployment, with 12.3% or 89 of them being unemployed.
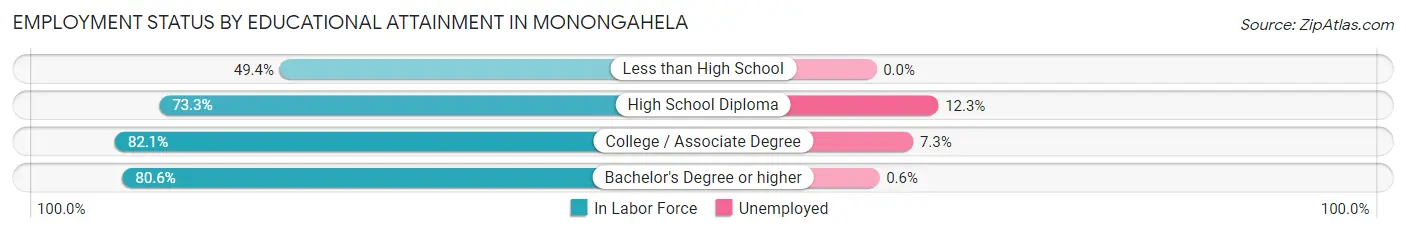
| Educational Attainment | In Labor Force | Unemployed |
| Less than High School | 42 (49.4%) | 0 (0.0%) |
| High School Diploma | 726 (73.3%) | 122 (12.3%) |
| College / Associate Degree | 482 (82.1%) | 43 (7.3%) |
| Bachelor's Degree or higher | 315 (80.6%) | 2 (0.6%) |
| Total | 1,565 (76.2%) | 166 (8.1%) |
Employment Occupations by Sex in Monongahela
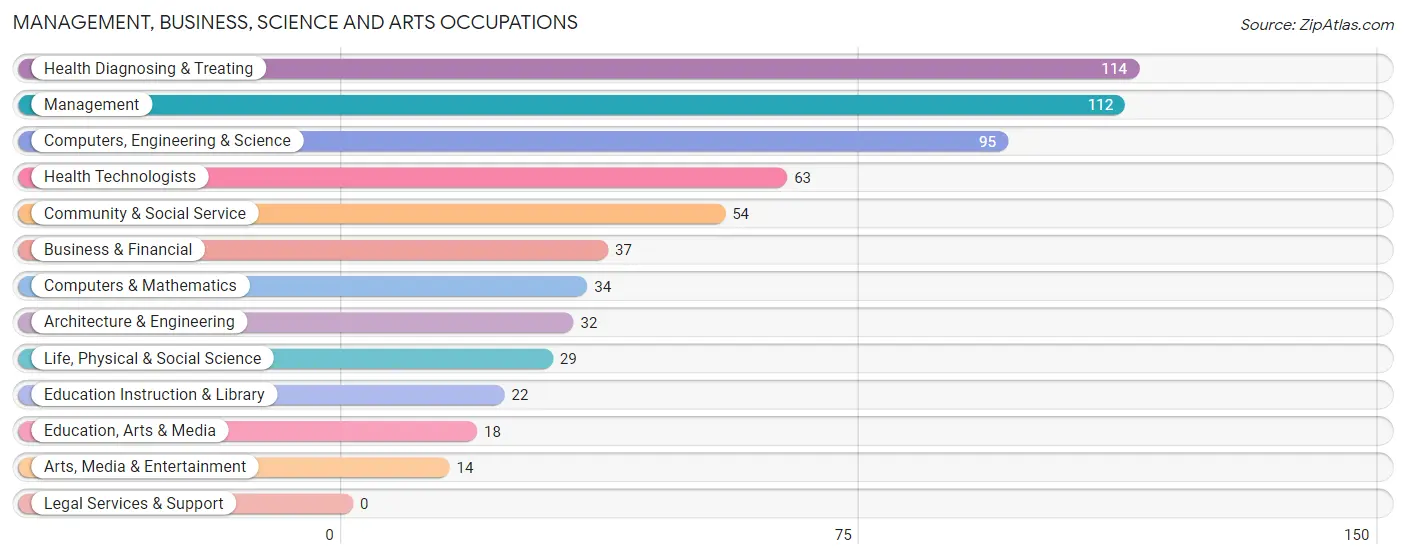
Management, Business, Science and Arts Occupations
The most common Management, Business, Science and Arts occupations in Monongahela are Health Diagnosing & Treating (114 | 5.7%), Management (112 | 5.6%), Computers, Engineering & Science (95 | 4.8%), Health Technologists (63 | 3.2%), and Community & Social Service (54 | 2.7%).
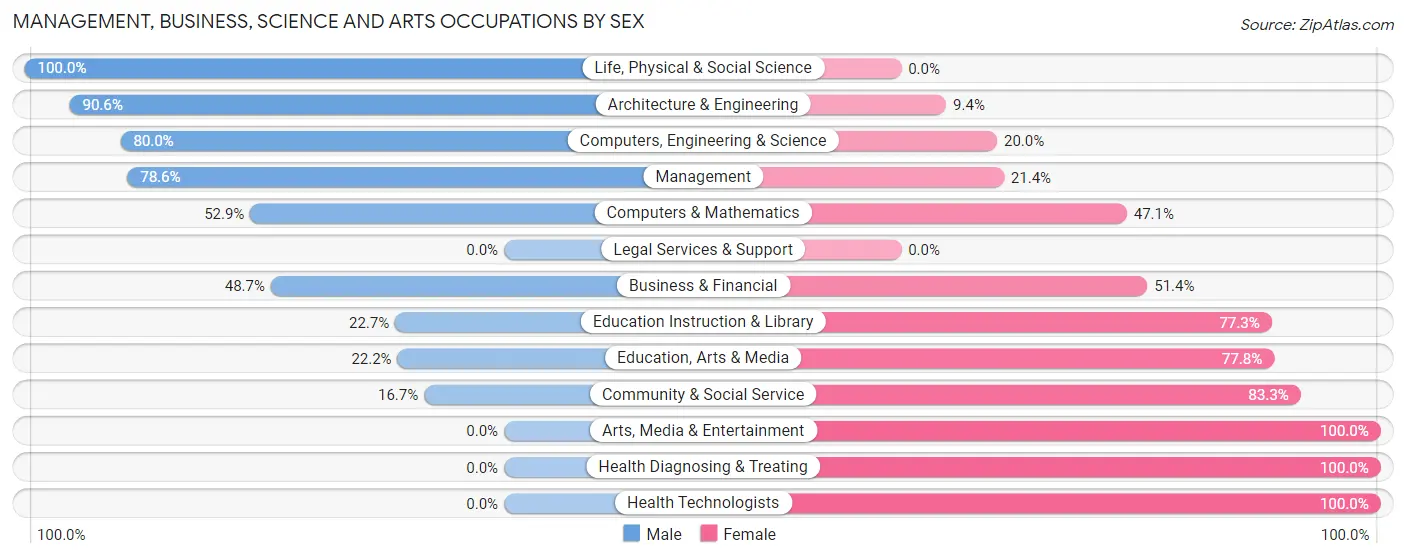
Management, Business, Science and Arts Occupations by Sex
Within the Management, Business, Science and Arts occupations in Monongahela, the most male-oriented occupations are Life, Physical & Social Science (100.0%), Architecture & Engineering (90.6%), and Computers, Engineering & Science (80.0%), while the most female-oriented occupations are Arts, Media & Entertainment (100.0%), Health Diagnosing & Treating (100.0%), and Health Technologists (100.0%).
| Occupation | Male | Female |
| Management | 88 (78.6%) | 24 (21.4%) |
| Business & Financial | 18 (48.6%) | 19 (51.3%) |
| Computers, Engineering & Science | 76 (80.0%) | 19 (20.0%) |
| Computers & Mathematics | 18 (52.9%) | 16 (47.1%) |
| Architecture & Engineering | 29 (90.6%) | 3 (9.4%) |
| Life, Physical & Social Science | 29 (100.0%) | 0 (0.0%) |
| Community & Social Service | 9 (16.7%) | 45 (83.3%) |
| Education, Arts & Media | 4 (22.2%) | 14 (77.8%) |
| Legal Services & Support | 0 (0.0%) | 0 (0.0%) |
| Education Instruction & Library | 5 (22.7%) | 17 (77.3%) |
| Arts, Media & Entertainment | 0 (0.0%) | 14 (100.0%) |
| Health Diagnosing & Treating | 0 (0.0%) | 114 (100.0%) |
| Health Technologists | 0 (0.0%) | 63 (100.0%) |
| Total (Category) | 191 (46.4%) | 221 (53.6%) |
| Total (Overall) | 963 (48.3%) | 1,031 (51.7%) |
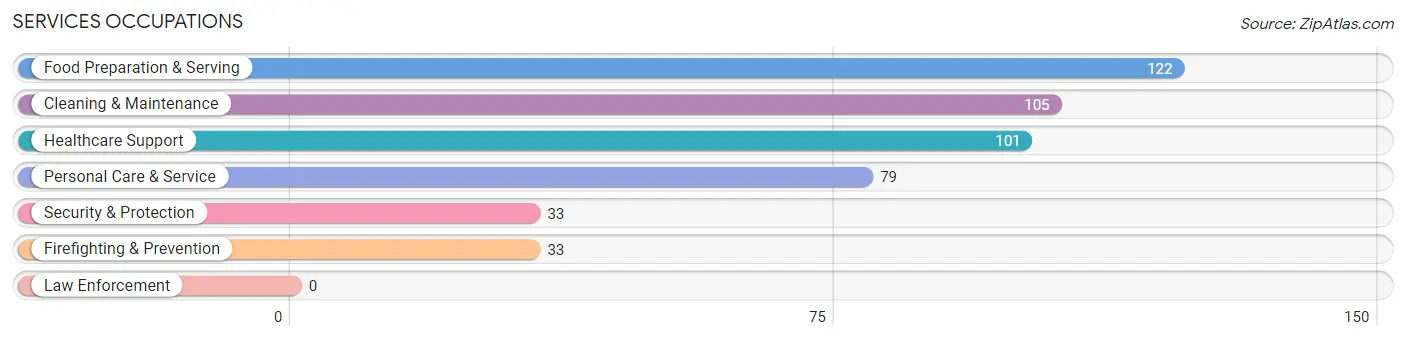
Services Occupations
The most common Services occupations in Monongahela are Food Preparation & Serving (122 | 6.1%), Cleaning & Maintenance (105 | 5.3%), Healthcare Support (101 | 5.1%), Personal Care & Service (79 | 4.0%), and Security & Protection (33 | 1.7%).
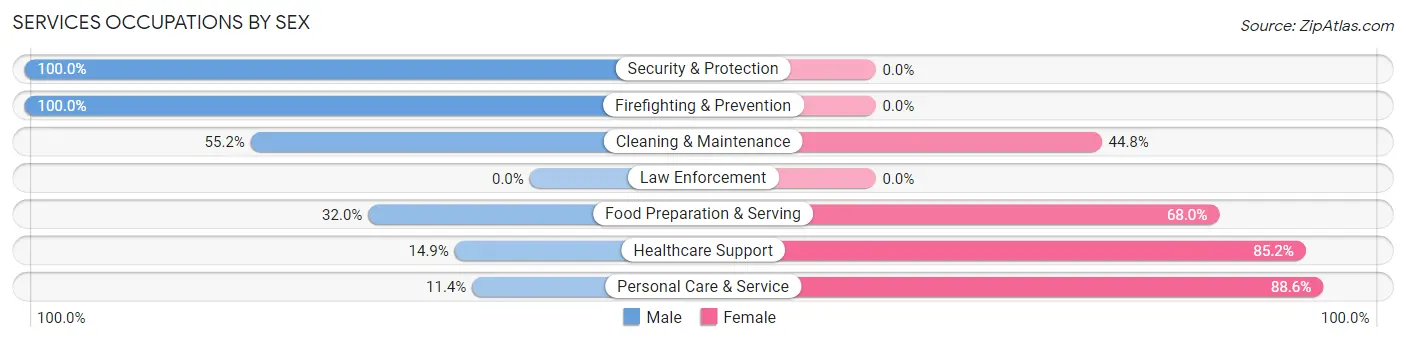
Services Occupations by Sex
Within the Services occupations in Monongahela, the most male-oriented occupations are Security & Protection (100.0%), Firefighting & Prevention (100.0%), and Cleaning & Maintenance (55.2%), while the most female-oriented occupations are Personal Care & Service (88.6%), Healthcare Support (85.2%), and Food Preparation & Serving (68.0%).
| Occupation | Male | Female |
| Healthcare Support | 15 (14.8%) | 86 (85.2%) |
| Security & Protection | 33 (100.0%) | 0 (0.0%) |
| Firefighting & Prevention | 33 (100.0%) | 0 (0.0%) |
| Law Enforcement | 0 (0.0%) | 0 (0.0%) |
| Food Preparation & Serving | 39 (32.0%) | 83 (68.0%) |
| Cleaning & Maintenance | 58 (55.2%) | 47 (44.8%) |
| Personal Care & Service | 9 (11.4%) | 70 (88.6%) |
| Total (Category) | 154 (35.0%) | 286 (65.0%) |
| Total (Overall) | 963 (48.3%) | 1,031 (51.7%) |
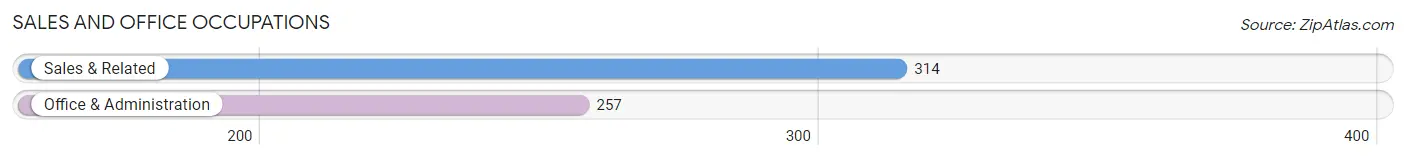
Sales and Office Occupations
The most common Sales and Office occupations in Monongahela are Sales & Related (314 | 15.8%), and Office & Administration (257 | 12.9%).
Sales and Office Occupations by Sex
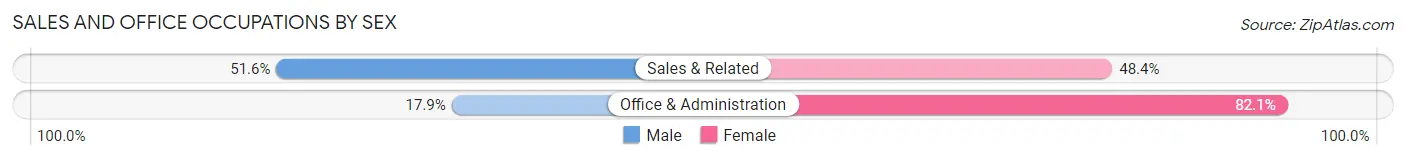
| Occupation | Male | Female |
| Sales & Related | 162 (51.6%) | 152 (48.4%) |
| Office & Administration | 46 (17.9%) | 211 (82.1%) |
| Total (Category) | 208 (36.4%) | 363 (63.6%) |
| Total (Overall) | 963 (48.3%) | 1,031 (51.7%) |
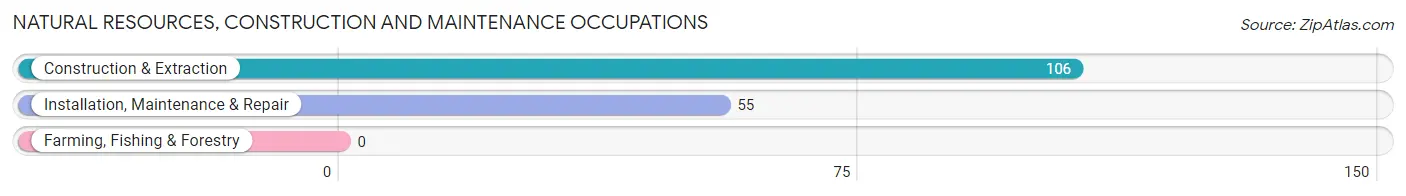
Natural Resources, Construction and Maintenance Occupations
The most common Natural Resources, Construction and Maintenance occupations in Monongahela are Construction & Extraction (106 | 5.3%), and Installation, Maintenance & Repair (55 | 2.8%).
Natural Resources, Construction and Maintenance Occupations by Sex
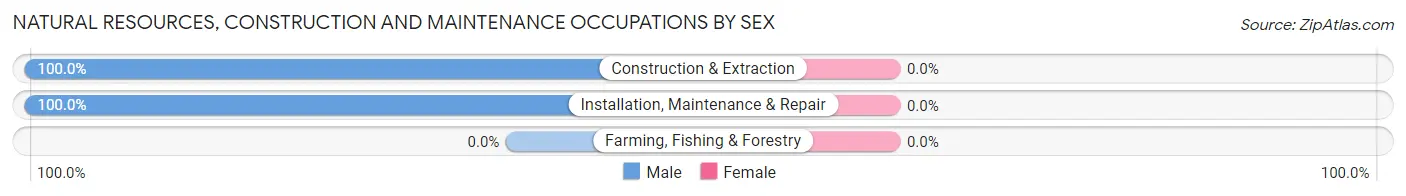
| Occupation | Male | Female |
| Farming, Fishing & Forestry | 0 (0.0%) | 0 (0.0%) |
| Construction & Extraction | 106 (100.0%) | 0 (0.0%) |
| Installation, Maintenance & Repair | 55 (100.0%) | 0 (0.0%) |
| Total (Category) | 161 (100.0%) | 0 (0.0%) |
| Total (Overall) | 963 (48.3%) | 1,031 (51.7%) |
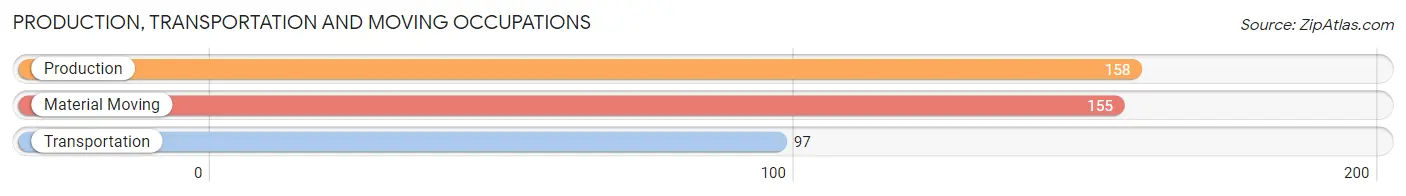
Production, Transportation and Moving Occupations
The most common Production, Transportation and Moving occupations in Monongahela are Production (158 | 7.9%), Material Moving (155 | 7.8%), and Transportation (97 | 4.9%).
Production, Transportation and Moving Occupations by Sex
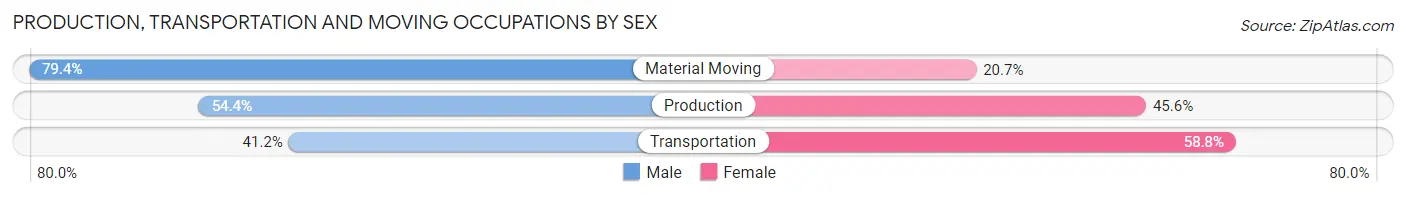
| Occupation | Male | Female |
| Production | 86 (54.4%) | 72 (45.6%) |
| Transportation | 40 (41.2%) | 57 (58.8%) |
| Material Moving | 123 (79.3%) | 32 (20.6%) |
| Total (Category) | 249 (60.7%) | 161 (39.3%) |
| Total (Overall) | 963 (48.3%) | 1,031 (51.7%) |
Employment Industries by Sex in Monongahela
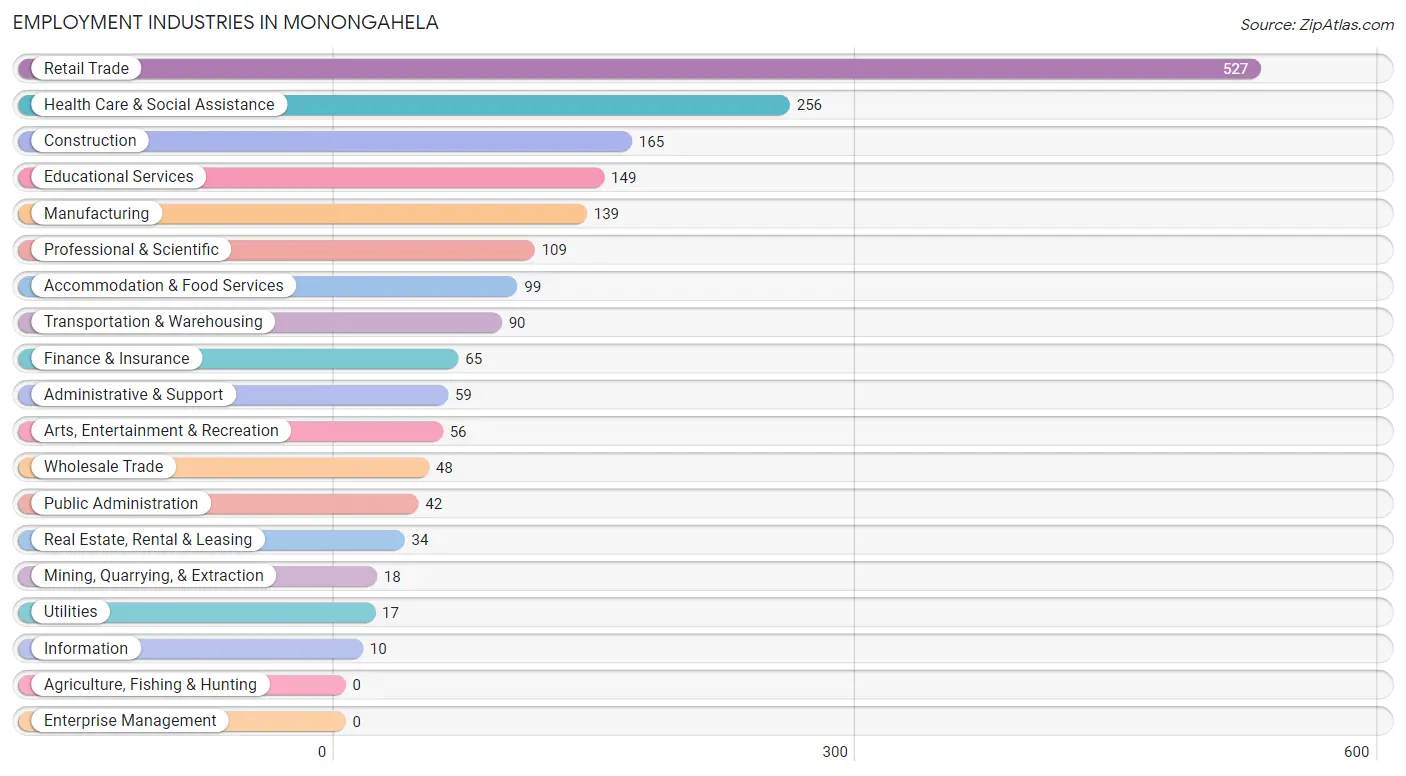
Employment Industries in Monongahela
The major employment industries in Monongahela include Retail Trade (527 | 26.4%), Health Care & Social Assistance (256 | 12.8%), Construction (165 | 8.3%), Educational Services (149 | 7.5%), and Manufacturing (139 | 7.0%).
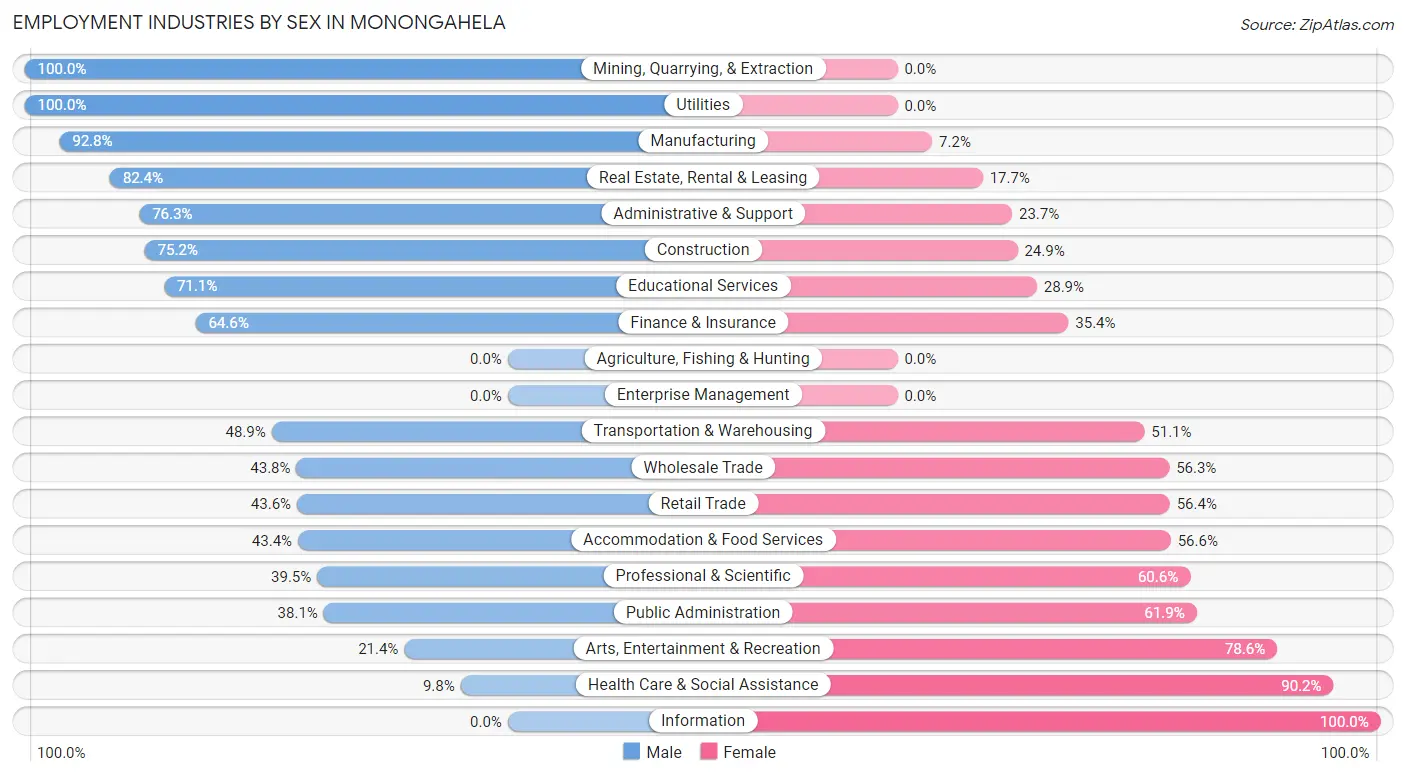
Employment Industries by Sex in Monongahela
The Monongahela industries that see more men than women are Mining, Quarrying, & Extraction (100.0%), Utilities (100.0%), and Manufacturing (92.8%), whereas the industries that tend to have a higher number of women are Information (100.0%), Health Care & Social Assistance (90.2%), and Arts, Entertainment & Recreation (78.6%).
| Industry | Male | Female |
| Agriculture, Fishing & Hunting | 0 (0.0%) | 0 (0.0%) |
| Mining, Quarrying, & Extraction | 18 (100.0%) | 0 (0.0%) |
| Construction | 124 (75.1%) | 41 (24.8%) |
| Manufacturing | 129 (92.8%) | 10 (7.2%) |
| Wholesale Trade | 21 (43.8%) | 27 (56.2%) |
| Retail Trade | 230 (43.6%) | 297 (56.4%) |
| Transportation & Warehousing | 44 (48.9%) | 46 (51.1%) |
| Utilities | 17 (100.0%) | 0 (0.0%) |
| Information | 0 (0.0%) | 10 (100.0%) |
| Finance & Insurance | 42 (64.6%) | 23 (35.4%) |
| Real Estate, Rental & Leasing | 28 (82.4%) | 6 (17.6%) |
| Professional & Scientific | 43 (39.5%) | 66 (60.6%) |
| Enterprise Management | 0 (0.0%) | 0 (0.0%) |
| Administrative & Support | 45 (76.3%) | 14 (23.7%) |
| Educational Services | 106 (71.1%) | 43 (28.9%) |
| Health Care & Social Assistance | 25 (9.8%) | 231 (90.2%) |
| Arts, Entertainment & Recreation | 12 (21.4%) | 44 (78.6%) |
| Accommodation & Food Services | 43 (43.4%) | 56 (56.6%) |
| Public Administration | 16 (38.1%) | 26 (61.9%) |
| Total | 963 (48.3%) | 1,031 (51.7%) |
Education in Monongahela
School Enrollment in Monongahela
The most common levels of schooling among the 839 students in Monongahela are middle school (244 | 29.1%), high school (185 | 22.1%), and elementary school (144 | 17.2%).
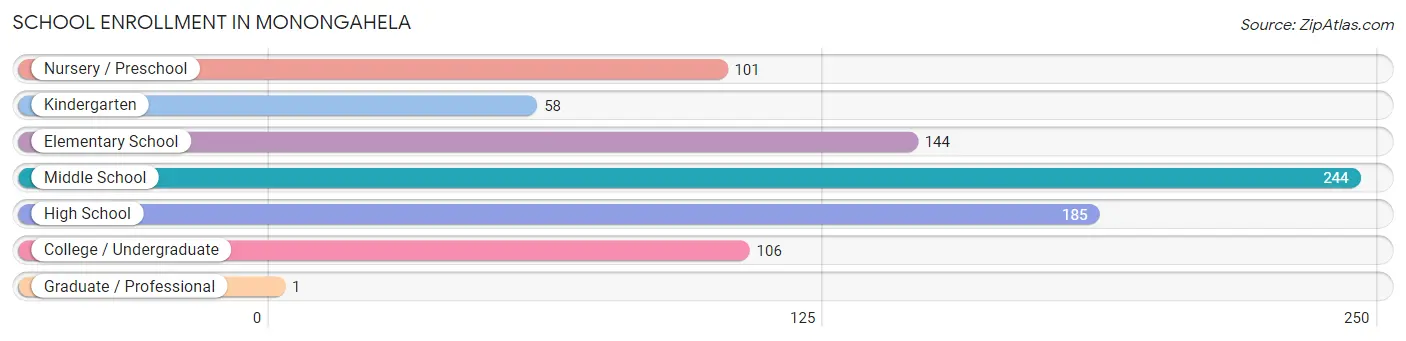
| School Level | # Students | % Students |
| Nursery / Preschool | 101 | 12.0% |
| Kindergarten | 58 | 6.9% |
| Elementary School | 144 | 17.2% |
| Middle School | 244 | 29.1% |
| High School | 185 | 22.1% |
| College / Undergraduate | 106 | 12.6% |
| Graduate / Professional | 1 | 0.1% |
| Total | 839 | 100.0% |
School Enrollment by Age by Funding Source in Monongahela
Out of a total of 839 students who are enrolled in schools in Monongahela, 50 (6.0%) attend a private institution, while the remaining 789 (94.0%) are enrolled in public schools. The age group of 20 to 24 year olds has the highest likelihood of being enrolled in private schools, with 18 (30.5% in the age bracket) enrolled. Conversely, the age group of 5 to 9 year old has the lowest likelihood of being enrolled in a private school, with 161 (100.0% in the age bracket) attending a public institution.
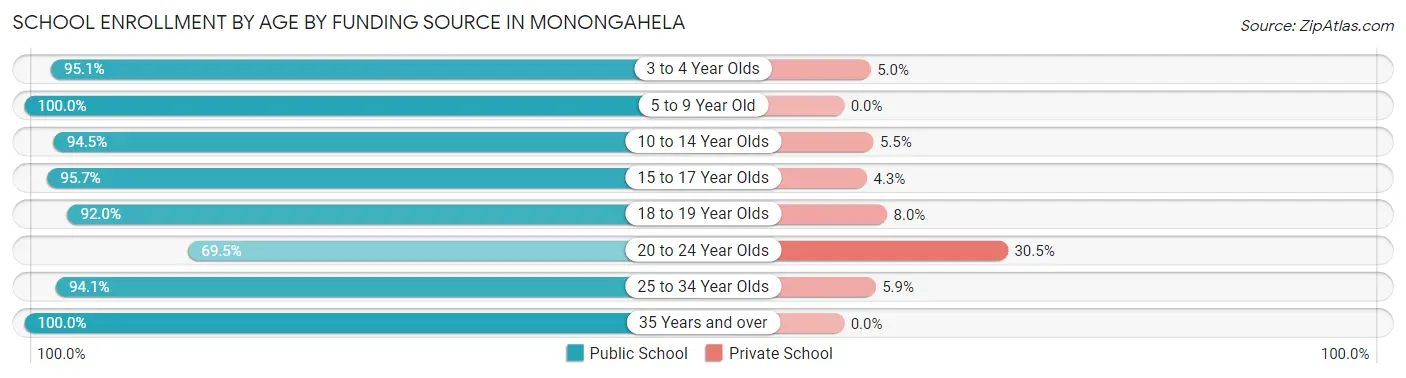
| Age Bracket | Public School | Private School |
| 3 to 4 Year Olds | 96 (95.1%) | 5 (5.0%) |
| 5 to 9 Year Old | 161 (100.0%) | 0 (0.0%) |
| 10 to 14 Year Olds | 277 (94.5%) | 16 (5.5%) |
| 15 to 17 Year Olds | 135 (95.7%) | 6 (4.3%) |
| 18 to 19 Year Olds | 46 (92.0%) | 4 (8.0%) |
| 20 to 24 Year Olds | 41 (69.5%) | 18 (30.5%) |
| 25 to 34 Year Olds | 16 (94.1%) | 1 (5.9%) |
| 35 Years and over | 17 (100.0%) | 0 (0.0%) |
| Total | 789 (94.0%) | 50 (6.0%) |
Educational Attainment by Field of Study in Monongahela
Education (184 | 31.2%), business (117 | 19.9%), science & technology (70 | 11.9%), visual & performing arts (36 | 6.1%), and literature & languages (30 | 5.1%) are the most common fields of study among 589 individuals in Monongahela who have obtained a bachelor's degree or higher.
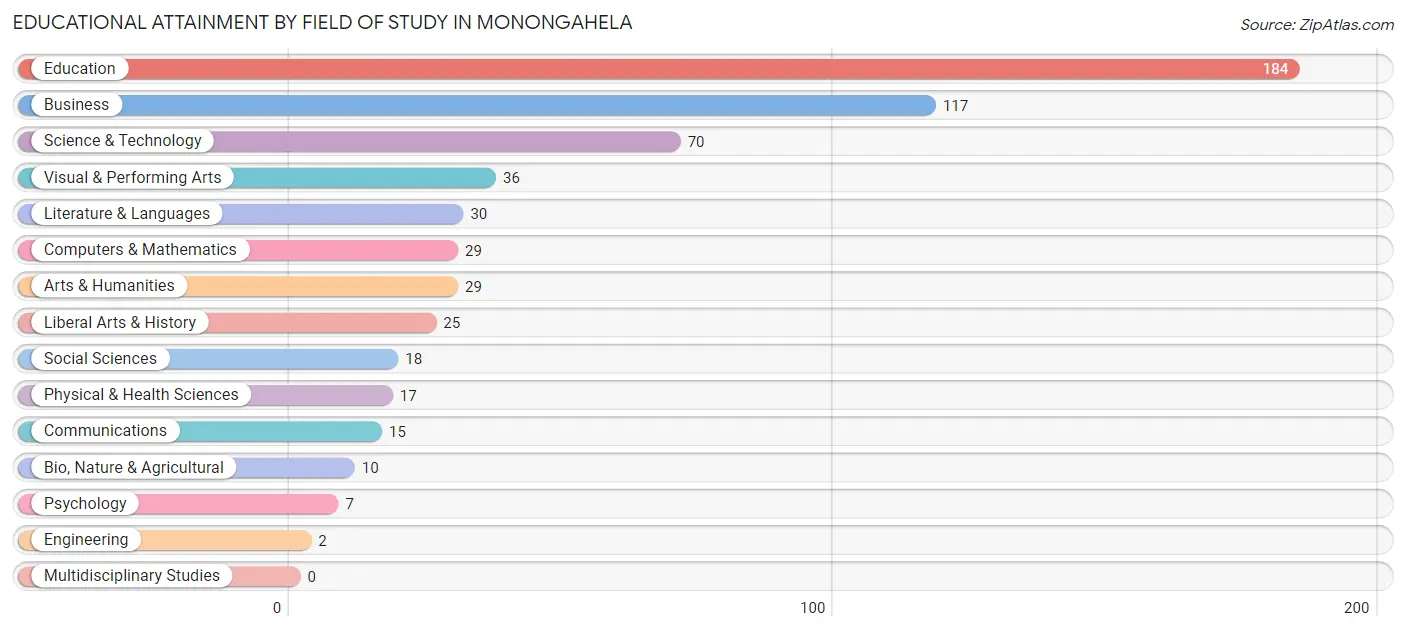
| Field of Study | # Graduates | % Graduates |
| Computers & Mathematics | 29 | 4.9% |
| Bio, Nature & Agricultural | 10 | 1.7% |
| Physical & Health Sciences | 17 | 2.9% |
| Psychology | 7 | 1.2% |
| Social Sciences | 18 | 3.1% |
| Engineering | 2 | 0.3% |
| Multidisciplinary Studies | 0 | 0.0% |
| Science & Technology | 70 | 11.9% |
| Business | 117 | 19.9% |
| Education | 184 | 31.2% |
| Literature & Languages | 30 | 5.1% |
| Liberal Arts & History | 25 | 4.2% |
| Visual & Performing Arts | 36 | 6.1% |
| Communications | 15 | 2.5% |
| Arts & Humanities | 29 | 4.9% |
| Total | 589 | 100.0% |
Transportation & Commute in Monongahela
Vehicle Availability by Sex in Monongahela
The most prevalent vehicle ownership categories in Monongahela are males with 2 vehicles (422, accounting for 43.9%) and females with 2 vehicles (376, making up 41.4%).
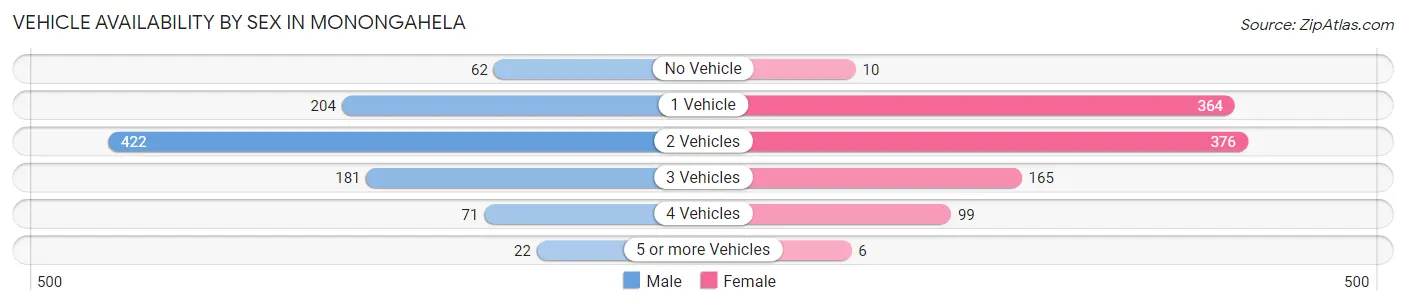
| Vehicles Available | Male | Female |
| No Vehicle | 62 (6.4%) | 10 (1.0%) |
| 1 Vehicle | 204 (21.2%) | 364 (35.7%) |
| 2 Vehicles | 422 (43.9%) | 376 (36.9%) |
| 3 Vehicles | 181 (18.8%) | 165 (16.2%) |
| 4 Vehicles | 71 (7.4%) | 99 (9.7%) |
| 5 or more Vehicles | 22 (2.3%) | 6 (0.6%) |
| Total | 962 (100.0%) | 1,020 (100.0%) |
Commute Time in Monongahela
The most frequently occuring commute durations in Monongahela are 35 to 39 minutes (341 commuters, 18.5%), 30 to 34 minutes (288 commuters, 15.7%), and 5 to 9 minutes (219 commuters, 11.9%).
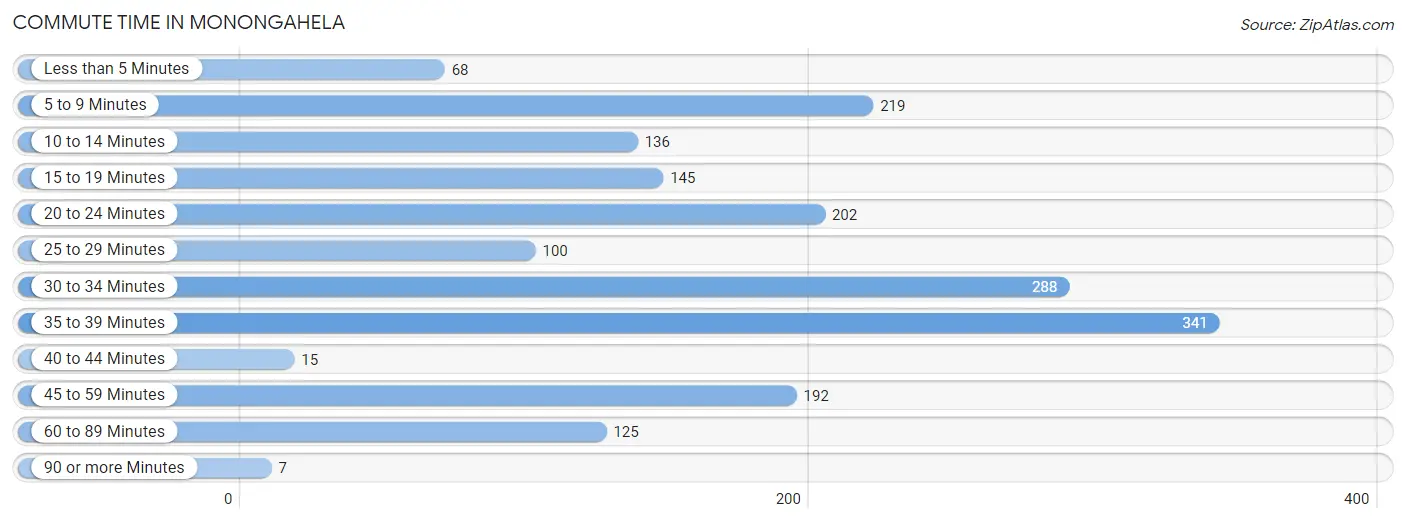
| Commute Time | # Commuters | % Commuters |
| Less than 5 Minutes | 68 | 3.7% |
| 5 to 9 Minutes | 219 | 11.9% |
| 10 to 14 Minutes | 136 | 7.4% |
| 15 to 19 Minutes | 145 | 7.9% |
| 20 to 24 Minutes | 202 | 11.0% |
| 25 to 29 Minutes | 100 | 5.4% |
| 30 to 34 Minutes | 288 | 15.7% |
| 35 to 39 Minutes | 341 | 18.5% |
| 40 to 44 Minutes | 15 | 0.8% |
| 45 to 59 Minutes | 192 | 10.4% |
| 60 to 89 Minutes | 125 | 6.8% |
| 90 or more Minutes | 7 | 0.4% |
Commute Time by Sex in Monongahela
The most common commute times in Monongahela are 45 to 59 minutes (140 commuters, 15.3%) for males and 35 to 39 minutes (250 commuters, 27.1%) for females.
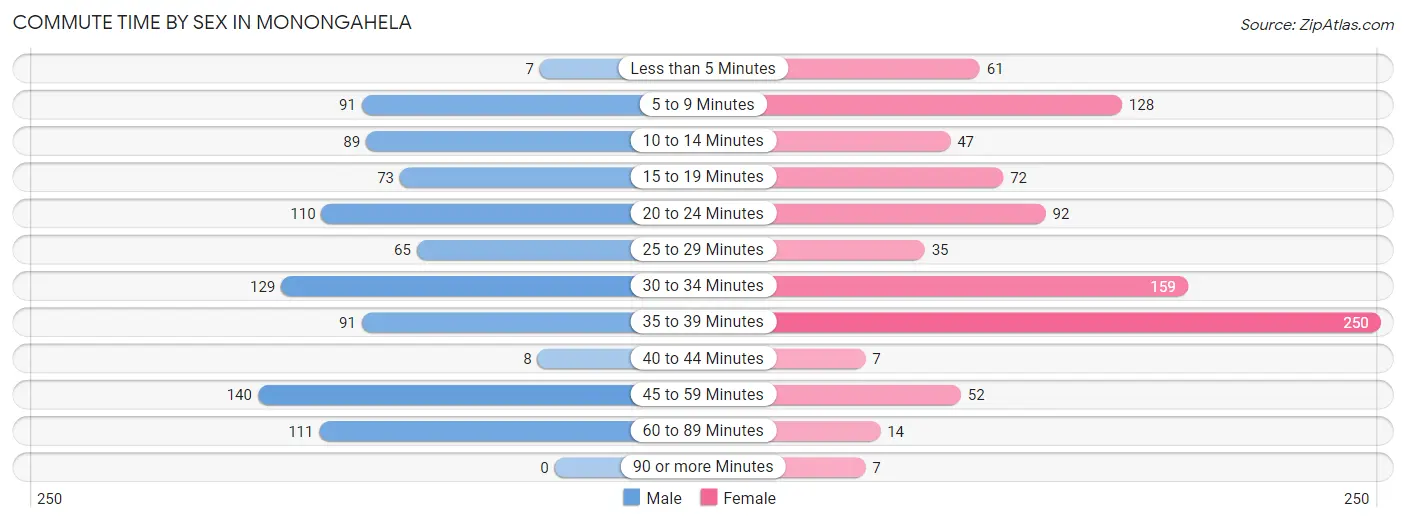
| Commute Time | Male | Female |
| Less than 5 Minutes | 7 (0.8%) | 61 (6.6%) |
| 5 to 9 Minutes | 91 (10.0%) | 128 (13.9%) |
| 10 to 14 Minutes | 89 (9.7%) | 47 (5.1%) |
| 15 to 19 Minutes | 73 (8.0%) | 72 (7.8%) |
| 20 to 24 Minutes | 110 (12.0%) | 92 (10.0%) |
| 25 to 29 Minutes | 65 (7.1%) | 35 (3.8%) |
| 30 to 34 Minutes | 129 (14.1%) | 159 (17.2%) |
| 35 to 39 Minutes | 91 (10.0%) | 250 (27.1%) |
| 40 to 44 Minutes | 8 (0.9%) | 7 (0.8%) |
| 45 to 59 Minutes | 140 (15.3%) | 52 (5.6%) |
| 60 to 89 Minutes | 111 (12.1%) | 14 (1.5%) |
| 90 or more Minutes | 0 (0.0%) | 7 (0.8%) |
Time of Departure to Work by Sex in Monongahela
The most frequent times of departure to work in Monongahela are 5:30 AM to 5:59 AM (140, 15.3%) for males and 5:00 AM to 5:29 AM (195, 21.1%) for females.
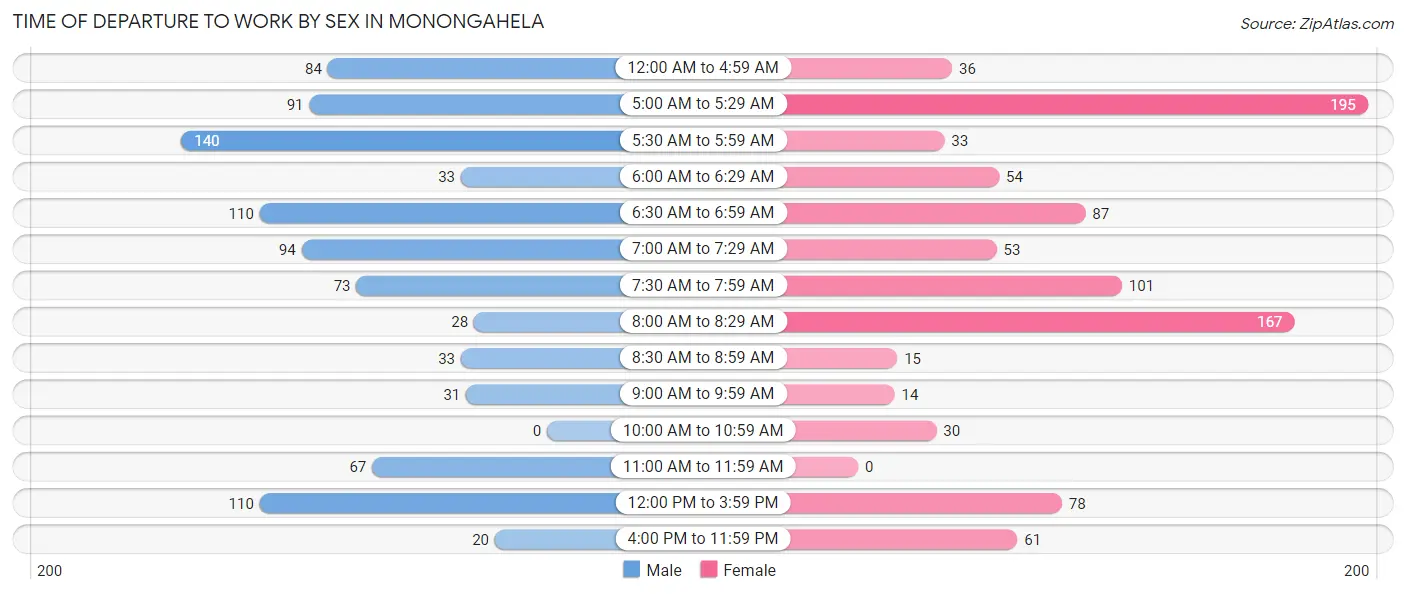
| Time of Departure | Male | Female |
| 12:00 AM to 4:59 AM | 84 (9.2%) | 36 (3.9%) |
| 5:00 AM to 5:29 AM | 91 (10.0%) | 195 (21.1%) |
| 5:30 AM to 5:59 AM | 140 (15.3%) | 33 (3.6%) |
| 6:00 AM to 6:29 AM | 33 (3.6%) | 54 (5.8%) |
| 6:30 AM to 6:59 AM | 110 (12.0%) | 87 (9.4%) |
| 7:00 AM to 7:29 AM | 94 (10.3%) | 53 (5.7%) |
| 7:30 AM to 7:59 AM | 73 (8.0%) | 101 (10.9%) |
| 8:00 AM to 8:29 AM | 28 (3.1%) | 167 (18.1%) |
| 8:30 AM to 8:59 AM | 33 (3.6%) | 15 (1.6%) |
| 9:00 AM to 9:59 AM | 31 (3.4%) | 14 (1.5%) |
| 10:00 AM to 10:59 AM | 0 (0.0%) | 30 (3.3%) |
| 11:00 AM to 11:59 AM | 67 (7.3%) | 0 (0.0%) |
| 12:00 PM to 3:59 PM | 110 (12.0%) | 78 (8.4%) |
| 4:00 PM to 11:59 PM | 20 (2.2%) | 61 (6.6%) |
| Total | 914 (100.0%) | 924 (100.0%) |
Housing Occupancy in Monongahela
Occupancy by Ownership in Monongahela
Of the total 1,932 dwellings in Monongahela, owner-occupied units account for 1,292 (66.9%), while renter-occupied units make up 640 (33.1%).
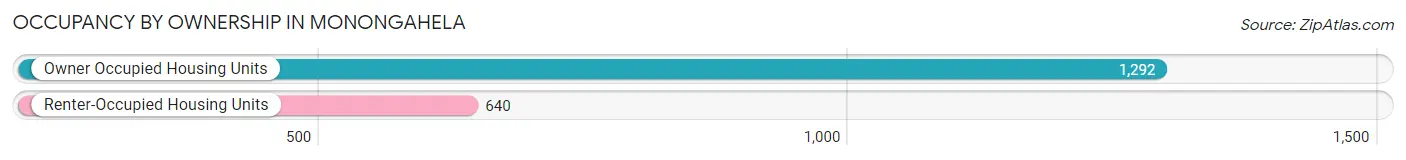
| Occupancy | # Housing Units | % Housing Units |
| Owner Occupied Housing Units | 1,292 | 66.9% |
| Renter-Occupied Housing Units | 640 | 33.1% |
| Total Occupied Housing Units | 1,932 | 100.0% |
Occupancy by Household Size in Monongahela
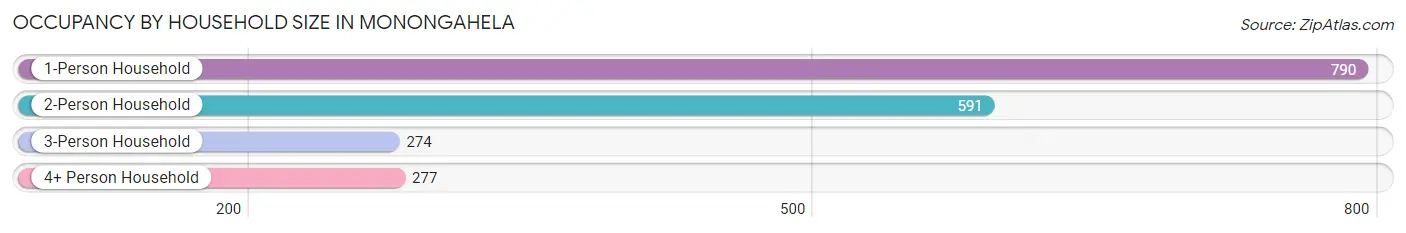
| Household Size | # Housing Units | % Housing Units |
| 1-Person Household | 790 | 40.9% |
| 2-Person Household | 591 | 30.6% |
| 3-Person Household | 274 | 14.2% |
| 4+ Person Household | 277 | 14.3% |
| Total Housing Units | 1,932 | 100.0% |
Occupancy by Ownership by Household Size in Monongahela
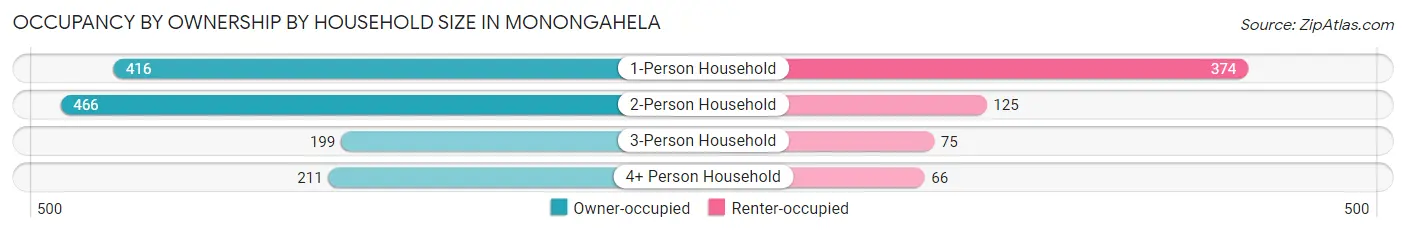
| Household Size | Owner-occupied | Renter-occupied |
| 1-Person Household | 416 (52.7%) | 374 (47.3%) |
| 2-Person Household | 466 (78.8%) | 125 (21.1%) |
| 3-Person Household | 199 (72.6%) | 75 (27.4%) |
| 4+ Person Household | 211 (76.2%) | 66 (23.8%) |
| Total Housing Units | 1,292 (66.9%) | 640 (33.1%) |
Occupancy by Educational Attainment in Monongahela
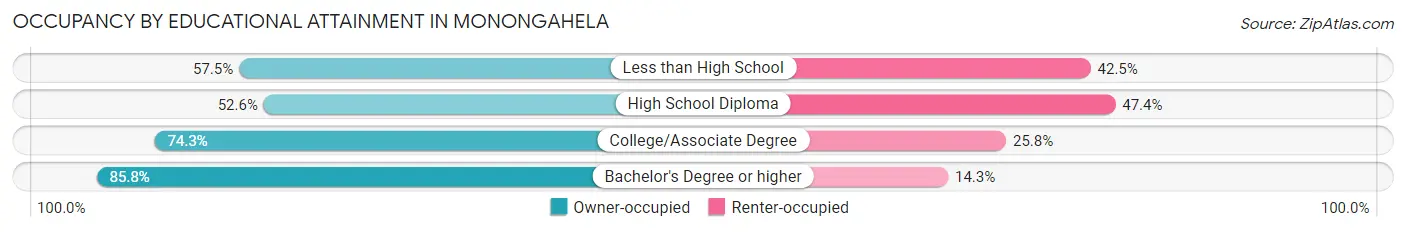
| Household Size | Owner-occupied | Renter-occupied |
| Less than High School | 73 (57.5%) | 54 (42.5%) |
| High School Diploma | 406 (52.6%) | 366 (47.4%) |
| College/Associate Degree | 470 (74.3%) | 163 (25.8%) |
| Bachelor's Degree or higher | 343 (85.8%) | 57 (14.2%) |
Occupancy by Age of Householder in Monongahela
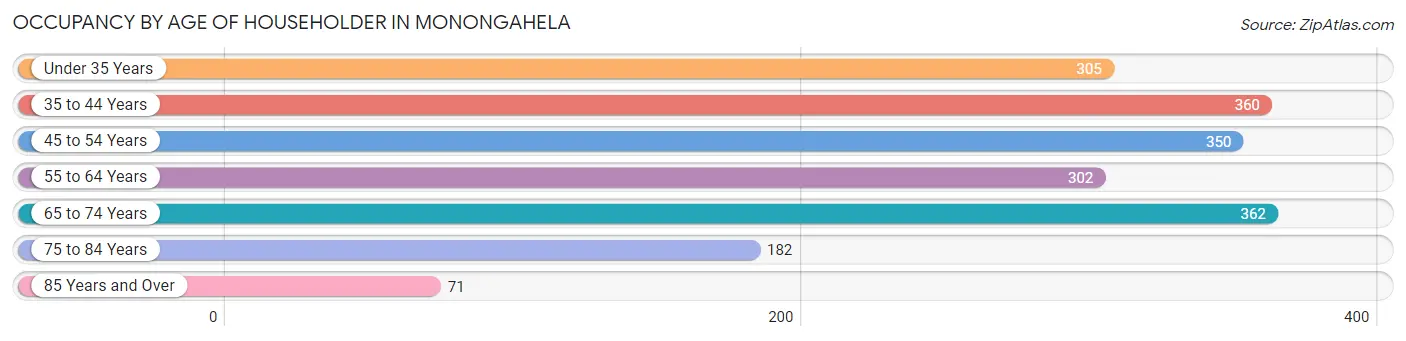
| Age Bracket | # Households | % Households |
| Under 35 Years | 305 | 15.8% |
| 35 to 44 Years | 360 | 18.6% |
| 45 to 54 Years | 350 | 18.1% |
| 55 to 64 Years | 302 | 15.6% |
| 65 to 74 Years | 362 | 18.7% |
| 75 to 84 Years | 182 | 9.4% |
| 85 Years and Over | 71 | 3.7% |
| Total | 1,932 | 100.0% |
Housing Finances in Monongahela
Median Income by Occupancy in Monongahela

| Occupancy Type | # Households | Median Income |
| Owner-Occupied | 1,292 (66.9%) | $66,900 |
| Renter-Occupied | 640 (33.1%) | $30,056 |
| Average | 1,932 (100.0%) | $50,000 |
Occupancy by Householder Income Bracket in Monongahela
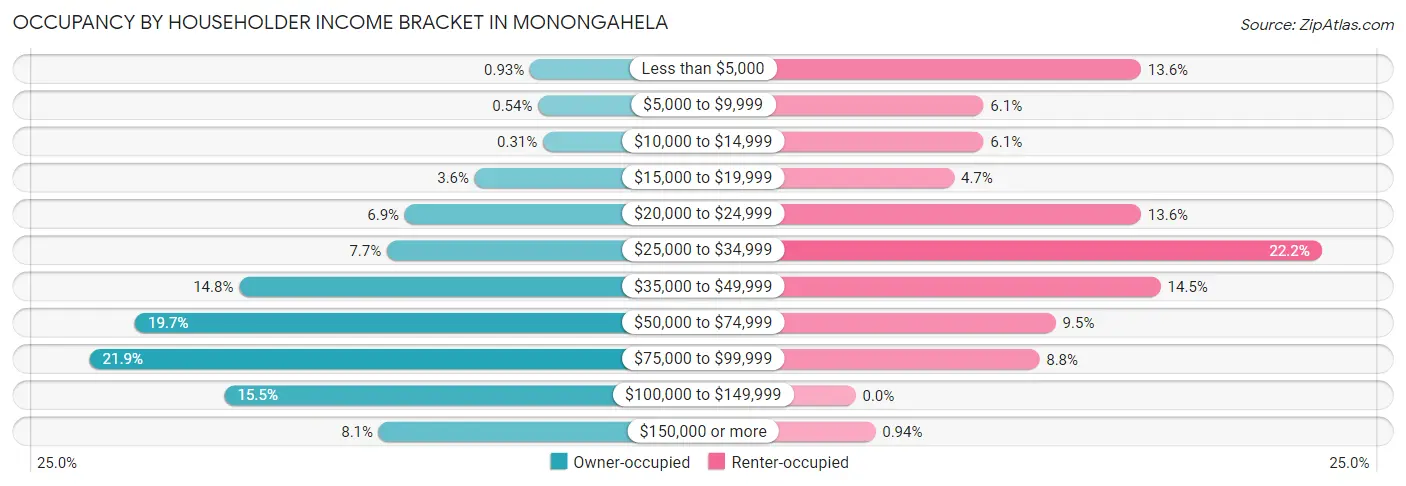
| Income Bracket | Owner-occupied | Renter-occupied |
| Less than $5,000 | 12 (0.9%) | 87 (13.6%) |
| $5,000 to $9,999 | 7 (0.5%) | 39 (6.1%) |
| $10,000 to $14,999 | 4 (0.3%) | 39 (6.1%) |
| $15,000 to $19,999 | 46 (3.6%) | 30 (4.7%) |
| $20,000 to $24,999 | 89 (6.9%) | 87 (13.6%) |
| $25,000 to $34,999 | 100 (7.7%) | 142 (22.2%) |
| $35,000 to $49,999 | 191 (14.8%) | 93 (14.5%) |
| $50,000 to $74,999 | 255 (19.7%) | 61 (9.5%) |
| $75,000 to $99,999 | 283 (21.9%) | 56 (8.7%) |
| $100,000 to $149,999 | 200 (15.5%) | 0 (0.0%) |
| $150,000 or more | 105 (8.1%) | 6 (0.9%) |
| Total | 1,292 (100.0%) | 640 (100.0%) |
Monthly Housing Cost Tiers in Monongahela
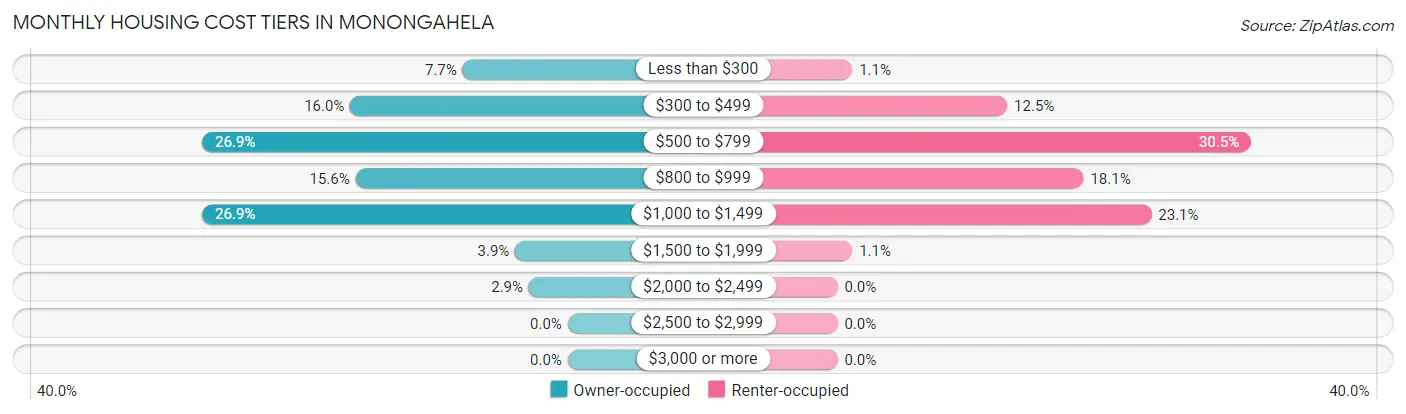
| Monthly Cost | Owner-occupied | Renter-occupied |
| Less than $300 | 100 (7.7%) | 7 (1.1%) |
| $300 to $499 | 207 (16.0%) | 80 (12.5%) |
| $500 to $799 | 348 (26.9%) | 195 (30.5%) |
| $800 to $999 | 202 (15.6%) | 116 (18.1%) |
| $1,000 to $1,499 | 348 (26.9%) | 148 (23.1%) |
| $1,500 to $1,999 | 50 (3.9%) | 7 (1.1%) |
| $2,000 to $2,499 | 37 (2.9%) | 0 (0.0%) |
| $2,500 to $2,999 | 0 (0.0%) | 0 (0.0%) |
| $3,000 or more | 0 (0.0%) | 0 (0.0%) |
| Total | 1,292 (100.0%) | 640 (100.0%) |
Physical Housing Characteristics in Monongahela
Housing Structures in Monongahela
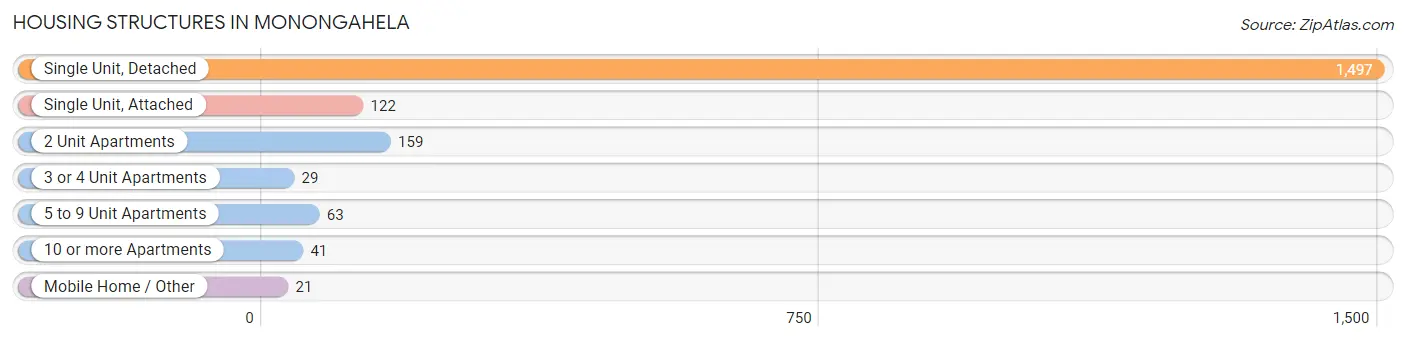
| Structure Type | # Housing Units | % Housing Units |
| Single Unit, Detached | 1,497 | 77.5% |
| Single Unit, Attached | 122 | 6.3% |
| 2 Unit Apartments | 159 | 8.2% |
| 3 or 4 Unit Apartments | 29 | 1.5% |
| 5 to 9 Unit Apartments | 63 | 3.3% |
| 10 or more Apartments | 41 | 2.1% |
| Mobile Home / Other | 21 | 1.1% |
| Total | 1,932 | 100.0% |
Housing Structures by Occupancy in Monongahela
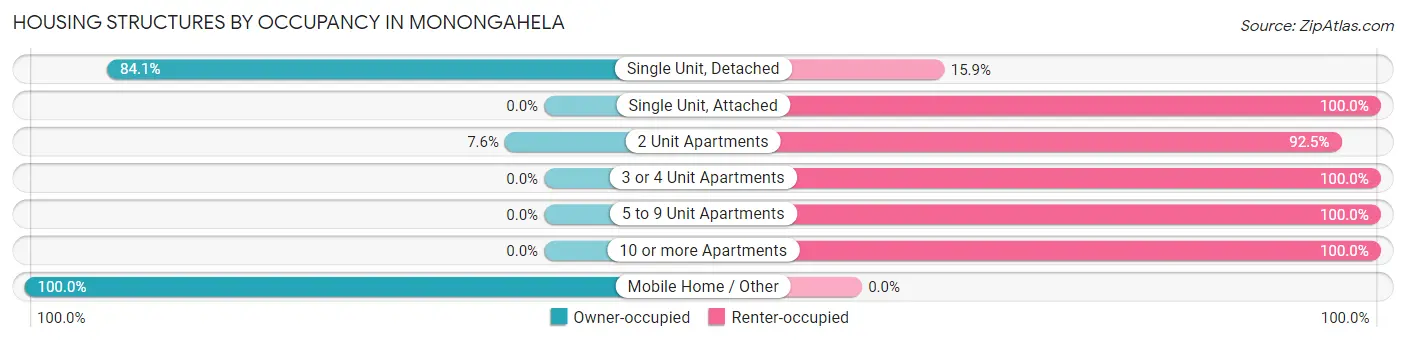
| Structure Type | Owner-occupied | Renter-occupied |
| Single Unit, Detached | 1,259 (84.1%) | 238 (15.9%) |
| Single Unit, Attached | 0 (0.0%) | 122 (100.0%) |
| 2 Unit Apartments | 12 (7.5%) | 147 (92.4%) |
| 3 or 4 Unit Apartments | 0 (0.0%) | 29 (100.0%) |
| 5 to 9 Unit Apartments | 0 (0.0%) | 63 (100.0%) |
| 10 or more Apartments | 0 (0.0%) | 41 (100.0%) |
| Mobile Home / Other | 21 (100.0%) | 0 (0.0%) |
| Total | 1,292 (66.9%) | 640 (33.1%) |
Housing Structures by Number of Rooms in Monongahela
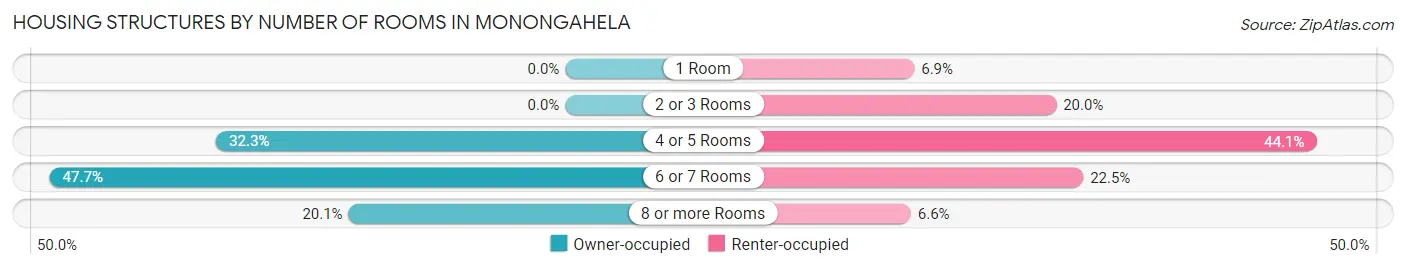
| Number of Rooms | Owner-occupied | Renter-occupied |
| 1 Room | 0 (0.0%) | 44 (6.9%) |
| 2 or 3 Rooms | 0 (0.0%) | 128 (20.0%) |
| 4 or 5 Rooms | 417 (32.3%) | 282 (44.1%) |
| 6 or 7 Rooms | 616 (47.7%) | 144 (22.5%) |
| 8 or more Rooms | 259 (20.1%) | 42 (6.6%) |
| Total | 1,292 (100.0%) | 640 (100.0%) |
Housing Structure by Heating Type in Monongahela
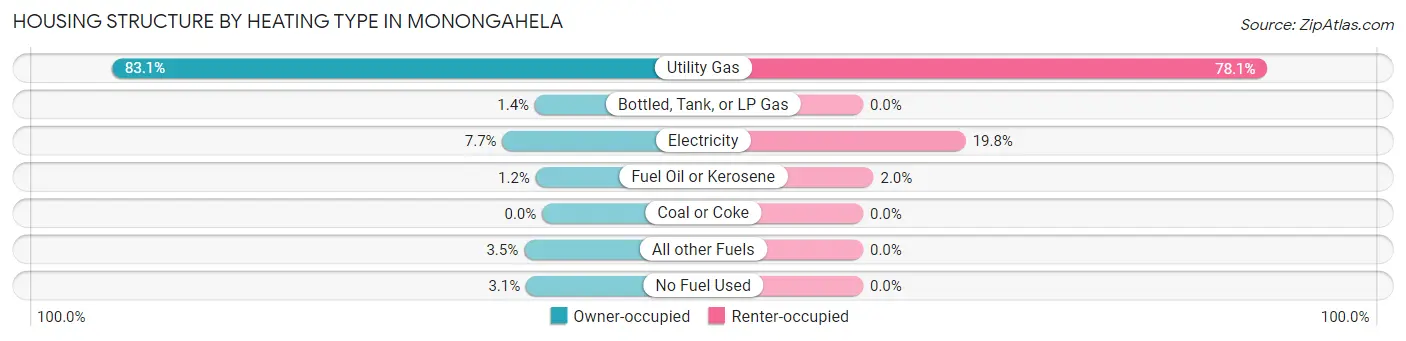
| Heating Type | Owner-occupied | Renter-occupied |
| Utility Gas | 1,074 (83.1%) | 500 (78.1%) |
| Bottled, Tank, or LP Gas | 18 (1.4%) | 0 (0.0%) |
| Electricity | 99 (7.7%) | 127 (19.8%) |
| Fuel Oil or Kerosene | 16 (1.2%) | 13 (2.0%) |
| Coal or Coke | 0 (0.0%) | 0 (0.0%) |
| All other Fuels | 45 (3.5%) | 0 (0.0%) |
| No Fuel Used | 40 (3.1%) | 0 (0.0%) |
| Total | 1,292 (100.0%) | 640 (100.0%) |
Household Vehicle Usage in Monongahela
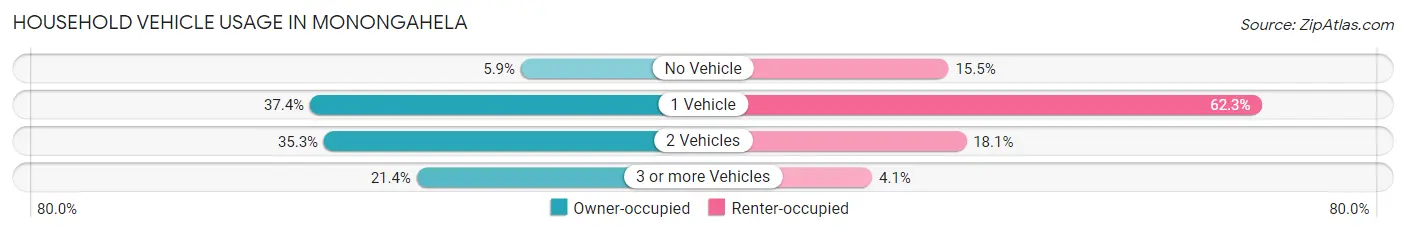
| Vehicles per Household | Owner-occupied | Renter-occupied |
| No Vehicle | 76 (5.9%) | 99 (15.5%) |
| 1 Vehicle | 483 (37.4%) | 399 (62.3%) |
| 2 Vehicles | 456 (35.3%) | 116 (18.1%) |
| 3 or more Vehicles | 277 (21.4%) | 26 (4.1%) |
| Total | 1,292 (100.0%) | 640 (100.0%) |
Real Estate & Mortgages in Monongahela
Real Estate and Mortgage Overview in Monongahela
| Characteristic | Without Mortgage | With Mortgage |
| Housing Units | 534 | 758 |
| Median Property Value | $106,600 | $106,100 |
| Median Household Income | $55,000 | $41 |
| Monthly Housing Costs | $488 | $0 |
| Real Estate Taxes | $1,635 | $0 |
Property Value by Mortgage Status in Monongahela
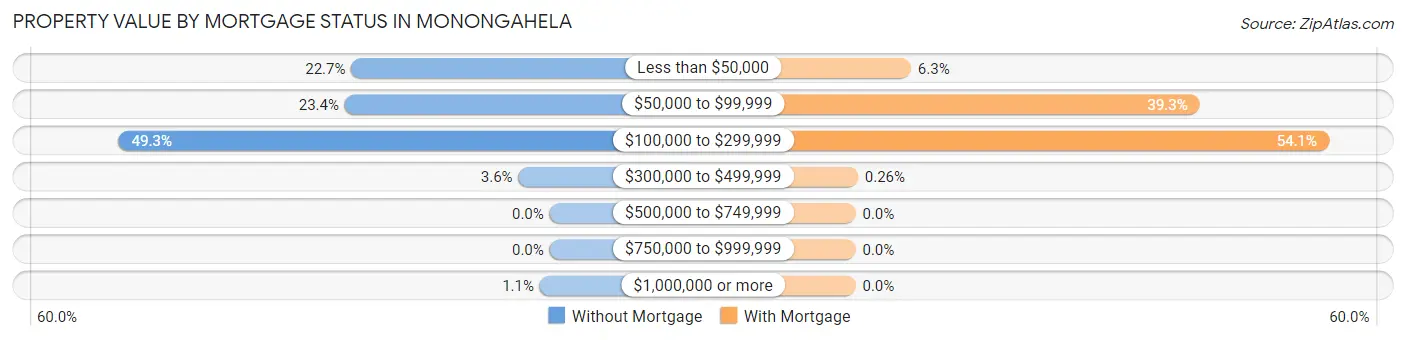
| Property Value | Without Mortgage | With Mortgage |
| Less than $50,000 | 121 (22.7%) | 48 (6.3%) |
| $50,000 to $99,999 | 125 (23.4%) | 298 (39.3%) |
| $100,000 to $299,999 | 263 (49.2%) | 410 (54.1%) |
| $300,000 to $499,999 | 19 (3.6%) | 2 (0.3%) |
| $500,000 to $749,999 | 0 (0.0%) | 0 (0.0%) |
| $750,000 to $999,999 | 0 (0.0%) | 0 (0.0%) |
| $1,000,000 or more | 6 (1.1%) | 0 (0.0%) |
| Total | 534 (100.0%) | 758 (100.0%) |
Household Income by Mortgage Status in Monongahela
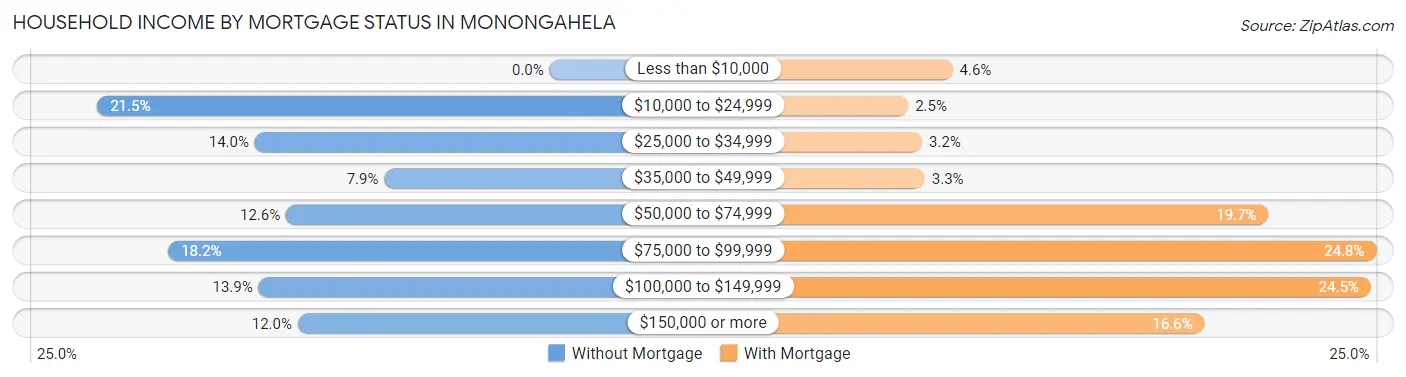
| Household Income | Without Mortgage | With Mortgage |
| Less than $10,000 | 0 (0.0%) | 35 (4.6%) |
| $10,000 to $24,999 | 115 (21.5%) | 19 (2.5%) |
| $25,000 to $34,999 | 75 (14.0%) | 24 (3.2%) |
| $35,000 to $49,999 | 42 (7.9%) | 25 (3.3%) |
| $50,000 to $74,999 | 67 (12.6%) | 149 (19.7%) |
| $75,000 to $99,999 | 97 (18.2%) | 188 (24.8%) |
| $100,000 to $149,999 | 74 (13.9%) | 186 (24.5%) |
| $150,000 or more | 64 (12.0%) | 126 (16.6%) |
| Total | 534 (100.0%) | 758 (100.0%) |
Property Value to Household Income Ratio in Monongahela
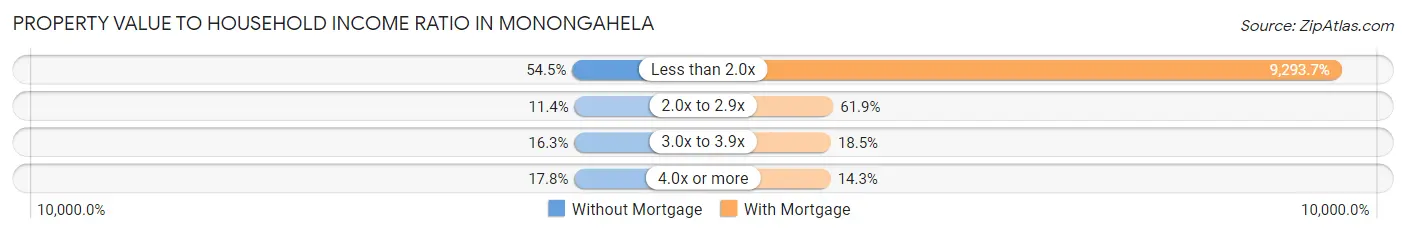
| Value-to-Income Ratio | Without Mortgage | With Mortgage |
| Less than 2.0x | 291 (54.5%) | 70,446 (9,293.7%) |
| 2.0x to 2.9x | 61 (11.4%) | 469 (61.9%) |
| 3.0x to 3.9x | 87 (16.3%) | 140 (18.5%) |
| 4.0x or more | 95 (17.8%) | 108 (14.2%) |
| Total | 534 (100.0%) | 758 (100.0%) |
Real Estate Taxes by Mortgage Status in Monongahela
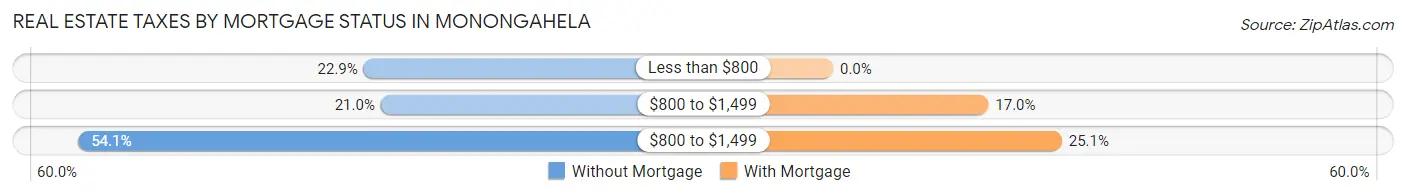
| Property Taxes | Without Mortgage | With Mortgage |
| Less than $800 | 122 (22.9%) | 0 (0.0%) |
| $800 to $1,499 | 112 (21.0%) | 129 (17.0%) |
| $800 to $1,499 | 289 (54.1%) | 190 (25.1%) |
| Total | 534 (100.0%) | 758 (100.0%) |
Health & Disability in Monongahela
Health Insurance Coverage by Age in Monongahela
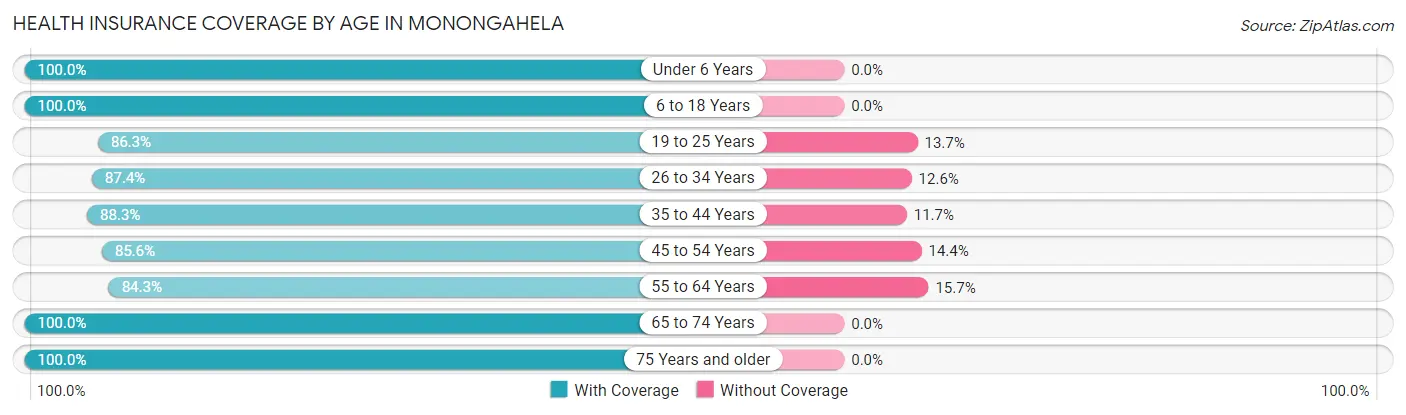
| Age Bracket | With Coverage | Without Coverage |
| Under 6 Years | 231 (100.0%) | 0 (0.0%) |
| 6 to 18 Years | 577 (100.0%) | 0 (0.0%) |
| 19 to 25 Years | 436 (86.3%) | 69 (13.7%) |
| 26 to 34 Years | 341 (87.4%) | 49 (12.6%) |
| 35 to 44 Years | 500 (88.3%) | 66 (11.7%) |
| 45 to 54 Years | 446 (85.6%) | 75 (14.4%) |
| 55 to 64 Years | 467 (84.3%) | 87 (15.7%) |
| 65 to 74 Years | 477 (100.0%) | 0 (0.0%) |
| 75 Years and older | 325 (100.0%) | 0 (0.0%) |
| Total | 3,800 (91.6%) | 346 (8.4%) |
Health Insurance Coverage by Citizenship Status in Monongahela
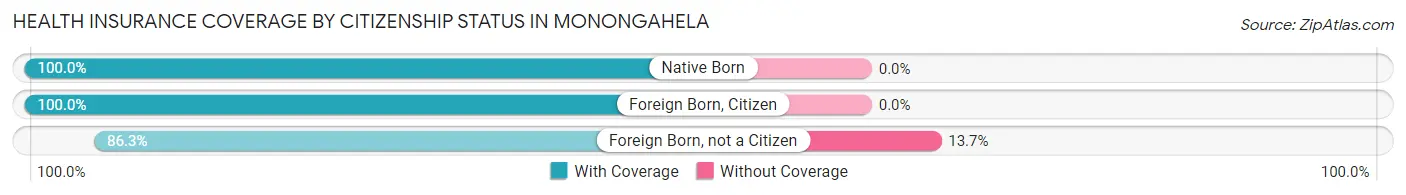
| Citizenship Status | With Coverage | Without Coverage |
| Native Born | 231 (100.0%) | 0 (0.0%) |
| Foreign Born, Citizen | 577 (100.0%) | 0 (0.0%) |
| Foreign Born, not a Citizen | 436 (86.3%) | 69 (13.7%) |
Health Insurance Coverage by Household Income in Monongahela
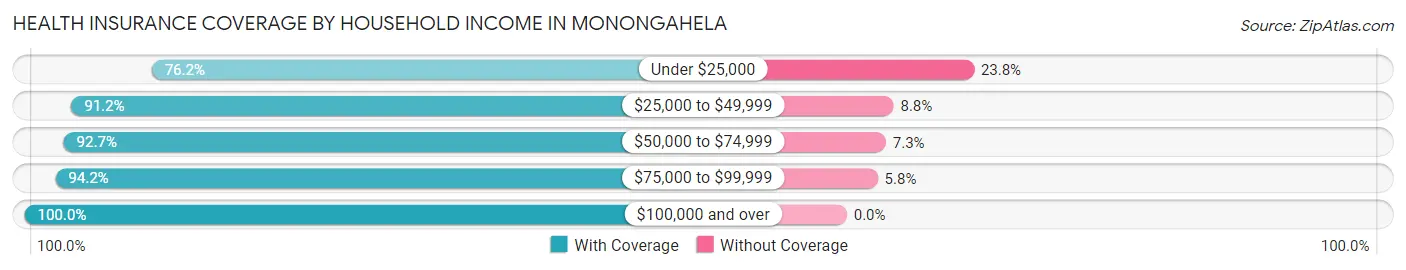
| Household Income | With Coverage | Without Coverage |
| Under $25,000 | 467 (76.2%) | 146 (23.8%) |
| $25,000 to $49,999 | 885 (91.2%) | 85 (8.8%) |
| $50,000 to $74,999 | 722 (92.7%) | 57 (7.3%) |
| $75,000 to $99,999 | 945 (94.2%) | 58 (5.8%) |
| $100,000 and over | 771 (100.0%) | 0 (0.0%) |
Public vs Private Health Insurance Coverage by Age in Monongahela
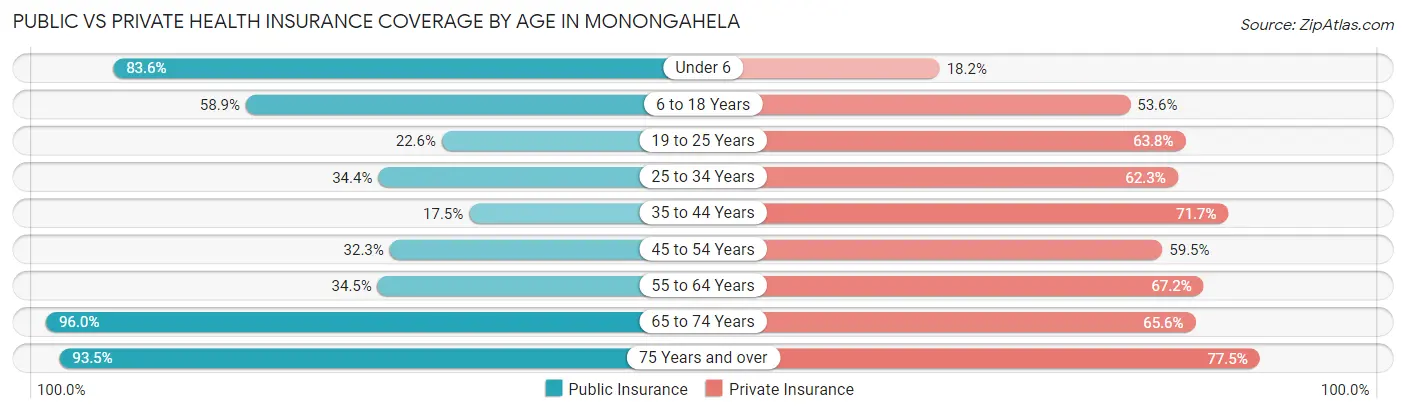
| Age Bracket | Public Insurance | Private Insurance |
| Under 6 | 193 (83.6%) | 42 (18.2%) |
| 6 to 18 Years | 340 (58.9%) | 309 (53.5%) |
| 19 to 25 Years | 114 (22.6%) | 322 (63.8%) |
| 25 to 34 Years | 134 (34.4%) | 243 (62.3%) |
| 35 to 44 Years | 99 (17.5%) | 406 (71.7%) |
| 45 to 54 Years | 168 (32.3%) | 310 (59.5%) |
| 55 to 64 Years | 191 (34.5%) | 372 (67.1%) |
| 65 to 74 Years | 458 (96.0%) | 313 (65.6%) |
| 75 Years and over | 304 (93.5%) | 252 (77.5%) |
| Total | 2,001 (48.3%) | 2,569 (62.0%) |
Disability Status by Sex by Age in Monongahela
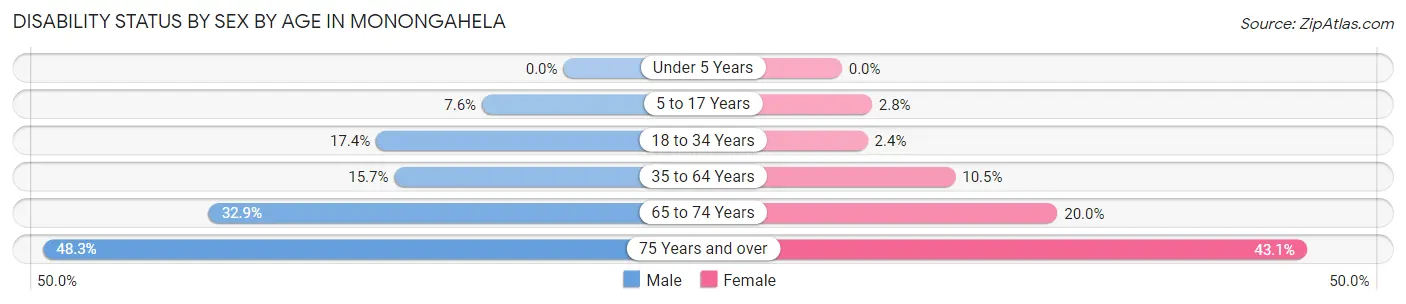
| Age Bracket | Male | Female |
| Under 5 Years | 0 (0.0%) | 0 (0.0%) |
| 5 to 17 Years | 26 (7.6%) | 7 (2.8%) |
| 18 to 34 Years | 85 (17.4%) | 10 (2.4%) |
| 35 to 64 Years | 107 (15.7%) | 101 (10.5%) |
| 65 to 74 Years | 78 (32.9%) | 48 (20.0%) |
| 75 Years and over | 55 (48.2%) | 91 (43.1%) |
Disability Class by Sex by Age in Monongahela
Disability Class: Hearing Difficulty
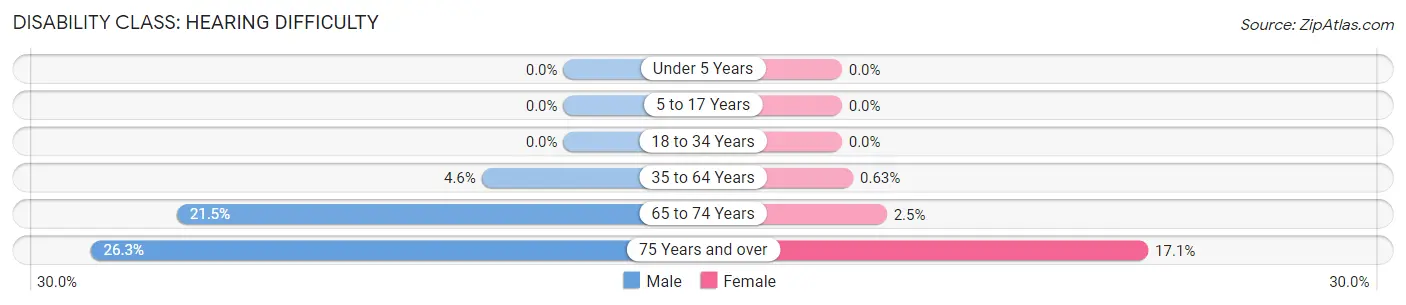
| Age Bracket | Male | Female |
| Under 5 Years | 0 (0.0%) | 0 (0.0%) |
| 5 to 17 Years | 0 (0.0%) | 0 (0.0%) |
| 18 to 34 Years | 0 (0.0%) | 0 (0.0%) |
| 35 to 64 Years | 31 (4.5%) | 6 (0.6%) |
| 65 to 74 Years | 51 (21.5%) | 6 (2.5%) |
| 75 Years and over | 30 (26.3%) | 36 (17.1%) |
Disability Class: Vision Difficulty
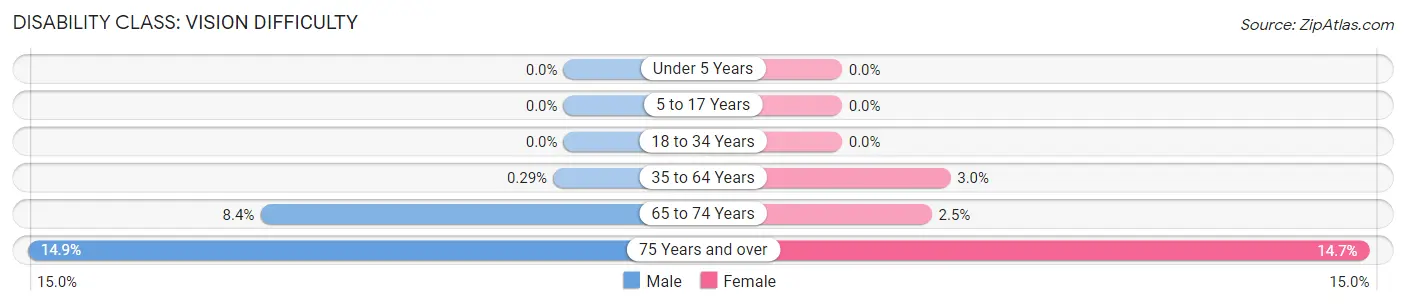
| Age Bracket | Male | Female |
| Under 5 Years | 0 (0.0%) | 0 (0.0%) |
| 5 to 17 Years | 0 (0.0%) | 0 (0.0%) |
| 18 to 34 Years | 0 (0.0%) | 0 (0.0%) |
| 35 to 64 Years | 2 (0.3%) | 29 (3.0%) |
| 65 to 74 Years | 20 (8.4%) | 6 (2.5%) |
| 75 Years and over | 17 (14.9%) | 31 (14.7%) |
Disability Class: Cognitive Difficulty
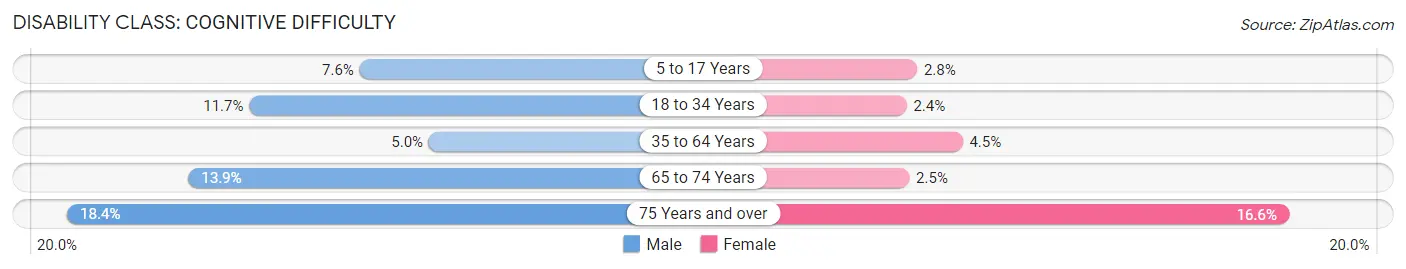
| Age Bracket | Male | Female |
| 5 to 17 Years | 26 (7.6%) | 7 (2.8%) |
| 18 to 34 Years | 57 (11.7%) | 10 (2.4%) |
| 35 to 64 Years | 34 (5.0%) | 43 (4.5%) |
| 65 to 74 Years | 33 (13.9%) | 6 (2.5%) |
| 75 Years and over | 21 (18.4%) | 35 (16.6%) |
Disability Class: Ambulatory Difficulty
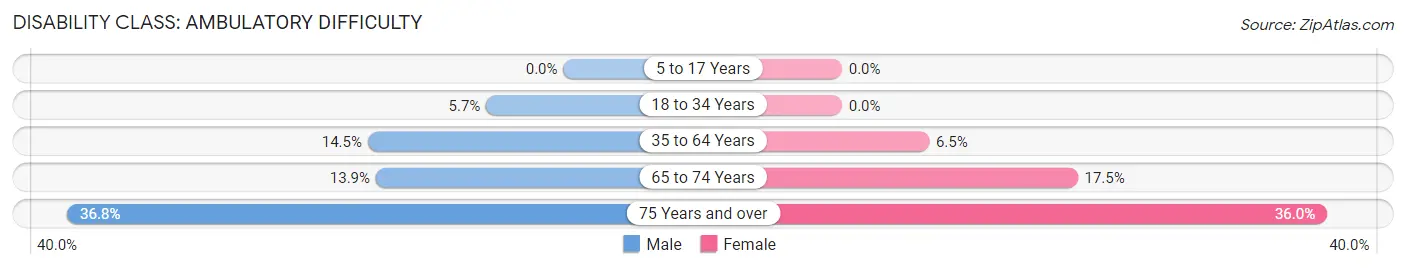
| Age Bracket | Male | Female |
| 5 to 17 Years | 0 (0.0%) | 0 (0.0%) |
| 18 to 34 Years | 28 (5.7%) | 0 (0.0%) |
| 35 to 64 Years | 99 (14.5%) | 62 (6.5%) |
| 65 to 74 Years | 33 (13.9%) | 42 (17.5%) |
| 75 Years and over | 42 (36.8%) | 76 (36.0%) |
Disability Class: Self-Care Difficulty
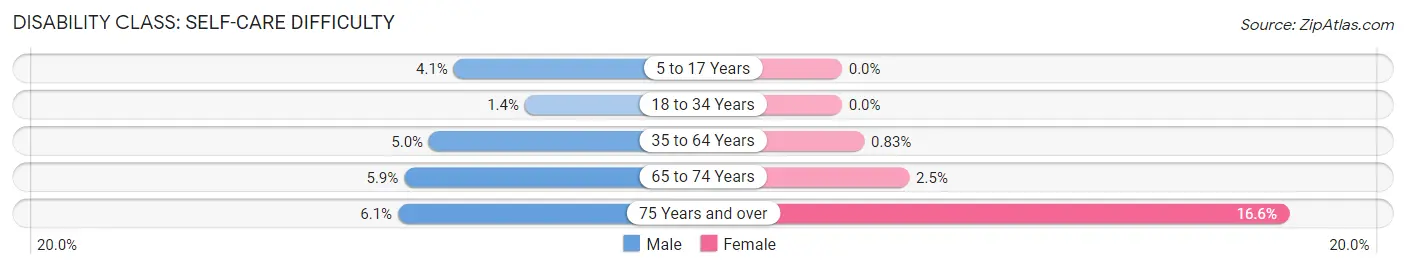
| Age Bracket | Male | Female |
| 5 to 17 Years | 14 (4.1%) | 0 (0.0%) |
| 18 to 34 Years | 7 (1.4%) | 0 (0.0%) |
| 35 to 64 Years | 34 (5.0%) | 8 (0.8%) |
| 65 to 74 Years | 14 (5.9%) | 6 (2.5%) |
| 75 Years and over | 7 (6.1%) | 35 (16.6%) |
Technology Access in Monongahela
Computing Device Access in Monongahela
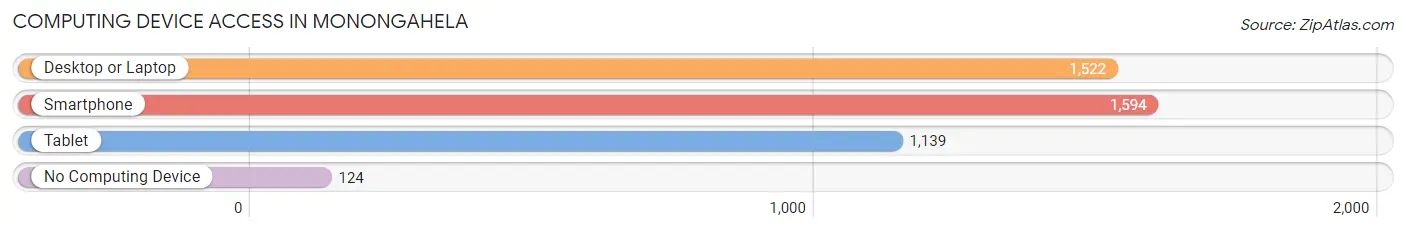
| Device Type | # Households | % Households |
| Desktop or Laptop | 1,522 | 78.8% |
| Smartphone | 1,594 | 82.5% |
| Tablet | 1,139 | 59.0% |
| No Computing Device | 124 | 6.4% |
| Total | 1,932 | 100.0% |
Internet Access in Monongahela
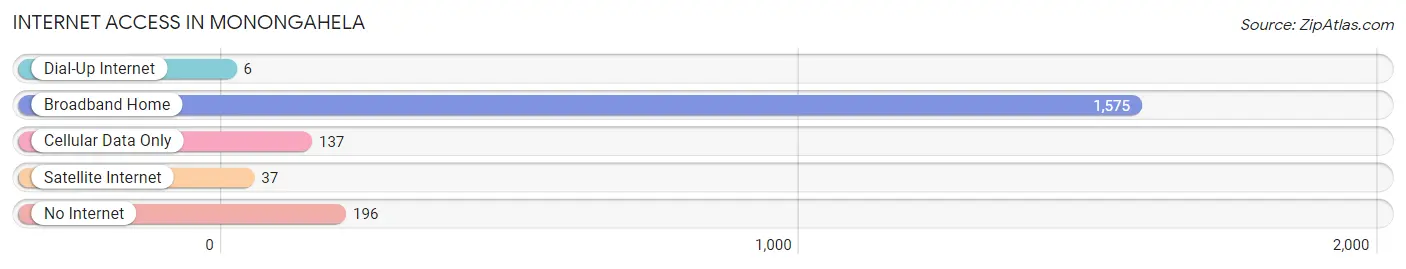
| Internet Type | # Households | % Households |
| Dial-Up Internet | 6 | 0.3% |
| Broadband Home | 1,575 | 81.5% |
| Cellular Data Only | 137 | 7.1% |
| Satellite Internet | 37 | 1.9% |
| No Internet | 196 | 10.1% |
| Total | 1,932 | 100.0% |
Monongahela Summary
Monongahela, Pennsylvania is a small borough located in Washington County, Pennsylvania. It is situated along the Monongahela River, approximately 25 miles south of Pittsburgh. The borough has a population of approximately 2,500 people and is part of the Greater Pittsburgh Metropolitan Area.
History
Monongahela was founded in 1769 by a group of settlers from Maryland and Virginia. The town was originally known as “The Forks” due to its location at the confluence of the Monongahela and Youghiogheny Rivers. The town was officially incorporated in 1817 and was named after the Monongahela River.
In the early 19th century, Monongahela was a thriving river port and was home to several industries, including coal mining, glass manufacturing, and iron production. The town was also a major stop on the Pennsylvania Canal, which connected Pittsburgh to Philadelphia.
The town experienced a period of decline in the late 19th and early 20th centuries due to the decline of the coal and iron industries. However, the town has experienced a resurgence in recent years due to its proximity to Pittsburgh and its access to the Monongahela River.
Geography
Monongahela is located in the southwestern corner of Washington County, Pennsylvania. It is situated along the Monongahela River, approximately 25 miles south of Pittsburgh. The borough has a total area of 1.2 square miles, all of which is land.
The borough is located in the Appalachian Plateau region of Pennsylvania and is surrounded by rolling hills and forests. The climate is humid continental, with hot summers and cold winters.
Economy
Monongahela’s economy is largely based on tourism and services. The town is home to several restaurants, bars, and shops, as well as a number of bed and breakfasts. The town is also home to several manufacturing companies, including a glass factory and a steel mill.
The town is also home to a number of small businesses, including a brewery, a winery, and a distillery. The town is also home to a number of professional services, including law firms, accounting firms, and medical offices.
Demographics
As of the 2010 census, Monongahela had a population of 2,521 people. The racial makeup of the borough was 97.2% White, 0.9% African American, 0.2% Native American, 0.4% Asian, 0.1% Pacific Islander, 0.3% from other races, and 0.9% from two or more races. Hispanic or Latino of any race were 1.2% of the population.
The median household income in Monongahela was $37,917, and the median family income was $45,938. The per capita income for the borough was $19,945. About 11.2% of families and 14.2% of the population were below the poverty line, including 22.2% of those under age 18 and 8.2% of those age 65 or over.
Common Questions
What is Per Capita Income in Monongahela?
Per Capita income in Monongahela is $30,490.
What is the Median Family Income in Monongahela?
Median Family Income in Monongahela is $71,741.
What is the Median Household income in Monongahela?
Median Household Income in Monongahela is $50,000.
What is Income or Wage Gap in Monongahela?
Income or Wage Gap in Monongahela is 37.1%.
Women in Monongahela earn 62.9 cents for every dollar earned by a man.
What is Inequality or Gini Index in Monongahela?
Inequality or Gini Index in Monongahela is 0.44.
What is the Total Population of Monongahela?
Total Population of Monongahela is 4,147.
What is the Total Male Population of Monongahela?
Total Male Population of Monongahela is 2,019.
What is the Total Female Population of Monongahela?
Total Female Population of Monongahela is 2,128.
What is the Ratio of Males per 100 Females in Monongahela?
There are 94.88 Males per 100 Females in Monongahela.
What is the Ratio of Females per 100 Males in Monongahela?
There are 105.40 Females per 100 Males in Monongahela.
What is the Median Population Age in Monongahela?
Median Population Age in Monongahela is 42.4 Years.
What is the Average Family Size in Monongahela
Average Family Size in Monongahela is 2.9 People.
What is the Average Household Size in Monongahela
Average Household Size in Monongahela is 2.1 People.
How Large is the Labor Force in Monongahela?
There are 2,164 People in the Labor Forcein in Monongahela.
What is the Percentage of People in the Labor Force in Monongahela?
62.4% of People are in the Labor Force in Monongahela.
What is the Unemployment Rate in Monongahela?
Unemployment Rate in Monongahela is 7.8%.