Ephrata borough, PA Map & Demographics
Ephrata borough Overview
$34,674
PER CAPITA INCOME
$79,938
AVG FAMILY INCOME
$62,590
AVG HOUSEHOLD INCOME
22.7%
WAGE / INCOME GAP [ % ]
77.3¢/ $1
WAGE / INCOME GAP [ $ ]
0.43
INEQUALITY / GINI INDEX
13,738
TOTAL POPULATION
7,008
MALE POPULATION
6,730
FEMALE POPULATION
104.13
MALES / 100 FEMALES
96.03
FEMALES / 100 MALES
36.0
MEDIAN AGE
3.0
AVG FAMILY SIZE
2.4
AVG HOUSEHOLD SIZE
7,344
LABOR FORCE [ PEOPLE ]
68.7%
PERCENT IN LABOR FORCE
3.2%
UNEMPLOYMENT RATE
Income in Ephrata borough
Income Overview in Ephrata borough
Per Capita Income in Ephrata borough is $34,674, while median incomes of families and households are $79,938 and $62,590 respectively.
| Characteristic | Number | Measure |
| Per Capita Income | 13,738 | $34,674 |
| Median Family Income | 3,615 | $79,938 |
| Mean Family Income | 3,615 | $101,118 |
| Median Household Income | 5,757 | $62,590 |
| Mean Household Income | 5,757 | $81,907 |
| Income Deficit | 3,615 | $0 |
| Wage / Income Gap (%) | 13,738 | 22.73% |
| Wage / Income Gap ($) | 13,738 | 77.27¢ per $1 |
| Gini / Inequality Index | 13,738 | 0.43 |
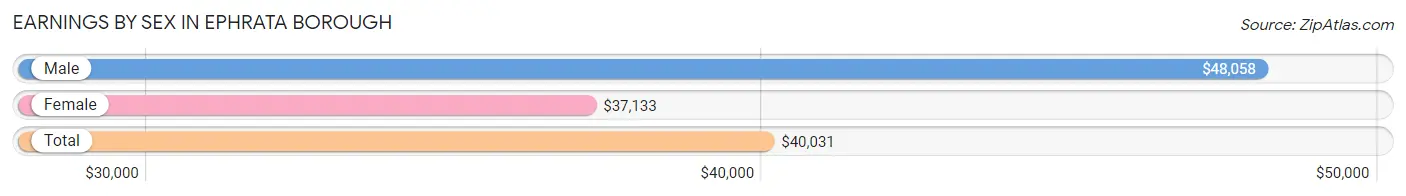
Earnings by Sex in Ephrata borough
Average Earnings in Ephrata borough are $40,031, $48,058 for men and $37,133 for women, a difference of 22.7%.
| Sex | Number | Average Earnings |
| Male | 4,305 (56.3%) | $48,058 |
| Female | 3,340 (43.7%) | $37,133 |
| Total | 7,645 (100.0%) | $40,031 |
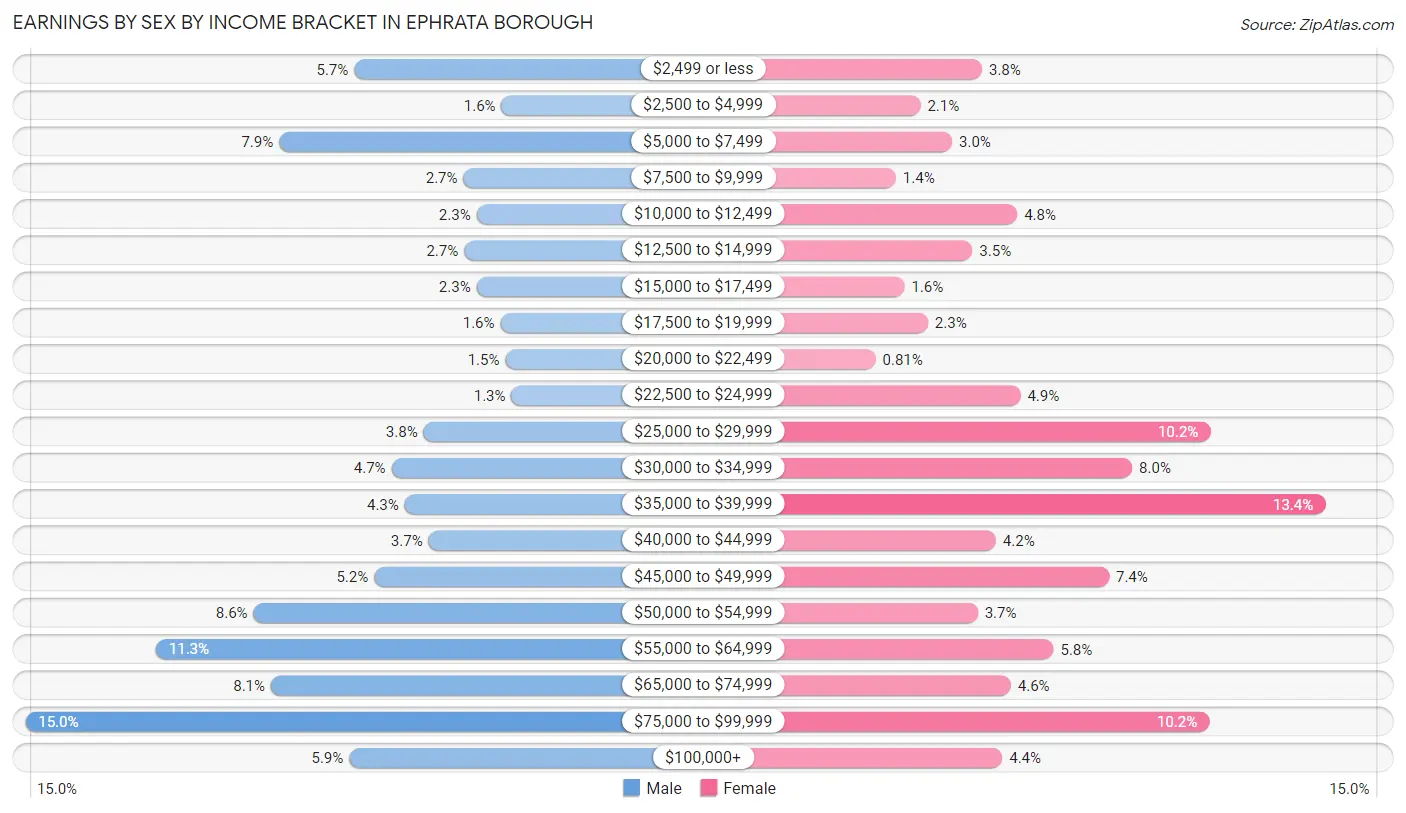
Earnings by Sex by Income Bracket in Ephrata borough
The most common earnings brackets in Ephrata borough are $75,000 to $99,999 for men (645 | 15.0%) and $35,000 to $39,999 for women (449 | 13.4%).
| Income | Male | Female |
| $2,499 or less | 247 (5.7%) | 127 (3.8%) |
| $2,500 to $4,999 | 69 (1.6%) | 69 (2.1%) |
| $5,000 to $7,499 | 338 (7.9%) | 99 (3.0%) |
| $7,500 to $9,999 | 115 (2.7%) | 46 (1.4%) |
| $10,000 to $12,499 | 99 (2.3%) | 160 (4.8%) |
| $12,500 to $14,999 | 114 (2.6%) | 118 (3.5%) |
| $15,000 to $17,499 | 99 (2.3%) | 54 (1.6%) |
| $17,500 to $19,999 | 70 (1.6%) | 76 (2.3%) |
| $20,000 to $22,499 | 64 (1.5%) | 27 (0.8%) |
| $22,500 to $24,999 | 57 (1.3%) | 163 (4.9%) |
| $25,000 to $29,999 | 163 (3.8%) | 341 (10.2%) |
| $30,000 to $34,999 | 202 (4.7%) | 268 (8.0%) |
| $35,000 to $39,999 | 186 (4.3%) | 449 (13.4%) |
| $40,000 to $44,999 | 157 (3.6%) | 140 (4.2%) |
| $45,000 to $49,999 | 223 (5.2%) | 246 (7.4%) |
| $50,000 to $54,999 | 369 (8.6%) | 123 (3.7%) |
| $55,000 to $64,999 | 487 (11.3%) | 194 (5.8%) |
| $65,000 to $74,999 | 348 (8.1%) | 154 (4.6%) |
| $75,000 to $99,999 | 645 (15.0%) | 340 (10.2%) |
| $100,000+ | 253 (5.9%) | 146 (4.4%) |
| Total | 4,305 (100.0%) | 3,340 (100.0%) |
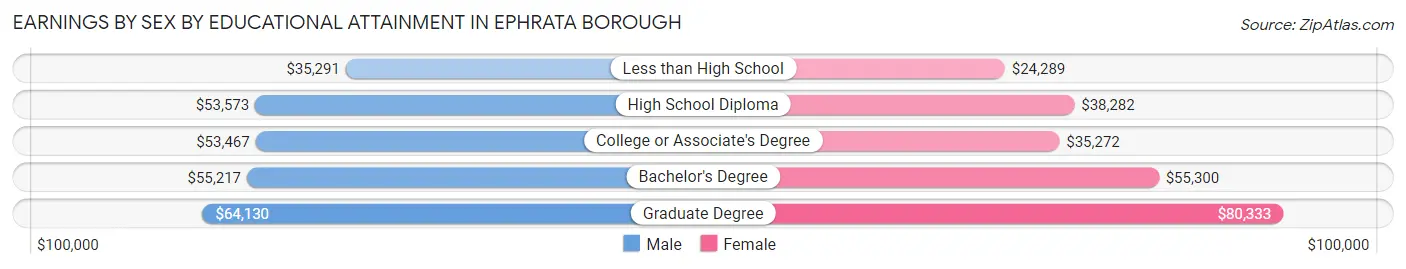
Earnings by Sex by Educational Attainment in Ephrata borough
Average earnings in Ephrata borough are $53,453 for men and $38,737 for women, a difference of 27.5%. Men with an educational attainment of graduate degree enjoy the highest average annual earnings of $64,130, while those with less than high school education earn the least with $35,291. Women with an educational attainment of graduate degree earn the most with the average annual earnings of $80,333, while those with less than high school education have the smallest earnings of $24,289.
| Educational Attainment | Male Income | Female Income |
| Less than High School | $35,291 | $24,289 |
| High School Diploma | $53,573 | $38,282 |
| College or Associate's Degree | $53,467 | $35,272 |
| Bachelor's Degree | $55,217 | $55,300 |
| Graduate Degree | $64,130 | $80,333 |
| Total | $53,453 | $38,737 |
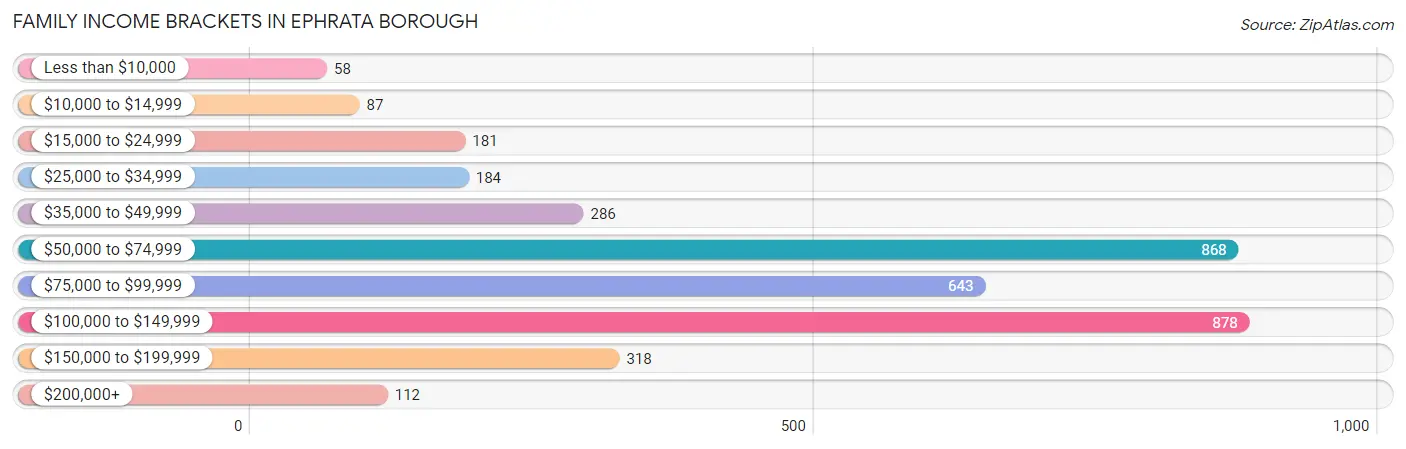
Family Income in Ephrata borough
Family Income Brackets in Ephrata borough
According to the Ephrata borough family income data, there are 878 families falling into the $100,000 to $149,999 income range, which is the most common income bracket and makes up 24.3% of all families. Conversely, the less than $10,000 income bracket is the least frequent group with only 58 families (1.6%) belonging to this category.
| Income Bracket | # Families | % Families |
| Less than $10,000 | 58 | 1.6% |
| $10,000 to $14,999 | 87 | 2.4% |
| $15,000 to $24,999 | 181 | 5.0% |
| $25,000 to $34,999 | 184 | 5.1% |
| $35,000 to $49,999 | 286 | 7.9% |
| $50,000 to $74,999 | 868 | 24.0% |
| $75,000 to $99,999 | 643 | 17.8% |
| $100,000 to $149,999 | 878 | 24.3% |
| $150,000 to $199,999 | 318 | 8.8% |
| $200,000+ | 112 | 3.1% |
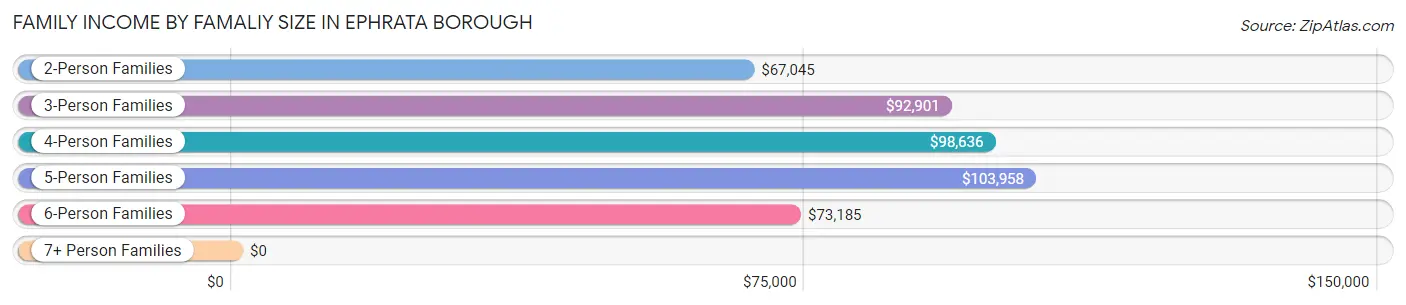
Family Income by Famaliy Size in Ephrata borough
5-person families (366 | 10.1%) account for the highest median family income in Ephrata borough with $103,958 per family, while 2-person families (1,590 | 44.0%) have the highest median income of $33,522 per family member.
| Income Bracket | # Families | Median Income |
| 2-Person Families | 1,590 (44.0%) | $67,045 |
| 3-Person Families | 1,078 (29.8%) | $92,901 |
| 4-Person Families | 466 (12.9%) | $98,636 |
| 5-Person Families | 366 (10.1%) | $103,958 |
| 6-Person Families | 99 (2.7%) | $73,185 |
| 7+ Person Families | 16 (0.4%) | $0 |
| Total | 3,615 (100.0%) | $79,938 |
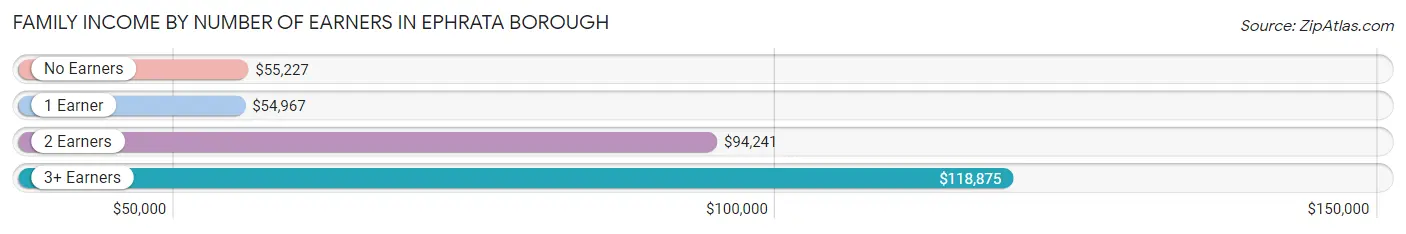
Family Income by Number of Earners in Ephrata borough
The median family income in Ephrata borough is $79,938, with families comprising 3+ earners (427) having the highest median family income of $118,875, while families with 1 earner (995) have the lowest median family income of $54,967, accounting for 11.8% and 27.5% of families, respectively.
| Number of Earners | # Families | Median Income |
| No Earners | 472 (13.1%) | $55,227 |
| 1 Earner | 995 (27.5%) | $54,967 |
| 2 Earners | 1,721 (47.6%) | $94,241 |
| 3+ Earners | 427 (11.8%) | $118,875 |
| Total | 3,615 (100.0%) | $79,938 |
Household Income in Ephrata borough
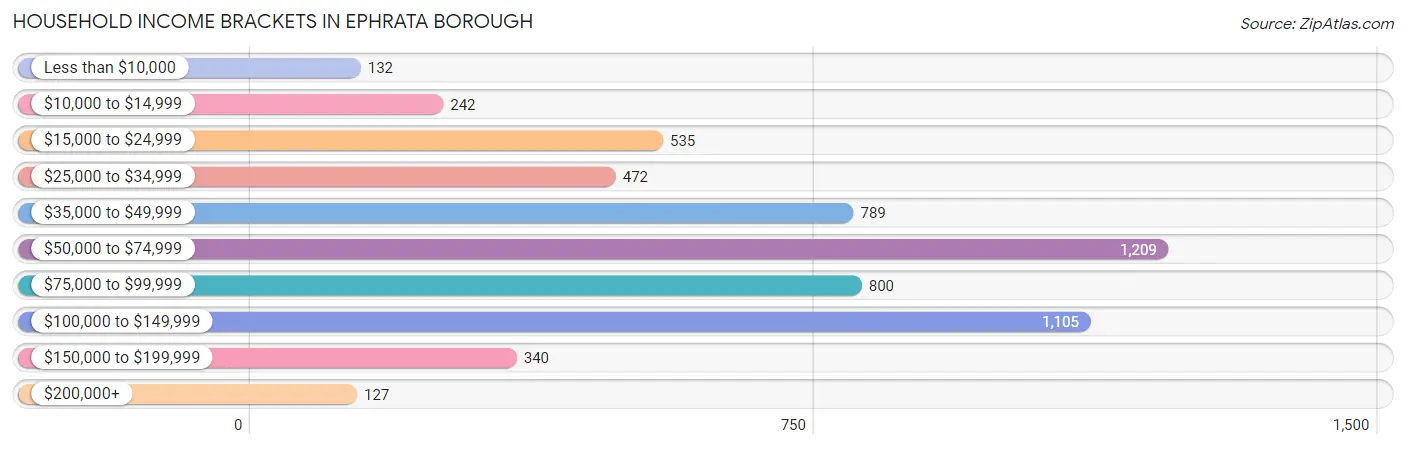
Household Income Brackets in Ephrata borough
With 1,209 households falling in the category, the $50,000 to $74,999 income range is the most frequent in Ephrata borough, accounting for 21.0% of all households. In contrast, only 127 households (2.2%) fall into the $200,000+ income bracket, making it the least populous group.
| Income Bracket | # Households | % Households |
| Less than $10,000 | 132 | 2.3% |
| $10,000 to $14,999 | 242 | 4.2% |
| $15,000 to $24,999 | 535 | 9.3% |
| $25,000 to $34,999 | 472 | 8.2% |
| $35,000 to $49,999 | 789 | 13.7% |
| $50,000 to $74,999 | 1,209 | 21.0% |
| $75,000 to $99,999 | 800 | 13.9% |
| $100,000 to $149,999 | 1,105 | 19.2% |
| $150,000 to $199,999 | 340 | 5.9% |
| $200,000+ | 127 | 2.2% |
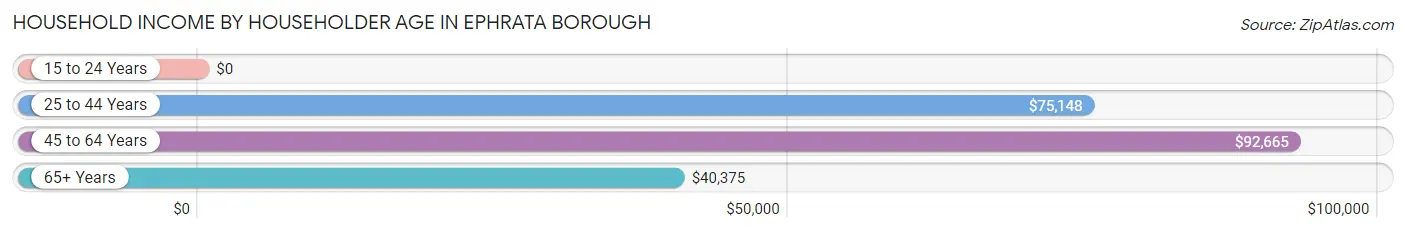
Household Income by Householder Age in Ephrata borough
The median household income in Ephrata borough is $62,590, with the highest median household income of $92,665 found in the 45 to 64 years age bracket for the primary householder. A total of 1,823 households (31.7%) fall into this category. Meanwhile, the 15 to 24 years age bracket for the primary householder has the lowest median household income of $0, with 276 households (4.8%) in this group.
| Income Bracket | # Households | Median Income |
| 15 to 24 Years | 276 (4.8%) | $0 |
| 25 to 44 Years | 1,993 (34.6%) | $75,148 |
| 45 to 64 Years | 1,823 (31.7%) | $92,665 |
| 65+ Years | 1,665 (28.9%) | $40,375 |
| Total | 5,757 (100.0%) | $62,590 |
Poverty in Ephrata borough
Income Below Poverty by Sex and Age in Ephrata borough
With 7.8% poverty level for males and 10.9% for females among the residents of Ephrata borough, 18 to 24 year old males and 12 to 14 year old females are the most vulnerable to poverty, with 118 males (24.0%) and 73 females (29.7%) in their respective age groups living below the poverty level.
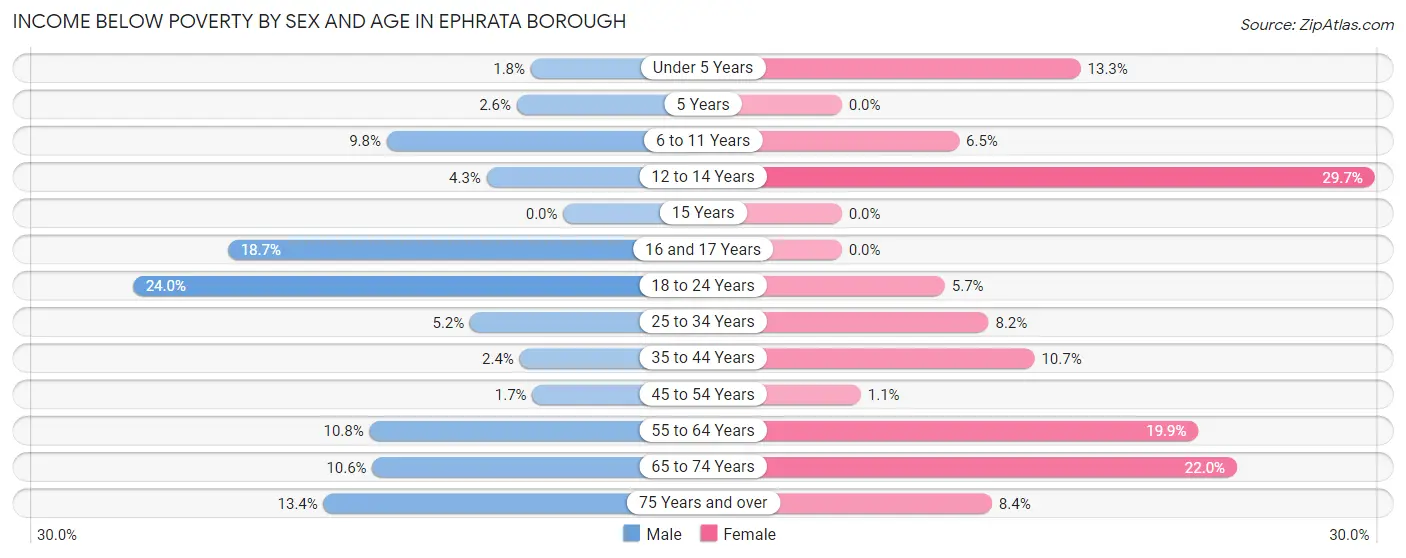
| Age Bracket | Male | Female |
| Under 5 Years | 10 (1.8%) | 48 (13.3%) |
| 5 Years | 3 (2.6%) | 0 (0.0%) |
| 6 to 11 Years | 53 (9.8%) | 41 (6.5%) |
| 12 to 14 Years | 10 (4.3%) | 73 (29.7%) |
| 15 Years | 0 (0.0%) | 0 (0.0%) |
| 16 and 17 Years | 40 (18.7%) | 0 (0.0%) |
| 18 to 24 Years | 118 (24.0%) | 26 (5.7%) |
| 25 to 34 Years | 60 (5.2%) | 93 (8.2%) |
| 35 to 44 Years | 24 (2.4%) | 69 (10.7%) |
| 45 to 54 Years | 14 (1.7%) | 8 (1.1%) |
| 55 to 64 Years | 85 (10.8%) | 157 (19.9%) |
| 65 to 74 Years | 49 (10.6%) | 163 (22.0%) |
| 75 Years and over | 75 (13.4%) | 50 (8.4%) |
| Total | 541 (7.8%) | 728 (10.9%) |
Income Above Poverty by Sex and Age in Ephrata borough
According to the poverty statistics in Ephrata borough, males aged 15 years and females aged 5 years are the age groups that are most secure financially, with 100.0% of males and 100.0% of females in these age groups living above the poverty line.
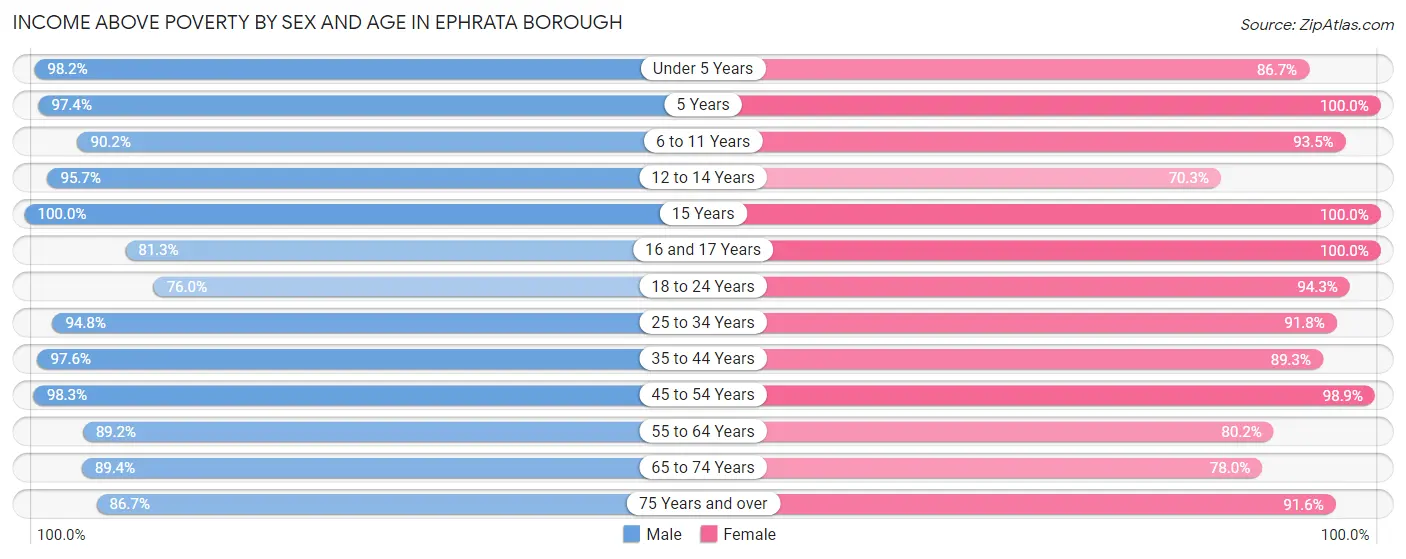
| Age Bracket | Male | Female |
| Under 5 Years | 544 (98.2%) | 313 (86.7%) |
| 5 Years | 113 (97.4%) | 50 (100.0%) |
| 6 to 11 Years | 486 (90.2%) | 587 (93.5%) |
| 12 to 14 Years | 224 (95.7%) | 173 (70.3%) |
| 15 Years | 23 (100.0%) | 234 (100.0%) |
| 16 and 17 Years | 174 (81.3%) | 55 (100.0%) |
| 18 to 24 Years | 374 (76.0%) | 427 (94.3%) |
| 25 to 34 Years | 1,096 (94.8%) | 1,046 (91.8%) |
| 35 to 44 Years | 965 (97.6%) | 574 (89.3%) |
| 45 to 54 Years | 798 (98.3%) | 750 (98.9%) |
| 55 to 64 Years | 703 (89.2%) | 634 (80.1%) |
| 65 to 74 Years | 412 (89.4%) | 578 (78.0%) |
| 75 Years and over | 487 (86.7%) | 548 (91.6%) |
| Total | 6,399 (92.2%) | 5,969 (89.1%) |
Income Below Poverty Among Married-Couple Families in Ephrata borough
The poverty statistics for married-couple families in Ephrata borough show that 3.1% or 81 of the total 2,648 families live below the poverty line. Families with no children have the highest poverty rate of 5.8%, comprising of 81 families. On the other hand, families with 1 or 2 children have the lowest poverty rate of 0.0%, which includes 0 families.
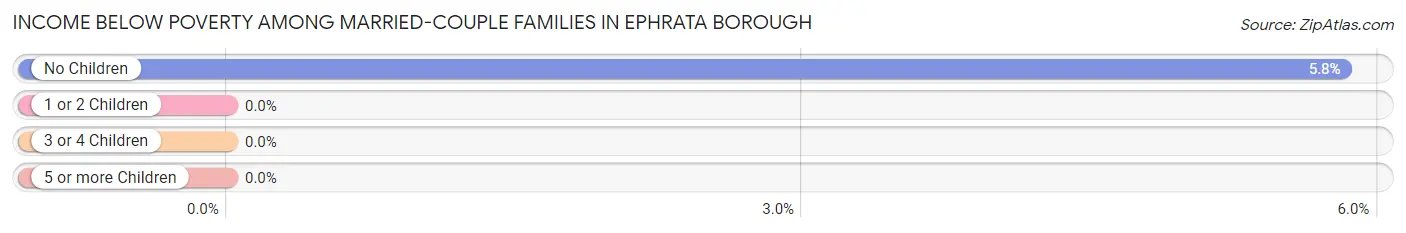
| Children | Above Poverty | Below Poverty |
| No Children | 1,310 (94.2%) | 81 (5.8%) |
| 1 or 2 Children | 921 (100.0%) | 0 (0.0%) |
| 3 or 4 Children | 336 (100.0%) | 0 (0.0%) |
| 5 or more Children | 0 (0.0%) | 0 (0.0%) |
| Total | 2,567 (96.9%) | 81 (3.1%) |
Income Below Poverty Among Single-Parent Households in Ephrata borough
According to the poverty data in Ephrata borough, 24.8% or 118 single-father households and 22.8% or 112 single-mother households are living below the poverty line. Among single-father households, those with no children have the highest poverty rate, with 118 households (47.6%) experiencing poverty. Likewise, among single-mother households, those with 5 or more children have the highest poverty rate, with 22 households (100.0%) falling below the poverty line.
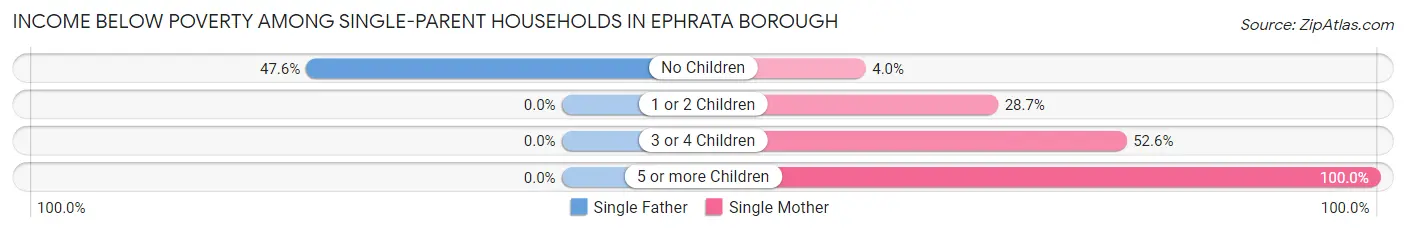
| Children | Single Father | Single Mother |
| No Children | 118 (47.6%) | 8 (4.0%) |
| 1 or 2 Children | 0 (0.0%) | 72 (28.7%) |
| 3 or 4 Children | 0 (0.0%) | 10 (52.6%) |
| 5 or more Children | 0 (0.0%) | 22 (100.0%) |
| Total | 118 (24.8%) | 112 (22.8%) |
Income Below Poverty Among Married-Couple vs Single-Parent Households in Ephrata borough
The poverty data for Ephrata borough shows that 81 of the married-couple family households (3.1%) and 230 of the single-parent households (23.8%) are living below the poverty level. Within the married-couple family households, those with no children have the highest poverty rate, with 81 households (5.8%) falling below the poverty line. Among the single-parent households, those with 5 or more children have the highest poverty rate, with 22 household (100.0%) living below poverty.
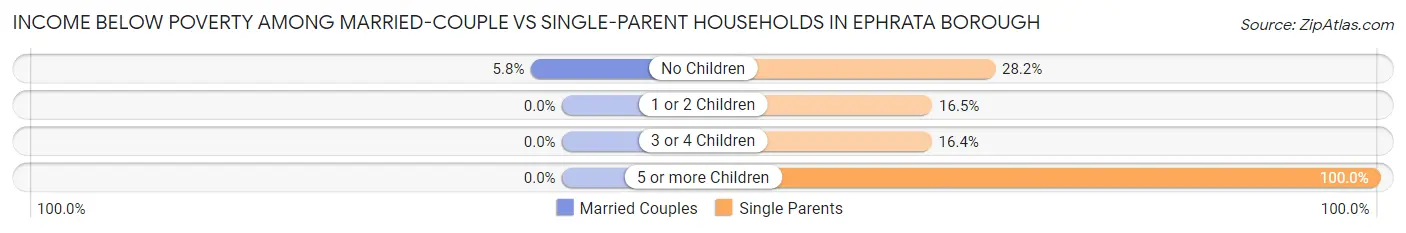
| Children | Married-Couple Families | Single-Parent Households |
| No Children | 81 (5.8%) | 126 (28.2%) |
| 1 or 2 Children | 0 (0.0%) | 72 (16.5%) |
| 3 or 4 Children | 0 (0.0%) | 10 (16.4%) |
| 5 or more Children | 0 (0.0%) | 22 (100.0%) |
| Total | 81 (3.1%) | 230 (23.8%) |
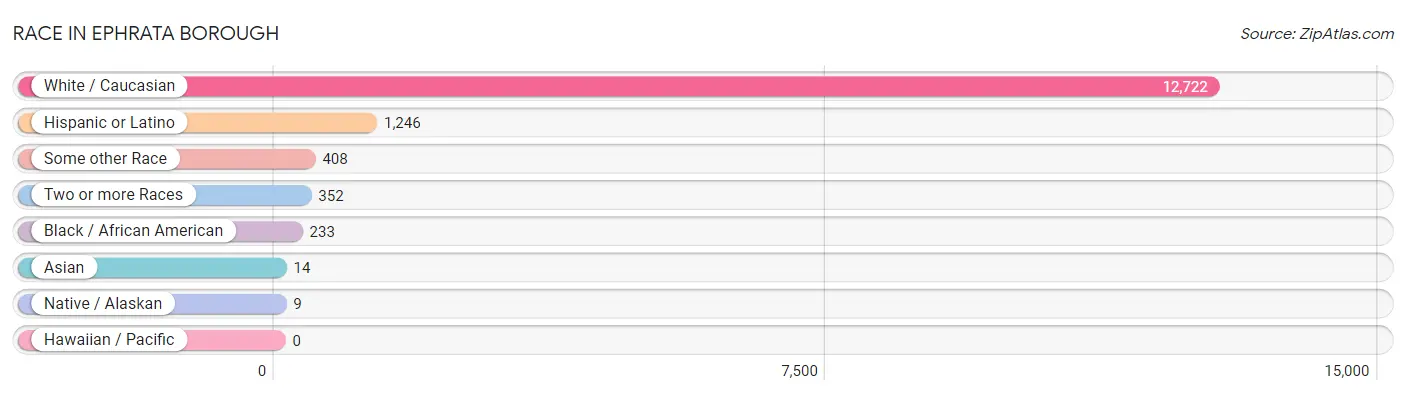
Race in Ephrata borough
The most populous races in Ephrata borough are White / Caucasian (12,722 | 92.6%), Hispanic or Latino (1,246 | 9.1%), and Some other Race (408 | 3.0%).
| Race | # Population | % Population |
| Asian | 14 | 0.1% |
| Black / African American | 233 | 1.7% |
| Hawaiian / Pacific | 0 | 0.0% |
| Hispanic or Latino | 1,246 | 9.1% |
| Native / Alaskan | 9 | 0.1% |
| White / Caucasian | 12,722 | 92.6% |
| Two or more Races | 352 | 2.6% |
| Some other Race | 408 | 3.0% |
| Total | 13,738 | 100.0% |
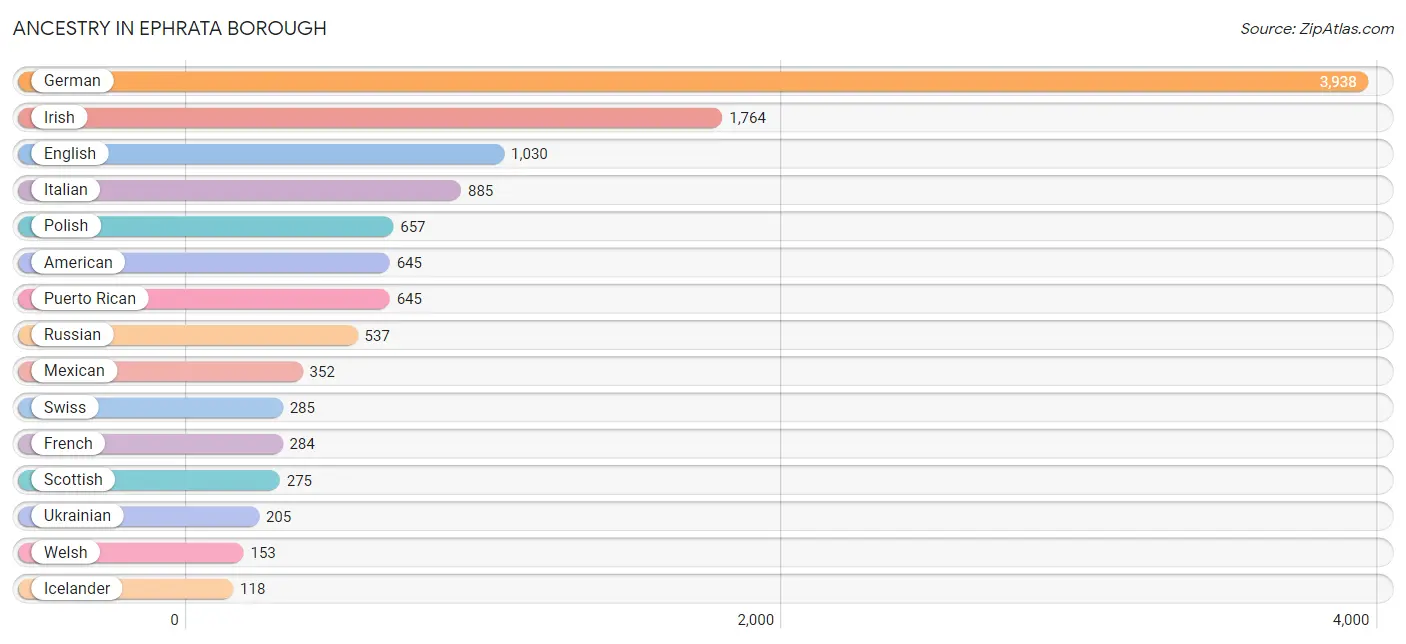
Ancestry in Ephrata borough
The most populous ancestries reported in Ephrata borough are German (3,938 | 28.7%), Irish (1,764 | 12.8%), English (1,030 | 7.5%), Italian (885 | 6.4%), and Polish (657 | 4.8%), together accounting for 60.2% of all Ephrata borough residents.
| Ancestry | # Population | % Population |
| African | 86 | 0.6% |
| American | 645 | 4.7% |
| Austrian | 23 | 0.2% |
| Belgian | 68 | 0.5% |
| Bhutanese | 11 | 0.1% |
| British | 46 | 0.3% |
| Central American | 41 | 0.3% |
| Cherokee | 9 | 0.1% |
| Colombian | 22 | 0.2% |
| Cuban | 115 | 0.8% |
| Czech | 12 | 0.1% |
| Dominican | 27 | 0.2% |
| Dutch | 95 | 0.7% |
| Eastern European | 6 | 0.0% |
| English | 1,030 | 7.5% |
| European | 78 | 0.6% |
| French | 284 | 2.1% |
| French Canadian | 9 | 0.1% |
| German | 3,938 | 28.7% |
| Greek | 13 | 0.1% |
| Hungarian | 31 | 0.2% |
| Icelander | 118 | 0.9% |
| Irish | 1,764 | 12.8% |
| Italian | 885 | 6.4% |
| Korean | 14 | 0.1% |
| Lithuanian | 53 | 0.4% |
| Mexican | 352 | 2.6% |
| Nigerian | 18 | 0.1% |
| Norwegian | 17 | 0.1% |
| Pennsylvania German | 104 | 0.8% |
| Polish | 657 | 4.8% |
| Puerto Rican | 645 | 4.7% |
| Romanian | 38 | 0.3% |
| Russian | 537 | 3.9% |
| Salvadoran | 41 | 0.3% |
| Scandinavian | 38 | 0.3% |
| Scotch-Irish | 45 | 0.3% |
| Scottish | 275 | 2.0% |
| Slovak | 103 | 0.7% |
| South American | 22 | 0.2% |
| Subsaharan African | 104 | 0.8% |
| Swedish | 106 | 0.8% |
| Swiss | 285 | 2.1% |
| Trinidadian and Tobagonian | 53 | 0.4% |
| Ukrainian | 205 | 1.5% |
| Welsh | 153 | 1.1% | View All 46 Rows |
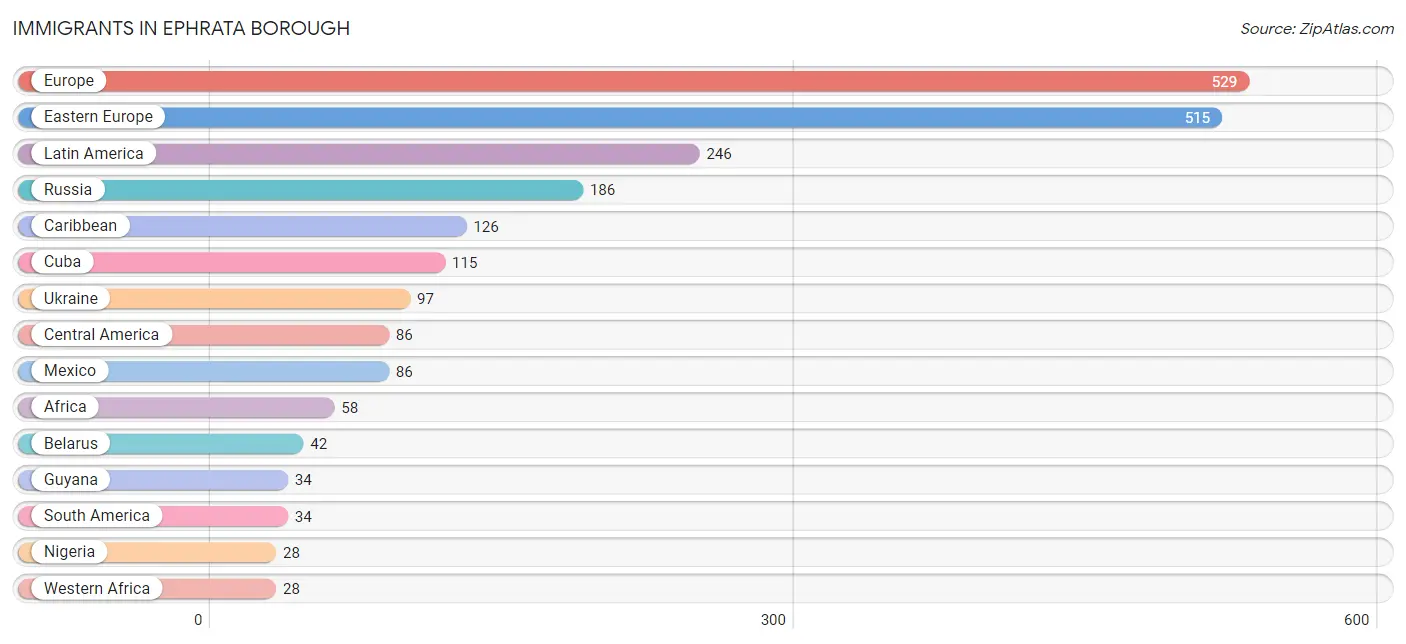
Immigrants in Ephrata borough
The most numerous immigrant groups reported in Ephrata borough came from Europe (529 | 3.8%), Eastern Europe (515 | 3.7%), Latin America (246 | 1.8%), Russia (186 | 1.3%), and Caribbean (126 | 0.9%), together accounting for 11.7% of all Ephrata borough residents.
| Immigration Origin | # Population | % Population |
| Africa | 58 | 0.4% |
| Asia | 14 | 0.1% |
| Belarus | 42 | 0.3% |
| Caribbean | 126 | 0.9% |
| Central America | 86 | 0.6% |
| Cuba | 115 | 0.8% |
| Dominican Republic | 11 | 0.1% |
| Eastern Africa | 18 | 0.1% |
| Eastern Europe | 515 | 3.7% |
| England | 14 | 0.1% |
| Europe | 529 | 3.8% |
| Guyana | 34 | 0.3% |
| Latin America | 246 | 1.8% |
| Mexico | 86 | 0.6% |
| Middle Africa | 12 | 0.1% |
| Moldova | 17 | 0.1% |
| Nigeria | 28 | 0.2% |
| Northern Europe | 14 | 0.1% |
| Philippines | 14 | 0.1% |
| Poland | 7 | 0.1% |
| Russia | 186 | 1.3% |
| South America | 34 | 0.3% |
| South Eastern Asia | 14 | 0.1% |
| Ukraine | 97 | 0.7% |
| Western Africa | 28 | 0.2% |
| Zaire | 12 | 0.1% | View All 26 Rows |
Sex and Age in Ephrata borough
Sex and Age in Ephrata borough
The most populous age groups in Ephrata borough are 35 to 39 Years (780 | 11.1%) for men and 30 to 34 Years (729 | 10.8%) for women.
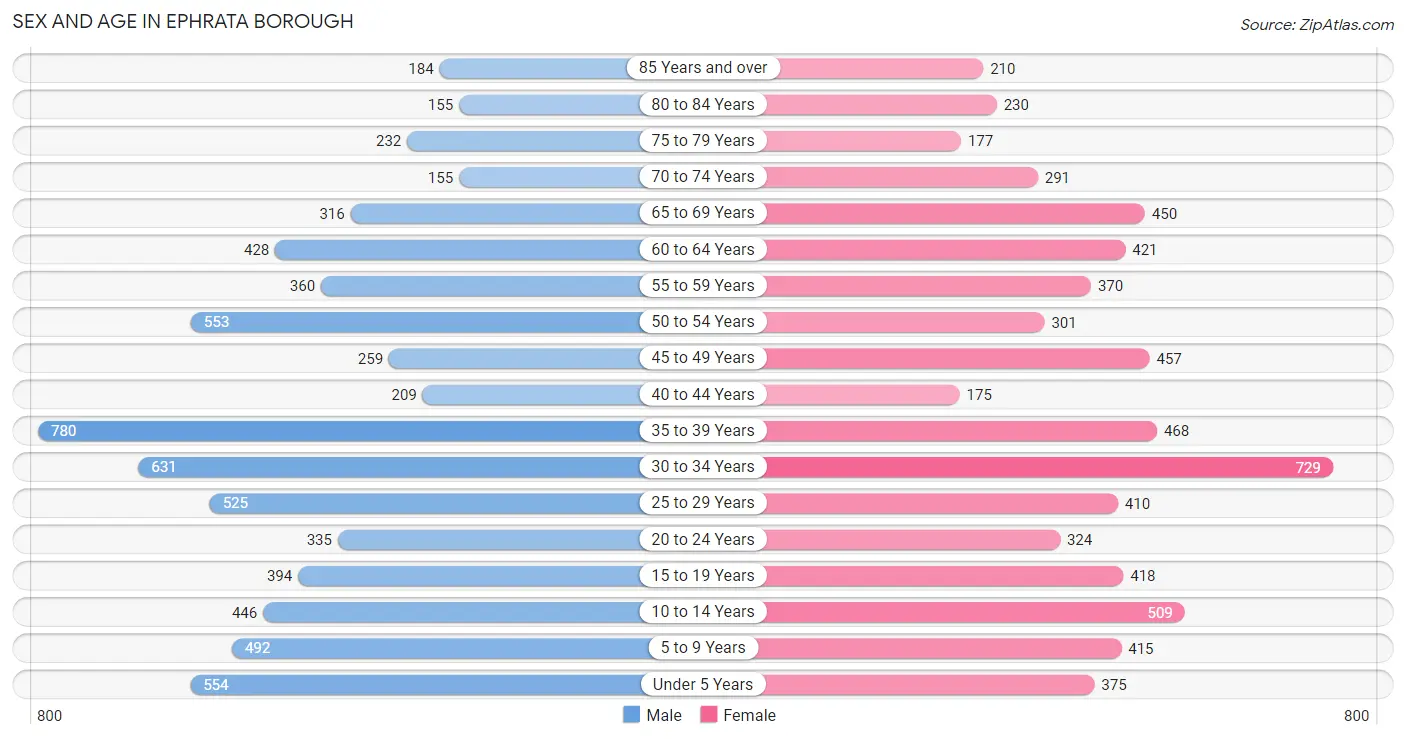
| Age Bracket | Male | Female |
| Under 5 Years | 554 (7.9%) | 375 (5.6%) |
| 5 to 9 Years | 492 (7.0%) | 415 (6.2%) |
| 10 to 14 Years | 446 (6.4%) | 509 (7.6%) |
| 15 to 19 Years | 394 (5.6%) | 418 (6.2%) |
| 20 to 24 Years | 335 (4.8%) | 324 (4.8%) |
| 25 to 29 Years | 525 (7.5%) | 410 (6.1%) |
| 30 to 34 Years | 631 (9.0%) | 729 (10.8%) |
| 35 to 39 Years | 780 (11.1%) | 468 (7.0%) |
| 40 to 44 Years | 209 (3.0%) | 175 (2.6%) |
| 45 to 49 Years | 259 (3.7%) | 457 (6.8%) |
| 50 to 54 Years | 553 (7.9%) | 301 (4.5%) |
| 55 to 59 Years | 360 (5.1%) | 370 (5.5%) |
| 60 to 64 Years | 428 (6.1%) | 421 (6.3%) |
| 65 to 69 Years | 316 (4.5%) | 450 (6.7%) |
| 70 to 74 Years | 155 (2.2%) | 291 (4.3%) |
| 75 to 79 Years | 232 (3.3%) | 177 (2.6%) |
| 80 to 84 Years | 155 (2.2%) | 230 (3.4%) |
| 85 Years and over | 184 (2.6%) | 210 (3.1%) |
| Total | 7,008 (100.0%) | 6,730 (100.0%) |
Families and Households in Ephrata borough
Median Family Size in Ephrata borough
The median family size in Ephrata borough is 2.99 persons per family, with married-couple families (2,648 | 73.3%) accounting for the largest median family size of 3.06 persons per family. On the other hand, single male/father families (476 | 13.2%) represent the smallest median family size with 2.66 persons per family.
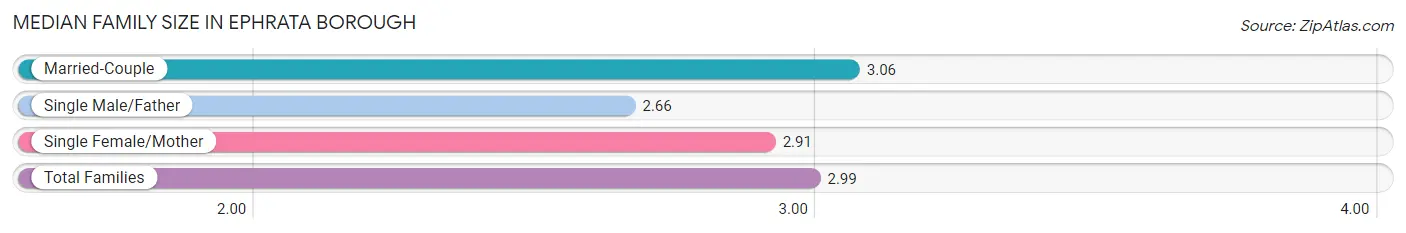
| Family Type | # Families | Family Size |
| Married-Couple | 2,648 (73.3%) | 3.06 |
| Single Male/Father | 476 (13.2%) | 2.66 |
| Single Female/Mother | 491 (13.6%) | 2.91 |
| Total Families | 3,615 (100.0%) | 2.99 |
Median Household Size in Ephrata borough
The median household size in Ephrata borough is 2.37 persons per household, with single female/mother households (491 | 8.5%) accounting for the largest median household size of 3.26 persons per household. non-family households (2,142 | 37.2%) represent the smallest median household size with 1.17 persons per household.
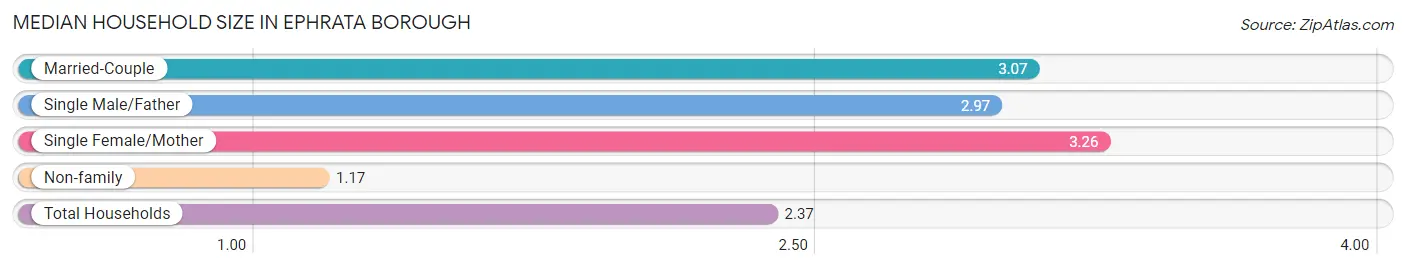
| Household Type | # Households | Household Size |
| Married-Couple | 2,648 (46.0%) | 3.07 |
| Single Male/Father | 476 (8.3%) | 2.97 |
| Single Female/Mother | 491 (8.5%) | 3.26 |
| Non-family | 2,142 (37.2%) | 1.17 |
| Total Households | 5,757 (100.0%) | 2.37 |
Household Size by Marriage Status in Ephrata borough
Out of a total of 5,757 households in Ephrata borough, 3,615 (62.8%) are family households, while 2,142 (37.2%) are nonfamily households. The most numerous type of family households are 2-person households, comprising 1,508, and the most common type of nonfamily households are 1-person households, comprising 1,795.
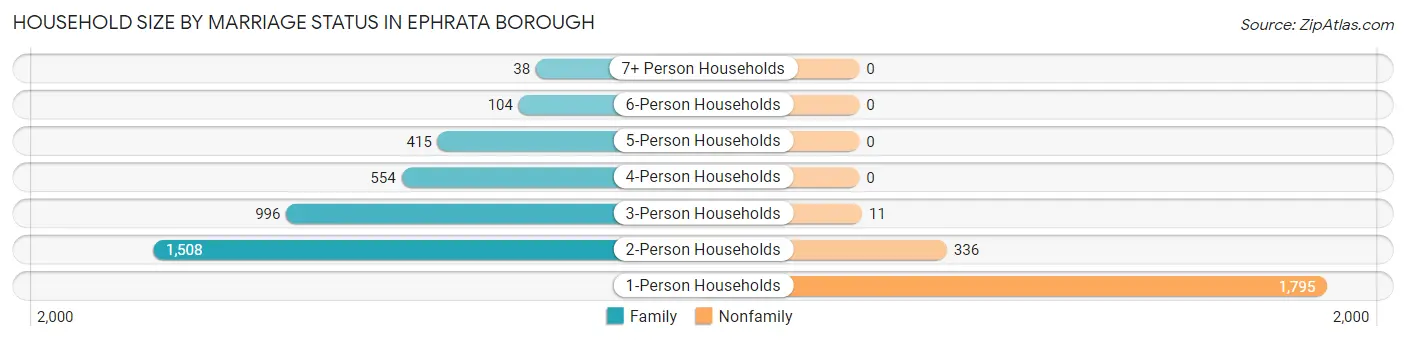
| Household Size | Family Households | Nonfamily Households |
| 1-Person Households | - | 1,795 (31.2%) |
| 2-Person Households | 1,508 (26.2%) | 336 (5.8%) |
| 3-Person Households | 996 (17.3%) | 11 (0.2%) |
| 4-Person Households | 554 (9.6%) | 0 (0.0%) |
| 5-Person Households | 415 (7.2%) | 0 (0.0%) |
| 6-Person Households | 104 (1.8%) | 0 (0.0%) |
| 7+ Person Households | 38 (0.7%) | 0 (0.0%) |
| Total | 3,615 (62.8%) | 2,142 (37.2%) |
Female Fertility in Ephrata borough
Fertility by Age in Ephrata borough
Average fertility rate in Ephrata borough is 58.0 births per 1,000 women. Women in the age bracket of 20 to 34 years have the highest fertility rate with 114.0 births per 1,000 women. Women in the age bracket of 20 to 34 years acount for 93.3% of all women with births.
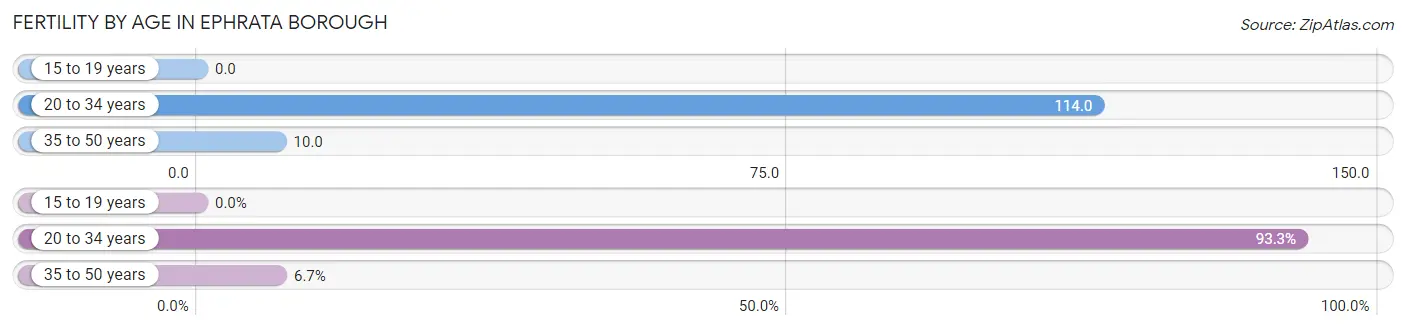
| Age Bracket | Women with Births | Births / 1,000 Women |
| 15 to 19 years | 0 (0.0%) | 0.0 |
| 20 to 34 years | 167 (93.3%) | 114.0 |
| 35 to 50 years | 12 (6.7%) | 10.0 |
| Total | 179 (100.0%) | 58.0 |
Fertility by Age by Marriage Status in Ephrata borough
84.4% of women with births (179) in Ephrata borough are married. The highest percentage of unmarried women with births falls into 35 to 50 years age bracket with 66.7% of them unmarried at the time of birth, while the lowest percentage of unmarried women with births belong to 20 to 34 years age bracket with 12.0% of them unmarried.
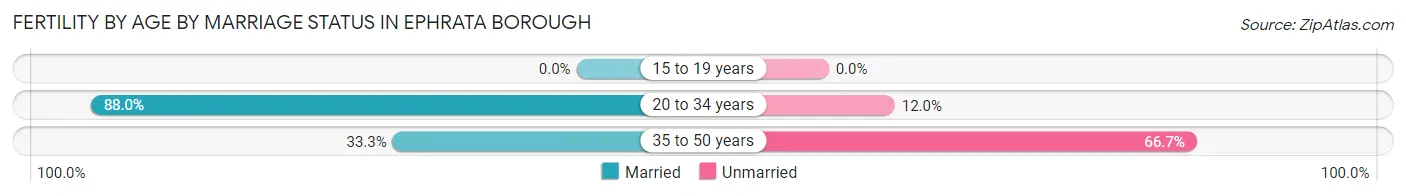
| Age Bracket | Married | Unmarried |
| 15 to 19 years | 0 (0.0%) | 0 (0.0%) |
| 20 to 34 years | 147 (88.0%) | 20 (12.0%) |
| 35 to 50 years | 4 (33.3%) | 8 (66.7%) |
| Total | 151 (84.4%) | 28 (15.6%) |
Fertility by Education in Ephrata borough
Average fertility rate in Ephrata borough is 58.0 births per 1,000 women. Women with the education attainment of bachelor's degree have the highest fertility rate of 120.0 births per 1,000 women, while women with the education attainment of high school diploma have the lowest fertility at 4.0 births per 1,000 women. Women with the education attainment of college or associate's degree represent 43.6% of all women with births.
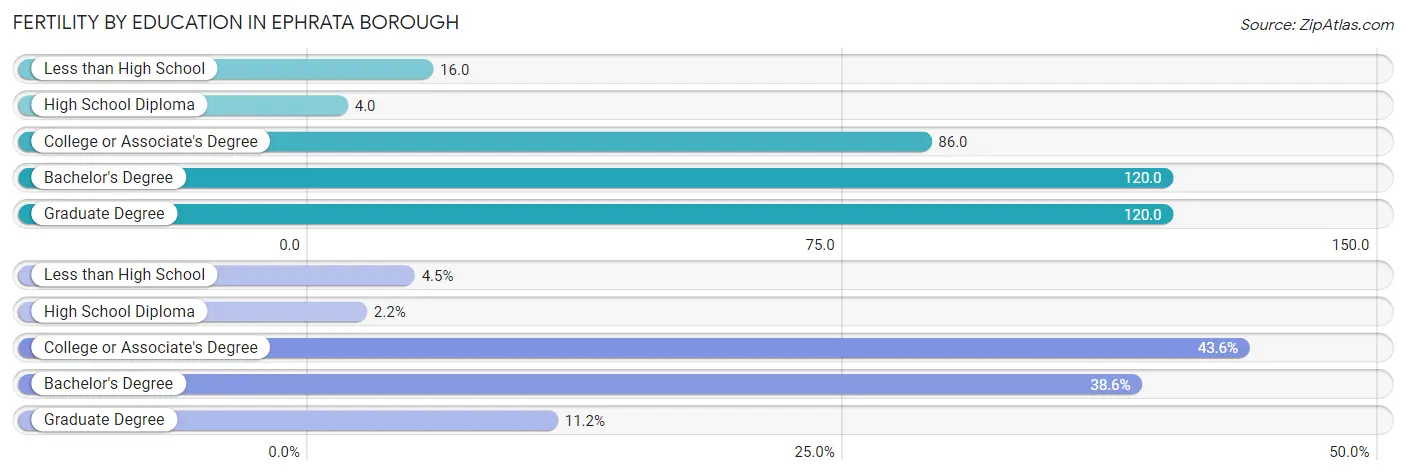
| Educational Attainment | Women with Births | Births / 1,000 Women |
| Less than High School | 8 (4.5%) | 16.0 |
| High School Diploma | 4 (2.2%) | 4.0 |
| College or Associate's Degree | 78 (43.6%) | 86.0 |
| Bachelor's Degree | 69 (38.6%) | 120.0 |
| Graduate Degree | 20 (11.2%) | 120.0 |
| Total | 179 (100.0%) | 58.0 |
Fertility by Education by Marriage Status in Ephrata borough
15.6% of women with births in Ephrata borough are unmarried. Women with the educational attainment of high school diploma are most likely to be married with 100.0% of them married at childbirth, while women with the educational attainment of less than high school are least likely to be married with 100.0% of them unmarried at childbirth.
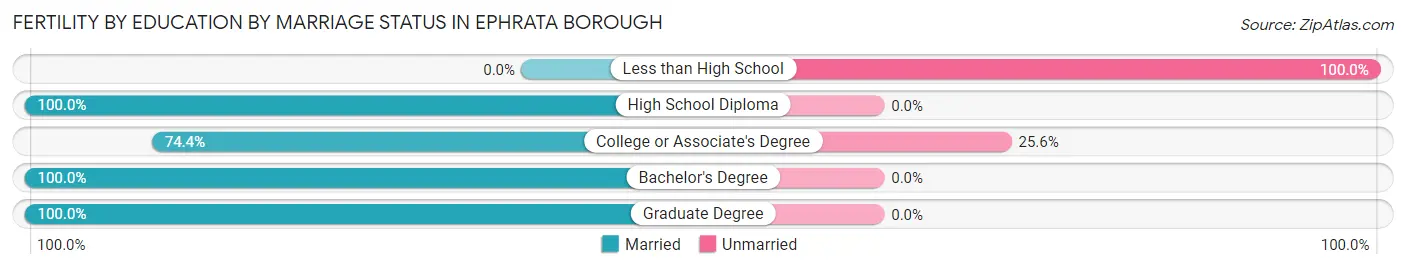
| Educational Attainment | Married | Unmarried |
| Less than High School | 0 (0.0%) | 8 (100.0%) |
| High School Diploma | 4 (100.0%) | 0 (0.0%) |
| College or Associate's Degree | 58 (74.4%) | 20 (25.6%) |
| Bachelor's Degree | 69 (100.0%) | 0 (0.0%) |
| Graduate Degree | 20 (100.0%) | 0 (0.0%) |
| Total | 151 (84.4%) | 28 (15.6%) |
Employment Characteristics in Ephrata borough
Employment by Class of Employer in Ephrata borough
Among the 6,984 employed individuals in Ephrata borough, private company employees (5,310 | 76.0%), not-for-profit organizations (718 | 10.3%), and local government employees (378 | 5.4%) make up the most common classes of employment.
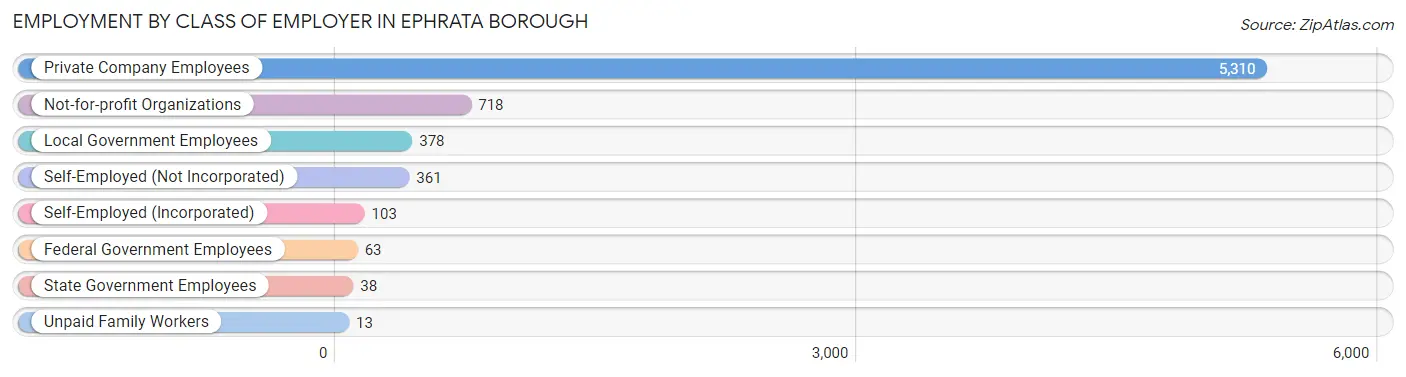
| Employer Class | # Employees | % Employees |
| Private Company Employees | 5,310 | 76.0% |
| Self-Employed (Incorporated) | 103 | 1.5% |
| Self-Employed (Not Incorporated) | 361 | 5.2% |
| Not-for-profit Organizations | 718 | 10.3% |
| Local Government Employees | 378 | 5.4% |
| State Government Employees | 38 | 0.5% |
| Federal Government Employees | 63 | 0.9% |
| Unpaid Family Workers | 13 | 0.2% |
| Total | 6,984 | 100.0% |
Employment Status by Age in Ephrata borough
According to the labor force statistics for Ephrata borough, out of the total population over 16 years of age (10,690), 68.7% or 7,344 individuals are in the labor force, with 3.2% or 235 of them unemployed. The age group with the highest labor force participation rate is 35 to 44 years, with 93.9% or 1,532 individuals in the labor force. Within the labor force, the 16 to 19 years age range has the highest percentage of unemployed individuals, with 17.5% or 65 of them being unemployed.
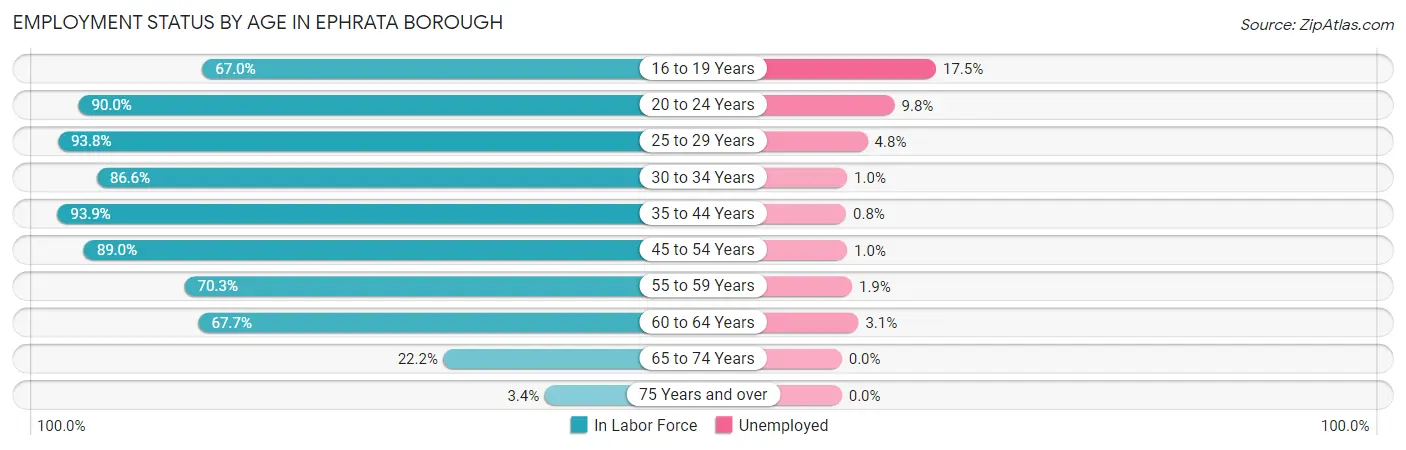
| Age Bracket | In Labor Force | Unemployed |
| 16 to 19 Years | 372 (67.0%) | 65 (17.5%) |
| 20 to 24 Years | 593 (90.0%) | 58 (9.8%) |
| 25 to 29 Years | 877 (93.8%) | 42 (4.8%) |
| 30 to 34 Years | 1,178 (86.6%) | 12 (1.0%) |
| 35 to 44 Years | 1,532 (93.9%) | 12 (0.8%) |
| 45 to 54 Years | 1,397 (89.0%) | 14 (1.0%) |
| 55 to 59 Years | 513 (70.3%) | 10 (1.9%) |
| 60 to 64 Years | 575 (67.7%) | 18 (3.1%) |
| 65 to 74 Years | 269 (22.2%) | 0 (0.0%) |
| 75 Years and over | 40 (3.4%) | 0 (0.0%) |
| Total | 7,344 (68.7%) | 235 (3.2%) |
Employment Status by Educational Attainment in Ephrata borough
According to labor force statistics for Ephrata borough, 85.8% of individuals (6,071) out of the total population between 25 and 64 years of age (7,076) are in the labor force, with 1.8% or 109 of them being unemployed. The group with the highest labor force participation rate are those with the educational attainment of bachelor's degree or higher, with 94.5% or 1,646 individuals in the labor force. Within the labor force, individuals with less than high school education have the highest percentage of unemployment, with 6.7% or 25 of them being unemployed.
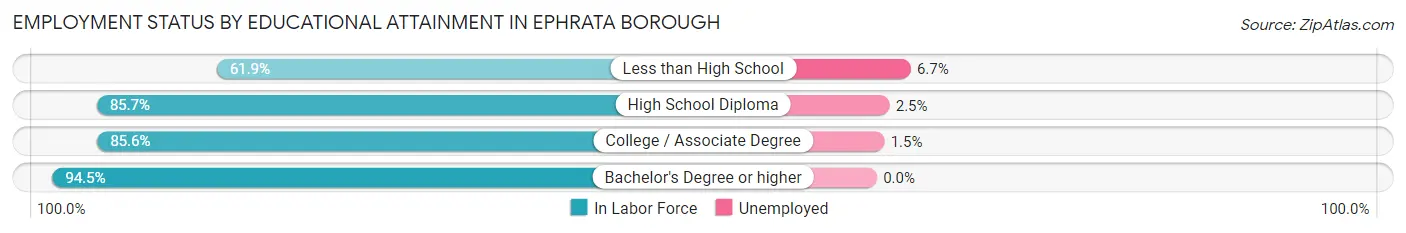
| Educational Attainment | In Labor Force | Unemployed |
| Less than High School | 374 (61.9%) | 40 (6.7%) |
| High School Diploma | 2,354 (85.7%) | 69 (2.5%) |
| College / Associate Degree | 1,697 (85.6%) | 30 (1.5%) |
| Bachelor's Degree or higher | 1,646 (94.5%) | 0 (0.0%) |
| Total | 6,071 (85.8%) | 127 (1.8%) |
Employment Occupations by Sex in Ephrata borough
Management, Business, Science and Arts Occupations
The most common Management, Business, Science and Arts occupations in Ephrata borough are Community & Social Service (715 | 10.1%), Health Diagnosing & Treating (432 | 6.1%), Education Instruction & Library (381 | 5.4%), Computers, Engineering & Science (323 | 4.5%), and Management (309 | 4.3%).
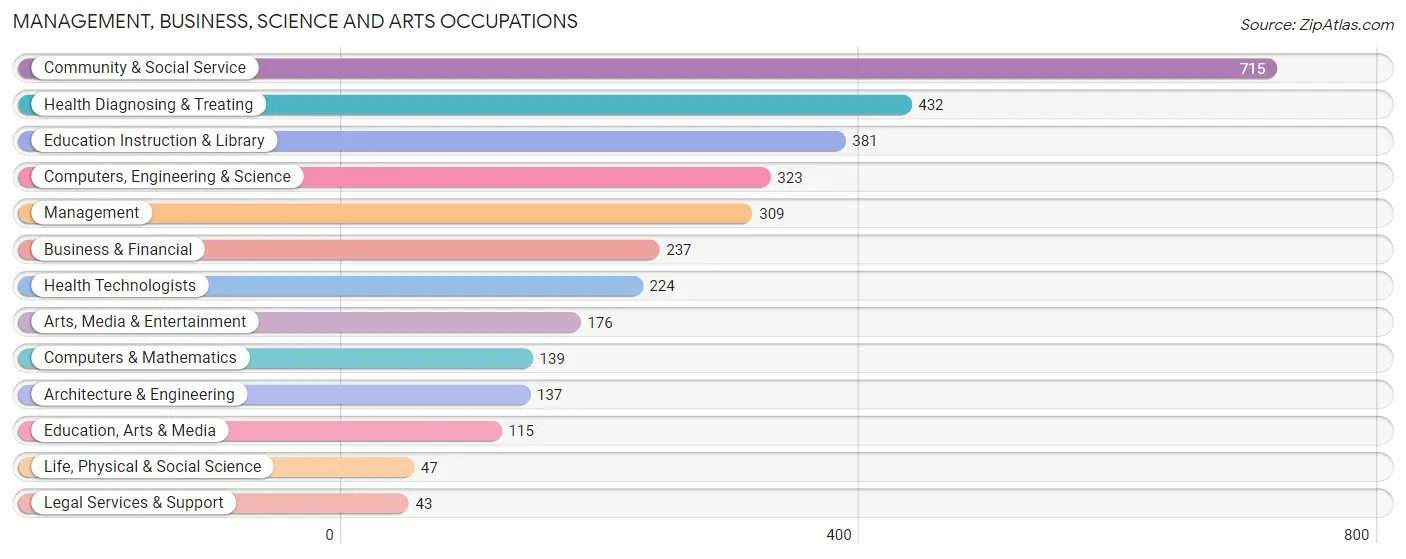
Management, Business, Science and Arts Occupations by Sex
Within the Management, Business, Science and Arts occupations in Ephrata borough, the most male-oriented occupations are Architecture & Engineering (100.0%), Computers & Mathematics (94.2%), and Computers, Engineering & Science (87.3%), while the most female-oriented occupations are Legal Services & Support (100.0%), Education Instruction & Library (85.0%), and Health Diagnosing & Treating (77.5%).
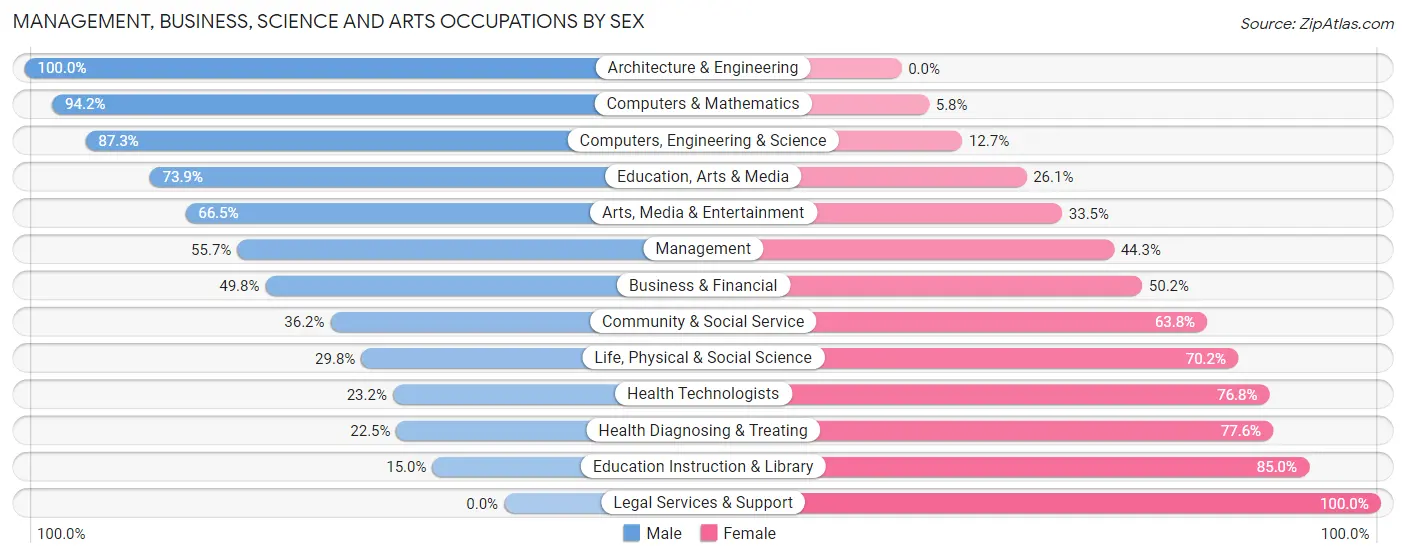
| Occupation | Male | Female |
| Management | 172 (55.7%) | 137 (44.3%) |
| Business & Financial | 118 (49.8%) | 119 (50.2%) |
| Computers, Engineering & Science | 282 (87.3%) | 41 (12.7%) |
| Computers & Mathematics | 131 (94.2%) | 8 (5.8%) |
| Architecture & Engineering | 137 (100.0%) | 0 (0.0%) |
| Life, Physical & Social Science | 14 (29.8%) | 33 (70.2%) |
| Community & Social Service | 259 (36.2%) | 456 (63.8%) |
| Education, Arts & Media | 85 (73.9%) | 30 (26.1%) |
| Legal Services & Support | 0 (0.0%) | 43 (100.0%) |
| Education Instruction & Library | 57 (15.0%) | 324 (85.0%) |
| Arts, Media & Entertainment | 117 (66.5%) | 59 (33.5%) |
| Health Diagnosing & Treating | 97 (22.5%) | 335 (77.5%) |
| Health Technologists | 52 (23.2%) | 172 (76.8%) |
| Total (Category) | 928 (46.0%) | 1,088 (54.0%) |
| Total (Overall) | 3,939 (55.4%) | 3,175 (44.6%) |
Services Occupations
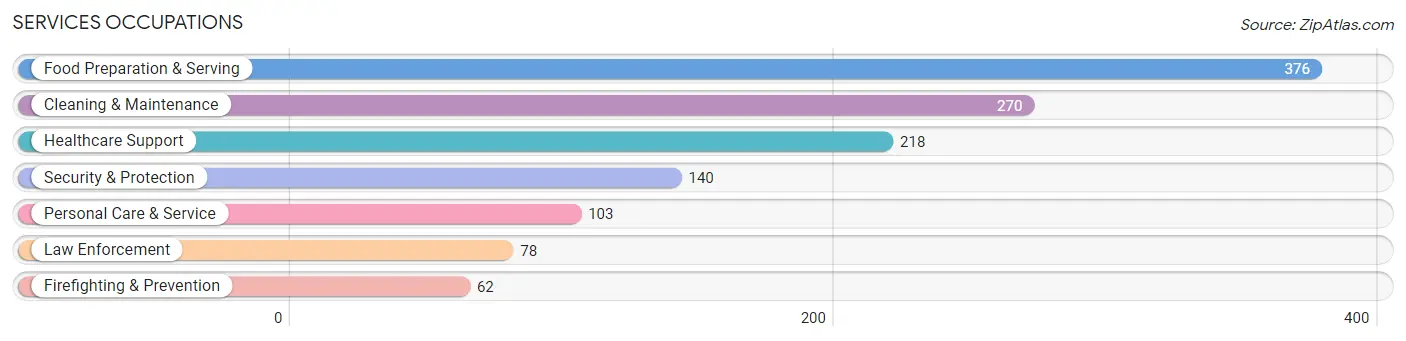
The most common Services occupations in Ephrata borough are Food Preparation & Serving (376 | 5.3%), Cleaning & Maintenance (270 | 3.8%), Healthcare Support (218 | 3.1%), Security & Protection (140 | 2.0%), and Personal Care & Service (103 | 1.5%).
Services Occupations by Sex
Within the Services occupations in Ephrata borough, the most male-oriented occupations are Firefighting & Prevention (80.6%), Cleaning & Maintenance (76.3%), and Security & Protection (61.4%), while the most female-oriented occupations are Healthcare Support (100.0%), Personal Care & Service (88.3%), and Law Enforcement (53.8%).
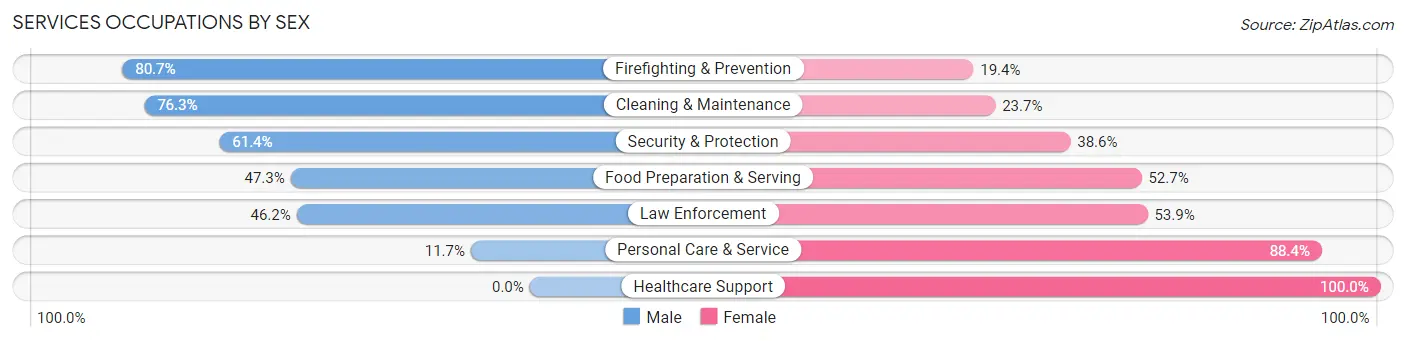
| Occupation | Male | Female |
| Healthcare Support | 0 (0.0%) | 218 (100.0%) |
| Security & Protection | 86 (61.4%) | 54 (38.6%) |
| Firefighting & Prevention | 50 (80.6%) | 12 (19.4%) |
| Law Enforcement | 36 (46.2%) | 42 (53.8%) |
| Food Preparation & Serving | 178 (47.3%) | 198 (52.7%) |
| Cleaning & Maintenance | 206 (76.3%) | 64 (23.7%) |
| Personal Care & Service | 12 (11.7%) | 91 (88.3%) |
| Total (Category) | 482 (43.5%) | 625 (56.5%) |
| Total (Overall) | 3,939 (55.4%) | 3,175 (44.6%) |
Sales and Office Occupations
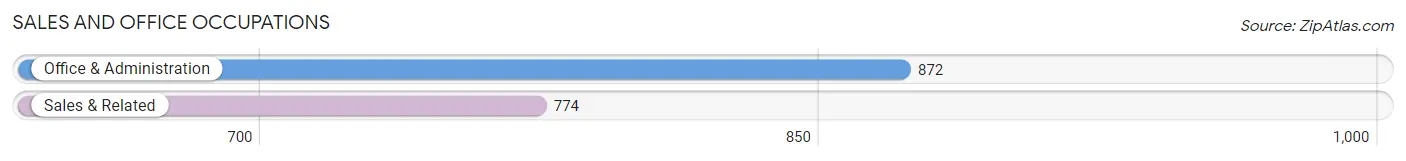
The most common Sales and Office occupations in Ephrata borough are Office & Administration (872 | 12.3%), and Sales & Related (774 | 10.9%).
Sales and Office Occupations by Sex
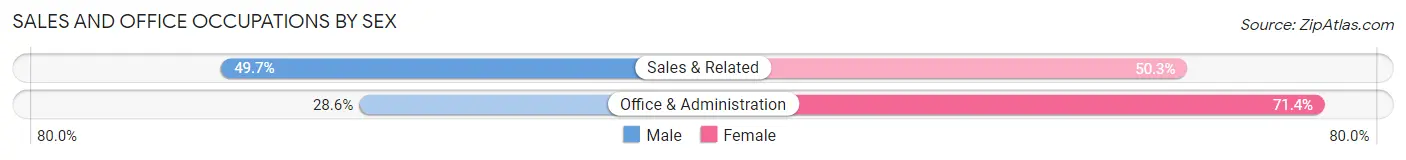
| Occupation | Male | Female |
| Sales & Related | 385 (49.7%) | 389 (50.3%) |
| Office & Administration | 249 (28.6%) | 623 (71.4%) |
| Total (Category) | 634 (38.5%) | 1,012 (61.5%) |
| Total (Overall) | 3,939 (55.4%) | 3,175 (44.6%) |
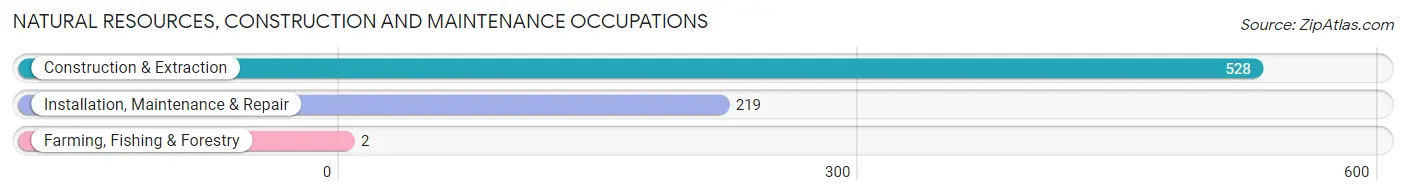
Natural Resources, Construction and Maintenance Occupations
The most common Natural Resources, Construction and Maintenance occupations in Ephrata borough are Construction & Extraction (528 | 7.4%), Installation, Maintenance & Repair (219 | 3.1%), and Farming, Fishing & Forestry (2 | 0.0%).
Natural Resources, Construction and Maintenance Occupations by Sex
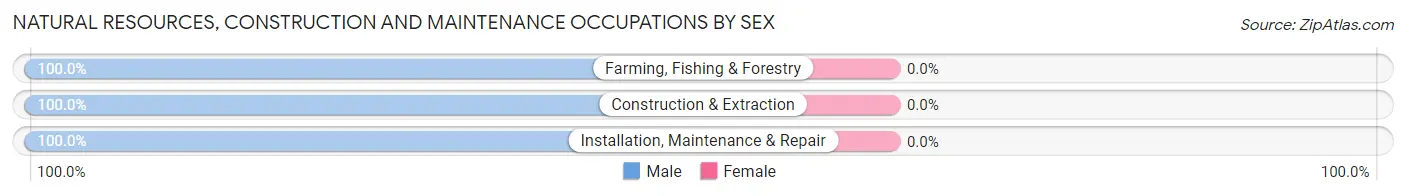
| Occupation | Male | Female |
| Farming, Fishing & Forestry | 2 (100.0%) | 0 (0.0%) |
| Construction & Extraction | 528 (100.0%) | 0 (0.0%) |
| Installation, Maintenance & Repair | 219 (100.0%) | 0 (0.0%) |
| Total (Category) | 749 (100.0%) | 0 (0.0%) |
| Total (Overall) | 3,939 (55.4%) | 3,175 (44.6%) |
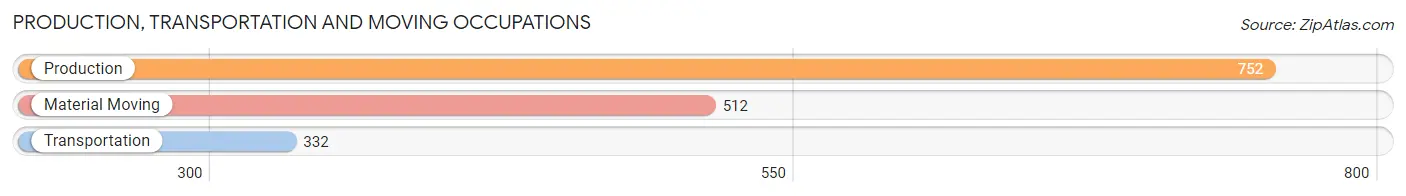
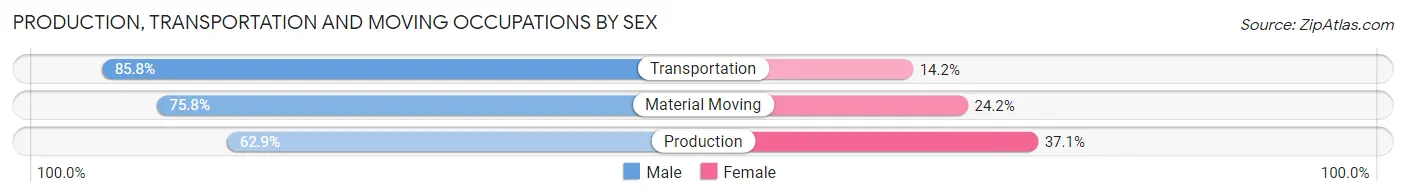
Production, Transportation and Moving Occupations
The most common Production, Transportation and Moving occupations in Ephrata borough are Production (752 | 10.6%), Material Moving (512 | 7.2%), and Transportation (332 | 4.7%).
Production, Transportation and Moving Occupations by Sex
| Occupation | Male | Female |
| Production | 473 (62.9%) | 279 (37.1%) |
| Transportation | 285 (85.8%) | 47 (14.2%) |
| Material Moving | 388 (75.8%) | 124 (24.2%) |
| Total (Category) | 1,146 (71.8%) | 450 (28.2%) |
| Total (Overall) | 3,939 (55.4%) | 3,175 (44.6%) |
Employment Industries by Sex in Ephrata borough
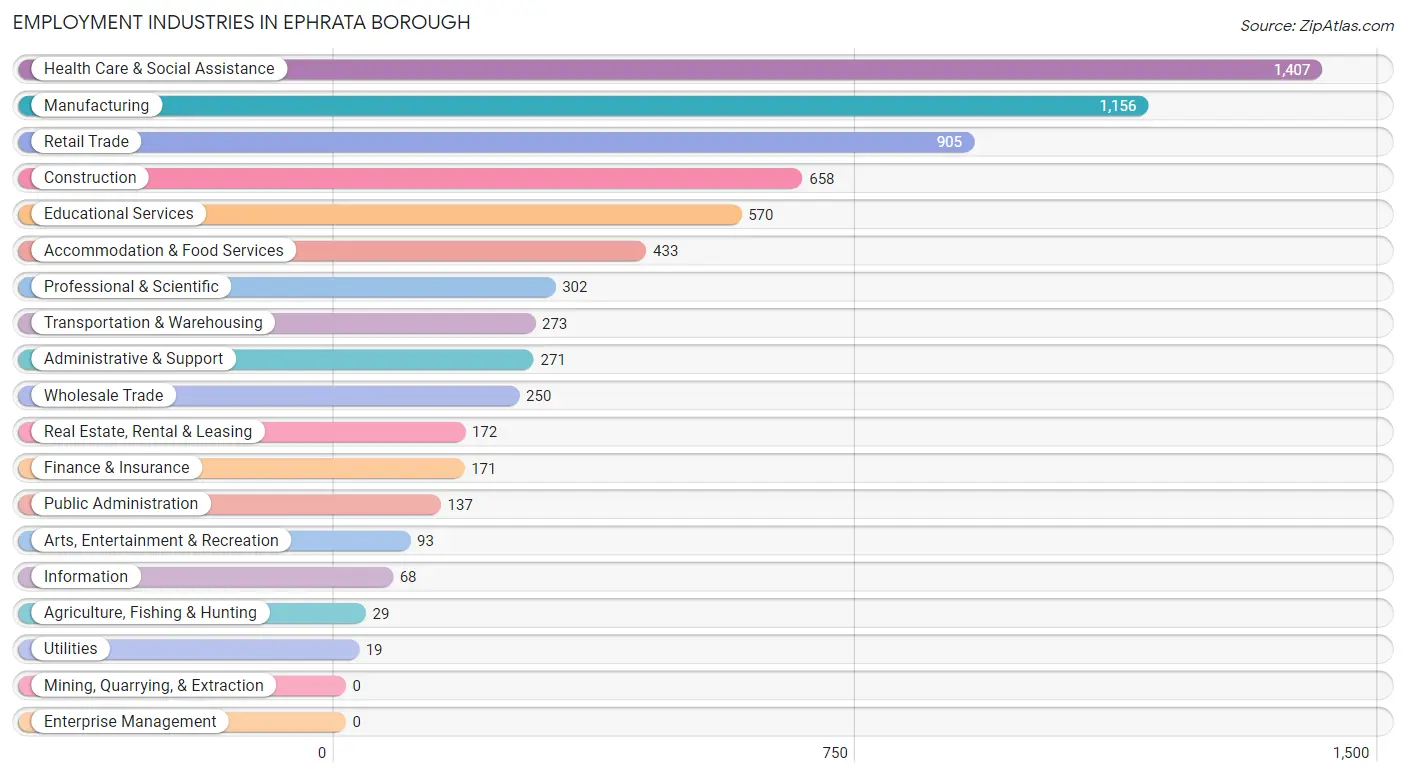
Employment Industries in Ephrata borough
The major employment industries in Ephrata borough include Health Care & Social Assistance (1,407 | 19.8%), Manufacturing (1,156 | 16.3%), Retail Trade (905 | 12.7%), Construction (658 | 9.2%), and Educational Services (570 | 8.0%).
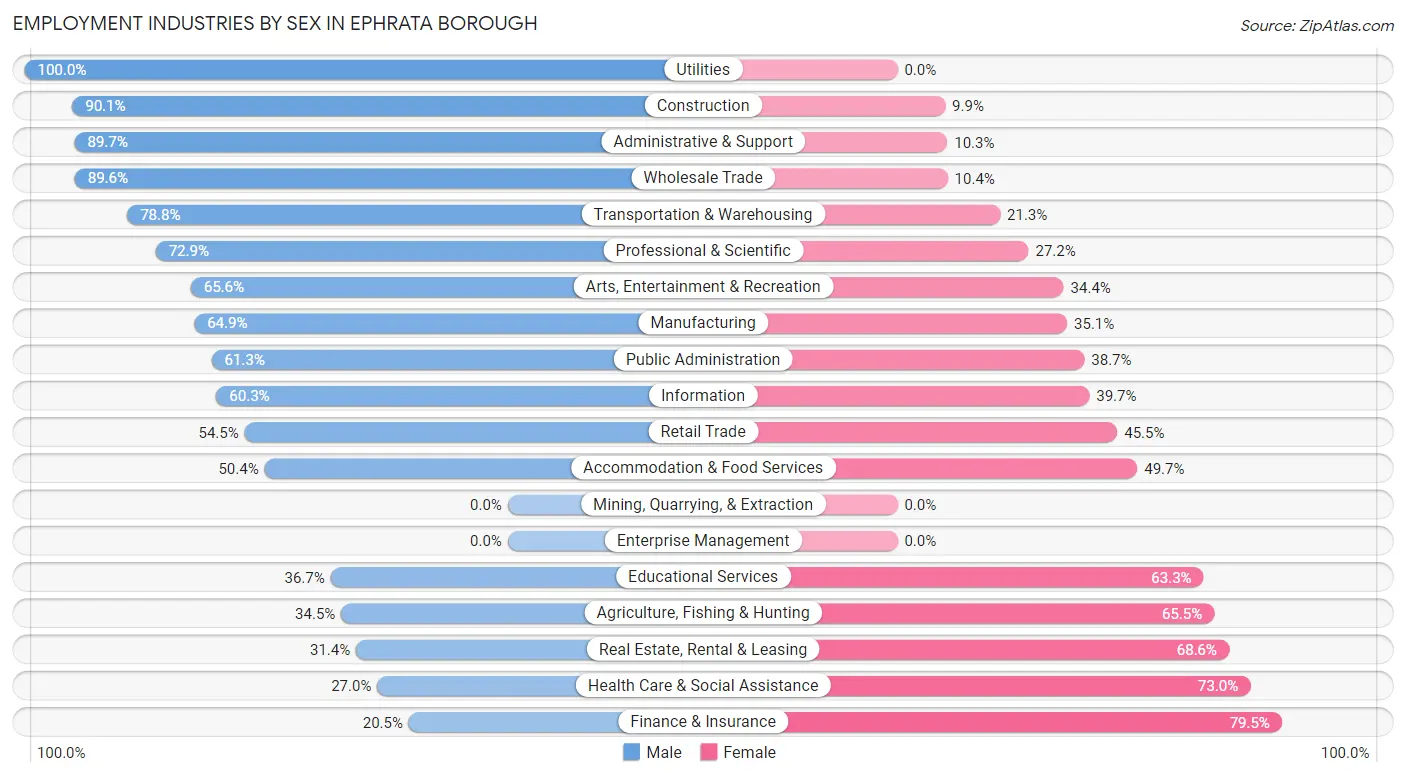
Employment Industries by Sex in Ephrata borough
The Ephrata borough industries that see more men than women are Utilities (100.0%), Construction (90.1%), and Administrative & Support (89.7%), whereas the industries that tend to have a higher number of women are Finance & Insurance (79.5%), Health Care & Social Assistance (73.0%), and Real Estate, Rental & Leasing (68.6%).
| Industry | Male | Female |
| Agriculture, Fishing & Hunting | 10 (34.5%) | 19 (65.5%) |
| Mining, Quarrying, & Extraction | 0 (0.0%) | 0 (0.0%) |
| Construction | 593 (90.1%) | 65 (9.9%) |
| Manufacturing | 750 (64.9%) | 406 (35.1%) |
| Wholesale Trade | 224 (89.6%) | 26 (10.4%) |
| Retail Trade | 493 (54.5%) | 412 (45.5%) |
| Transportation & Warehousing | 215 (78.7%) | 58 (21.2%) |
| Utilities | 19 (100.0%) | 0 (0.0%) |
| Information | 41 (60.3%) | 27 (39.7%) |
| Finance & Insurance | 35 (20.5%) | 136 (79.5%) |
| Real Estate, Rental & Leasing | 54 (31.4%) | 118 (68.6%) |
| Professional & Scientific | 220 (72.9%) | 82 (27.2%) |
| Enterprise Management | 0 (0.0%) | 0 (0.0%) |
| Administrative & Support | 243 (89.7%) | 28 (10.3%) |
| Educational Services | 209 (36.7%) | 361 (63.3%) |
| Health Care & Social Assistance | 380 (27.0%) | 1,027 (73.0%) |
| Arts, Entertainment & Recreation | 61 (65.6%) | 32 (34.4%) |
| Accommodation & Food Services | 218 (50.3%) | 215 (49.6%) |
| Public Administration | 84 (61.3%) | 53 (38.7%) |
| Total | 3,939 (55.4%) | 3,175 (44.6%) |
Education in Ephrata borough
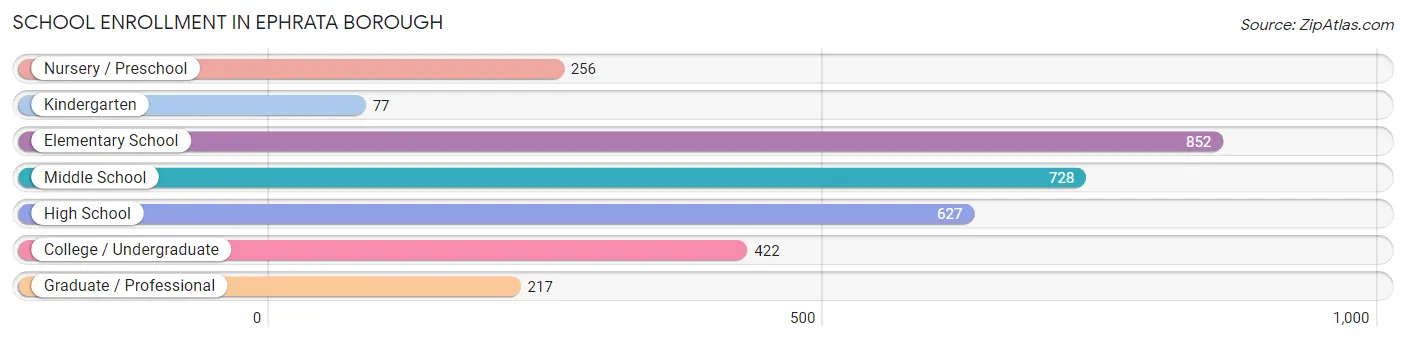
School Enrollment in Ephrata borough
The most common levels of schooling among the 3,179 students in Ephrata borough are elementary school (852 | 26.8%), middle school (728 | 22.9%), and high school (627 | 19.7%).
| School Level | # Students | % Students |
| Nursery / Preschool | 256 | 8.1% |
| Kindergarten | 77 | 2.4% |
| Elementary School | 852 | 26.8% |
| Middle School | 728 | 22.9% |
| High School | 627 | 19.7% |
| College / Undergraduate | 422 | 13.3% |
| Graduate / Professional | 217 | 6.8% |
| Total | 3,179 | 100.0% |
School Enrollment by Age by Funding Source in Ephrata borough
Out of a total of 3,179 students who are enrolled in schools in Ephrata borough, 474 (14.9%) attend a private institution, while the remaining 2,705 (85.1%) are enrolled in public schools. The age group of 25 to 34 year olds has the highest likelihood of being enrolled in private schools, with 144 (87.8% in the age bracket) enrolled. Conversely, the age group of 3 to 4 year olds has the lowest likelihood of being enrolled in a private school, with 197 (97.5% in the age bracket) attending a public institution.
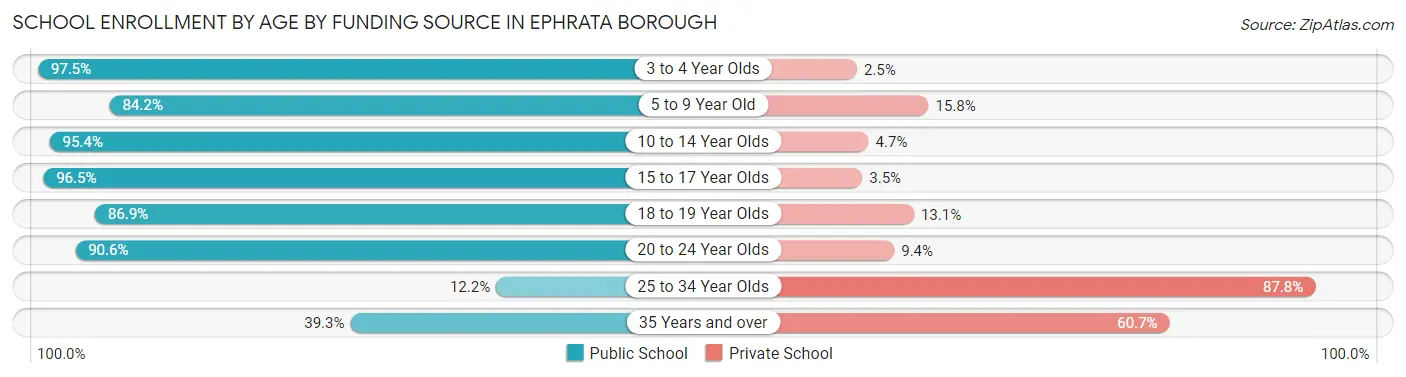
| Age Bracket | Public School | Private School |
| 3 to 4 Year Olds | 197 (97.5%) | 5 (2.5%) |
| 5 to 9 Year Old | 713 (84.2%) | 134 (15.8%) |
| 10 to 14 Year Olds | 902 (95.4%) | 44 (4.6%) |
| 15 to 17 Year Olds | 472 (96.5%) | 17 (3.5%) |
| 18 to 19 Year Olds | 73 (86.9%) | 11 (13.1%) |
| 20 to 24 Year Olds | 269 (90.6%) | 28 (9.4%) |
| 25 to 34 Year Olds | 20 (12.2%) | 144 (87.8%) |
| 35 Years and over | 59 (39.3%) | 91 (60.7%) |
| Total | 2,705 (85.1%) | 474 (14.9%) |
Educational Attainment by Field of Study in Ephrata borough
Education (424 | 17.3%), science & technology (267 | 10.9%), arts & humanities (246 | 10.0%), business (227 | 9.2%), and literature & languages (206 | 8.4%) are the most common fields of study among 2,457 individuals in Ephrata borough who have obtained a bachelor's degree or higher.
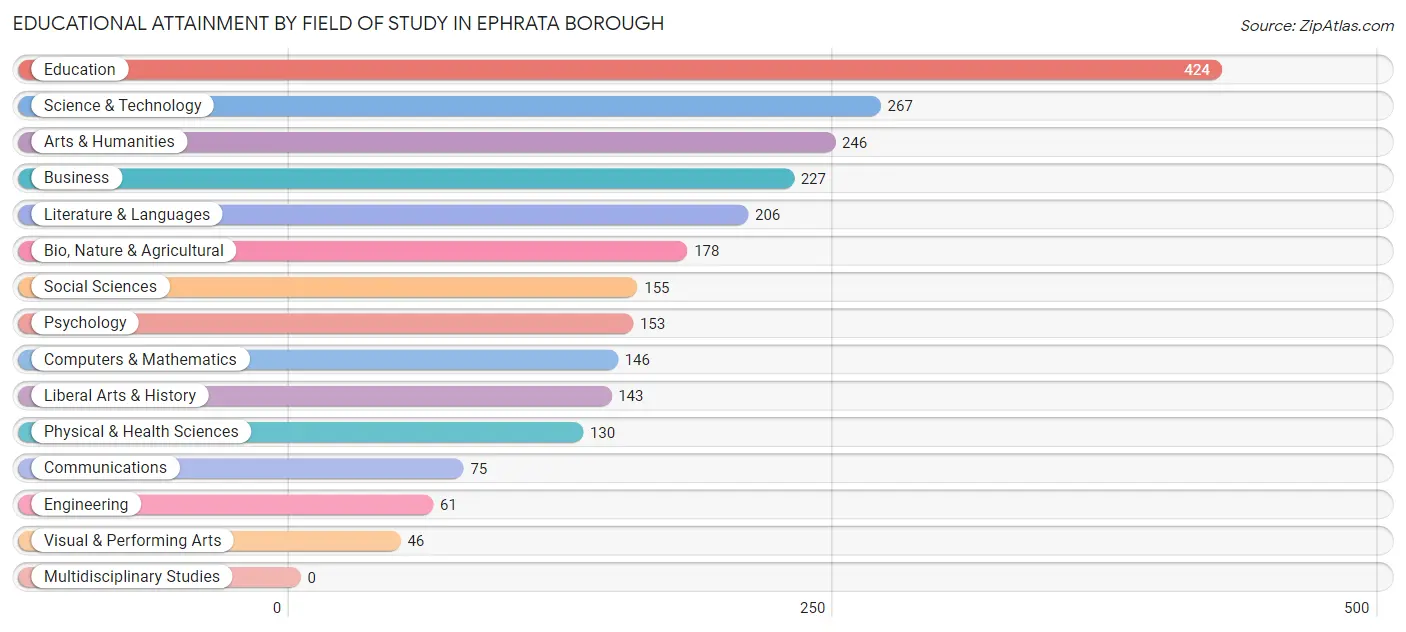
| Field of Study | # Graduates | % Graduates |
| Computers & Mathematics | 146 | 5.9% |
| Bio, Nature & Agricultural | 178 | 7.2% |
| Physical & Health Sciences | 130 | 5.3% |
| Psychology | 153 | 6.2% |
| Social Sciences | 155 | 6.3% |
| Engineering | 61 | 2.5% |
| Multidisciplinary Studies | 0 | 0.0% |
| Science & Technology | 267 | 10.9% |
| Business | 227 | 9.2% |
| Education | 424 | 17.3% |
| Literature & Languages | 206 | 8.4% |
| Liberal Arts & History | 143 | 5.8% |
| Visual & Performing Arts | 46 | 1.9% |
| Communications | 75 | 3.0% |
| Arts & Humanities | 246 | 10.0% |
| Total | 2,457 | 100.0% |
Transportation & Commute in Ephrata borough
Vehicle Availability by Sex in Ephrata borough
The most prevalent vehicle ownership categories in Ephrata borough are males with 2 vehicles (1,741, accounting for 44.7%) and females with 2 vehicles (1,313, making up 56.5%).
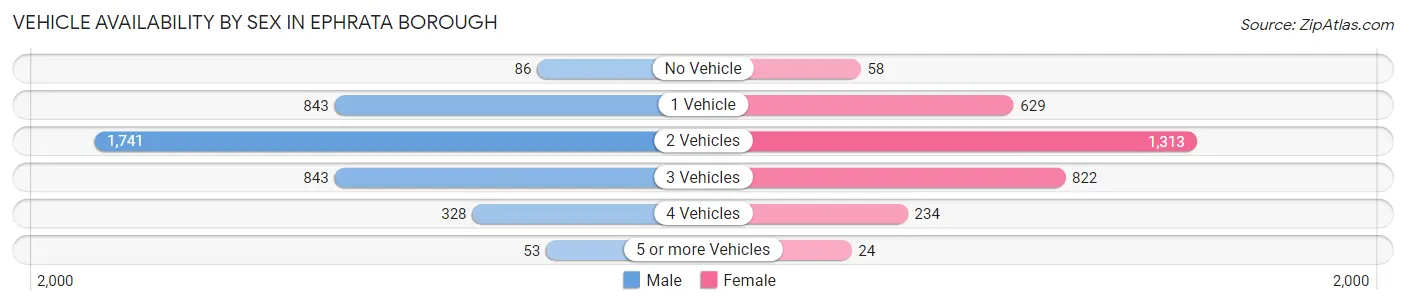
| Vehicles Available | Male | Female |
| No Vehicle | 86 (2.2%) | 58 (1.9%) |
| 1 Vehicle | 843 (21.6%) | 629 (20.4%) |
| 2 Vehicles | 1,741 (44.7%) | 1,313 (42.6%) |
| 3 Vehicles | 843 (21.6%) | 822 (26.7%) |
| 4 Vehicles | 328 (8.4%) | 234 (7.6%) |
| 5 or more Vehicles | 53 (1.4%) | 24 (0.8%) |
| Total | 3,894 (100.0%) | 3,080 (100.0%) |
Commute Time in Ephrata borough
The most frequently occuring commute durations in Ephrata borough are 20 to 24 minutes (1,059 commuters, 15.8%), 30 to 34 minutes (1,059 commuters, 15.8%), and 5 to 9 minutes (884 commuters, 13.2%).
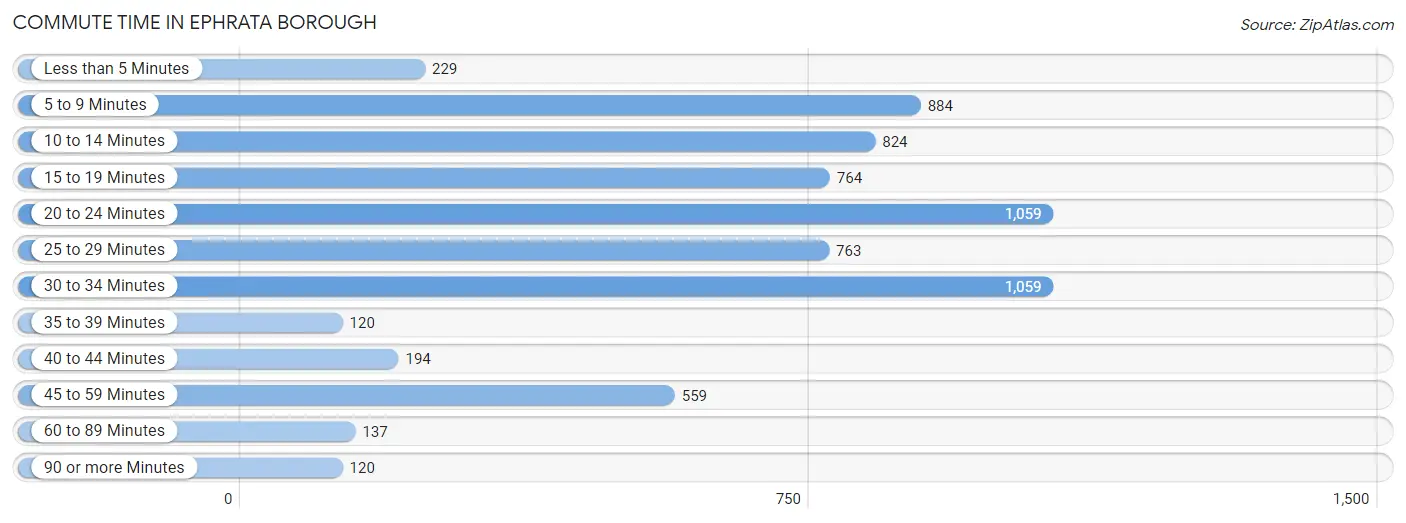
| Commute Time | # Commuters | % Commuters |
| Less than 5 Minutes | 229 | 3.4% |
| 5 to 9 Minutes | 884 | 13.2% |
| 10 to 14 Minutes | 824 | 12.3% |
| 15 to 19 Minutes | 764 | 11.4% |
| 20 to 24 Minutes | 1,059 | 15.8% |
| 25 to 29 Minutes | 763 | 11.4% |
| 30 to 34 Minutes | 1,059 | 15.8% |
| 35 to 39 Minutes | 120 | 1.8% |
| 40 to 44 Minutes | 194 | 2.9% |
| 45 to 59 Minutes | 559 | 8.3% |
| 60 to 89 Minutes | 137 | 2.0% |
| 90 or more Minutes | 120 | 1.8% |
Commute Time by Sex in Ephrata borough
The most common commute times in Ephrata borough are 20 to 24 minutes (657 commuters, 17.4%) for males and 30 to 34 minutes (566 commuters, 19.2%) for females.
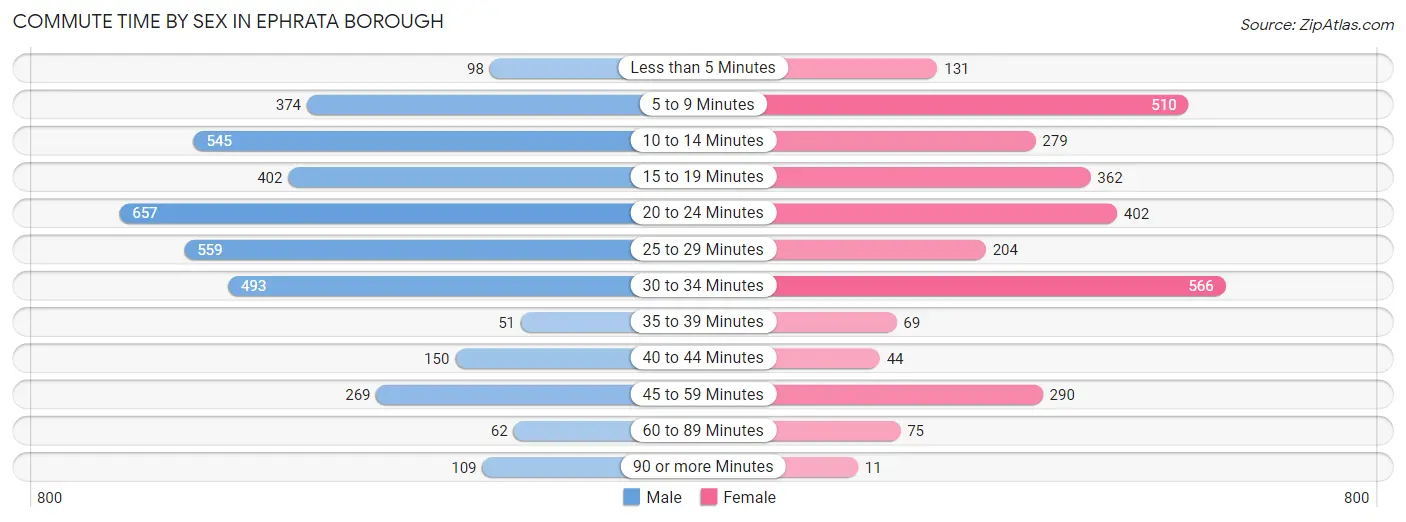
| Commute Time | Male | Female |
| Less than 5 Minutes | 98 (2.6%) | 131 (4.4%) |
| 5 to 9 Minutes | 374 (9.9%) | 510 (17.3%) |
| 10 to 14 Minutes | 545 (14.5%) | 279 (9.5%) |
| 15 to 19 Minutes | 402 (10.7%) | 362 (12.3%) |
| 20 to 24 Minutes | 657 (17.4%) | 402 (13.7%) |
| 25 to 29 Minutes | 559 (14.8%) | 204 (6.9%) |
| 30 to 34 Minutes | 493 (13.1%) | 566 (19.2%) |
| 35 to 39 Minutes | 51 (1.3%) | 69 (2.3%) |
| 40 to 44 Minutes | 150 (4.0%) | 44 (1.5%) |
| 45 to 59 Minutes | 269 (7.1%) | 290 (9.9%) |
| 60 to 89 Minutes | 62 (1.6%) | 75 (2.5%) |
| 90 or more Minutes | 109 (2.9%) | 11 (0.4%) |
Time of Departure to Work by Sex in Ephrata borough
The most frequent times of departure to work in Ephrata borough are 6:30 AM to 6:59 AM (506, 13.4%) for males and 7:00 AM to 7:29 AM (634, 21.5%) for females.
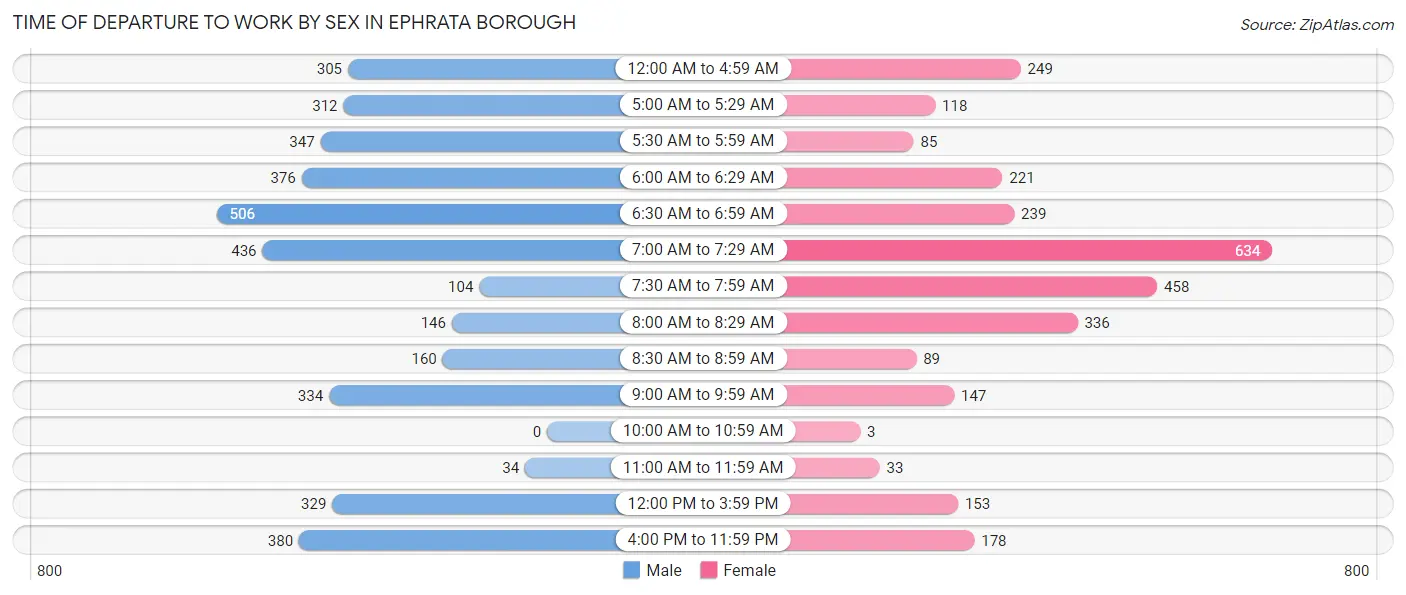
| Time of Departure | Male | Female |
| 12:00 AM to 4:59 AM | 305 (8.1%) | 249 (8.5%) |
| 5:00 AM to 5:29 AM | 312 (8.3%) | 118 (4.0%) |
| 5:30 AM to 5:59 AM | 347 (9.2%) | 85 (2.9%) |
| 6:00 AM to 6:29 AM | 376 (10.0%) | 221 (7.5%) |
| 6:30 AM to 6:59 AM | 506 (13.4%) | 239 (8.1%) |
| 7:00 AM to 7:29 AM | 436 (11.6%) | 634 (21.5%) |
| 7:30 AM to 7:59 AM | 104 (2.8%) | 458 (15.6%) |
| 8:00 AM to 8:29 AM | 146 (3.9%) | 336 (11.4%) |
| 8:30 AM to 8:59 AM | 160 (4.3%) | 89 (3.0%) |
| 9:00 AM to 9:59 AM | 334 (8.9%) | 147 (5.0%) |
| 10:00 AM to 10:59 AM | 0 (0.0%) | 3 (0.1%) |
| 11:00 AM to 11:59 AM | 34 (0.9%) | 33 (1.1%) |
| 12:00 PM to 3:59 PM | 329 (8.7%) | 153 (5.2%) |
| 4:00 PM to 11:59 PM | 380 (10.1%) | 178 (6.0%) |
| Total | 3,769 (100.0%) | 2,943 (100.0%) |
Housing Occupancy in Ephrata borough
Occupancy by Ownership in Ephrata borough
Of the total 5,757 dwellings in Ephrata borough, owner-occupied units account for 3,099 (53.8%), while renter-occupied units make up 2,658 (46.2%).
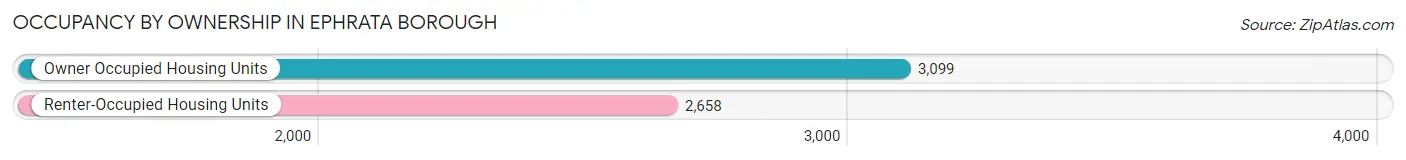
| Occupancy | # Housing Units | % Housing Units |
| Owner Occupied Housing Units | 3,099 | 53.8% |
| Renter-Occupied Housing Units | 2,658 | 46.2% |
| Total Occupied Housing Units | 5,757 | 100.0% |
Occupancy by Household Size in Ephrata borough
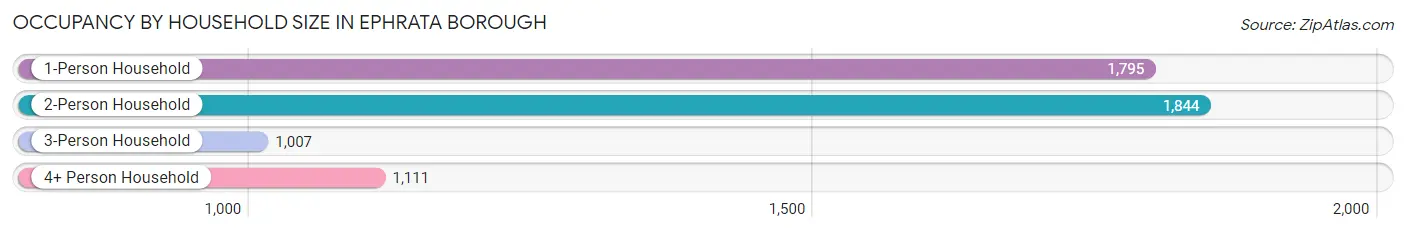
| Household Size | # Housing Units | % Housing Units |
| 1-Person Household | 1,795 | 31.2% |
| 2-Person Household | 1,844 | 32.0% |
| 3-Person Household | 1,007 | 17.5% |
| 4+ Person Household | 1,111 | 19.3% |
| Total Housing Units | 5,757 | 100.0% |
Occupancy by Ownership by Household Size in Ephrata borough
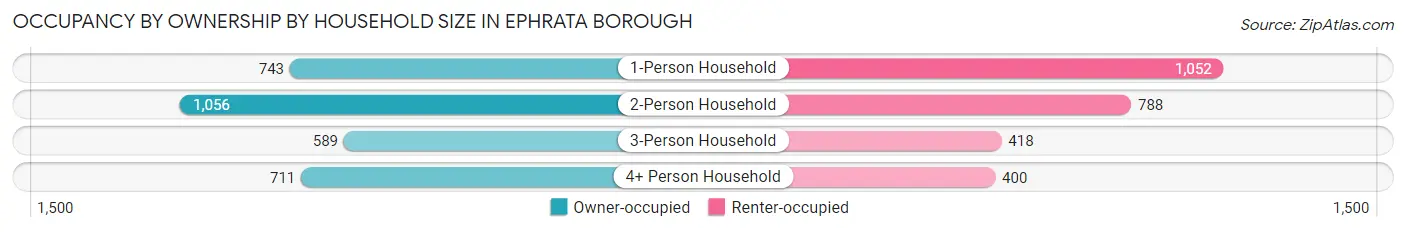
| Household Size | Owner-occupied | Renter-occupied |
| 1-Person Household | 743 (41.4%) | 1,052 (58.6%) |
| 2-Person Household | 1,056 (57.3%) | 788 (42.7%) |
| 3-Person Household | 589 (58.5%) | 418 (41.5%) |
| 4+ Person Household | 711 (64.0%) | 400 (36.0%) |
| Total Housing Units | 3,099 (53.8%) | 2,658 (46.2%) |
Occupancy by Educational Attainment in Ephrata borough
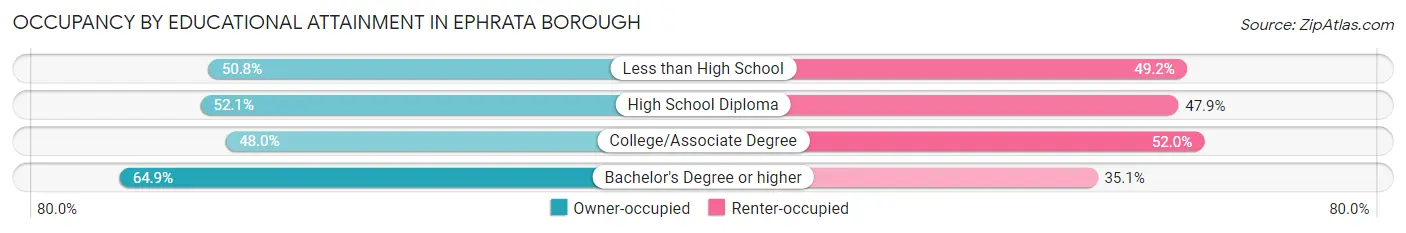
| Household Size | Owner-occupied | Renter-occupied |
| Less than High School | 330 (50.8%) | 320 (49.2%) |
| High School Diploma | 1,252 (52.1%) | 1,152 (47.9%) |
| College/Associate Degree | 674 (48.0%) | 730 (52.0%) |
| Bachelor's Degree or higher | 843 (64.9%) | 456 (35.1%) |
Occupancy by Age of Householder in Ephrata borough
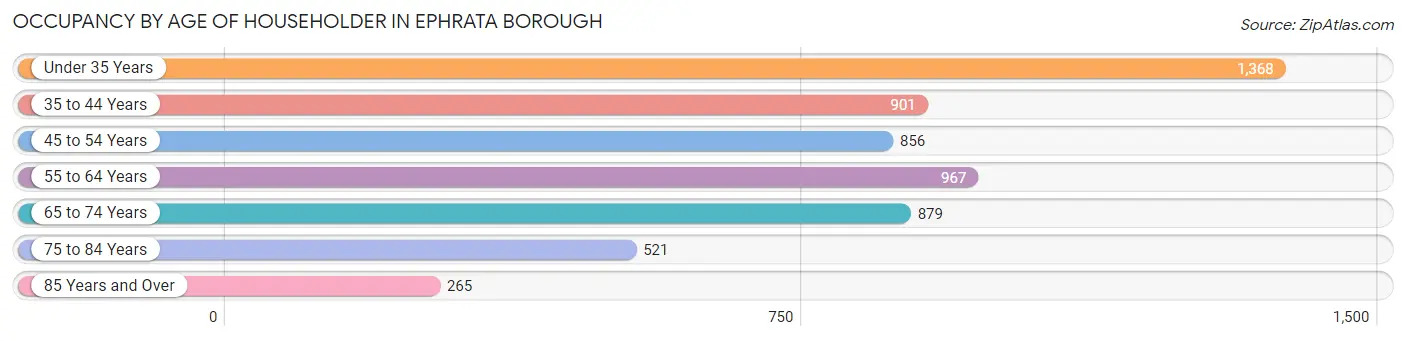
| Age Bracket | # Households | % Households |
| Under 35 Years | 1,368 | 23.8% |
| 35 to 44 Years | 901 | 15.7% |
| 45 to 54 Years | 856 | 14.9% |
| 55 to 64 Years | 967 | 16.8% |
| 65 to 74 Years | 879 | 15.3% |
| 75 to 84 Years | 521 | 9.0% |
| 85 Years and Over | 265 | 4.6% |
| Total | 5,757 | 100.0% |
Housing Finances in Ephrata borough
Median Income by Occupancy in Ephrata borough
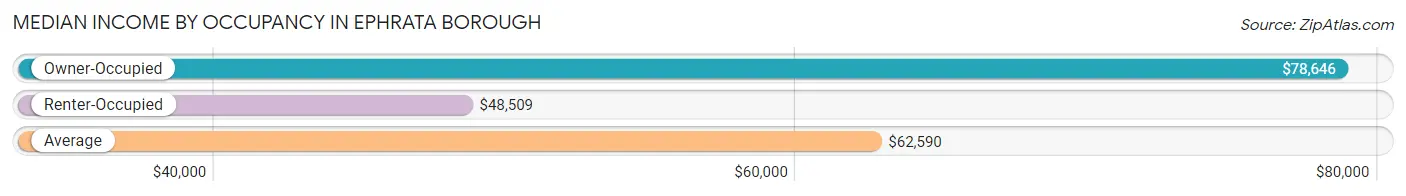
| Occupancy Type | # Households | Median Income |
| Owner-Occupied | 3,099 (53.8%) | $78,646 |
| Renter-Occupied | 2,658 (46.2%) | $48,509 |
| Average | 5,757 (100.0%) | $62,590 |
Occupancy by Householder Income Bracket in Ephrata borough
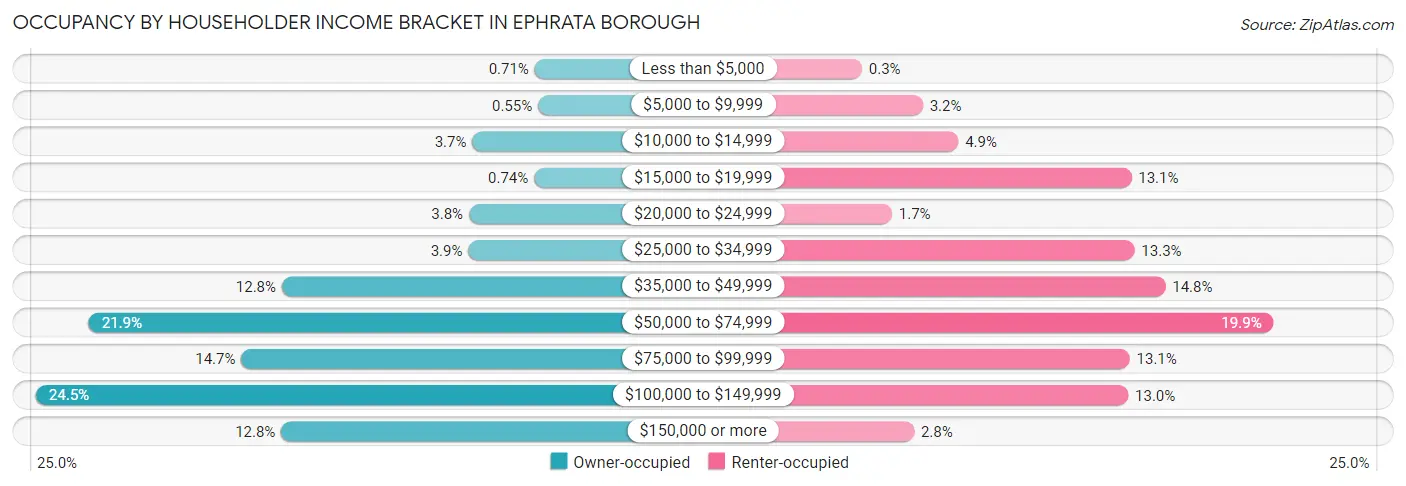
| Income Bracket | Owner-occupied | Renter-occupied |
| Less than $5,000 | 22 (0.7%) | 8 (0.3%) |
| $5,000 to $9,999 | 17 (0.5%) | 85 (3.2%) |
| $10,000 to $14,999 | 114 (3.7%) | 130 (4.9%) |
| $15,000 to $19,999 | 23 (0.7%) | 349 (13.1%) |
| $20,000 to $24,999 | 119 (3.8%) | 46 (1.7%) |
| $25,000 to $34,999 | 120 (3.9%) | 353 (13.3%) |
| $35,000 to $49,999 | 395 (12.8%) | 392 (14.7%) |
| $50,000 to $74,999 | 680 (21.9%) | 529 (19.9%) |
| $75,000 to $99,999 | 455 (14.7%) | 347 (13.1%) |
| $100,000 to $149,999 | 758 (24.5%) | 345 (13.0%) |
| $150,000 or more | 396 (12.8%) | 74 (2.8%) |
| Total | 3,099 (100.0%) | 2,658 (100.0%) |
Monthly Housing Cost Tiers in Ephrata borough
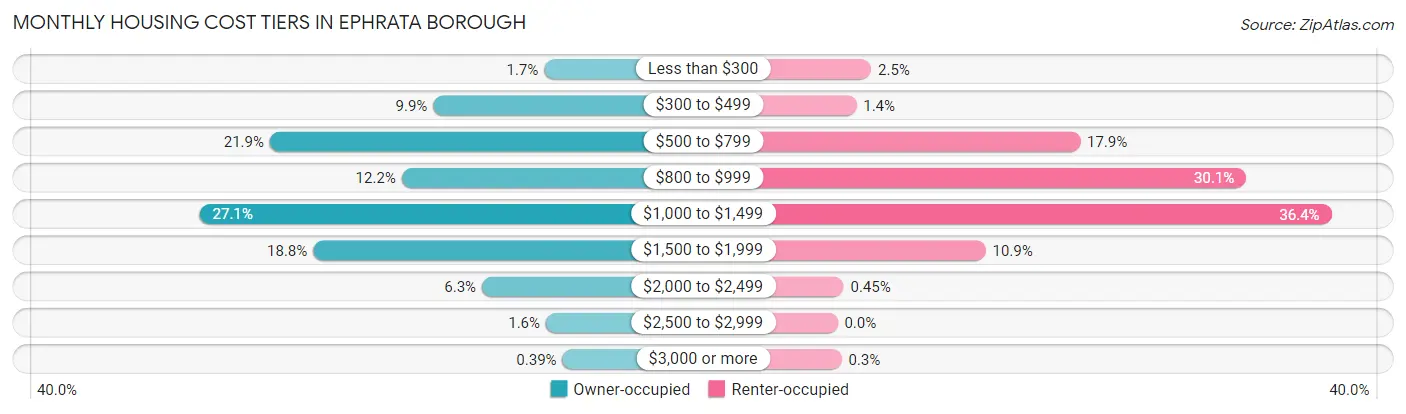
| Monthly Cost | Owner-occupied | Renter-occupied |
| Less than $300 | 54 (1.7%) | 66 (2.5%) |
| $300 to $499 | 307 (9.9%) | 37 (1.4%) |
| $500 to $799 | 680 (21.9%) | 475 (17.9%) |
| $800 to $999 | 379 (12.2%) | 800 (30.1%) |
| $1,000 to $1,499 | 840 (27.1%) | 967 (36.4%) |
| $1,500 to $1,999 | 581 (18.8%) | 290 (10.9%) |
| $2,000 to $2,499 | 196 (6.3%) | 12 (0.4%) |
| $2,500 to $2,999 | 50 (1.6%) | 0 (0.0%) |
| $3,000 or more | 12 (0.4%) | 8 (0.3%) |
| Total | 3,099 (100.0%) | 2,658 (100.0%) |
Physical Housing Characteristics in Ephrata borough
Housing Structures in Ephrata borough
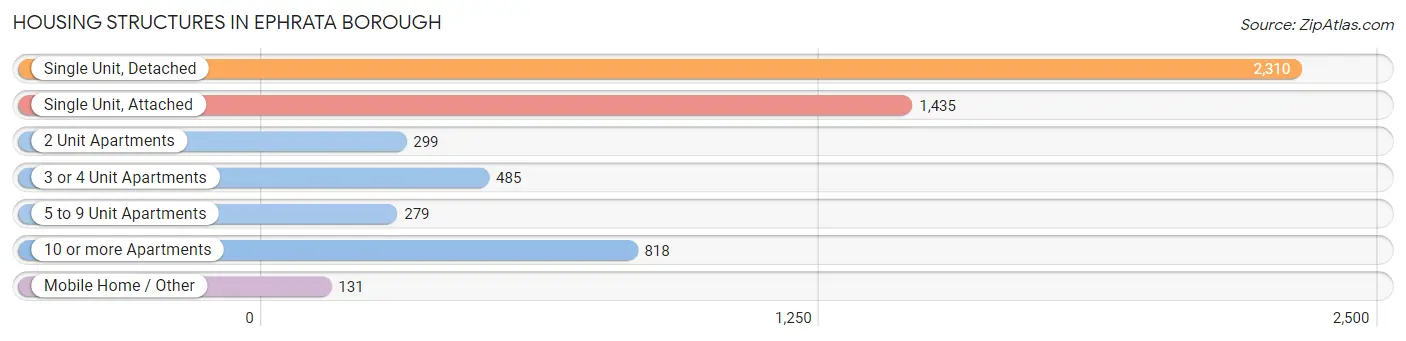
| Structure Type | # Housing Units | % Housing Units |
| Single Unit, Detached | 2,310 | 40.1% |
| Single Unit, Attached | 1,435 | 24.9% |
| 2 Unit Apartments | 299 | 5.2% |
| 3 or 4 Unit Apartments | 485 | 8.4% |
| 5 to 9 Unit Apartments | 279 | 4.9% |
| 10 or more Apartments | 818 | 14.2% |
| Mobile Home / Other | 131 | 2.3% |
| Total | 5,757 | 100.0% |
Housing Structures by Occupancy in Ephrata borough
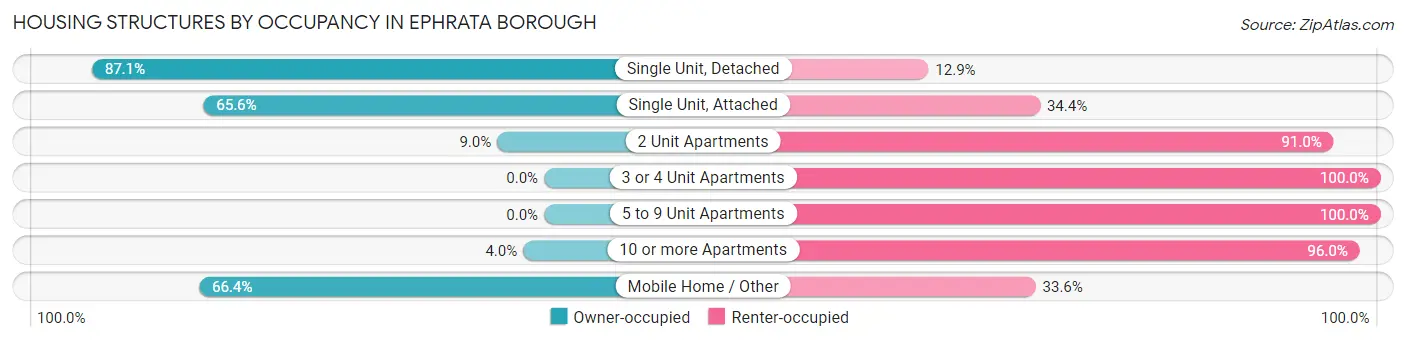
| Structure Type | Owner-occupied | Renter-occupied |
| Single Unit, Detached | 2,011 (87.1%) | 299 (12.9%) |
| Single Unit, Attached | 941 (65.6%) | 494 (34.4%) |
| 2 Unit Apartments | 27 (9.0%) | 272 (91.0%) |
| 3 or 4 Unit Apartments | 0 (0.0%) | 485 (100.0%) |
| 5 to 9 Unit Apartments | 0 (0.0%) | 279 (100.0%) |
| 10 or more Apartments | 33 (4.0%) | 785 (96.0%) |
| Mobile Home / Other | 87 (66.4%) | 44 (33.6%) |
| Total | 3,099 (53.8%) | 2,658 (46.2%) |
Housing Structures by Number of Rooms in Ephrata borough
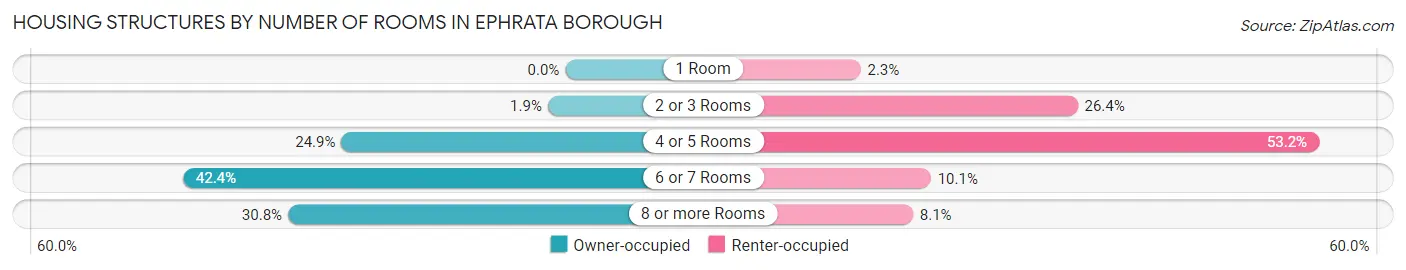
| Number of Rooms | Owner-occupied | Renter-occupied |
| 1 Room | 0 (0.0%) | 61 (2.3%) |
| 2 or 3 Rooms | 60 (1.9%) | 701 (26.4%) |
| 4 or 5 Rooms | 770 (24.8%) | 1,413 (53.2%) |
| 6 or 7 Rooms | 1,315 (42.4%) | 268 (10.1%) |
| 8 or more Rooms | 954 (30.8%) | 215 (8.1%) |
| Total | 3,099 (100.0%) | 2,658 (100.0%) |
Housing Structure by Heating Type in Ephrata borough
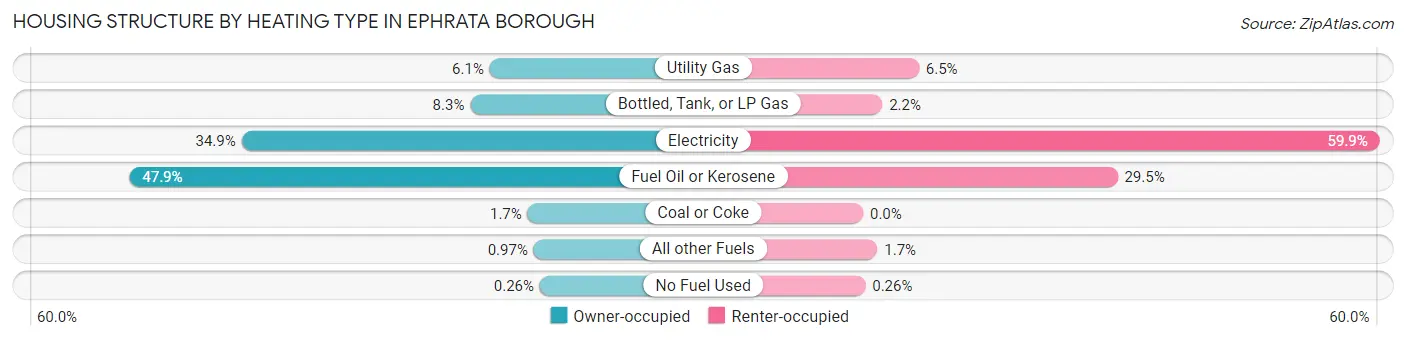
| Heating Type | Owner-occupied | Renter-occupied |
| Utility Gas | 188 (6.1%) | 172 (6.5%) |
| Bottled, Tank, or LP Gas | 258 (8.3%) | 59 (2.2%) |
| Electricity | 1,080 (34.8%) | 1,592 (59.9%) |
| Fuel Oil or Kerosene | 1,483 (47.8%) | 784 (29.5%) |
| Coal or Coke | 52 (1.7%) | 0 (0.0%) |
| All other Fuels | 30 (1.0%) | 44 (1.7%) |
| No Fuel Used | 8 (0.3%) | 7 (0.3%) |
| Total | 3,099 (100.0%) | 2,658 (100.0%) |
Household Vehicle Usage in Ephrata borough
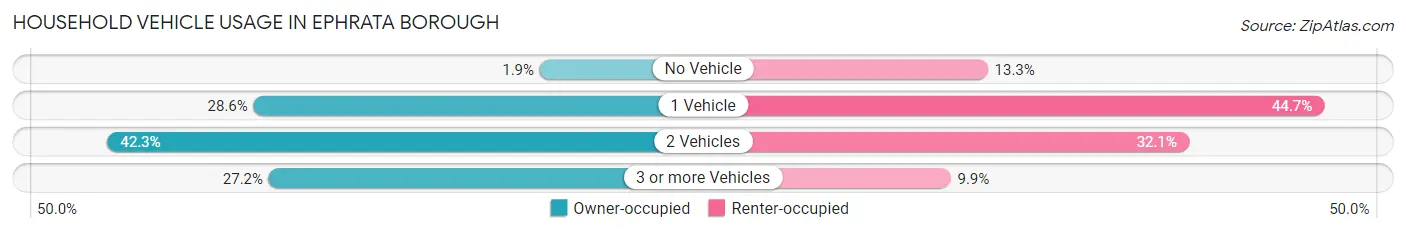
| Vehicles per Household | Owner-occupied | Renter-occupied |
| No Vehicle | 59 (1.9%) | 354 (13.3%) |
| 1 Vehicle | 887 (28.6%) | 1,189 (44.7%) |
| 2 Vehicles | 1,310 (42.3%) | 853 (32.1%) |
| 3 or more Vehicles | 843 (27.2%) | 262 (9.9%) |
| Total | 3,099 (100.0%) | 2,658 (100.0%) |
Real Estate & Mortgages in Ephrata borough
Real Estate and Mortgage Overview in Ephrata borough
| Characteristic | Without Mortgage | With Mortgage |
| Housing Units | 1,313 | 1,786 |
| Median Property Value | $195,000 | $209,500 |
| Median Household Income | $54,336 | $283 |
| Monthly Housing Costs | $623 | $12 |
| Real Estate Taxes | $3,950 | $9 |
Property Value by Mortgage Status in Ephrata borough
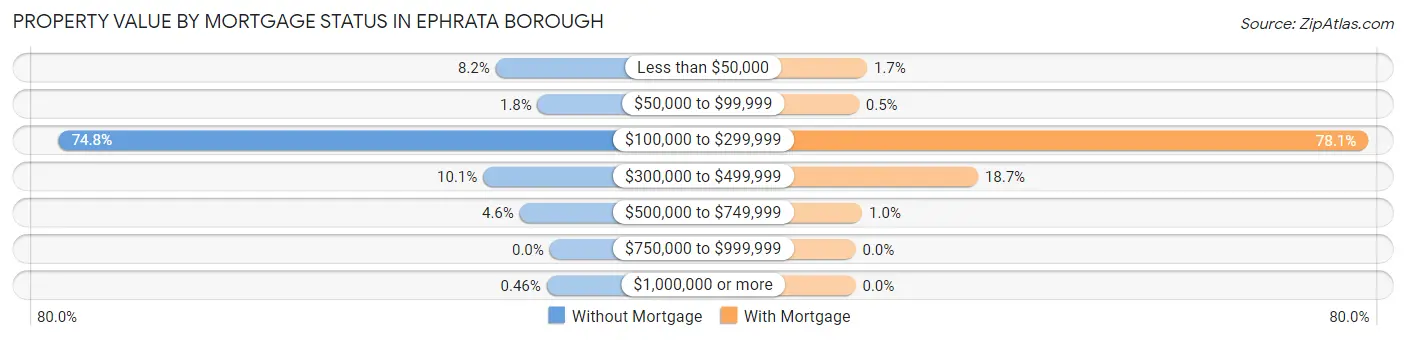
| Property Value | Without Mortgage | With Mortgage |
| Less than $50,000 | 108 (8.2%) | 31 (1.7%) |
| $50,000 to $99,999 | 24 (1.8%) | 9 (0.5%) |
| $100,000 to $299,999 | 982 (74.8%) | 1,395 (78.1%) |
| $300,000 to $499,999 | 133 (10.1%) | 333 (18.6%) |
| $500,000 to $749,999 | 60 (4.6%) | 18 (1.0%) |
| $750,000 to $999,999 | 0 (0.0%) | 0 (0.0%) |
| $1,000,000 or more | 6 (0.5%) | 0 (0.0%) |
| Total | 1,313 (100.0%) | 1,786 (100.0%) |
Household Income by Mortgage Status in Ephrata borough
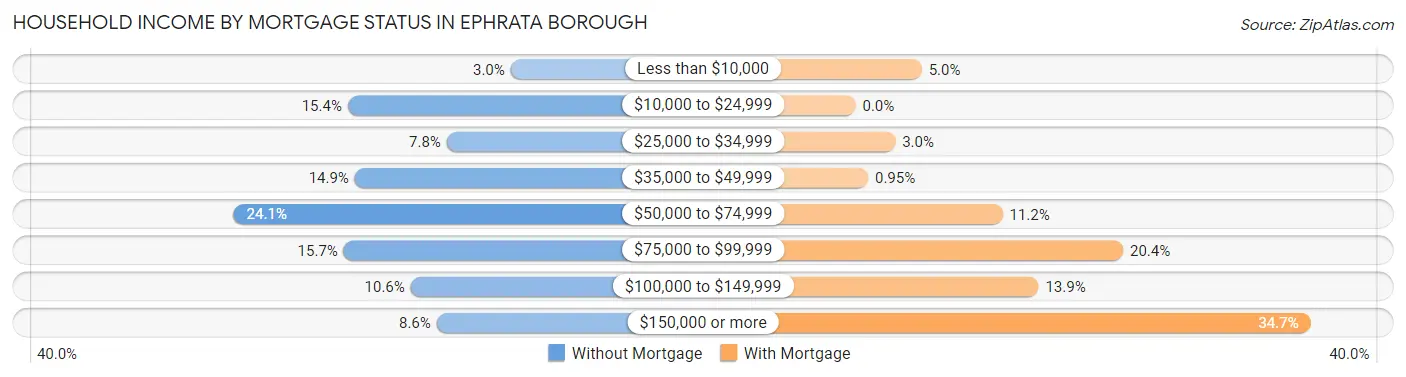
| Household Income | Without Mortgage | With Mortgage |
| Less than $10,000 | 39 (3.0%) | 90 (5.0%) |
| $10,000 to $24,999 | 202 (15.4%) | 0 (0.0%) |
| $25,000 to $34,999 | 103 (7.8%) | 54 (3.0%) |
| $35,000 to $49,999 | 195 (14.8%) | 17 (0.9%) |
| $50,000 to $74,999 | 316 (24.1%) | 200 (11.2%) |
| $75,000 to $99,999 | 206 (15.7%) | 364 (20.4%) |
| $100,000 to $149,999 | 139 (10.6%) | 249 (13.9%) |
| $150,000 or more | 113 (8.6%) | 619 (34.7%) |
| Total | 1,313 (100.0%) | 1,786 (100.0%) |
Property Value to Household Income Ratio in Ephrata borough
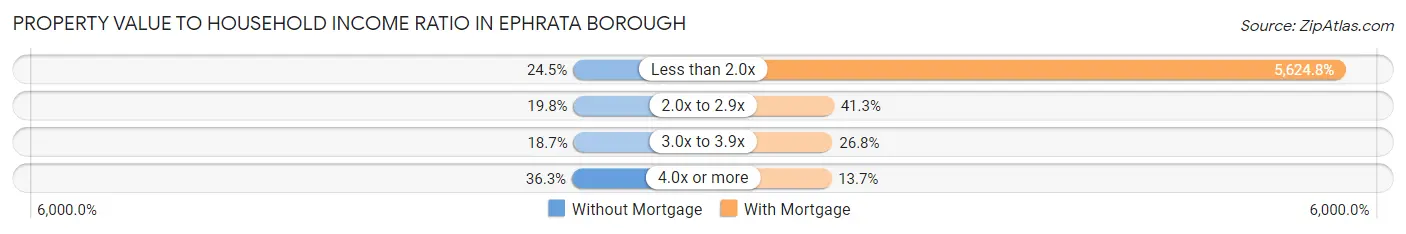
| Value-to-Income Ratio | Without Mortgage | With Mortgage |
| Less than 2.0x | 321 (24.4%) | 100,459 (5,624.8%) |
| 2.0x to 2.9x | 260 (19.8%) | 738 (41.3%) |
| 3.0x to 3.9x | 246 (18.7%) | 478 (26.8%) |
| 4.0x or more | 477 (36.3%) | 244 (13.7%) |
| Total | 1,313 (100.0%) | 1,786 (100.0%) |
Real Estate Taxes by Mortgage Status in Ephrata borough
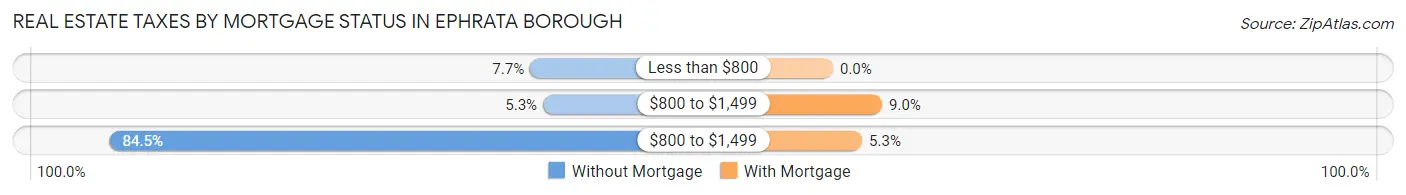
| Property Taxes | Without Mortgage | With Mortgage |
| Less than $800 | 101 (7.7%) | 0 (0.0%) |
| $800 to $1,499 | 70 (5.3%) | 160 (9.0%) |
| $800 to $1,499 | 1,109 (84.5%) | 95 (5.3%) |
| Total | 1,313 (100.0%) | 1,786 (100.0%) |
Health & Disability in Ephrata borough
Health Insurance Coverage by Age in Ephrata borough
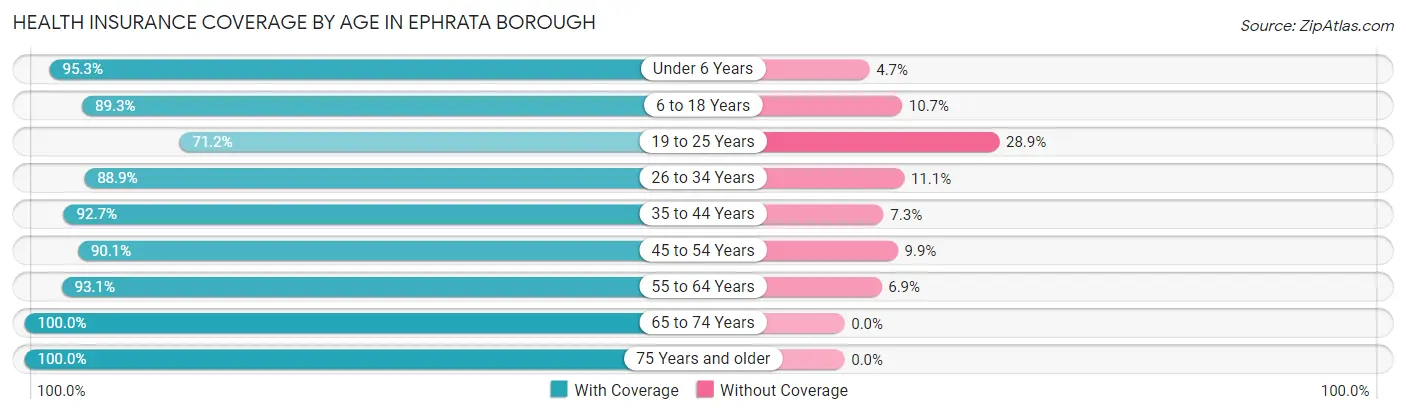
| Age Bracket | With Coverage | Without Coverage |
| Under 6 Years | 1,044 (95.3%) | 51 (4.7%) |
| 6 to 18 Years | 2,110 (89.3%) | 254 (10.7%) |
| 19 to 25 Years | 683 (71.2%) | 277 (28.8%) |
| 26 to 34 Years | 1,900 (88.9%) | 238 (11.1%) |
| 35 to 44 Years | 1,513 (92.7%) | 119 (7.3%) |
| 45 to 54 Years | 1,414 (90.1%) | 156 (9.9%) |
| 55 to 64 Years | 1,470 (93.1%) | 109 (6.9%) |
| 65 to 74 Years | 1,202 (100.0%) | 0 (0.0%) |
| 75 Years and older | 1,160 (100.0%) | 0 (0.0%) |
| Total | 12,496 (91.2%) | 1,204 (8.8%) |
Health Insurance Coverage by Citizenship Status in Ephrata borough
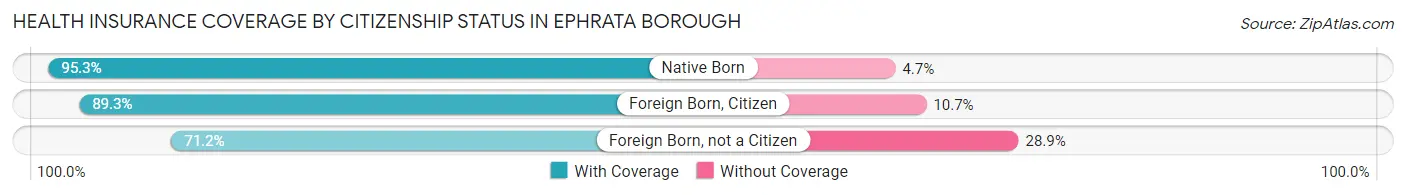
| Citizenship Status | With Coverage | Without Coverage |
| Native Born | 1,044 (95.3%) | 51 (4.7%) |
| Foreign Born, Citizen | 2,110 (89.3%) | 254 (10.7%) |
| Foreign Born, not a Citizen | 683 (71.2%) | 277 (28.8%) |
Health Insurance Coverage by Household Income in Ephrata borough
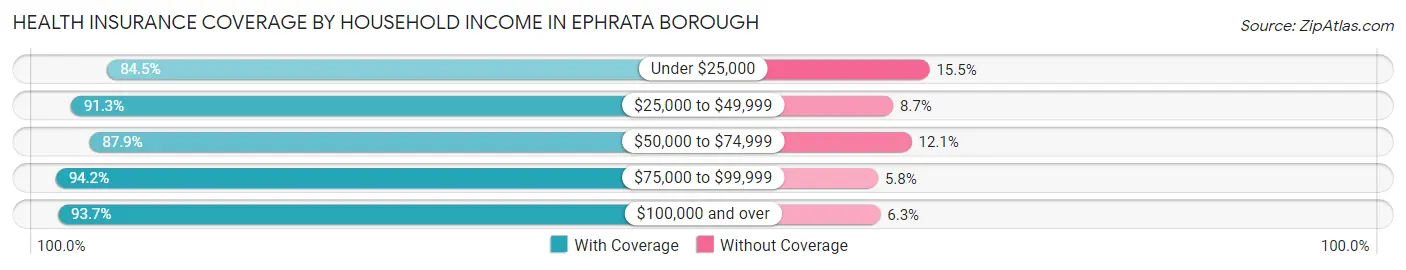
| Household Income | With Coverage | Without Coverage |
| Under $25,000 | 960 (84.5%) | 176 (15.5%) |
| $25,000 to $49,999 | 2,127 (91.3%) | 202 (8.7%) |
| $50,000 to $74,999 | 2,865 (87.9%) | 396 (12.1%) |
| $75,000 to $99,999 | 2,016 (94.2%) | 125 (5.8%) |
| $100,000 and over | 4,492 (93.7%) | 301 (6.3%) |
Public vs Private Health Insurance Coverage by Age in Ephrata borough
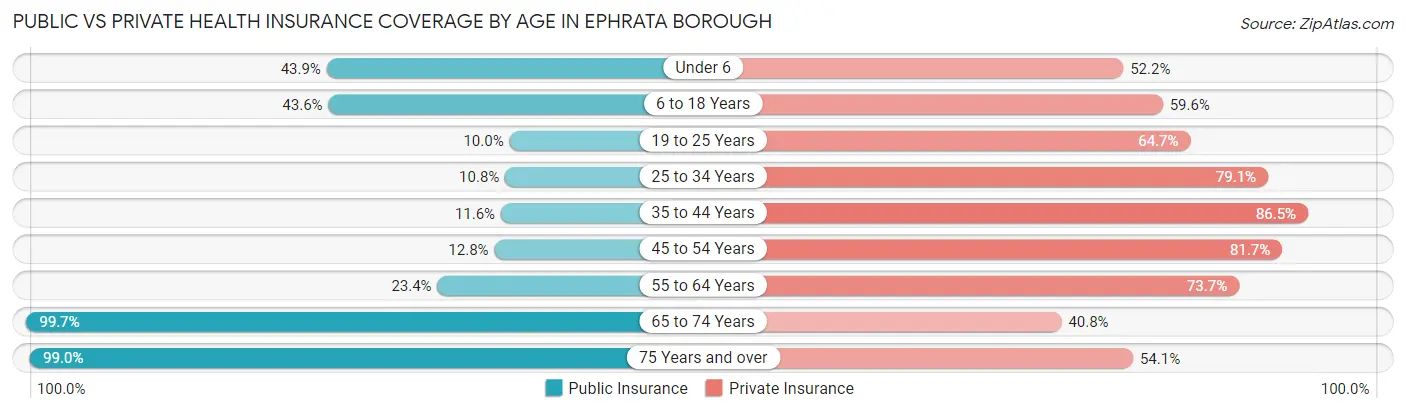
| Age Bracket | Public Insurance | Private Insurance |
| Under 6 | 481 (43.9%) | 572 (52.2%) |
| 6 to 18 Years | 1,031 (43.6%) | 1,408 (59.6%) |
| 19 to 25 Years | 96 (10.0%) | 621 (64.7%) |
| 25 to 34 Years | 231 (10.8%) | 1,691 (79.1%) |
| 35 to 44 Years | 189 (11.6%) | 1,412 (86.5%) |
| 45 to 54 Years | 201 (12.8%) | 1,283 (81.7%) |
| 55 to 64 Years | 369 (23.4%) | 1,164 (73.7%) |
| 65 to 74 Years | 1,198 (99.7%) | 490 (40.8%) |
| 75 Years and over | 1,148 (99.0%) | 627 (54.0%) |
| Total | 4,944 (36.1%) | 9,268 (67.6%) |
Disability Status by Sex by Age in Ephrata borough
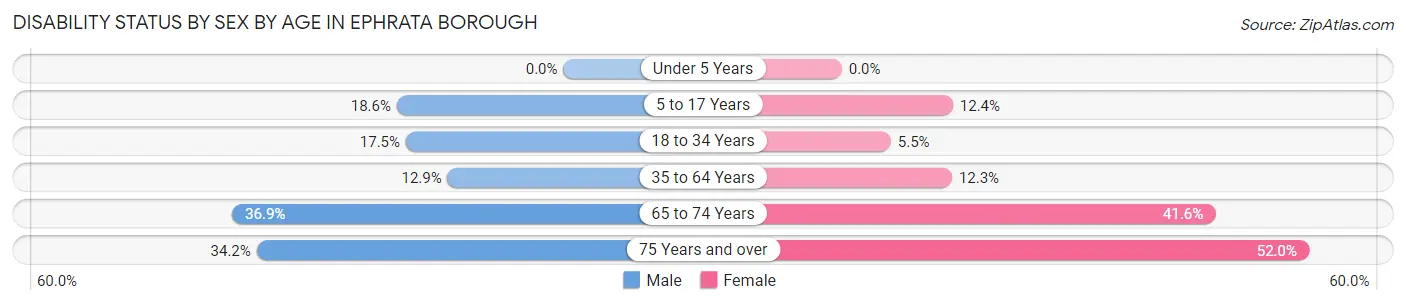
| Age Bracket | Male | Female |
| Under 5 Years | 0 (0.0%) | 0 (0.0%) |
| 5 to 17 Years | 218 (18.5%) | 150 (12.4%) |
| 18 to 34 Years | 289 (17.5%) | 87 (5.5%) |
| 35 to 64 Years | 334 (12.9%) | 269 (12.3%) |
| 65 to 74 Years | 170 (36.9%) | 308 (41.6%) |
| 75 Years and over | 192 (34.2%) | 311 (52.0%) |
Disability Class by Sex by Age in Ephrata borough
Disability Class: Hearing Difficulty
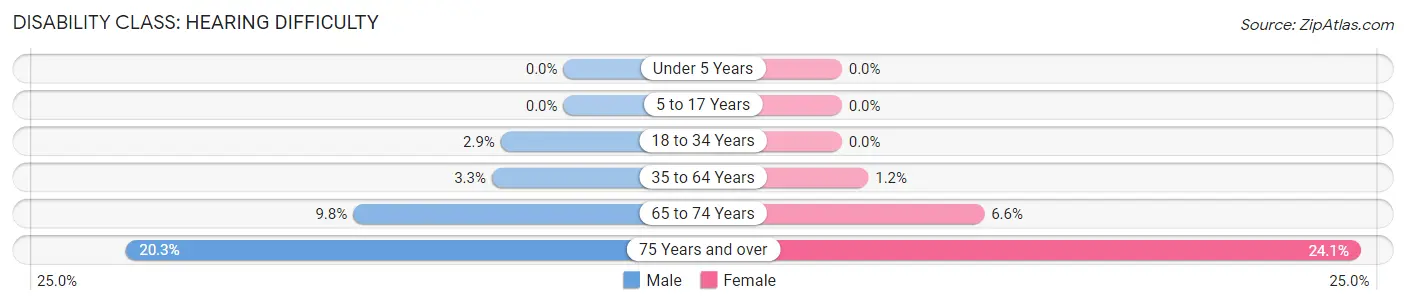
| Age Bracket | Male | Female |
| Under 5 Years | 0 (0.0%) | 0 (0.0%) |
| 5 to 17 Years | 0 (0.0%) | 0 (0.0%) |
| 18 to 34 Years | 48 (2.9%) | 0 (0.0%) |
| 35 to 64 Years | 86 (3.3%) | 27 (1.2%) |
| 65 to 74 Years | 45 (9.8%) | 49 (6.6%) |
| 75 Years and over | 114 (20.3%) | 144 (24.1%) |
Disability Class: Vision Difficulty
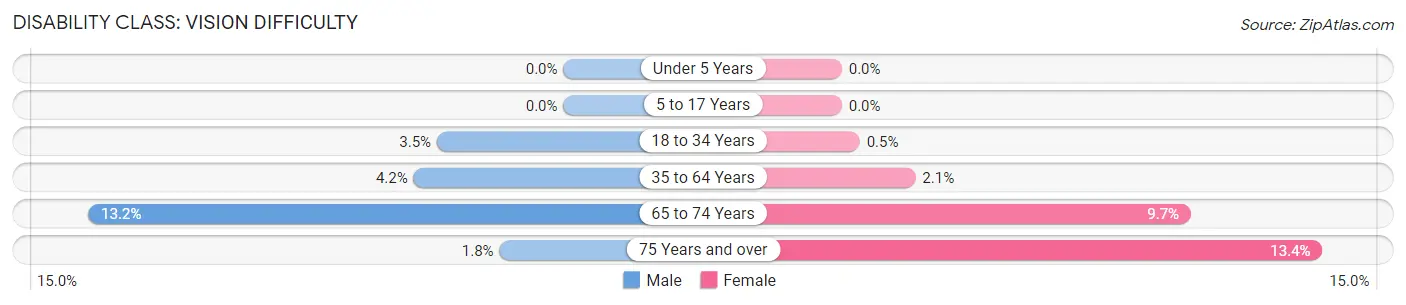
| Age Bracket | Male | Female |
| Under 5 Years | 0 (0.0%) | 0 (0.0%) |
| 5 to 17 Years | 0 (0.0%) | 0 (0.0%) |
| 18 to 34 Years | 58 (3.5%) | 8 (0.5%) |
| 35 to 64 Years | 108 (4.2%) | 45 (2.1%) |
| 65 to 74 Years | 61 (13.2%) | 72 (9.7%) |
| 75 Years and over | 10 (1.8%) | 80 (13.4%) |
Disability Class: Cognitive Difficulty
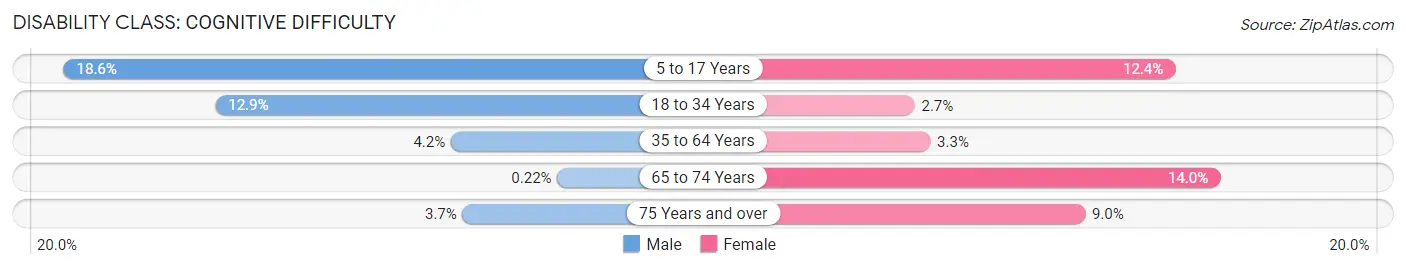
| Age Bracket | Male | Female |
| 5 to 17 Years | 218 (18.5%) | 150 (12.4%) |
| 18 to 34 Years | 213 (12.9%) | 43 (2.7%) |
| 35 to 64 Years | 108 (4.2%) | 72 (3.3%) |
| 65 to 74 Years | 1 (0.2%) | 104 (14.0%) |
| 75 Years and over | 21 (3.7%) | 54 (9.0%) |
Disability Class: Ambulatory Difficulty
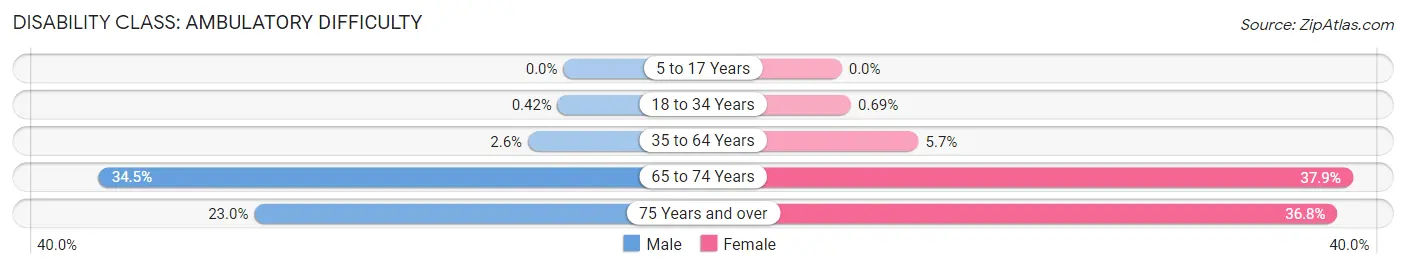
| Age Bracket | Male | Female |
| 5 to 17 Years | 0 (0.0%) | 0 (0.0%) |
| 18 to 34 Years | 7 (0.4%) | 11 (0.7%) |
| 35 to 64 Years | 68 (2.6%) | 125 (5.7%) |
| 65 to 74 Years | 159 (34.5%) | 281 (37.9%) |
| 75 Years and over | 129 (23.0%) | 220 (36.8%) |
Disability Class: Self-Care Difficulty
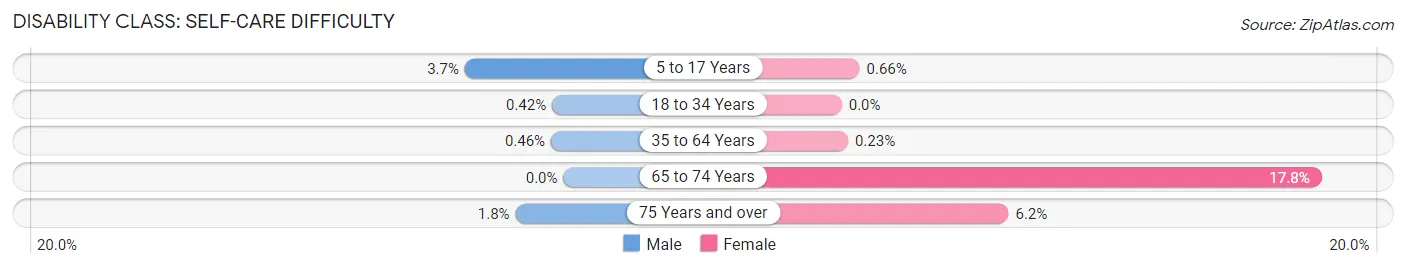
| Age Bracket | Male | Female |
| 5 to 17 Years | 43 (3.7%) | 8 (0.7%) |
| 18 to 34 Years | 7 (0.4%) | 0 (0.0%) |
| 35 to 64 Years | 12 (0.5%) | 5 (0.2%) |
| 65 to 74 Years | 0 (0.0%) | 132 (17.8%) |
| 75 Years and over | 10 (1.8%) | 37 (6.2%) |
Technology Access in Ephrata borough
Computing Device Access in Ephrata borough
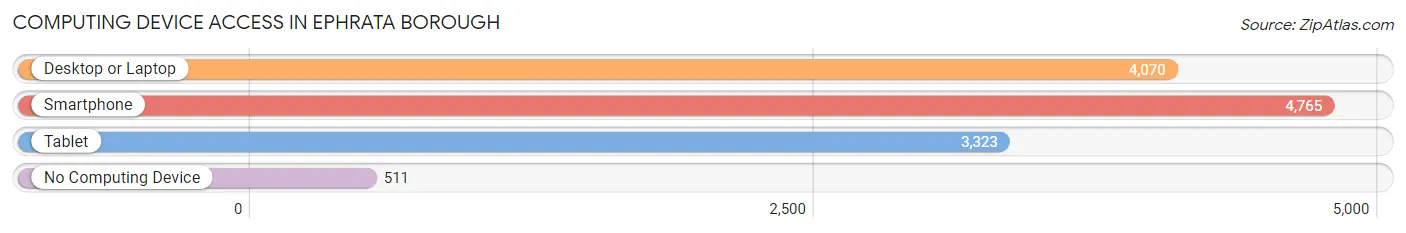
| Device Type | # Households | % Households |
| Desktop or Laptop | 4,070 | 70.7% |
| Smartphone | 4,765 | 82.8% |
| Tablet | 3,323 | 57.7% |
| No Computing Device | 511 | 8.9% |
| Total | 5,757 | 100.0% |
Internet Access in Ephrata borough
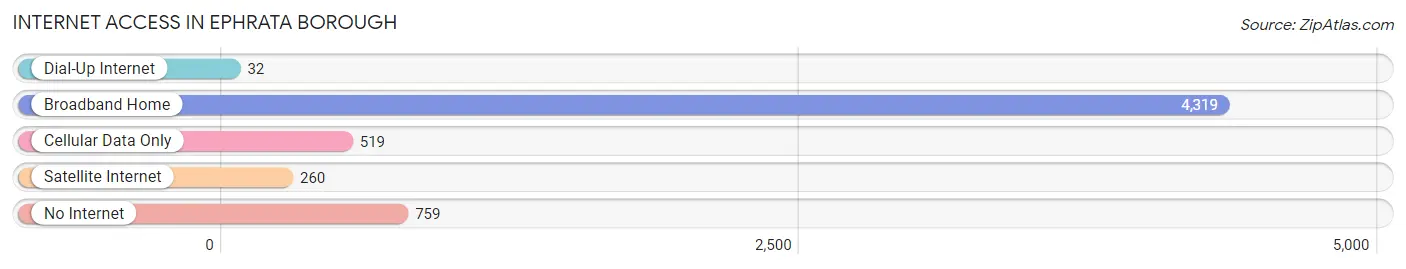
| Internet Type | # Households | % Households |
| Dial-Up Internet | 32 | 0.6% |
| Broadband Home | 4,319 | 75.0% |
| Cellular Data Only | 519 | 9.0% |
| Satellite Internet | 260 | 4.5% |
| No Internet | 759 | 13.2% |
| Total | 5,757 | 100.0% |
Ephrata borough Summary
Ephrata Borough is a borough located in Lancaster County, Pennsylvania, United States. The population was 13,394 at the 2010 census. It is part of the Lancaster, Pennsylvania Metropolitan Statistical Area.
History
Ephrata Borough was founded in 1732 by a group of German immigrants led by Johann Conrad Beissel. The group was part of the religious sect known as the Ephrata Cloister, which was established in 1732 and was one of the first religious communities in the United States. The Cloister was a communal society that practiced celibacy, communal living, and a strict religious lifestyle. The Cloister was a major influence in the area and was a major employer in the area until its dissolution in 1814.
The borough was incorporated in 1891 and is named after the Ephrata Cloister. The borough is home to several historic sites, including the Ephrata Cloister, the Ephrata Public Library, and the Ephrata National Bank.
Geography
Ephrata Borough is located at 40°11'17" North, 76°11'17" West (40.188056, -76.188056). According to the United States Census Bureau, the borough has a total area of 2.2 square miles (5.7 km2), all of it land.
Economy
Ephrata Borough is home to several businesses, including manufacturing, retail, and service industries. The borough is also home to several restaurants, including the Ephrata Family Restaurant, the Ephrata Diner, and the Ephrata Pizza House.
Demographics
As of the census of 2000, there were 13,394 people, 5,717 households, and 3,619 families residing in the borough. The population density was 6,072.2 people per square mile (2,344.2/km2). There were 5,945 housing units at an average density of 2,689.2 per square mile (1,037.2/km2). The racial makeup of the borough was 97.17% White, 0.50% African American, 0.17% Native American, 0.90% Asian, 0.02% Pacific Islander, 0.37% from other races, and 0.87% from two or more races. Hispanic or Latino of any race were 1.17% of the population.
There were 5,717 households, out of which 28.2% had children under the age of 18 living with them, 49.2% were married couples living together, 10.2% had a female householder with no husband present, and 36.7% were non-families. 32.2% of all households were made up of individuals, and 16.2% had someone living alone who was 65 years of age or older. The average household size was 2.30 and the average family size was 2.93.
In the borough the population was spread out, with 22.3% under the age of 18, 7.2% from 18 to 24, 28.7% from 25 to 44, 21.3% from 45 to 64, and 20.5% who were 65 years of age or older. The median age was 40 years. For every 100 females, there were 87.7 males. For every 100 females age 18 and over, there were 83.7 males.
The median income for a household in the borough was $37,917, and the median income for a family was $45,945. Males had a median income of $32,917 versus $23,917 for females. The per capita income for the borough was $19,945. About 4.2% of families and 6.2% of the population were below the poverty line, including 8.2% of those under age 18 and 6.2% of those age 65 or over.
Common Questions
What is Per Capita Income in Ephrata borough?
Per Capita income in Ephrata borough is $34,674.
What is the Median Family Income in Ephrata borough?
Median Family Income in Ephrata borough is $79,938.
What is the Median Household income in Ephrata borough?
Median Household Income in Ephrata borough is $62,590.
What is Income or Wage Gap in Ephrata borough?
Income or Wage Gap in Ephrata borough is 22.7%.
Women in Ephrata borough earn 77.3 cents for every dollar earned by a man.
What is Inequality or Gini Index in Ephrata borough?
Inequality or Gini Index in Ephrata borough is 0.43.
What is the Total Population of Ephrata borough?
Total Population of Ephrata borough is 13,738.
What is the Total Male Population of Ephrata borough?
Total Male Population of Ephrata borough is 7,008.
What is the Total Female Population of Ephrata borough?
Total Female Population of Ephrata borough is 6,730.
What is the Ratio of Males per 100 Females in Ephrata borough?
There are 104.13 Males per 100 Females in Ephrata borough.
What is the Ratio of Females per 100 Males in Ephrata borough?
There are 96.03 Females per 100 Males in Ephrata borough.
What is the Median Population Age in Ephrata borough?
Median Population Age in Ephrata borough is 36.0 Years.
What is the Average Family Size in Ephrata borough
Average Family Size in Ephrata borough is 3.0 People.
What is the Average Household Size in Ephrata borough
Average Household Size in Ephrata borough is 2.4 People.
How Large is the Labor Force in Ephrata borough?
There are 7,344 People in the Labor Forcein in Ephrata borough.
What is the Percentage of People in the Labor Force in Ephrata borough?
68.7% of People are in the Labor Force in Ephrata borough.
What is the Unemployment Rate in Ephrata borough?
Unemployment Rate in Ephrata borough is 3.2%.