Zip Codes with the Lowest Poverty Level Among Children Under the Age of 5 in Pennsylvania
RELATED REPORTS & OPTIONS
Lowest Poverty | Child 0-5
Pennsylvania
Compare Zip Codes
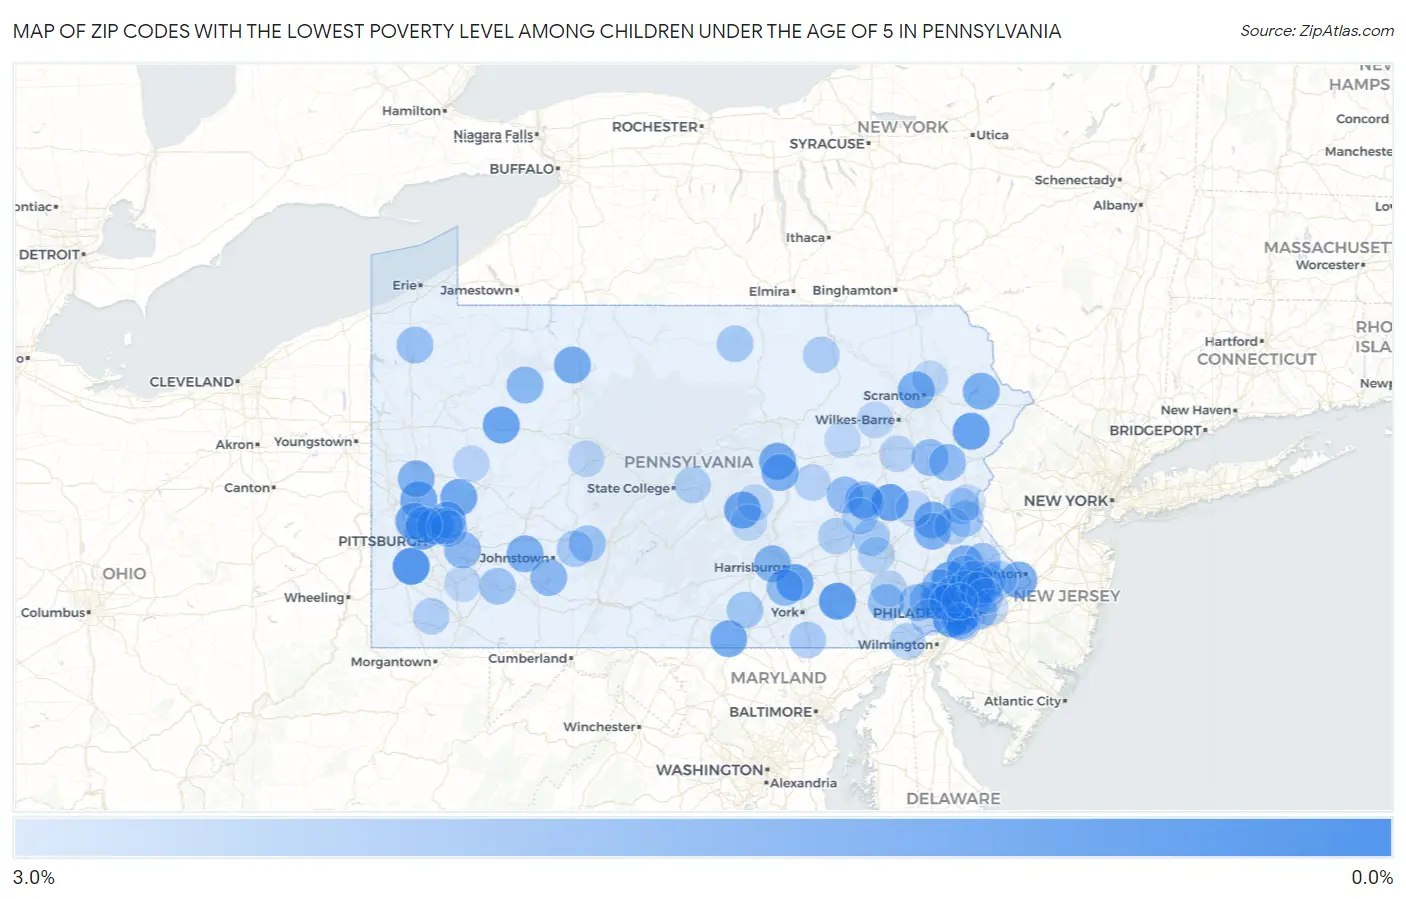
Map of Zip Codes with the Lowest Poverty Level Among Children Under the Age of 5 in Pennsylvania
3.0%
0.0%
Zip Codes with the Lowest Poverty Level Among Children Under the Age of 5 in Pennsylvania
| Zip Code | Child Poverty | vs State | vs National | |
| 1. | 15317 | 0.11% | 17.3%(-17.1)#1 | 18.1%(-18.0)#1 |
| 2. | 17554 | 0.41% | 17.3%(-16.8)#2 | 18.1%(-17.6)#35 |
| 3. | 19087 | 0.44% | 17.3%(-16.8)#3 | 18.1%(-17.6)#42 |
| 4. | 17960 | 0.54% | 17.3%(-16.7)#4 | 18.1%(-17.5)#69 |
| 5. | 19008 | 0.55% | 17.3%(-16.7)#5 | 18.1%(-17.5)#73 |
| 6. | 19064 | 0.59% | 17.3%(-16.7)#6 | 18.1%(-17.5)#87 |
| 7. | 17319 | 0.59% | 17.3%(-16.7)#7 | 18.1%(-17.5)#88 |
| 8. | 18326 | 0.60% | 17.3%(-16.7)#8 | 18.1%(-17.5)#92 |
| 9. | 19426 | 0.64% | 17.3%(-16.6)#9 | 18.1%(-17.4)#108 |
| 10. | 19063 | 0.66% | 17.3%(-16.6)#10 | 18.1%(-17.4)#118 |
| 11. | 16214 | 0.66% | 17.3%(-16.6)#11 | 18.1%(-17.4)#119 |
| 12. | 17049 | 0.71% | 17.3%(-16.5)#12 | 18.1%(-17.3)#136 |
| 13. | 15202 | 0.81% | 17.3%(-16.4)#13 | 18.1%(-17.3)#179 |
| 14. | 16066 | 0.84% | 17.3%(-16.4)#14 | 18.1%(-17.2)#197 |
| 15. | 16055 | 0.85% | 17.3%(-16.4)#15 | 18.1%(-17.2)#203 |
| 16. | 15143 | 0.86% | 17.3%(-16.4)#16 | 18.1%(-17.2)#211 |
| 17. | 17320 | 0.89% | 17.3%(-16.4)#17 | 18.1%(-17.2)#224 |
| 18. | 17837 | 0.92% | 17.3%(-16.3)#18 | 18.1%(-17.1)#238 |
| 19. | 15116 | 0.92% | 17.3%(-16.3)#19 | 18.1%(-17.1)#240 |
| 20. | 16735 | 0.98% | 17.3%(-16.3)#20 | 18.1%(-17.1)#265 |
| 21. | 18106 | 1.0% | 17.3%(-16.2)#21 | 18.1%(-17.0)#287 |
| 22. | 15024 | 1.0% | 17.3%(-16.2)#22 | 18.1%(-17.0)#288 |
| 23. | 18411 | 1.0% | 17.3%(-16.2)#23 | 18.1%(-17.0)#307 |
| 24. | 18428 | 1.1% | 17.3%(-16.2)#24 | 18.1%(-17.0)#329 |
| 25. | 19030 | 1.1% | 17.3%(-16.1)#25 | 18.1%(-16.9)#336 |
| 26. | 19440 | 1.1% | 17.3%(-16.1)#26 | 18.1%(-16.9)#339 |
| 27. | 17889 | 1.2% | 17.3%(-16.1)#27 | 18.1%(-16.9)#376 |
| 28. | 15923 | 1.2% | 17.3%(-16.1)#28 | 18.1%(-16.9)#377 |
| 29. | 18062 | 1.2% | 17.3%(-16.0)#29 | 18.1%(-16.8)#397 |
| 30. | 16037 | 1.3% | 17.3%(-16.0)#30 | 18.1%(-16.8)#411 |
| 31. | 17025 | 1.3% | 17.3%(-15.9)#31 | 18.1%(-16.7)#436 |
| 32. | 19333 | 1.4% | 17.3%(-15.9)#32 | 18.1%(-16.7)#455 |
| 33. | 16239 | 1.5% | 17.3%(-15.8)#33 | 18.1%(-16.6)#533 |
| 34. | 17970 | 1.5% | 17.3%(-15.7)#34 | 18.1%(-16.5)#539 |
| 35. | 15935 | 1.5% | 17.3%(-15.7)#35 | 18.1%(-16.5)#544 |
| 36. | 19460 | 1.5% | 17.3%(-15.7)#36 | 18.1%(-16.5)#560 |
| 37. | 15085 | 1.6% | 17.3%(-15.7)#37 | 18.1%(-16.5)#563 |
| 38. | 19355 | 1.7% | 17.3%(-15.6)#38 | 18.1%(-16.4)#622 |
| 39. | 17339 | 1.7% | 17.3%(-15.6)#39 | 18.1%(-16.4)#634 |
| 40. | 19040 | 1.7% | 17.3%(-15.6)#40 | 18.1%(-16.4)#636 |
| 41. | 18210 | 1.7% | 17.3%(-15.6)#41 | 18.1%(-16.4)#641 |
| 42. | 18330 | 1.7% | 17.3%(-15.6)#42 | 18.1%(-16.4)#646 |
| 43. | 17921 | 1.7% | 17.3%(-15.5)#43 | 18.1%(-16.3)#653 |
| 44. | 19130 | 1.7% | 17.3%(-15.5)#44 | 18.1%(-16.3)#659 |
| 45. | 19335 | 1.8% | 17.3%(-15.5)#45 | 18.1%(-16.3)#694 |
| 46. | 15139 | 1.8% | 17.3%(-15.5)#46 | 18.1%(-16.3)#698 |
| 47. | 19034 | 1.9% | 17.3%(-15.4)#47 | 18.1%(-16.2)#745 |
| 48. | 17527 | 1.9% | 17.3%(-15.4)#48 | 18.1%(-16.2)#752 |
| 49. | 16433 | 1.9% | 17.3%(-15.4)#49 | 18.1%(-16.2)#770 |
| 50. | 19341 | 1.9% | 17.3%(-15.3)#50 | 18.1%(-16.1)#788 |
| 51. | 15938 | 1.9% | 17.3%(-15.3)#51 | 18.1%(-16.1)#792 |
| 52. | 15610 | 2.0% | 17.3%(-15.3)#52 | 18.1%(-16.1)#821 |
| 53. | 18901 | 2.0% | 17.3%(-15.3)#53 | 18.1%(-16.1)#825 |
| 54. | 17304 | 2.1% | 17.3%(-15.1)#54 | 18.1%(-16.0)#909 |
| 55. | 19038 | 2.1% | 17.3%(-15.1)#55 | 18.1%(-15.9)#926 |
| 56. | 19033 | 2.1% | 17.3%(-15.1)#56 | 18.1%(-15.9)#927 |
| 57. | 19506 | 2.1% | 17.3%(-15.1)#57 | 18.1%(-15.9)#931 |
| 58. | 19406 | 2.2% | 17.3%(-15.1)#58 | 18.1%(-15.9)#938 |
| 59. | 19128 | 2.2% | 17.3%(-15.1)#59 | 18.1%(-15.9)#939 |
| 60. | 19446 | 2.2% | 17.3%(-15.1)#60 | 18.1%(-15.9)#945 |
| 61. | 18055 | 2.2% | 17.3%(-15.1)#61 | 18.1%(-15.9)#957 |
| 62. | 16901 | 2.2% | 17.3%(-15.0)#62 | 18.1%(-15.8)#986 |
| 63. | 19462 | 2.2% | 17.3%(-15.0)#63 | 18.1%(-15.8)#989 |
| 64. | 15958 | 2.2% | 17.3%(-15.0)#64 | 18.1%(-15.8)#999 |
| 65. | 17349 | 2.3% | 17.3%(-15.0)#65 | 18.1%(-15.8)#1,005 |
| 66. | 17965 | 2.3% | 17.3%(-15.0)#66 | 18.1%(-15.8)#1,006 |
| 67. | 19312 | 2.3% | 17.3%(-15.0)#67 | 18.1%(-15.8)#1,007 |
| 68. | 19090 | 2.3% | 17.3%(-15.0)#68 | 18.1%(-15.8)#1,030 |
| 69. | 18020 | 2.4% | 17.3%(-14.9)#69 | 18.1%(-15.7)#1,070 |
| 70. | 18832 | 2.4% | 17.3%(-14.9)#70 | 18.1%(-15.7)#1,082 |
| 71. | 17026 | 2.4% | 17.3%(-14.9)#71 | 18.1%(-15.7)#1,094 |
| 72. | 16828 | 2.4% | 17.3%(-14.8)#72 | 18.1%(-15.6)#1,121 |
| 73. | 15238 | 2.5% | 17.3%(-14.8)#73 | 18.1%(-15.6)#1,137 |
| 74. | 19350 | 2.5% | 17.3%(-14.8)#74 | 18.1%(-15.6)#1,142 |
| 75. | 15357 | 2.5% | 17.3%(-14.8)#75 | 18.1%(-15.6)#1,151 |
| 76. | 19081 | 2.5% | 17.3%(-14.7)#76 | 18.1%(-15.5)#1,182 |
| 77. | 17972 | 2.5% | 17.3%(-14.7)#77 | 18.1%(-15.5)#1,190 |
| 78. | 18966 | 2.6% | 17.3%(-14.7)#78 | 18.1%(-15.5)#1,197 |
| 79. | 19565 | 2.6% | 17.3%(-14.7)#79 | 18.1%(-15.5)#1,206 |
| 80. | 15237 | 2.6% | 17.3%(-14.7)#80 | 18.1%(-15.5)#1,210 |
| 81. | 19002 | 2.6% | 17.3%(-14.7)#81 | 18.1%(-15.5)#1,211 |
| 82. | 17555 | 2.6% | 17.3%(-14.7)#82 | 18.1%(-15.5)#1,214 |
| 83. | 18034 | 2.6% | 17.3%(-14.7)#83 | 18.1%(-15.5)#1,215 |
| 84. | 17860 | 2.6% | 17.3%(-14.7)#84 | 18.1%(-15.5)#1,232 |
| 85. | 18224 | 2.6% | 17.3%(-14.7)#85 | 18.1%(-15.5)#1,238 |
| 86. | 16838 | 2.6% | 17.3%(-14.6)#86 | 18.1%(-15.4)#1,245 |
| 87. | 19382 | 2.6% | 17.3%(-14.6)#87 | 18.1%(-15.4)#1,247 |
| 88. | 19075 | 2.6% | 17.3%(-14.6)#88 | 18.1%(-15.4)#1,250 |
| 89. | 18621 | 2.7% | 17.3%(-14.6)#89 | 18.1%(-15.4)#1,285 |
| 90. | 17086 | 2.7% | 17.3%(-14.6)#90 | 18.1%(-15.4)#1,297 |
| 91. | 16028 | 2.7% | 17.3%(-14.6)#91 | 18.1%(-15.4)#1,298 |
| 92. | 19137 | 2.7% | 17.3%(-14.6)#92 | 18.1%(-15.4)#1,304 |
| 93. | 18447 | 2.7% | 17.3%(-14.5)#93 | 18.1%(-15.3)#1,327 |
| 94. | 19027 | 2.8% | 17.3%(-14.5)#94 | 18.1%(-15.3)#1,334 |
| 95. | 18066 | 2.8% | 17.3%(-14.5)#95 | 18.1%(-15.3)#1,348 |
| 96. | 15479 | 2.8% | 17.3%(-14.5)#96 | 18.1%(-15.3)#1,350 |
| 97. | 19085 | 2.8% | 17.3%(-14.5)#97 | 18.1%(-15.3)#1,363 |
| 98. | 17062 | 2.8% | 17.3%(-14.4)#98 | 18.1%(-15.2)#1,377 |
| 99. | 17859 | 2.8% | 17.3%(-14.4)#99 | 18.1%(-15.2)#1,386 |
| 100. | 18045 | 2.9% | 17.3%(-14.4)#100 | 18.1%(-15.2)#1,431 |
Common Questions
What are the Top 10 Zip Codes with the Lowest Poverty Level Among Children Under the Age of 5 in Pennsylvania?
Top 10 Zip Codes with the Lowest Poverty Level Among Children Under the Age of 5 in Pennsylvania are:
What zip code has the Lowest Poverty Level Among Children Under the Age of 5 in Pennsylvania?
15317 has the Lowest Poverty Level Among Children Under the Age of 5 in Pennsylvania with 0.11%.
What is the Poverty Level Among Children Under the Age of 5 in the State of Pennsylvania?
Poverty Level Among Children Under the Age of 5 in Pennsylvania is 17.3%.
What is the Poverty Level Among Children Under the Age of 5 in the United States?
Poverty Level Among Children Under the Age of 5 in the United States is 18.1%.