Hyndman borough, PA Map & Demographics
Hyndman borough Overview
$24,509
PER CAPITA INCOME
$64,688
AVG FAMILY INCOME
$48,750
AVG HOUSEHOLD INCOME
37.2%
WAGE / INCOME GAP [ % ]
62.8¢/ $1
WAGE / INCOME GAP [ $ ]
0.39
INEQUALITY / GINI INDEX
926
TOTAL POPULATION
417
MALE POPULATION
509
FEMALE POPULATION
81.93
MALES / 100 FEMALES
122.06
FEMALES / 100 MALES
45.2
MEDIAN AGE
3.1
AVG FAMILY SIZE
2.5
AVG HOUSEHOLD SIZE
481
LABOR FORCE [ PEOPLE ]
61.9%
PERCENT IN LABOR FORCE
5.0%
UNEMPLOYMENT RATE
Income in Hyndman borough
Income Overview in Hyndman borough
Per Capita Income in Hyndman borough is $24,509, while median incomes of families and households are $64,688 and $48,750 respectively.
| Characteristic | Number | Measure |
| Per Capita Income | 926 | $24,509 |
| Median Family Income | 251 | $64,688 |
| Mean Family Income | 251 | $70,706 |
| Median Household Income | 373 | $48,750 |
| Mean Household Income | 373 | $56,674 |
| Income Deficit | 251 | $0 |
| Wage / Income Gap (%) | 926 | 37.24% |
| Wage / Income Gap ($) | 926 | 62.76¢ per $1 |
| Gini / Inequality Index | 926 | 0.39 |
Earnings by Sex in Hyndman borough
Average Earnings in Hyndman borough are $26,504, $38,750 for men and $24,318 for women, a difference of 37.2%.
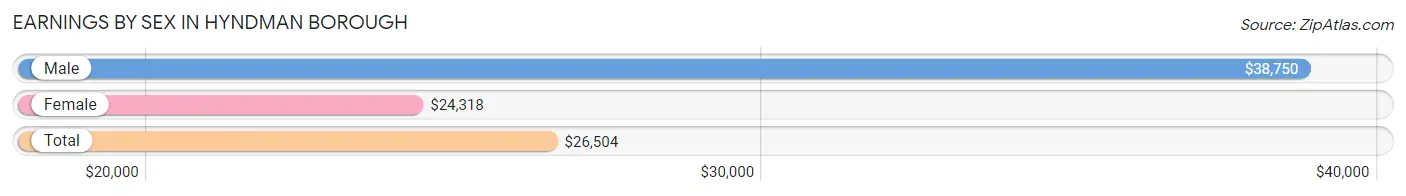
| Sex | Number | Average Earnings |
| Male | 273 (55.6%) | $38,750 |
| Female | 218 (44.4%) | $24,318 |
| Total | 491 (100.0%) | $26,504 |
Earnings by Sex by Income Bracket in Hyndman borough
The most common earnings brackets in Hyndman borough are $75,000 to $99,999 for men (53 | 19.4%) and $25,000 to $29,999 for women (65 | 29.8%).
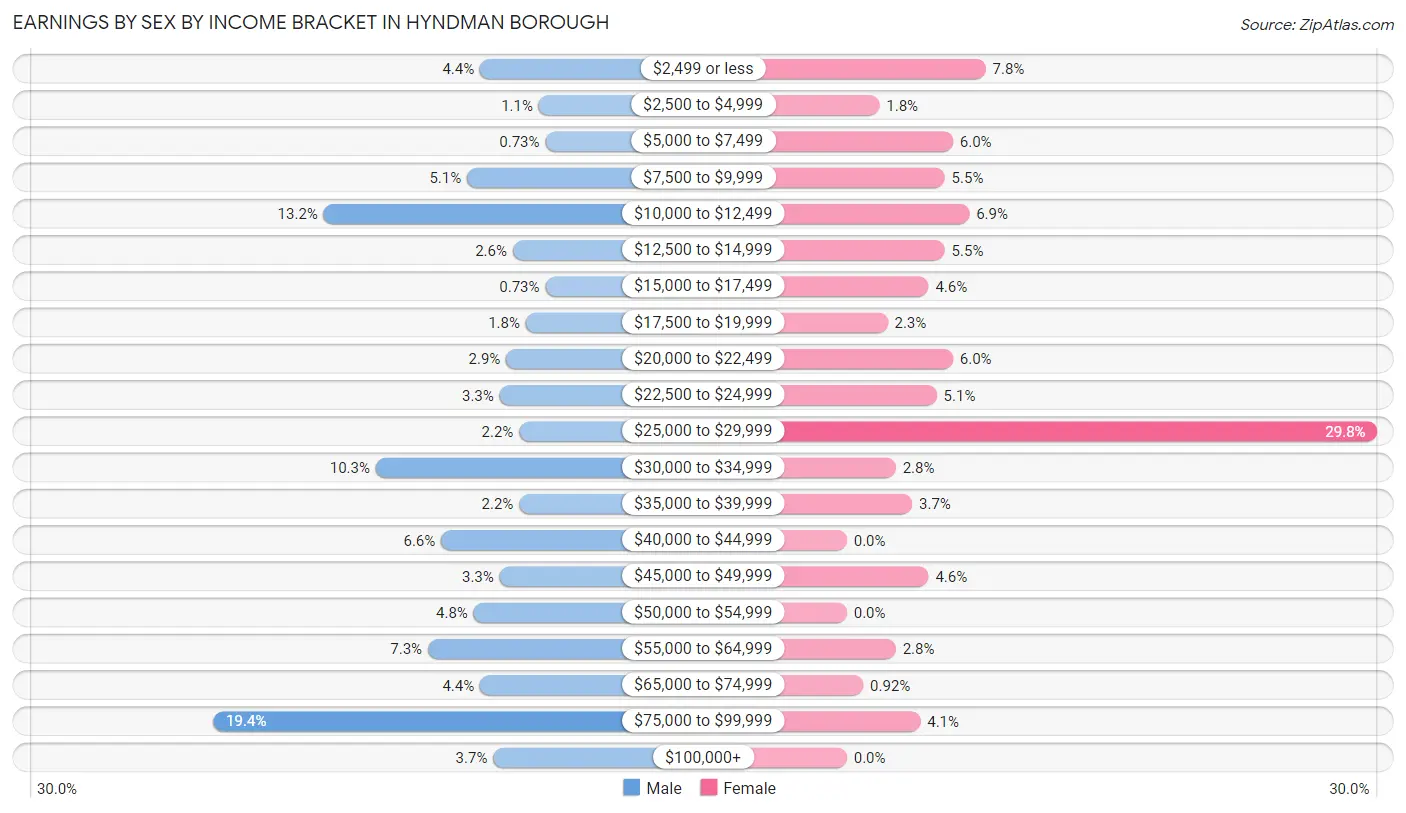
| Income | Male | Female |
| $2,499 or less | 12 (4.4%) | 17 (7.8%) |
| $2,500 to $4,999 | 3 (1.1%) | 4 (1.8%) |
| $5,000 to $7,499 | 2 (0.7%) | 13 (6.0%) |
| $7,500 to $9,999 | 14 (5.1%) | 12 (5.5%) |
| $10,000 to $12,499 | 36 (13.2%) | 15 (6.9%) |
| $12,500 to $14,999 | 7 (2.6%) | 12 (5.5%) |
| $15,000 to $17,499 | 2 (0.7%) | 10 (4.6%) |
| $17,500 to $19,999 | 5 (1.8%) | 5 (2.3%) |
| $20,000 to $22,499 | 8 (2.9%) | 13 (6.0%) |
| $22,500 to $24,999 | 9 (3.3%) | 11 (5.1%) |
| $25,000 to $29,999 | 6 (2.2%) | 65 (29.8%) |
| $30,000 to $34,999 | 28 (10.3%) | 6 (2.8%) |
| $35,000 to $39,999 | 6 (2.2%) | 8 (3.7%) |
| $40,000 to $44,999 | 18 (6.6%) | 0 (0.0%) |
| $45,000 to $49,999 | 9 (3.3%) | 10 (4.6%) |
| $50,000 to $54,999 | 13 (4.8%) | 0 (0.0%) |
| $55,000 to $64,999 | 20 (7.3%) | 6 (2.8%) |
| $65,000 to $74,999 | 12 (4.4%) | 2 (0.9%) |
| $75,000 to $99,999 | 53 (19.4%) | 9 (4.1%) |
| $100,000+ | 10 (3.7%) | 0 (0.0%) |
| Total | 273 (100.0%) | 218 (100.0%) |
Earnings by Sex by Educational Attainment in Hyndman borough
Average earnings in Hyndman borough are $39,583 for men and $25,403 for women, a difference of 35.8%. Men with an educational attainment of high school diploma enjoy the highest average annual earnings of $38,333, while those with less than high school education earn the least with $32,500. Women with an educational attainment of bachelor's degree earn the most with the average annual earnings of $49,464, while those with less than high school education have the smallest earnings of $9,464.
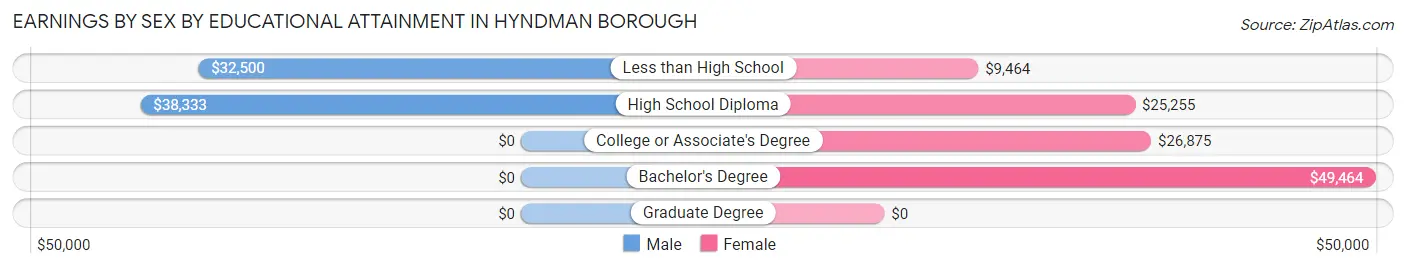
| Educational Attainment | Male Income | Female Income |
| Less than High School | $32,500 | $9,464 |
| High School Diploma | $38,333 | $25,255 |
| College or Associate's Degree | - | - |
| Bachelor's Degree | - | - |
| Graduate Degree | - | - |
| Total | $39,583 | $25,403 |
Family Income in Hyndman borough
Family Income Brackets in Hyndman borough
According to the Hyndman borough family income data, there are 62 families falling into the $50,000 to $74,999 income range, which is the most common income bracket and makes up 24.7% of all families.
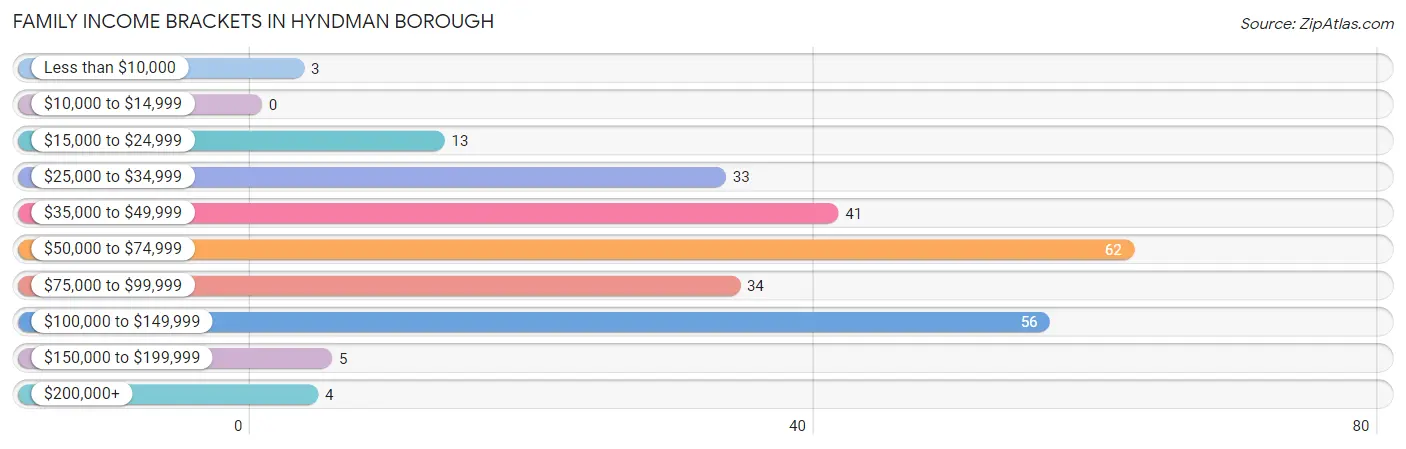
| Income Bracket | # Families | % Families |
| Less than $10,000 | 3 | 1.2% |
| $10,000 to $14,999 | 0 | 0.0% |
| $15,000 to $24,999 | 13 | 5.2% |
| $25,000 to $34,999 | 33 | 13.1% |
| $35,000 to $49,999 | 41 | 16.3% |
| $50,000 to $74,999 | 62 | 24.7% |
| $75,000 to $99,999 | 34 | 13.5% |
| $100,000 to $149,999 | 56 | 22.3% |
| $150,000 to $199,999 | 5 | 2.0% |
| $200,000+ | 4 | 1.6% |
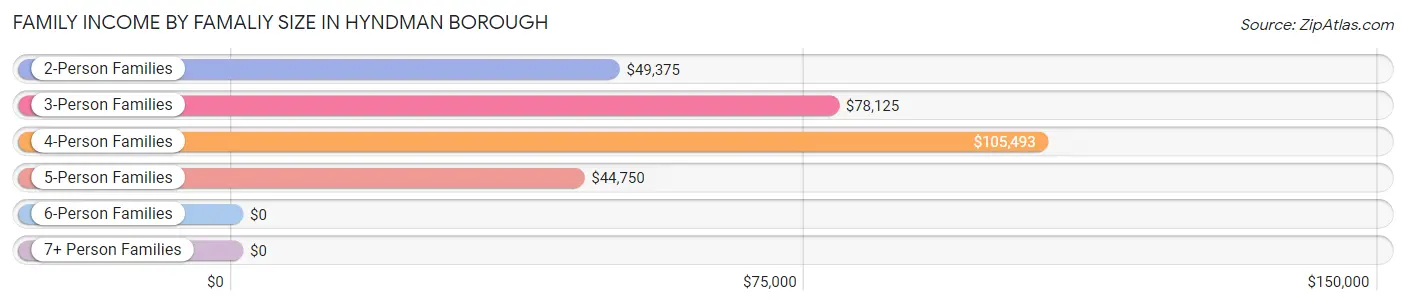
Family Income by Famaliy Size in Hyndman borough
4-person families (67 | 26.7%) account for the highest median family income in Hyndman borough with $105,493 per family, while 4-person families (67 | 26.7%) have the highest median income of $26,373 per family member.
| Income Bracket | # Families | Median Income |
| 2-Person Families | 114 (45.4%) | $49,375 |
| 3-Person Families | 55 (21.9%) | $78,125 |
| 4-Person Families | 67 (26.7%) | $105,493 |
| 5-Person Families | 15 (6.0%) | $44,750 |
| 6-Person Families | 0 (0.0%) | $0 |
| 7+ Person Families | 0 (0.0%) | $0 |
| Total | 251 (100.0%) | $64,688 |
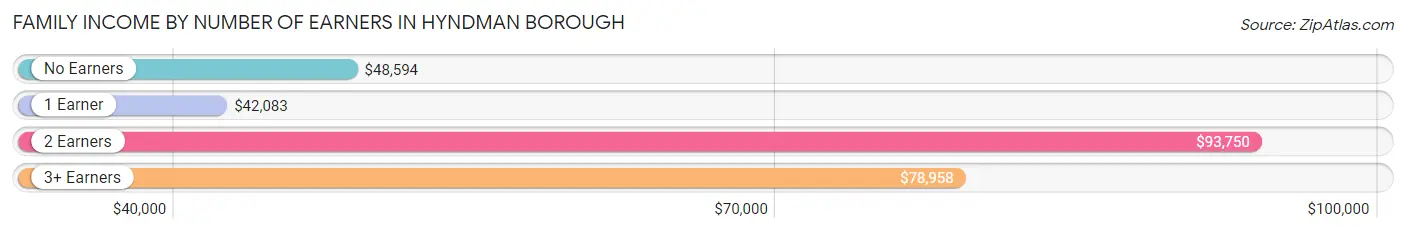
Family Income by Number of Earners in Hyndman borough
The median family income in Hyndman borough is $64,688, with families comprising 2 earners (106) having the highest median family income of $93,750, while families with 1 earner (67) have the lowest median family income of $42,083, accounting for 42.2% and 26.7% of families, respectively.
| Number of Earners | # Families | Median Income |
| No Earners | 45 (17.9%) | $48,594 |
| 1 Earner | 67 (26.7%) | $42,083 |
| 2 Earners | 106 (42.2%) | $93,750 |
| 3+ Earners | 33 (13.2%) | $78,958 |
| Total | 251 (100.0%) | $64,688 |
Household Income in Hyndman borough
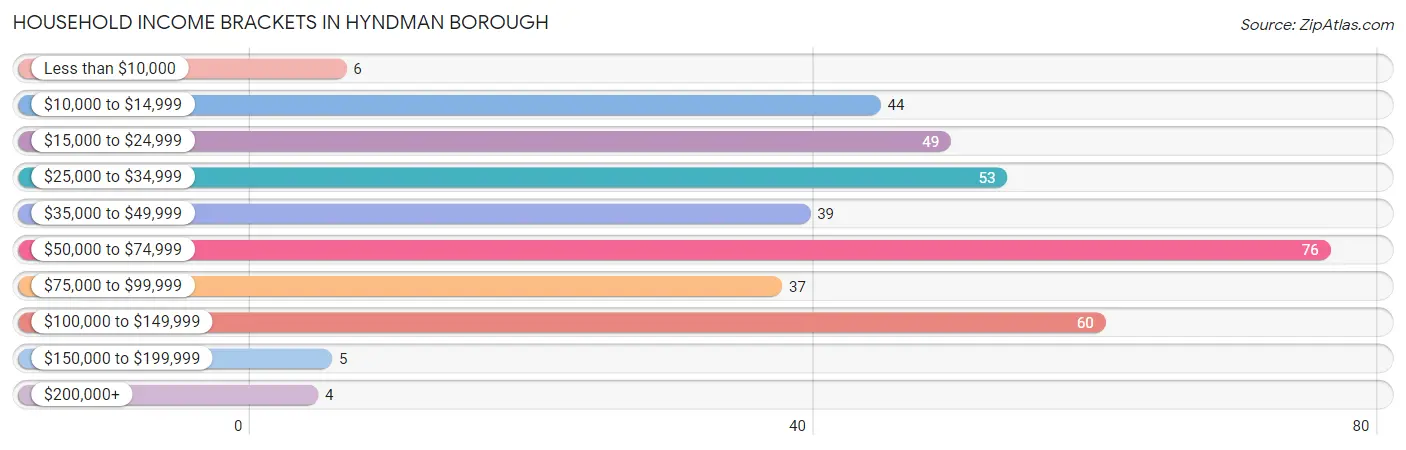
Household Income Brackets in Hyndman borough
With 76 households falling in the category, the $50,000 to $74,999 income range is the most frequent in Hyndman borough, accounting for 20.4% of all households. In contrast, only 4 households (1.1%) fall into the $200,000+ income bracket, making it the least populous group.
| Income Bracket | # Households | % Households |
| Less than $10,000 | 6 | 1.6% |
| $10,000 to $14,999 | 44 | 11.8% |
| $15,000 to $24,999 | 49 | 13.1% |
| $25,000 to $34,999 | 53 | 14.2% |
| $35,000 to $49,999 | 39 | 10.5% |
| $50,000 to $74,999 | 76 | 20.4% |
| $75,000 to $99,999 | 37 | 9.9% |
| $100,000 to $149,999 | 60 | 16.1% |
| $150,000 to $199,999 | 5 | 1.3% |
| $200,000+ | 4 | 1.1% |
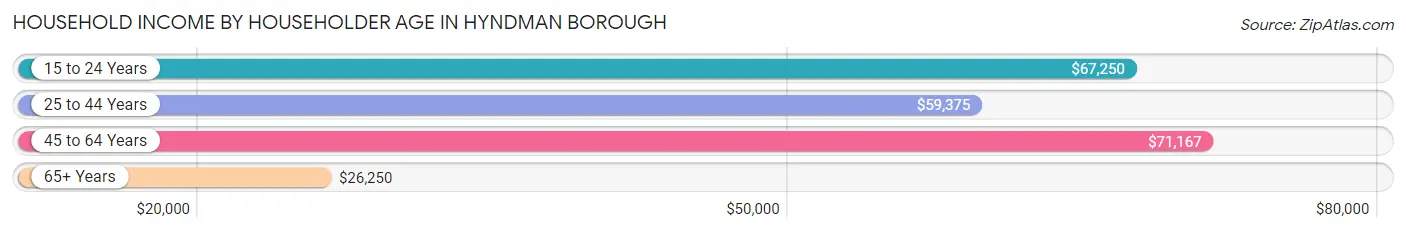
Household Income by Householder Age in Hyndman borough
The median household income in Hyndman borough is $48,750, with the highest median household income of $71,167 found in the 45 to 64 years age bracket for the primary householder. A total of 174 households (46.7%) fall into this category. Meanwhile, the 65+ years age bracket for the primary householder has the lowest median household income of $26,250, with 116 households (31.1%) in this group.
| Income Bracket | # Households | Median Income |
| 15 to 24 Years | 17 (4.6%) | $67,250 |
| 25 to 44 Years | 66 (17.7%) | $59,375 |
| 45 to 64 Years | 174 (46.7%) | $71,167 |
| 65+ Years | 116 (31.1%) | $26,250 |
| Total | 373 (100.0%) | $48,750 |
Poverty in Hyndman borough
Income Below Poverty by Sex and Age in Hyndman borough
With 13.0% poverty level for males and 8.6% for females among the residents of Hyndman borough, 15 year old males and 15 year old females are the most vulnerable to poverty, with 3 males (60.0%) and 2 females (66.7%) in their respective age groups living below the poverty level.
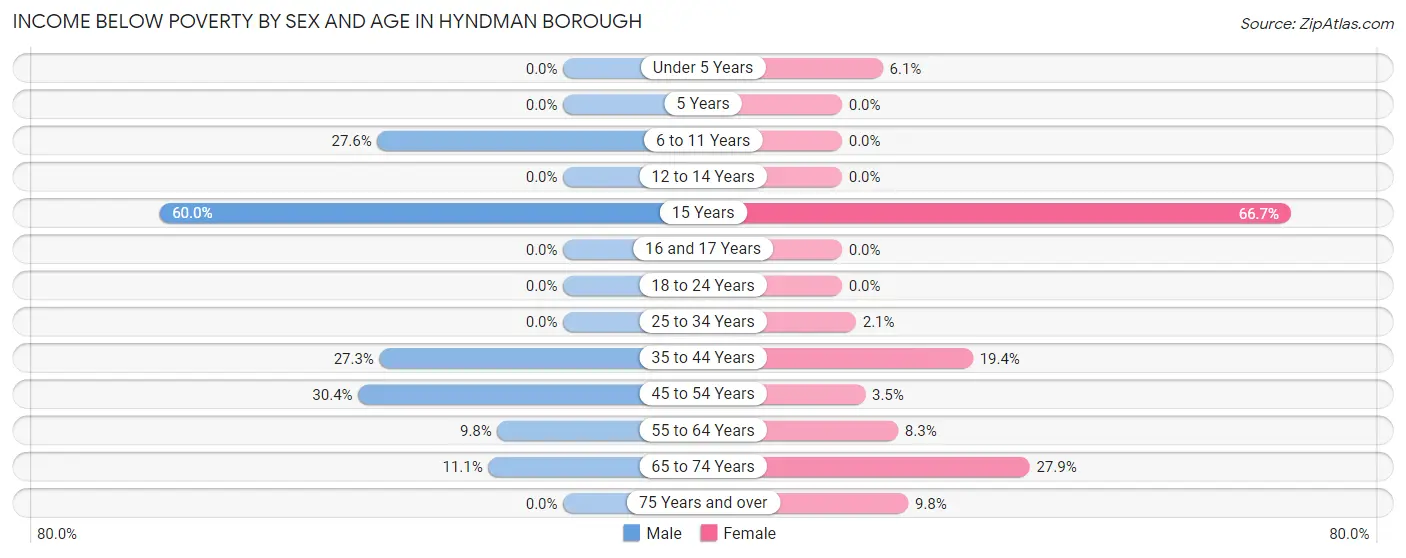
| Age Bracket | Male | Female |
| Under 5 Years | 0 (0.0%) | 2 (6.1%) |
| 5 Years | 0 (0.0%) | 0 (0.0%) |
| 6 to 11 Years | 8 (27.6%) | 0 (0.0%) |
| 12 to 14 Years | 0 (0.0%) | 0 (0.0%) |
| 15 Years | 3 (60.0%) | 2 (66.7%) |
| 16 and 17 Years | 0 (0.0%) | 0 (0.0%) |
| 18 to 24 Years | 0 (0.0%) | 0 (0.0%) |
| 25 to 34 Years | 0 (0.0%) | 2 (2.1%) |
| 35 to 44 Years | 15 (27.3%) | 7 (19.4%) |
| 45 to 54 Years | 14 (30.4%) | 2 (3.5%) |
| 55 to 64 Years | 12 (9.8%) | 6 (8.3%) |
| 65 to 74 Years | 2 (11.1%) | 17 (27.9%) |
| 75 Years and over | 0 (0.0%) | 6 (9.8%) |
| Total | 54 (13.0%) | 44 (8.6%) |
Income Above Poverty by Sex and Age in Hyndman borough
According to the poverty statistics in Hyndman borough, males aged under 5 years and females aged 5 years are the age groups that are most secure financially, with 100.0% of males and 100.0% of females in these age groups living above the poverty line.
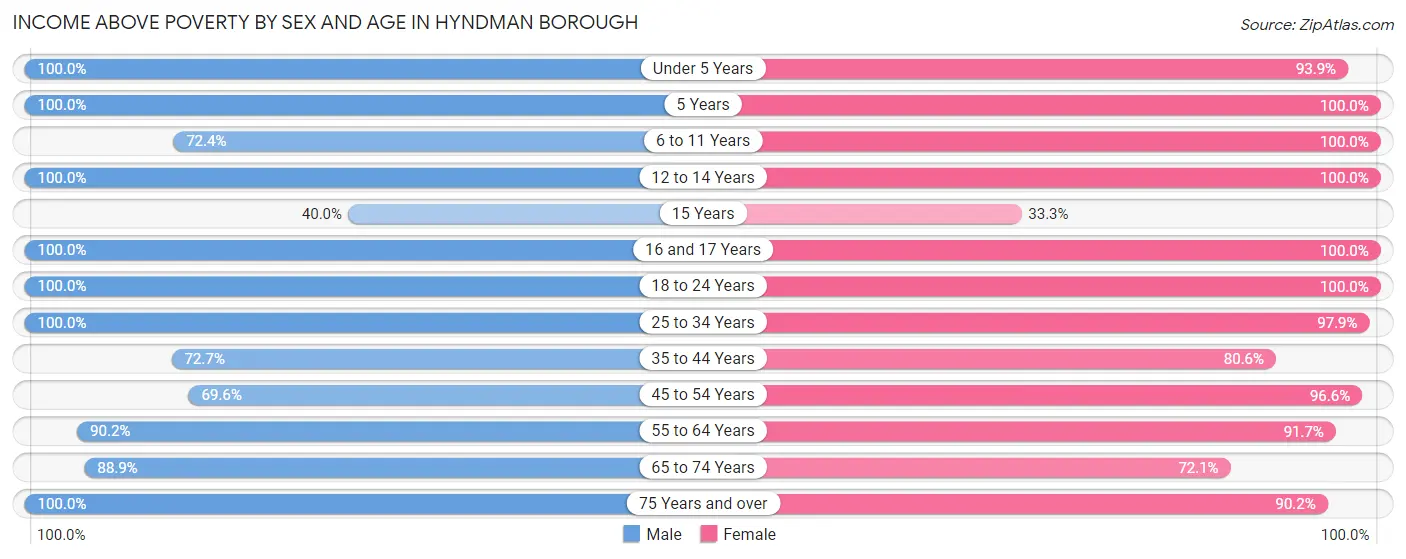
| Age Bracket | Male | Female |
| Under 5 Years | 13 (100.0%) | 31 (93.9%) |
| 5 Years | 1 (100.0%) | 2 (100.0%) |
| 6 to 11 Years | 21 (72.4%) | 44 (100.0%) |
| 12 to 14 Years | 13 (100.0%) | 4 (100.0%) |
| 15 Years | 2 (40.0%) | 1 (33.3%) |
| 16 and 17 Years | 3 (100.0%) | 5 (100.0%) |
| 18 to 24 Years | 38 (100.0%) | 34 (100.0%) |
| 25 to 34 Years | 45 (100.0%) | 94 (97.9%) |
| 35 to 44 Years | 40 (72.7%) | 29 (80.6%) |
| 45 to 54 Years | 32 (69.6%) | 56 (96.6%) |
| 55 to 64 Years | 111 (90.2%) | 66 (91.7%) |
| 65 to 74 Years | 16 (88.9%) | 44 (72.1%) |
| 75 Years and over | 26 (100.0%) | 55 (90.2%) |
| Total | 361 (87.0%) | 465 (91.4%) |
Income Below Poverty Among Married-Couple Families in Hyndman borough
The poverty statistics for married-couple families in Hyndman borough show that 3.0% or 6 of the total 197 families live below the poverty line. Families with 1 or 2 children have the highest poverty rate of 5.9%, comprising of 4 families. On the other hand, families with 3 or 4 children have the lowest poverty rate of 0.0%, which includes 0 families.
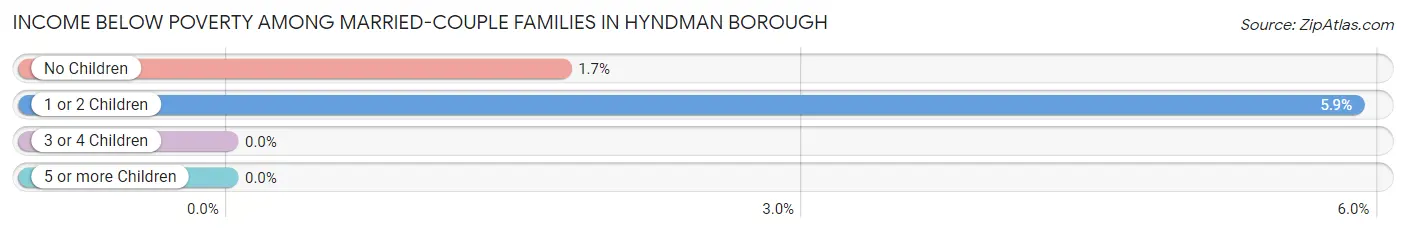
| Children | Above Poverty | Below Poverty |
| No Children | 113 (98.3%) | 2 (1.7%) |
| 1 or 2 Children | 64 (94.1%) | 4 (5.9%) |
| 3 or 4 Children | 14 (100.0%) | 0 (0.0%) |
| 5 or more Children | 0 (0.0%) | 0 (0.0%) |
| Total | 191 (97.0%) | 6 (3.0%) |
Income Below Poverty Among Single-Parent Households in Hyndman borough
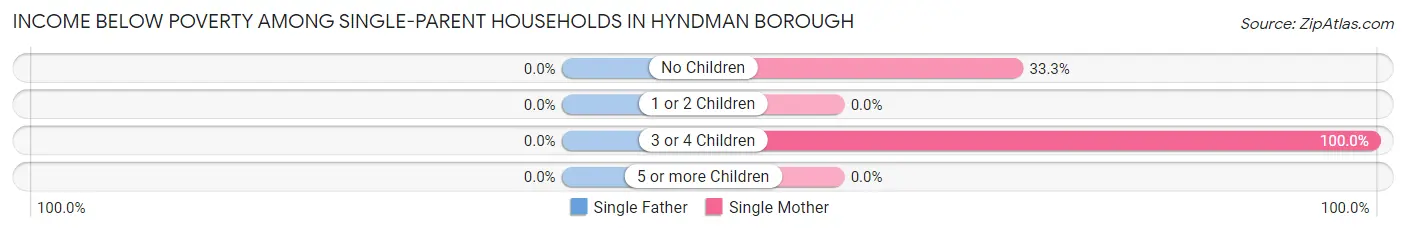
| Children | Single Father | Single Mother |
| No Children | 0 (0.0%) | 9 (33.3%) |
| 1 or 2 Children | 0 (0.0%) | 0 (0.0%) |
| 3 or 4 Children | 0 (0.0%) | 1 (100.0%) |
| 5 or more Children | 0 (0.0%) | 0 (0.0%) |
| Total | 0 (0.0%) | 10 (27.0%) |
Income Below Poverty Among Married-Couple vs Single-Parent Households in Hyndman borough
The poverty data for Hyndman borough shows that 6 of the married-couple family households (3.0%) and 10 of the single-parent households (18.5%) are living below the poverty level. Within the married-couple family households, those with 1 or 2 children have the highest poverty rate, with 4 households (5.9%) falling below the poverty line. Among the single-parent households, those with 3 or 4 children have the highest poverty rate, with 1 household (100.0%) living below poverty.
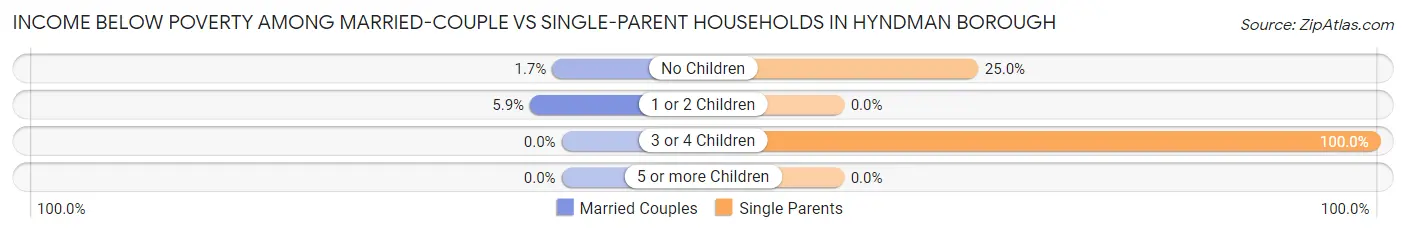
| Children | Married-Couple Families | Single-Parent Households |
| No Children | 2 (1.7%) | 9 (25.0%) |
| 1 or 2 Children | 4 (5.9%) | 0 (0.0%) |
| 3 or 4 Children | 0 (0.0%) | 1 (100.0%) |
| 5 or more Children | 0 (0.0%) | 0 (0.0%) |
| Total | 6 (3.0%) | 10 (18.5%) |
Race in Hyndman borough
The most populous races in Hyndman borough are White / Caucasian (903 | 97.5%), Two or more Races (13 | 1.4%), and Hispanic or Latino (5 | 0.5%).
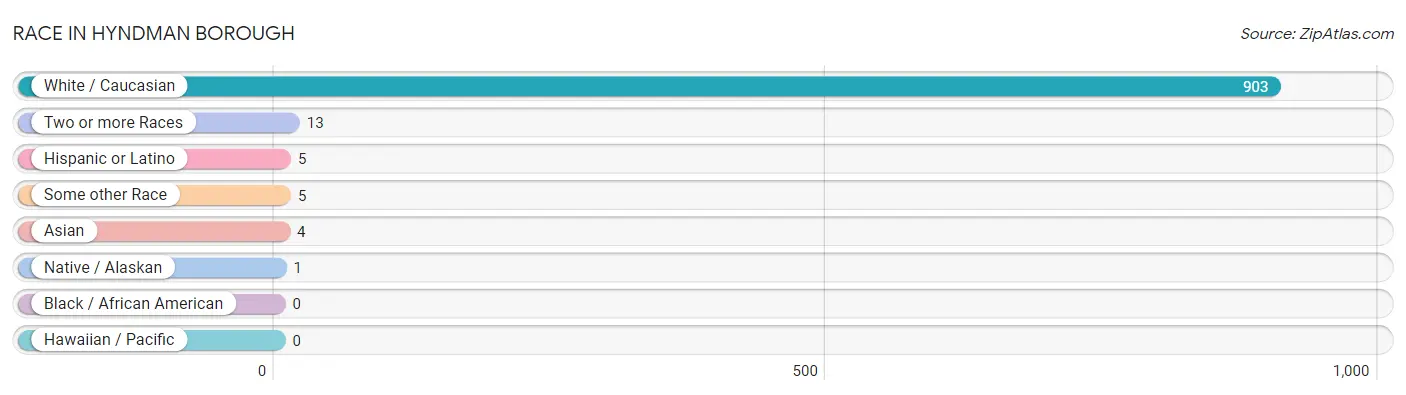
| Race | # Population | % Population |
| Asian | 4 | 0.4% |
| Black / African American | 0 | 0.0% |
| Hawaiian / Pacific | 0 | 0.0% |
| Hispanic or Latino | 5 | 0.5% |
| Native / Alaskan | 1 | 0.1% |
| White / Caucasian | 903 | 97.5% |
| Two or more Races | 13 | 1.4% |
| Some other Race | 5 | 0.5% |
| Total | 926 | 100.0% |
Ancestry in Hyndman borough
The most populous ancestries reported in Hyndman borough are German (189 | 20.4%), English (176 | 19.0%), Irish (44 | 4.8%), Polish (33 | 3.6%), and European (31 | 3.4%), together accounting for 51.1% of all Hyndman borough residents.
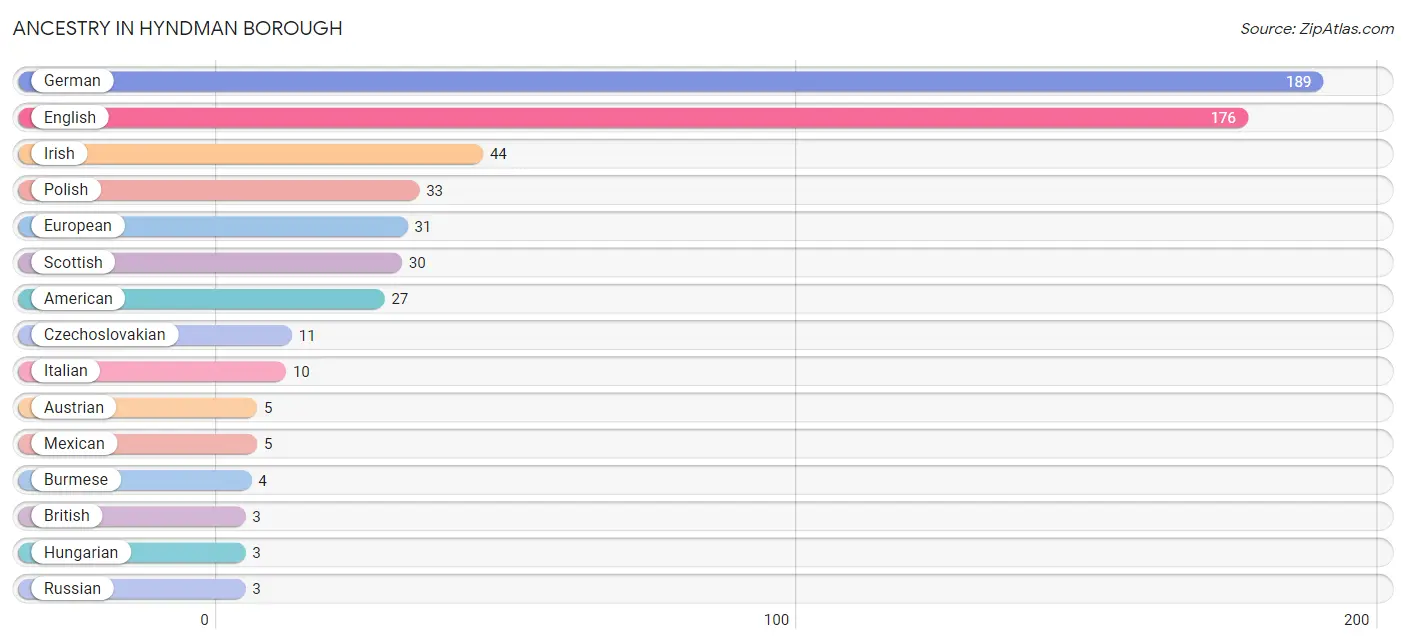
| Ancestry | # Population | % Population |
| Alaskan Athabascan | 1 | 0.1% |
| American | 27 | 2.9% |
| Austrian | 5 | 0.5% |
| British | 3 | 0.3% |
| Burmese | 4 | 0.4% |
| Czechoslovakian | 11 | 1.2% |
| Dutch | 2 | 0.2% |
| English | 176 | 19.0% |
| European | 31 | 3.4% |
| German | 189 | 20.4% |
| Hungarian | 3 | 0.3% |
| Irish | 44 | 4.8% |
| Italian | 10 | 1.1% |
| Mexican | 5 | 0.5% |
| Polish | 33 | 3.6% |
| Russian | 3 | 0.3% |
| Scottish | 30 | 3.2% |
| Swedish | 2 | 0.2% | View All 18 Rows |
Immigrants in Hyndman borough
The most numerous immigrant groups reported in Hyndman borough came from Asia (4 | 0.4%), Eastern Asia (4 | 0.4%), Korea (4 | 0.4%), Central America (1 | 0.1%), and Latin America (1 | 0.1%), together accounting for 1.5% of all Hyndman borough residents.
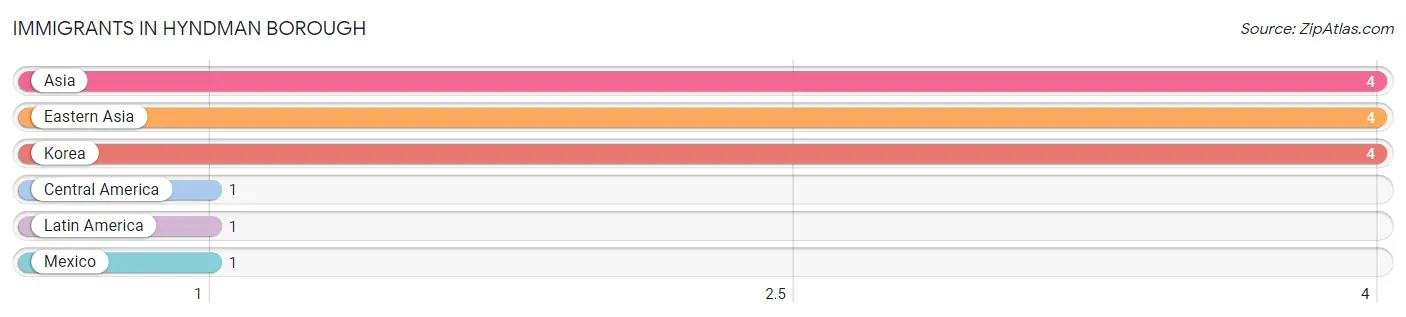
| Immigration Origin | # Population | % Population |
| Asia | 4 | 0.4% |
| Central America | 1 | 0.1% |
| Eastern Asia | 4 | 0.4% |
| Korea | 4 | 0.4% |
| Latin America | 1 | 0.1% |
| Mexico | 1 | 0.1% | View All 6 Rows |
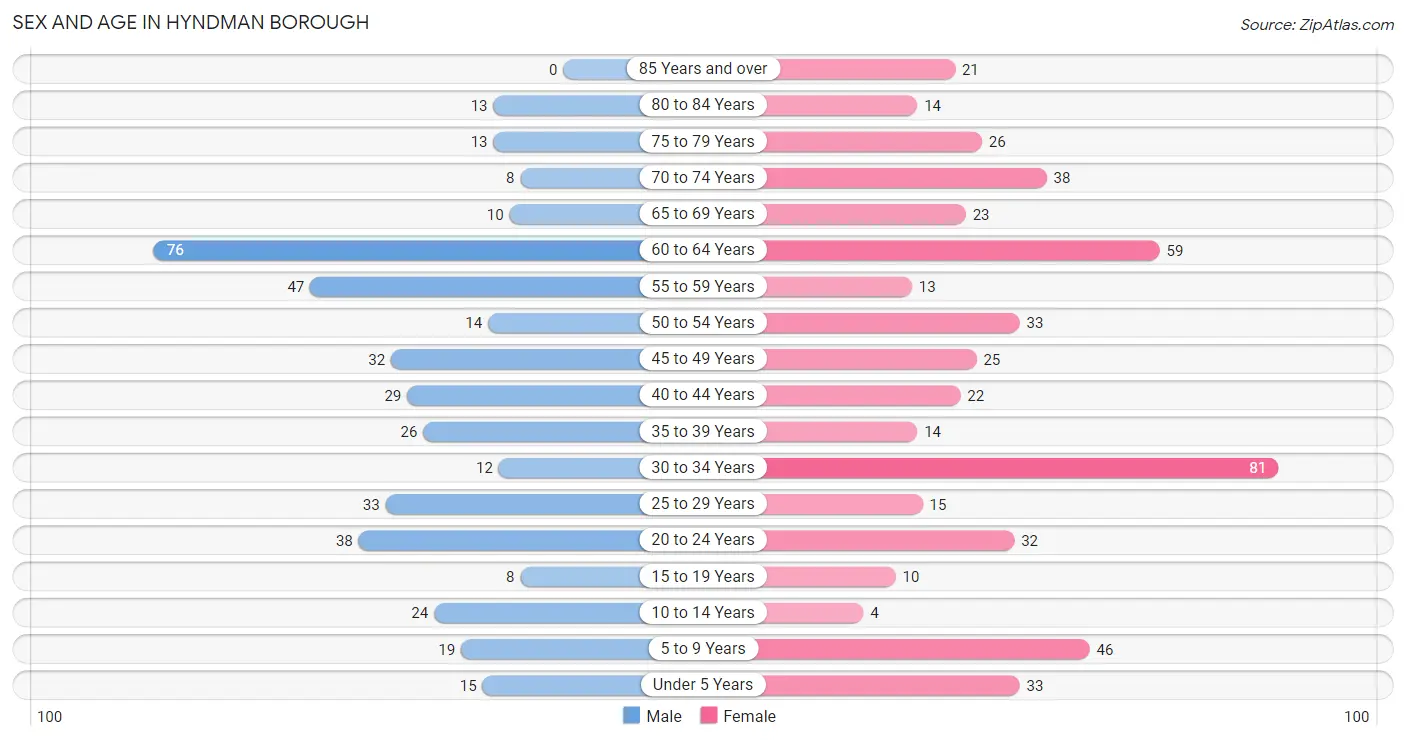
Sex and Age in Hyndman borough
Sex and Age in Hyndman borough
The most populous age groups in Hyndman borough are 60 to 64 Years (76 | 18.2%) for men and 30 to 34 Years (81 | 15.9%) for women.
| Age Bracket | Male | Female |
| Under 5 Years | 15 (3.6%) | 33 (6.5%) |
| 5 to 9 Years | 19 (4.6%) | 46 (9.0%) |
| 10 to 14 Years | 24 (5.8%) | 4 (0.8%) |
| 15 to 19 Years | 8 (1.9%) | 10 (2.0%) |
| 20 to 24 Years | 38 (9.1%) | 32 (6.3%) |
| 25 to 29 Years | 33 (7.9%) | 15 (2.9%) |
| 30 to 34 Years | 12 (2.9%) | 81 (15.9%) |
| 35 to 39 Years | 26 (6.2%) | 14 (2.8%) |
| 40 to 44 Years | 29 (7.0%) | 22 (4.3%) |
| 45 to 49 Years | 32 (7.7%) | 25 (4.9%) |
| 50 to 54 Years | 14 (3.4%) | 33 (6.5%) |
| 55 to 59 Years | 47 (11.3%) | 13 (2.5%) |
| 60 to 64 Years | 76 (18.2%) | 59 (11.6%) |
| 65 to 69 Years | 10 (2.4%) | 23 (4.5%) |
| 70 to 74 Years | 8 (1.9%) | 38 (7.5%) |
| 75 to 79 Years | 13 (3.1%) | 26 (5.1%) |
| 80 to 84 Years | 13 (3.1%) | 14 (2.8%) |
| 85 Years and over | 0 (0.0%) | 21 (4.1%) |
| Total | 417 (100.0%) | 509 (100.0%) |
Families and Households in Hyndman borough
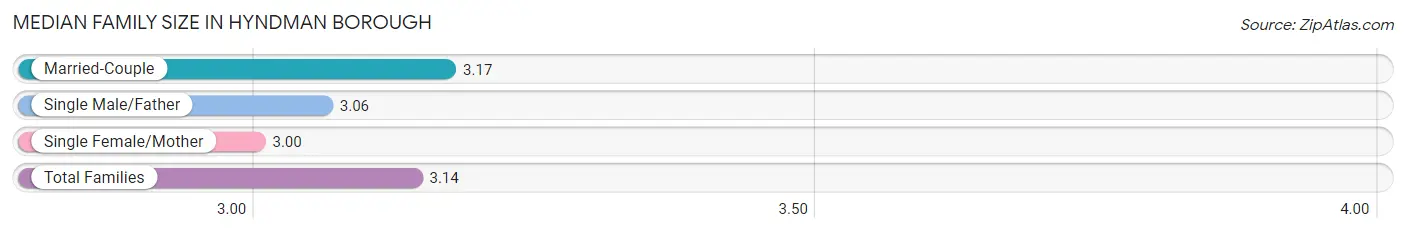
Median Family Size in Hyndman borough
The median family size in Hyndman borough is 3.14 persons per family, with married-couple families (197 | 78.5%) accounting for the largest median family size of 3.17 persons per family. On the other hand, single female/mother families (37 | 14.7%) represent the smallest median family size with 3.00 persons per family.
| Family Type | # Families | Family Size |
| Married-Couple | 197 (78.5%) | 3.17 |
| Single Male/Father | 17 (6.8%) | 3.06 |
| Single Female/Mother | 37 (14.7%) | 3.00 |
| Total Families | 251 (100.0%) | 3.14 |
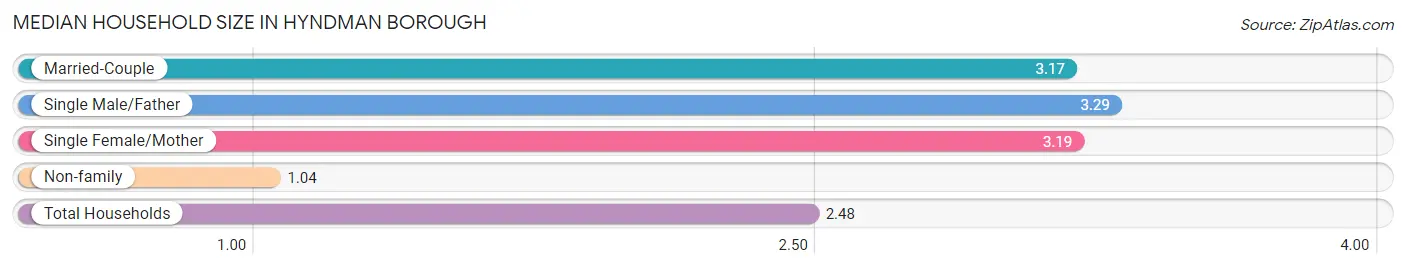
Median Household Size in Hyndman borough
The median household size in Hyndman borough is 2.48 persons per household, with single male/father households (17 | 4.6%) accounting for the largest median household size of 3.29 persons per household. non-family households (122 | 32.7%) represent the smallest median household size with 1.04 persons per household.
| Household Type | # Households | Household Size |
| Married-Couple | 197 (52.8%) | 3.17 |
| Single Male/Father | 17 (4.6%) | 3.29 |
| Single Female/Mother | 37 (9.9%) | 3.19 |
| Non-family | 122 (32.7%) | 1.04 |
| Total Households | 373 (100.0%) | 2.48 |
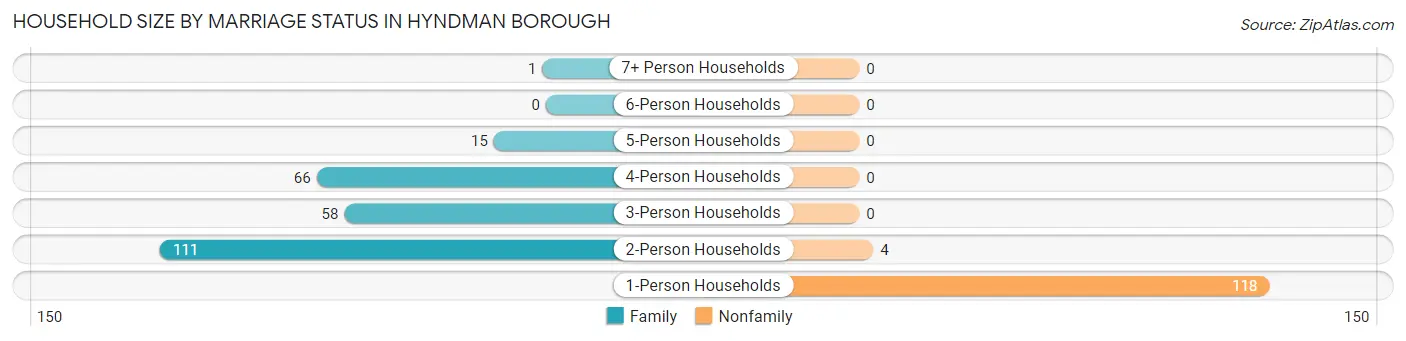
Household Size by Marriage Status in Hyndman borough
Out of a total of 373 households in Hyndman borough, 251 (67.3%) are family households, while 122 (32.7%) are nonfamily households. The most numerous type of family households are 2-person households, comprising 111, and the most common type of nonfamily households are 1-person households, comprising 118.
| Household Size | Family Households | Nonfamily Households |
| 1-Person Households | - | 118 (31.6%) |
| 2-Person Households | 111 (29.8%) | 4 (1.1%) |
| 3-Person Households | 58 (15.5%) | 0 (0.0%) |
| 4-Person Households | 66 (17.7%) | 0 (0.0%) |
| 5-Person Households | 15 (4.0%) | 0 (0.0%) |
| 6-Person Households | 0 (0.0%) | 0 (0.0%) |
| 7+ Person Households | 1 (0.3%) | 0 (0.0%) |
| Total | 251 (67.3%) | 122 (32.7%) |
Female Fertility in Hyndman borough
Fertility by Age in Hyndman borough
Average fertility rate in Hyndman borough is 79.0 births per 1,000 women. Women in the age bracket of 20 to 34 years have the highest fertility rate with 125.0 births per 1,000 women. Women in the age bracket of 20 to 34 years acount for 100.0% of all women with births.
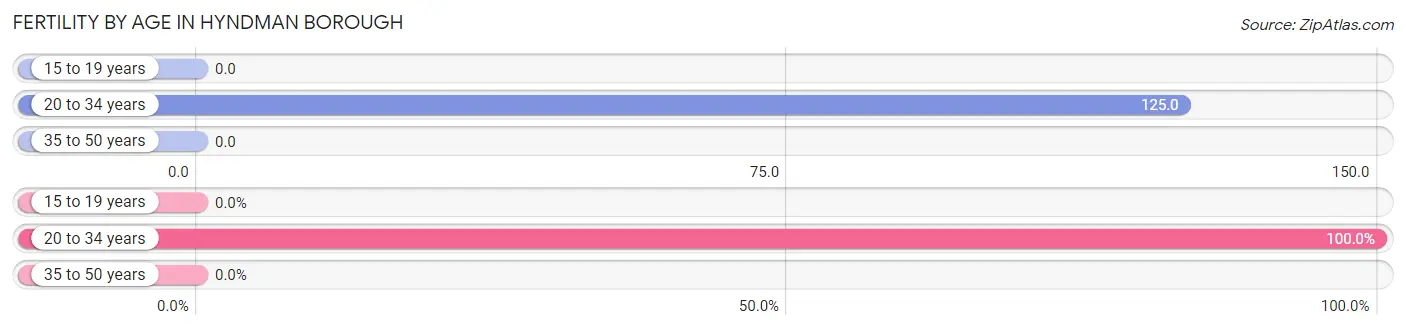
| Age Bracket | Women with Births | Births / 1,000 Women |
| 15 to 19 years | 0 (0.0%) | 0.0 |
| 20 to 34 years | 16 (100.0%) | 125.0 |
| 35 to 50 years | 0 (0.0%) | 0.0 |
| Total | 16 (100.0%) | 79.0 |
Fertility by Age by Marriage Status in Hyndman borough
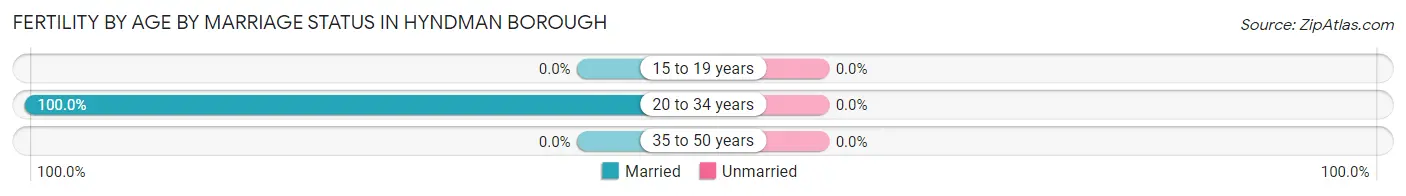
| Age Bracket | Married | Unmarried |
| 15 to 19 years | 0 (0.0%) | 0 (0.0%) |
| 20 to 34 years | 16 (100.0%) | 0 (0.0%) |
| 35 to 50 years | 0 (0.0%) | 0 (0.0%) |
| Total | 16 (100.0%) | 0 (0.0%) |
Fertility by Education in Hyndman borough
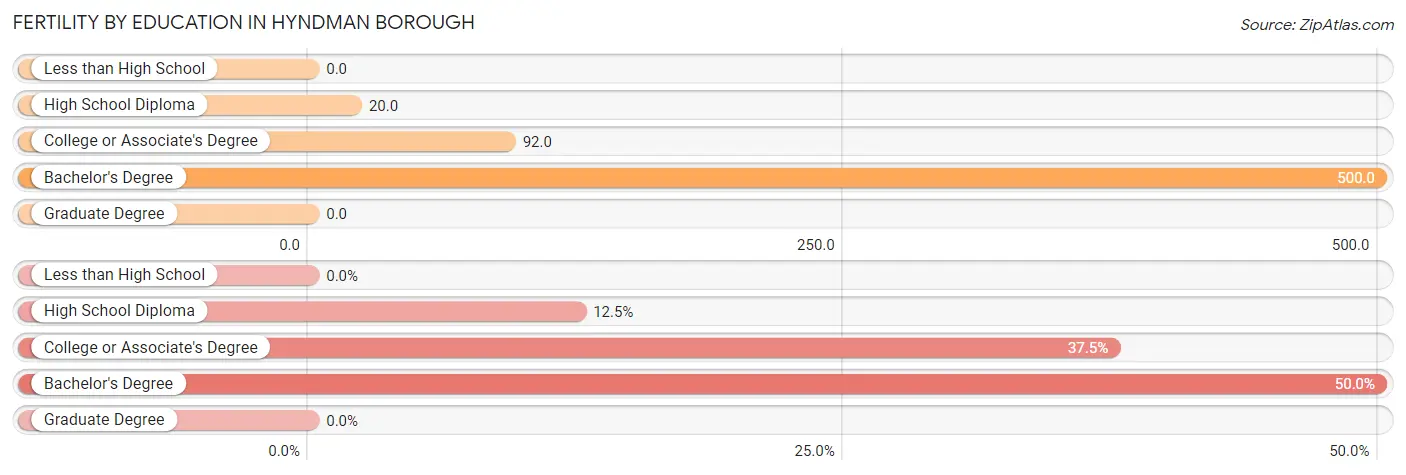
| Educational Attainment | Women with Births | Births / 1,000 Women |
| Less than High School | 0 (0.0%) | 0.0 |
| High School Diploma | 2 (12.5%) | 20.0 |
| College or Associate's Degree | 6 (37.5%) | 92.0 |
| Bachelor's Degree | 8 (50.0%) | 500.0 |
| Graduate Degree | 0 (0.0%) | 0.0 |
| Total | 16 (100.0%) | 79.0 |
Fertility by Education by Marriage Status in Hyndman borough
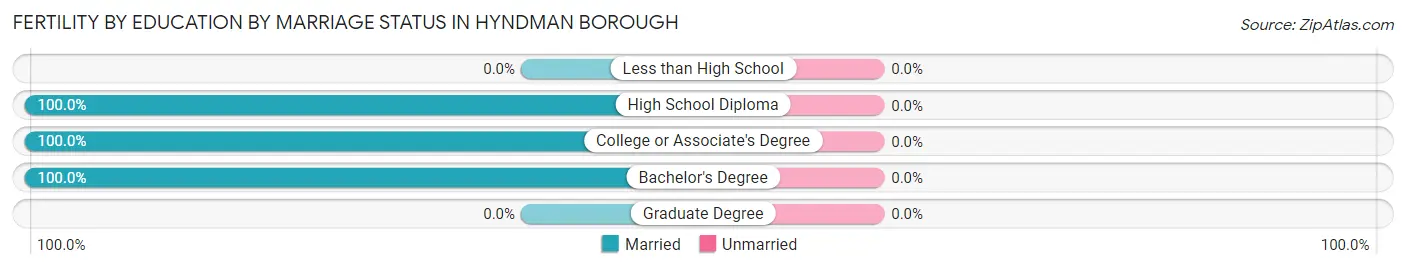
| Educational Attainment | Married | Unmarried |
| Less than High School | 0 (0.0%) | 0 (0.0%) |
| High School Diploma | 2 (100.0%) | 0 (0.0%) |
| College or Associate's Degree | 6 (100.0%) | 0 (0.0%) |
| Bachelor's Degree | 8 (100.0%) | 0 (0.0%) |
| Graduate Degree | 0 (0.0%) | 0 (0.0%) |
| Total | 16 (100.0%) | 0 (0.0%) |
Employment Characteristics in Hyndman borough
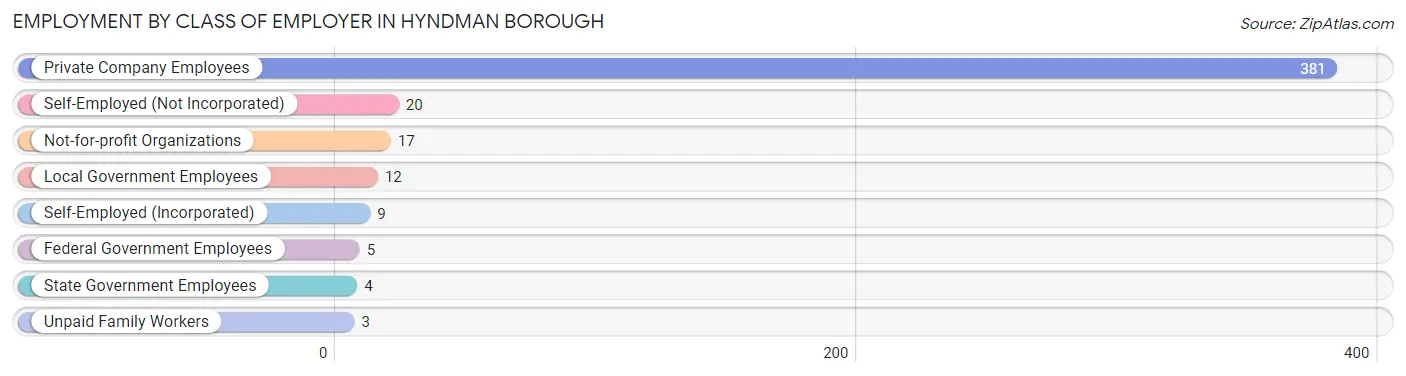
Employment by Class of Employer in Hyndman borough
Among the 451 employed individuals in Hyndman borough, private company employees (381 | 84.5%), self-employed (not incorporated) (20 | 4.4%), and not-for-profit organizations (17 | 3.8%) make up the most common classes of employment.
| Employer Class | # Employees | % Employees |
| Private Company Employees | 381 | 84.5% |
| Self-Employed (Incorporated) | 9 | 2.0% |
| Self-Employed (Not Incorporated) | 20 | 4.4% |
| Not-for-profit Organizations | 17 | 3.8% |
| Local Government Employees | 12 | 2.7% |
| State Government Employees | 4 | 0.9% |
| Federal Government Employees | 5 | 1.1% |
| Unpaid Family Workers | 3 | 0.7% |
| Total | 451 | 100.0% |
Employment Status by Age in Hyndman borough
According to the labor force statistics for Hyndman borough, out of the total population over 16 years of age (777), 61.9% or 481 individuals are in the labor force, with 5.0% or 24 of them unemployed. The age group with the highest labor force participation rate is 25 to 29 years, with 97.9% or 47 individuals in the labor force. Within the labor force, the 55 to 59 years age range has the highest percentage of unemployed individuals, with 27.5% or 11 of them being unemployed.
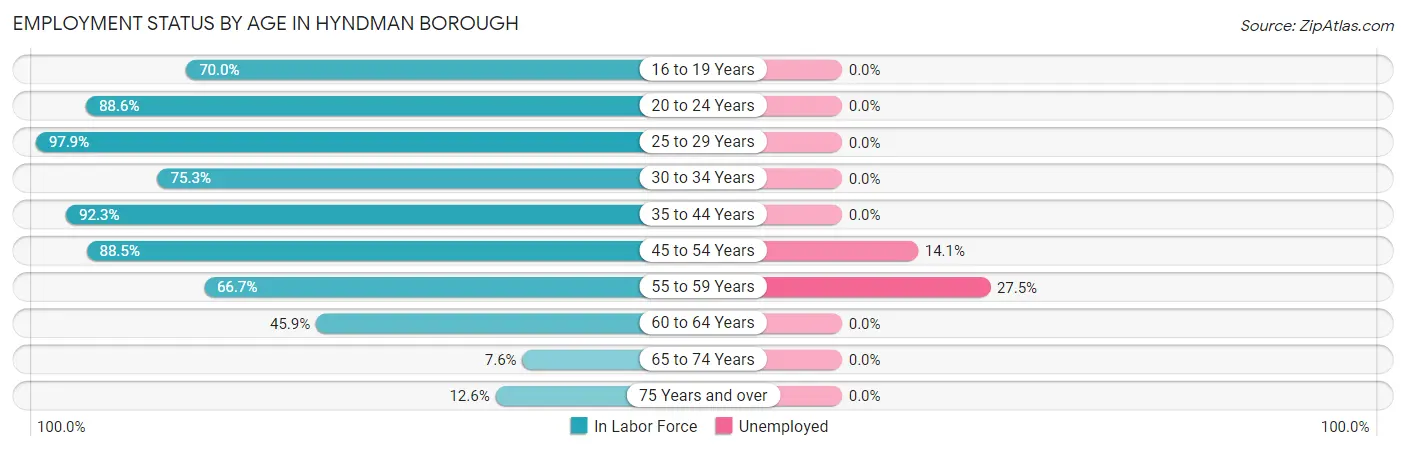
| Age Bracket | In Labor Force | Unemployed |
| 16 to 19 Years | 7 (70.0%) | 0 (0.0%) |
| 20 to 24 Years | 62 (88.6%) | 0 (0.0%) |
| 25 to 29 Years | 47 (97.9%) | 0 (0.0%) |
| 30 to 34 Years | 70 (75.3%) | 0 (0.0%) |
| 35 to 44 Years | 84 (92.3%) | 0 (0.0%) |
| 45 to 54 Years | 92 (88.5%) | 13 (14.1%) |
| 55 to 59 Years | 40 (66.7%) | 11 (27.5%) |
| 60 to 64 Years | 62 (45.9%) | 0 (0.0%) |
| 65 to 74 Years | 6 (7.6%) | 0 (0.0%) |
| 75 Years and over | 11 (12.6%) | 0 (0.0%) |
| Total | 481 (61.9%) | 24 (5.0%) |
Employment Status by Educational Attainment in Hyndman borough
According to labor force statistics for Hyndman borough, 74.4% of individuals (395) out of the total population between 25 and 64 years of age (531) are in the labor force, with 6.1% or 24 of them being unemployed. The group with the highest labor force participation rate are those with the educational attainment of less than high school, with 95.5% or 42 individuals in the labor force. Within the labor force, individuals with less than high school education have the highest percentage of unemployment, with 26.2% or 11 of them being unemployed.
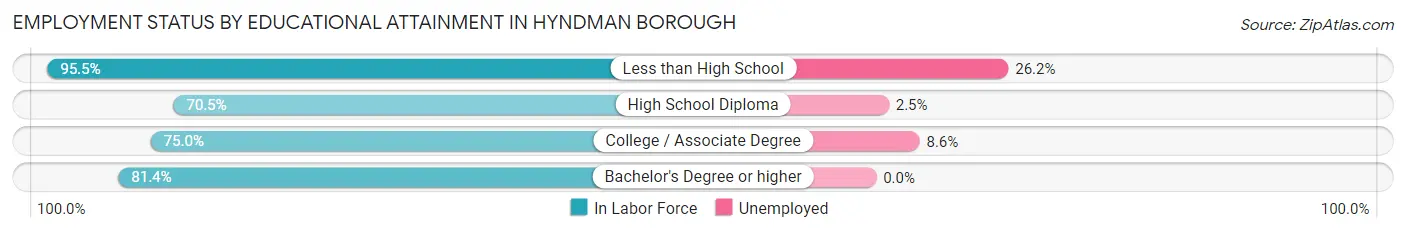
| Educational Attainment | In Labor Force | Unemployed |
| Less than High School | 42 (95.5%) | 12 (26.2%) |
| High School Diploma | 237 (70.5%) | 8 (2.5%) |
| College / Associate Degree | 81 (75.0%) | 9 (8.6%) |
| Bachelor's Degree or higher | 35 (81.4%) | 0 (0.0%) |
| Total | 395 (74.4%) | 32 (6.1%) |
Employment Occupations by Sex in Hyndman borough
Management, Business, Science and Arts Occupations
The most common Management, Business, Science and Arts occupations in Hyndman borough are Community & Social Service (25 | 5.5%), Management (23 | 5.0%), Education Instruction & Library (19 | 4.2%), Computers, Engineering & Science (17 | 3.7%), and Architecture & Engineering (14 | 3.1%).
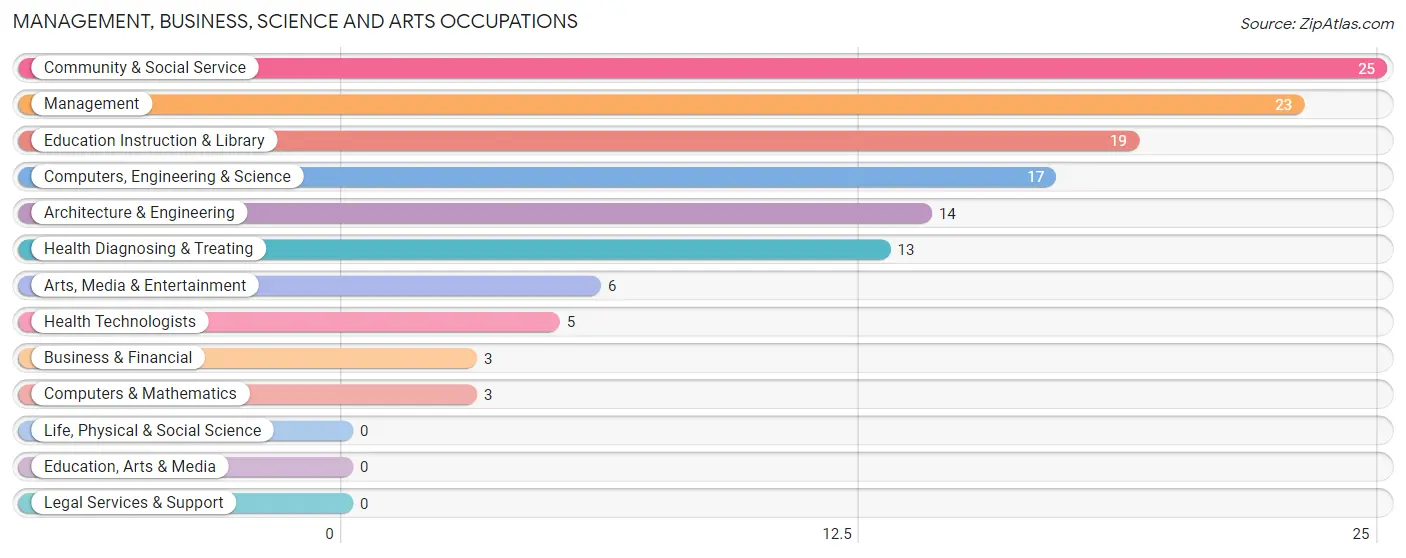
Management, Business, Science and Arts Occupations by Sex
Within the Management, Business, Science and Arts occupations in Hyndman borough, the most male-oriented occupations are Business & Financial (100.0%), Computers, Engineering & Science (100.0%), and Computers & Mathematics (100.0%), while the most female-oriented occupations are Health Diagnosing & Treating (100.0%), Health Technologists (100.0%), and Education Instruction & Library (89.5%).
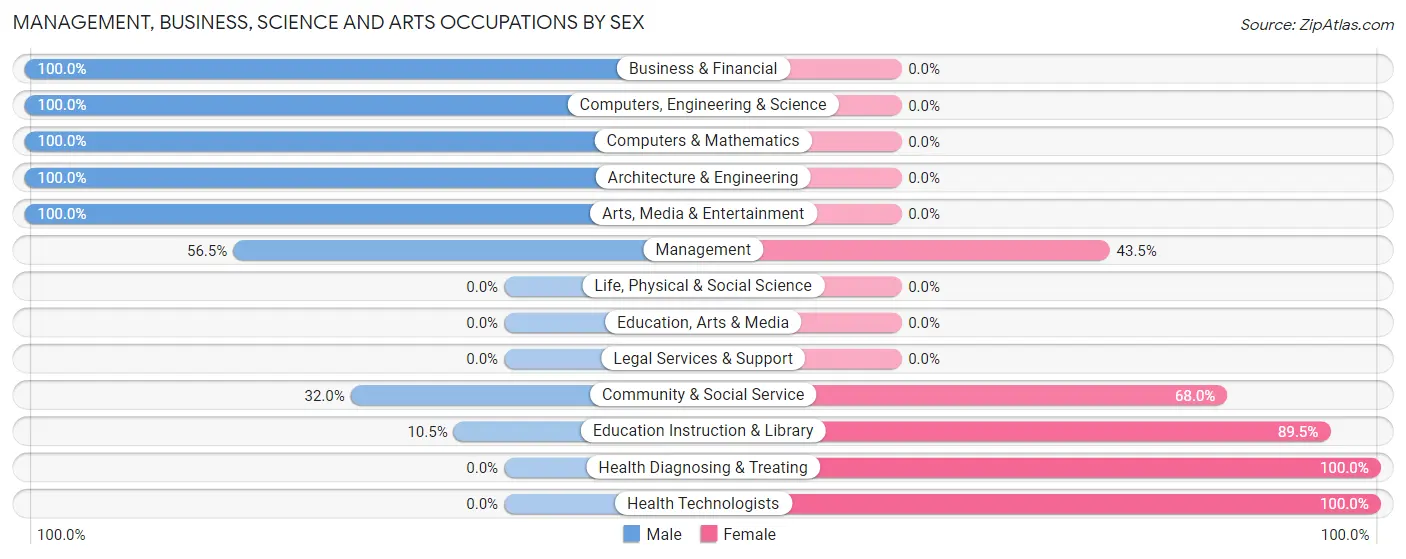
| Occupation | Male | Female |
| Management | 13 (56.5%) | 10 (43.5%) |
| Business & Financial | 3 (100.0%) | 0 (0.0%) |
| Computers, Engineering & Science | 17 (100.0%) | 0 (0.0%) |
| Computers & Mathematics | 3 (100.0%) | 0 (0.0%) |
| Architecture & Engineering | 14 (100.0%) | 0 (0.0%) |
| Life, Physical & Social Science | 0 (0.0%) | 0 (0.0%) |
| Community & Social Service | 8 (32.0%) | 17 (68.0%) |
| Education, Arts & Media | 0 (0.0%) | 0 (0.0%) |
| Legal Services & Support | 0 (0.0%) | 0 (0.0%) |
| Education Instruction & Library | 2 (10.5%) | 17 (89.5%) |
| Arts, Media & Entertainment | 6 (100.0%) | 0 (0.0%) |
| Health Diagnosing & Treating | 0 (0.0%) | 13 (100.0%) |
| Health Technologists | 0 (0.0%) | 5 (100.0%) |
| Total (Category) | 41 (50.6%) | 40 (49.4%) |
| Total (Overall) | 251 (54.9%) | 206 (45.1%) |
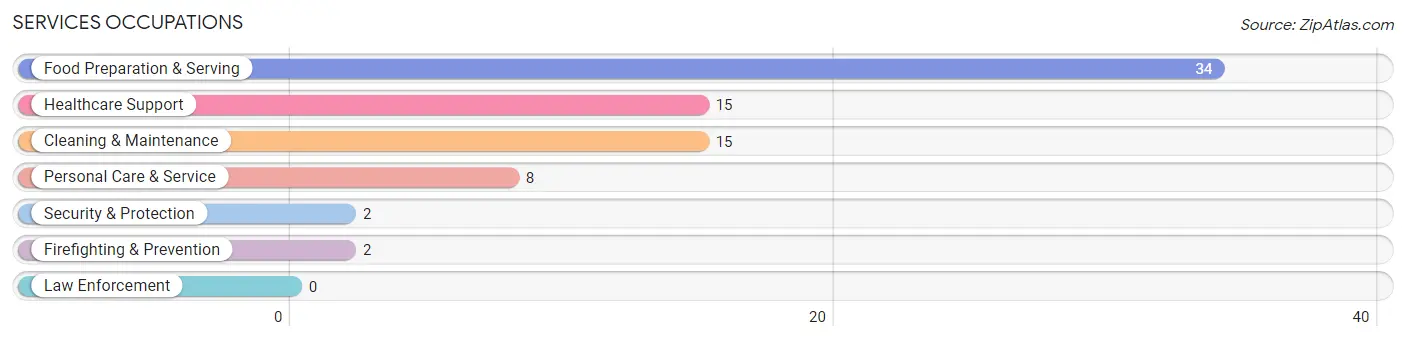
Services Occupations
The most common Services occupations in Hyndman borough are Food Preparation & Serving (34 | 7.4%), Healthcare Support (15 | 3.3%), Cleaning & Maintenance (15 | 3.3%), Personal Care & Service (8 | 1.8%), and Security & Protection (2 | 0.4%).
Services Occupations by Sex
Within the Services occupations in Hyndman borough, the most male-oriented occupations are Security & Protection (100.0%), Firefighting & Prevention (100.0%), and Cleaning & Maintenance (53.3%), while the most female-oriented occupations are Healthcare Support (100.0%), Food Preparation & Serving (79.4%), and Personal Care & Service (62.5%).
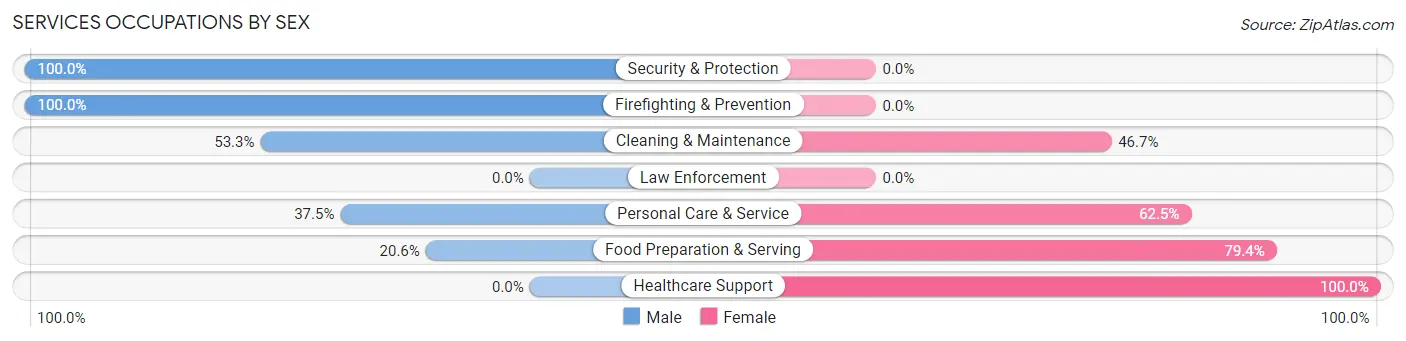
| Occupation | Male | Female |
| Healthcare Support | 0 (0.0%) | 15 (100.0%) |
| Security & Protection | 2 (100.0%) | 0 (0.0%) |
| Firefighting & Prevention | 2 (100.0%) | 0 (0.0%) |
| Law Enforcement | 0 (0.0%) | 0 (0.0%) |
| Food Preparation & Serving | 7 (20.6%) | 27 (79.4%) |
| Cleaning & Maintenance | 8 (53.3%) | 7 (46.7%) |
| Personal Care & Service | 3 (37.5%) | 5 (62.5%) |
| Total (Category) | 20 (27.0%) | 54 (73.0%) |
| Total (Overall) | 251 (54.9%) | 206 (45.1%) |
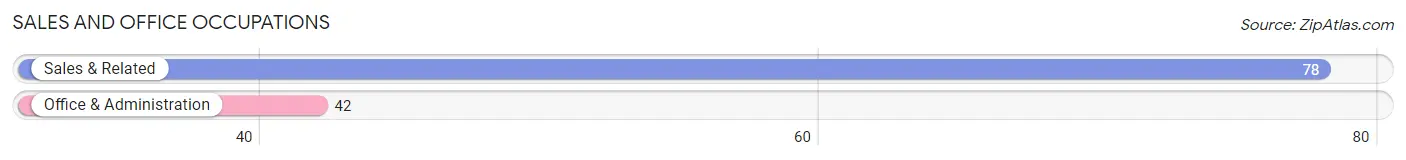
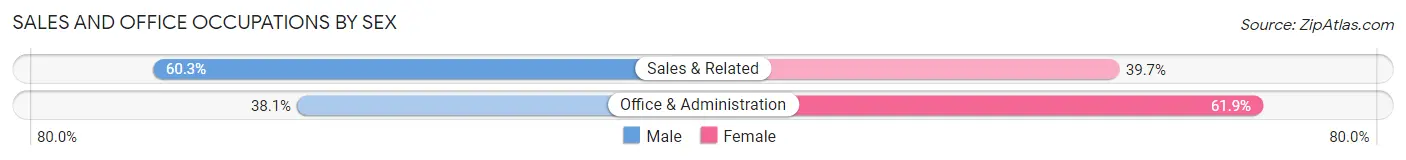
Sales and Office Occupations
The most common Sales and Office occupations in Hyndman borough are Sales & Related (78 | 17.1%), and Office & Administration (42 | 9.2%).
Sales and Office Occupations by Sex
| Occupation | Male | Female |
| Sales & Related | 47 (60.3%) | 31 (39.7%) |
| Office & Administration | 16 (38.1%) | 26 (61.9%) |
| Total (Category) | 63 (52.5%) | 57 (47.5%) |
| Total (Overall) | 251 (54.9%) | 206 (45.1%) |
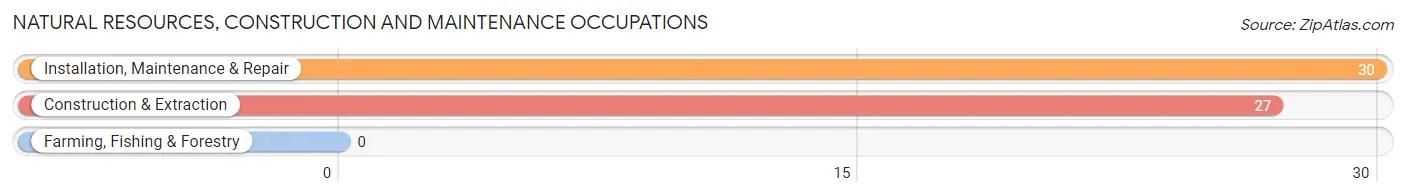
Natural Resources, Construction and Maintenance Occupations
The most common Natural Resources, Construction and Maintenance occupations in Hyndman borough are Installation, Maintenance & Repair (30 | 6.6%), and Construction & Extraction (27 | 5.9%).
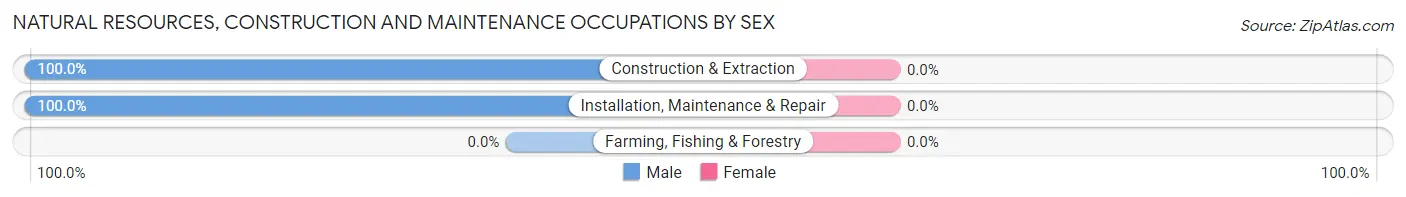
Natural Resources, Construction and Maintenance Occupations by Sex
| Occupation | Male | Female |
| Farming, Fishing & Forestry | 0 (0.0%) | 0 (0.0%) |
| Construction & Extraction | 27 (100.0%) | 0 (0.0%) |
| Installation, Maintenance & Repair | 30 (100.0%) | 0 (0.0%) |
| Total (Category) | 57 (100.0%) | 0 (0.0%) |
| Total (Overall) | 251 (54.9%) | 206 (45.1%) |
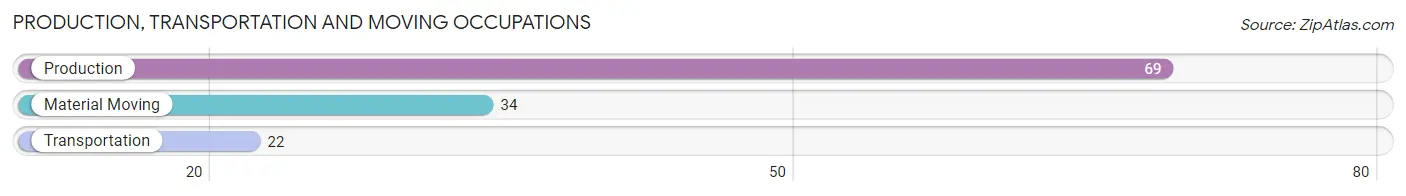
Production, Transportation and Moving Occupations
The most common Production, Transportation and Moving occupations in Hyndman borough are Production (69 | 15.1%), Material Moving (34 | 7.4%), and Transportation (22 | 4.8%).
Production, Transportation and Moving Occupations by Sex
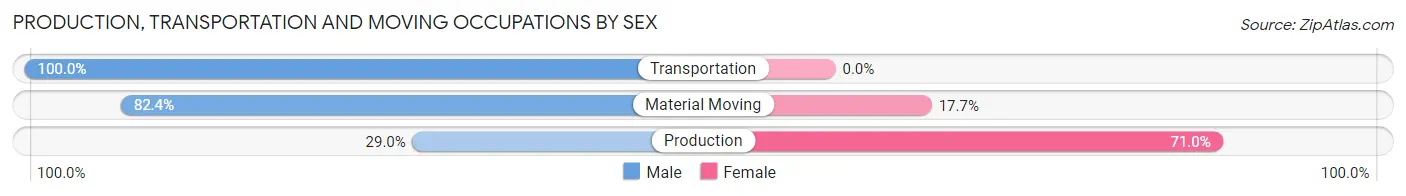
| Occupation | Male | Female |
| Production | 20 (29.0%) | 49 (71.0%) |
| Transportation | 22 (100.0%) | 0 (0.0%) |
| Material Moving | 28 (82.4%) | 6 (17.6%) |
| Total (Category) | 70 (56.0%) | 55 (44.0%) |
| Total (Overall) | 251 (54.9%) | 206 (45.1%) |
Employment Industries by Sex in Hyndman borough
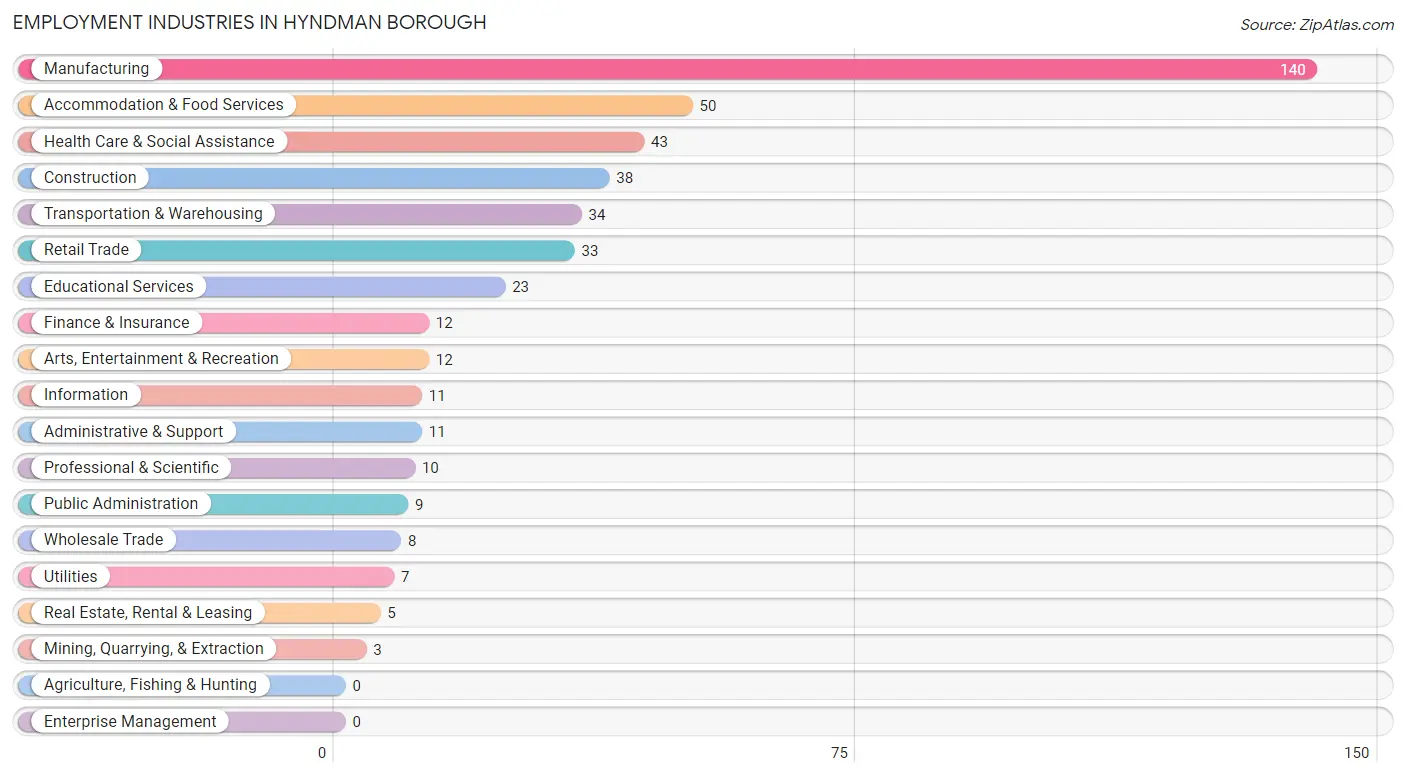
Employment Industries in Hyndman borough
The major employment industries in Hyndman borough include Manufacturing (140 | 30.6%), Accommodation & Food Services (50 | 10.9%), Health Care & Social Assistance (43 | 9.4%), Construction (38 | 8.3%), and Transportation & Warehousing (34 | 7.4%).
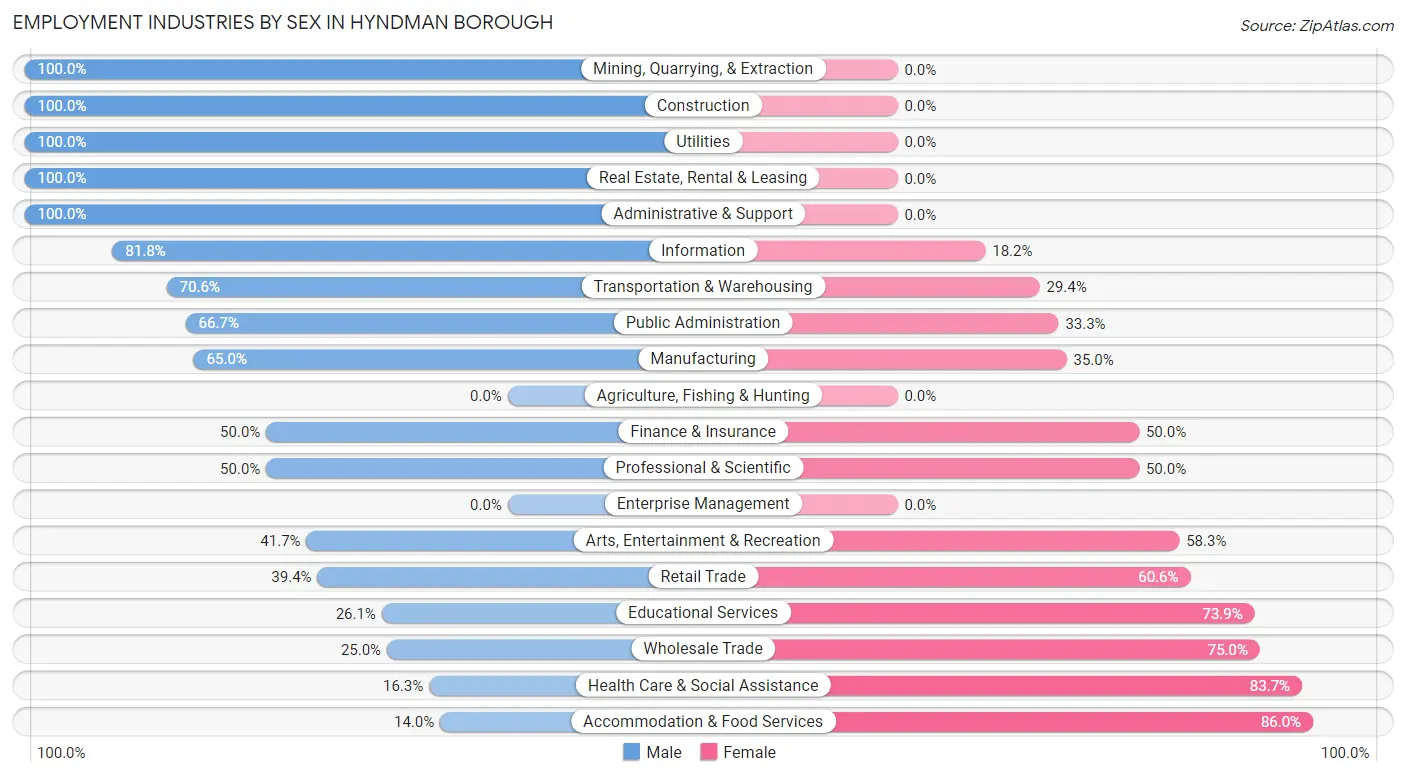
Employment Industries by Sex in Hyndman borough
The Hyndman borough industries that see more men than women are Mining, Quarrying, & Extraction (100.0%), Construction (100.0%), and Utilities (100.0%), whereas the industries that tend to have a higher number of women are Accommodation & Food Services (86.0%), Health Care & Social Assistance (83.7%), and Wholesale Trade (75.0%).
| Industry | Male | Female |
| Agriculture, Fishing & Hunting | 0 (0.0%) | 0 (0.0%) |
| Mining, Quarrying, & Extraction | 3 (100.0%) | 0 (0.0%) |
| Construction | 38 (100.0%) | 0 (0.0%) |
| Manufacturing | 91 (65.0%) | 49 (35.0%) |
| Wholesale Trade | 2 (25.0%) | 6 (75.0%) |
| Retail Trade | 13 (39.4%) | 20 (60.6%) |
| Transportation & Warehousing | 24 (70.6%) | 10 (29.4%) |
| Utilities | 7 (100.0%) | 0 (0.0%) |
| Information | 9 (81.8%) | 2 (18.2%) |
| Finance & Insurance | 6 (50.0%) | 6 (50.0%) |
| Real Estate, Rental & Leasing | 5 (100.0%) | 0 (0.0%) |
| Professional & Scientific | 5 (50.0%) | 5 (50.0%) |
| Enterprise Management | 0 (0.0%) | 0 (0.0%) |
| Administrative & Support | 11 (100.0%) | 0 (0.0%) |
| Educational Services | 6 (26.1%) | 17 (73.9%) |
| Health Care & Social Assistance | 7 (16.3%) | 36 (83.7%) |
| Arts, Entertainment & Recreation | 5 (41.7%) | 7 (58.3%) |
| Accommodation & Food Services | 7 (14.0%) | 43 (86.0%) |
| Public Administration | 6 (66.7%) | 3 (33.3%) |
| Total | 251 (54.9%) | 206 (45.1%) |
Education in Hyndman borough
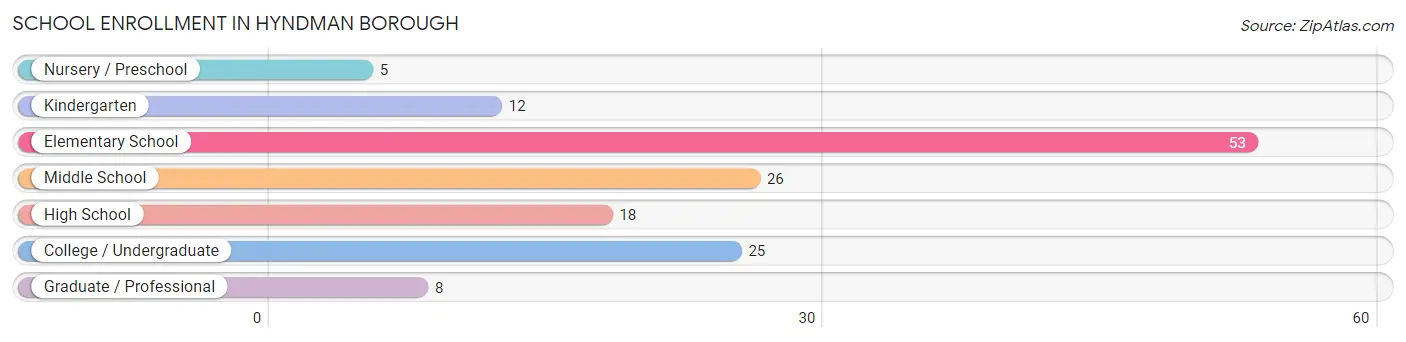
School Enrollment in Hyndman borough
The most common levels of schooling among the 147 students in Hyndman borough are elementary school (53 | 36.0%), middle school (26 | 17.7%), and college / undergraduate (25 | 17.0%).
| School Level | # Students | % Students |
| Nursery / Preschool | 5 | 3.4% |
| Kindergarten | 12 | 8.2% |
| Elementary School | 53 | 36.0% |
| Middle School | 26 | 17.7% |
| High School | 18 | 12.2% |
| College / Undergraduate | 25 | 17.0% |
| Graduate / Professional | 8 | 5.4% |
| Total | 147 | 100.0% |
School Enrollment by Age by Funding Source in Hyndman borough
Out of a total of 147 students who are enrolled in schools in Hyndman borough, 19 (12.9%) attend a private institution, while the remaining 128 (87.1%) are enrolled in public schools. The age group of 10 to 14 year olds has the highest likelihood of being enrolled in private schools, with 12 (42.9% in the age bracket) enrolled. Conversely, the age group of 15 to 17 year olds has the lowest likelihood of being enrolled in a private school, with 16 (100.0% in the age bracket) attending a public institution.
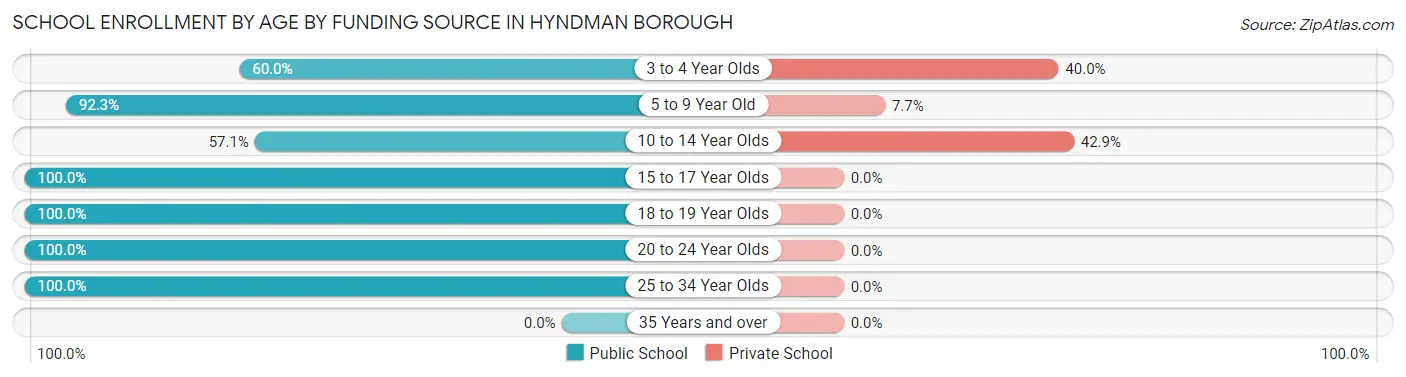
| Age Bracket | Public School | Private School |
| 3 to 4 Year Olds | 3 (60.0%) | 2 (40.0%) |
| 5 to 9 Year Old | 60 (92.3%) | 5 (7.7%) |
| 10 to 14 Year Olds | 16 (57.1%) | 12 (42.9%) |
| 15 to 17 Year Olds | 16 (100.0%) | 0 (0.0%) |
| 18 to 19 Year Olds | 2 (100.0%) | 0 (0.0%) |
| 20 to 24 Year Olds | 21 (100.0%) | 0 (0.0%) |
| 25 to 34 Year Olds | 10 (100.0%) | 0 (0.0%) |
| 35 Years and over | 0 (0.0%) | 0 (0.0%) |
| Total | 128 (87.1%) | 19 (12.9%) |
Educational Attainment by Field of Study in Hyndman borough
Business (17 | 30.9%), education (12 | 21.8%), liberal arts & history (8 | 14.5%), social sciences (4 | 7.3%), and science & technology (4 | 7.3%) are the most common fields of study among 55 individuals in Hyndman borough who have obtained a bachelor's degree or higher.
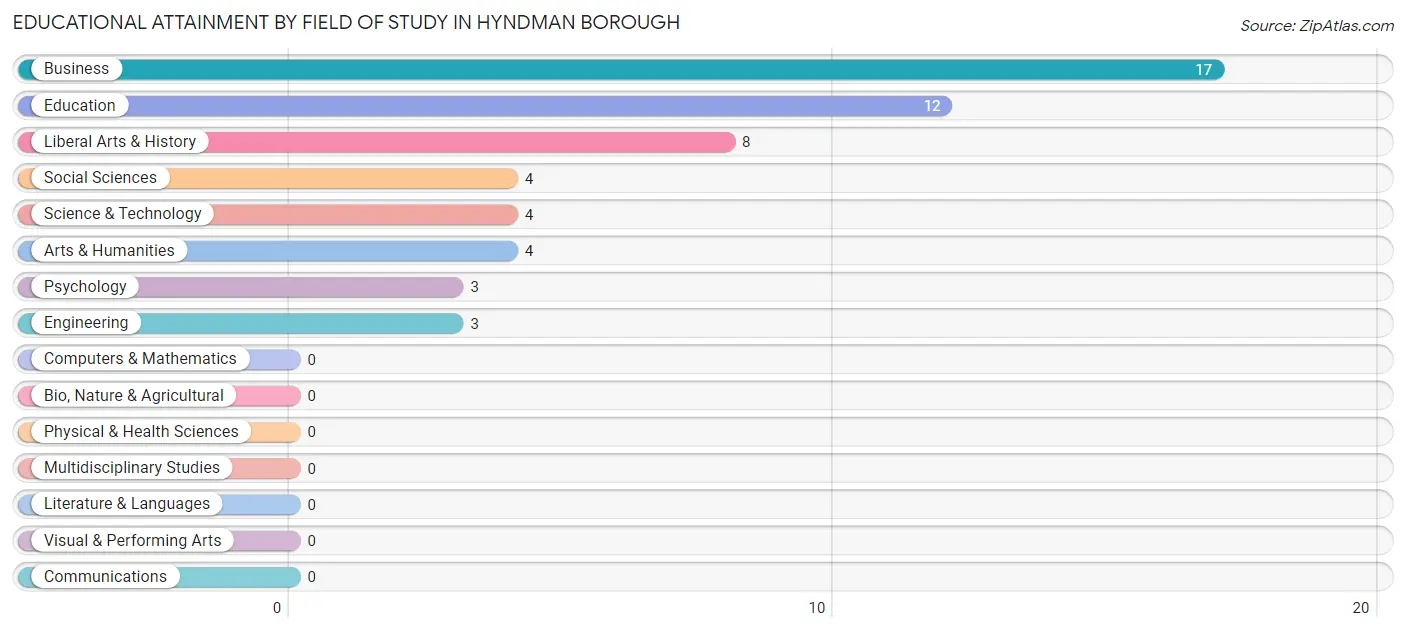
| Field of Study | # Graduates | % Graduates |
| Computers & Mathematics | 0 | 0.0% |
| Bio, Nature & Agricultural | 0 | 0.0% |
| Physical & Health Sciences | 0 | 0.0% |
| Psychology | 3 | 5.4% |
| Social Sciences | 4 | 7.3% |
| Engineering | 3 | 5.4% |
| Multidisciplinary Studies | 0 | 0.0% |
| Science & Technology | 4 | 7.3% |
| Business | 17 | 30.9% |
| Education | 12 | 21.8% |
| Literature & Languages | 0 | 0.0% |
| Liberal Arts & History | 8 | 14.5% |
| Visual & Performing Arts | 0 | 0.0% |
| Communications | 0 | 0.0% |
| Arts & Humanities | 4 | 7.3% |
| Total | 55 | 100.0% |
Transportation & Commute in Hyndman borough
Vehicle Availability by Sex in Hyndman borough
The most prevalent vehicle ownership categories in Hyndman borough are males with 4 vehicles (74, accounting for 30.0%) and females with 4 vehicles (91, making up 36.3%).
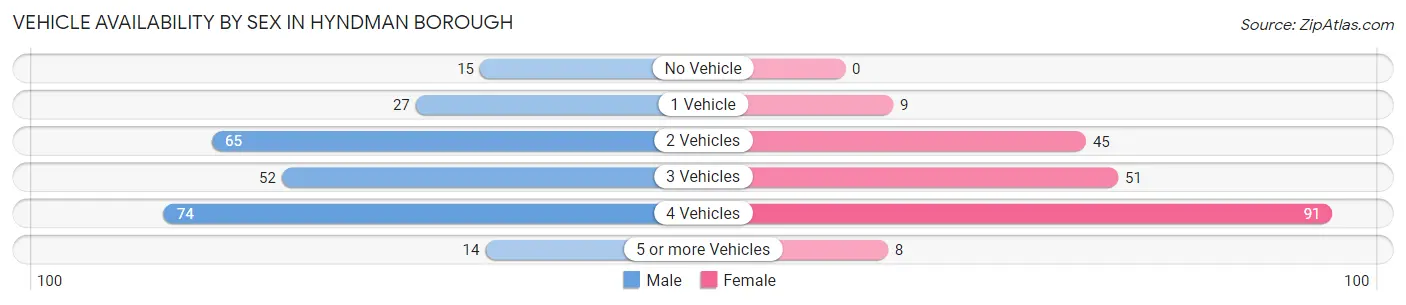
| Vehicles Available | Male | Female |
| No Vehicle | 15 (6.1%) | 0 (0.0%) |
| 1 Vehicle | 27 (10.9%) | 9 (4.4%) |
| 2 Vehicles | 65 (26.3%) | 45 (22.1%) |
| 3 Vehicles | 52 (21.0%) | 51 (25.0%) |
| 4 Vehicles | 74 (30.0%) | 91 (44.6%) |
| 5 or more Vehicles | 14 (5.7%) | 8 (3.9%) |
| Total | 247 (100.0%) | 204 (100.0%) |
Commute Time in Hyndman borough
The most frequently occuring commute durations in Hyndman borough are 30 to 34 minutes (137 commuters, 31.8%), 25 to 29 minutes (83 commuters, 19.3%), and 20 to 24 minutes (58 commuters, 13.5%).
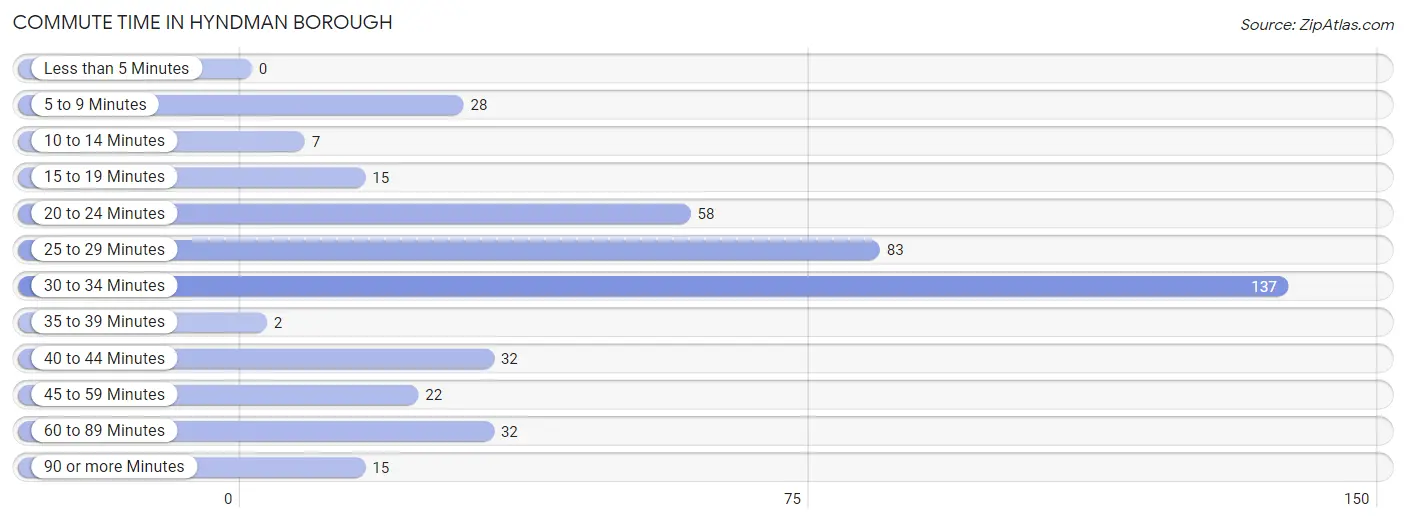
| Commute Time | # Commuters | % Commuters |
| Less than 5 Minutes | 0 | 0.0% |
| 5 to 9 Minutes | 28 | 6.5% |
| 10 to 14 Minutes | 7 | 1.6% |
| 15 to 19 Minutes | 15 | 3.5% |
| 20 to 24 Minutes | 58 | 13.5% |
| 25 to 29 Minutes | 83 | 19.3% |
| 30 to 34 Minutes | 137 | 31.8% |
| 35 to 39 Minutes | 2 | 0.5% |
| 40 to 44 Minutes | 32 | 7.4% |
| 45 to 59 Minutes | 22 | 5.1% |
| 60 to 89 Minutes | 32 | 7.4% |
| 90 or more Minutes | 15 | 3.5% |
Commute Time by Sex in Hyndman borough
The most common commute times in Hyndman borough are 25 to 29 minutes (64 commuters, 27.2%) for males and 30 to 34 minutes (93 commuters, 47.4%) for females.
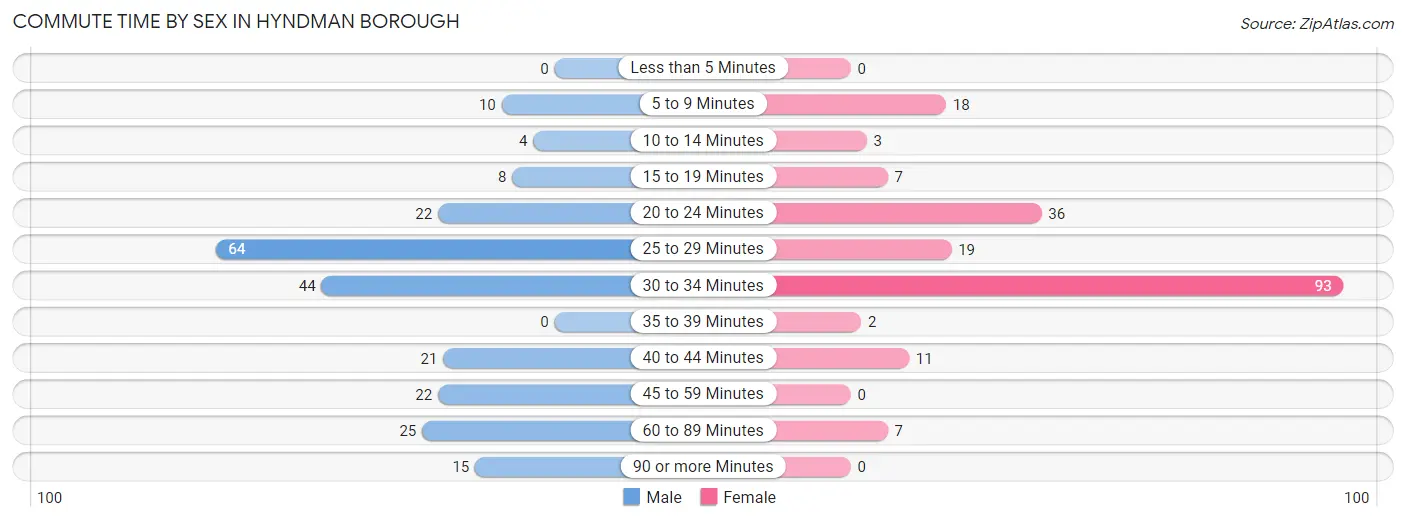
| Commute Time | Male | Female |
| Less than 5 Minutes | 0 (0.0%) | 0 (0.0%) |
| 5 to 9 Minutes | 10 (4.3%) | 18 (9.2%) |
| 10 to 14 Minutes | 4 (1.7%) | 3 (1.5%) |
| 15 to 19 Minutes | 8 (3.4%) | 7 (3.6%) |
| 20 to 24 Minutes | 22 (9.4%) | 36 (18.4%) |
| 25 to 29 Minutes | 64 (27.2%) | 19 (9.7%) |
| 30 to 34 Minutes | 44 (18.7%) | 93 (47.4%) |
| 35 to 39 Minutes | 0 (0.0%) | 2 (1.0%) |
| 40 to 44 Minutes | 21 (8.9%) | 11 (5.6%) |
| 45 to 59 Minutes | 22 (9.4%) | 0 (0.0%) |
| 60 to 89 Minutes | 25 (10.6%) | 7 (3.6%) |
| 90 or more Minutes | 15 (6.4%) | 0 (0.0%) |
Time of Departure to Work by Sex in Hyndman borough
The most frequent times of departure to work in Hyndman borough are 6:00 AM to 6:29 AM (50, 21.3%) for males and 4:00 PM to 11:59 PM (62, 31.6%) for females.
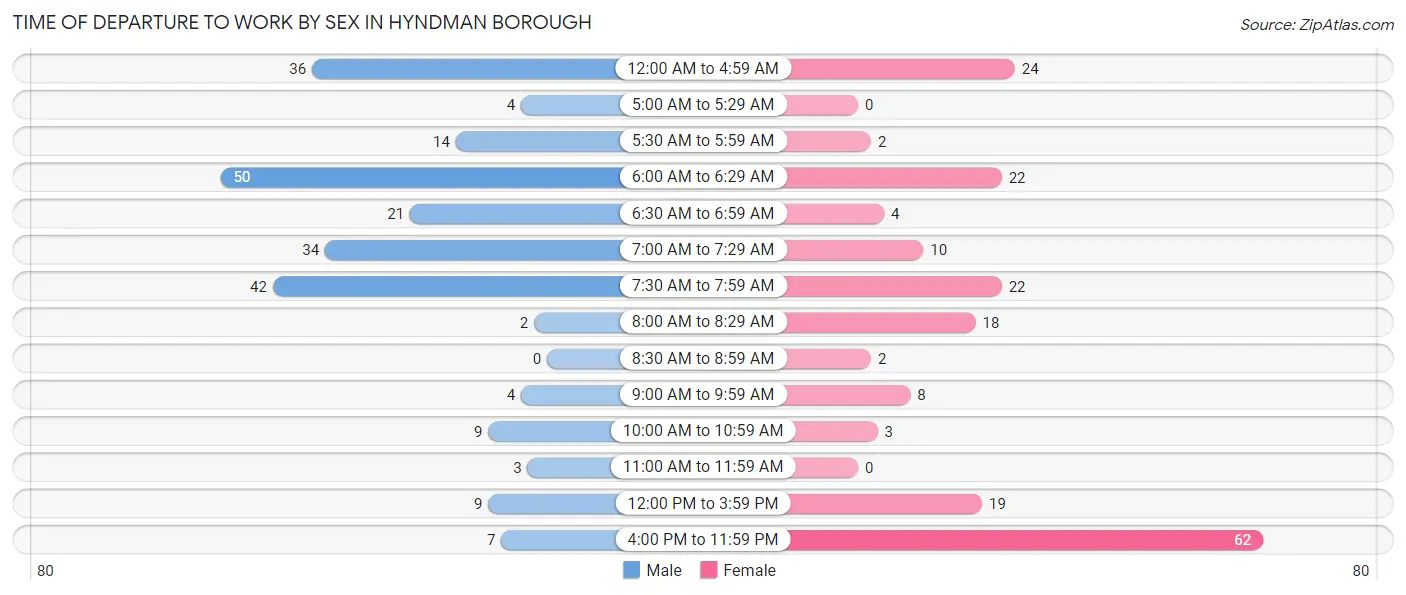
| Time of Departure | Male | Female |
| 12:00 AM to 4:59 AM | 36 (15.3%) | 24 (12.2%) |
| 5:00 AM to 5:29 AM | 4 (1.7%) | 0 (0.0%) |
| 5:30 AM to 5:59 AM | 14 (6.0%) | 2 (1.0%) |
| 6:00 AM to 6:29 AM | 50 (21.3%) | 22 (11.2%) |
| 6:30 AM to 6:59 AM | 21 (8.9%) | 4 (2.0%) |
| 7:00 AM to 7:29 AM | 34 (14.5%) | 10 (5.1%) |
| 7:30 AM to 7:59 AM | 42 (17.9%) | 22 (11.2%) |
| 8:00 AM to 8:29 AM | 2 (0.9%) | 18 (9.2%) |
| 8:30 AM to 8:59 AM | 0 (0.0%) | 2 (1.0%) |
| 9:00 AM to 9:59 AM | 4 (1.7%) | 8 (4.1%) |
| 10:00 AM to 10:59 AM | 9 (3.8%) | 3 (1.5%) |
| 11:00 AM to 11:59 AM | 3 (1.3%) | 0 (0.0%) |
| 12:00 PM to 3:59 PM | 9 (3.8%) | 19 (9.7%) |
| 4:00 PM to 11:59 PM | 7 (3.0%) | 62 (31.6%) |
| Total | 235 (100.0%) | 196 (100.0%) |
Housing Occupancy in Hyndman borough
Occupancy by Ownership in Hyndman borough
Of the total 373 dwellings in Hyndman borough, owner-occupied units account for 274 (73.5%), while renter-occupied units make up 99 (26.5%).
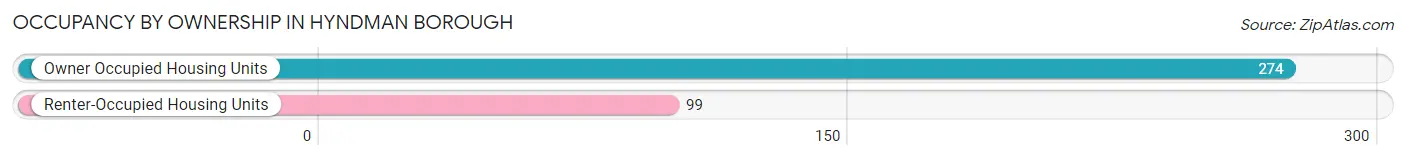
| Occupancy | # Housing Units | % Housing Units |
| Owner Occupied Housing Units | 274 | 73.5% |
| Renter-Occupied Housing Units | 99 | 26.5% |
| Total Occupied Housing Units | 373 | 100.0% |
Occupancy by Household Size in Hyndman borough
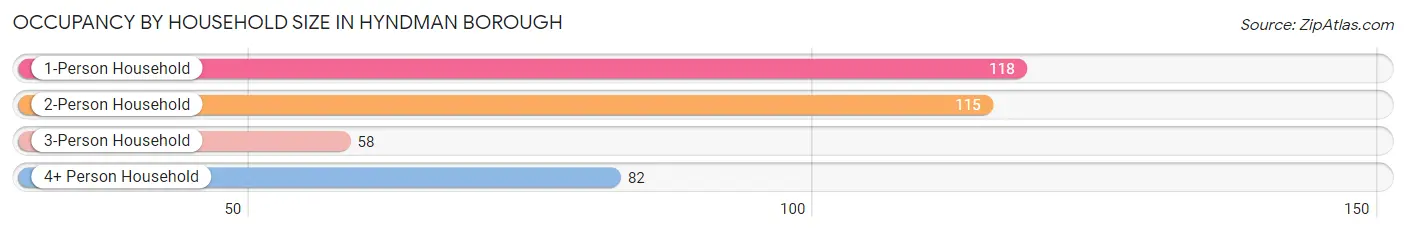
| Household Size | # Housing Units | % Housing Units |
| 1-Person Household | 118 | 31.6% |
| 2-Person Household | 115 | 30.8% |
| 3-Person Household | 58 | 15.5% |
| 4+ Person Household | 82 | 22.0% |
| Total Housing Units | 373 | 100.0% |
Occupancy by Ownership by Household Size in Hyndman borough
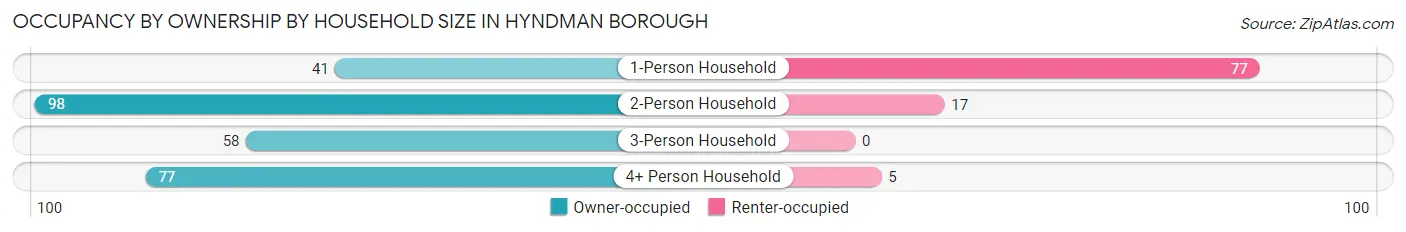
| Household Size | Owner-occupied | Renter-occupied |
| 1-Person Household | 41 (34.7%) | 77 (65.2%) |
| 2-Person Household | 98 (85.2%) | 17 (14.8%) |
| 3-Person Household | 58 (100.0%) | 0 (0.0%) |
| 4+ Person Household | 77 (93.9%) | 5 (6.1%) |
| Total Housing Units | 274 (73.5%) | 99 (26.5%) |
Occupancy by Educational Attainment in Hyndman borough
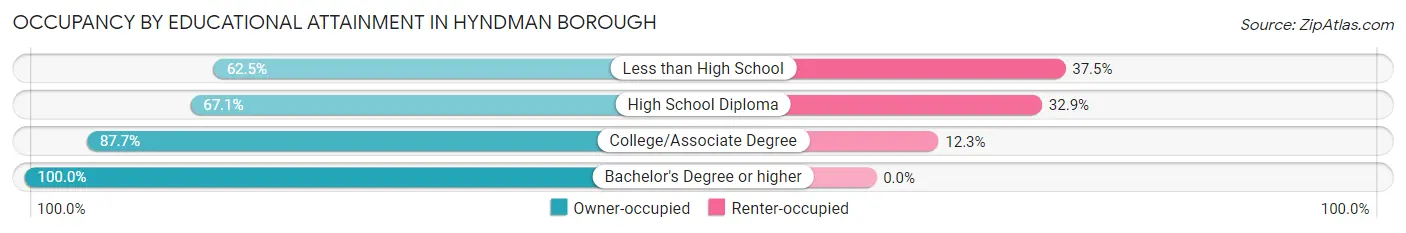
| Household Size | Owner-occupied | Renter-occupied |
| Less than High School | 35 (62.5%) | 21 (37.5%) |
| High School Diploma | 141 (67.1%) | 69 (32.9%) |
| College/Associate Degree | 64 (87.7%) | 9 (12.3%) |
| Bachelor's Degree or higher | 34 (100.0%) | 0 (0.0%) |
Occupancy by Age of Householder in Hyndman borough
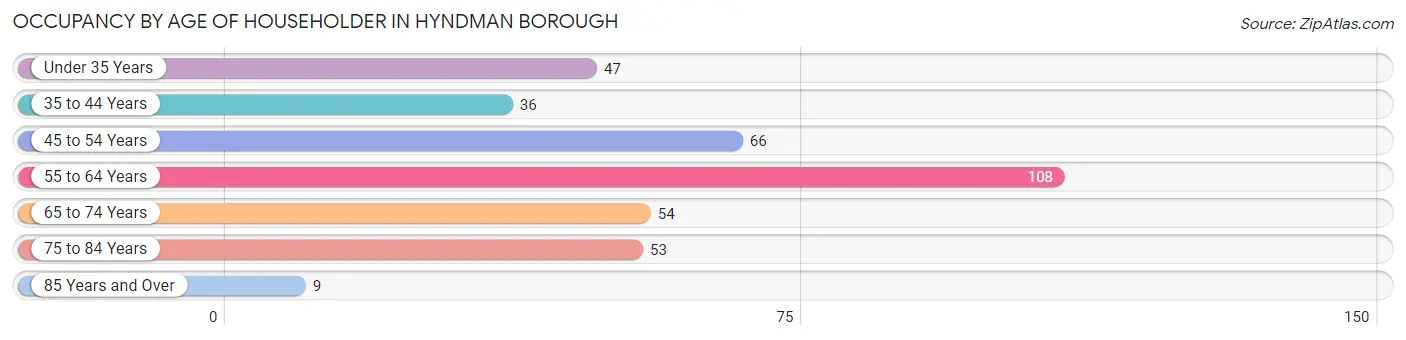
| Age Bracket | # Households | % Households |
| Under 35 Years | 47 | 12.6% |
| 35 to 44 Years | 36 | 9.7% |
| 45 to 54 Years | 66 | 17.7% |
| 55 to 64 Years | 108 | 28.9% |
| 65 to 74 Years | 54 | 14.5% |
| 75 to 84 Years | 53 | 14.2% |
| 85 Years and Over | 9 | 2.4% |
| Total | 373 | 100.0% |
Housing Finances in Hyndman borough
Median Income by Occupancy in Hyndman borough
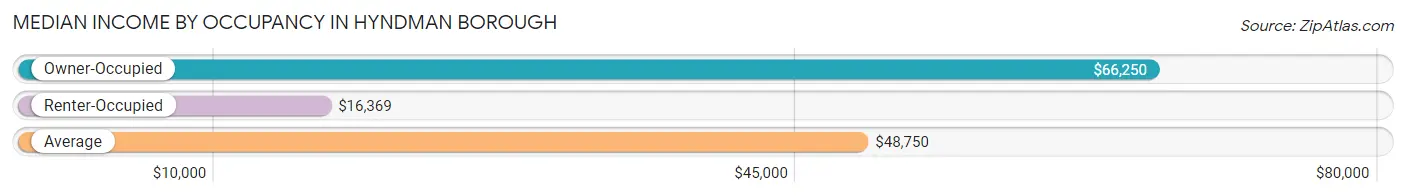
| Occupancy Type | # Households | Median Income |
| Owner-Occupied | 274 (73.5%) | $66,250 |
| Renter-Occupied | 99 (26.5%) | $16,369 |
| Average | 373 (100.0%) | $48,750 |
Occupancy by Householder Income Bracket in Hyndman borough
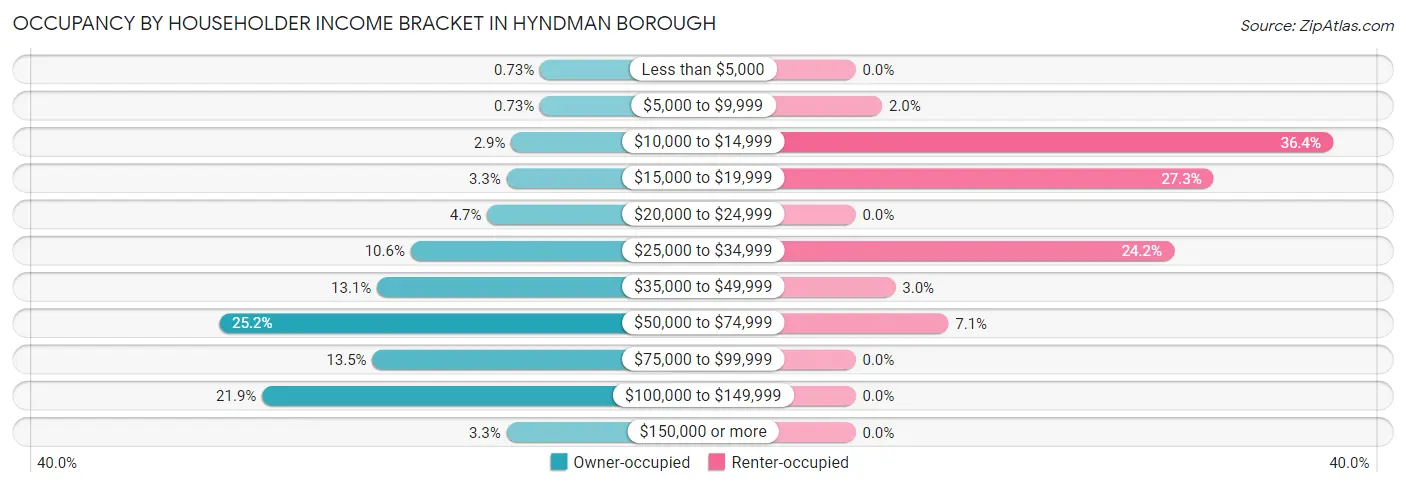
| Income Bracket | Owner-occupied | Renter-occupied |
| Less than $5,000 | 2 (0.7%) | 0 (0.0%) |
| $5,000 to $9,999 | 2 (0.7%) | 2 (2.0%) |
| $10,000 to $14,999 | 8 (2.9%) | 36 (36.4%) |
| $15,000 to $19,999 | 9 (3.3%) | 27 (27.3%) |
| $20,000 to $24,999 | 13 (4.7%) | 0 (0.0%) |
| $25,000 to $34,999 | 29 (10.6%) | 24 (24.2%) |
| $35,000 to $49,999 | 36 (13.1%) | 3 (3.0%) |
| $50,000 to $74,999 | 69 (25.2%) | 7 (7.1%) |
| $75,000 to $99,999 | 37 (13.5%) | 0 (0.0%) |
| $100,000 to $149,999 | 60 (21.9%) | 0 (0.0%) |
| $150,000 or more | 9 (3.3%) | 0 (0.0%) |
| Total | 274 (100.0%) | 99 (100.0%) |
Monthly Housing Cost Tiers in Hyndman borough
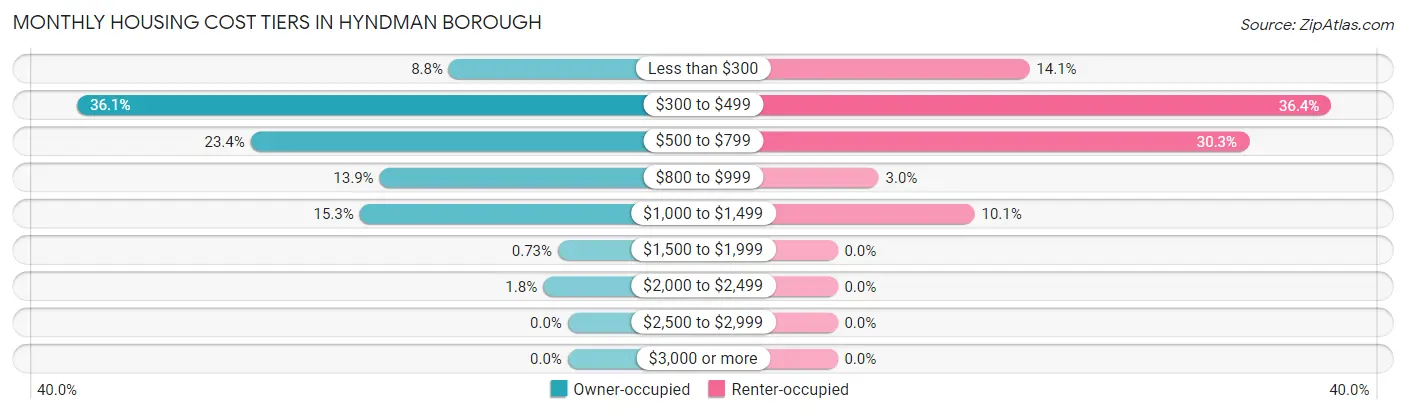
| Monthly Cost | Owner-occupied | Renter-occupied |
| Less than $300 | 24 (8.8%) | 14 (14.1%) |
| $300 to $499 | 99 (36.1%) | 36 (36.4%) |
| $500 to $799 | 64 (23.4%) | 30 (30.3%) |
| $800 to $999 | 38 (13.9%) | 3 (3.0%) |
| $1,000 to $1,499 | 42 (15.3%) | 10 (10.1%) |
| $1,500 to $1,999 | 2 (0.7%) | 0 (0.0%) |
| $2,000 to $2,499 | 5 (1.8%) | 0 (0.0%) |
| $2,500 to $2,999 | 0 (0.0%) | 0 (0.0%) |
| $3,000 or more | 0 (0.0%) | 0 (0.0%) |
| Total | 274 (100.0%) | 99 (100.0%) |
Physical Housing Characteristics in Hyndman borough
Housing Structures in Hyndman borough
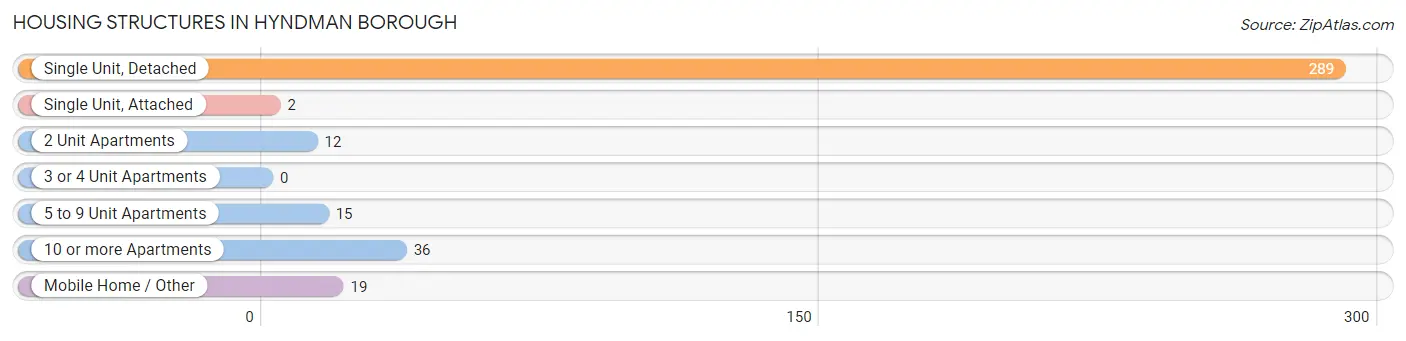
| Structure Type | # Housing Units | % Housing Units |
| Single Unit, Detached | 289 | 77.5% |
| Single Unit, Attached | 2 | 0.5% |
| 2 Unit Apartments | 12 | 3.2% |
| 3 or 4 Unit Apartments | 0 | 0.0% |
| 5 to 9 Unit Apartments | 15 | 4.0% |
| 10 or more Apartments | 36 | 9.7% |
| Mobile Home / Other | 19 | 5.1% |
| Total | 373 | 100.0% |
Housing Structures by Occupancy in Hyndman borough
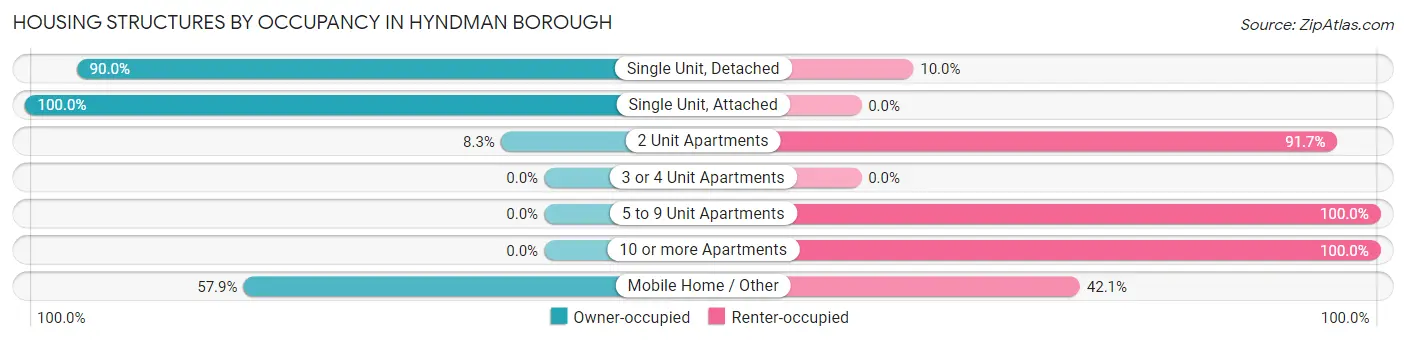
| Structure Type | Owner-occupied | Renter-occupied |
| Single Unit, Detached | 260 (90.0%) | 29 (10.0%) |
| Single Unit, Attached | 2 (100.0%) | 0 (0.0%) |
| 2 Unit Apartments | 1 (8.3%) | 11 (91.7%) |
| 3 or 4 Unit Apartments | 0 (0.0%) | 0 (0.0%) |
| 5 to 9 Unit Apartments | 0 (0.0%) | 15 (100.0%) |
| 10 or more Apartments | 0 (0.0%) | 36 (100.0%) |
| Mobile Home / Other | 11 (57.9%) | 8 (42.1%) |
| Total | 274 (73.5%) | 99 (26.5%) |
Housing Structures by Number of Rooms in Hyndman borough
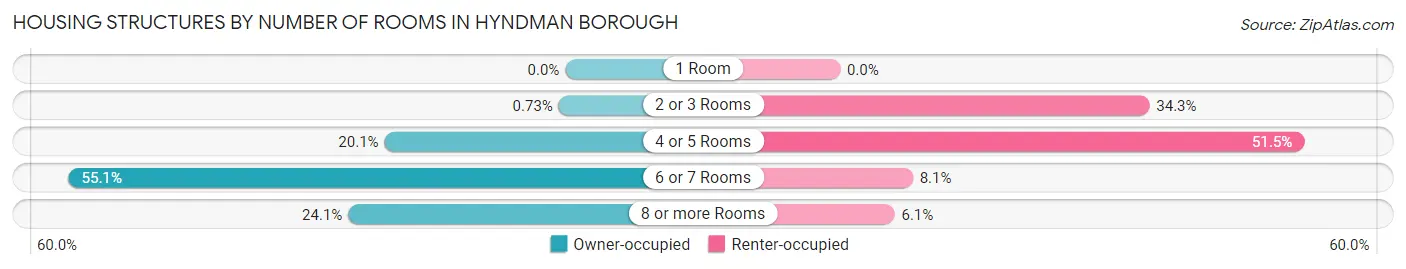
| Number of Rooms | Owner-occupied | Renter-occupied |
| 1 Room | 0 (0.0%) | 0 (0.0%) |
| 2 or 3 Rooms | 2 (0.7%) | 34 (34.3%) |
| 4 or 5 Rooms | 55 (20.1%) | 51 (51.5%) |
| 6 or 7 Rooms | 151 (55.1%) | 8 (8.1%) |
| 8 or more Rooms | 66 (24.1%) | 6 (6.1%) |
| Total | 274 (100.0%) | 99 (100.0%) |
Housing Structure by Heating Type in Hyndman borough
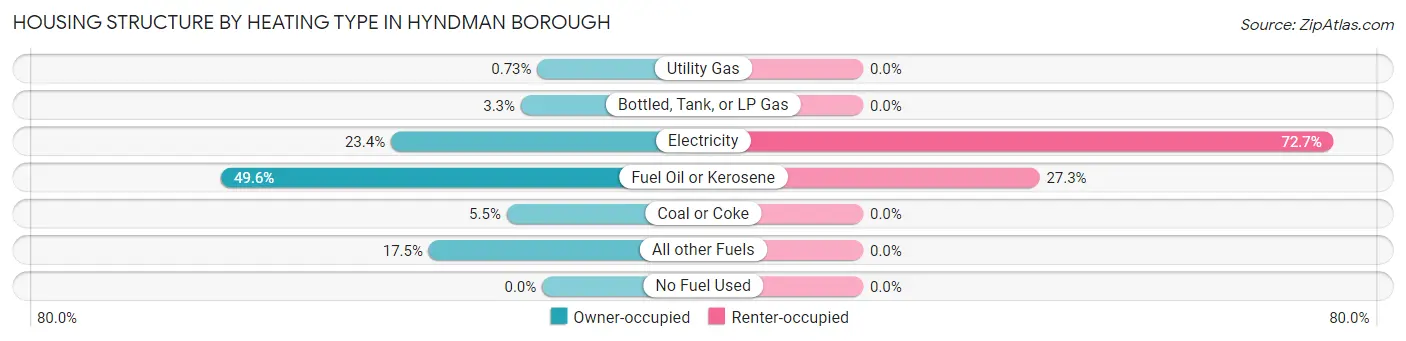
| Heating Type | Owner-occupied | Renter-occupied |
| Utility Gas | 2 (0.7%) | 0 (0.0%) |
| Bottled, Tank, or LP Gas | 9 (3.3%) | 0 (0.0%) |
| Electricity | 64 (23.4%) | 72 (72.7%) |
| Fuel Oil or Kerosene | 136 (49.6%) | 27 (27.3%) |
| Coal or Coke | 15 (5.5%) | 0 (0.0%) |
| All other Fuels | 48 (17.5%) | 0 (0.0%) |
| No Fuel Used | 0 (0.0%) | 0 (0.0%) |
| Total | 274 (100.0%) | 99 (100.0%) |
Household Vehicle Usage in Hyndman borough
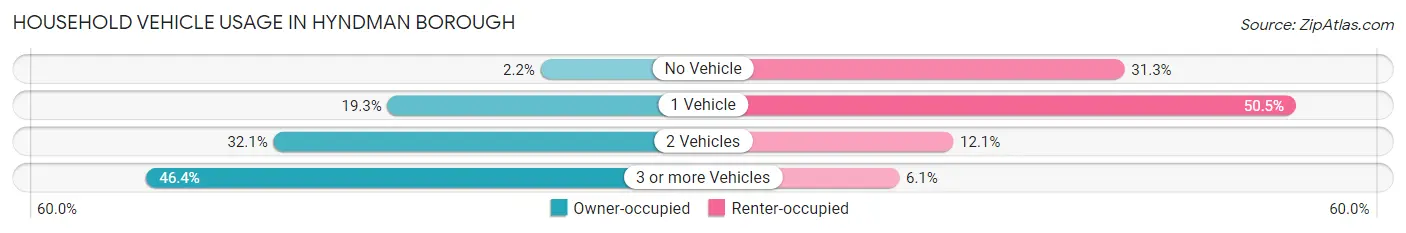
| Vehicles per Household | Owner-occupied | Renter-occupied |
| No Vehicle | 6 (2.2%) | 31 (31.3%) |
| 1 Vehicle | 53 (19.3%) | 50 (50.5%) |
| 2 Vehicles | 88 (32.1%) | 12 (12.1%) |
| 3 or more Vehicles | 127 (46.4%) | 6 (6.1%) |
| Total | 274 (100.0%) | 99 (100.0%) |
Real Estate & Mortgages in Hyndman borough
Real Estate and Mortgage Overview in Hyndman borough
| Characteristic | Without Mortgage | With Mortgage |
| Housing Units | 169 | 105 |
| Median Property Value | $75,400 | $94,300 |
| Median Household Income | $54,583 | $6 |
| Monthly Housing Costs | $360 | $0 |
| Real Estate Taxes | $613 | $2 |
Property Value by Mortgage Status in Hyndman borough
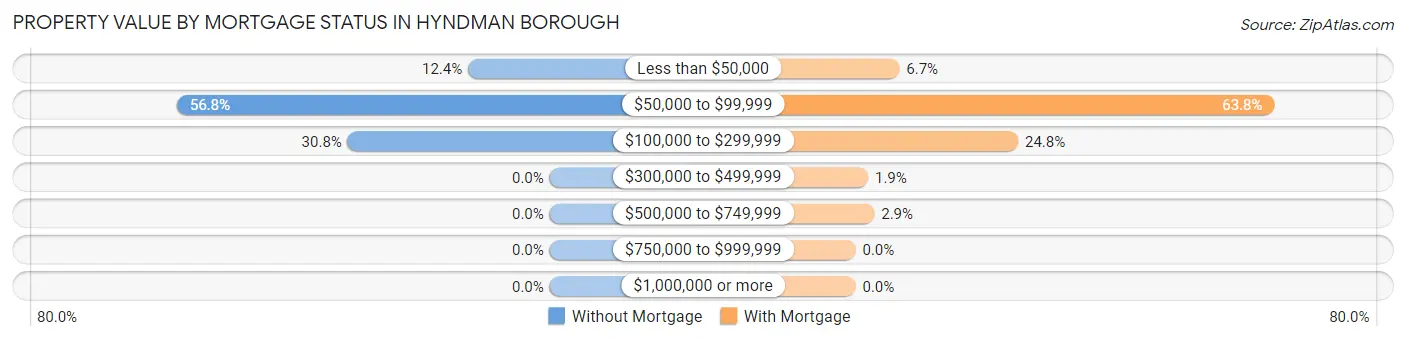
| Property Value | Without Mortgage | With Mortgage |
| Less than $50,000 | 21 (12.4%) | 7 (6.7%) |
| $50,000 to $99,999 | 96 (56.8%) | 67 (63.8%) |
| $100,000 to $299,999 | 52 (30.8%) | 26 (24.8%) |
| $300,000 to $499,999 | 0 (0.0%) | 2 (1.9%) |
| $500,000 to $749,999 | 0 (0.0%) | 3 (2.9%) |
| $750,000 to $999,999 | 0 (0.0%) | 0 (0.0%) |
| $1,000,000 or more | 0 (0.0%) | 0 (0.0%) |
| Total | 169 (100.0%) | 105 (100.0%) |
Household Income by Mortgage Status in Hyndman borough
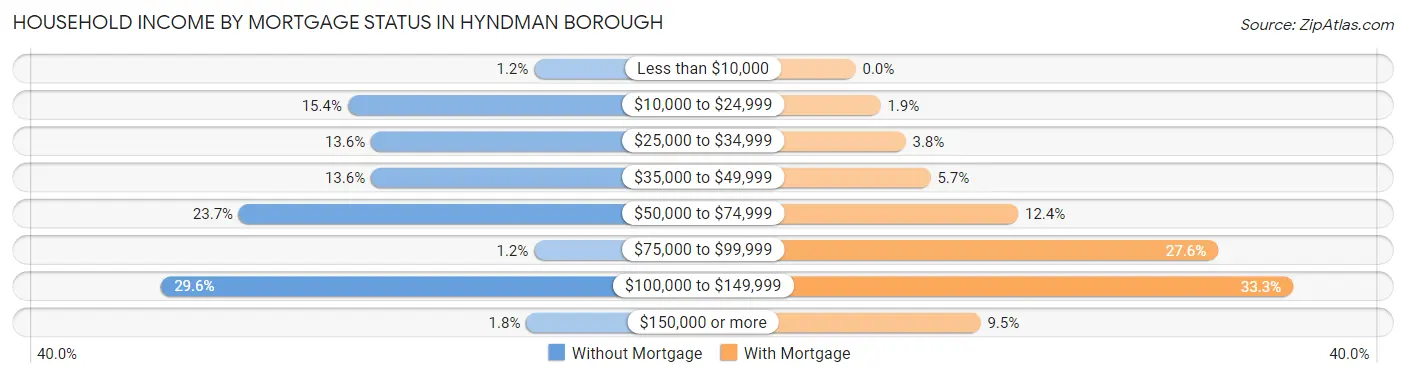
| Household Income | Without Mortgage | With Mortgage |
| Less than $10,000 | 2 (1.2%) | 0 (0.0%) |
| $10,000 to $24,999 | 26 (15.4%) | 2 (1.9%) |
| $25,000 to $34,999 | 23 (13.6%) | 4 (3.8%) |
| $35,000 to $49,999 | 23 (13.6%) | 6 (5.7%) |
| $50,000 to $74,999 | 40 (23.7%) | 13 (12.4%) |
| $75,000 to $99,999 | 2 (1.2%) | 29 (27.6%) |
| $100,000 to $149,999 | 50 (29.6%) | 35 (33.3%) |
| $150,000 or more | 3 (1.8%) | 10 (9.5%) |
| Total | 169 (100.0%) | 105 (100.0%) |
Property Value to Household Income Ratio in Hyndman borough
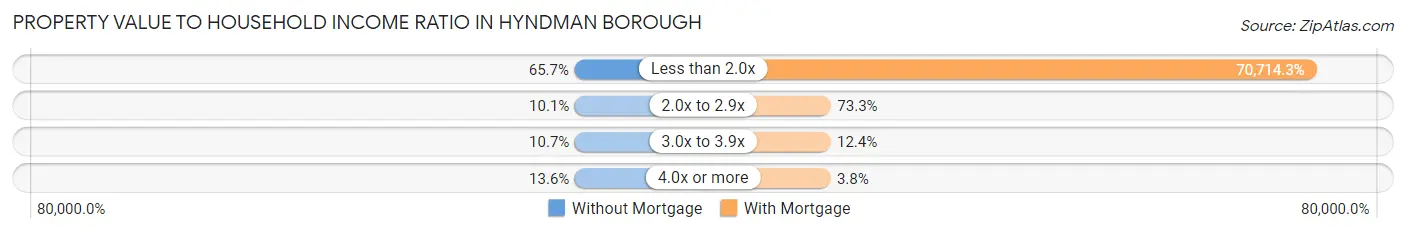
| Value-to-Income Ratio | Without Mortgage | With Mortgage |
| Less than 2.0x | 111 (65.7%) | 74,250 (70,714.3%) |
| 2.0x to 2.9x | 17 (10.1%) | 77 (73.3%) |
| 3.0x to 3.9x | 18 (10.6%) | 13 (12.4%) |
| 4.0x or more | 23 (13.6%) | 4 (3.8%) |
| Total | 169 (100.0%) | 105 (100.0%) |
Real Estate Taxes by Mortgage Status in Hyndman borough
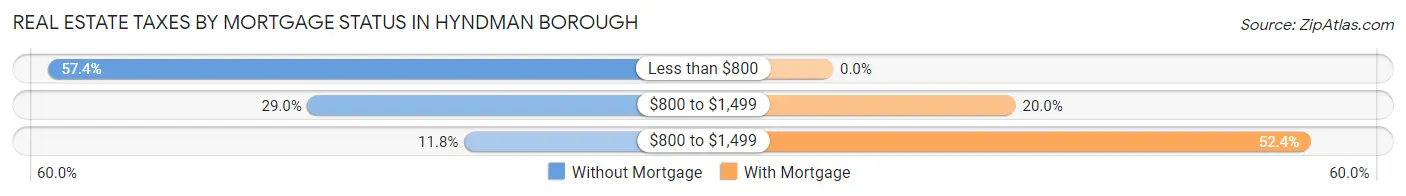
| Property Taxes | Without Mortgage | With Mortgage |
| Less than $800 | 97 (57.4%) | 0 (0.0%) |
| $800 to $1,499 | 49 (29.0%) | 21 (20.0%) |
| $800 to $1,499 | 20 (11.8%) | 55 (52.4%) |
| Total | 169 (100.0%) | 105 (100.0%) |
Health & Disability in Hyndman borough
Health Insurance Coverage by Age in Hyndman borough
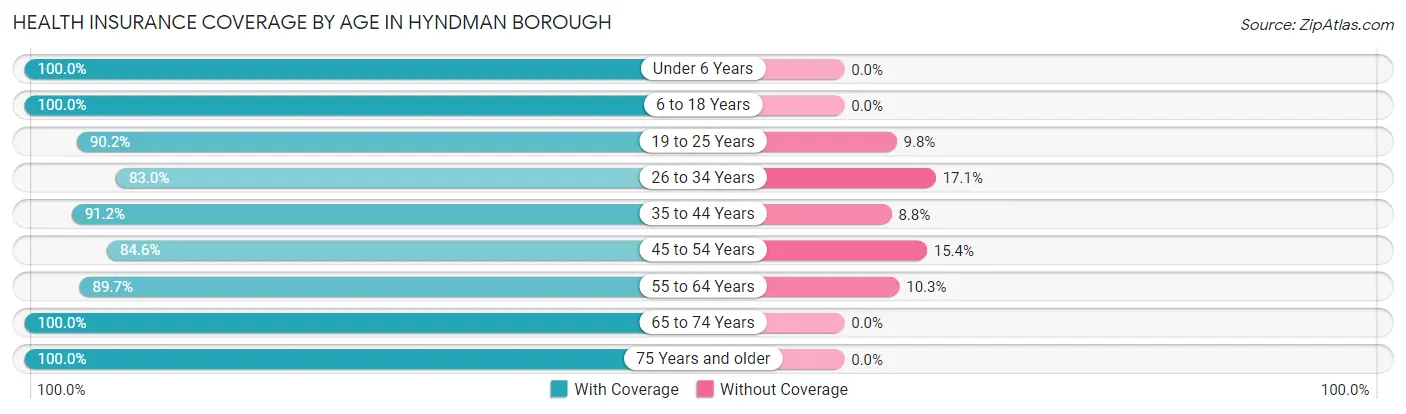
| Age Bracket | With Coverage | Without Coverage |
| Under 6 Years | 51 (100.0%) | 0 (0.0%) |
| 6 to 18 Years | 108 (100.0%) | 0 (0.0%) |
| 19 to 25 Years | 74 (90.2%) | 8 (9.8%) |
| 26 to 34 Years | 107 (83.0%) | 22 (17.1%) |
| 35 to 44 Years | 83 (91.2%) | 8 (8.8%) |
| 45 to 54 Years | 88 (84.6%) | 16 (15.4%) |
| 55 to 64 Years | 175 (89.7%) | 20 (10.3%) |
| 65 to 74 Years | 79 (100.0%) | 0 (0.0%) |
| 75 Years and older | 87 (100.0%) | 0 (0.0%) |
| Total | 852 (92.0%) | 74 (8.0%) |
Health Insurance Coverage by Citizenship Status in Hyndman borough
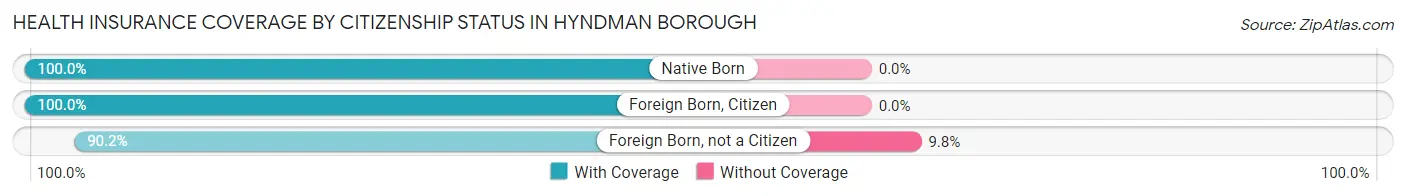
| Citizenship Status | With Coverage | Without Coverage |
| Native Born | 51 (100.0%) | 0 (0.0%) |
| Foreign Born, Citizen | 108 (100.0%) | 0 (0.0%) |
| Foreign Born, not a Citizen | 74 (90.2%) | 8 (9.8%) |
Health Insurance Coverage by Household Income in Hyndman borough
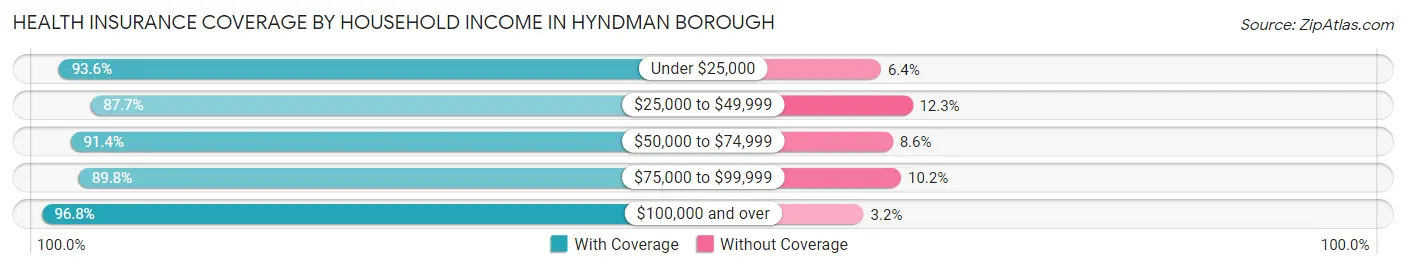
| Household Income | With Coverage | Without Coverage |
| Under $25,000 | 117 (93.6%) | 8 (6.4%) |
| $25,000 to $49,999 | 214 (87.7%) | 30 (12.3%) |
| $50,000 to $74,999 | 170 (91.4%) | 16 (8.6%) |
| $75,000 to $99,999 | 106 (89.8%) | 12 (10.2%) |
| $100,000 and over | 245 (96.8%) | 8 (3.2%) |
Public vs Private Health Insurance Coverage by Age in Hyndman borough
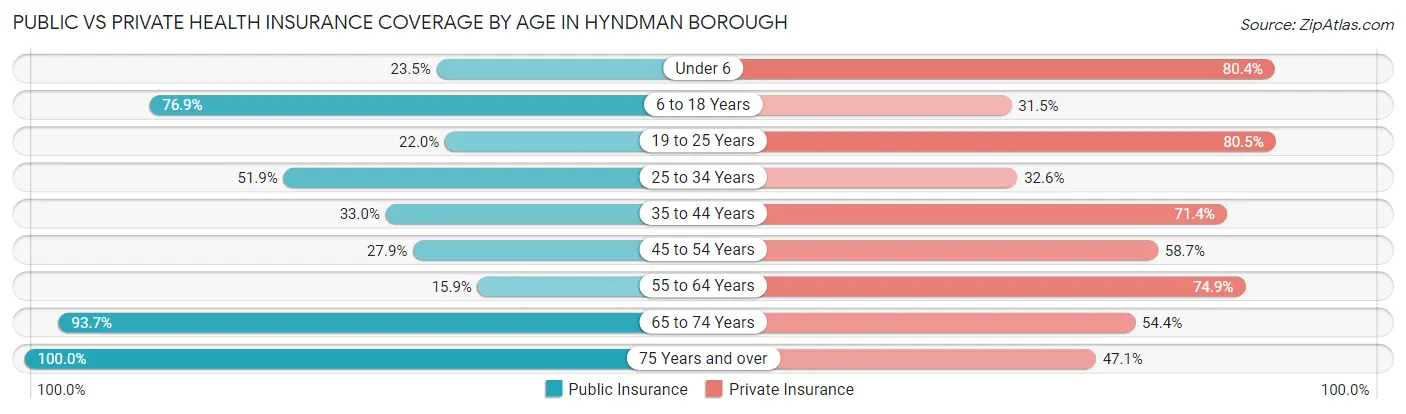
| Age Bracket | Public Insurance | Private Insurance |
| Under 6 | 12 (23.5%) | 41 (80.4%) |
| 6 to 18 Years | 83 (76.8%) | 34 (31.5%) |
| 19 to 25 Years | 18 (22.0%) | 66 (80.5%) |
| 25 to 34 Years | 67 (51.9%) | 42 (32.6%) |
| 35 to 44 Years | 30 (33.0%) | 65 (71.4%) |
| 45 to 54 Years | 29 (27.9%) | 61 (58.7%) |
| 55 to 64 Years | 31 (15.9%) | 146 (74.9%) |
| 65 to 74 Years | 74 (93.7%) | 43 (54.4%) |
| 75 Years and over | 87 (100.0%) | 41 (47.1%) |
| Total | 431 (46.5%) | 539 (58.2%) |
Disability Status by Sex by Age in Hyndman borough
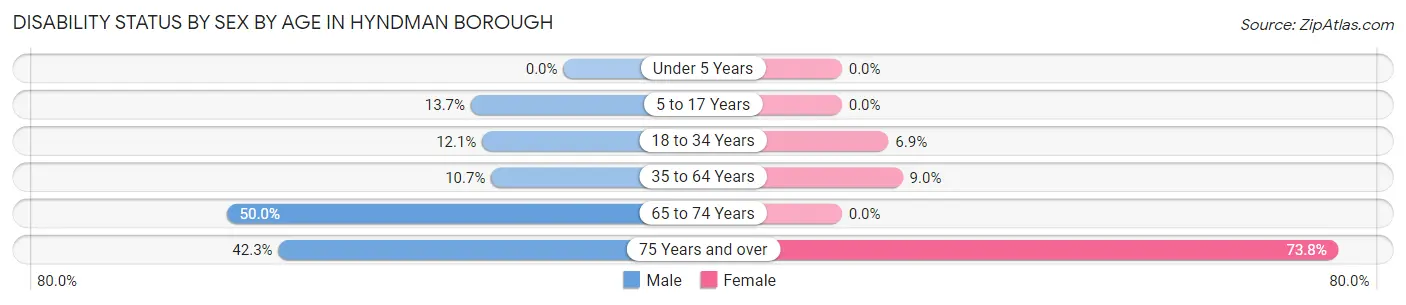
| Age Bracket | Male | Female |
| Under 5 Years | 0 (0.0%) | 0 (0.0%) |
| 5 to 17 Years | 7 (13.7%) | 0 (0.0%) |
| 18 to 34 Years | 10 (12.0%) | 9 (6.9%) |
| 35 to 64 Years | 24 (10.7%) | 15 (9.0%) |
| 65 to 74 Years | 9 (50.0%) | 0 (0.0%) |
| 75 Years and over | 11 (42.3%) | 45 (73.8%) |
Disability Class by Sex by Age in Hyndman borough
Disability Class: Hearing Difficulty
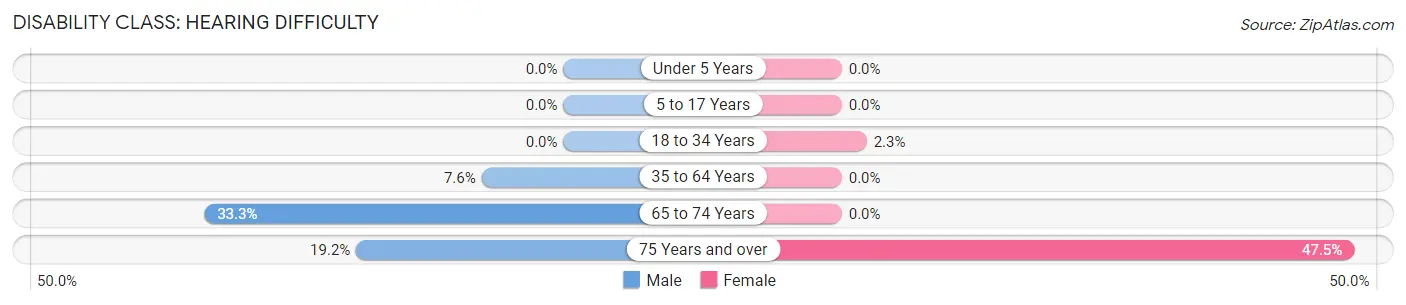
| Age Bracket | Male | Female |
| Under 5 Years | 0 (0.0%) | 0 (0.0%) |
| 5 to 17 Years | 0 (0.0%) | 0 (0.0%) |
| 18 to 34 Years | 0 (0.0%) | 3 (2.3%) |
| 35 to 64 Years | 17 (7.6%) | 0 (0.0%) |
| 65 to 74 Years | 6 (33.3%) | 0 (0.0%) |
| 75 Years and over | 5 (19.2%) | 29 (47.5%) |
Disability Class: Vision Difficulty
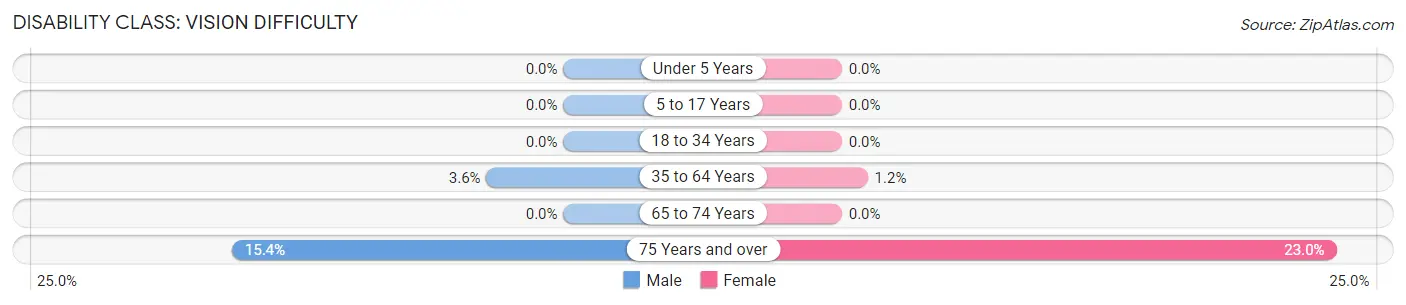
| Age Bracket | Male | Female |
| Under 5 Years | 0 (0.0%) | 0 (0.0%) |
| 5 to 17 Years | 0 (0.0%) | 0 (0.0%) |
| 18 to 34 Years | 0 (0.0%) | 0 (0.0%) |
| 35 to 64 Years | 8 (3.6%) | 2 (1.2%) |
| 65 to 74 Years | 0 (0.0%) | 0 (0.0%) |
| 75 Years and over | 4 (15.4%) | 14 (23.0%) |
Disability Class: Cognitive Difficulty
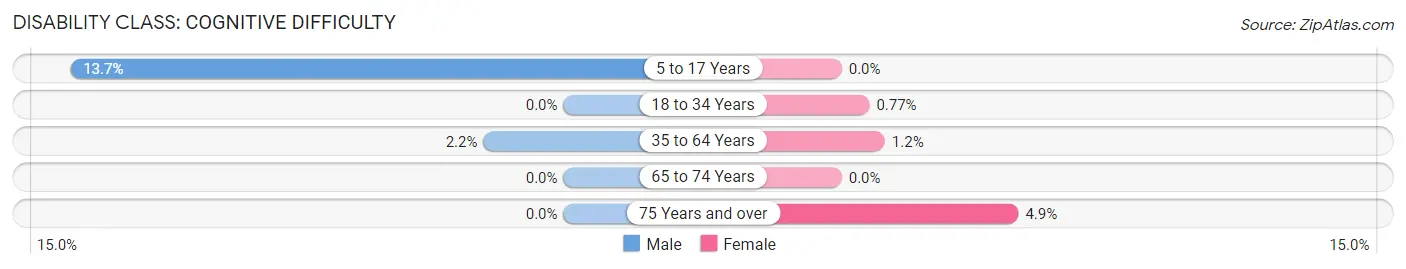
| Age Bracket | Male | Female |
| 5 to 17 Years | 7 (13.7%) | 0 (0.0%) |
| 18 to 34 Years | 0 (0.0%) | 1 (0.8%) |
| 35 to 64 Years | 5 (2.2%) | 2 (1.2%) |
| 65 to 74 Years | 0 (0.0%) | 0 (0.0%) |
| 75 Years and over | 0 (0.0%) | 3 (4.9%) |
Disability Class: Ambulatory Difficulty
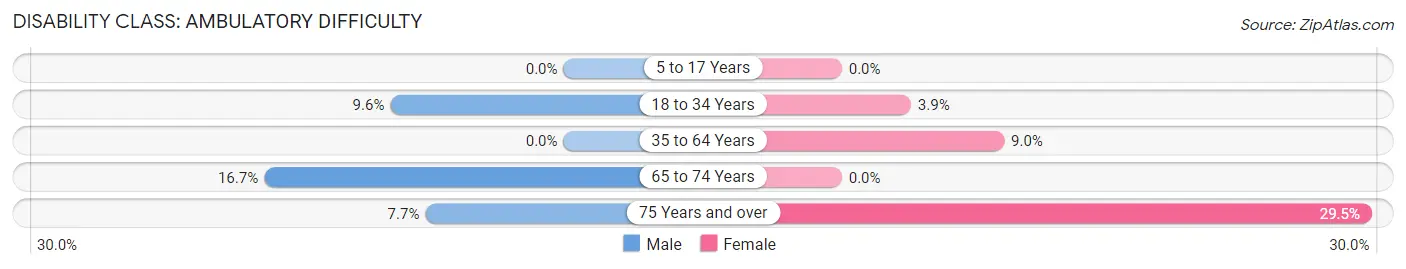
| Age Bracket | Male | Female |
| 5 to 17 Years | 0 (0.0%) | 0 (0.0%) |
| 18 to 34 Years | 8 (9.6%) | 5 (3.8%) |
| 35 to 64 Years | 0 (0.0%) | 15 (9.0%) |
| 65 to 74 Years | 3 (16.7%) | 0 (0.0%) |
| 75 Years and over | 2 (7.7%) | 18 (29.5%) |
Disability Class: Self-Care Difficulty
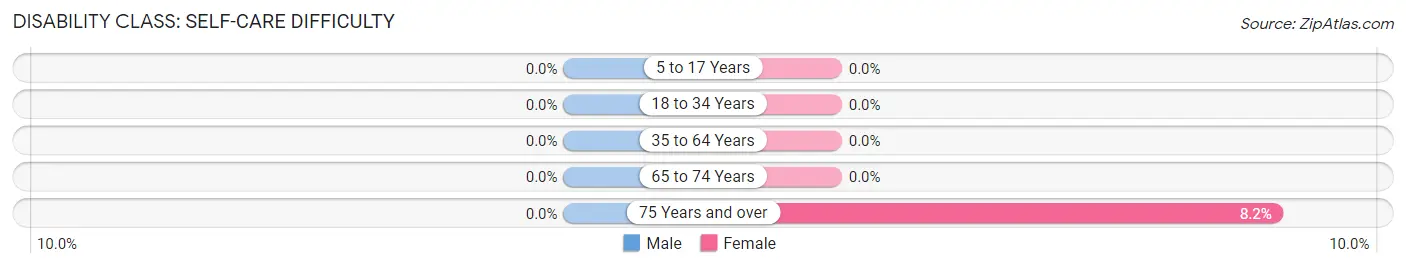
| Age Bracket | Male | Female |
| 5 to 17 Years | 0 (0.0%) | 0 (0.0%) |
| 18 to 34 Years | 0 (0.0%) | 0 (0.0%) |
| 35 to 64 Years | 0 (0.0%) | 0 (0.0%) |
| 65 to 74 Years | 0 (0.0%) | 0 (0.0%) |
| 75 Years and over | 0 (0.0%) | 5 (8.2%) |
Technology Access in Hyndman borough
Computing Device Access in Hyndman borough
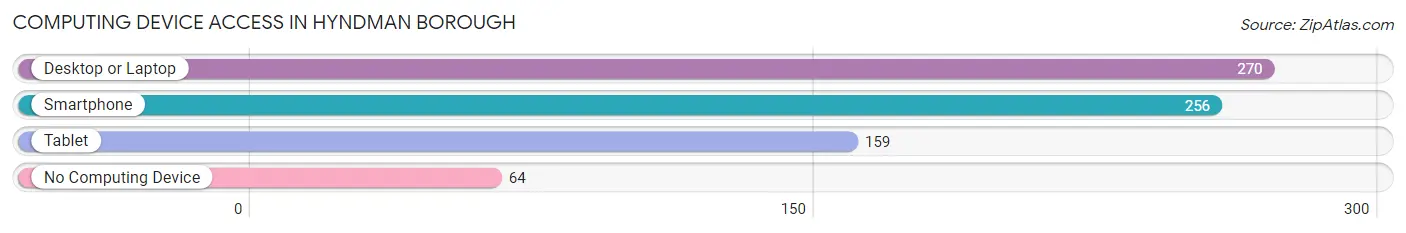
| Device Type | # Households | % Households |
| Desktop or Laptop | 270 | 72.4% |
| Smartphone | 256 | 68.6% |
| Tablet | 159 | 42.6% |
| No Computing Device | 64 | 17.2% |
| Total | 373 | 100.0% |
Internet Access in Hyndman borough
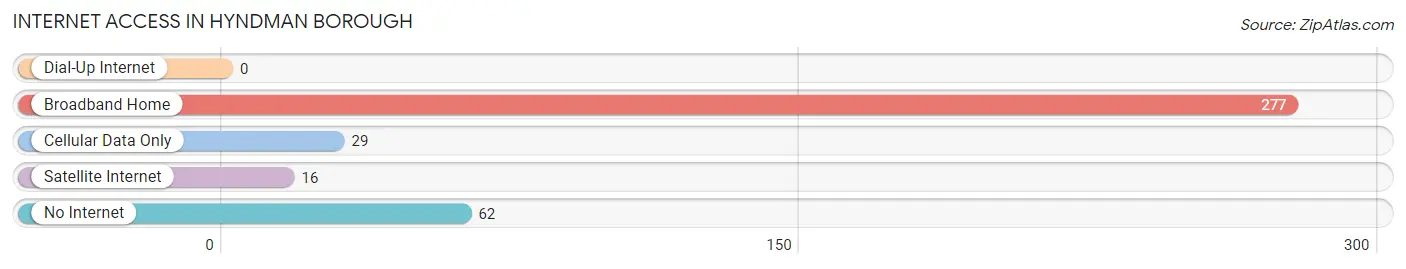
| Internet Type | # Households | % Households |
| Dial-Up Internet | 0 | 0.0% |
| Broadband Home | 277 | 74.3% |
| Cellular Data Only | 29 | 7.8% |
| Satellite Internet | 16 | 4.3% |
| No Internet | 62 | 16.6% |
| Total | 373 | 100.0% |
Hyndman borough Summary
Hyndman Borough is a small borough located in Bedford County, Pennsylvania. It is situated in the Appalachian Mountains and is part of the Cumberland Valley region. The population of Hyndman Borough was 1,093 at the 2010 census.
History
Hyndman Borough was founded in 1872 by a group of settlers from the nearby town of Bedford. The town was named after the Hyndman family, who were among the first settlers. The town was incorporated in 1876 and has remained a small, rural community ever since.
The town was originally a farming community, but in the early 20th century, the coal industry began to take off in the area. The coal industry provided jobs and economic stability to the town, and it remained a major employer until the industry began to decline in the 1950s.
Geography
Hyndman Borough is located in the Appalachian Mountains of Bedford County, Pennsylvania. It is situated in the Cumberland Valley region, which is known for its rolling hills and lush forests. The town is located at the intersection of US Route 220 and Pennsylvania Route 96.
The town is located at an elevation of 1,845 feet above sea level. The climate is humid continental, with cold winters and hot, humid summers. The average annual temperature is 48.3 degrees Fahrenheit.
Economy
The economy of Hyndman Borough is largely based on agriculture and tourism. The town is home to several farms, which produce a variety of crops, including corn, soybeans, hay, and wheat. The town also has several small businesses, including restaurants, shops, and a gas station.
The town is also a popular tourist destination, as it is located near several state parks and recreational areas. The town is home to several bed and breakfasts, as well as a few small hotels.
Demographics
As of the 2010 census, the population of Hyndman Borough was 1,093. The racial makeup of the town was 97.2% White, 0.7% African American, 0.2% Native American, 0.2% Asian, 0.1% Pacific Islander, 0.7% from other races, and 0.9% from two or more races. Hispanic or Latino of any race were 1.3% of the population.
The median income for a household in the town was $35,625, and the median income for a family was $41,250. The per capita income for the town was $17,845. About 11.2% of families and 14.2% of the population were below the poverty line, including 18.2% of those under age 18 and 8.3% of those age 65 or over.
Hyndman Borough is a small, rural community with a rich history and a strong sense of community. The town is home to a variety of businesses and attractions, and it is a popular tourist destination. The town is also home to a diverse population, with a variety of racial and ethnic backgrounds. The town is a great place to live, work, and visit.
Common Questions
What is Per Capita Income in Hyndman borough?
Per Capita income in Hyndman borough is $24,509.
What is the Median Family Income in Hyndman borough?
Median Family Income in Hyndman borough is $64,688.
What is the Median Household income in Hyndman borough?
Median Household Income in Hyndman borough is $48,750.
What is Income or Wage Gap in Hyndman borough?
Income or Wage Gap in Hyndman borough is 37.2%.
Women in Hyndman borough earn 62.8 cents for every dollar earned by a man.
What is Inequality or Gini Index in Hyndman borough?
Inequality or Gini Index in Hyndman borough is 0.39.
What is the Total Population of Hyndman borough?
Total Population of Hyndman borough is 926.
What is the Total Male Population of Hyndman borough?
Total Male Population of Hyndman borough is 417.
What is the Total Female Population of Hyndman borough?
Total Female Population of Hyndman borough is 509.
What is the Ratio of Males per 100 Females in Hyndman borough?
There are 81.93 Males per 100 Females in Hyndman borough.
What is the Ratio of Females per 100 Males in Hyndman borough?
There are 122.06 Females per 100 Males in Hyndman borough.
What is the Median Population Age in Hyndman borough?
Median Population Age in Hyndman borough is 45.2 Years.
What is the Average Family Size in Hyndman borough
Average Family Size in Hyndman borough is 3.1 People.
What is the Average Household Size in Hyndman borough
Average Household Size in Hyndman borough is 2.5 People.
How Large is the Labor Force in Hyndman borough?
There are 481 People in the Labor Forcein in Hyndman borough.
What is the Percentage of People in the Labor Force in Hyndman borough?
61.9% of People are in the Labor Force in Hyndman borough.
What is the Unemployment Rate in Hyndman borough?
Unemployment Rate in Hyndman borough is 5.0%.