Pottsgrove, PA Map & Demographics
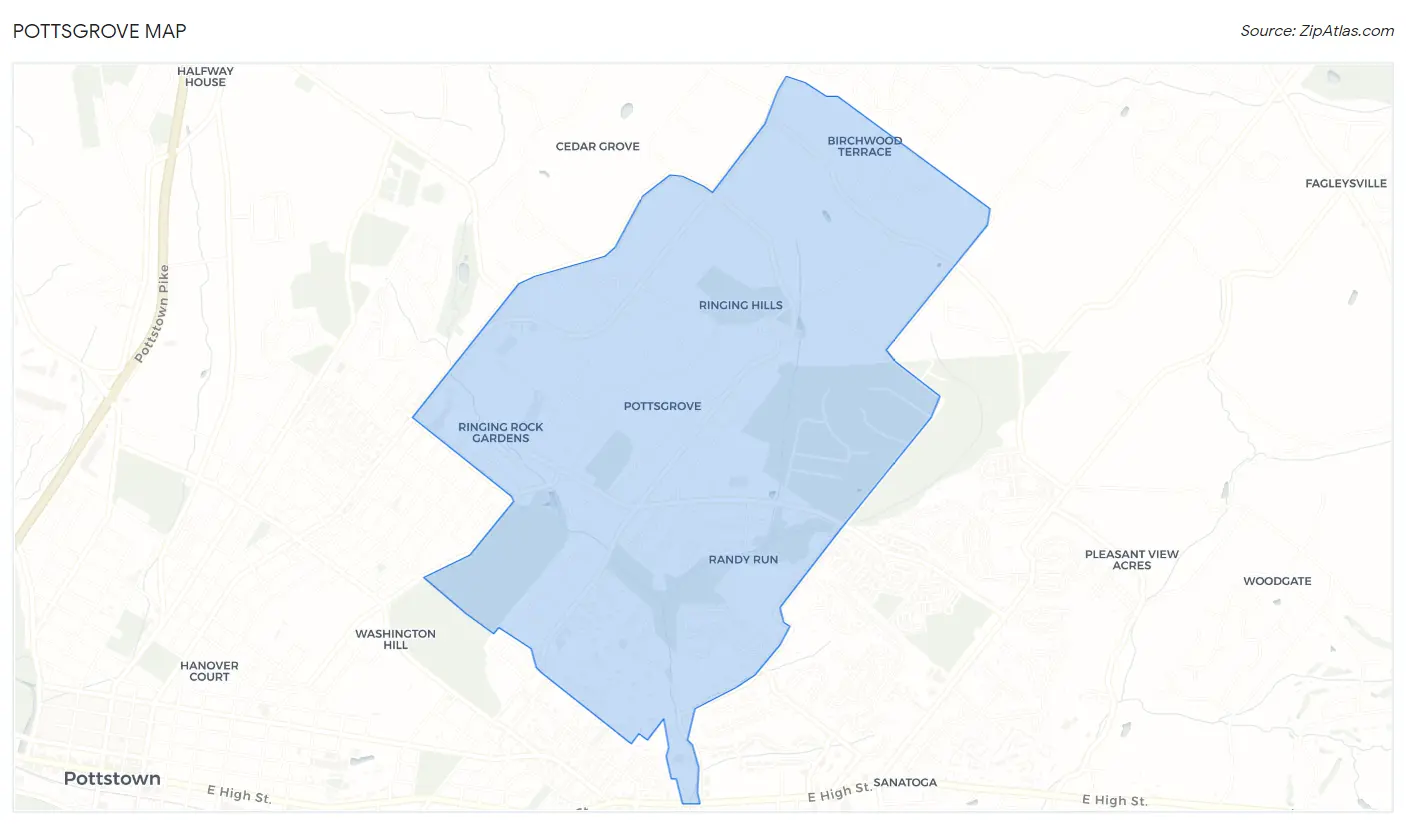
Pottsgrove Map
Pottsgrove Overview
$47,259
PER CAPITA INCOME
$134,034
AVG FAMILY INCOME
$125,303
AVG HOUSEHOLD INCOME
17.6%
WAGE / INCOME GAP [ % ]
82.4¢/ $1
WAGE / INCOME GAP [ $ ]
0.34
INEQUALITY / GINI INDEX
3,409
TOTAL POPULATION
1,743
MALE POPULATION
1,666
FEMALE POPULATION
104.62
MALES / 100 FEMALES
95.58
FEMALES / 100 MALES
43.5
MEDIAN AGE
3.2
AVG FAMILY SIZE
3.0
AVG HOUSEHOLD SIZE
2,100
LABOR FORCE [ PEOPLE ]
73.2%
PERCENT IN LABOR FORCE
3.2%
UNEMPLOYMENT RATE
Income in Pottsgrove
Income Overview in Pottsgrove
Per Capita Income in Pottsgrove is $47,259, while median incomes of families and households are $134,034 and $125,303 respectively.
| Characteristic | Number | Measure |
| Per Capita Income | 3,409 | $47,259 |
| Median Family Income | 939 | $134,034 |
| Mean Family Income | 939 | $147,602 |
| Median Household Income | 1,150 | $125,303 |
| Mean Household Income | 1,150 | $134,828 |
| Income Deficit | 939 | $0 |
| Wage / Income Gap (%) | 3,409 | 17.60% |
| Wage / Income Gap ($) | 3,409 | 82.40¢ per $1 |
| Gini / Inequality Index | 3,409 | 0.34 |
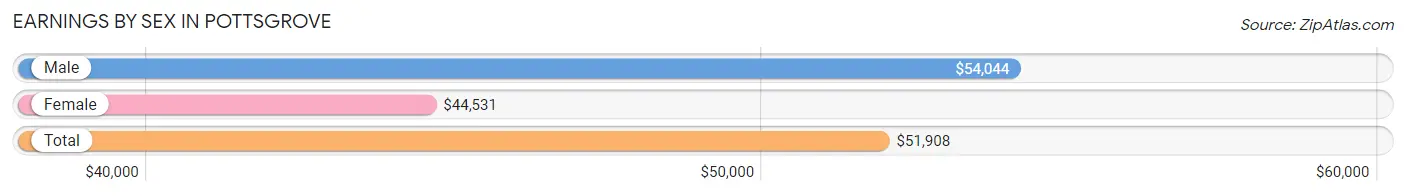
Earnings by Sex in Pottsgrove
Average Earnings in Pottsgrove are $51,908, $54,044 for men and $44,531 for women, a difference of 17.6%.
| Sex | Number | Average Earnings |
| Male | 1,191 (55.8%) | $54,044 |
| Female | 943 (44.2%) | $44,531 |
| Total | 2,134 (100.0%) | $51,908 |
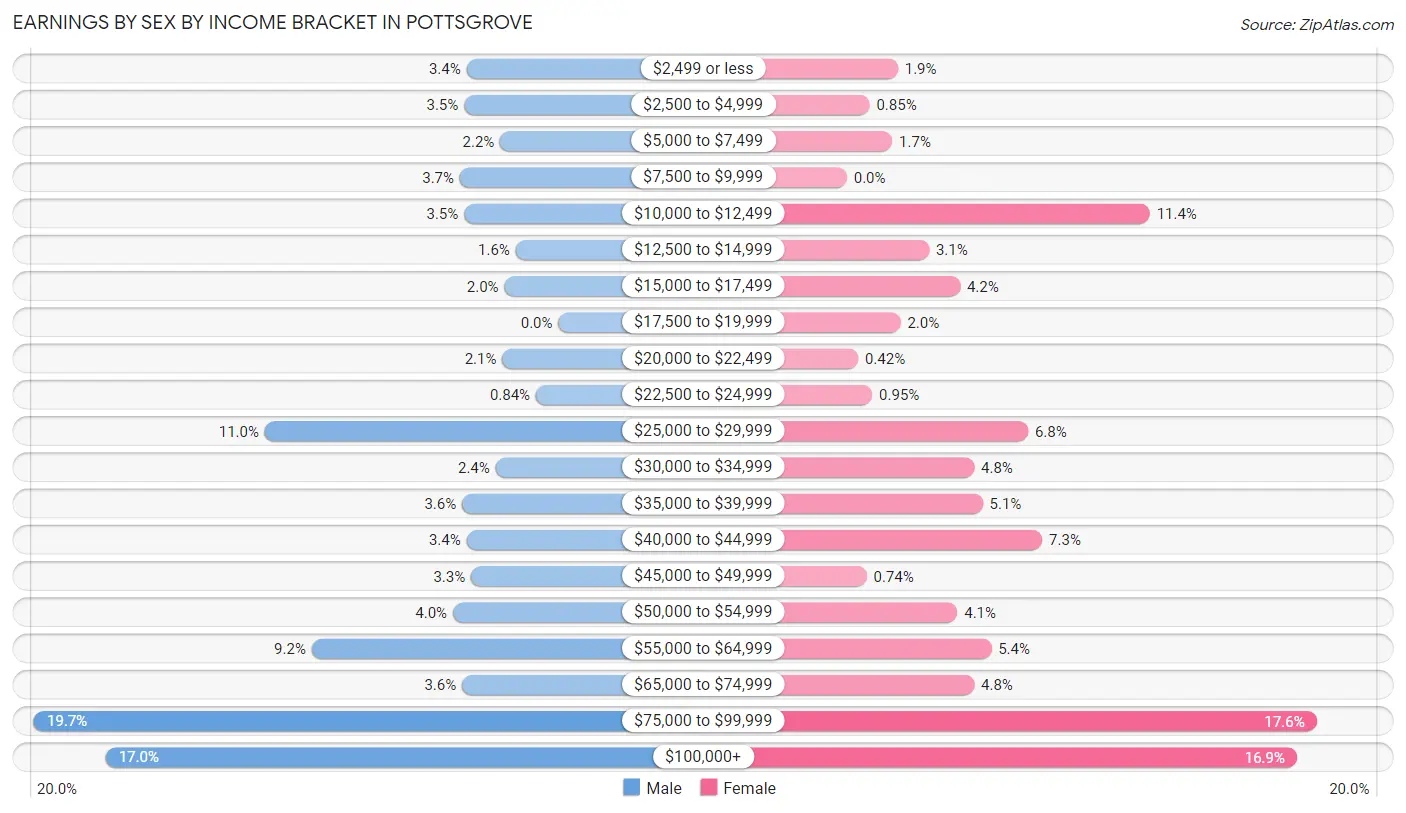
Earnings by Sex by Income Bracket in Pottsgrove
The most common earnings brackets in Pottsgrove are $75,000 to $99,999 for men (234 | 19.7%) and $75,000 to $99,999 for women (166 | 17.6%).
| Income | Male | Female |
| $2,499 or less | 41 (3.4%) | 18 (1.9%) |
| $2,500 to $4,999 | 42 (3.5%) | 8 (0.9%) |
| $5,000 to $7,499 | 26 (2.2%) | 16 (1.7%) |
| $7,500 to $9,999 | 44 (3.7%) | 0 (0.0%) |
| $10,000 to $12,499 | 42 (3.5%) | 107 (11.4%) |
| $12,500 to $14,999 | 19 (1.6%) | 29 (3.1%) |
| $15,000 to $17,499 | 24 (2.0%) | 40 (4.2%) |
| $17,500 to $19,999 | 0 (0.0%) | 19 (2.0%) |
| $20,000 to $22,499 | 25 (2.1%) | 4 (0.4%) |
| $22,500 to $24,999 | 10 (0.8%) | 9 (0.9%) |
| $25,000 to $29,999 | 131 (11.0%) | 64 (6.8%) |
| $30,000 to $34,999 | 28 (2.4%) | 45 (4.8%) |
| $35,000 to $39,999 | 43 (3.6%) | 48 (5.1%) |
| $40,000 to $44,999 | 41 (3.4%) | 69 (7.3%) |
| $45,000 to $49,999 | 39 (3.3%) | 7 (0.7%) |
| $50,000 to $54,999 | 47 (4.0%) | 39 (4.1%) |
| $55,000 to $64,999 | 110 (9.2%) | 51 (5.4%) |
| $65,000 to $74,999 | 43 (3.6%) | 45 (4.8%) |
| $75,000 to $99,999 | 234 (19.7%) | 166 (17.6%) |
| $100,000+ | 202 (17.0%) | 159 (16.9%) |
| Total | 1,191 (100.0%) | 943 (100.0%) |
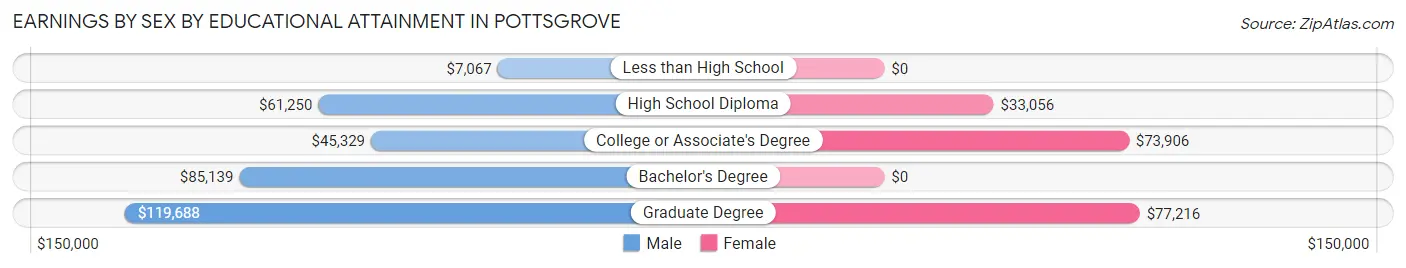
Earnings by Sex by Educational Attainment in Pottsgrove
Average earnings in Pottsgrove are $59,639 for men and $54,234 for women, a difference of 9.1%. Men with an educational attainment of graduate degree enjoy the highest average annual earnings of $119,688, while those with less than high school education earn the least with $7,067. Women with an educational attainment of graduate degree earn the most with the average annual earnings of $77,216, while those with high school diploma education have the smallest earnings of $33,056.
| Educational Attainment | Male Income | Female Income |
| Less than High School | $7,067 | $0 |
| High School Diploma | $61,250 | $33,056 |
| College or Associate's Degree | $45,329 | $73,906 |
| Bachelor's Degree | $85,139 | $0 |
| Graduate Degree | $119,688 | $77,216 |
| Total | $59,639 | $54,234 |
Family Income in Pottsgrove
Family Income Brackets in Pottsgrove
According to the Pottsgrove family income data, there are 291 families falling into the $100,000 to $149,999 income range, which is the most common income bracket and makes up 31.0% of all families.
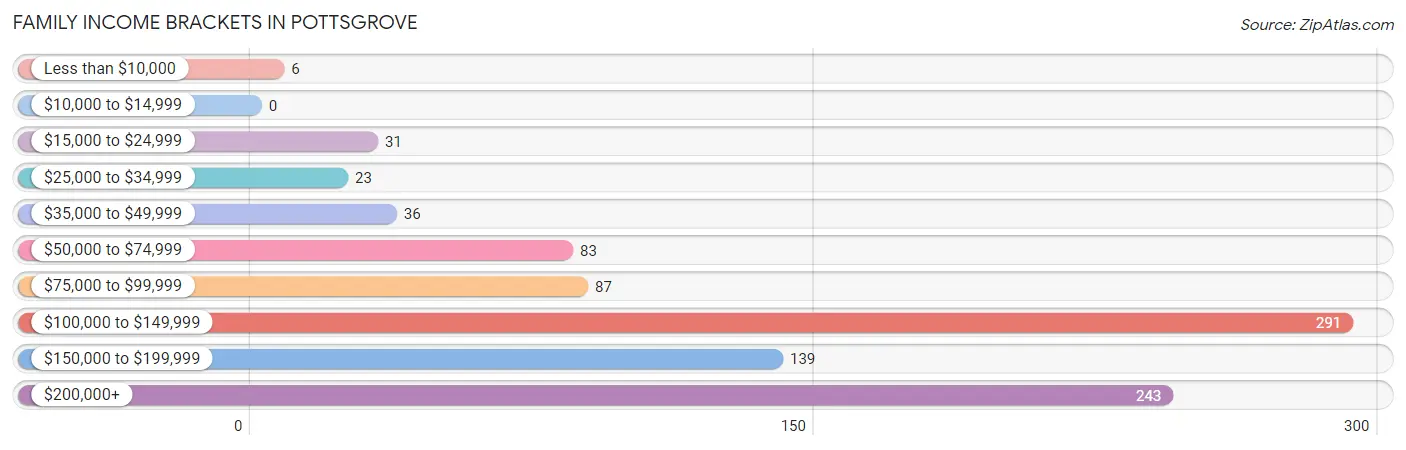
| Income Bracket | # Families | % Families |
| Less than $10,000 | 6 | 0.6% |
| $10,000 to $14,999 | 0 | 0.0% |
| $15,000 to $24,999 | 31 | 3.3% |
| $25,000 to $34,999 | 23 | 2.4% |
| $35,000 to $49,999 | 36 | 3.8% |
| $50,000 to $74,999 | 83 | 8.8% |
| $75,000 to $99,999 | 87 | 9.3% |
| $100,000 to $149,999 | 291 | 31.0% |
| $150,000 to $199,999 | 139 | 14.8% |
| $200,000+ | 243 | 25.9% |
Family Income by Famaliy Size in Pottsgrove
5-person families (61 | 6.5%) account for the highest median family income in Pottsgrove with $166,094 per family, while 2-person families (396 | 42.2%) have the highest median income of $54,474 per family member.
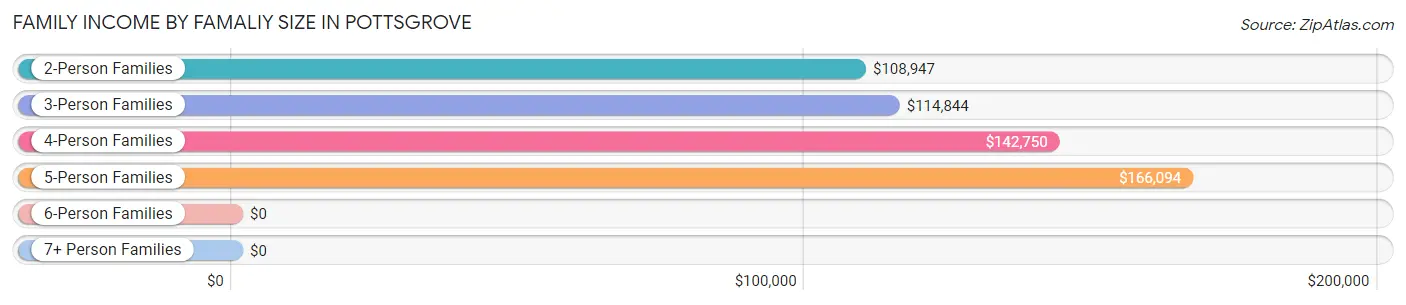
| Income Bracket | # Families | Median Income |
| 2-Person Families | 396 (42.2%) | $108,947 |
| 3-Person Families | 239 (25.5%) | $114,844 |
| 4-Person Families | 223 (23.7%) | $142,750 |
| 5-Person Families | 61 (6.5%) | $166,094 |
| 6-Person Families | 16 (1.7%) | $0 |
| 7+ Person Families | 4 (0.4%) | $0 |
| Total | 939 (100.0%) | $134,034 |
Family Income by Number of Earners in Pottsgrove
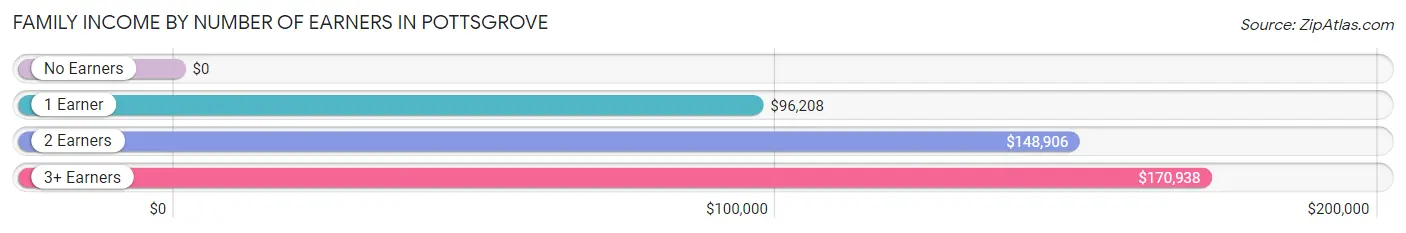
| Number of Earners | # Families | Median Income |
| No Earners | 94 (10.0%) | $0 |
| 1 Earner | 199 (21.2%) | $96,208 |
| 2 Earners | 464 (49.4%) | $148,906 |
| 3+ Earners | 182 (19.4%) | $170,938 |
| Total | 939 (100.0%) | $134,034 |
Household Income in Pottsgrove
Household Income Brackets in Pottsgrove
With 330 households falling in the category, the $100,000 to $149,999 income range is the most frequent in Pottsgrove, accounting for 28.7% of all households. In contrast, only 8 households (0.7%) fall into the $10,000 to $14,999 income bracket, making it the least populous group.
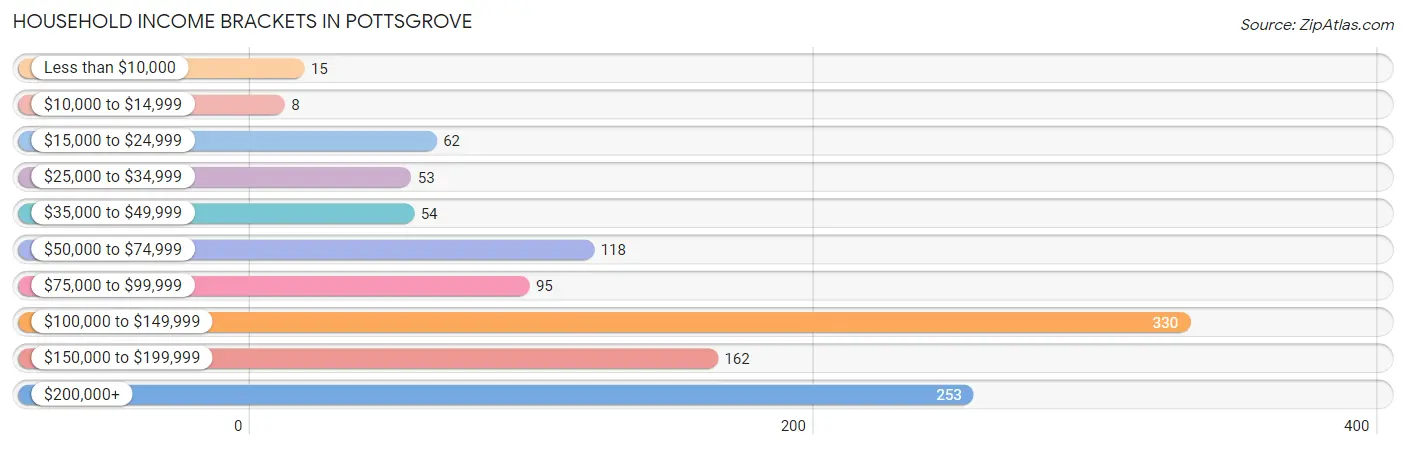
| Income Bracket | # Households | % Households |
| Less than $10,000 | 15 | 1.3% |
| $10,000 to $14,999 | 8 | 0.7% |
| $15,000 to $24,999 | 62 | 5.4% |
| $25,000 to $34,999 | 53 | 4.6% |
| $35,000 to $49,999 | 54 | 4.7% |
| $50,000 to $74,999 | 118 | 10.3% |
| $75,000 to $99,999 | 95 | 8.3% |
| $100,000 to $149,999 | 330 | 28.7% |
| $150,000 to $199,999 | 162 | 14.1% |
| $200,000+ | 253 | 22.0% |
Household Income by Householder Age in Pottsgrove
The median household income in Pottsgrove is $125,303, with the highest median household income of $146,696 found in the 45 to 64 years age bracket for the primary householder. A total of 431 households (37.5%) fall into this category.
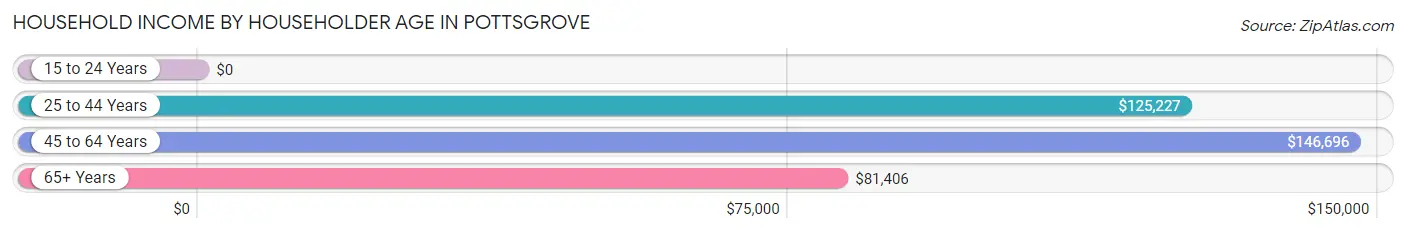
| Income Bracket | # Households | Median Income |
| 15 to 24 Years | 0 (0.0%) | $0 |
| 25 to 44 Years | 400 (34.8%) | $125,227 |
| 45 to 64 Years | 431 (37.5%) | $146,696 |
| 65+ Years | 319 (27.7%) | $81,406 |
| Total | 1,150 (100.0%) | $125,303 |
Poverty in Pottsgrove
Income Below Poverty by Sex and Age in Pottsgrove
With 7.1% poverty level for males and 1.9% for females among the residents of Pottsgrove, 18 to 24 year old males and 45 to 54 year old females are the most vulnerable to poverty, with 27 males (22.9%) and 18 females (10.5%) in their respective age groups living below the poverty level.
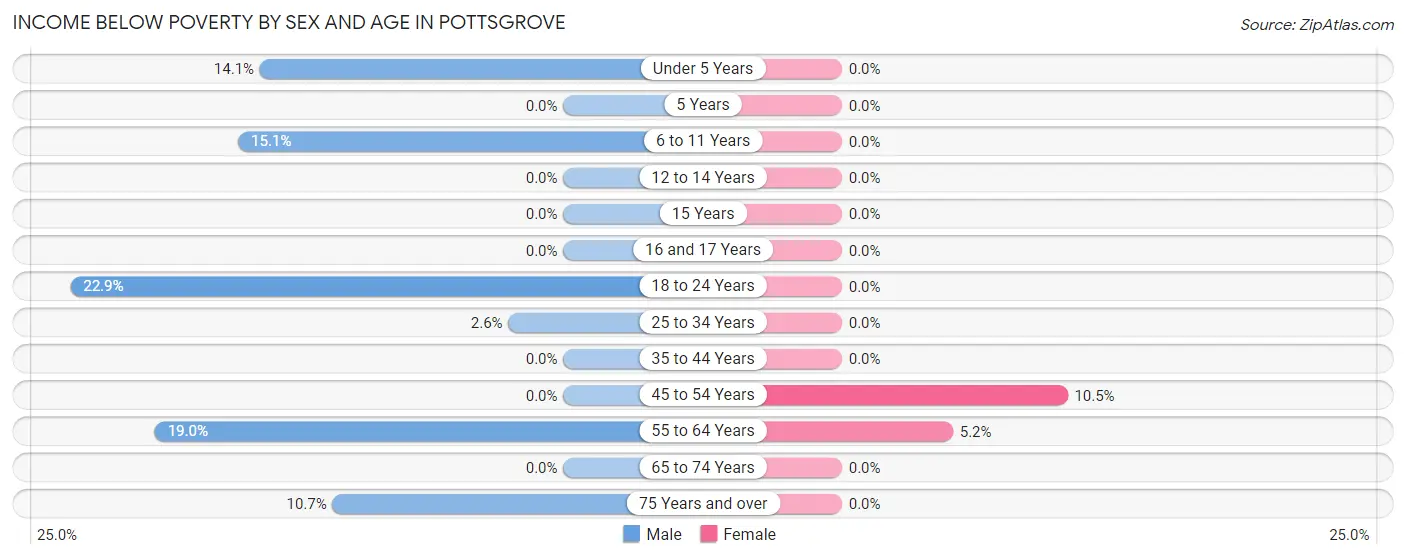
| Age Bracket | Male | Female |
| Under 5 Years | 10 (14.1%) | 0 (0.0%) |
| 5 Years | 0 (0.0%) | 0 (0.0%) |
| 6 to 11 Years | 8 (15.1%) | 0 (0.0%) |
| 12 to 14 Years | 0 (0.0%) | 0 (0.0%) |
| 15 Years | 0 (0.0%) | 0 (0.0%) |
| 16 and 17 Years | 0 (0.0%) | 0 (0.0%) |
| 18 to 24 Years | 27 (22.9%) | 0 (0.0%) |
| 25 to 34 Years | 7 (2.5%) | 0 (0.0%) |
| 35 to 44 Years | 0 (0.0%) | 0 (0.0%) |
| 45 to 54 Years | 0 (0.0%) | 18 (10.5%) |
| 55 to 64 Years | 62 (19.0%) | 14 (5.1%) |
| 65 to 74 Years | 0 (0.0%) | 0 (0.0%) |
| 75 Years and over | 9 (10.7%) | 0 (0.0%) |
| Total | 123 (7.1%) | 32 (1.9%) |
Income Above Poverty by Sex and Age in Pottsgrove
According to the poverty statistics in Pottsgrove, males aged 5 years and females aged under 5 years are the age groups that are most secure financially, with 100.0% of males and 100.0% of females in these age groups living above the poverty line.
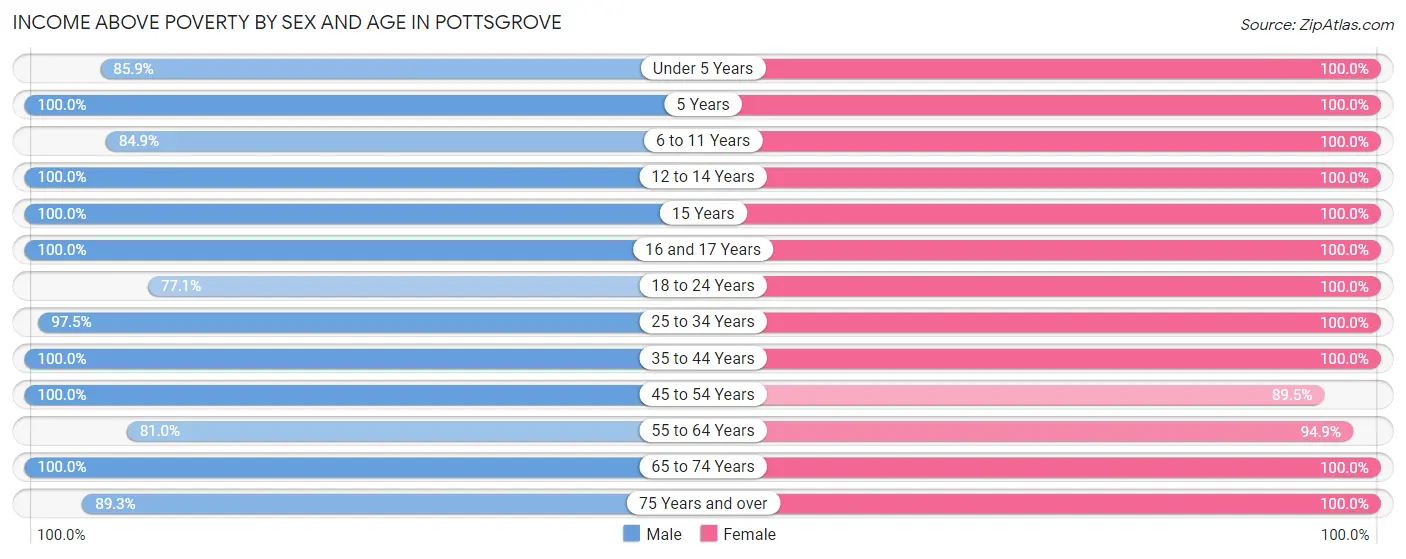
| Age Bracket | Male | Female |
| Under 5 Years | 61 (85.9%) | 92 (100.0%) |
| 5 Years | 70 (100.0%) | 8 (100.0%) |
| 6 to 11 Years | 45 (84.9%) | 116 (100.0%) |
| 12 to 14 Years | 37 (100.0%) | 55 (100.0%) |
| 15 Years | 13 (100.0%) | 14 (100.0%) |
| 16 and 17 Years | 62 (100.0%) | 25 (100.0%) |
| 18 to 24 Years | 91 (77.1%) | 115 (100.0%) |
| 25 to 34 Years | 268 (97.5%) | 133 (100.0%) |
| 35 to 44 Years | 221 (100.0%) | 319 (100.0%) |
| 45 to 54 Years | 241 (100.0%) | 154 (89.5%) |
| 55 to 64 Years | 265 (81.0%) | 258 (94.9%) |
| 65 to 74 Years | 160 (100.0%) | 167 (100.0%) |
| 75 Years and over | 75 (89.3%) | 178 (100.0%) |
| Total | 1,609 (92.9%) | 1,634 (98.1%) |
Income Below Poverty Among Married-Couple Families in Pottsgrove
The poverty statistics for married-couple families in Pottsgrove show that 1.5% or 13 of the total 862 families live below the poverty line. Families with no children have the highest poverty rate of 2.5%, comprising of 13 families. On the other hand, families with 1 or 2 children have the lowest poverty rate of 0.0%, which includes 0 families.
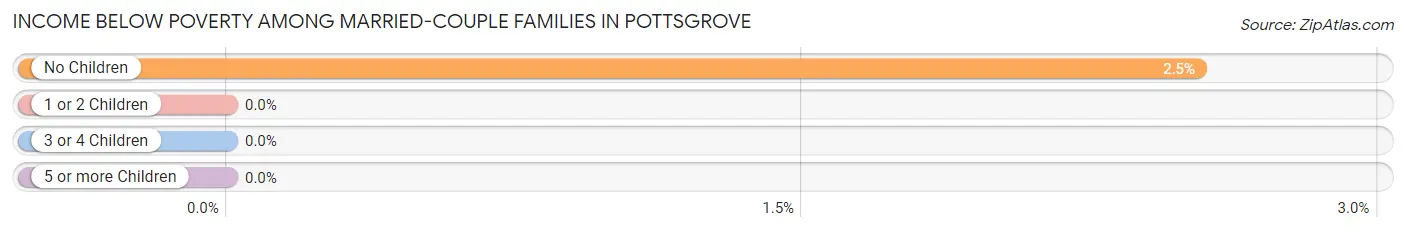
| Children | Above Poverty | Below Poverty |
| No Children | 501 (97.5%) | 13 (2.5%) |
| 1 or 2 Children | 314 (100.0%) | 0 (0.0%) |
| 3 or 4 Children | 30 (100.0%) | 0 (0.0%) |
| 5 or more Children | 4 (100.0%) | 0 (0.0%) |
| Total | 849 (98.5%) | 13 (1.5%) |
Income Below Poverty Among Single-Parent Households in Pottsgrove
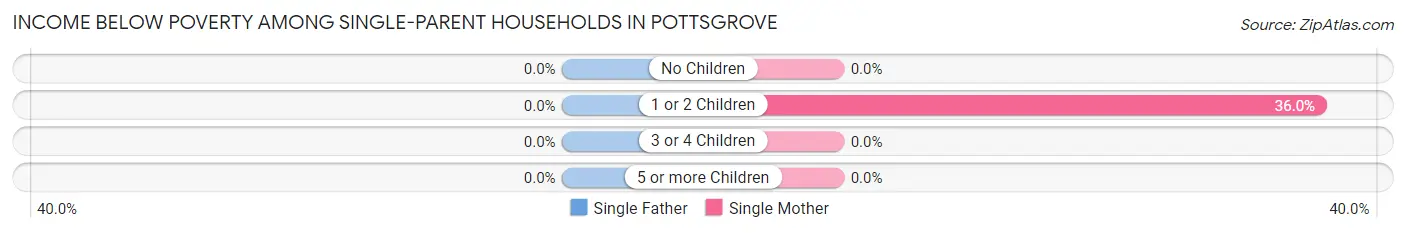
| Children | Single Father | Single Mother |
| No Children | 0 (0.0%) | 0 (0.0%) |
| 1 or 2 Children | 0 (0.0%) | 9 (36.0%) |
| 3 or 4 Children | 0 (0.0%) | 0 (0.0%) |
| 5 or more Children | 0 (0.0%) | 0 (0.0%) |
| Total | 0 (0.0%) | 9 (15.5%) |
Income Below Poverty Among Married-Couple vs Single-Parent Households in Pottsgrove
The poverty data for Pottsgrove shows that 13 of the married-couple family households (1.5%) and 9 of the single-parent households (11.7%) are living below the poverty level. Within the married-couple family households, those with no children have the highest poverty rate, with 13 households (2.5%) falling below the poverty line. Among the single-parent households, those with 1 or 2 children have the highest poverty rate, with 9 household (36.0%) living below poverty.
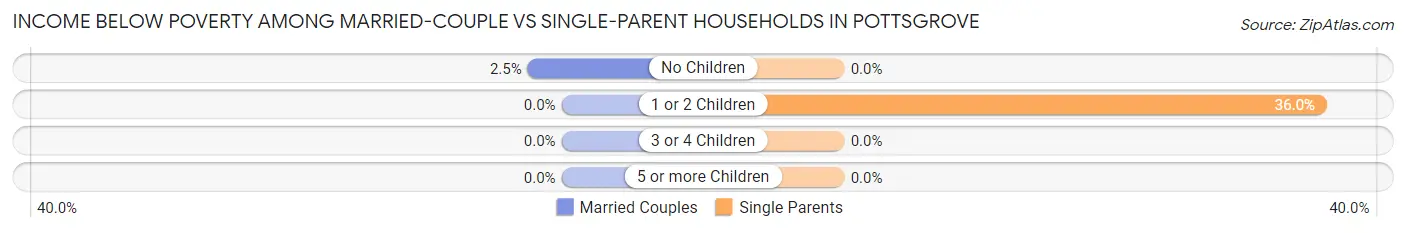
| Children | Married-Couple Families | Single-Parent Households |
| No Children | 13 (2.5%) | 0 (0.0%) |
| 1 or 2 Children | 0 (0.0%) | 9 (36.0%) |
| 3 or 4 Children | 0 (0.0%) | 0 (0.0%) |
| 5 or more Children | 0 (0.0%) | 0 (0.0%) |
| Total | 13 (1.5%) | 9 (11.7%) |
Race in Pottsgrove
The most populous races in Pottsgrove are White / Caucasian (3,029 | 88.8%), Black / African American (210 | 6.2%), and Two or more Races (118 | 3.5%).
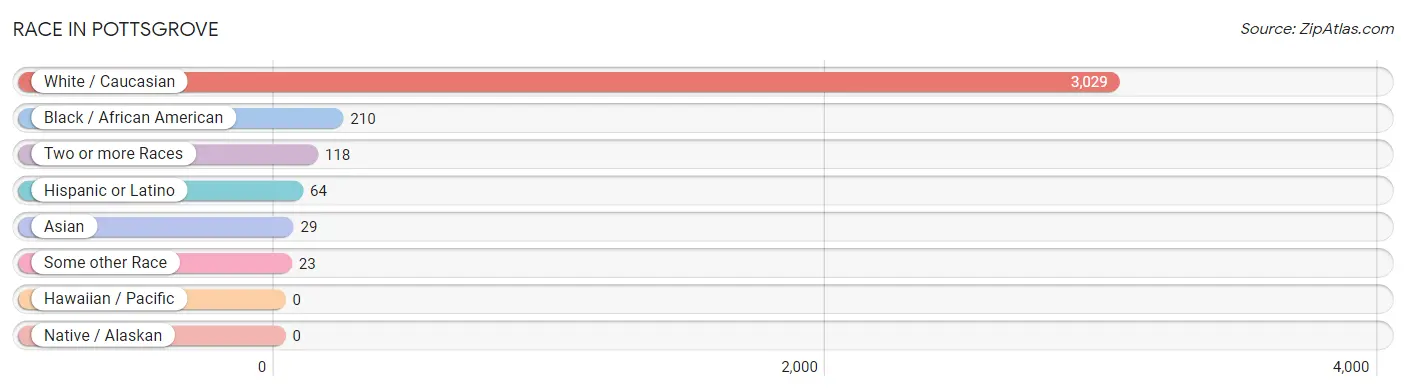
| Race | # Population | % Population |
| Asian | 29 | 0.9% |
| Black / African American | 210 | 6.2% |
| Hawaiian / Pacific | 0 | 0.0% |
| Hispanic or Latino | 64 | 1.9% |
| Native / Alaskan | 0 | 0.0% |
| White / Caucasian | 3,029 | 88.8% |
| Two or more Races | 118 | 3.5% |
| Some other Race | 23 | 0.7% |
| Total | 3,409 | 100.0% |
Ancestry in Pottsgrove
The most populous ancestries reported in Pottsgrove are German (957 | 28.1%), Italian (659 | 19.3%), Irish (556 | 16.3%), Polish (460 | 13.5%), and English (375 | 11.0%), together accounting for 88.2% of all Pottsgrove residents.
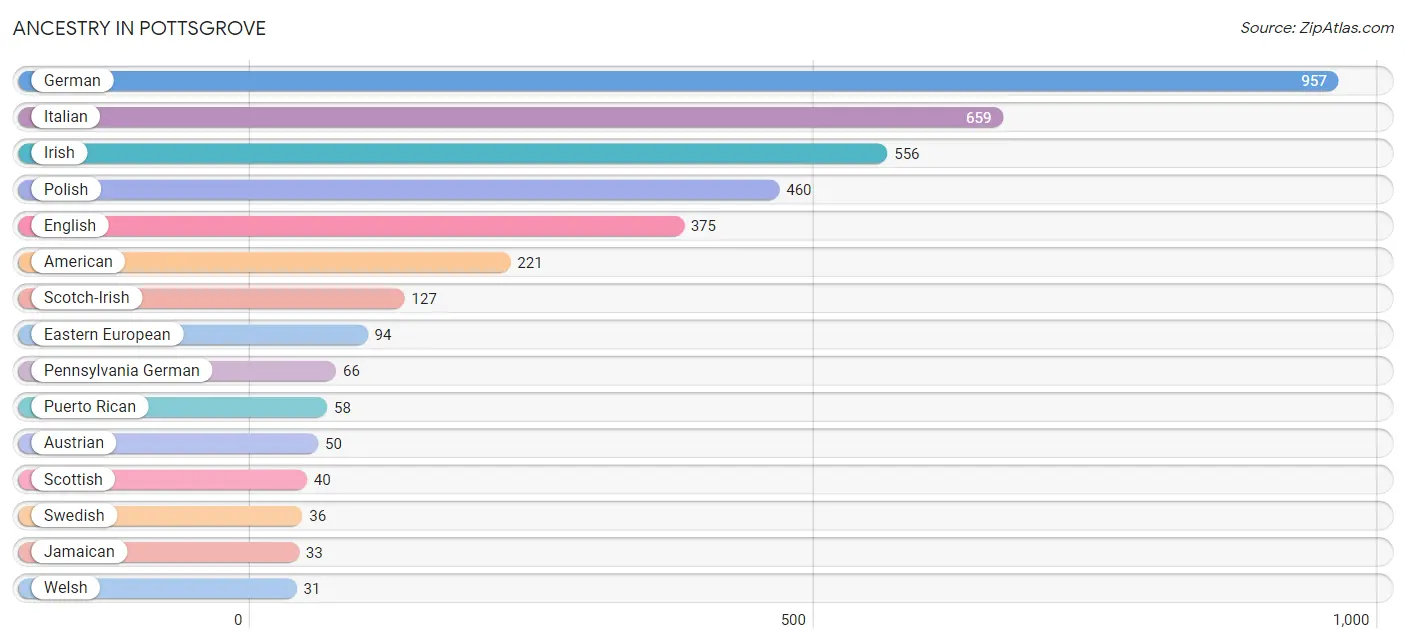
| Ancestry | # Population | % Population |
| American | 221 | 6.5% |
| Austrian | 50 | 1.5% |
| British | 11 | 0.3% |
| British West Indian | 7 | 0.2% |
| Burmese | 12 | 0.4% |
| Central American | 6 | 0.2% |
| Czech | 8 | 0.2% |
| Dutch | 15 | 0.4% |
| Eastern European | 94 | 2.8% |
| English | 375 | 11.0% |
| European | 30 | 0.9% |
| French | 21 | 0.6% |
| French Canadian | 8 | 0.2% |
| German | 957 | 28.1% |
| Greek | 21 | 0.6% |
| Hungarian | 9 | 0.3% |
| Irish | 556 | 16.3% |
| Italian | 659 | 19.3% |
| Jamaican | 33 | 1.0% |
| Korean | 8 | 0.2% |
| Lithuanian | 8 | 0.2% |
| Northern European | 9 | 0.3% |
| Norwegian | 8 | 0.2% |
| Pakistani | 9 | 0.3% |
| Panamanian | 6 | 0.2% |
| Pennsylvania German | 66 | 1.9% |
| Polish | 460 | 13.5% |
| Puerto Rican | 58 | 1.7% |
| Scotch-Irish | 127 | 3.7% |
| Scottish | 40 | 1.2% |
| Slovak | 24 | 0.7% |
| Swedish | 36 | 1.1% |
| Trinidadian and Tobagonian | 5 | 0.2% |
| Ukrainian | 29 | 0.9% |
| Welsh | 31 | 0.9% | View All 35 Rows |
Immigrants in Pottsgrove
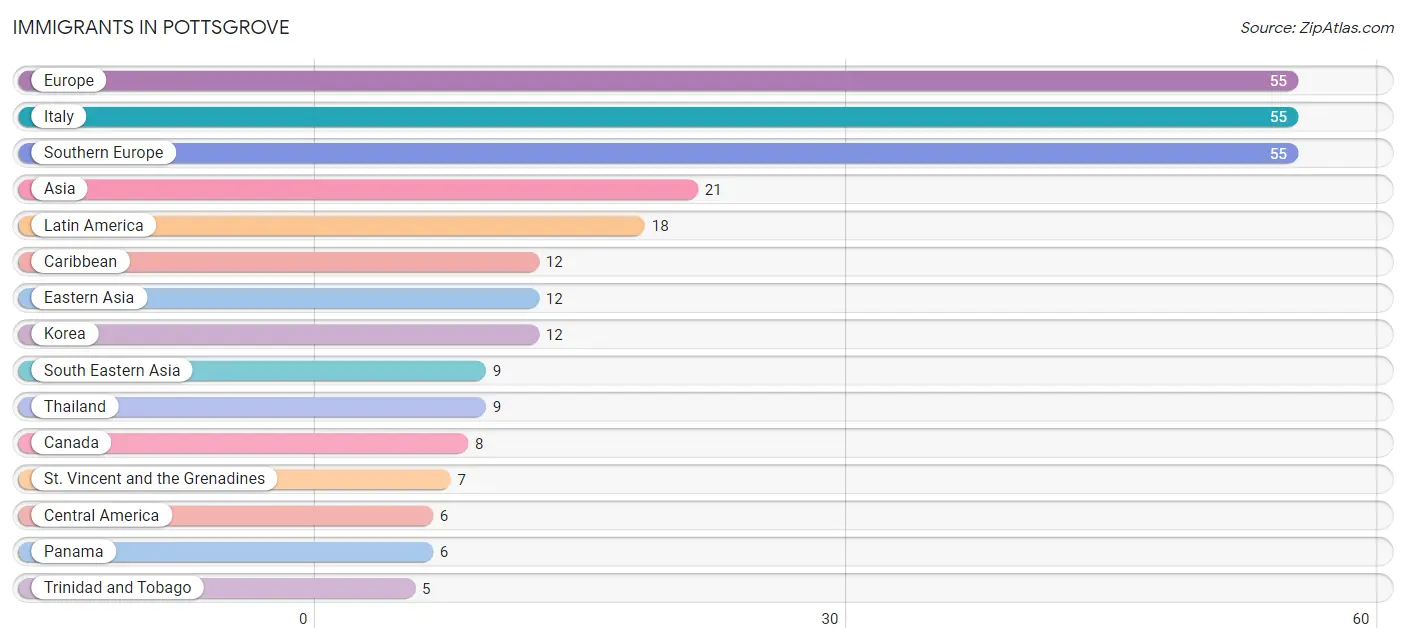
The most numerous immigrant groups reported in Pottsgrove came from Europe (55 | 1.6%), Italy (55 | 1.6%), Southern Europe (55 | 1.6%), Asia (21 | 0.6%), and Latin America (18 | 0.5%), together accounting for 6.0% of all Pottsgrove residents.
| Immigration Origin | # Population | % Population |
| Asia | 21 | 0.6% |
| Canada | 8 | 0.2% |
| Caribbean | 12 | 0.4% |
| Central America | 6 | 0.2% |
| Eastern Asia | 12 | 0.4% |
| Europe | 55 | 1.6% |
| Italy | 55 | 1.6% |
| Korea | 12 | 0.4% |
| Latin America | 18 | 0.5% |
| Panama | 6 | 0.2% |
| South Eastern Asia | 9 | 0.3% |
| Southern Europe | 55 | 1.6% |
| St. Vincent and the Grenadines | 7 | 0.2% |
| Thailand | 9 | 0.3% |
| Trinidad and Tobago | 5 | 0.2% | View All 15 Rows |
Sex and Age in Pottsgrove
Sex and Age in Pottsgrove
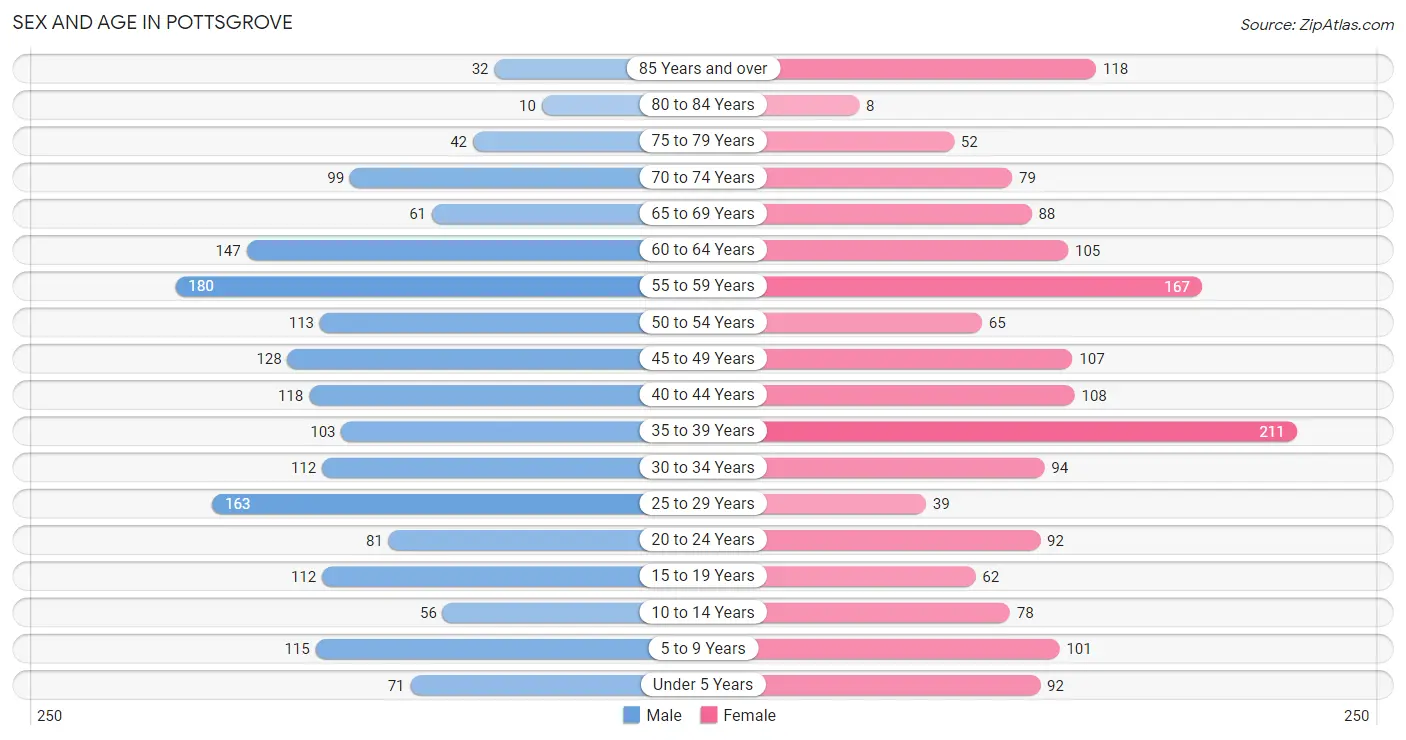
The most populous age groups in Pottsgrove are 55 to 59 Years (180 | 10.3%) for men and 35 to 39 Years (211 | 12.7%) for women.
| Age Bracket | Male | Female |
| Under 5 Years | 71 (4.1%) | 92 (5.5%) |
| 5 to 9 Years | 115 (6.6%) | 101 (6.1%) |
| 10 to 14 Years | 56 (3.2%) | 78 (4.7%) |
| 15 to 19 Years | 112 (6.4%) | 62 (3.7%) |
| 20 to 24 Years | 81 (4.6%) | 92 (5.5%) |
| 25 to 29 Years | 163 (9.3%) | 39 (2.3%) |
| 30 to 34 Years | 112 (6.4%) | 94 (5.6%) |
| 35 to 39 Years | 103 (5.9%) | 211 (12.7%) |
| 40 to 44 Years | 118 (6.8%) | 108 (6.5%) |
| 45 to 49 Years | 128 (7.3%) | 107 (6.4%) |
| 50 to 54 Years | 113 (6.5%) | 65 (3.9%) |
| 55 to 59 Years | 180 (10.3%) | 167 (10.0%) |
| 60 to 64 Years | 147 (8.4%) | 105 (6.3%) |
| 65 to 69 Years | 61 (3.5%) | 88 (5.3%) |
| 70 to 74 Years | 99 (5.7%) | 79 (4.7%) |
| 75 to 79 Years | 42 (2.4%) | 52 (3.1%) |
| 80 to 84 Years | 10 (0.6%) | 8 (0.5%) |
| 85 Years and over | 32 (1.8%) | 118 (7.1%) |
| Total | 1,743 (100.0%) | 1,666 (100.0%) |
Families and Households in Pottsgrove
Median Family Size in Pottsgrove
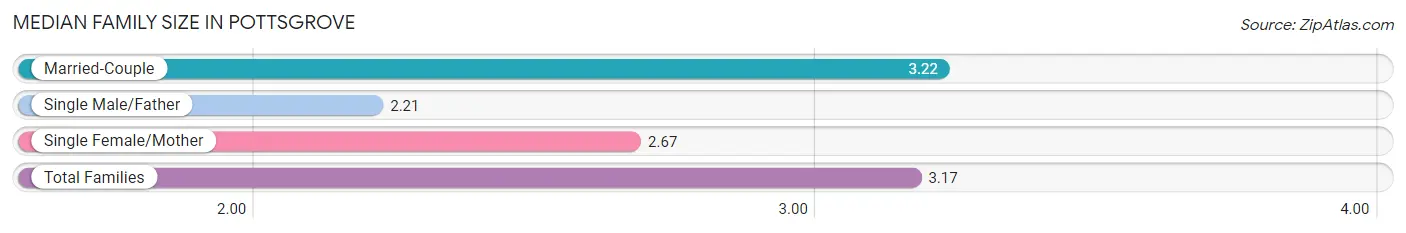
The median family size in Pottsgrove is 3.17 persons per family, with married-couple families (862 | 91.8%) accounting for the largest median family size of 3.22 persons per family. On the other hand, single male/father families (19 | 2.0%) represent the smallest median family size with 2.21 persons per family.
| Family Type | # Families | Family Size |
| Married-Couple | 862 (91.8%) | 3.22 |
| Single Male/Father | 19 (2.0%) | 2.21 |
| Single Female/Mother | 58 (6.2%) | 2.67 |
| Total Families | 939 (100.0%) | 3.17 |
Median Household Size in Pottsgrove
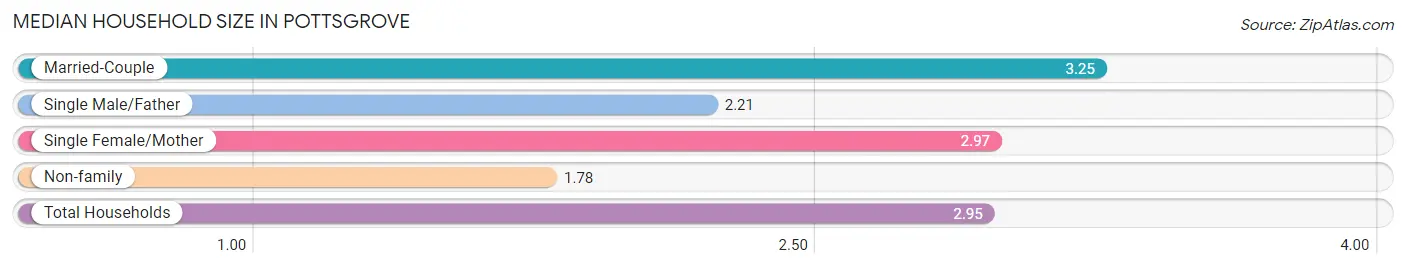
The median household size in Pottsgrove is 2.95 persons per household, with married-couple households (862 | 75.0%) accounting for the largest median household size of 3.25 persons per household. non-family households (211 | 18.3%) represent the smallest median household size with 1.78 persons per household.
| Household Type | # Households | Household Size |
| Married-Couple | 862 (75.0%) | 3.25 |
| Single Male/Father | 19 (1.7%) | 2.21 |
| Single Female/Mother | 58 (5.0%) | 2.97 |
| Non-family | 211 (18.3%) | 1.78 |
| Total Households | 1,150 (100.0%) | 2.95 |
Household Size by Marriage Status in Pottsgrove
Out of a total of 1,150 households in Pottsgrove, 939 (81.7%) are family households, while 211 (18.3%) are nonfamily households. The most numerous type of family households are 2-person households, comprising 389, and the most common type of nonfamily households are 1-person households, comprising 123.
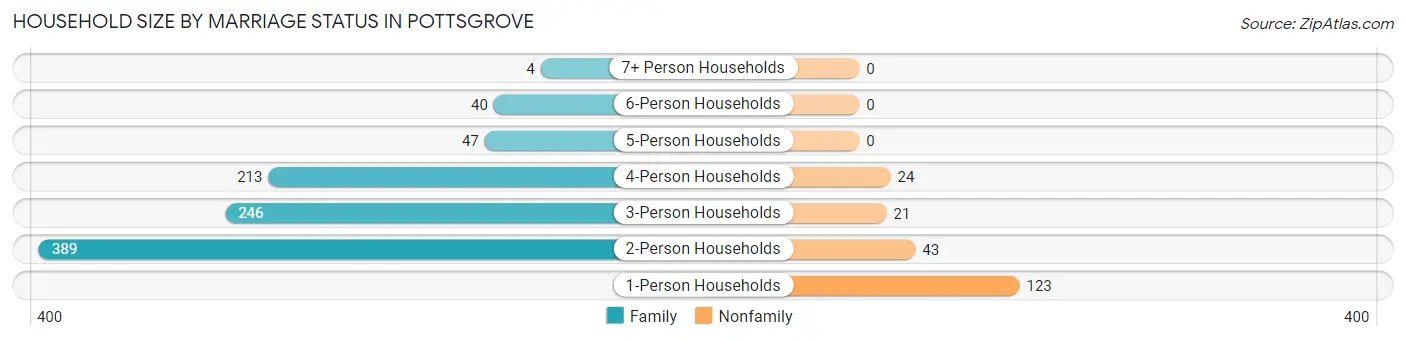
| Household Size | Family Households | Nonfamily Households |
| 1-Person Households | - | 123 (10.7%) |
| 2-Person Households | 389 (33.8%) | 43 (3.7%) |
| 3-Person Households | 246 (21.4%) | 21 (1.8%) |
| 4-Person Households | 213 (18.5%) | 24 (2.1%) |
| 5-Person Households | 47 (4.1%) | 0 (0.0%) |
| 6-Person Households | 40 (3.5%) | 0 (0.0%) |
| 7+ Person Households | 4 (0.4%) | 0 (0.0%) |
| Total | 939 (81.7%) | 211 (18.3%) |
Female Fertility in Pottsgrove
Fertility by Age in Pottsgrove
Average fertility rate in Pottsgrove is 48.0 births per 1,000 women. Women in the age bracket of 15 to 19 years have the highest fertility rate with 258.0 births per 1,000 women. Women in the age bracket of 15 to 19 years acount for 45.7% of all women with births.
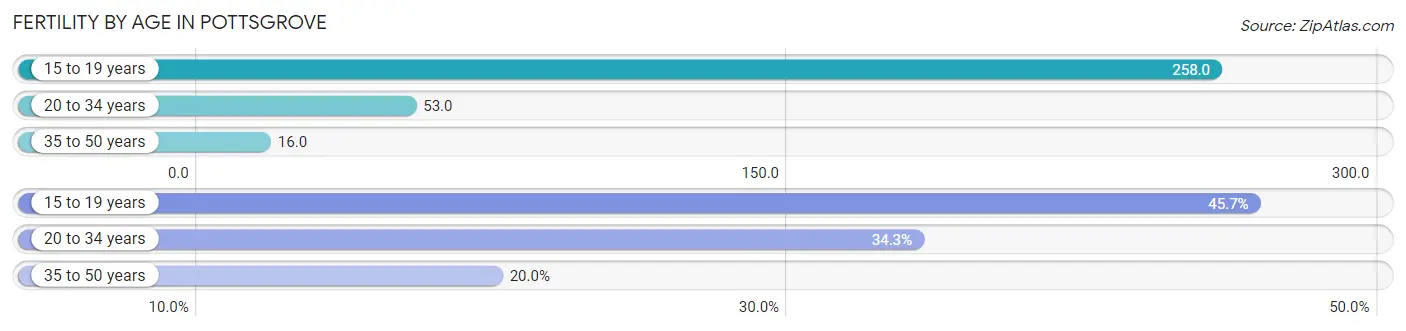
| Age Bracket | Women with Births | Births / 1,000 Women |
| 15 to 19 years | 16 (45.7%) | 258.0 |
| 20 to 34 years | 12 (34.3%) | 53.0 |
| 35 to 50 years | 7 (20.0%) | 16.0 |
| Total | 35 (100.0%) | 48.0 |
Fertility by Age by Marriage Status in Pottsgrove
54.3% of women with births (35) in Pottsgrove are married. The highest percentage of unmarried women with births falls into 15 to 19 years age bracket with 100.0% of them unmarried at the time of birth, while the lowest percentage of unmarried women with births belong to 20 to 34 years age bracket with 0.0% of them unmarried.
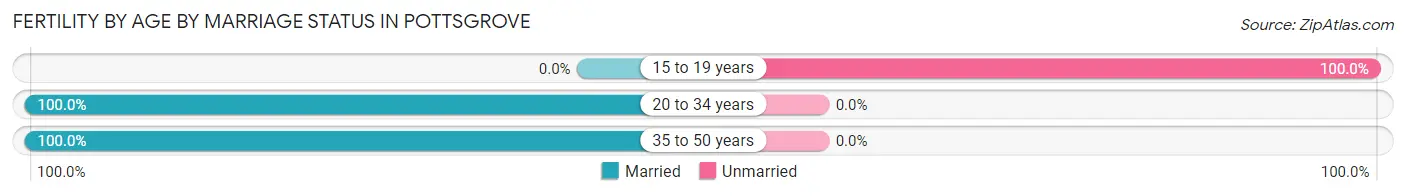
| Age Bracket | Married | Unmarried |
| 15 to 19 years | 0 (0.0%) | 16 (100.0%) |
| 20 to 34 years | 12 (100.0%) | 0 (0.0%) |
| 35 to 50 years | 7 (100.0%) | 0 (0.0%) |
| Total | 19 (54.3%) | 16 (45.7%) |
Fertility by Education in Pottsgrove
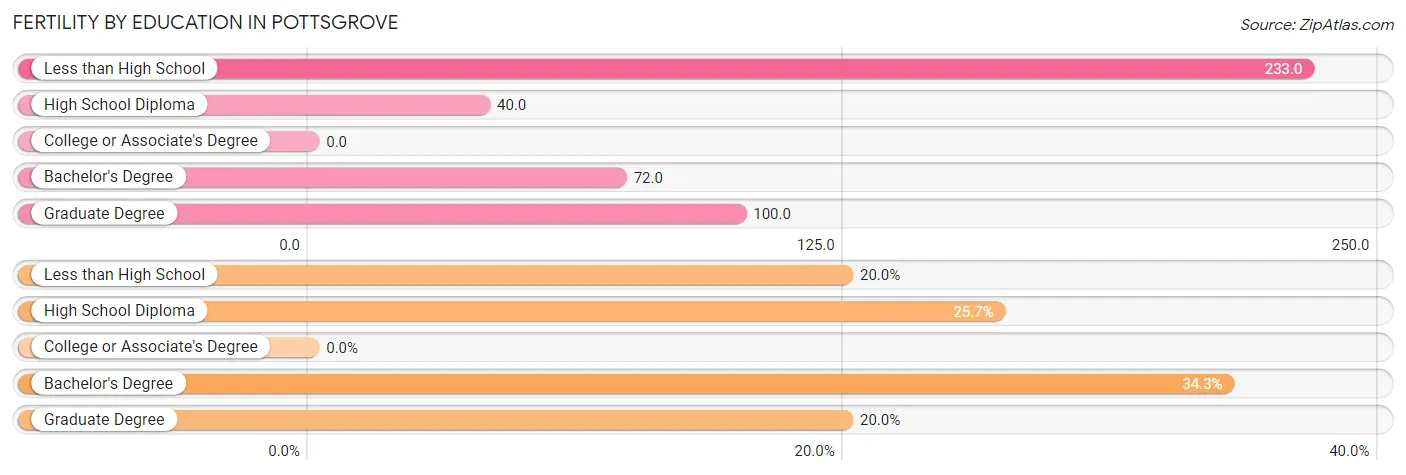
| Educational Attainment | Women with Births | Births / 1,000 Women |
| Less than High School | 7 (20.0%) | 233.0 |
| High School Diploma | 9 (25.7%) | 40.0 |
| College or Associate's Degree | 0 (0.0%) | 0.0 |
| Bachelor's Degree | 12 (34.3%) | 72.0 |
| Graduate Degree | 7 (20.0%) | 100.0 |
| Total | 35 (100.0%) | 48.0 |
Fertility by Education by Marriage Status in Pottsgrove
45.7% of women with births in Pottsgrove are unmarried. Women with the educational attainment of bachelor's degree are most likely to be married with 100.0% of them married at childbirth, while women with the educational attainment of less than high school are least likely to be married with 100.0% of them unmarried at childbirth.
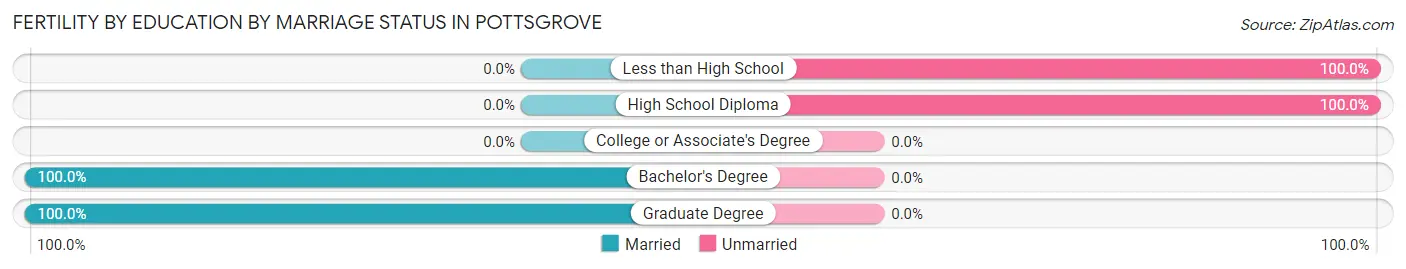
| Educational Attainment | Married | Unmarried |
| Less than High School | 0 (0.0%) | 7 (100.0%) |
| High School Diploma | 0 (0.0%) | 9 (100.0%) |
| College or Associate's Degree | 0 (0.0%) | 0 (0.0%) |
| Bachelor's Degree | 12 (100.0%) | 0 (0.0%) |
| Graduate Degree | 7 (100.0%) | 0 (0.0%) |
| Total | 19 (54.3%) | 16 (45.7%) |
Employment Characteristics in Pottsgrove
Employment by Class of Employer in Pottsgrove
Among the 2,024 employed individuals in Pottsgrove, private company employees (1,547 | 76.4%), not-for-profit organizations (233 | 11.5%), and local government employees (81 | 4.0%) make up the most common classes of employment.
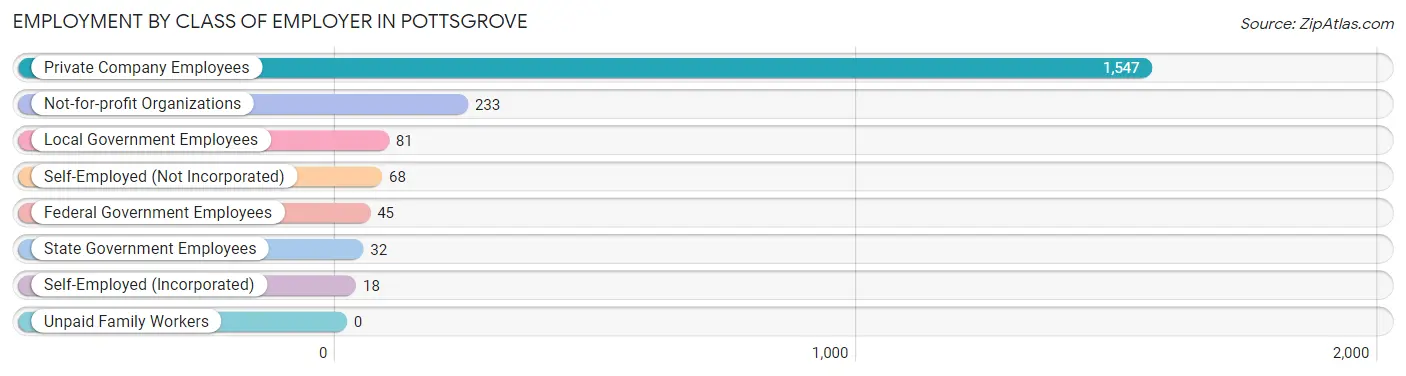
| Employer Class | # Employees | % Employees |
| Private Company Employees | 1,547 | 76.4% |
| Self-Employed (Incorporated) | 18 | 0.9% |
| Self-Employed (Not Incorporated) | 68 | 3.4% |
| Not-for-profit Organizations | 233 | 11.5% |
| Local Government Employees | 81 | 4.0% |
| State Government Employees | 32 | 1.6% |
| Federal Government Employees | 45 | 2.2% |
| Unpaid Family Workers | 0 | 0.0% |
| Total | 2,024 | 100.0% |
Employment Status by Age in Pottsgrove
According to the labor force statistics for Pottsgrove, out of the total population over 16 years of age (2,869), 73.2% or 2,100 individuals are in the labor force, with 3.2% or 67 of them unemployed. The age group with the highest labor force participation rate is 25 to 29 years, with 97.5% or 197 individuals in the labor force. Within the labor force, the 16 to 19 years age range has the highest percentage of unemployed individuals, with 13.8% or 11 of them being unemployed.
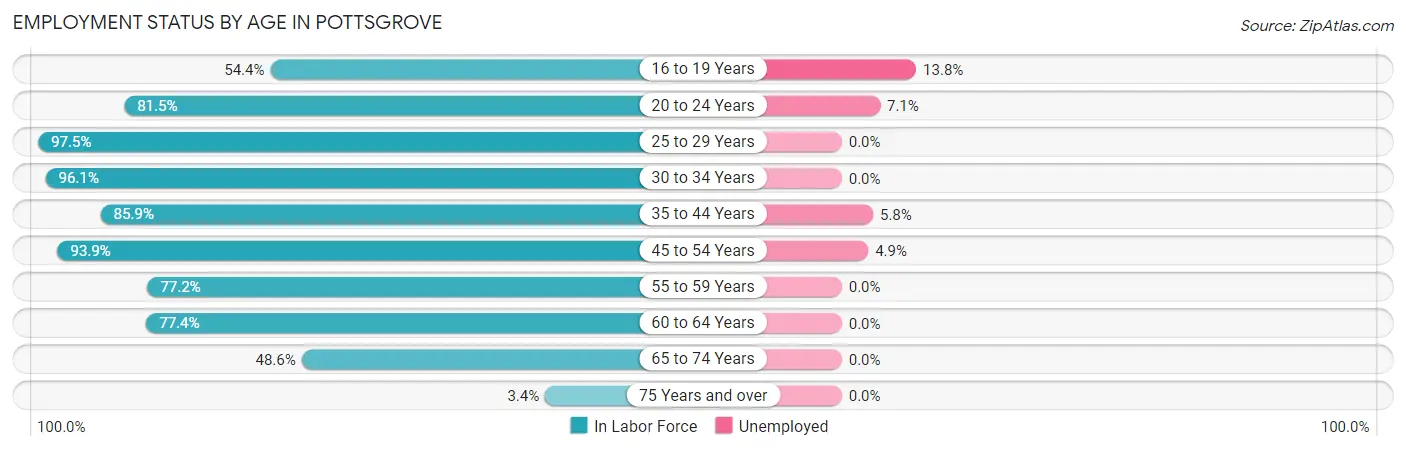
| Age Bracket | In Labor Force | Unemployed |
| 16 to 19 Years | 80 (54.4%) | 11 (13.8%) |
| 20 to 24 Years | 141 (81.5%) | 10 (7.1%) |
| 25 to 29 Years | 197 (97.5%) | 0 (0.0%) |
| 30 to 34 Years | 198 (96.1%) | 0 (0.0%) |
| 35 to 44 Years | 464 (85.9%) | 27 (5.8%) |
| 45 to 54 Years | 388 (93.9%) | 19 (4.9%) |
| 55 to 59 Years | 268 (77.2%) | 0 (0.0%) |
| 60 to 64 Years | 195 (77.4%) | 0 (0.0%) |
| 65 to 74 Years | 159 (48.6%) | 0 (0.0%) |
| 75 Years and over | 9 (3.4%) | 0 (0.0%) |
| Total | 2,100 (73.2%) | 67 (3.2%) |
Employment Status by Educational Attainment in Pottsgrove
According to labor force statistics for Pottsgrove, 87.2% of individuals (1,709) out of the total population between 25 and 64 years of age (1,960) are in the labor force, with 2.7% or 46 of them being unemployed. The group with the highest labor force participation rate are those with the educational attainment of bachelor's degree or higher, with 96.8% or 550 individuals in the labor force. Within the labor force, individuals with bachelor's degree or higher education have the highest percentage of unemployment, with 3.5% or 19 of them being unemployed.
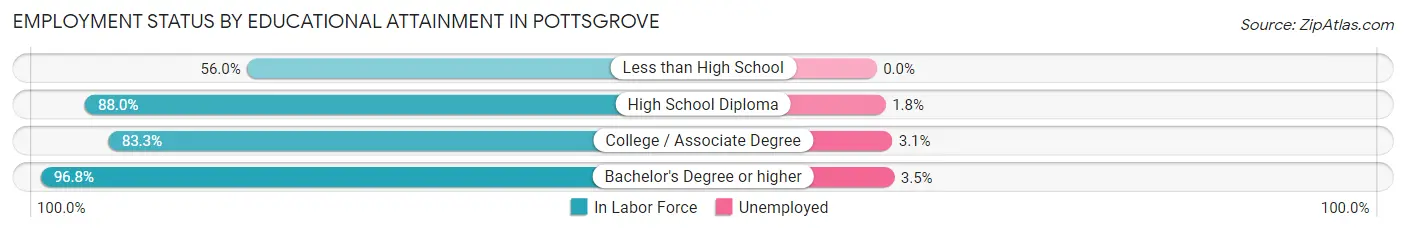
| Educational Attainment | In Labor Force | Unemployed |
| Less than High School | 61 (56.0%) | 0 (0.0%) |
| High School Diploma | 559 (88.0%) | 11 (1.8%) |
| College / Associate Degree | 540 (83.3%) | 20 (3.1%) |
| Bachelor's Degree or higher | 550 (96.8%) | 20 (3.5%) |
| Total | 1,709 (87.2%) | 53 (2.7%) |
Employment Occupations by Sex in Pottsgrove
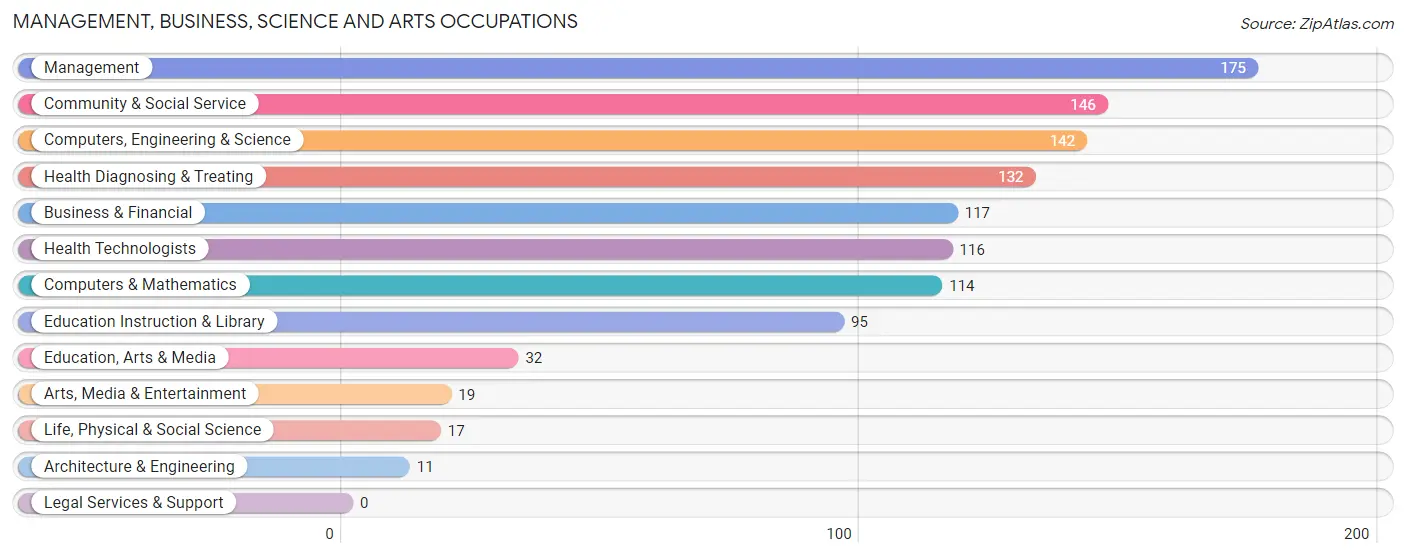
Management, Business, Science and Arts Occupations
The most common Management, Business, Science and Arts occupations in Pottsgrove are Management (175 | 8.6%), Community & Social Service (146 | 7.2%), Computers, Engineering & Science (142 | 7.0%), Health Diagnosing & Treating (132 | 6.5%), and Business & Financial (117 | 5.8%).
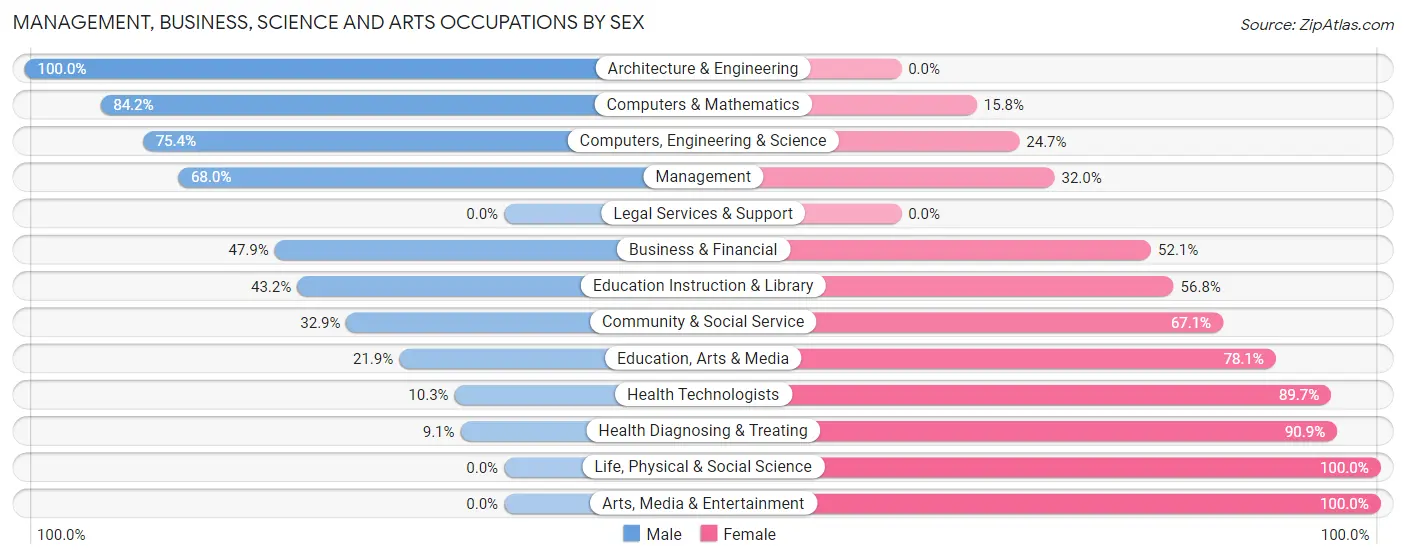
Management, Business, Science and Arts Occupations by Sex
Within the Management, Business, Science and Arts occupations in Pottsgrove, the most male-oriented occupations are Architecture & Engineering (100.0%), Computers & Mathematics (84.2%), and Computers, Engineering & Science (75.3%), while the most female-oriented occupations are Life, Physical & Social Science (100.0%), Arts, Media & Entertainment (100.0%), and Health Diagnosing & Treating (90.9%).
| Occupation | Male | Female |
| Management | 119 (68.0%) | 56 (32.0%) |
| Business & Financial | 56 (47.9%) | 61 (52.1%) |
| Computers, Engineering & Science | 107 (75.3%) | 35 (24.6%) |
| Computers & Mathematics | 96 (84.2%) | 18 (15.8%) |
| Architecture & Engineering | 11 (100.0%) | 0 (0.0%) |
| Life, Physical & Social Science | 0 (0.0%) | 17 (100.0%) |
| Community & Social Service | 48 (32.9%) | 98 (67.1%) |
| Education, Arts & Media | 7 (21.9%) | 25 (78.1%) |
| Legal Services & Support | 0 (0.0%) | 0 (0.0%) |
| Education Instruction & Library | 41 (43.2%) | 54 (56.8%) |
| Arts, Media & Entertainment | 0 (0.0%) | 19 (100.0%) |
| Health Diagnosing & Treating | 12 (9.1%) | 120 (90.9%) |
| Health Technologists | 12 (10.3%) | 104 (89.7%) |
| Total (Category) | 342 (48.0%) | 370 (52.0%) |
| Total (Overall) | 1,105 (54.4%) | 927 (45.6%) |
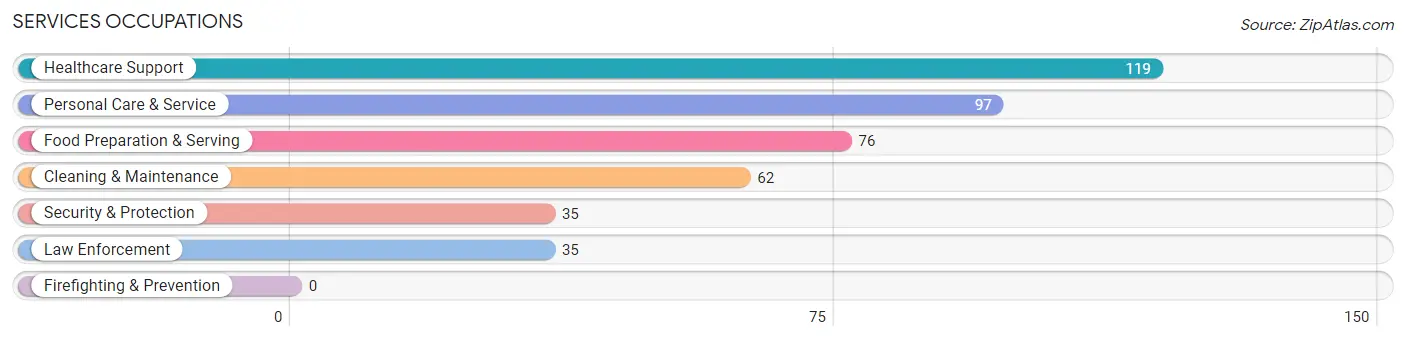
Services Occupations
The most common Services occupations in Pottsgrove are Healthcare Support (119 | 5.9%), Personal Care & Service (97 | 4.8%), Food Preparation & Serving (76 | 3.7%), Cleaning & Maintenance (62 | 3.0%), and Security & Protection (35 | 1.7%).
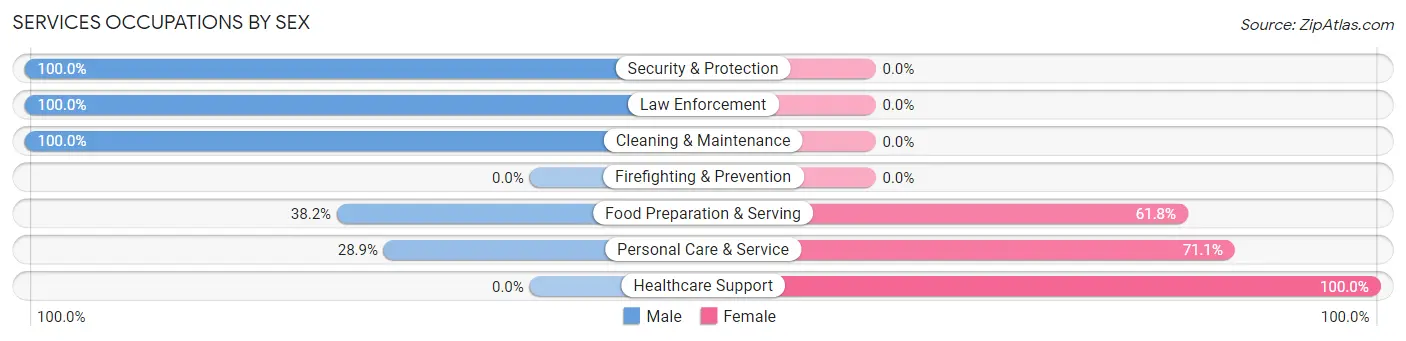
Services Occupations by Sex
Within the Services occupations in Pottsgrove, the most male-oriented occupations are Security & Protection (100.0%), Law Enforcement (100.0%), and Cleaning & Maintenance (100.0%), while the most female-oriented occupations are Healthcare Support (100.0%), Personal Care & Service (71.1%), and Food Preparation & Serving (61.8%).
| Occupation | Male | Female |
| Healthcare Support | 0 (0.0%) | 119 (100.0%) |
| Security & Protection | 35 (100.0%) | 0 (0.0%) |
| Firefighting & Prevention | 0 (0.0%) | 0 (0.0%) |
| Law Enforcement | 35 (100.0%) | 0 (0.0%) |
| Food Preparation & Serving | 29 (38.2%) | 47 (61.8%) |
| Cleaning & Maintenance | 62 (100.0%) | 0 (0.0%) |
| Personal Care & Service | 28 (28.9%) | 69 (71.1%) |
| Total (Category) | 154 (39.6%) | 235 (60.4%) |
| Total (Overall) | 1,105 (54.4%) | 927 (45.6%) |
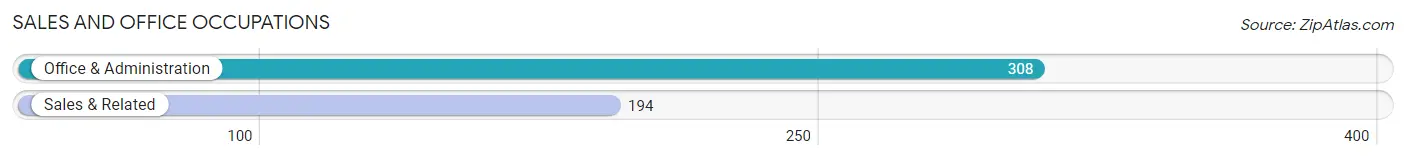
Sales and Office Occupations
The most common Sales and Office occupations in Pottsgrove are Office & Administration (308 | 15.2%), and Sales & Related (194 | 9.6%).
Sales and Office Occupations by Sex
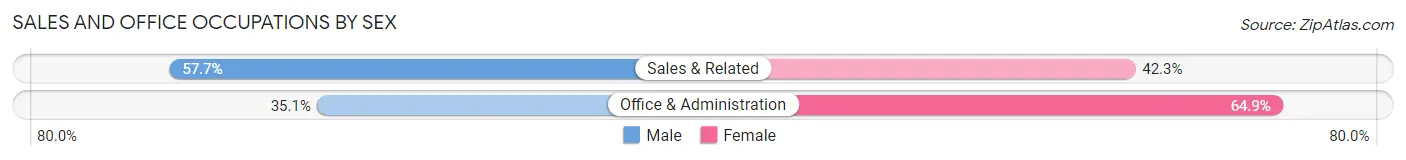
| Occupation | Male | Female |
| Sales & Related | 112 (57.7%) | 82 (42.3%) |
| Office & Administration | 108 (35.1%) | 200 (64.9%) |
| Total (Category) | 220 (43.8%) | 282 (56.2%) |
| Total (Overall) | 1,105 (54.4%) | 927 (45.6%) |
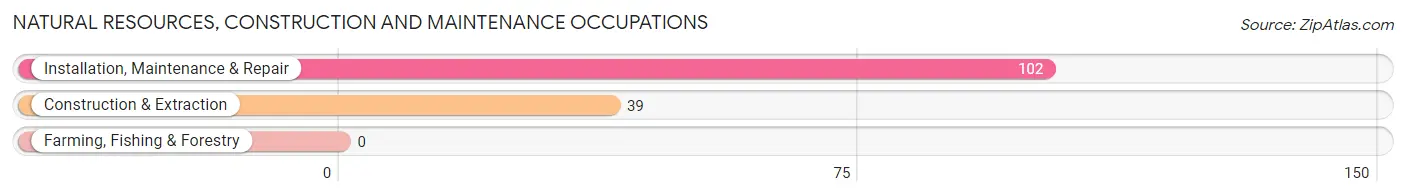
Natural Resources, Construction and Maintenance Occupations
The most common Natural Resources, Construction and Maintenance occupations in Pottsgrove are Installation, Maintenance & Repair (102 | 5.0%), and Construction & Extraction (39 | 1.9%).
Natural Resources, Construction and Maintenance Occupations by Sex
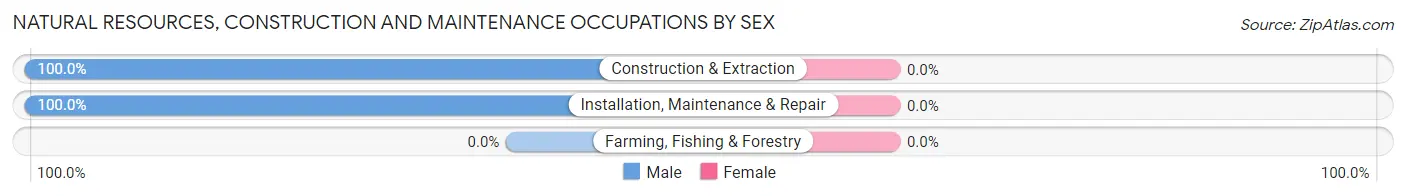
| Occupation | Male | Female |
| Farming, Fishing & Forestry | 0 (0.0%) | 0 (0.0%) |
| Construction & Extraction | 39 (100.0%) | 0 (0.0%) |
| Installation, Maintenance & Repair | 102 (100.0%) | 0 (0.0%) |
| Total (Category) | 141 (100.0%) | 0 (0.0%) |
| Total (Overall) | 1,105 (54.4%) | 927 (45.6%) |
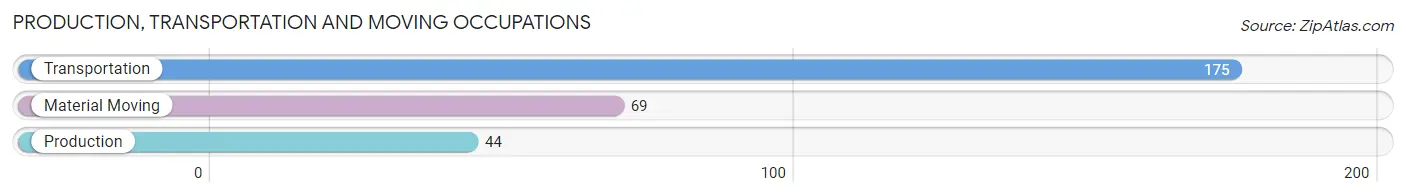
Production, Transportation and Moving Occupations
The most common Production, Transportation and Moving occupations in Pottsgrove are Transportation (175 | 8.6%), Material Moving (69 | 3.4%), and Production (44 | 2.2%).
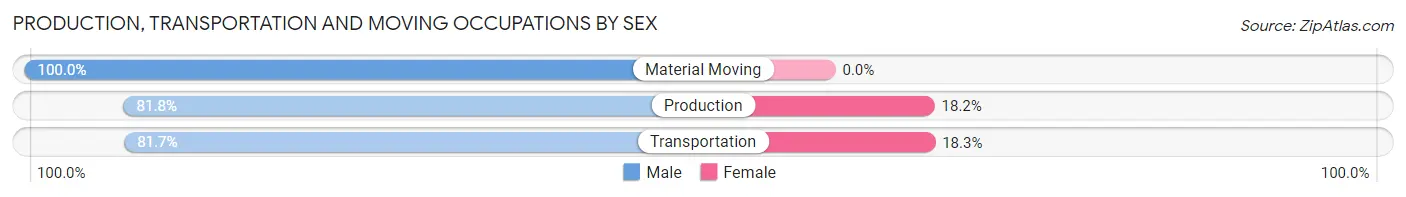
Production, Transportation and Moving Occupations by Sex
| Occupation | Male | Female |
| Production | 36 (81.8%) | 8 (18.2%) |
| Transportation | 143 (81.7%) | 32 (18.3%) |
| Material Moving | 69 (100.0%) | 0 (0.0%) |
| Total (Category) | 248 (86.1%) | 40 (13.9%) |
| Total (Overall) | 1,105 (54.4%) | 927 (45.6%) |
Employment Industries by Sex in Pottsgrove
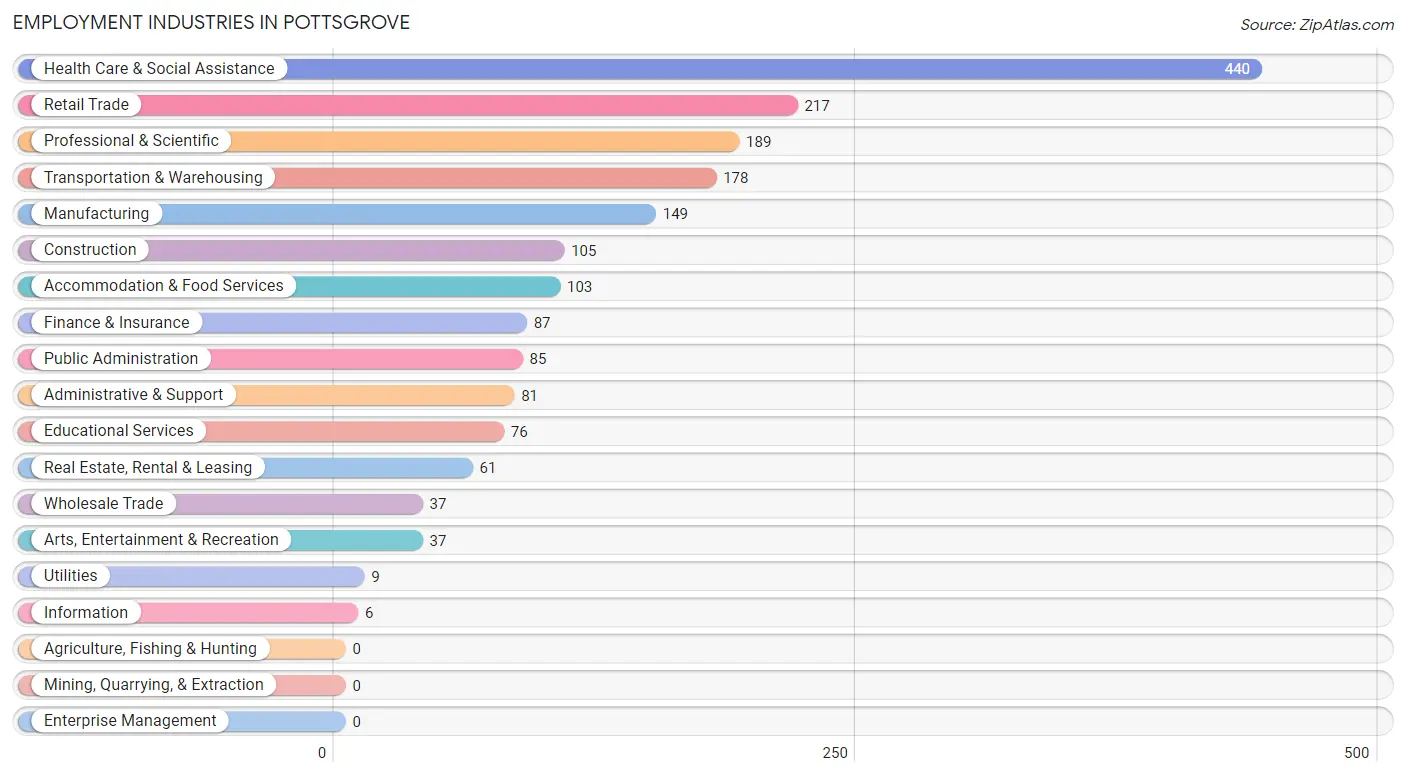
Employment Industries in Pottsgrove
The major employment industries in Pottsgrove include Health Care & Social Assistance (440 | 21.6%), Retail Trade (217 | 10.7%), Professional & Scientific (189 | 9.3%), Transportation & Warehousing (178 | 8.8%), and Manufacturing (149 | 7.3%).
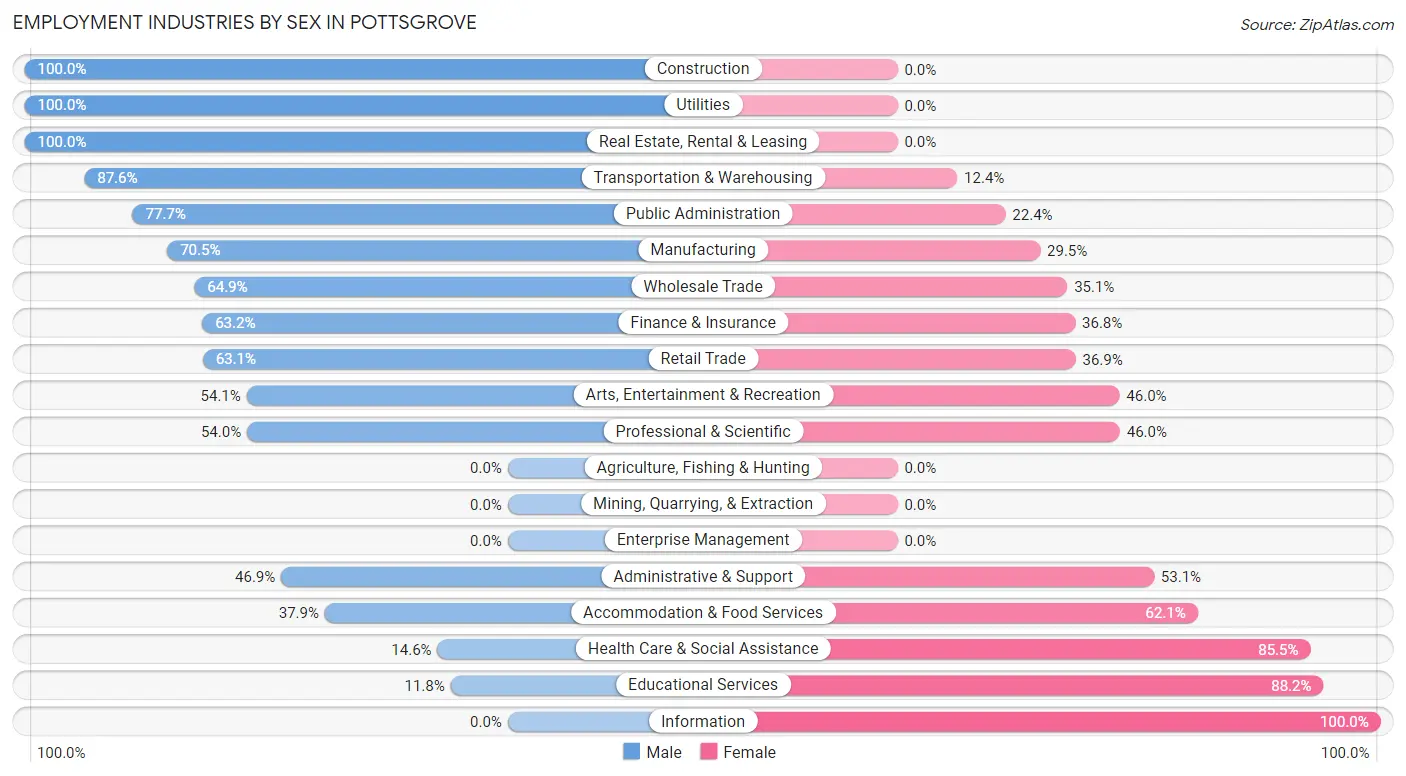
Employment Industries by Sex in Pottsgrove
The Pottsgrove industries that see more men than women are Construction (100.0%), Utilities (100.0%), and Real Estate, Rental & Leasing (100.0%), whereas the industries that tend to have a higher number of women are Information (100.0%), Educational Services (88.2%), and Health Care & Social Assistance (85.5%).
| Industry | Male | Female |
| Agriculture, Fishing & Hunting | 0 (0.0%) | 0 (0.0%) |
| Mining, Quarrying, & Extraction | 0 (0.0%) | 0 (0.0%) |
| Construction | 105 (100.0%) | 0 (0.0%) |
| Manufacturing | 105 (70.5%) | 44 (29.5%) |
| Wholesale Trade | 24 (64.9%) | 13 (35.1%) |
| Retail Trade | 137 (63.1%) | 80 (36.9%) |
| Transportation & Warehousing | 156 (87.6%) | 22 (12.4%) |
| Utilities | 9 (100.0%) | 0 (0.0%) |
| Information | 0 (0.0%) | 6 (100.0%) |
| Finance & Insurance | 55 (63.2%) | 32 (36.8%) |
| Real Estate, Rental & Leasing | 61 (100.0%) | 0 (0.0%) |
| Professional & Scientific | 102 (54.0%) | 87 (46.0%) |
| Enterprise Management | 0 (0.0%) | 0 (0.0%) |
| Administrative & Support | 38 (46.9%) | 43 (53.1%) |
| Educational Services | 9 (11.8%) | 67 (88.2%) |
| Health Care & Social Assistance | 64 (14.5%) | 376 (85.5%) |
| Arts, Entertainment & Recreation | 20 (54.0%) | 17 (46.0%) |
| Accommodation & Food Services | 39 (37.9%) | 64 (62.1%) |
| Public Administration | 66 (77.6%) | 19 (22.4%) |
| Total | 1,105 (54.4%) | 927 (45.6%) |
Education in Pottsgrove
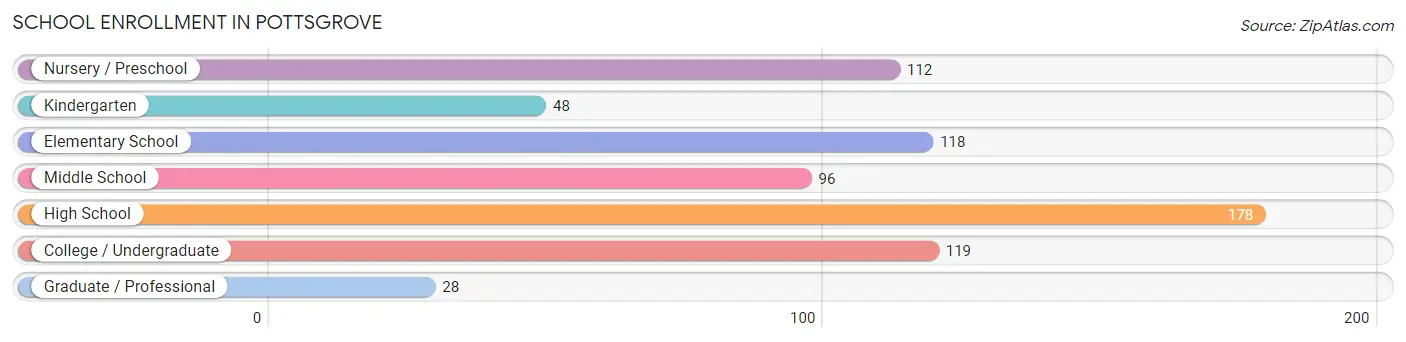
School Enrollment in Pottsgrove
The most common levels of schooling among the 699 students in Pottsgrove are high school (178 | 25.5%), college / undergraduate (119 | 17.0%), and elementary school (118 | 16.9%).
| School Level | # Students | % Students |
| Nursery / Preschool | 112 | 16.0% |
| Kindergarten | 48 | 6.9% |
| Elementary School | 118 | 16.9% |
| Middle School | 96 | 13.7% |
| High School | 178 | 25.5% |
| College / Undergraduate | 119 | 17.0% |
| Graduate / Professional | 28 | 4.0% |
| Total | 699 | 100.0% |
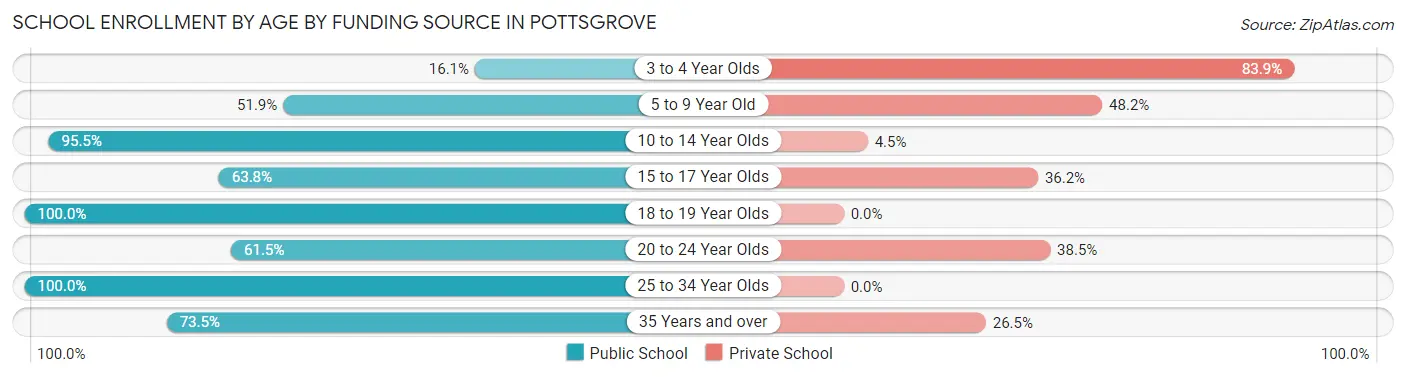
School Enrollment by Age by Funding Source in Pottsgrove
Out of a total of 699 students who are enrolled in schools in Pottsgrove, 238 (34.0%) attend a private institution, while the remaining 461 (66.0%) are enrolled in public schools. The age group of 3 to 4 year olds has the highest likelihood of being enrolled in private schools, with 52 (83.9% in the age bracket) enrolled. Conversely, the age group of 18 to 19 year olds has the lowest likelihood of being enrolled in a private school, with 40 (100.0% in the age bracket) attending a public institution.
| Age Bracket | Public School | Private School |
| 3 to 4 Year Olds | 10 (16.1%) | 52 (83.9%) |
| 5 to 9 Year Old | 112 (51.8%) | 104 (48.1%) |
| 10 to 14 Year Olds | 128 (95.5%) | 6 (4.5%) |
| 15 to 17 Year Olds | 67 (63.8%) | 38 (36.2%) |
| 18 to 19 Year Olds | 40 (100.0%) | 0 (0.0%) |
| 20 to 24 Year Olds | 32 (61.5%) | 20 (38.5%) |
| 25 to 34 Year Olds | 22 (100.0%) | 0 (0.0%) |
| 35 Years and over | 50 (73.5%) | 18 (26.5%) |
| Total | 461 (66.0%) | 238 (34.0%) |
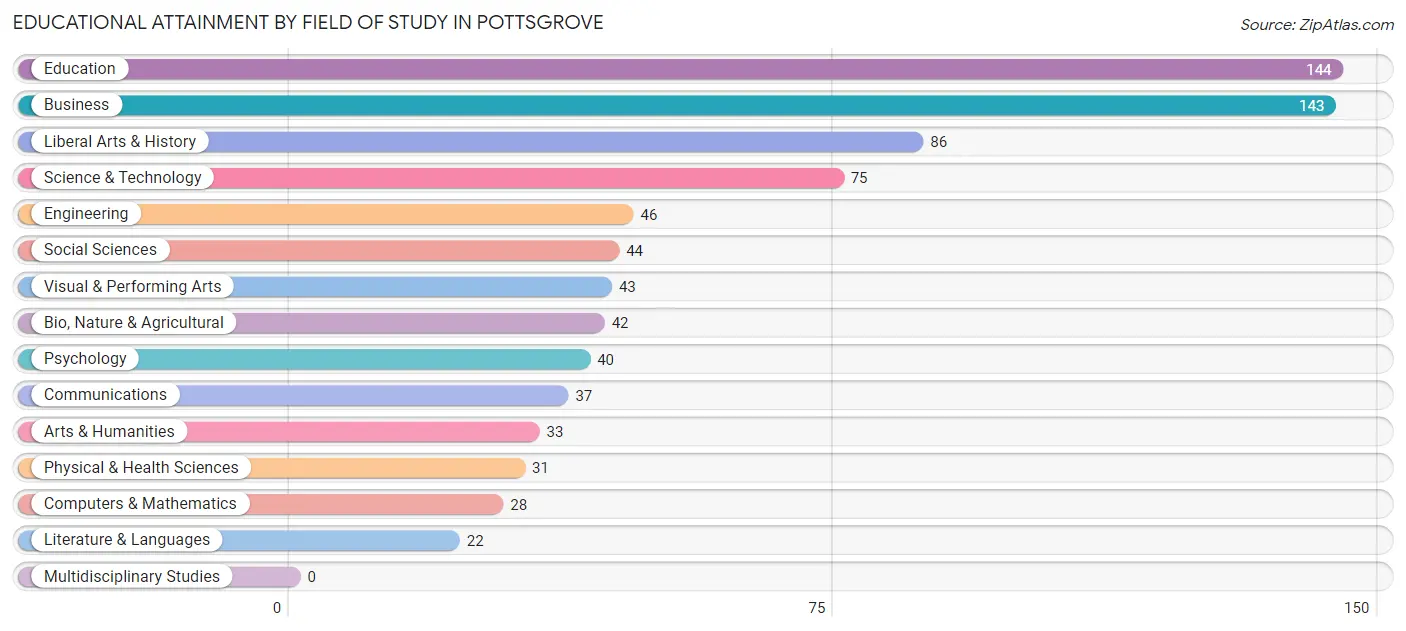
Educational Attainment by Field of Study in Pottsgrove
Education (144 | 17.7%), business (143 | 17.6%), liberal arts & history (86 | 10.6%), science & technology (75 | 9.2%), and engineering (46 | 5.7%) are the most common fields of study among 814 individuals in Pottsgrove who have obtained a bachelor's degree or higher.
| Field of Study | # Graduates | % Graduates |
| Computers & Mathematics | 28 | 3.4% |
| Bio, Nature & Agricultural | 42 | 5.2% |
| Physical & Health Sciences | 31 | 3.8% |
| Psychology | 40 | 4.9% |
| Social Sciences | 44 | 5.4% |
| Engineering | 46 | 5.7% |
| Multidisciplinary Studies | 0 | 0.0% |
| Science & Technology | 75 | 9.2% |
| Business | 143 | 17.6% |
| Education | 144 | 17.7% |
| Literature & Languages | 22 | 2.7% |
| Liberal Arts & History | 86 | 10.6% |
| Visual & Performing Arts | 43 | 5.3% |
| Communications | 37 | 4.5% |
| Arts & Humanities | 33 | 4.1% |
| Total | 814 | 100.0% |
Transportation & Commute in Pottsgrove
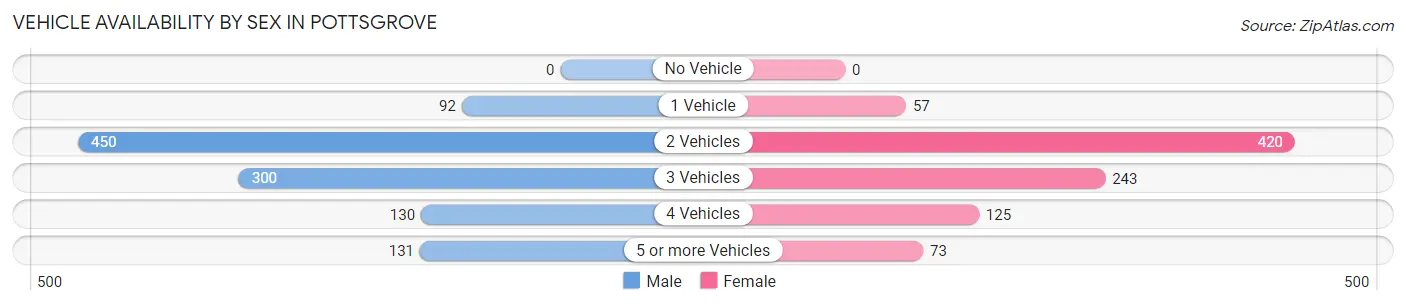
Vehicle Availability by Sex in Pottsgrove
The most prevalent vehicle ownership categories in Pottsgrove are males with 2 vehicles (450, accounting for 40.8%) and females with 2 vehicles (420, making up 49.0%).
| Vehicles Available | Male | Female |
| No Vehicle | 0 (0.0%) | 0 (0.0%) |
| 1 Vehicle | 92 (8.3%) | 57 (6.2%) |
| 2 Vehicles | 450 (40.8%) | 420 (45.8%) |
| 3 Vehicles | 300 (27.2%) | 243 (26.5%) |
| 4 Vehicles | 130 (11.8%) | 125 (13.6%) |
| 5 or more Vehicles | 131 (11.9%) | 73 (8.0%) |
| Total | 1,103 (100.0%) | 918 (100.0%) |
Commute Time in Pottsgrove
The most frequently occuring commute durations in Pottsgrove are 30 to 34 minutes (302 commuters, 16.9%), 45 to 59 minutes (273 commuters, 15.3%), and 10 to 14 minutes (242 commuters, 13.5%).
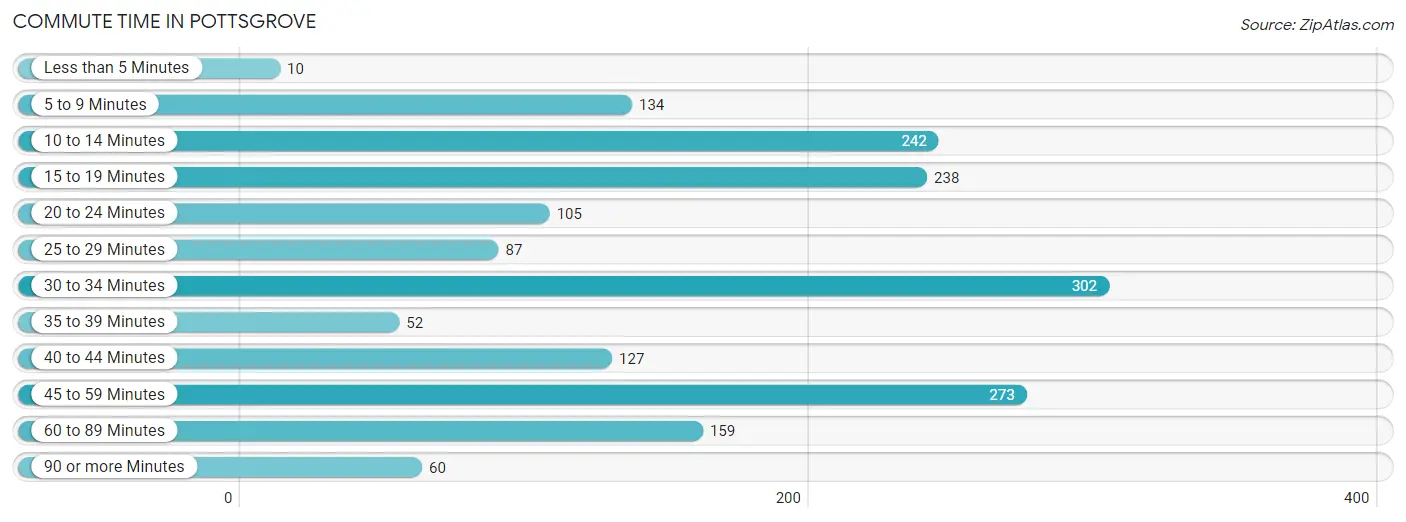
| Commute Time | # Commuters | % Commuters |
| Less than 5 Minutes | 10 | 0.6% |
| 5 to 9 Minutes | 134 | 7.5% |
| 10 to 14 Minutes | 242 | 13.5% |
| 15 to 19 Minutes | 238 | 13.3% |
| 20 to 24 Minutes | 105 | 5.9% |
| 25 to 29 Minutes | 87 | 4.9% |
| 30 to 34 Minutes | 302 | 16.9% |
| 35 to 39 Minutes | 52 | 2.9% |
| 40 to 44 Minutes | 127 | 7.1% |
| 45 to 59 Minutes | 273 | 15.3% |
| 60 to 89 Minutes | 159 | 8.9% |
| 90 or more Minutes | 60 | 3.4% |
Commute Time by Sex in Pottsgrove
The most common commute times in Pottsgrove are 30 to 34 minutes (161 commuters, 16.6%) for males and 30 to 34 minutes (141 commuters, 17.2%) for females.
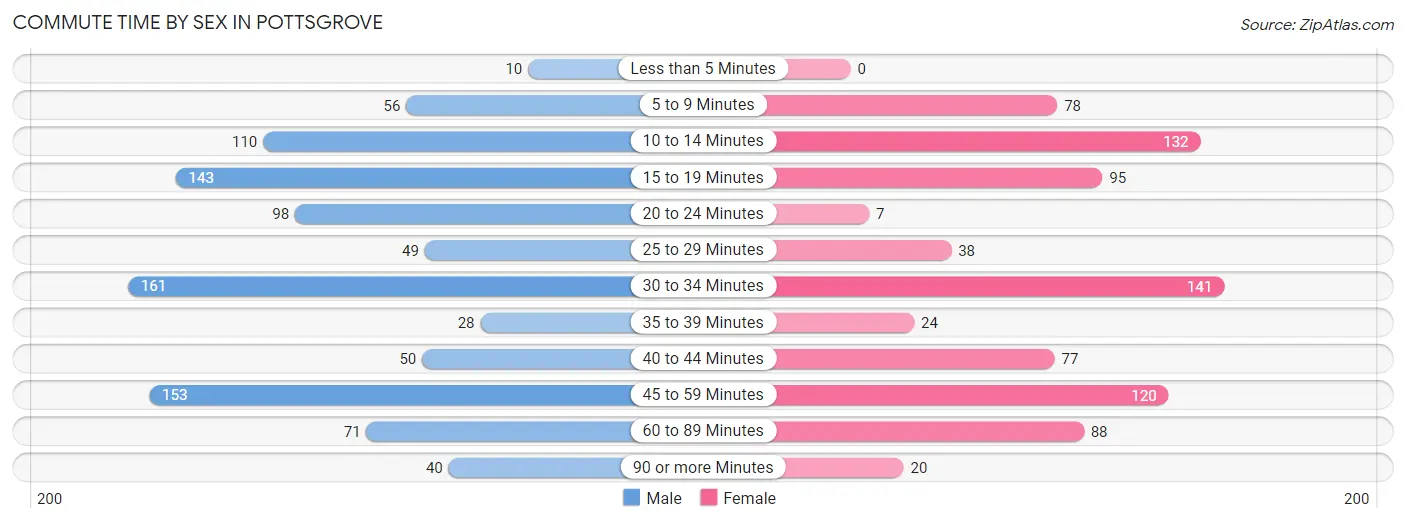
| Commute Time | Male | Female |
| Less than 5 Minutes | 10 (1.0%) | 0 (0.0%) |
| 5 to 9 Minutes | 56 (5.8%) | 78 (9.5%) |
| 10 to 14 Minutes | 110 (11.4%) | 132 (16.1%) |
| 15 to 19 Minutes | 143 (14.8%) | 95 (11.6%) |
| 20 to 24 Minutes | 98 (10.1%) | 7 (0.9%) |
| 25 to 29 Minutes | 49 (5.1%) | 38 (4.6%) |
| 30 to 34 Minutes | 161 (16.6%) | 141 (17.2%) |
| 35 to 39 Minutes | 28 (2.9%) | 24 (2.9%) |
| 40 to 44 Minutes | 50 (5.2%) | 77 (9.4%) |
| 45 to 59 Minutes | 153 (15.8%) | 120 (14.6%) |
| 60 to 89 Minutes | 71 (7.3%) | 88 (10.7%) |
| 90 or more Minutes | 40 (4.1%) | 20 (2.4%) |
Time of Departure to Work by Sex in Pottsgrove
The most frequent times of departure to work in Pottsgrove are 7:00 AM to 7:29 AM (176, 18.2%) for males and 7:00 AM to 7:29 AM (164, 20.0%) for females.
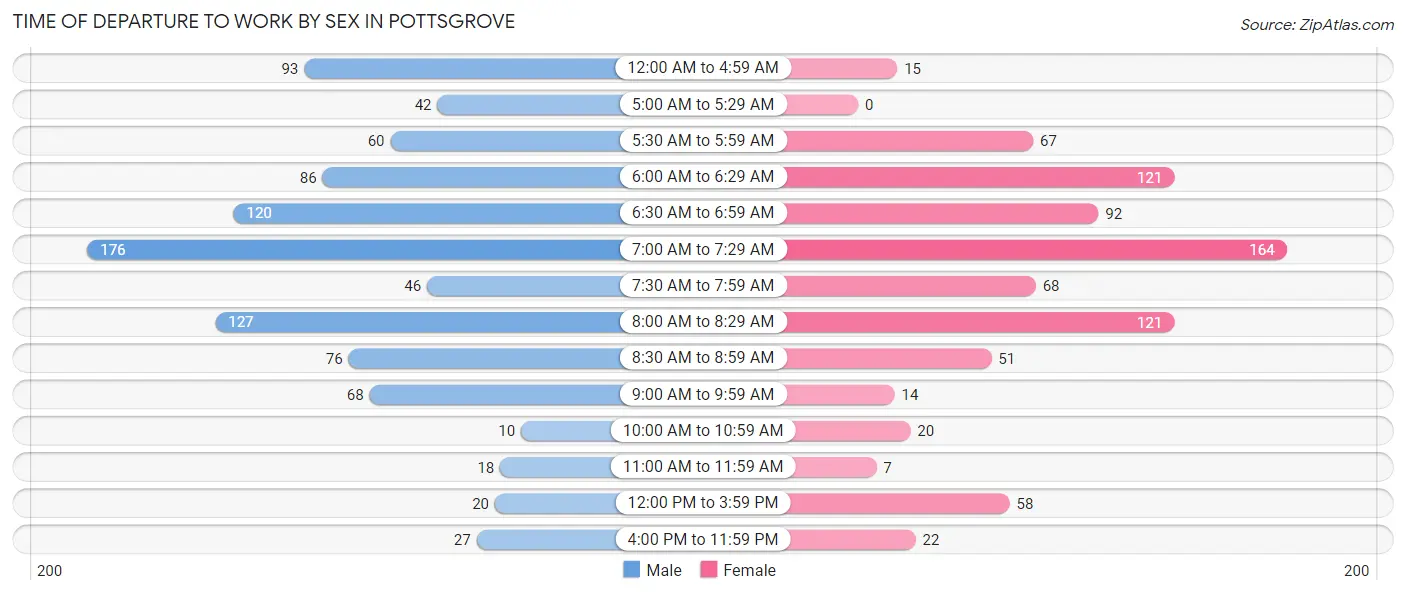
| Time of Departure | Male | Female |
| 12:00 AM to 4:59 AM | 93 (9.6%) | 15 (1.8%) |
| 5:00 AM to 5:29 AM | 42 (4.3%) | 0 (0.0%) |
| 5:30 AM to 5:59 AM | 60 (6.2%) | 67 (8.2%) |
| 6:00 AM to 6:29 AM | 86 (8.9%) | 121 (14.8%) |
| 6:30 AM to 6:59 AM | 120 (12.4%) | 92 (11.2%) |
| 7:00 AM to 7:29 AM | 176 (18.2%) | 164 (20.0%) |
| 7:30 AM to 7:59 AM | 46 (4.8%) | 68 (8.3%) |
| 8:00 AM to 8:29 AM | 127 (13.1%) | 121 (14.8%) |
| 8:30 AM to 8:59 AM | 76 (7.8%) | 51 (6.2%) |
| 9:00 AM to 9:59 AM | 68 (7.0%) | 14 (1.7%) |
| 10:00 AM to 10:59 AM | 10 (1.0%) | 20 (2.4%) |
| 11:00 AM to 11:59 AM | 18 (1.9%) | 7 (0.9%) |
| 12:00 PM to 3:59 PM | 20 (2.1%) | 58 (7.1%) |
| 4:00 PM to 11:59 PM | 27 (2.8%) | 22 (2.7%) |
| Total | 969 (100.0%) | 820 (100.0%) |
Housing Occupancy in Pottsgrove
Occupancy by Ownership in Pottsgrove
Of the total 1,150 dwellings in Pottsgrove, owner-occupied units account for 1,128 (98.1%), while renter-occupied units make up 22 (1.9%).
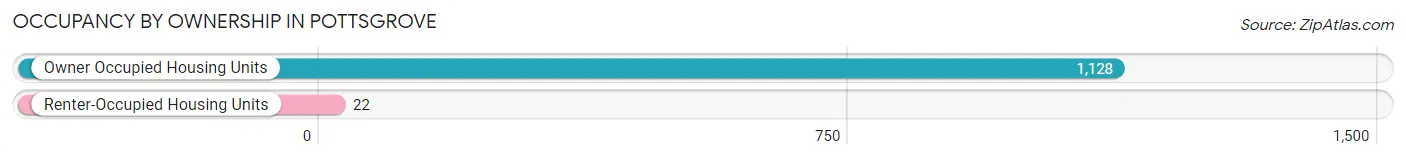
| Occupancy | # Housing Units | % Housing Units |
| Owner Occupied Housing Units | 1,128 | 98.1% |
| Renter-Occupied Housing Units | 22 | 1.9% |
| Total Occupied Housing Units | 1,150 | 100.0% |
Occupancy by Household Size in Pottsgrove
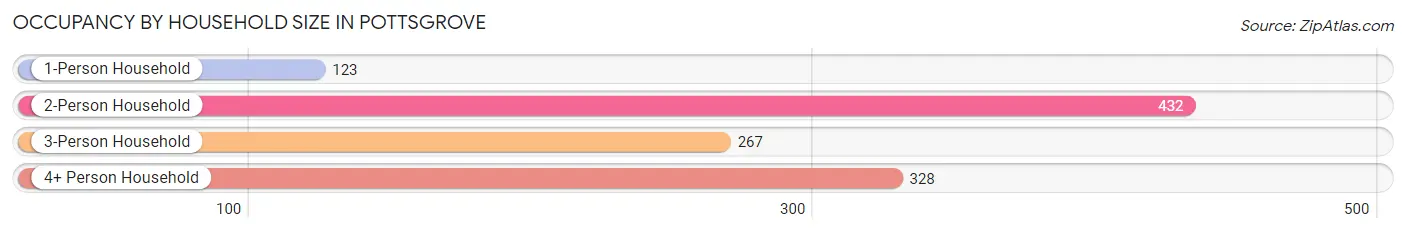
| Household Size | # Housing Units | % Housing Units |
| 1-Person Household | 123 | 10.7% |
| 2-Person Household | 432 | 37.6% |
| 3-Person Household | 267 | 23.2% |
| 4+ Person Household | 328 | 28.5% |
| Total Housing Units | 1,150 | 100.0% |
Occupancy by Ownership by Household Size in Pottsgrove
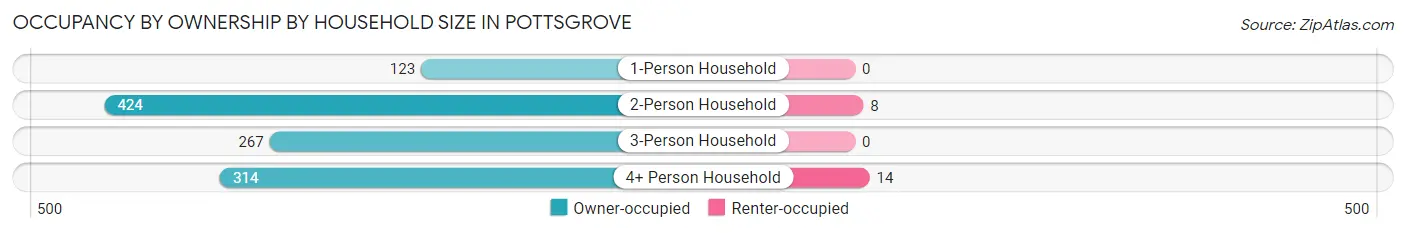
| Household Size | Owner-occupied | Renter-occupied |
| 1-Person Household | 123 (100.0%) | 0 (0.0%) |
| 2-Person Household | 424 (98.2%) | 8 (1.8%) |
| 3-Person Household | 267 (100.0%) | 0 (0.0%) |
| 4+ Person Household | 314 (95.7%) | 14 (4.3%) |
| Total Housing Units | 1,128 (98.1%) | 22 (1.9%) |
Occupancy by Educational Attainment in Pottsgrove
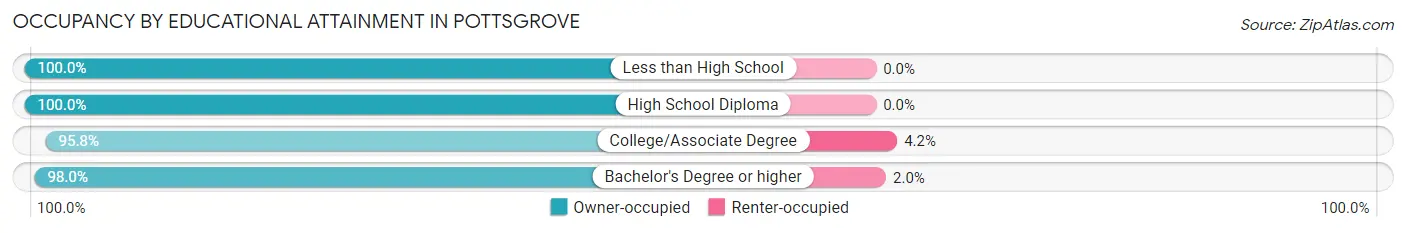
| Household Size | Owner-occupied | Renter-occupied |
| Less than High School | 63 (100.0%) | 0 (0.0%) |
| High School Diploma | 345 (100.0%) | 0 (0.0%) |
| College/Associate Degree | 322 (95.8%) | 14 (4.2%) |
| Bachelor's Degree or higher | 398 (98.0%) | 8 (2.0%) |
Occupancy by Age of Householder in Pottsgrove
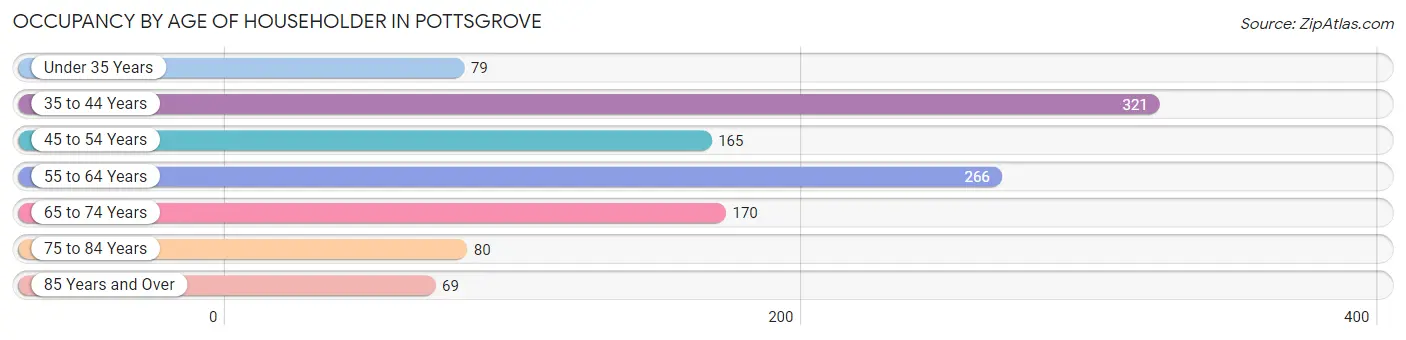
| Age Bracket | # Households | % Households |
| Under 35 Years | 79 | 6.9% |
| 35 to 44 Years | 321 | 27.9% |
| 45 to 54 Years | 165 | 14.3% |
| 55 to 64 Years | 266 | 23.1% |
| 65 to 74 Years | 170 | 14.8% |
| 75 to 84 Years | 80 | 7.0% |
| 85 Years and Over | 69 | 6.0% |
| Total | 1,150 | 100.0% |
Housing Finances in Pottsgrove
Median Income by Occupancy in Pottsgrove
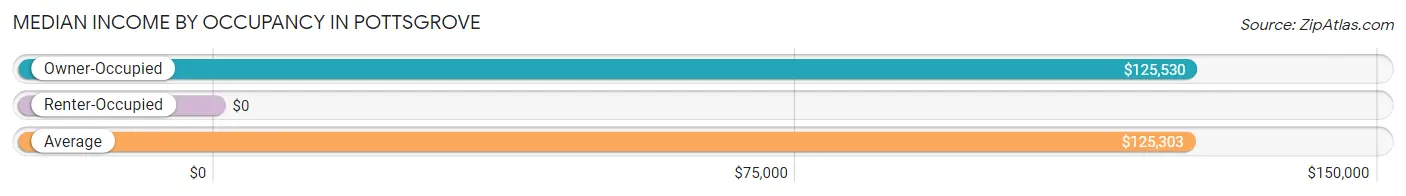
| Occupancy Type | # Households | Median Income |
| Owner-Occupied | 1,128 (98.1%) | $125,530 |
| Renter-Occupied | 22 (1.9%) | $0 |
| Average | 1,150 (100.0%) | $125,303 |
Occupancy by Householder Income Bracket in Pottsgrove
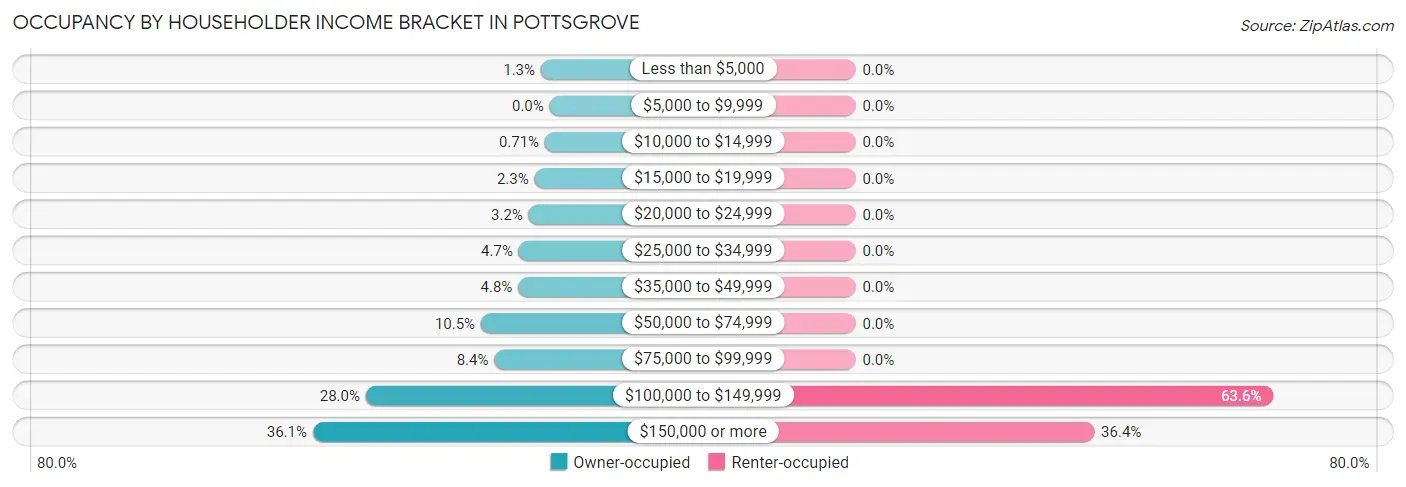
| Income Bracket | Owner-occupied | Renter-occupied |
| Less than $5,000 | 15 (1.3%) | 0 (0.0%) |
| $5,000 to $9,999 | 0 (0.0%) | 0 (0.0%) |
| $10,000 to $14,999 | 8 (0.7%) | 0 (0.0%) |
| $15,000 to $19,999 | 26 (2.3%) | 0 (0.0%) |
| $20,000 to $24,999 | 36 (3.2%) | 0 (0.0%) |
| $25,000 to $34,999 | 53 (4.7%) | 0 (0.0%) |
| $35,000 to $49,999 | 54 (4.8%) | 0 (0.0%) |
| $50,000 to $74,999 | 118 (10.5%) | 0 (0.0%) |
| $75,000 to $99,999 | 95 (8.4%) | 0 (0.0%) |
| $100,000 to $149,999 | 316 (28.0%) | 14 (63.6%) |
| $150,000 or more | 407 (36.1%) | 8 (36.4%) |
| Total | 1,128 (100.0%) | 22 (100.0%) |
Monthly Housing Cost Tiers in Pottsgrove
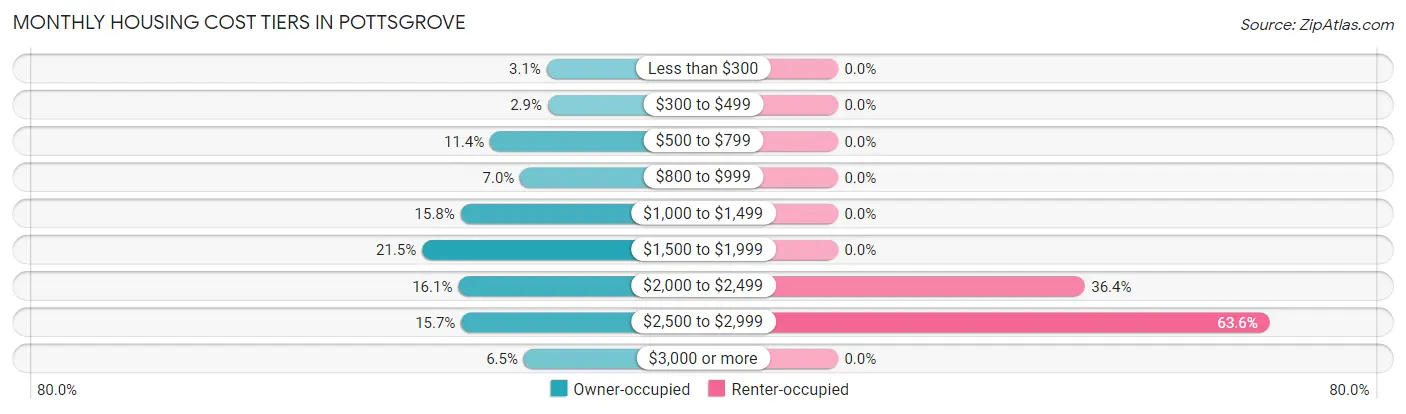
| Monthly Cost | Owner-occupied | Renter-occupied |
| Less than $300 | 35 (3.1%) | 0 (0.0%) |
| $300 to $499 | 33 (2.9%) | 0 (0.0%) |
| $500 to $799 | 129 (11.4%) | 0 (0.0%) |
| $800 to $999 | 79 (7.0%) | 0 (0.0%) |
| $1,000 to $1,499 | 178 (15.8%) | 0 (0.0%) |
| $1,500 to $1,999 | 242 (21.4%) | 0 (0.0%) |
| $2,000 to $2,499 | 182 (16.1%) | 8 (36.4%) |
| $2,500 to $2,999 | 177 (15.7%) | 14 (63.6%) |
| $3,000 or more | 73 (6.5%) | 0 (0.0%) |
| Total | 1,128 (100.0%) | 22 (100.0%) |
Physical Housing Characteristics in Pottsgrove
Housing Structures in Pottsgrove
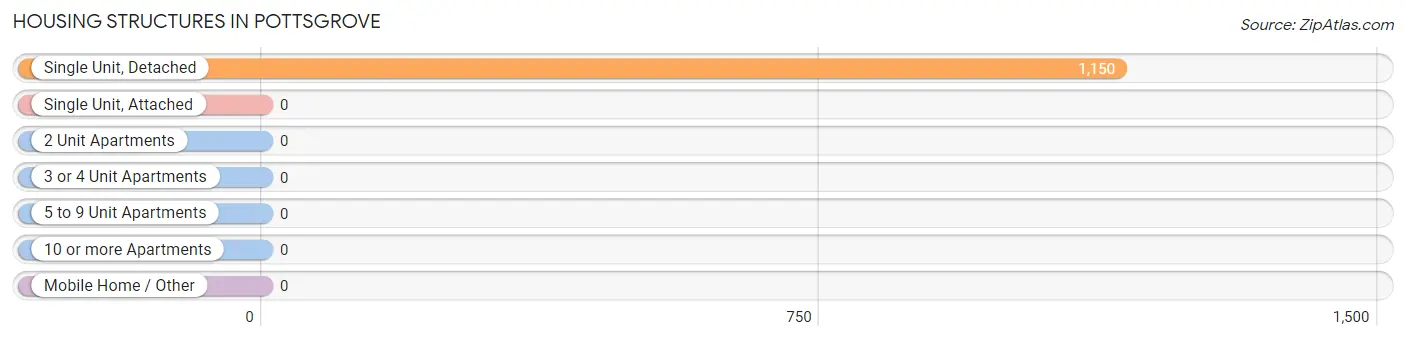
| Structure Type | # Housing Units | % Housing Units |
| Single Unit, Detached | 1,150 | 100.0% |
| Single Unit, Attached | 0 | 0.0% |
| 2 Unit Apartments | 0 | 0.0% |
| 3 or 4 Unit Apartments | 0 | 0.0% |
| 5 to 9 Unit Apartments | 0 | 0.0% |
| 10 or more Apartments | 0 | 0.0% |
| Mobile Home / Other | 0 | 0.0% |
| Total | 1,150 | 100.0% |
Housing Structures by Occupancy in Pottsgrove
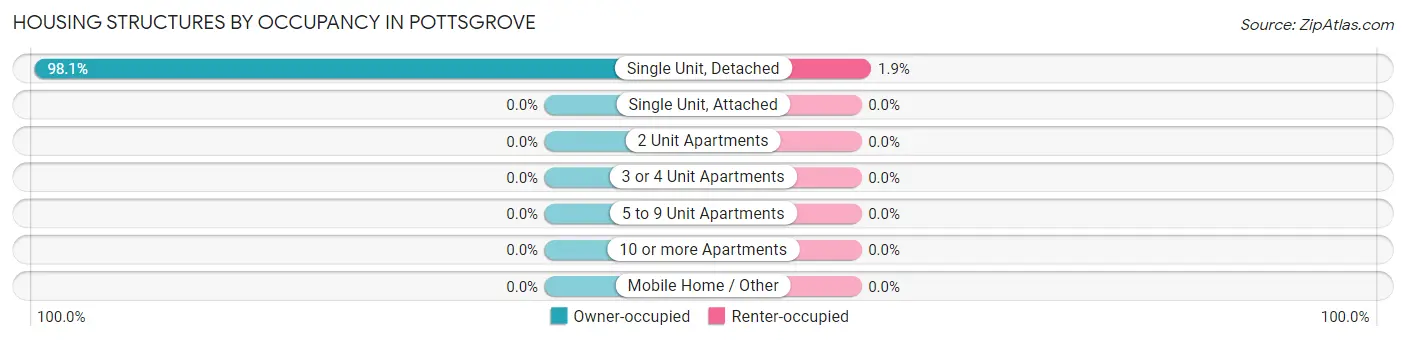
| Structure Type | Owner-occupied | Renter-occupied |
| Single Unit, Detached | 1,128 (98.1%) | 22 (1.9%) |
| Single Unit, Attached | 0 (0.0%) | 0 (0.0%) |
| 2 Unit Apartments | 0 (0.0%) | 0 (0.0%) |
| 3 or 4 Unit Apartments | 0 (0.0%) | 0 (0.0%) |
| 5 to 9 Unit Apartments | 0 (0.0%) | 0 (0.0%) |
| 10 or more Apartments | 0 (0.0%) | 0 (0.0%) |
| Mobile Home / Other | 0 (0.0%) | 0 (0.0%) |
| Total | 1,128 (98.1%) | 22 (1.9%) |
Housing Structures by Number of Rooms in Pottsgrove
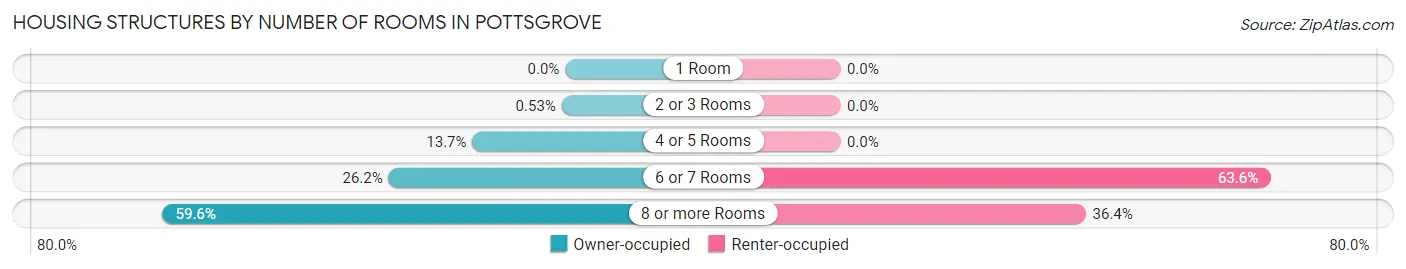
| Number of Rooms | Owner-occupied | Renter-occupied |
| 1 Room | 0 (0.0%) | 0 (0.0%) |
| 2 or 3 Rooms | 6 (0.5%) | 0 (0.0%) |
| 4 or 5 Rooms | 155 (13.7%) | 0 (0.0%) |
| 6 or 7 Rooms | 295 (26.2%) | 14 (63.6%) |
| 8 or more Rooms | 672 (59.6%) | 8 (36.4%) |
| Total | 1,128 (100.0%) | 22 (100.0%) |
Housing Structure by Heating Type in Pottsgrove
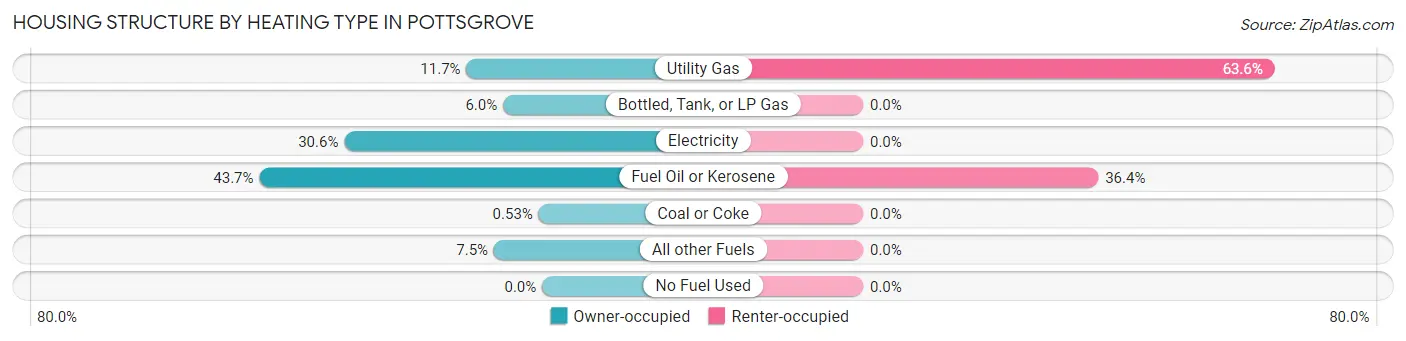
| Heating Type | Owner-occupied | Renter-occupied |
| Utility Gas | 132 (11.7%) | 14 (63.6%) |
| Bottled, Tank, or LP Gas | 68 (6.0%) | 0 (0.0%) |
| Electricity | 345 (30.6%) | 0 (0.0%) |
| Fuel Oil or Kerosene | 493 (43.7%) | 8 (36.4%) |
| Coal or Coke | 6 (0.5%) | 0 (0.0%) |
| All other Fuels | 84 (7.4%) | 0 (0.0%) |
| No Fuel Used | 0 (0.0%) | 0 (0.0%) |
| Total | 1,128 (100.0%) | 22 (100.0%) |
Household Vehicle Usage in Pottsgrove
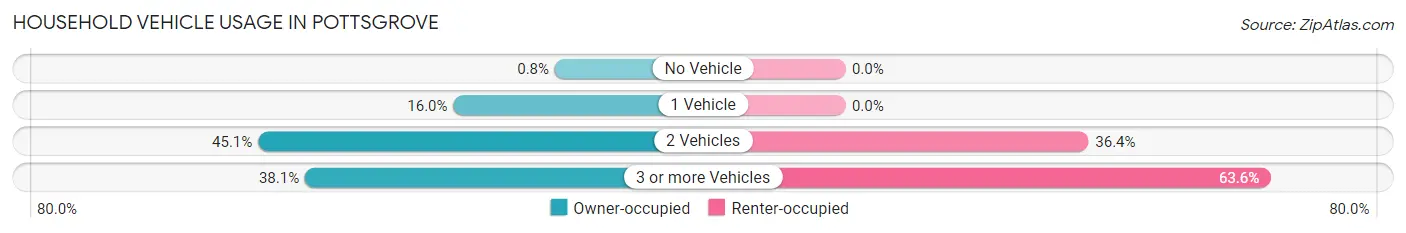
| Vehicles per Household | Owner-occupied | Renter-occupied |
| No Vehicle | 9 (0.8%) | 0 (0.0%) |
| 1 Vehicle | 180 (16.0%) | 0 (0.0%) |
| 2 Vehicles | 509 (45.1%) | 8 (36.4%) |
| 3 or more Vehicles | 430 (38.1%) | 14 (63.6%) |
| Total | 1,128 (100.0%) | 22 (100.0%) |
Real Estate & Mortgages in Pottsgrove
Real Estate and Mortgage Overview in Pottsgrove
| Characteristic | Without Mortgage | With Mortgage |
| Housing Units | 323 | 805 |
| Median Property Value | $264,000 | $277,400 |
| Median Household Income | $88,906 | $363 |
| Monthly Housing Costs | $767 | $73 |
| Real Estate Taxes | $5,739 | $0 |
Property Value by Mortgage Status in Pottsgrove
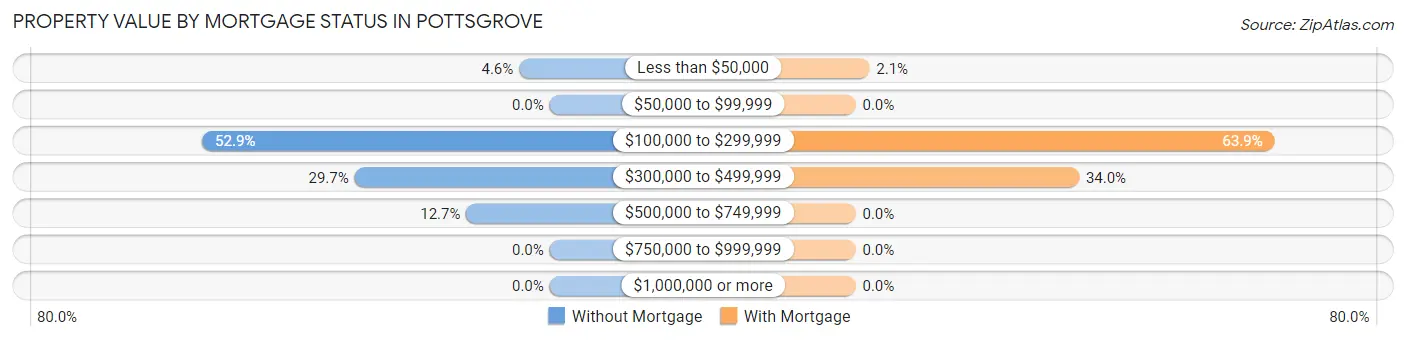
| Property Value | Without Mortgage | With Mortgage |
| Less than $50,000 | 15 (4.6%) | 17 (2.1%) |
| $50,000 to $99,999 | 0 (0.0%) | 0 (0.0%) |
| $100,000 to $299,999 | 171 (52.9%) | 514 (63.8%) |
| $300,000 to $499,999 | 96 (29.7%) | 274 (34.0%) |
| $500,000 to $749,999 | 41 (12.7%) | 0 (0.0%) |
| $750,000 to $999,999 | 0 (0.0%) | 0 (0.0%) |
| $1,000,000 or more | 0 (0.0%) | 0 (0.0%) |
| Total | 323 (100.0%) | 805 (100.0%) |
Household Income by Mortgage Status in Pottsgrove
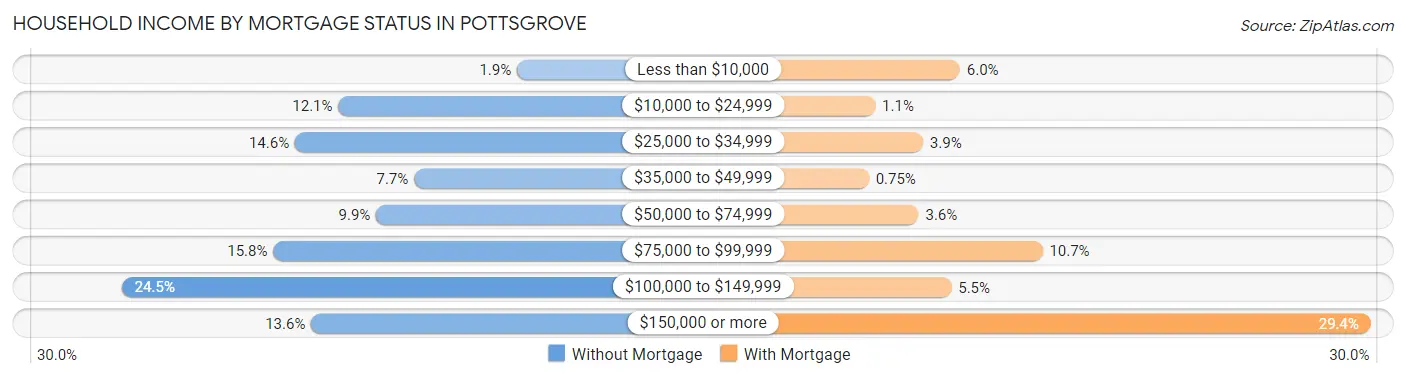
| Household Income | Without Mortgage | With Mortgage |
| Less than $10,000 | 6 (1.9%) | 48 (6.0%) |
| $10,000 to $24,999 | 39 (12.1%) | 9 (1.1%) |
| $25,000 to $34,999 | 47 (14.5%) | 31 (3.8%) |
| $35,000 to $49,999 | 25 (7.7%) | 6 (0.7%) |
| $50,000 to $74,999 | 32 (9.9%) | 29 (3.6%) |
| $75,000 to $99,999 | 51 (15.8%) | 86 (10.7%) |
| $100,000 to $149,999 | 79 (24.5%) | 44 (5.5%) |
| $150,000 or more | 44 (13.6%) | 237 (29.4%) |
| Total | 323 (100.0%) | 805 (100.0%) |
Property Value to Household Income Ratio in Pottsgrove
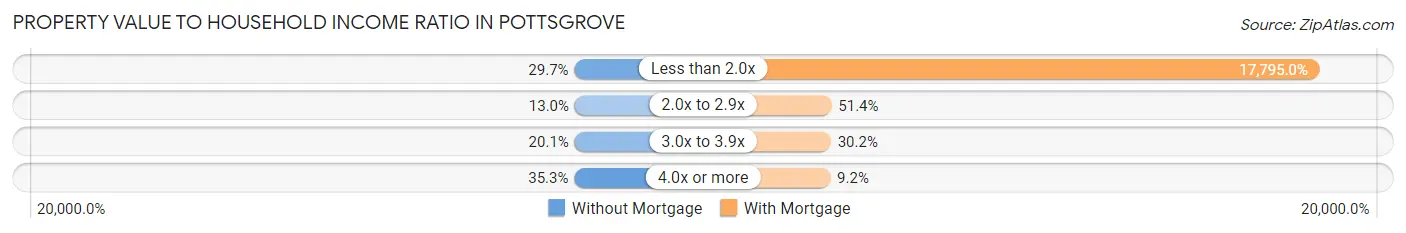
| Value-to-Income Ratio | Without Mortgage | With Mortgage |
| Less than 2.0x | 96 (29.7%) | 143,250 (17,795.0%) |
| 2.0x to 2.9x | 42 (13.0%) | 414 (51.4%) |
| 3.0x to 3.9x | 65 (20.1%) | 243 (30.2%) |
| 4.0x or more | 114 (35.3%) | 74 (9.2%) |
| Total | 323 (100.0%) | 805 (100.0%) |
Real Estate Taxes by Mortgage Status in Pottsgrove
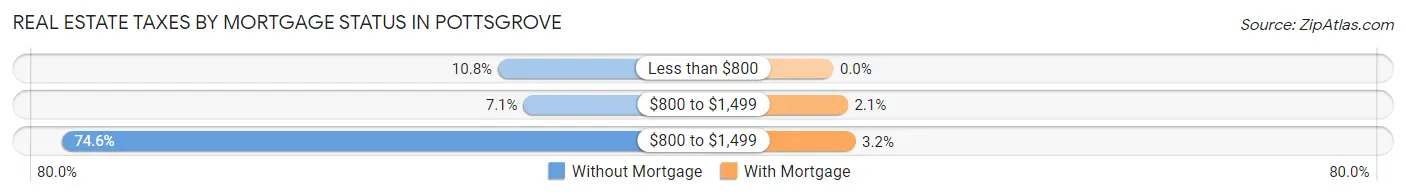
| Property Taxes | Without Mortgage | With Mortgage |
| Less than $800 | 35 (10.8%) | 0 (0.0%) |
| $800 to $1,499 | 23 (7.1%) | 17 (2.1%) |
| $800 to $1,499 | 241 (74.6%) | 26 (3.2%) |
| Total | 323 (100.0%) | 805 (100.0%) |
Health & Disability in Pottsgrove
Health Insurance Coverage by Age in Pottsgrove
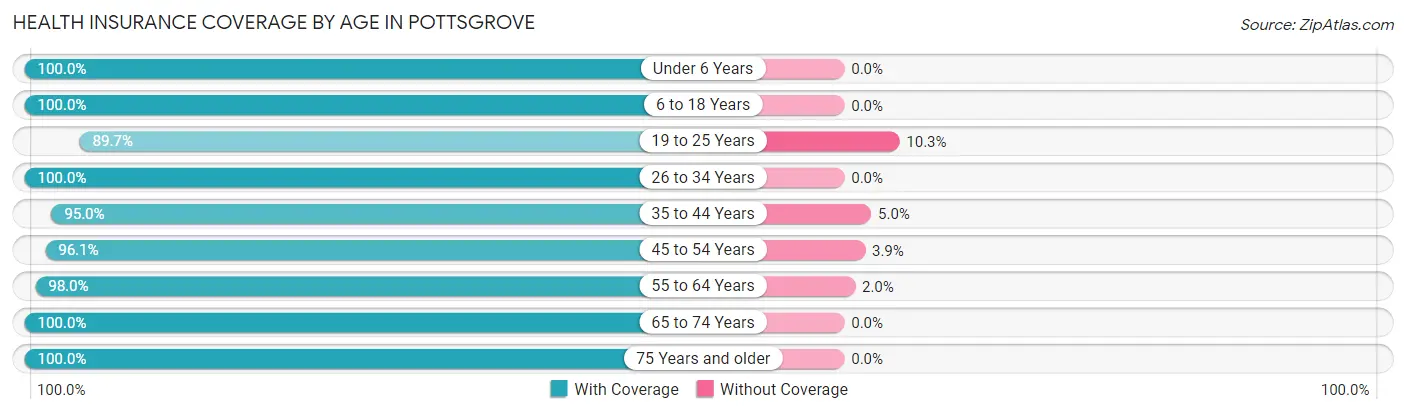
| Age Bracket | With Coverage | Without Coverage |
| Under 6 Years | 241 (100.0%) | 0 (0.0%) |
| 6 to 18 Years | 394 (100.0%) | 0 (0.0%) |
| 19 to 25 Years | 236 (89.7%) | 27 (10.3%) |
| 26 to 34 Years | 370 (100.0%) | 0 (0.0%) |
| 35 to 44 Years | 513 (95.0%) | 27 (5.0%) |
| 45 to 54 Years | 397 (96.1%) | 16 (3.9%) |
| 55 to 64 Years | 587 (98.0%) | 12 (2.0%) |
| 65 to 74 Years | 327 (100.0%) | 0 (0.0%) |
| 75 Years and older | 262 (100.0%) | 0 (0.0%) |
| Total | 3,327 (97.6%) | 82 (2.4%) |
Health Insurance Coverage by Citizenship Status in Pottsgrove
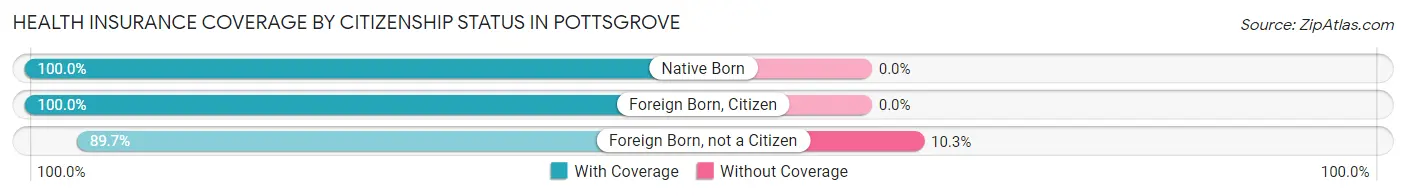
| Citizenship Status | With Coverage | Without Coverage |
| Native Born | 241 (100.0%) | 0 (0.0%) |
| Foreign Born, Citizen | 394 (100.0%) | 0 (0.0%) |
| Foreign Born, not a Citizen | 236 (89.7%) | 27 (10.3%) |
Health Insurance Coverage by Household Income in Pottsgrove
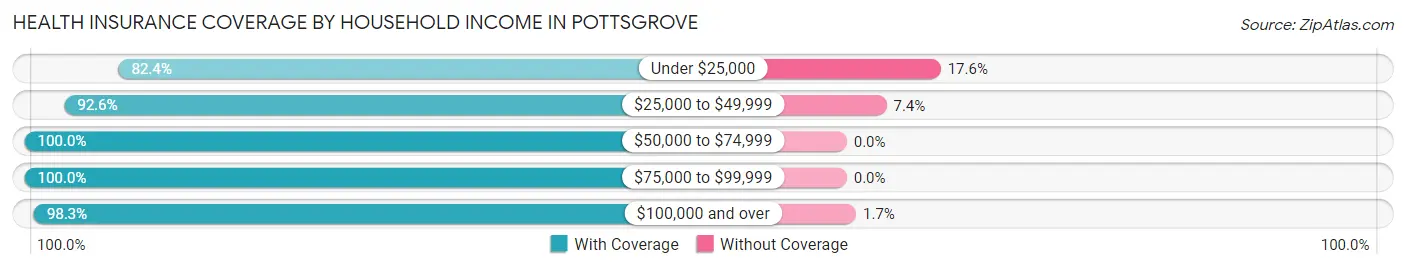
| Household Income | With Coverage | Without Coverage |
| Under $25,000 | 103 (82.4%) | 22 (17.6%) |
| $25,000 to $49,999 | 199 (92.6%) | 16 (7.4%) |
| $50,000 to $74,999 | 307 (100.0%) | 0 (0.0%) |
| $75,000 to $99,999 | 215 (100.0%) | 0 (0.0%) |
| $100,000 and over | 2,488 (98.3%) | 44 (1.7%) |
Public vs Private Health Insurance Coverage by Age in Pottsgrove
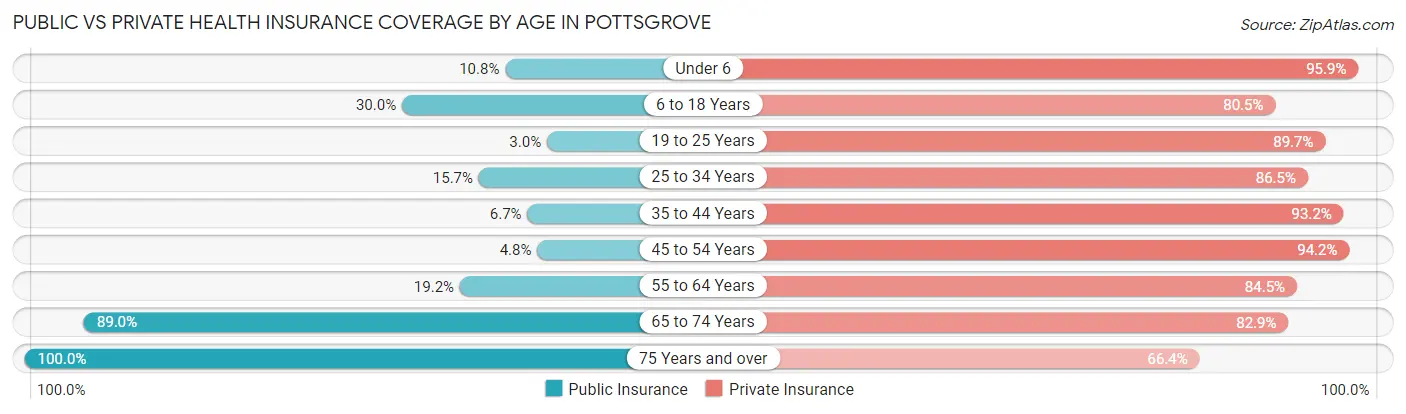
| Age Bracket | Public Insurance | Private Insurance |
| Under 6 | 26 (10.8%) | 231 (95.9%) |
| 6 to 18 Years | 118 (29.9%) | 317 (80.5%) |
| 19 to 25 Years | 8 (3.0%) | 236 (89.7%) |
| 25 to 34 Years | 58 (15.7%) | 320 (86.5%) |
| 35 to 44 Years | 36 (6.7%) | 503 (93.1%) |
| 45 to 54 Years | 20 (4.8%) | 389 (94.2%) |
| 55 to 64 Years | 115 (19.2%) | 506 (84.5%) |
| 65 to 74 Years | 291 (89.0%) | 271 (82.9%) |
| 75 Years and over | 262 (100.0%) | 174 (66.4%) |
| Total | 934 (27.4%) | 2,947 (86.5%) |
Disability Status by Sex by Age in Pottsgrove
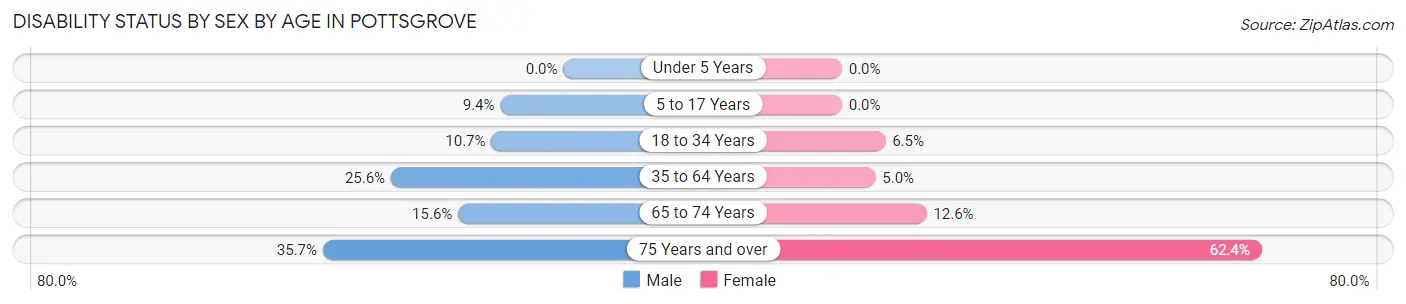
| Age Bracket | Male | Female |
| Under 5 Years | 0 (0.0%) | 0 (0.0%) |
| 5 to 17 Years | 23 (9.3%) | 0 (0.0%) |
| 18 to 34 Years | 42 (10.7%) | 16 (6.5%) |
| 35 to 64 Years | 202 (25.6%) | 38 (5.0%) |
| 65 to 74 Years | 25 (15.6%) | 21 (12.6%) |
| 75 Years and over | 30 (35.7%) | 111 (62.4%) |
Disability Class by Sex by Age in Pottsgrove
Disability Class: Hearing Difficulty
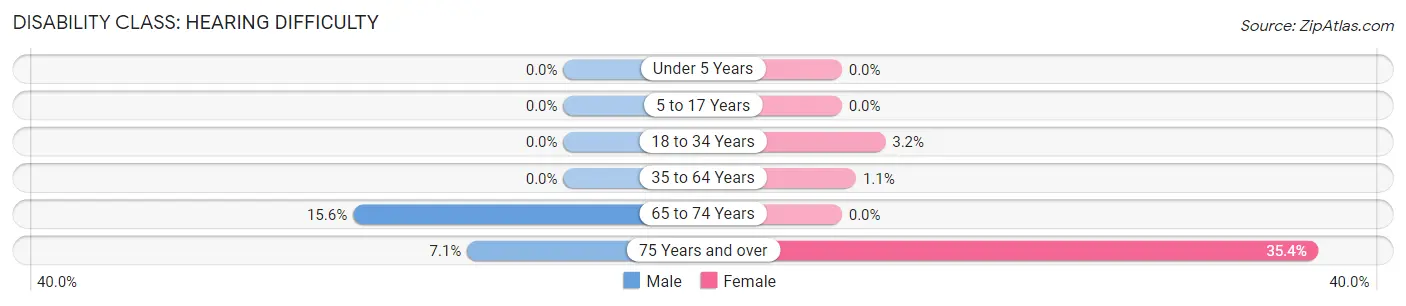
| Age Bracket | Male | Female |
| Under 5 Years | 0 (0.0%) | 0 (0.0%) |
| 5 to 17 Years | 0 (0.0%) | 0 (0.0%) |
| 18 to 34 Years | 0 (0.0%) | 8 (3.2%) |
| 35 to 64 Years | 0 (0.0%) | 8 (1.1%) |
| 65 to 74 Years | 25 (15.6%) | 0 (0.0%) |
| 75 Years and over | 6 (7.1%) | 63 (35.4%) |
Disability Class: Vision Difficulty
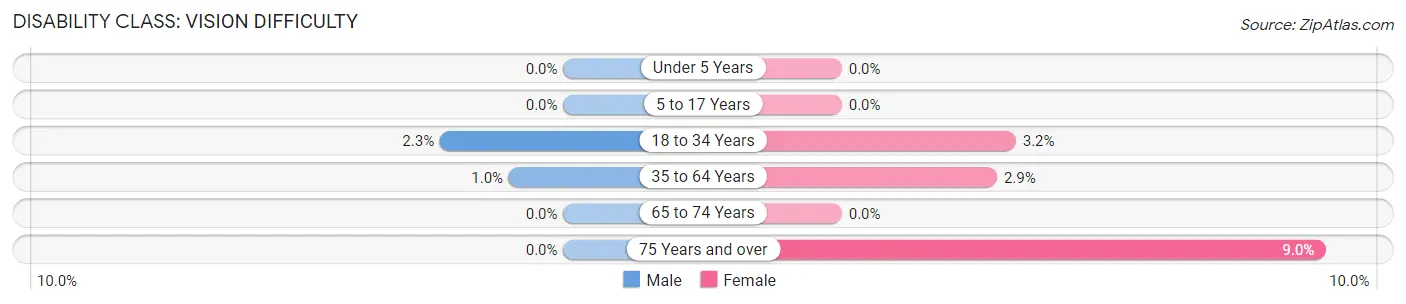
| Age Bracket | Male | Female |
| Under 5 Years | 0 (0.0%) | 0 (0.0%) |
| 5 to 17 Years | 0 (0.0%) | 0 (0.0%) |
| 18 to 34 Years | 9 (2.3%) | 8 (3.2%) |
| 35 to 64 Years | 8 (1.0%) | 22 (2.9%) |
| 65 to 74 Years | 0 (0.0%) | 0 (0.0%) |
| 75 Years and over | 0 (0.0%) | 16 (9.0%) |
Disability Class: Cognitive Difficulty
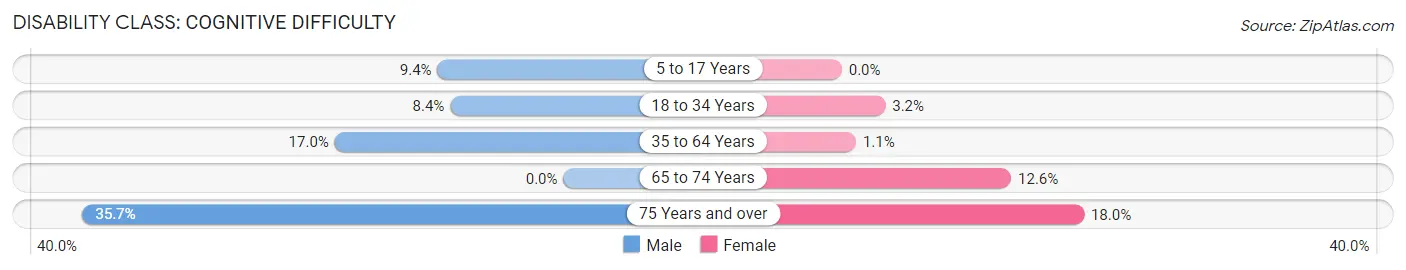
| Age Bracket | Male | Female |
| 5 to 17 Years | 23 (9.3%) | 0 (0.0%) |
| 18 to 34 Years | 33 (8.4%) | 8 (3.2%) |
| 35 to 64 Years | 134 (17.0%) | 8 (1.1%) |
| 65 to 74 Years | 0 (0.0%) | 21 (12.6%) |
| 75 Years and over | 30 (35.7%) | 32 (18.0%) |
Disability Class: Ambulatory Difficulty
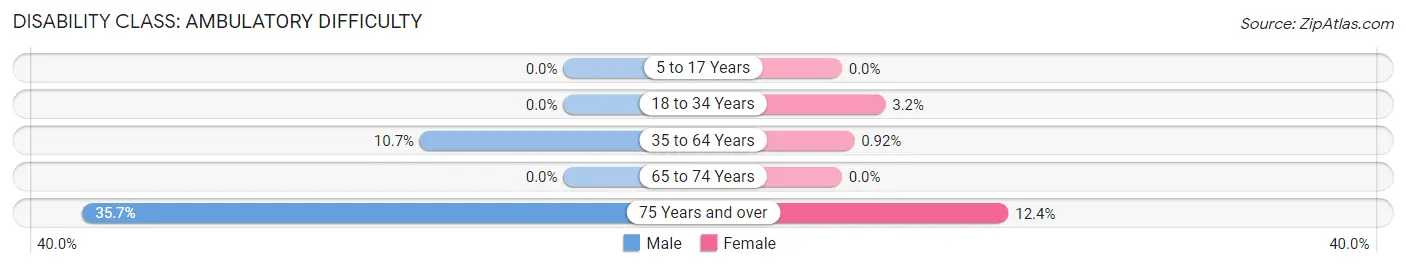
| Age Bracket | Male | Female |
| 5 to 17 Years | 0 (0.0%) | 0 (0.0%) |
| 18 to 34 Years | 0 (0.0%) | 8 (3.2%) |
| 35 to 64 Years | 84 (10.6%) | 7 (0.9%) |
| 65 to 74 Years | 0 (0.0%) | 0 (0.0%) |
| 75 Years and over | 30 (35.7%) | 22 (12.4%) |
Disability Class: Self-Care Difficulty
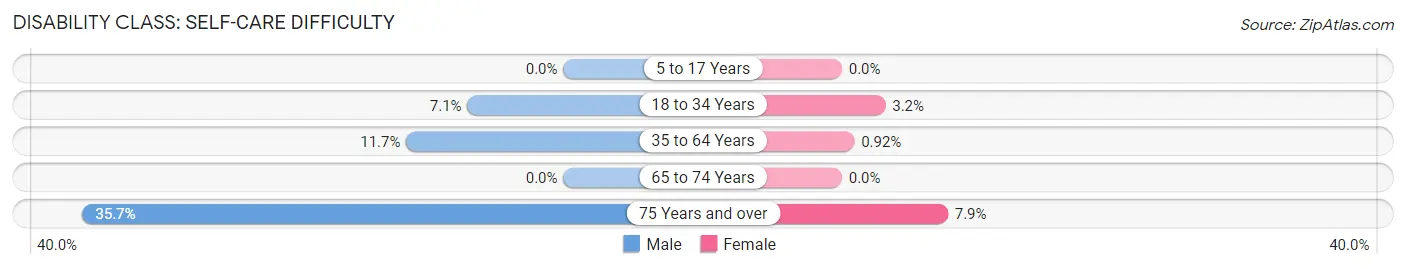
| Age Bracket | Male | Female |
| 5 to 17 Years | 0 (0.0%) | 0 (0.0%) |
| 18 to 34 Years | 28 (7.1%) | 8 (3.2%) |
| 35 to 64 Years | 92 (11.7%) | 7 (0.9%) |
| 65 to 74 Years | 0 (0.0%) | 0 (0.0%) |
| 75 Years and over | 30 (35.7%) | 14 (7.9%) |
Technology Access in Pottsgrove
Computing Device Access in Pottsgrove
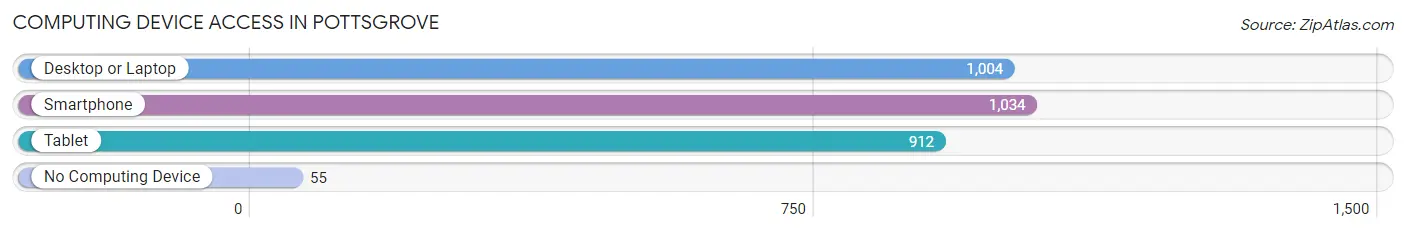
| Device Type | # Households | % Households |
| Desktop or Laptop | 1,004 | 87.3% |
| Smartphone | 1,034 | 89.9% |
| Tablet | 912 | 79.3% |
| No Computing Device | 55 | 4.8% |
| Total | 1,150 | 100.0% |
Internet Access in Pottsgrove
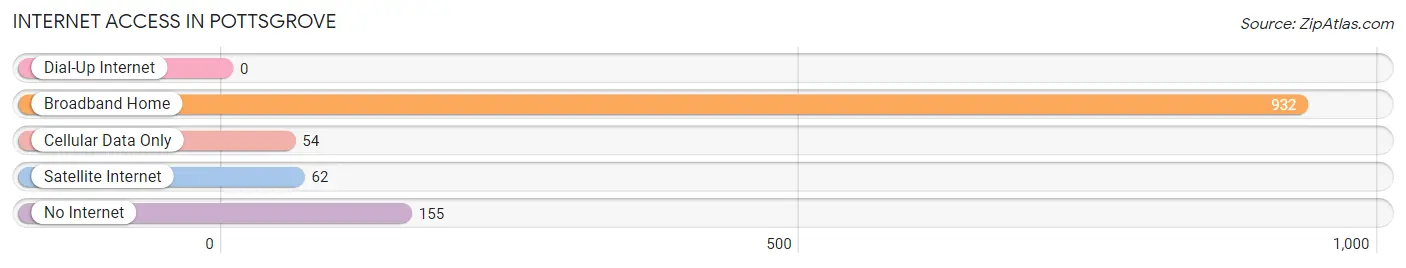
| Internet Type | # Households | % Households |
| Dial-Up Internet | 0 | 0.0% |
| Broadband Home | 932 | 81.0% |
| Cellular Data Only | 54 | 4.7% |
| Satellite Internet | 62 | 5.4% |
| No Internet | 155 | 13.5% |
| Total | 1,150 | 100.0% |
Pottsgrove Summary
Pottsgrove, Pennsylvania is a small borough located in Montgomery County, Pennsylvania. It is situated approximately 20 miles northwest of Philadelphia and is part of the Greater Philadelphia Metropolitan Area. The borough is home to a population of approximately 4,000 people and is known for its rich history, diverse geography, and vibrant economy.
History
Pottsgrove was founded in 1752 by John Potts, a Quaker from Bucks County, Pennsylvania. Potts purchased a large tract of land in the area and established a gristmill, sawmill, and forge. The area quickly grew and became known as Pottsgrove. In 1784, the borough was officially incorporated and became the first municipality in Montgomery County.
Throughout the 19th century, Pottsgrove continued to grow and develop. In 1831, the borough was connected to Philadelphia by the Schuylkill Canal, which allowed for the transportation of goods and people. In 1854, the borough was connected to the Philadelphia and Reading Railroad, which further increased its economic growth.
In the early 20th century, Pottsgrove experienced a period of rapid growth and development. The borough was home to several factories and businesses, including the Pottsgrove Manufacturing Company, which produced a variety of products, including textiles, furniture, and tools.
Geography
Pottsgrove is located in southeastern Pennsylvania, approximately 20 miles northwest of Philadelphia. The borough is situated in the Schuylkill River Valley and is surrounded by rolling hills and farmland. The borough is home to several parks and recreational areas, including the Pottsgrove Manor Historic Site, which is a National Historic Landmark.
Economy
Pottsgrove is home to a diverse economy. The borough is home to several small businesses, including restaurants, retail stores, and professional services. The borough is also home to several manufacturing companies, including the Pottsgrove Manufacturing Company, which produces a variety of products, including textiles, furniture, and tools.
The borough is also home to several educational institutions, including the Pottsgrove School District, which serves the borough and surrounding areas. The district is home to several elementary, middle, and high schools, as well as a vocational-technical school.
Demographics
As of the 2010 census, the population of Pottsgrove was 4,077. The racial makeup of the borough was 94.3% White, 2.2% African American, 0.3% Native American, 0.7% Asian, 0.1% Pacific Islander, 1.2% from other races, and 1.2% from two or more races. Hispanic or Latino of any race were 3.2% of the population.
The median household income in Pottsgrove was $50,945, and the median family income was $60,917. The per capita income for the borough was $25,945. About 5.2% of families and 6.7% of the population were below the poverty line, including 8.2% of those under age 18 and 4.2% of those age 65 or over.
Common Questions
What is Per Capita Income in Pottsgrove?
Per Capita income in Pottsgrove is $47,259.
What is the Median Family Income in Pottsgrove?
Median Family Income in Pottsgrove is $134,034.
What is the Median Household income in Pottsgrove?
Median Household Income in Pottsgrove is $125,303.
What is Income or Wage Gap in Pottsgrove?
Income or Wage Gap in Pottsgrove is 17.6%.
Women in Pottsgrove earn 82.4 cents for every dollar earned by a man.
What is Inequality or Gini Index in Pottsgrove?
Inequality or Gini Index in Pottsgrove is 0.34.
What is the Total Population of Pottsgrove?
Total Population of Pottsgrove is 3,409.
What is the Total Male Population of Pottsgrove?
Total Male Population of Pottsgrove is 1,743.
What is the Total Female Population of Pottsgrove?
Total Female Population of Pottsgrove is 1,666.
What is the Ratio of Males per 100 Females in Pottsgrove?
There are 104.62 Males per 100 Females in Pottsgrove.
What is the Ratio of Females per 100 Males in Pottsgrove?
There are 95.58 Females per 100 Males in Pottsgrove.
What is the Median Population Age in Pottsgrove?
Median Population Age in Pottsgrove is 43.5 Years.
What is the Average Family Size in Pottsgrove
Average Family Size in Pottsgrove is 3.2 People.
What is the Average Household Size in Pottsgrove
Average Household Size in Pottsgrove is 3.0 People.
How Large is the Labor Force in Pottsgrove?
There are 2,100 People in the Labor Forcein in Pottsgrove.
What is the Percentage of People in the Labor Force in Pottsgrove?
73.2% of People are in the Labor Force in Pottsgrove.
What is the Unemployment Rate in Pottsgrove?
Unemployment Rate in Pottsgrove is 3.2%.