Northumberland borough, PA Map & Demographics
Northumberland borough Overview
$32,355
PER CAPITA INCOME
$78,125
AVG FAMILY INCOME
$56,964
AVG HOUSEHOLD INCOME
28.2%
WAGE / INCOME GAP [ % ]
71.8¢/ $1
WAGE / INCOME GAP [ $ ]
0.42
INEQUALITY / GINI INDEX
3,892
TOTAL POPULATION
1,921
MALE POPULATION
1,971
FEMALE POPULATION
97.46
MALES / 100 FEMALES
102.60
FEMALES / 100 MALES
42.1
MEDIAN AGE
2.7
AVG FAMILY SIZE
2.2
AVG HOUSEHOLD SIZE
2,026
LABOR FORCE [ PEOPLE ]
65.9%
PERCENT IN LABOR FORCE
1.4%
UNEMPLOYMENT RATE
Income in Northumberland borough
Income Overview in Northumberland borough
Per Capita Income in Northumberland borough is $32,355, while median incomes of families and households are $78,125 and $56,964 respectively.
| Characteristic | Number | Measure |
| Per Capita Income | 3,892 | $32,355 |
| Median Family Income | 1,065 | $78,125 |
| Mean Family Income | 1,065 | $80,109 |
| Median Household Income | 1,773 | $56,964 |
| Mean Household Income | 1,773 | $70,502 |
| Income Deficit | 1,065 | $0 |
| Wage / Income Gap (%) | 3,892 | 28.25% |
| Wage / Income Gap ($) | 3,892 | 71.75¢ per $1 |
| Gini / Inequality Index | 3,892 | 0.42 |
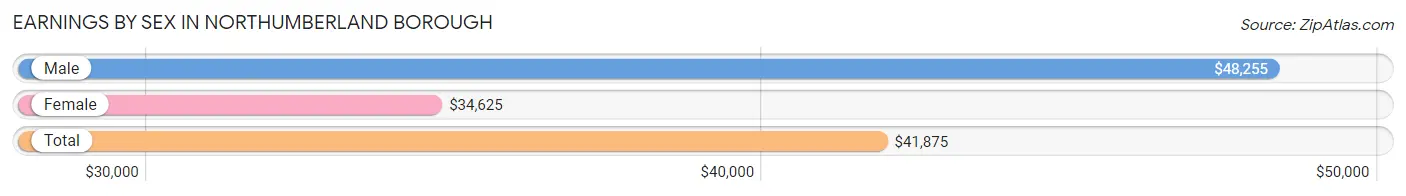
Earnings by Sex in Northumberland borough
Average Earnings in Northumberland borough are $41,875, $48,255 for men and $34,625 for women, a difference of 28.2%.
| Sex | Number | Average Earnings |
| Male | 1,031 (48.6%) | $48,255 |
| Female | 1,091 (51.4%) | $34,625 |
| Total | 2,122 (100.0%) | $41,875 |
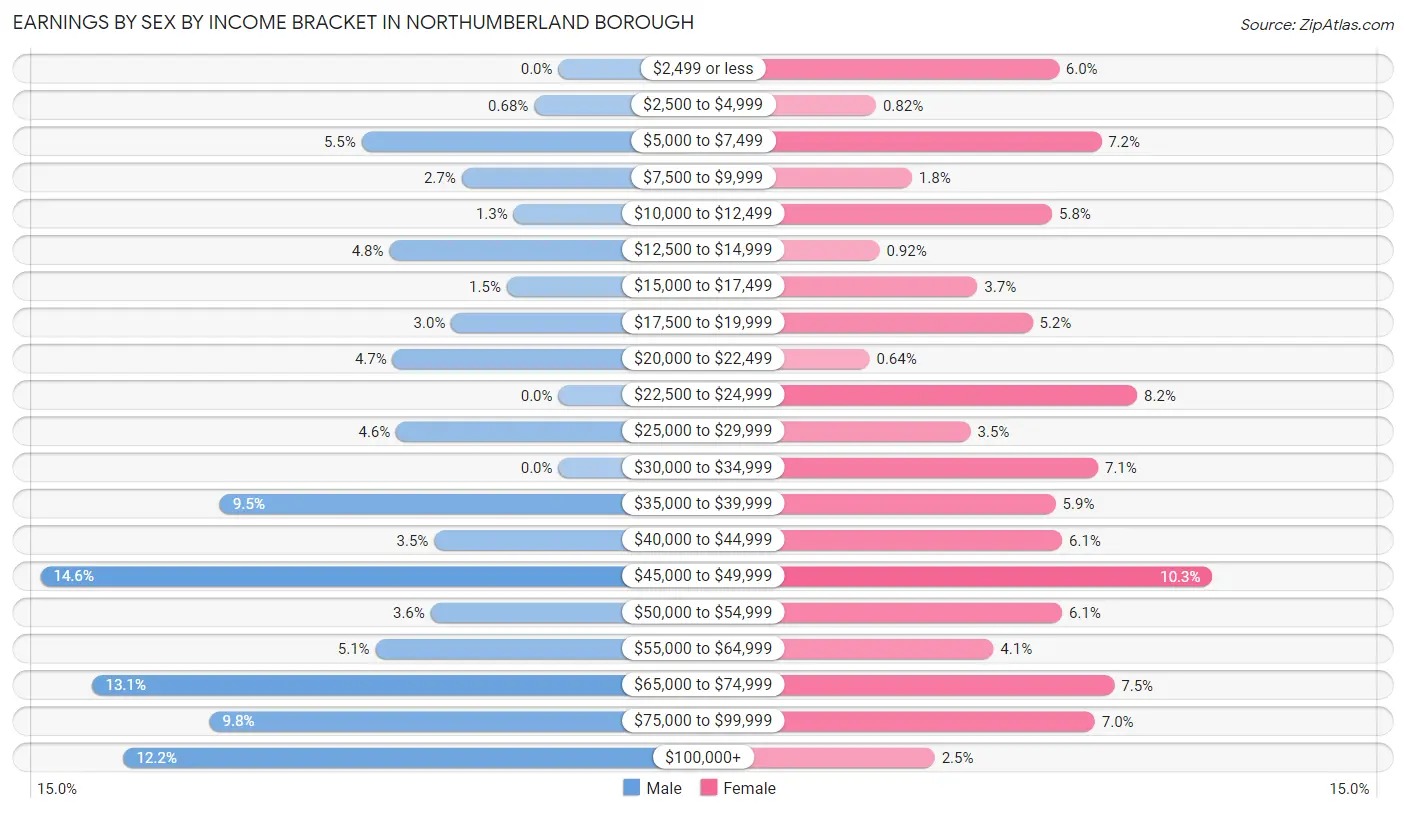
Earnings by Sex by Income Bracket in Northumberland borough
The most common earnings brackets in Northumberland borough are $45,000 to $49,999 for men (150 | 14.5%) and $45,000 to $49,999 for women (112 | 10.3%).
| Income | Male | Female |
| $2,499 or less | 0 (0.0%) | 65 (6.0%) |
| $2,500 to $4,999 | 7 (0.7%) | 9 (0.8%) |
| $5,000 to $7,499 | 57 (5.5%) | 78 (7.1%) |
| $7,500 to $9,999 | 28 (2.7%) | 20 (1.8%) |
| $10,000 to $12,499 | 13 (1.3%) | 63 (5.8%) |
| $12,500 to $14,999 | 49 (4.8%) | 10 (0.9%) |
| $15,000 to $17,499 | 15 (1.5%) | 40 (3.7%) |
| $17,500 to $19,999 | 31 (3.0%) | 57 (5.2%) |
| $20,000 to $22,499 | 48 (4.7%) | 7 (0.6%) |
| $22,500 to $24,999 | 0 (0.0%) | 89 (8.2%) |
| $25,000 to $29,999 | 47 (4.6%) | 38 (3.5%) |
| $30,000 to $34,999 | 0 (0.0%) | 77 (7.1%) |
| $35,000 to $39,999 | 98 (9.5%) | 64 (5.9%) |
| $40,000 to $44,999 | 36 (3.5%) | 66 (6.0%) |
| $45,000 to $49,999 | 150 (14.5%) | 112 (10.3%) |
| $50,000 to $54,999 | 37 (3.6%) | 66 (6.0%) |
| $55,000 to $64,999 | 53 (5.1%) | 45 (4.1%) |
| $65,000 to $74,999 | 135 (13.1%) | 82 (7.5%) |
| $75,000 to $99,999 | 101 (9.8%) | 76 (7.0%) |
| $100,000+ | 126 (12.2%) | 27 (2.5%) |
| Total | 1,031 (100.0%) | 1,091 (100.0%) |
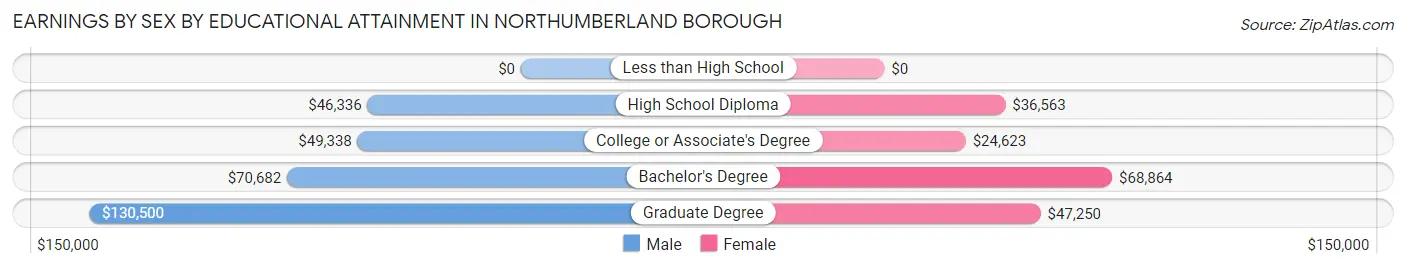
Earnings by Sex by Educational Attainment in Northumberland borough
Average earnings in Northumberland borough are $49,574 for men and $36,914 for women, a difference of 25.5%. Men with an educational attainment of graduate degree enjoy the highest average annual earnings of $130,500, while those with high school diploma education earn the least with $46,336. Women with an educational attainment of bachelor's degree earn the most with the average annual earnings of $68,864, while those with college or associate's degree education have the smallest earnings of $24,623.
| Educational Attainment | Male Income | Female Income |
| Less than High School | - | - |
| High School Diploma | $46,336 | $36,563 |
| College or Associate's Degree | $49,338 | $24,623 |
| Bachelor's Degree | $70,682 | $68,864 |
| Graduate Degree | $130,500 | $47,250 |
| Total | $49,574 | $36,914 |
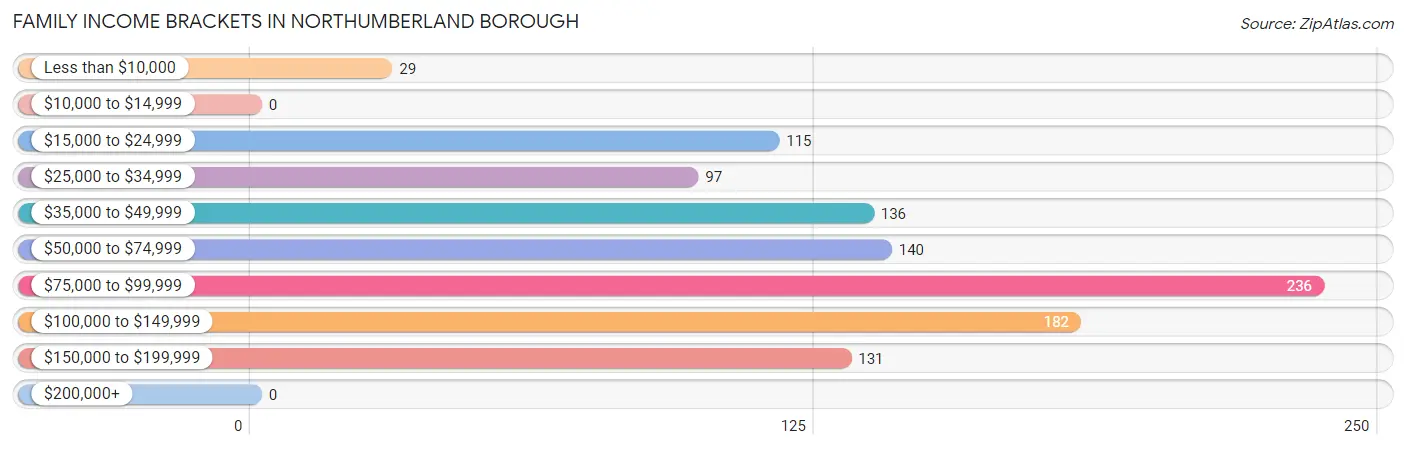
Family Income in Northumberland borough
Family Income Brackets in Northumberland borough
According to the Northumberland borough family income data, there are 236 families falling into the $75,000 to $99,999 income range, which is the most common income bracket and makes up 22.2% of all families.
| Income Bracket | # Families | % Families |
| Less than $10,000 | 29 | 2.7% |
| $10,000 to $14,999 | 0 | 0.0% |
| $15,000 to $24,999 | 115 | 10.8% |
| $25,000 to $34,999 | 97 | 9.1% |
| $35,000 to $49,999 | 136 | 12.8% |
| $50,000 to $74,999 | 140 | 13.1% |
| $75,000 to $99,999 | 236 | 22.2% |
| $100,000 to $149,999 | 182 | 17.1% |
| $150,000 to $199,999 | 131 | 12.3% |
| $200,000+ | 0 | 0.0% |
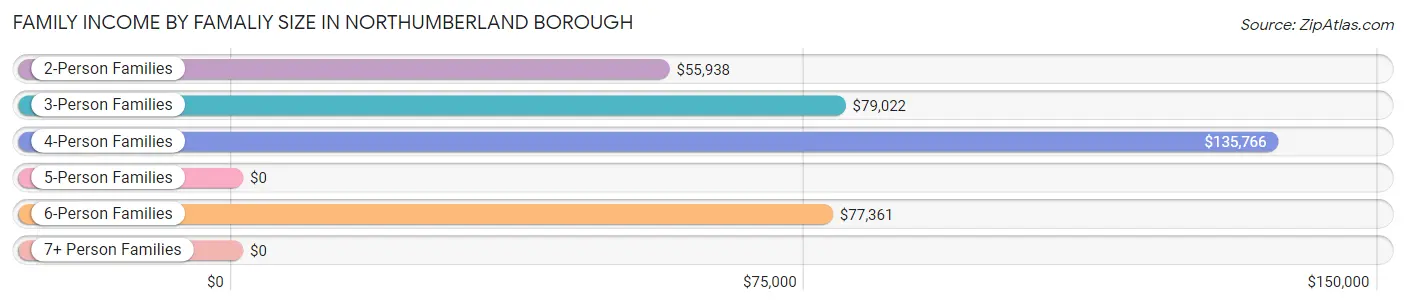
Family Income by Famaliy Size in Northumberland borough
4-person families (135 | 12.7%) account for the highest median family income in Northumberland borough with $135,766 per family, while 4-person families (135 | 12.7%) have the highest median income of $33,942 per family member.
| Income Bracket | # Families | Median Income |
| 2-Person Families | 586 (55.0%) | $55,938 |
| 3-Person Families | 252 (23.7%) | $79,022 |
| 4-Person Families | 135 (12.7%) | $135,766 |
| 5-Person Families | 55 (5.2%) | $0 |
| 6-Person Families | 37 (3.5%) | $77,361 |
| 7+ Person Families | 0 (0.0%) | $0 |
| Total | 1,065 (100.0%) | $78,125 |
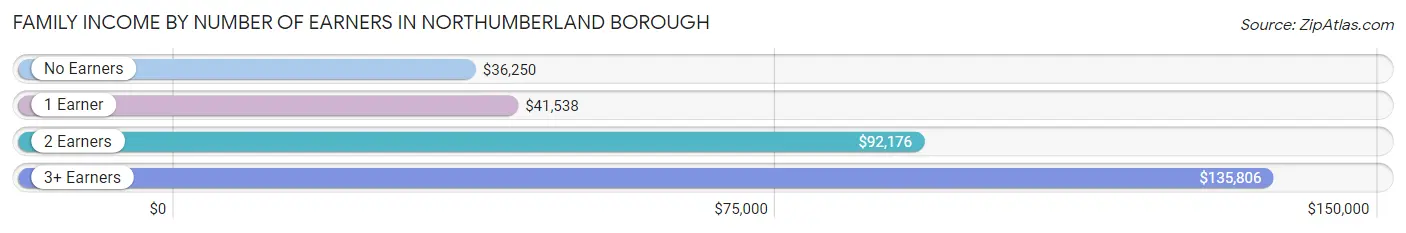
Family Income by Number of Earners in Northumberland borough
The median family income in Northumberland borough is $78,125, with families comprising 3+ earners (90) having the highest median family income of $135,806, while families with no earners (216) have the lowest median family income of $36,250, accounting for 8.5% and 20.3% of families, respectively.
| Number of Earners | # Families | Median Income |
| No Earners | 216 (20.3%) | $36,250 |
| 1 Earner | 278 (26.1%) | $41,538 |
| 2 Earners | 481 (45.2%) | $92,176 |
| 3+ Earners | 90 (8.5%) | $135,806 |
| Total | 1,065 (100.0%) | $78,125 |
Household Income in Northumberland borough
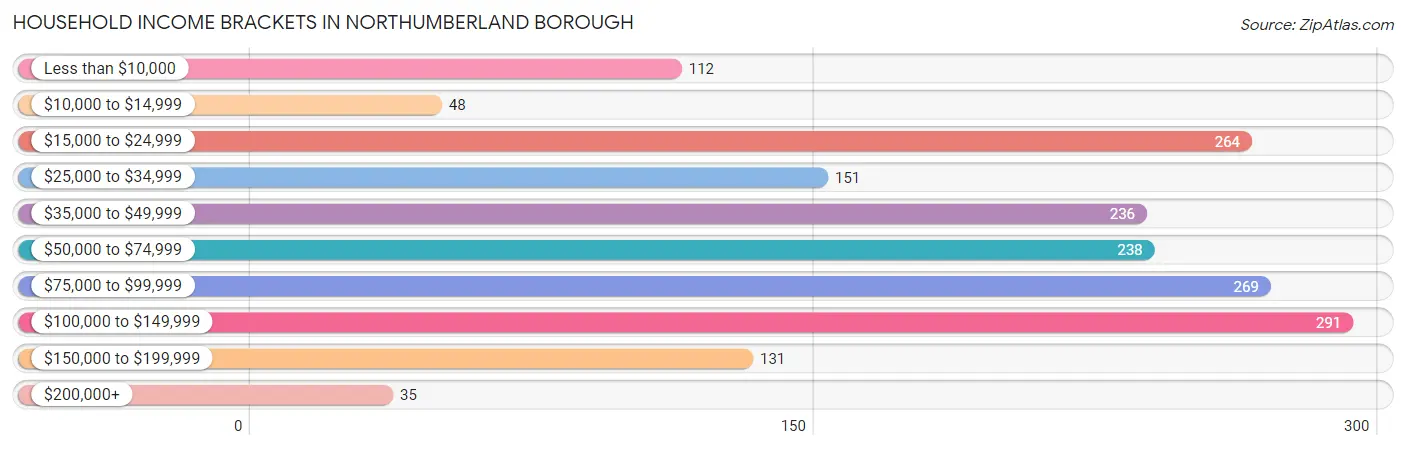
Household Income Brackets in Northumberland borough
With 291 households falling in the category, the $100,000 to $149,999 income range is the most frequent in Northumberland borough, accounting for 16.4% of all households. In contrast, only 35 households (2.0%) fall into the $200,000+ income bracket, making it the least populous group.
| Income Bracket | # Households | % Households |
| Less than $10,000 | 112 | 6.3% |
| $10,000 to $14,999 | 48 | 2.7% |
| $15,000 to $24,999 | 264 | 14.9% |
| $25,000 to $34,999 | 151 | 8.5% |
| $35,000 to $49,999 | 236 | 13.3% |
| $50,000 to $74,999 | 238 | 13.4% |
| $75,000 to $99,999 | 269 | 15.2% |
| $100,000 to $149,999 | 291 | 16.4% |
| $150,000 to $199,999 | 131 | 7.4% |
| $200,000+ | 35 | 2.0% |
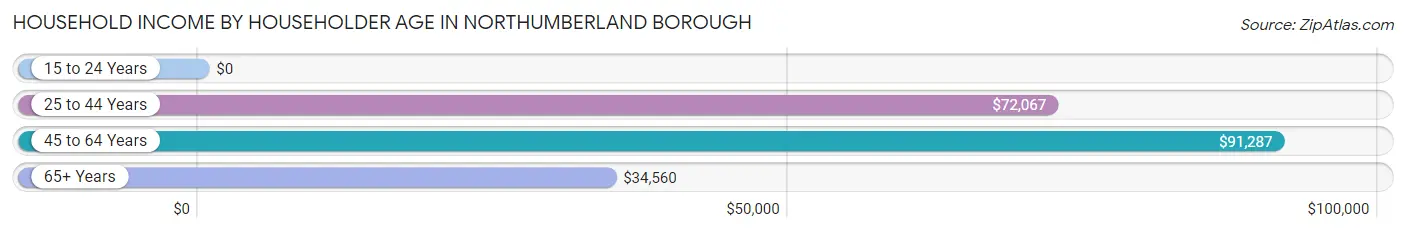
Household Income by Householder Age in Northumberland borough
The median household income in Northumberland borough is $56,964, with the highest median household income of $91,287 found in the 45 to 64 years age bracket for the primary householder. A total of 595 households (33.6%) fall into this category. Meanwhile, the 15 to 24 years age bracket for the primary householder has the lowest median household income of $0, with 10 households (0.6%) in this group.
| Income Bracket | # Households | Median Income |
| 15 to 24 Years | 10 (0.6%) | $0 |
| 25 to 44 Years | 585 (33.0%) | $72,067 |
| 45 to 64 Years | 595 (33.6%) | $91,287 |
| 65+ Years | 583 (32.9%) | $34,560 |
| Total | 1,773 (100.0%) | $56,964 |
Poverty in Northumberland borough
Income Below Poverty by Sex and Age in Northumberland borough
With 9.2% poverty level for males and 17.5% for females among the residents of Northumberland borough, 16 and 17 year old males and 12 to 14 year old females are the most vulnerable to poverty, with 7 males (100.0%) and 30 females (47.6%) in their respective age groups living below the poverty level.
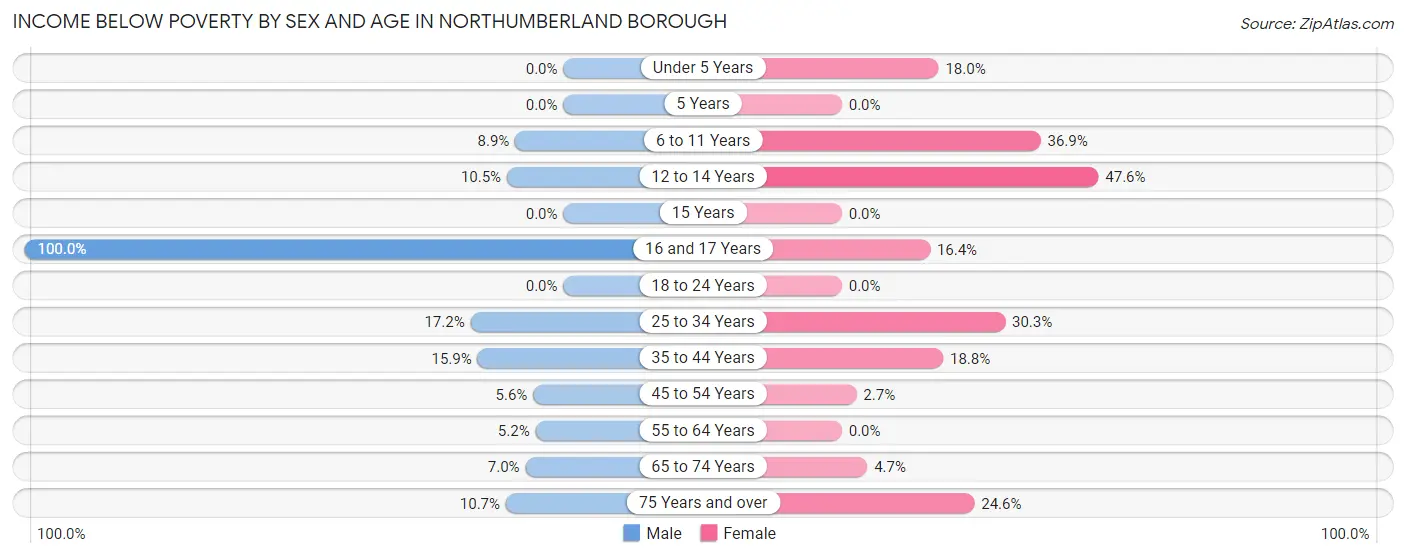
| Age Bracket | Male | Female |
| Under 5 Years | 0 (0.0%) | 7 (17.9%) |
| 5 Years | 0 (0.0%) | 0 (0.0%) |
| 6 to 11 Years | 22 (8.9%) | 76 (36.9%) |
| 12 to 14 Years | 9 (10.5%) | 30 (47.6%) |
| 15 Years | 0 (0.0%) | 0 (0.0%) |
| 16 and 17 Years | 7 (100.0%) | 9 (16.4%) |
| 18 to 24 Years | 0 (0.0%) | 0 (0.0%) |
| 25 to 34 Years | 30 (17.2%) | 80 (30.3%) |
| 35 to 44 Years | 46 (15.9%) | 56 (18.8%) |
| 45 to 54 Years | 15 (5.6%) | 7 (2.7%) |
| 55 to 64 Years | 12 (5.2%) | 0 (0.0%) |
| 65 to 74 Years | 15 (7.0%) | 10 (4.7%) |
| 75 Years and over | 19 (10.7%) | 62 (24.6%) |
| Total | 175 (9.2%) | 337 (17.5%) |
Income Above Poverty by Sex and Age in Northumberland borough
According to the poverty statistics in Northumberland borough, males aged under 5 years and females aged 5 years are the age groups that are most secure financially, with 100.0% of males and 100.0% of females in these age groups living above the poverty line.
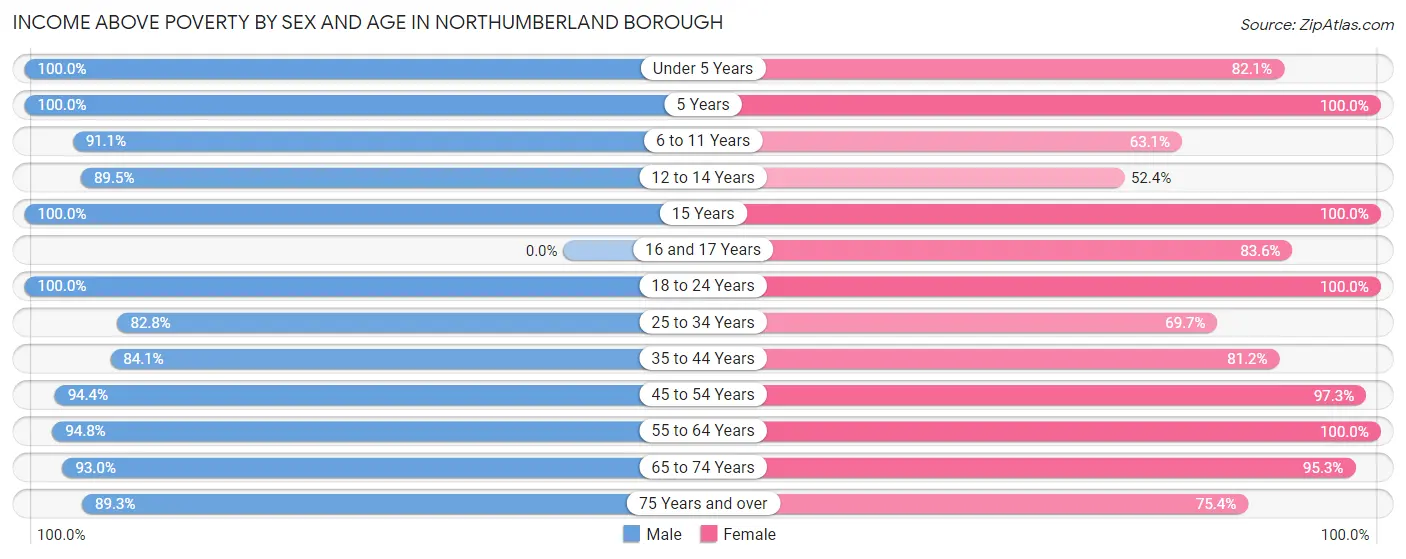
| Age Bracket | Male | Female |
| Under 5 Years | 83 (100.0%) | 32 (82.1%) |
| 5 Years | 16 (100.0%) | 24 (100.0%) |
| 6 to 11 Years | 224 (91.1%) | 130 (63.1%) |
| 12 to 14 Years | 77 (89.5%) | 33 (52.4%) |
| 15 Years | 22 (100.0%) | 13 (100.0%) |
| 16 and 17 Years | 0 (0.0%) | 46 (83.6%) |
| 18 to 24 Years | 97 (100.0%) | 58 (100.0%) |
| 25 to 34 Years | 144 (82.8%) | 184 (69.7%) |
| 35 to 44 Years | 243 (84.1%) | 242 (81.2%) |
| 45 to 54 Years | 253 (94.4%) | 251 (97.3%) |
| 55 to 64 Years | 220 (94.8%) | 186 (100.0%) |
| 65 to 74 Years | 198 (93.0%) | 202 (95.3%) |
| 75 Years and over | 159 (89.3%) | 190 (75.4%) |
| Total | 1,736 (90.8%) | 1,591 (82.5%) |
Income Below Poverty Among Married-Couple Families in Northumberland borough
The poverty statistics for married-couple families in Northumberland borough show that 2.5% or 20 of the total 794 families live below the poverty line. Families with no children have the highest poverty rate of 3.8%, comprising of 20 families. On the other hand, families with 1 or 2 children have the lowest poverty rate of 0.0%, which includes 0 families.
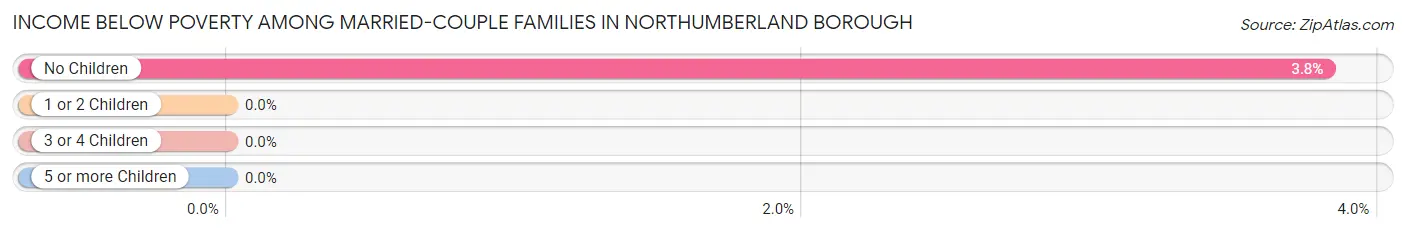
| Children | Above Poverty | Below Poverty |
| No Children | 504 (96.2%) | 20 (3.8%) |
| 1 or 2 Children | 195 (100.0%) | 0 (0.0%) |
| 3 or 4 Children | 75 (100.0%) | 0 (0.0%) |
| 5 or more Children | 0 (0.0%) | 0 (0.0%) |
| Total | 774 (97.5%) | 20 (2.5%) |
Income Below Poverty Among Single-Parent Households in Northumberland borough
According to the poverty data in Northumberland borough, 11.7% or 7 single-father households and 42.2% or 89 single-mother households are living below the poverty line. Among single-father households, those with 1 or 2 children have the highest poverty rate, with 7 households (15.9%) experiencing poverty. Likewise, among single-mother households, those with 3 or 4 children have the highest poverty rate, with 27 households (100.0%) falling below the poverty line.
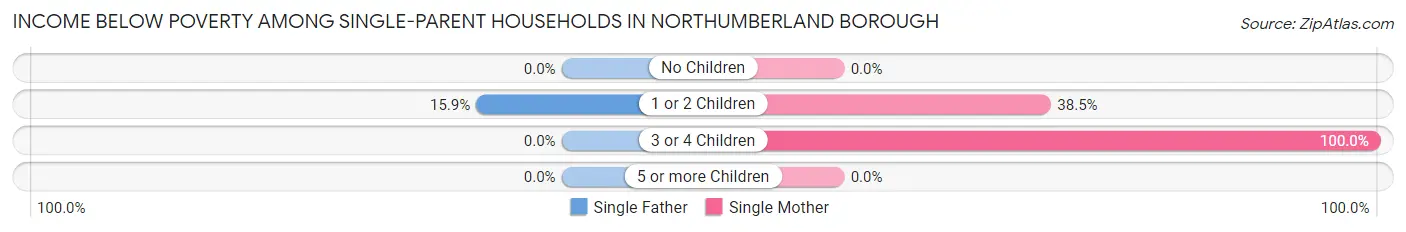
| Children | Single Father | Single Mother |
| No Children | 0 (0.0%) | 0 (0.0%) |
| 1 or 2 Children | 7 (15.9%) | 62 (38.5%) |
| 3 or 4 Children | 0 (0.0%) | 27 (100.0%) |
| 5 or more Children | 0 (0.0%) | 0 (0.0%) |
| Total | 7 (11.7%) | 89 (42.2%) |
Income Below Poverty Among Married-Couple vs Single-Parent Households in Northumberland borough
The poverty data for Northumberland borough shows that 20 of the married-couple family households (2.5%) and 96 of the single-parent households (35.4%) are living below the poverty level. Within the married-couple family households, those with no children have the highest poverty rate, with 20 households (3.8%) falling below the poverty line. Among the single-parent households, those with 3 or 4 children have the highest poverty rate, with 27 household (90.0%) living below poverty.
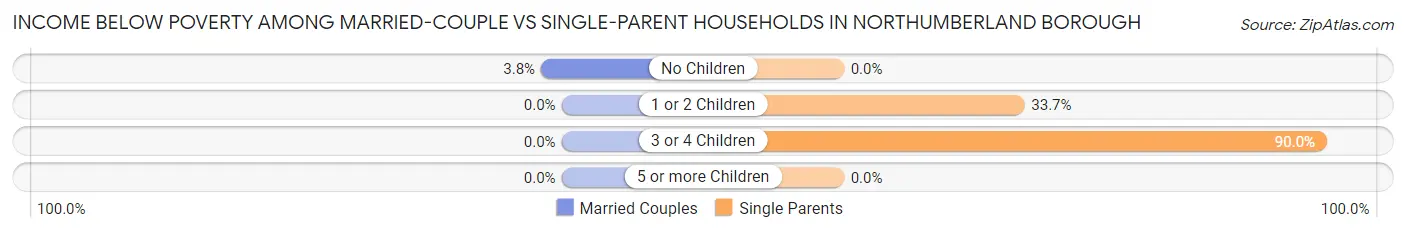
| Children | Married-Couple Families | Single-Parent Households |
| No Children | 20 (3.8%) | 0 (0.0%) |
| 1 or 2 Children | 0 (0.0%) | 69 (33.7%) |
| 3 or 4 Children | 0 (0.0%) | 27 (90.0%) |
| 5 or more Children | 0 (0.0%) | 0 (0.0%) |
| Total | 20 (2.5%) | 96 (35.4%) |
Race in Northumberland borough
The most populous races in Northumberland borough are White / Caucasian (3,598 | 92.4%), Black / African American (120 | 3.1%), and Hispanic or Latino (108 | 2.8%).
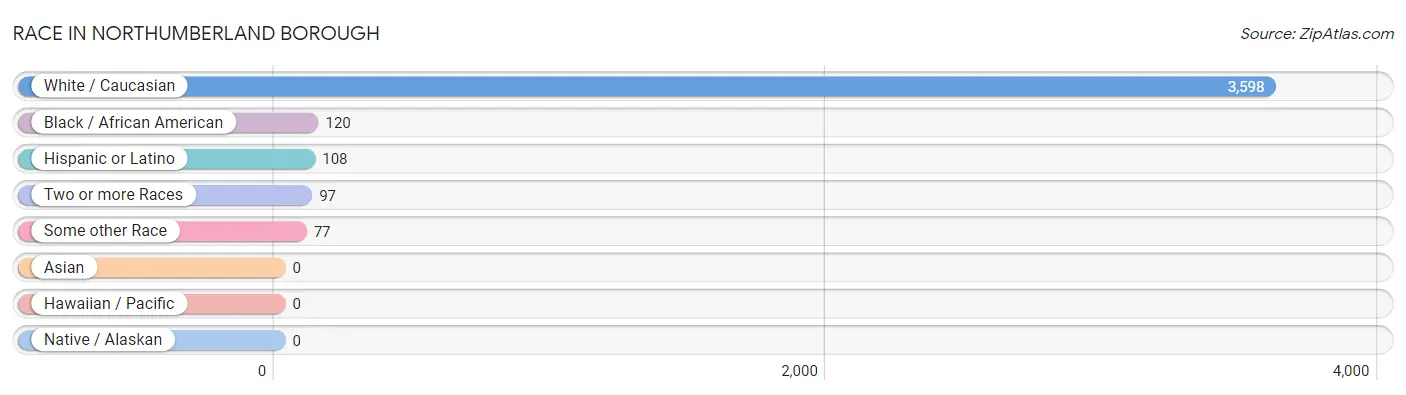
| Race | # Population | % Population |
| Asian | 0 | 0.0% |
| Black / African American | 120 | 3.1% |
| Hawaiian / Pacific | 0 | 0.0% |
| Hispanic or Latino | 108 | 2.8% |
| Native / Alaskan | 0 | 0.0% |
| White / Caucasian | 3,598 | 92.4% |
| Two or more Races | 97 | 2.5% |
| Some other Race | 77 | 2.0% |
| Total | 3,892 | 100.0% |
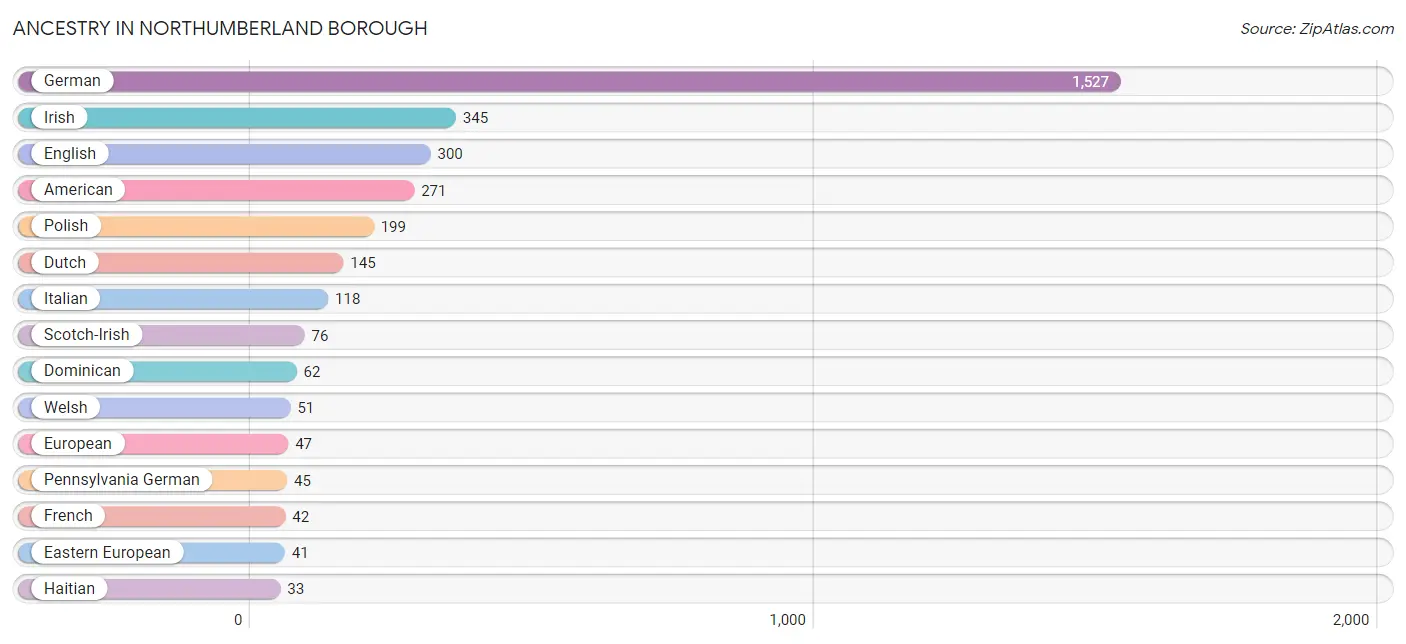
Ancestry in Northumberland borough
The most populous ancestries reported in Northumberland borough are German (1,527 | 39.2%), Irish (345 | 8.9%), English (300 | 7.7%), American (271 | 7.0%), and Polish (199 | 5.1%), together accounting for 67.9% of all Northumberland borough residents.
| Ancestry | # Population | % Population |
| American | 271 | 7.0% |
| British | 17 | 0.4% |
| Czech | 12 | 0.3% |
| Dominican | 62 | 1.6% |
| Dutch | 145 | 3.7% |
| Eastern European | 41 | 1.1% |
| English | 300 | 7.7% |
| European | 47 | 1.2% |
| French | 42 | 1.1% |
| German | 1,527 | 39.2% |
| Haitian | 33 | 0.9% |
| Irish | 345 | 8.9% |
| Italian | 118 | 3.0% |
| Mexican | 4 | 0.1% |
| Pennsylvania German | 45 | 1.2% |
| Polish | 199 | 5.1% |
| Portuguese | 13 | 0.3% |
| Puerto Rican | 33 | 0.9% |
| Russian | 6 | 0.2% |
| Scandinavian | 18 | 0.5% |
| Scotch-Irish | 76 | 1.9% |
| Scottish | 18 | 0.5% |
| Slavic | 7 | 0.2% |
| Slovak | 17 | 0.4% |
| Swedish | 21 | 0.5% |
| Thai | 4 | 0.1% |
| Ukrainian | 32 | 0.8% |
| Welsh | 51 | 1.3% | View All 28 Rows |
Immigrants in Northumberland borough
The most numerous immigrant groups reported in Northumberland borough came from Caribbean (20 | 0.5%), Dominican Republic (20 | 0.5%), Latin America (20 | 0.5%), Europe (18 | 0.5%), and Germany (18 | 0.5%), together accounting for 2.5% of all Northumberland borough residents.
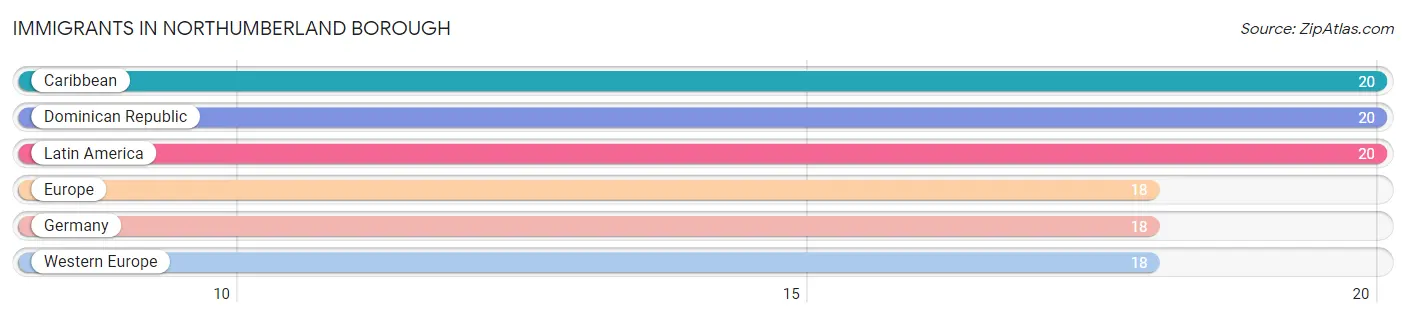
| Immigration Origin | # Population | % Population |
| Caribbean | 20 | 0.5% |
| Dominican Republic | 20 | 0.5% |
| Europe | 18 | 0.5% |
| Germany | 18 | 0.5% |
| Latin America | 20 | 0.5% |
| Western Europe | 18 | 0.5% | View All 6 Rows |
Sex and Age in Northumberland borough
Sex and Age in Northumberland borough
The most populous age groups in Northumberland borough are 10 to 14 Years (210 | 10.9%) for men and 30 to 34 Years (201 | 10.2%) for women.
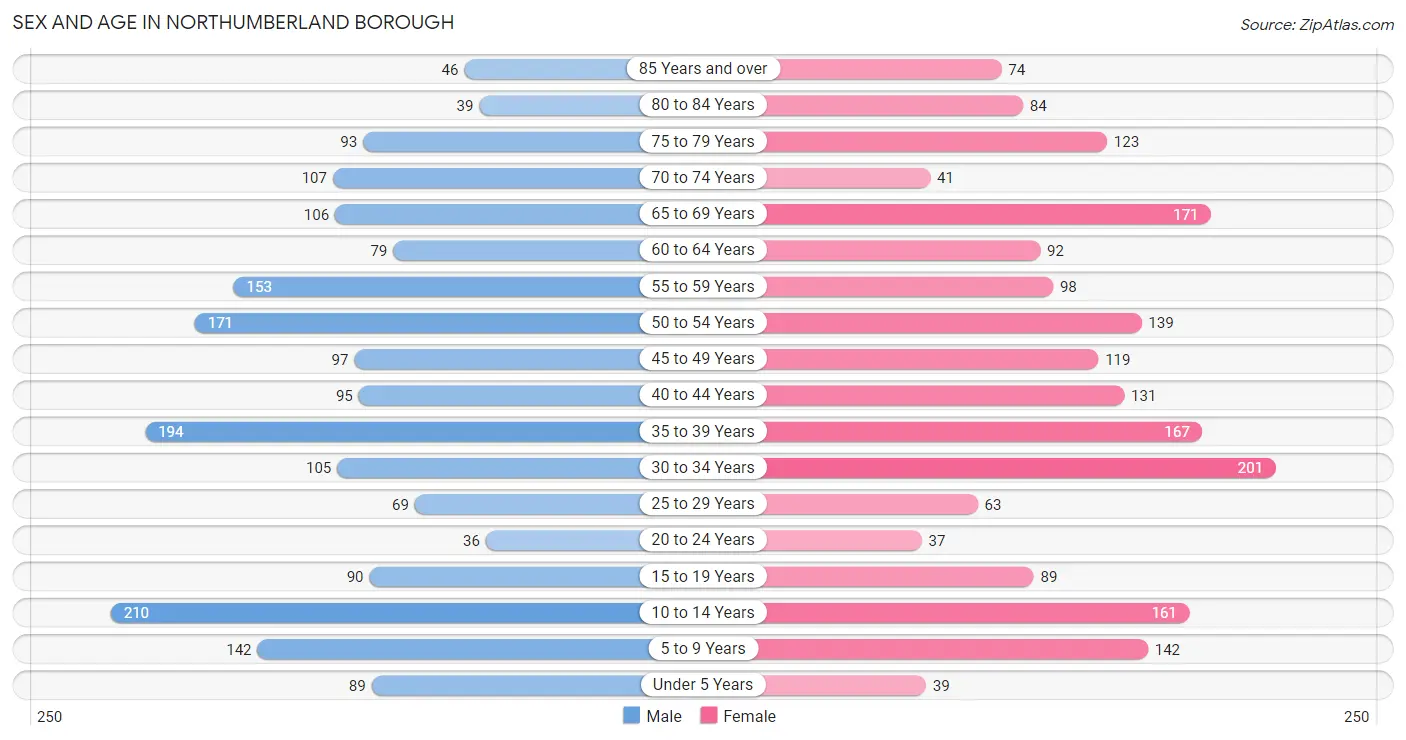
| Age Bracket | Male | Female |
| Under 5 Years | 89 (4.6%) | 39 (2.0%) |
| 5 to 9 Years | 142 (7.4%) | 142 (7.2%) |
| 10 to 14 Years | 210 (10.9%) | 161 (8.2%) |
| 15 to 19 Years | 90 (4.7%) | 89 (4.5%) |
| 20 to 24 Years | 36 (1.9%) | 37 (1.9%) |
| 25 to 29 Years | 69 (3.6%) | 63 (3.2%) |
| 30 to 34 Years | 105 (5.5%) | 201 (10.2%) |
| 35 to 39 Years | 194 (10.1%) | 167 (8.5%) |
| 40 to 44 Years | 95 (5.0%) | 131 (6.7%) |
| 45 to 49 Years | 97 (5.1%) | 119 (6.0%) |
| 50 to 54 Years | 171 (8.9%) | 139 (7.0%) |
| 55 to 59 Years | 153 (8.0%) | 98 (5.0%) |
| 60 to 64 Years | 79 (4.1%) | 92 (4.7%) |
| 65 to 69 Years | 106 (5.5%) | 171 (8.7%) |
| 70 to 74 Years | 107 (5.6%) | 41 (2.1%) |
| 75 to 79 Years | 93 (4.8%) | 123 (6.2%) |
| 80 to 84 Years | 39 (2.0%) | 84 (4.3%) |
| 85 Years and over | 46 (2.4%) | 74 (3.7%) |
| Total | 1,921 (100.0%) | 1,971 (100.0%) |
Families and Households in Northumberland borough
Median Family Size in Northumberland borough
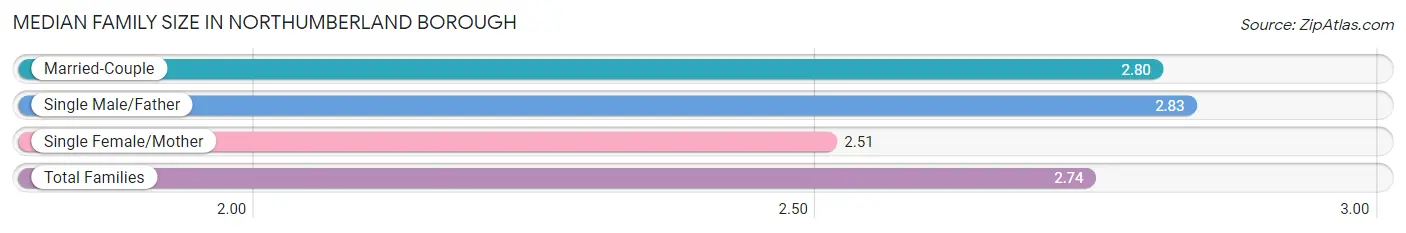
The median family size in Northumberland borough is 2.74 persons per family, with single male/father families (60 | 5.6%) accounting for the largest median family size of 2.83 persons per family. On the other hand, single female/mother families (211 | 19.8%) represent the smallest median family size with 2.51 persons per family.
| Family Type | # Families | Family Size |
| Married-Couple | 794 (74.6%) | 2.80 |
| Single Male/Father | 60 (5.6%) | 2.83 |
| Single Female/Mother | 211 (19.8%) | 2.51 |
| Total Families | 1,065 (100.0%) | 2.74 |
Median Household Size in Northumberland borough
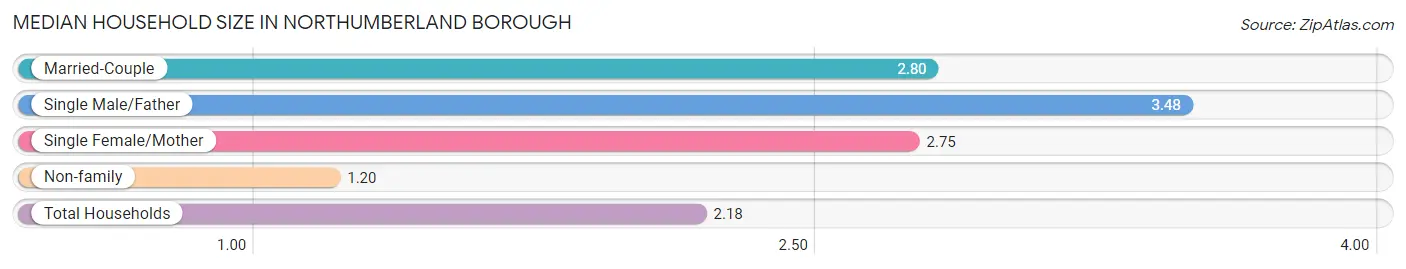
The median household size in Northumberland borough is 2.18 persons per household, with single male/father households (60 | 3.4%) accounting for the largest median household size of 3.48 persons per household. non-family households (708 | 39.9%) represent the smallest median household size with 1.20 persons per household.
| Household Type | # Households | Household Size |
| Married-Couple | 794 (44.8%) | 2.80 |
| Single Male/Father | 60 (3.4%) | 3.48 |
| Single Female/Mother | 211 (11.9%) | 2.75 |
| Non-family | 708 (39.9%) | 1.20 |
| Total Households | 1,773 (100.0%) | 2.18 |
Household Size by Marriage Status in Northumberland borough
Out of a total of 1,773 households in Northumberland borough, 1,065 (60.1%) are family households, while 708 (39.9%) are nonfamily households. The most numerous type of family households are 2-person households, comprising 550, and the most common type of nonfamily households are 1-person households, comprising 581.
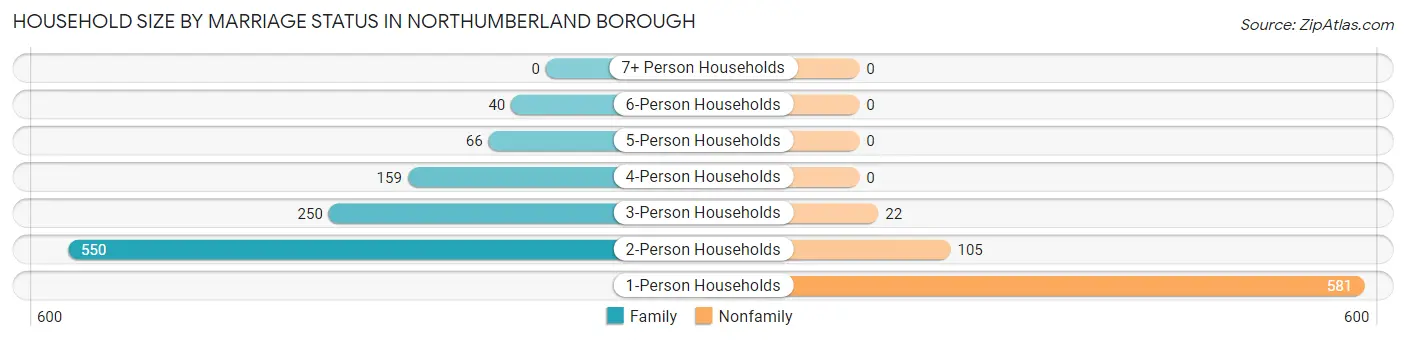
| Household Size | Family Households | Nonfamily Households |
| 1-Person Households | - | 581 (32.8%) |
| 2-Person Households | 550 (31.0%) | 105 (5.9%) |
| 3-Person Households | 250 (14.1%) | 22 (1.2%) |
| 4-Person Households | 159 (9.0%) | 0 (0.0%) |
| 5-Person Households | 66 (3.7%) | 0 (0.0%) |
| 6-Person Households | 40 (2.3%) | 0 (0.0%) |
| 7+ Person Households | 0 (0.0%) | 0 (0.0%) |
| Total | 1,065 (60.1%) | 708 (39.9%) |
Female Fertility in Northumberland borough
Fertility by Age in Northumberland borough
Average fertility rate in Northumberland borough is 19.0 births per 1,000 women. Women in the age bracket of 20 to 34 years have the highest fertility rate with 53.0 births per 1,000 women. Women in the age bracket of 20 to 34 years acount for 100.0% of all women with births.
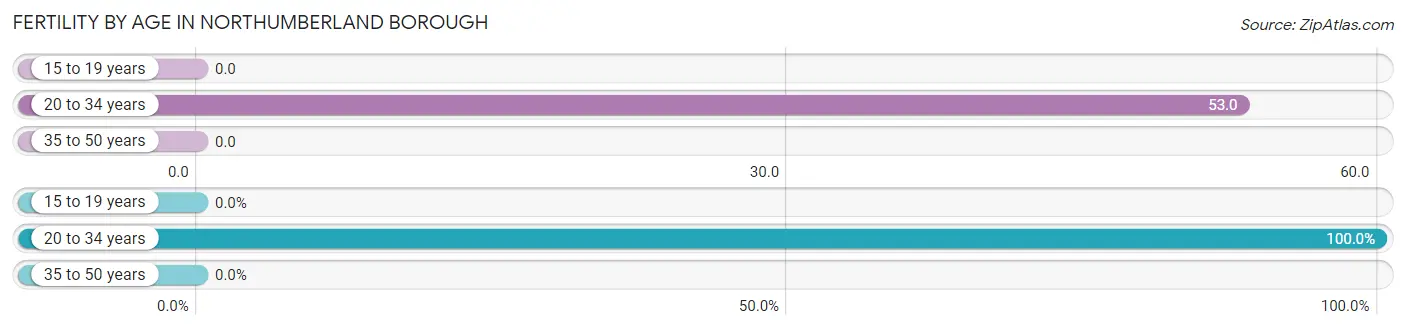
| Age Bracket | Women with Births | Births / 1,000 Women |
| 15 to 19 years | 0 (0.0%) | 0.0 |
| 20 to 34 years | 16 (100.0%) | 53.0 |
| 35 to 50 years | 0 (0.0%) | 0.0 |
| Total | 16 (100.0%) | 19.0 |
Fertility by Age by Marriage Status in Northumberland borough
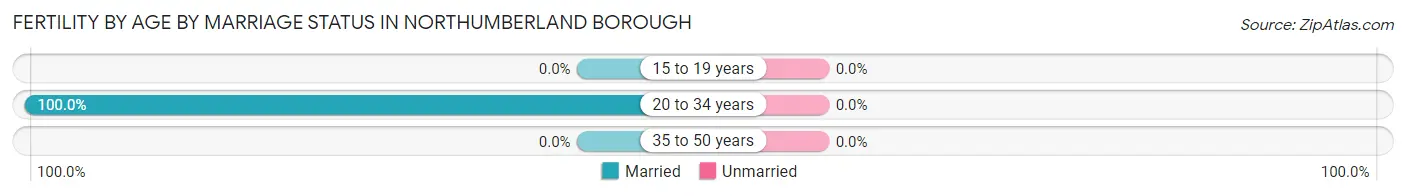
| Age Bracket | Married | Unmarried |
| 15 to 19 years | 0 (0.0%) | 0 (0.0%) |
| 20 to 34 years | 16 (100.0%) | 0 (0.0%) |
| 35 to 50 years | 0 (0.0%) | 0 (0.0%) |
| Total | 16 (100.0%) | 0 (0.0%) |
Fertility by Education in Northumberland borough
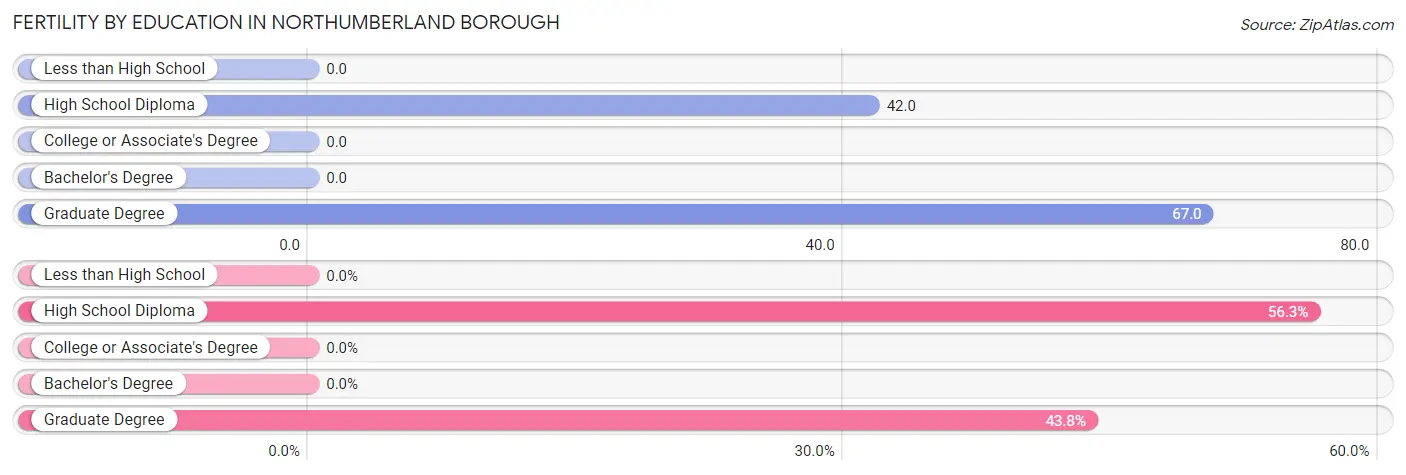
| Educational Attainment | Women with Births | Births / 1,000 Women |
| Less than High School | 0 (0.0%) | 0.0 |
| High School Diploma | 9 (56.2%) | 42.0 |
| College or Associate's Degree | 0 (0.0%) | 0.0 |
| Bachelor's Degree | 0 (0.0%) | 0.0 |
| Graduate Degree | 7 (43.8%) | 67.0 |
| Total | 16 (100.0%) | 19.0 |
Fertility by Education by Marriage Status in Northumberland borough
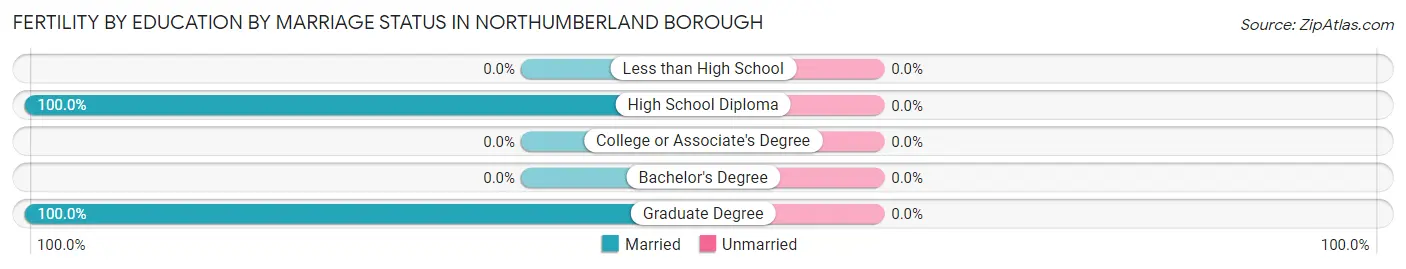
| Educational Attainment | Married | Unmarried |
| Less than High School | 0 (0.0%) | 0 (0.0%) |
| High School Diploma | 9 (100.0%) | 0 (0.0%) |
| College or Associate's Degree | 0 (0.0%) | 0 (0.0%) |
| Bachelor's Degree | 0 (0.0%) | 0 (0.0%) |
| Graduate Degree | 7 (100.0%) | 0 (0.0%) |
| Total | 16 (100.0%) | 0 (0.0%) |
Employment Characteristics in Northumberland borough
Employment by Class of Employer in Northumberland borough
Among the 1,873 employed individuals in Northumberland borough, private company employees (1,307 | 69.8%), not-for-profit organizations (206 | 11.0%), and self-employed (not incorporated) (133 | 7.1%) make up the most common classes of employment.
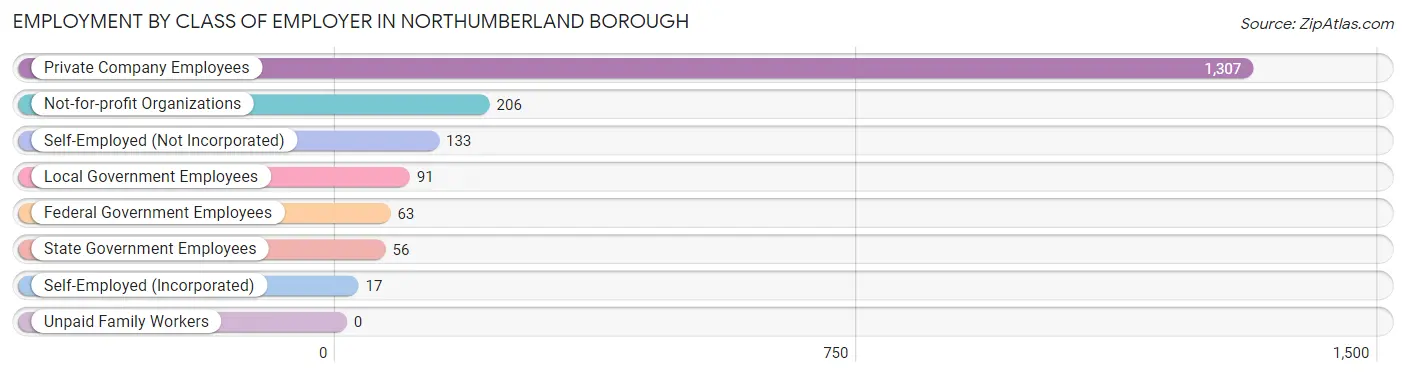
| Employer Class | # Employees | % Employees |
| Private Company Employees | 1,307 | 69.8% |
| Self-Employed (Incorporated) | 17 | 0.9% |
| Self-Employed (Not Incorporated) | 133 | 7.1% |
| Not-for-profit Organizations | 206 | 11.0% |
| Local Government Employees | 91 | 4.9% |
| State Government Employees | 56 | 3.0% |
| Federal Government Employees | 63 | 3.4% |
| Unpaid Family Workers | 0 | 0.0% |
| Total | 1,873 | 100.0% |
Employment Status by Age in Northumberland borough
According to the labor force statistics for Northumberland borough, out of the total population over 16 years of age (3,074), 65.9% or 2,026 individuals are in the labor force, with 1.4% or 28 of them unemployed. The age group with the highest labor force participation rate is 20 to 24 years, with 100.0% or 73 individuals in the labor force. Within the labor force, the 35 to 44 years age range has the highest percentage of unemployed individuals, with 3.0% or 16 of them being unemployed.
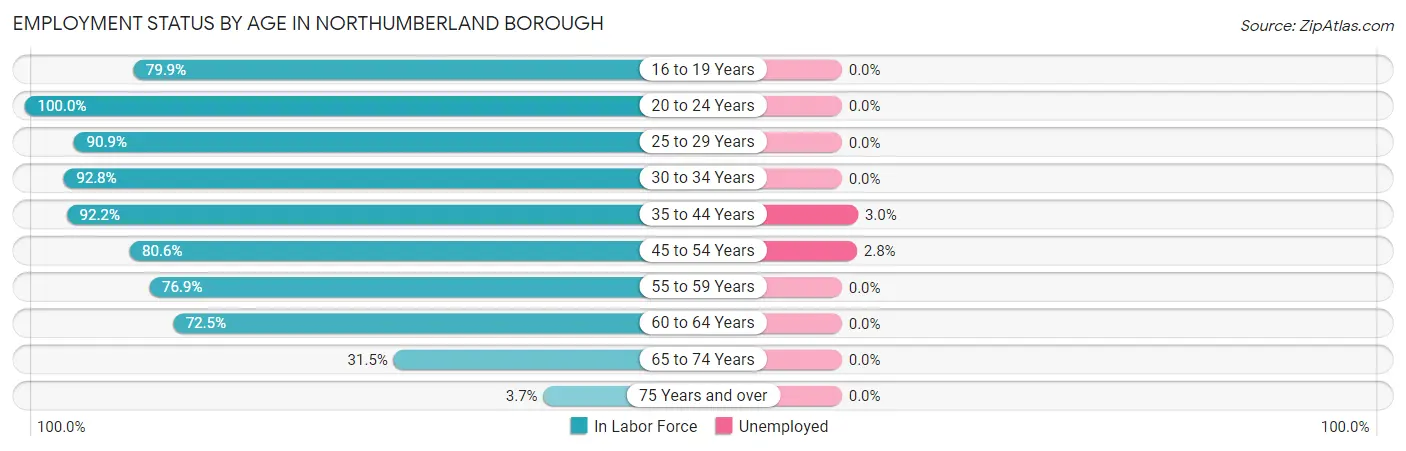
| Age Bracket | In Labor Force | Unemployed |
| 16 to 19 Years | 115 (79.9%) | 0 (0.0%) |
| 20 to 24 Years | 73 (100.0%) | 0 (0.0%) |
| 25 to 29 Years | 120 (90.9%) | 0 (0.0%) |
| 30 to 34 Years | 284 (92.8%) | 0 (0.0%) |
| 35 to 44 Years | 541 (92.2%) | 16 (3.0%) |
| 45 to 54 Years | 424 (80.6%) | 12 (2.8%) |
| 55 to 59 Years | 193 (76.9%) | 0 (0.0%) |
| 60 to 64 Years | 124 (72.5%) | 0 (0.0%) |
| 65 to 74 Years | 134 (31.5%) | 0 (0.0%) |
| 75 Years and over | 17 (3.7%) | 0 (0.0%) |
| Total | 2,026 (65.9%) | 28 (1.4%) |
Employment Status by Educational Attainment in Northumberland borough
According to labor force statistics for Northumberland borough, 85.5% of individuals (1,687) out of the total population between 25 and 64 years of age (1,973) are in the labor force, with 1.7% or 29 of them being unemployed. The group with the highest labor force participation rate are those with the educational attainment of college / associate degree, with 94.2% or 572 individuals in the labor force. Within the labor force, individuals with bachelor's degree or higher education have the highest percentage of unemployment, with 4.9% or 21 of them being unemployed.
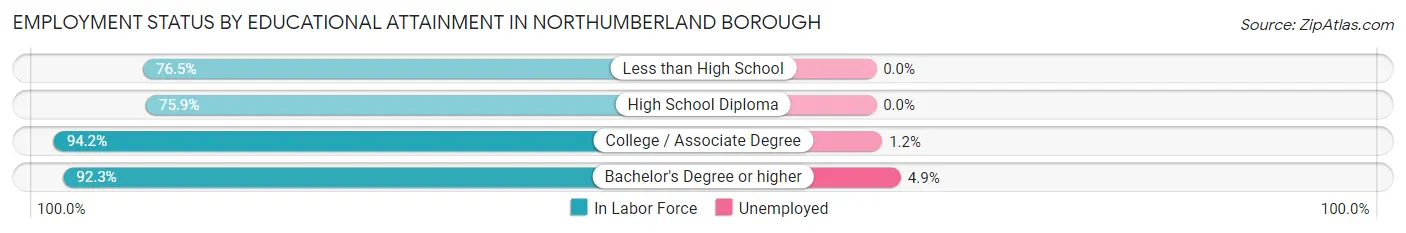
| Educational Attainment | In Labor Force | Unemployed |
| Less than High School | 137 (76.5%) | 0 (0.0%) |
| High School Diploma | 548 (75.9%) | 0 (0.0%) |
| College / Associate Degree | 572 (94.2%) | 7 (1.2%) |
| Bachelor's Degree or higher | 429 (92.3%) | 23 (4.9%) |
| Total | 1,687 (85.5%) | 34 (1.7%) |
Employment Occupations by Sex in Northumberland borough
Management, Business, Science and Arts Occupations
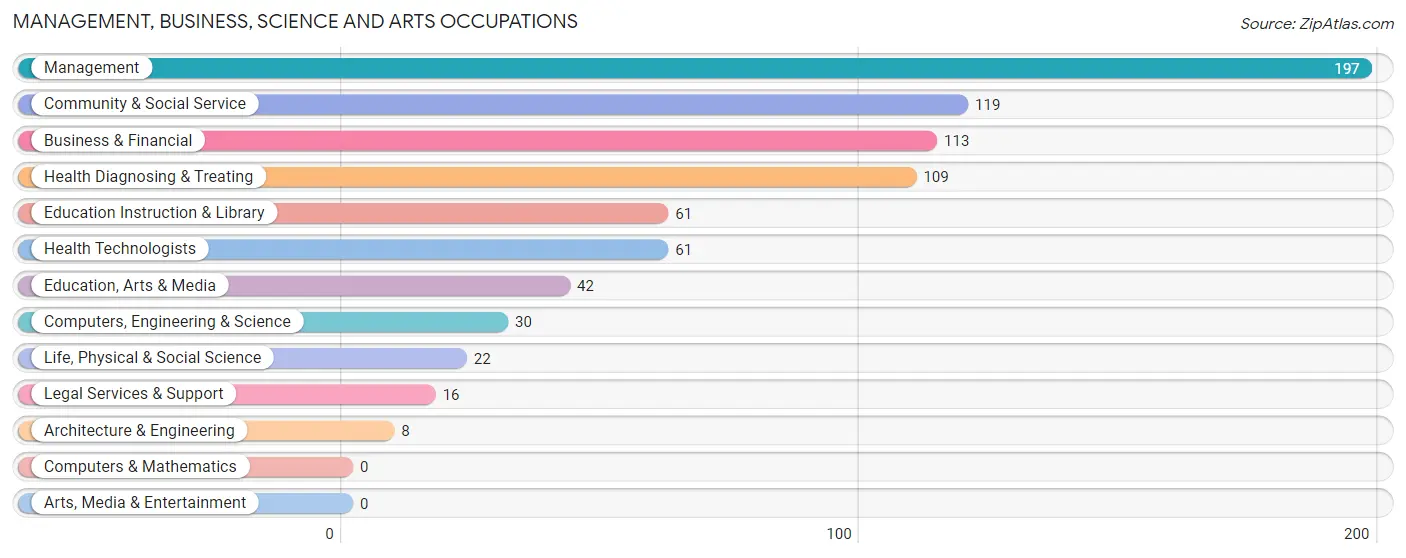
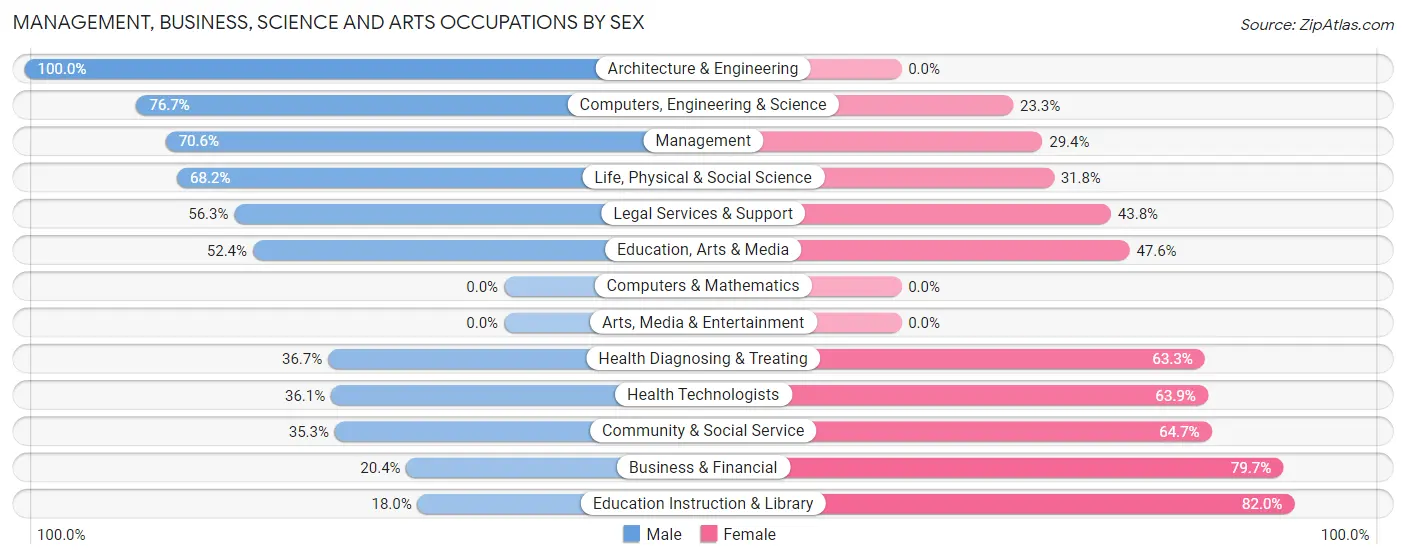
The most common Management, Business, Science and Arts occupations in Northumberland borough are Management (197 | 9.9%), Community & Social Service (119 | 6.0%), Business & Financial (113 | 5.7%), Health Diagnosing & Treating (109 | 5.5%), and Education Instruction & Library (61 | 3.0%).
Management, Business, Science and Arts Occupations by Sex
Within the Management, Business, Science and Arts occupations in Northumberland borough, the most male-oriented occupations are Architecture & Engineering (100.0%), Computers, Engineering & Science (76.7%), and Management (70.6%), while the most female-oriented occupations are Education Instruction & Library (82.0%), Business & Financial (79.6%), and Community & Social Service (64.7%).
| Occupation | Male | Female |
| Management | 139 (70.6%) | 58 (29.4%) |
| Business & Financial | 23 (20.3%) | 90 (79.6%) |
| Computers, Engineering & Science | 23 (76.7%) | 7 (23.3%) |
| Computers & Mathematics | 0 (0.0%) | 0 (0.0%) |
| Architecture & Engineering | 8 (100.0%) | 0 (0.0%) |
| Life, Physical & Social Science | 15 (68.2%) | 7 (31.8%) |
| Community & Social Service | 42 (35.3%) | 77 (64.7%) |
| Education, Arts & Media | 22 (52.4%) | 20 (47.6%) |
| Legal Services & Support | 9 (56.2%) | 7 (43.8%) |
| Education Instruction & Library | 11 (18.0%) | 50 (82.0%) |
| Arts, Media & Entertainment | 0 (0.0%) | 0 (0.0%) |
| Health Diagnosing & Treating | 40 (36.7%) | 69 (63.3%) |
| Health Technologists | 22 (36.1%) | 39 (63.9%) |
| Total (Category) | 267 (47.0%) | 301 (53.0%) |
| Total (Overall) | 995 (49.8%) | 1,002 (50.2%) |
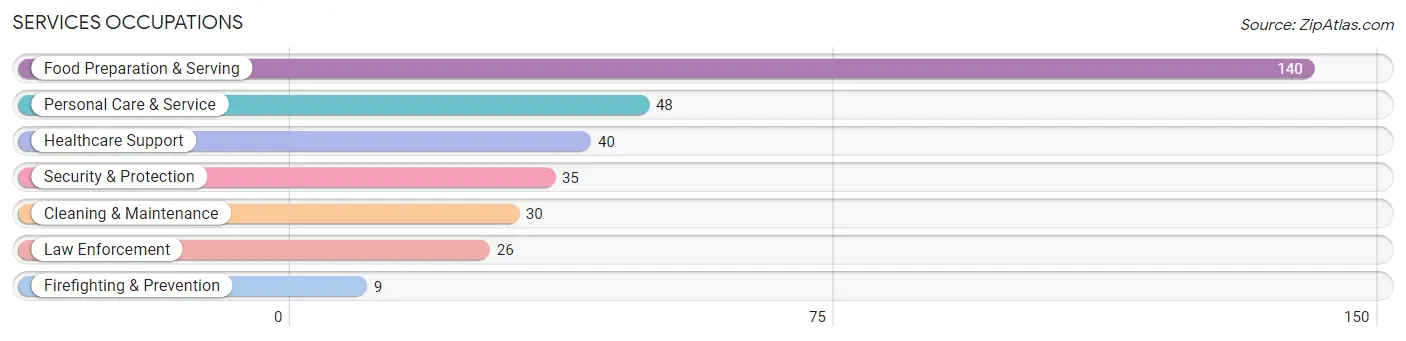
Services Occupations
The most common Services occupations in Northumberland borough are Food Preparation & Serving (140 | 7.0%), Personal Care & Service (48 | 2.4%), Healthcare Support (40 | 2.0%), Security & Protection (35 | 1.8%), and Cleaning & Maintenance (30 | 1.5%).
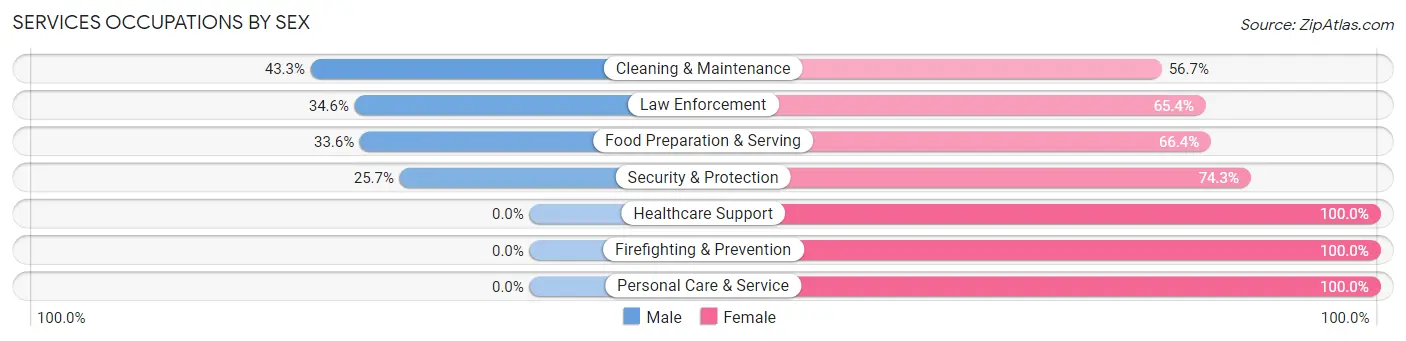
Services Occupations by Sex
Within the Services occupations in Northumberland borough, the most male-oriented occupations are Cleaning & Maintenance (43.3%), Law Enforcement (34.6%), and Food Preparation & Serving (33.6%), while the most female-oriented occupations are Healthcare Support (100.0%), Firefighting & Prevention (100.0%), and Personal Care & Service (100.0%).
| Occupation | Male | Female |
| Healthcare Support | 0 (0.0%) | 40 (100.0%) |
| Security & Protection | 9 (25.7%) | 26 (74.3%) |
| Firefighting & Prevention | 0 (0.0%) | 9 (100.0%) |
| Law Enforcement | 9 (34.6%) | 17 (65.4%) |
| Food Preparation & Serving | 47 (33.6%) | 93 (66.4%) |
| Cleaning & Maintenance | 13 (43.3%) | 17 (56.7%) |
| Personal Care & Service | 0 (0.0%) | 48 (100.0%) |
| Total (Category) | 69 (23.5%) | 224 (76.4%) |
| Total (Overall) | 995 (49.8%) | 1,002 (50.2%) |
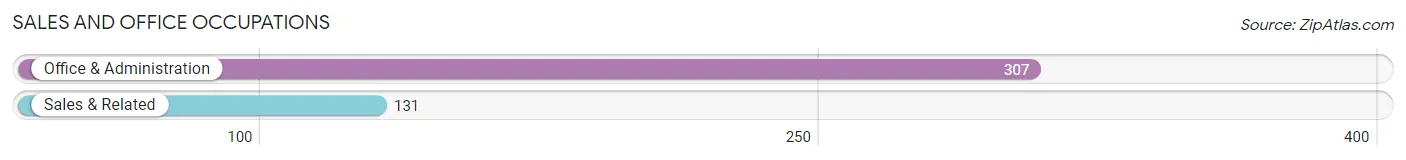
Sales and Office Occupations
The most common Sales and Office occupations in Northumberland borough are Office & Administration (307 | 15.4%), and Sales & Related (131 | 6.6%).
Sales and Office Occupations by Sex
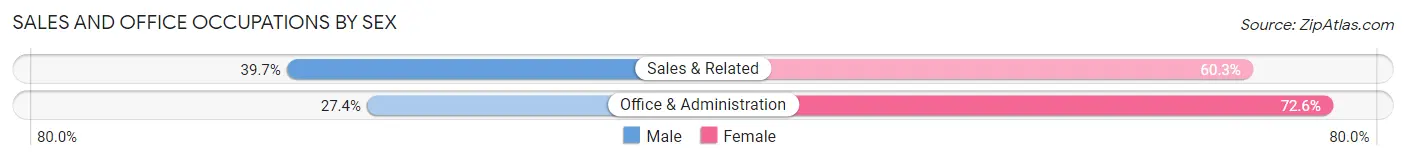
| Occupation | Male | Female |
| Sales & Related | 52 (39.7%) | 79 (60.3%) |
| Office & Administration | 84 (27.4%) | 223 (72.6%) |
| Total (Category) | 136 (31.0%) | 302 (69.0%) |
| Total (Overall) | 995 (49.8%) | 1,002 (50.2%) |
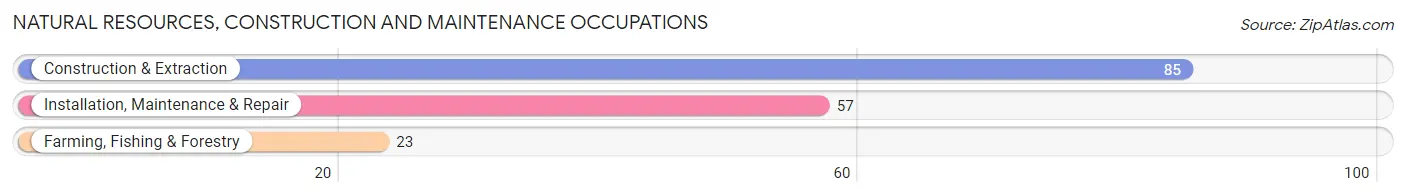
Natural Resources, Construction and Maintenance Occupations
The most common Natural Resources, Construction and Maintenance occupations in Northumberland borough are Construction & Extraction (85 | 4.3%), Installation, Maintenance & Repair (57 | 2.9%), and Farming, Fishing & Forestry (23 | 1.1%).
Natural Resources, Construction and Maintenance Occupations by Sex
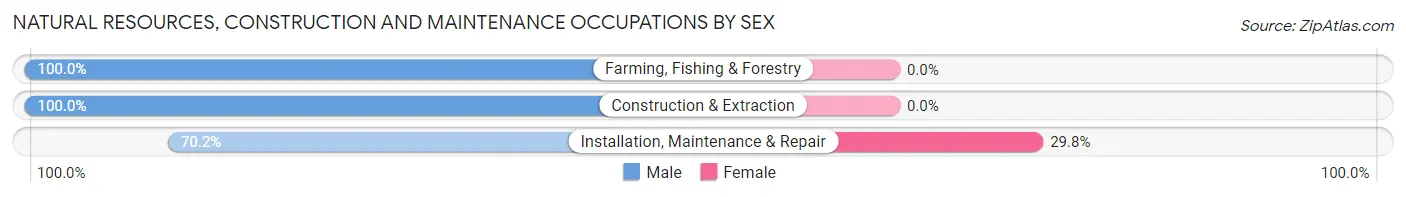
| Occupation | Male | Female |
| Farming, Fishing & Forestry | 23 (100.0%) | 0 (0.0%) |
| Construction & Extraction | 85 (100.0%) | 0 (0.0%) |
| Installation, Maintenance & Repair | 40 (70.2%) | 17 (29.8%) |
| Total (Category) | 148 (89.7%) | 17 (10.3%) |
| Total (Overall) | 995 (49.8%) | 1,002 (50.2%) |
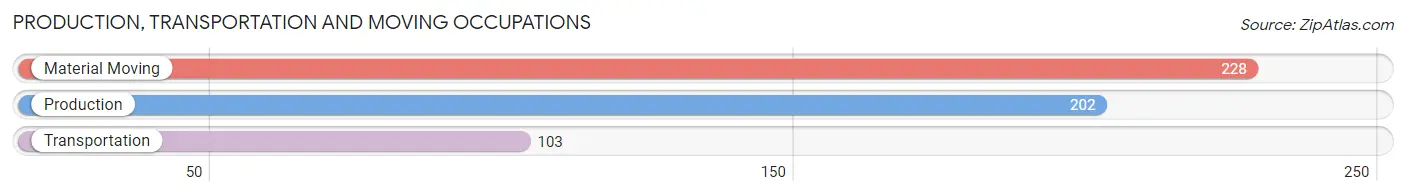
Production, Transportation and Moving Occupations
The most common Production, Transportation and Moving occupations in Northumberland borough are Material Moving (228 | 11.4%), Production (202 | 10.1%), and Transportation (103 | 5.2%).
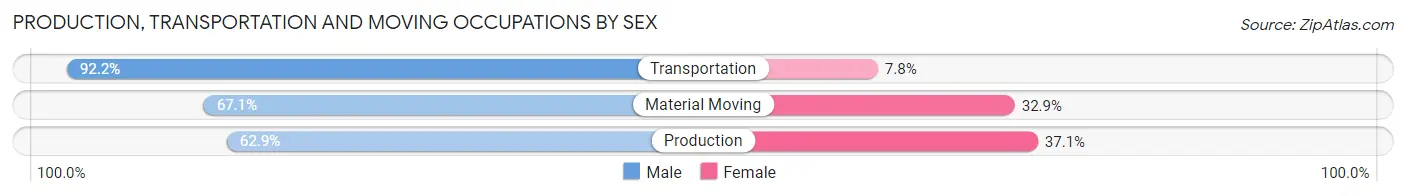
Production, Transportation and Moving Occupations by Sex
| Occupation | Male | Female |
| Production | 127 (62.9%) | 75 (37.1%) |
| Transportation | 95 (92.2%) | 8 (7.8%) |
| Material Moving | 153 (67.1%) | 75 (32.9%) |
| Total (Category) | 375 (70.4%) | 158 (29.6%) |
| Total (Overall) | 995 (49.8%) | 1,002 (50.2%) |
Employment Industries by Sex in Northumberland borough
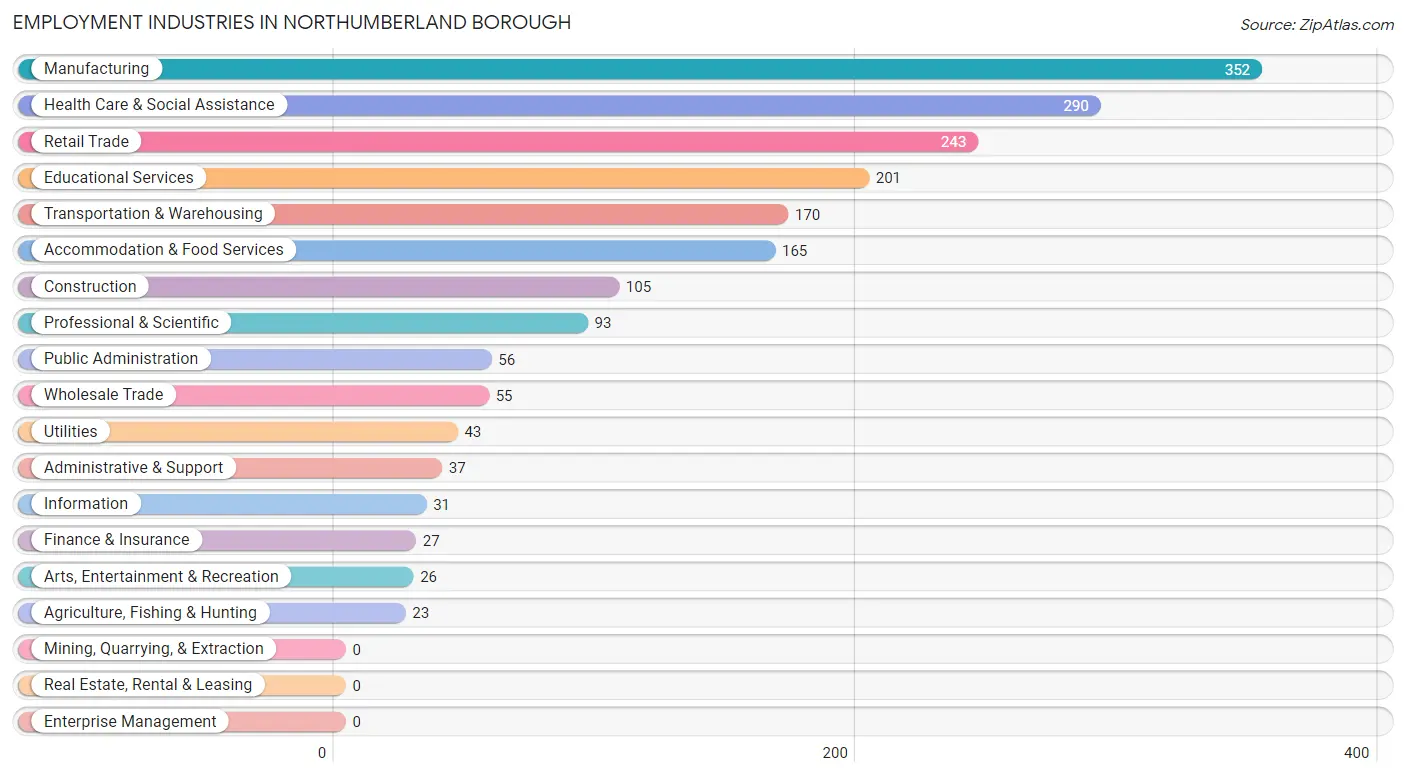
Employment Industries in Northumberland borough
The major employment industries in Northumberland borough include Manufacturing (352 | 17.6%), Health Care & Social Assistance (290 | 14.5%), Retail Trade (243 | 12.2%), Educational Services (201 | 10.1%), and Transportation & Warehousing (170 | 8.5%).
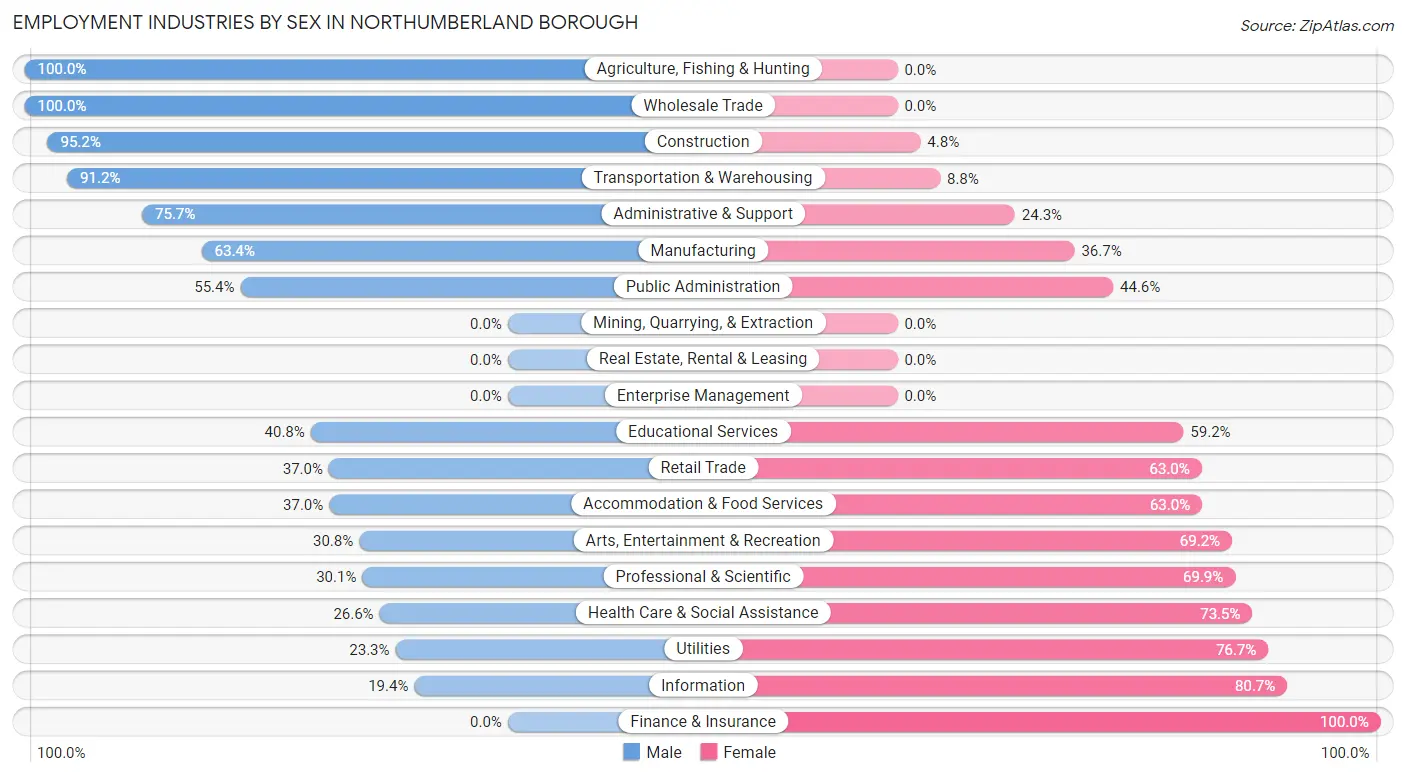
Employment Industries by Sex in Northumberland borough
The Northumberland borough industries that see more men than women are Agriculture, Fishing & Hunting (100.0%), Wholesale Trade (100.0%), and Construction (95.2%), whereas the industries that tend to have a higher number of women are Finance & Insurance (100.0%), Information (80.6%), and Utilities (76.7%).
| Industry | Male | Female |
| Agriculture, Fishing & Hunting | 23 (100.0%) | 0 (0.0%) |
| Mining, Quarrying, & Extraction | 0 (0.0%) | 0 (0.0%) |
| Construction | 100 (95.2%) | 5 (4.8%) |
| Manufacturing | 223 (63.3%) | 129 (36.6%) |
| Wholesale Trade | 55 (100.0%) | 0 (0.0%) |
| Retail Trade | 90 (37.0%) | 153 (63.0%) |
| Transportation & Warehousing | 155 (91.2%) | 15 (8.8%) |
| Utilities | 10 (23.3%) | 33 (76.7%) |
| Information | 6 (19.4%) | 25 (80.6%) |
| Finance & Insurance | 0 (0.0%) | 27 (100.0%) |
| Real Estate, Rental & Leasing | 0 (0.0%) | 0 (0.0%) |
| Professional & Scientific | 28 (30.1%) | 65 (69.9%) |
| Enterprise Management | 0 (0.0%) | 0 (0.0%) |
| Administrative & Support | 28 (75.7%) | 9 (24.3%) |
| Educational Services | 82 (40.8%) | 119 (59.2%) |
| Health Care & Social Assistance | 77 (26.6%) | 213 (73.5%) |
| Arts, Entertainment & Recreation | 8 (30.8%) | 18 (69.2%) |
| Accommodation & Food Services | 61 (37.0%) | 104 (63.0%) |
| Public Administration | 31 (55.4%) | 25 (44.6%) |
| Total | 995 (49.8%) | 1,002 (50.2%) |
Education in Northumberland borough
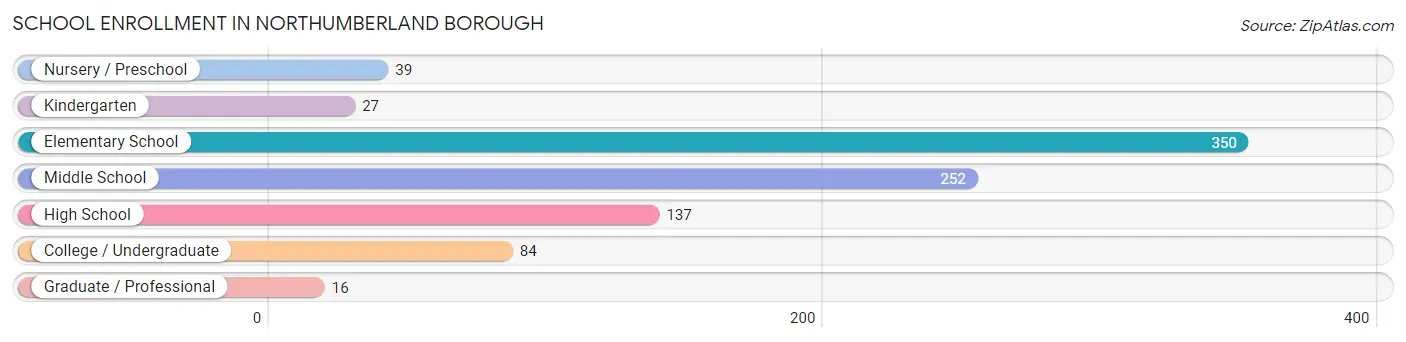
School Enrollment in Northumberland borough
The most common levels of schooling among the 905 students in Northumberland borough are elementary school (350 | 38.7%), middle school (252 | 27.9%), and high school (137 | 15.1%).
| School Level | # Students | % Students |
| Nursery / Preschool | 39 | 4.3% |
| Kindergarten | 27 | 3.0% |
| Elementary School | 350 | 38.7% |
| Middle School | 252 | 27.9% |
| High School | 137 | 15.1% |
| College / Undergraduate | 84 | 9.3% |
| Graduate / Professional | 16 | 1.8% |
| Total | 905 | 100.0% |
School Enrollment by Age by Funding Source in Northumberland borough
Out of a total of 905 students who are enrolled in schools in Northumberland borough, 87 (9.6%) attend a private institution, while the remaining 818 (90.4%) are enrolled in public schools. The age group of 3 to 4 year olds has the highest likelihood of being enrolled in private schools, with 25 (78.1% in the age bracket) enrolled. Conversely, the age group of 18 to 19 year olds has the lowest likelihood of being enrolled in a private school, with 39 (100.0% in the age bracket) attending a public institution.
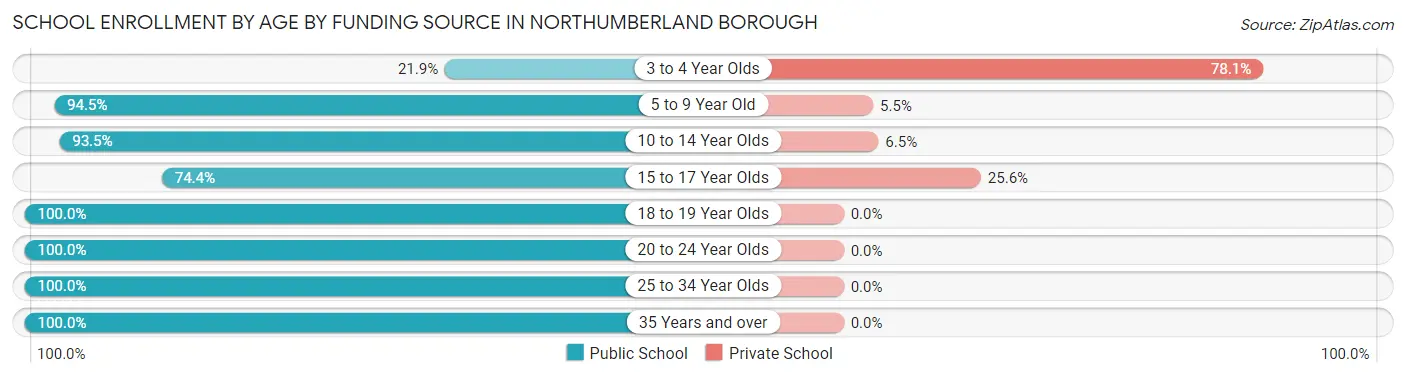
| Age Bracket | Public School | Private School |
| 3 to 4 Year Olds | 7 (21.9%) | 25 (78.1%) |
| 5 to 9 Year Old | 258 (94.5%) | 15 (5.5%) |
| 10 to 14 Year Olds | 347 (93.5%) | 24 (6.5%) |
| 15 to 17 Year Olds | 67 (74.4%) | 23 (25.6%) |
| 18 to 19 Year Olds | 39 (100.0%) | 0 (0.0%) |
| 20 to 24 Year Olds | 10 (100.0%) | 0 (0.0%) |
| 25 to 34 Year Olds | 40 (100.0%) | 0 (0.0%) |
| 35 Years and over | 50 (100.0%) | 0 (0.0%) |
| Total | 818 (90.4%) | 87 (9.6%) |
Educational Attainment by Field of Study in Northumberland borough
Education (151 | 23.2%), social sciences (85 | 13.1%), science & technology (81 | 12.4%), literature & languages (60 | 9.2%), and arts & humanities (53 | 8.1%) are the most common fields of study among 651 individuals in Northumberland borough who have obtained a bachelor's degree or higher.
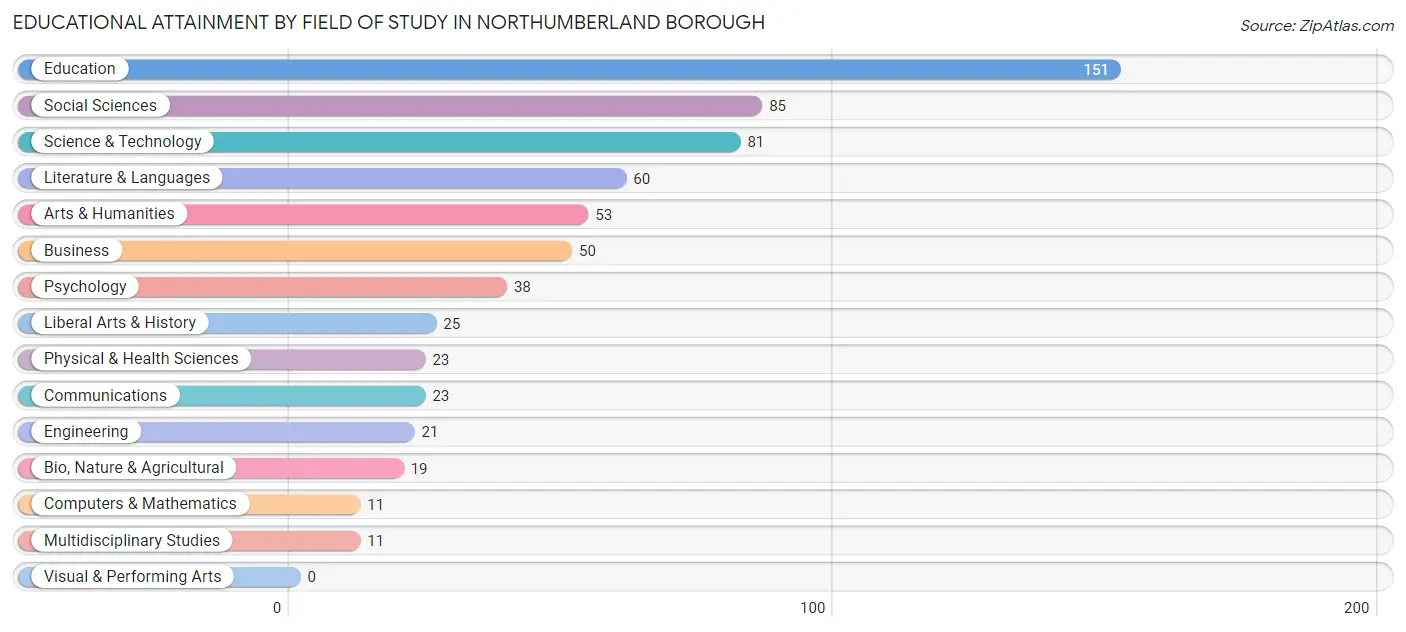
| Field of Study | # Graduates | % Graduates |
| Computers & Mathematics | 11 | 1.7% |
| Bio, Nature & Agricultural | 19 | 2.9% |
| Physical & Health Sciences | 23 | 3.5% |
| Psychology | 38 | 5.8% |
| Social Sciences | 85 | 13.1% |
| Engineering | 21 | 3.2% |
| Multidisciplinary Studies | 11 | 1.7% |
| Science & Technology | 81 | 12.4% |
| Business | 50 | 7.7% |
| Education | 151 | 23.2% |
| Literature & Languages | 60 | 9.2% |
| Liberal Arts & History | 25 | 3.8% |
| Visual & Performing Arts | 0 | 0.0% |
| Communications | 23 | 3.5% |
| Arts & Humanities | 53 | 8.1% |
| Total | 651 | 100.0% |
Transportation & Commute in Northumberland borough
Vehicle Availability by Sex in Northumberland borough
The most prevalent vehicle ownership categories in Northumberland borough are males with 2 vehicles (457, accounting for 48.7%) and females with 2 vehicles (430, making up 48.9%).
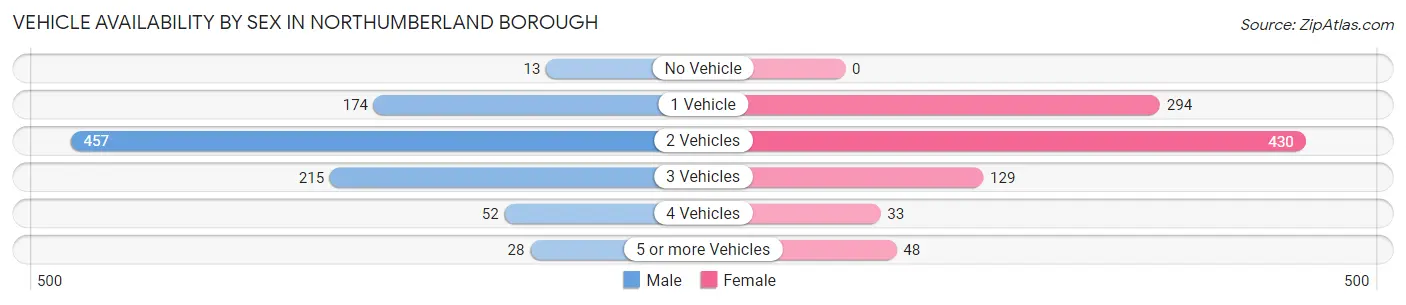
| Vehicles Available | Male | Female |
| No Vehicle | 13 (1.4%) | 0 (0.0%) |
| 1 Vehicle | 174 (18.5%) | 294 (31.5%) |
| 2 Vehicles | 457 (48.7%) | 430 (46.0%) |
| 3 Vehicles | 215 (22.9%) | 129 (13.8%) |
| 4 Vehicles | 52 (5.5%) | 33 (3.5%) |
| 5 or more Vehicles | 28 (3.0%) | 48 (5.1%) |
| Total | 939 (100.0%) | 934 (100.0%) |
Commute Time in Northumberland borough
The most frequently occuring commute durations in Northumberland borough are 15 to 19 minutes (441 commuters, 25.6%), 5 to 9 minutes (286 commuters, 16.6%), and 20 to 24 minutes (247 commuters, 14.4%).
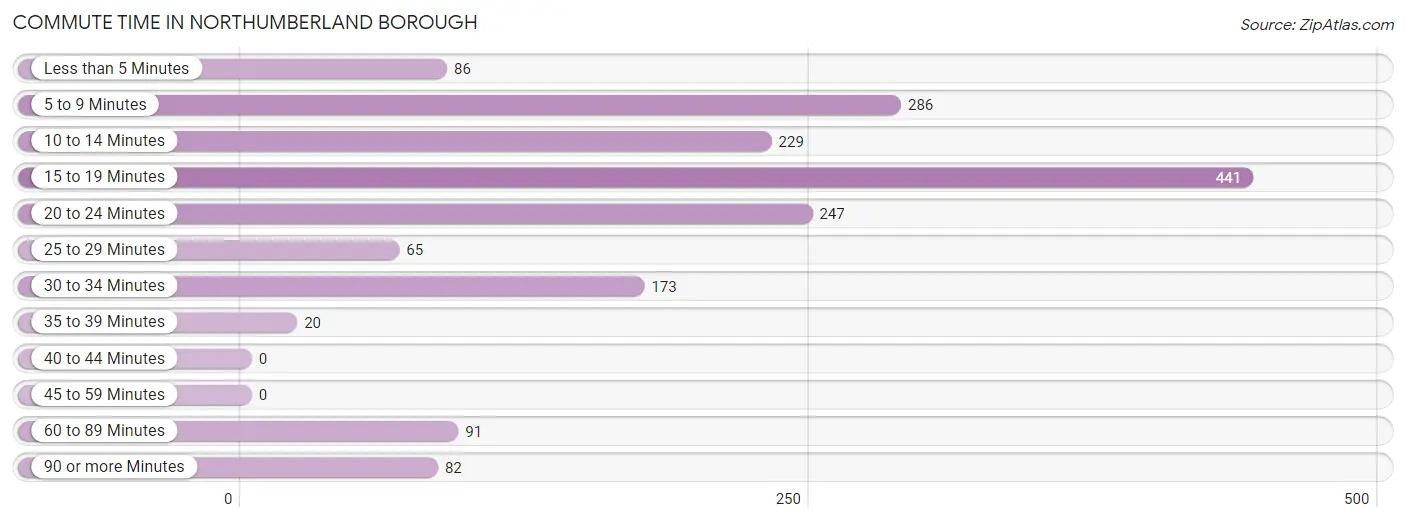
| Commute Time | # Commuters | % Commuters |
| Less than 5 Minutes | 86 | 5.0% |
| 5 to 9 Minutes | 286 | 16.6% |
| 10 to 14 Minutes | 229 | 13.3% |
| 15 to 19 Minutes | 441 | 25.6% |
| 20 to 24 Minutes | 247 | 14.4% |
| 25 to 29 Minutes | 65 | 3.8% |
| 30 to 34 Minutes | 173 | 10.1% |
| 35 to 39 Minutes | 20 | 1.2% |
| 40 to 44 Minutes | 0 | 0.0% |
| 45 to 59 Minutes | 0 | 0.0% |
| 60 to 89 Minutes | 91 | 5.3% |
| 90 or more Minutes | 82 | 4.8% |
Commute Time by Sex in Northumberland borough
The most common commute times in Northumberland borough are 15 to 19 minutes (239 commuters, 26.4%) for males and 15 to 19 minutes (202 commuters, 24.8%) for females.
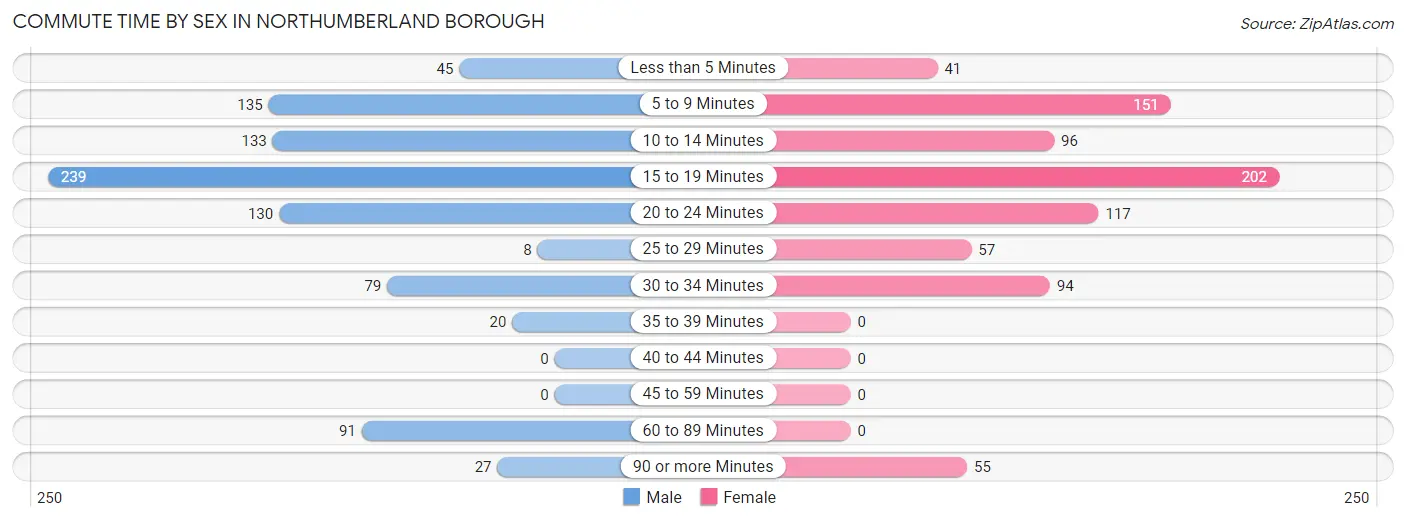
| Commute Time | Male | Female |
| Less than 5 Minutes | 45 (5.0%) | 41 (5.0%) |
| 5 to 9 Minutes | 135 (14.9%) | 151 (18.6%) |
| 10 to 14 Minutes | 133 (14.7%) | 96 (11.8%) |
| 15 to 19 Minutes | 239 (26.4%) | 202 (24.8%) |
| 20 to 24 Minutes | 130 (14.3%) | 117 (14.4%) |
| 25 to 29 Minutes | 8 (0.9%) | 57 (7.0%) |
| 30 to 34 Minutes | 79 (8.7%) | 94 (11.6%) |
| 35 to 39 Minutes | 20 (2.2%) | 0 (0.0%) |
| 40 to 44 Minutes | 0 (0.0%) | 0 (0.0%) |
| 45 to 59 Minutes | 0 (0.0%) | 0 (0.0%) |
| 60 to 89 Minutes | 91 (10.0%) | 0 (0.0%) |
| 90 or more Minutes | 27 (3.0%) | 55 (6.8%) |
Time of Departure to Work by Sex in Northumberland borough
The most frequent times of departure to work in Northumberland borough are 7:00 AM to 7:29 AM (177, 19.5%) for males and 7:00 AM to 7:29 AM (145, 17.8%) for females.
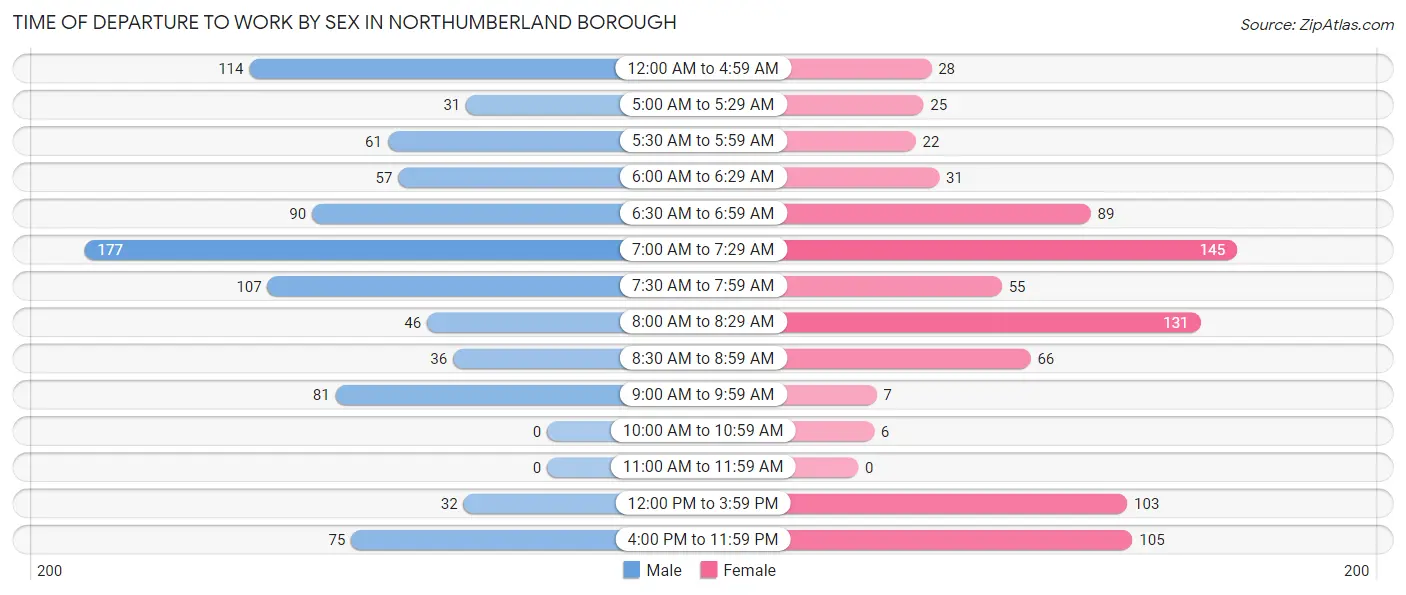
| Time of Departure | Male | Female |
| 12:00 AM to 4:59 AM | 114 (12.6%) | 28 (3.4%) |
| 5:00 AM to 5:29 AM | 31 (3.4%) | 25 (3.1%) |
| 5:30 AM to 5:59 AM | 61 (6.7%) | 22 (2.7%) |
| 6:00 AM to 6:29 AM | 57 (6.3%) | 31 (3.8%) |
| 6:30 AM to 6:59 AM | 90 (9.9%) | 89 (11.0%) |
| 7:00 AM to 7:29 AM | 177 (19.5%) | 145 (17.8%) |
| 7:30 AM to 7:59 AM | 107 (11.8%) | 55 (6.8%) |
| 8:00 AM to 8:29 AM | 46 (5.1%) | 131 (16.1%) |
| 8:30 AM to 8:59 AM | 36 (4.0%) | 66 (8.1%) |
| 9:00 AM to 9:59 AM | 81 (8.9%) | 7 (0.9%) |
| 10:00 AM to 10:59 AM | 0 (0.0%) | 6 (0.7%) |
| 11:00 AM to 11:59 AM | 0 (0.0%) | 0 (0.0%) |
| 12:00 PM to 3:59 PM | 32 (3.5%) | 103 (12.7%) |
| 4:00 PM to 11:59 PM | 75 (8.3%) | 105 (12.9%) |
| Total | 907 (100.0%) | 813 (100.0%) |
Housing Occupancy in Northumberland borough
Occupancy by Ownership in Northumberland borough
Of the total 1,773 dwellings in Northumberland borough, owner-occupied units account for 1,213 (68.4%), while renter-occupied units make up 560 (31.6%).
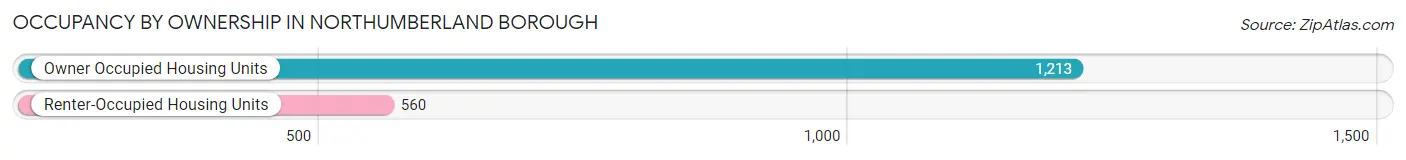
| Occupancy | # Housing Units | % Housing Units |
| Owner Occupied Housing Units | 1,213 | 68.4% |
| Renter-Occupied Housing Units | 560 | 31.6% |
| Total Occupied Housing Units | 1,773 | 100.0% |
Occupancy by Household Size in Northumberland borough
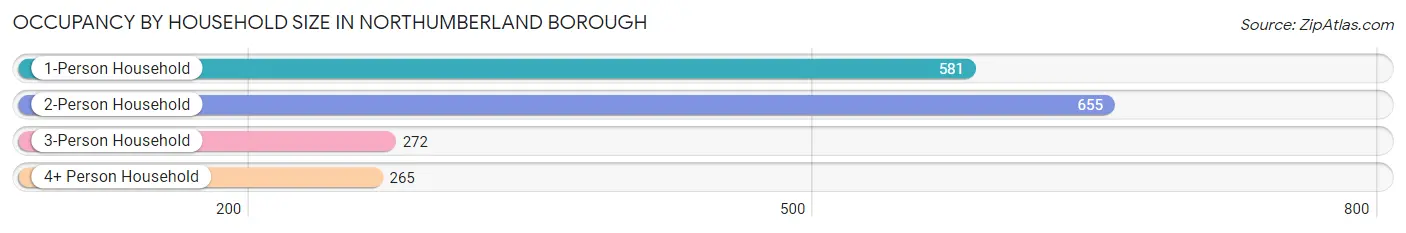
| Household Size | # Housing Units | % Housing Units |
| 1-Person Household | 581 | 32.8% |
| 2-Person Household | 655 | 36.9% |
| 3-Person Household | 272 | 15.3% |
| 4+ Person Household | 265 | 14.9% |
| Total Housing Units | 1,773 | 100.0% |
Occupancy by Ownership by Household Size in Northumberland borough
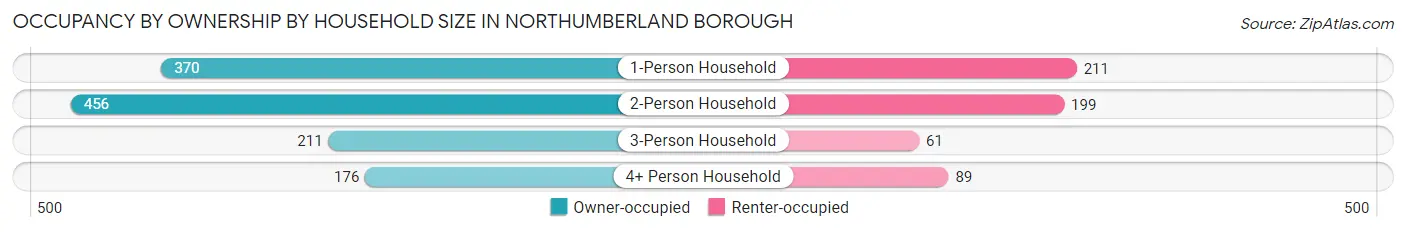
| Household Size | Owner-occupied | Renter-occupied |
| 1-Person Household | 370 (63.7%) | 211 (36.3%) |
| 2-Person Household | 456 (69.6%) | 199 (30.4%) |
| 3-Person Household | 211 (77.6%) | 61 (22.4%) |
| 4+ Person Household | 176 (66.4%) | 89 (33.6%) |
| Total Housing Units | 1,213 (68.4%) | 560 (31.6%) |
Occupancy by Educational Attainment in Northumberland borough
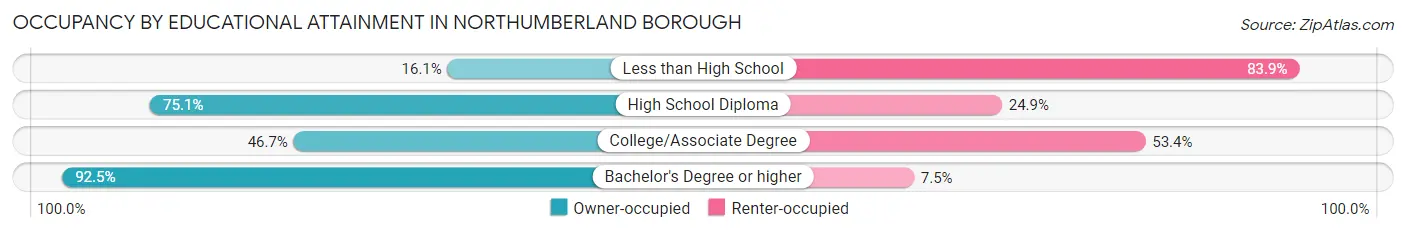
| Household Size | Owner-occupied | Renter-occupied |
| Less than High School | 15 (16.1%) | 78 (83.9%) |
| High School Diploma | 591 (75.1%) | 196 (24.9%) |
| College/Associate Degree | 223 (46.7%) | 255 (53.3%) |
| Bachelor's Degree or higher | 384 (92.5%) | 31 (7.5%) |
Occupancy by Age of Householder in Northumberland borough
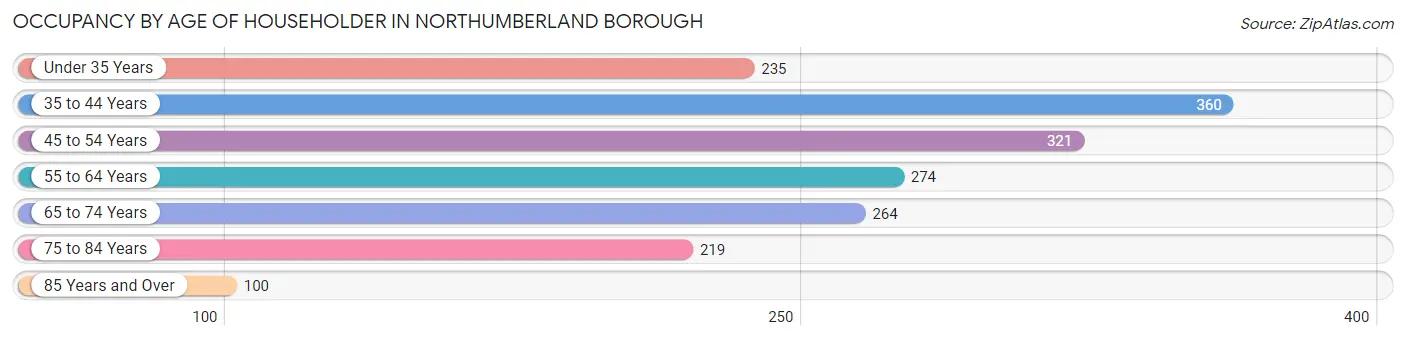
| Age Bracket | # Households | % Households |
| Under 35 Years | 235 | 13.3% |
| 35 to 44 Years | 360 | 20.3% |
| 45 to 54 Years | 321 | 18.1% |
| 55 to 64 Years | 274 | 15.4% |
| 65 to 74 Years | 264 | 14.9% |
| 75 to 84 Years | 219 | 12.3% |
| 85 Years and Over | 100 | 5.6% |
| Total | 1,773 | 100.0% |
Housing Finances in Northumberland borough
Median Income by Occupancy in Northumberland borough
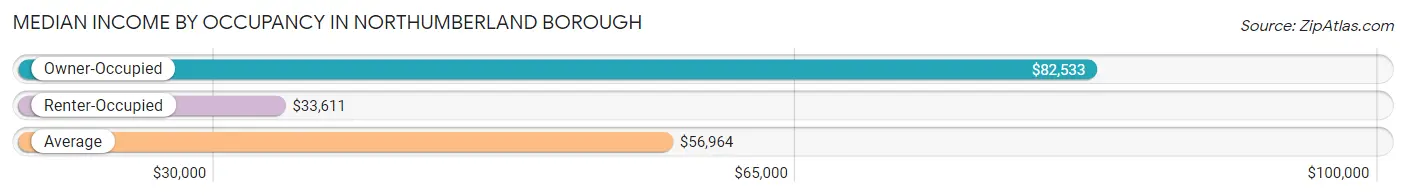
| Occupancy Type | # Households | Median Income |
| Owner-Occupied | 1,213 (68.4%) | $82,533 |
| Renter-Occupied | 560 (31.6%) | $33,611 |
| Average | 1,773 (100.0%) | $56,964 |
Occupancy by Householder Income Bracket in Northumberland borough
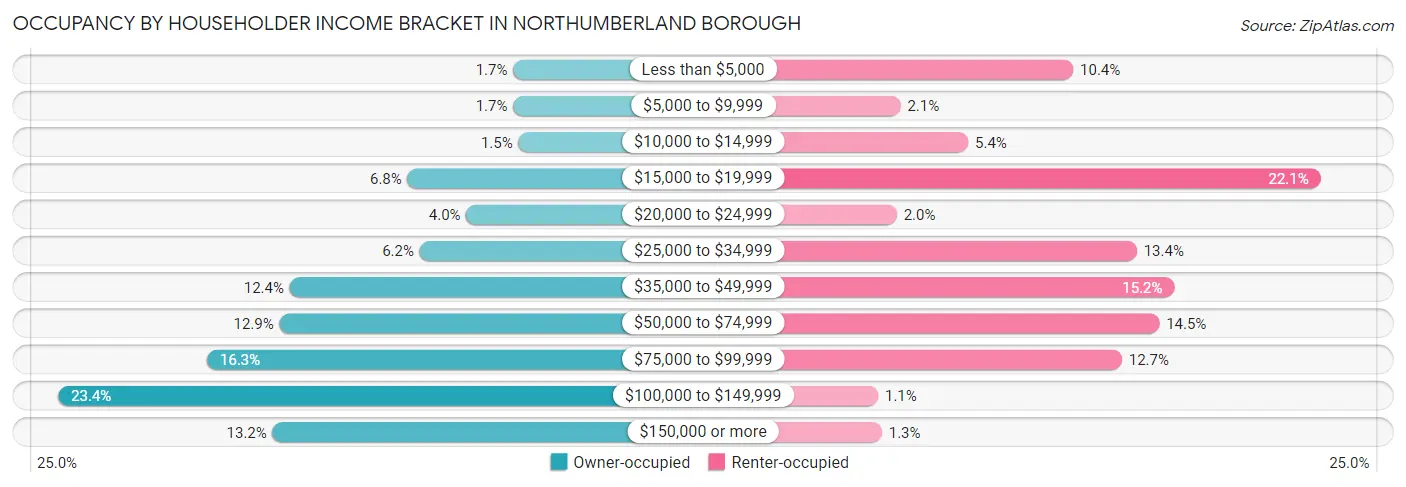
| Income Bracket | Owner-occupied | Renter-occupied |
| Less than $5,000 | 21 (1.7%) | 58 (10.4%) |
| $5,000 to $9,999 | 21 (1.7%) | 12 (2.1%) |
| $10,000 to $14,999 | 18 (1.5%) | 30 (5.4%) |
| $15,000 to $19,999 | 82 (6.8%) | 124 (22.1%) |
| $20,000 to $24,999 | 48 (4.0%) | 11 (2.0%) |
| $25,000 to $34,999 | 75 (6.2%) | 75 (13.4%) |
| $35,000 to $49,999 | 150 (12.4%) | 85 (15.2%) |
| $50,000 to $74,999 | 156 (12.9%) | 81 (14.5%) |
| $75,000 to $99,999 | 198 (16.3%) | 71 (12.7%) |
| $100,000 to $149,999 | 284 (23.4%) | 6 (1.1%) |
| $150,000 or more | 160 (13.2%) | 7 (1.3%) |
| Total | 1,213 (100.0%) | 560 (100.0%) |
Monthly Housing Cost Tiers in Northumberland borough
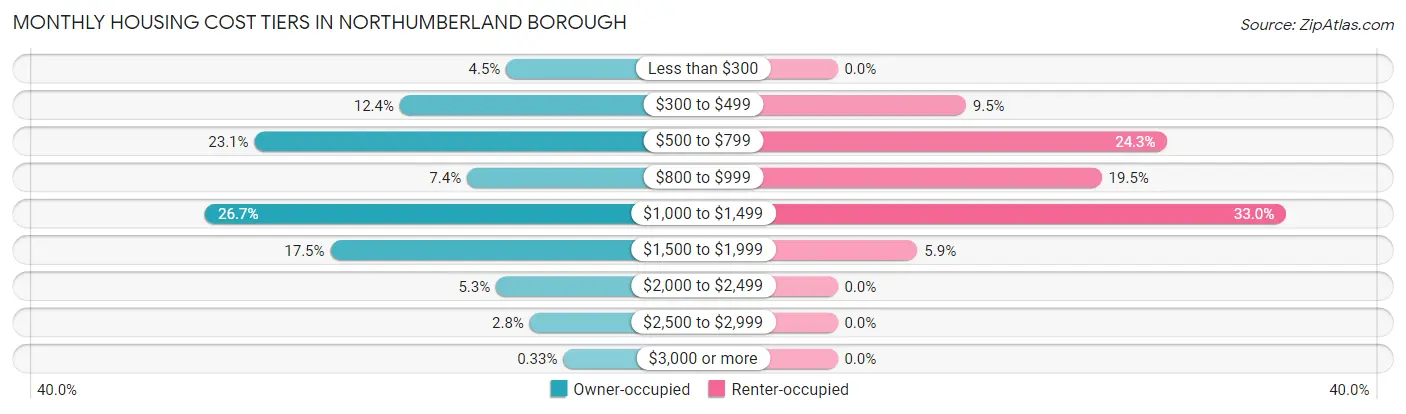
| Monthly Cost | Owner-occupied | Renter-occupied |
| Less than $300 | 55 (4.5%) | 0 (0.0%) |
| $300 to $499 | 150 (12.4%) | 53 (9.5%) |
| $500 to $799 | 280 (23.1%) | 136 (24.3%) |
| $800 to $999 | 90 (7.4%) | 109 (19.5%) |
| $1,000 to $1,499 | 324 (26.7%) | 185 (33.0%) |
| $1,500 to $1,999 | 212 (17.5%) | 33 (5.9%) |
| $2,000 to $2,499 | 64 (5.3%) | 0 (0.0%) |
| $2,500 to $2,999 | 34 (2.8%) | 0 (0.0%) |
| $3,000 or more | 4 (0.3%) | 0 (0.0%) |
| Total | 1,213 (100.0%) | 560 (100.0%) |
Physical Housing Characteristics in Northumberland borough
Housing Structures in Northumberland borough
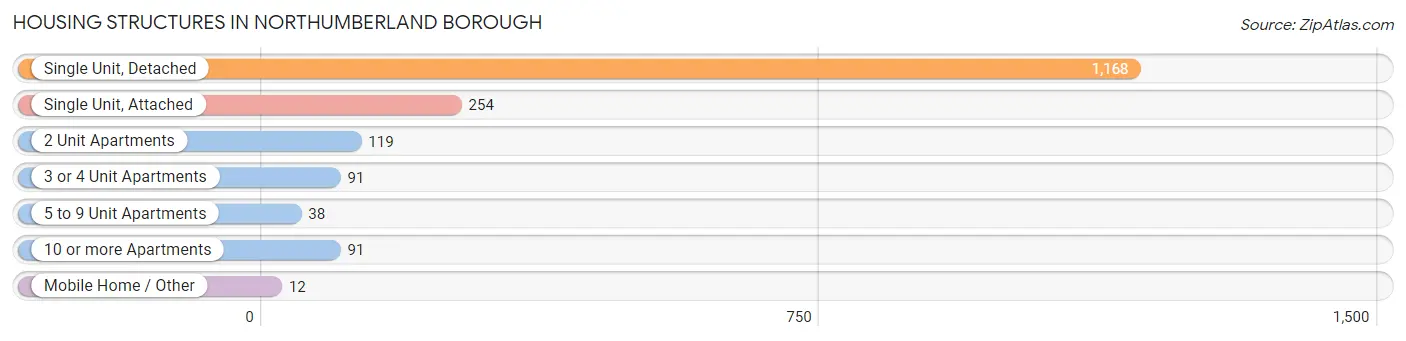
| Structure Type | # Housing Units | % Housing Units |
| Single Unit, Detached | 1,168 | 65.9% |
| Single Unit, Attached | 254 | 14.3% |
| 2 Unit Apartments | 119 | 6.7% |
| 3 or 4 Unit Apartments | 91 | 5.1% |
| 5 to 9 Unit Apartments | 38 | 2.1% |
| 10 or more Apartments | 91 | 5.1% |
| Mobile Home / Other | 12 | 0.7% |
| Total | 1,773 | 100.0% |
Housing Structures by Occupancy in Northumberland borough
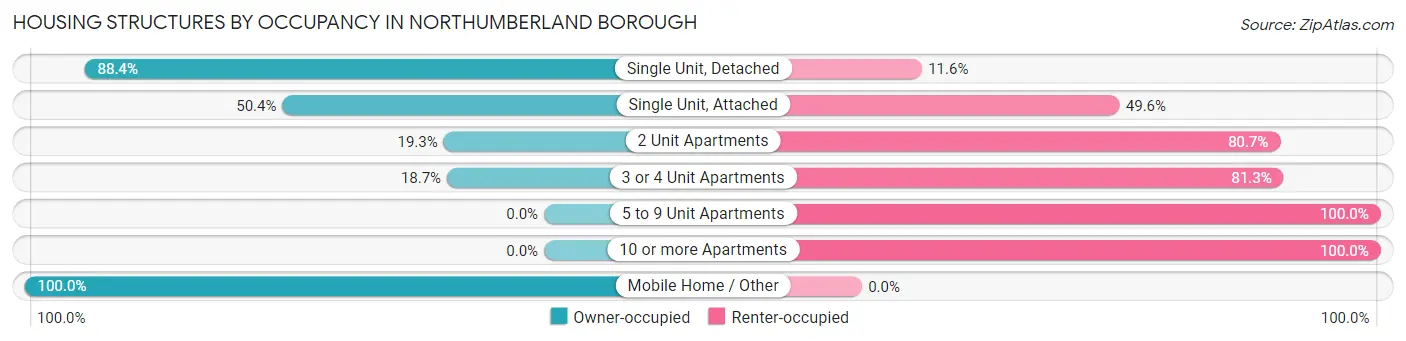
| Structure Type | Owner-occupied | Renter-occupied |
| Single Unit, Detached | 1,033 (88.4%) | 135 (11.6%) |
| Single Unit, Attached | 128 (50.4%) | 126 (49.6%) |
| 2 Unit Apartments | 23 (19.3%) | 96 (80.7%) |
| 3 or 4 Unit Apartments | 17 (18.7%) | 74 (81.3%) |
| 5 to 9 Unit Apartments | 0 (0.0%) | 38 (100.0%) |
| 10 or more Apartments | 0 (0.0%) | 91 (100.0%) |
| Mobile Home / Other | 12 (100.0%) | 0 (0.0%) |
| Total | 1,213 (68.4%) | 560 (31.6%) |
Housing Structures by Number of Rooms in Northumberland borough
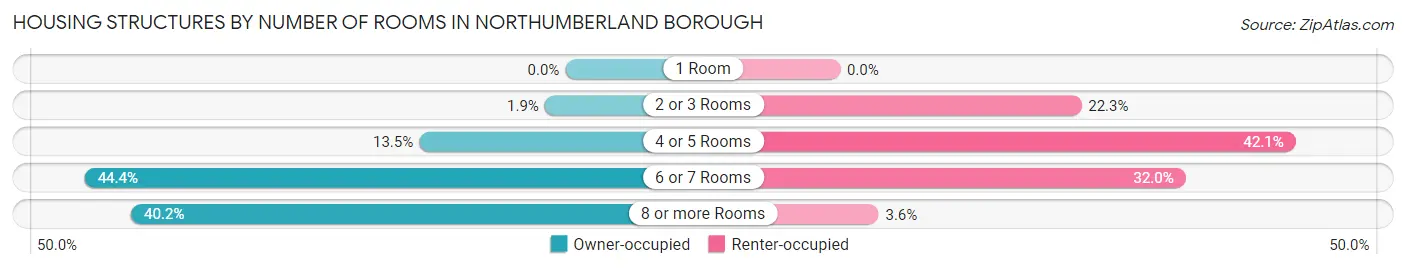
| Number of Rooms | Owner-occupied | Renter-occupied |
| 1 Room | 0 (0.0%) | 0 (0.0%) |
| 2 or 3 Rooms | 23 (1.9%) | 125 (22.3%) |
| 4 or 5 Rooms | 164 (13.5%) | 236 (42.1%) |
| 6 or 7 Rooms | 539 (44.4%) | 179 (32.0%) |
| 8 or more Rooms | 487 (40.2%) | 20 (3.6%) |
| Total | 1,213 (100.0%) | 560 (100.0%) |
Housing Structure by Heating Type in Northumberland borough
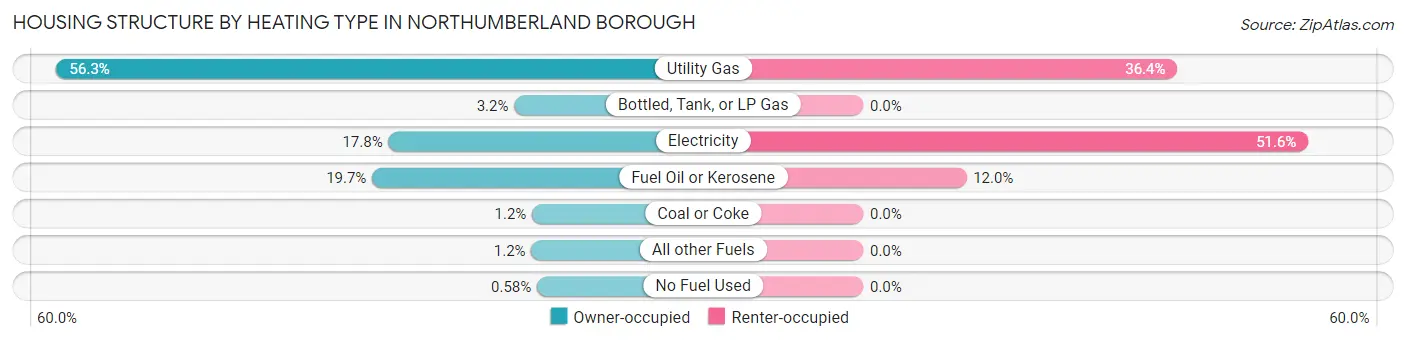
| Heating Type | Owner-occupied | Renter-occupied |
| Utility Gas | 683 (56.3%) | 204 (36.4%) |
| Bottled, Tank, or LP Gas | 39 (3.2%) | 0 (0.0%) |
| Electricity | 216 (17.8%) | 289 (51.6%) |
| Fuel Oil or Kerosene | 239 (19.7%) | 67 (12.0%) |
| Coal or Coke | 14 (1.1%) | 0 (0.0%) |
| All other Fuels | 15 (1.2%) | 0 (0.0%) |
| No Fuel Used | 7 (0.6%) | 0 (0.0%) |
| Total | 1,213 (100.0%) | 560 (100.0%) |
Household Vehicle Usage in Northumberland borough
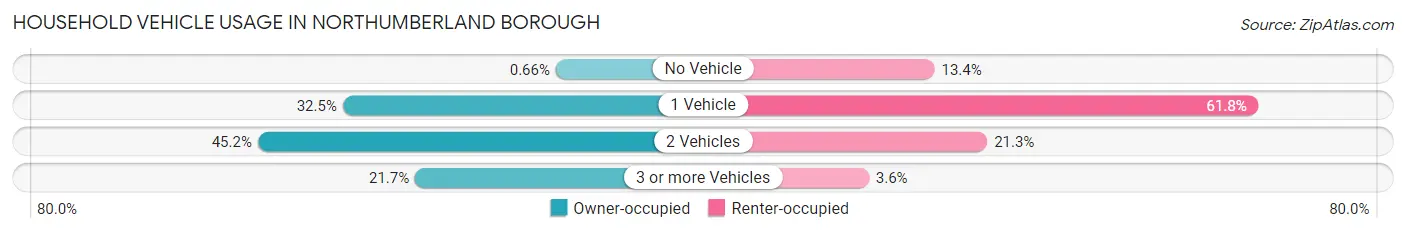
| Vehicles per Household | Owner-occupied | Renter-occupied |
| No Vehicle | 8 (0.7%) | 75 (13.4%) |
| 1 Vehicle | 394 (32.5%) | 346 (61.8%) |
| 2 Vehicles | 548 (45.2%) | 119 (21.2%) |
| 3 or more Vehicles | 263 (21.7%) | 20 (3.6%) |
| Total | 1,213 (100.0%) | 560 (100.0%) |
Real Estate & Mortgages in Northumberland borough
Real Estate and Mortgage Overview in Northumberland borough
| Characteristic | Without Mortgage | With Mortgage |
| Housing Units | 531 | 682 |
| Median Property Value | $99,200 | $168,800 |
| Median Household Income | $63,036 | $114 |
| Monthly Housing Costs | $575 | $4 |
| Real Estate Taxes | $1,989 | $0 |
Property Value by Mortgage Status in Northumberland borough
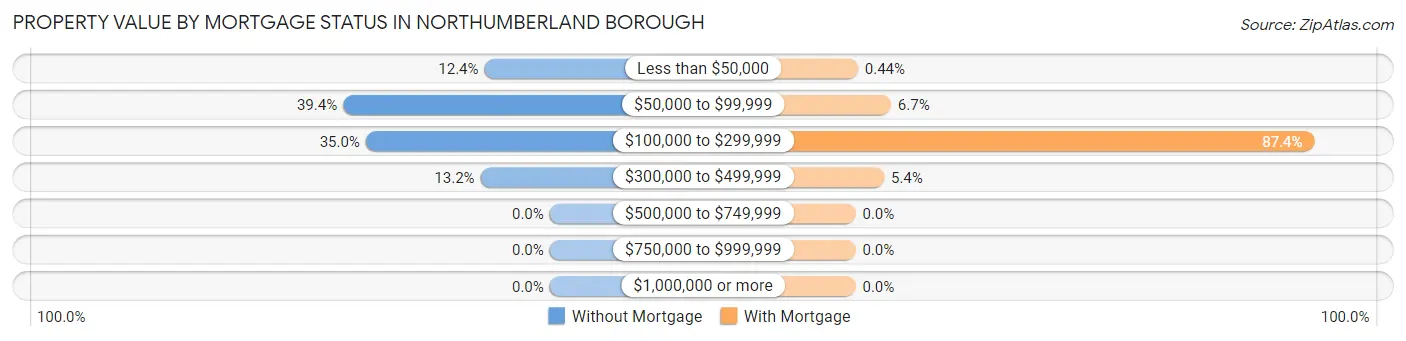
| Property Value | Without Mortgage | With Mortgage |
| Less than $50,000 | 66 (12.4%) | 3 (0.4%) |
| $50,000 to $99,999 | 209 (39.4%) | 46 (6.7%) |
| $100,000 to $299,999 | 186 (35.0%) | 596 (87.4%) |
| $300,000 to $499,999 | 70 (13.2%) | 37 (5.4%) |
| $500,000 to $749,999 | 0 (0.0%) | 0 (0.0%) |
| $750,000 to $999,999 | 0 (0.0%) | 0 (0.0%) |
| $1,000,000 or more | 0 (0.0%) | 0 (0.0%) |
| Total | 531 (100.0%) | 682 (100.0%) |
Household Income by Mortgage Status in Northumberland borough
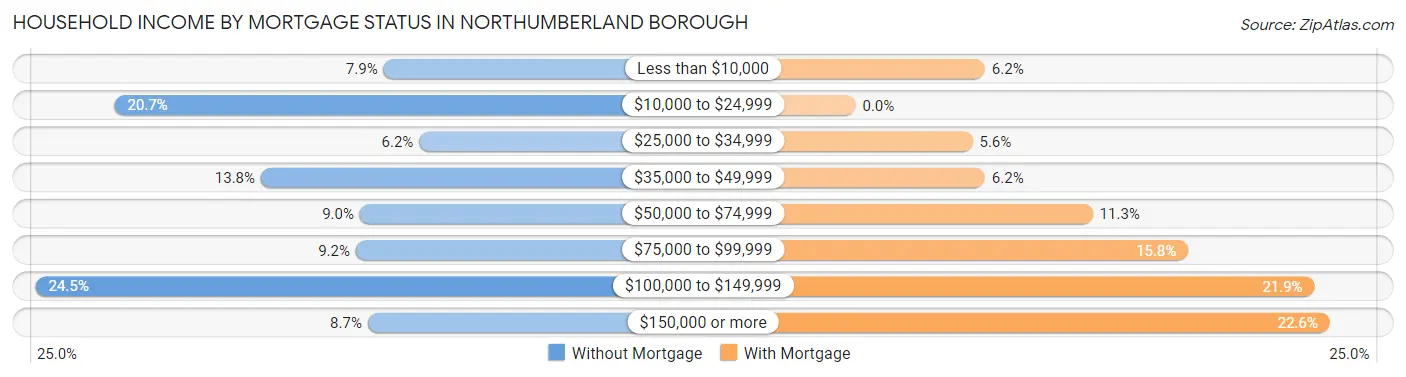
| Household Income | Without Mortgage | With Mortgage |
| Less than $10,000 | 42 (7.9%) | 42 (6.2%) |
| $10,000 to $24,999 | 110 (20.7%) | 0 (0.0%) |
| $25,000 to $34,999 | 33 (6.2%) | 38 (5.6%) |
| $35,000 to $49,999 | 73 (13.8%) | 42 (6.2%) |
| $50,000 to $74,999 | 48 (9.0%) | 77 (11.3%) |
| $75,000 to $99,999 | 49 (9.2%) | 108 (15.8%) |
| $100,000 to $149,999 | 130 (24.5%) | 149 (21.8%) |
| $150,000 or more | 46 (8.7%) | 154 (22.6%) |
| Total | 531 (100.0%) | 682 (100.0%) |
Property Value to Household Income Ratio in Northumberland borough
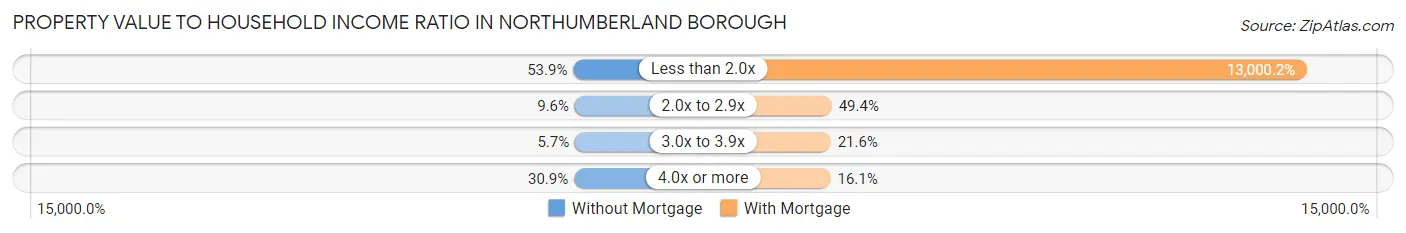
| Value-to-Income Ratio | Without Mortgage | With Mortgage |
| Less than 2.0x | 286 (53.9%) | 88,661 (13,000.1%) |
| 2.0x to 2.9x | 51 (9.6%) | 337 (49.4%) |
| 3.0x to 3.9x | 30 (5.7%) | 147 (21.5%) |
| 4.0x or more | 164 (30.9%) | 110 (16.1%) |
| Total | 531 (100.0%) | 682 (100.0%) |
Real Estate Taxes by Mortgage Status in Northumberland borough
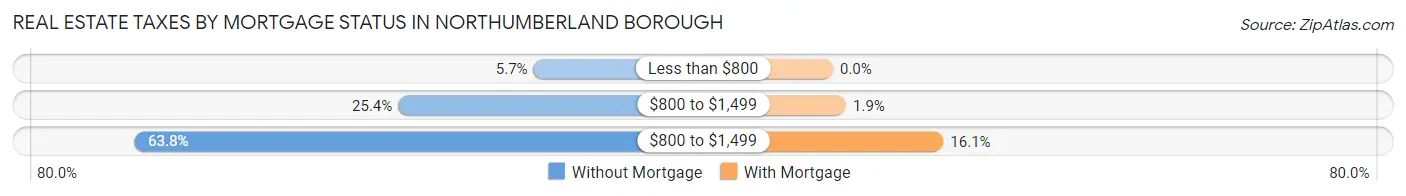
| Property Taxes | Without Mortgage | With Mortgage |
| Less than $800 | 30 (5.7%) | 0 (0.0%) |
| $800 to $1,499 | 135 (25.4%) | 13 (1.9%) |
| $800 to $1,499 | 339 (63.8%) | 110 (16.1%) |
| Total | 531 (100.0%) | 682 (100.0%) |
Health & Disability in Northumberland borough
Health Insurance Coverage by Age in Northumberland borough
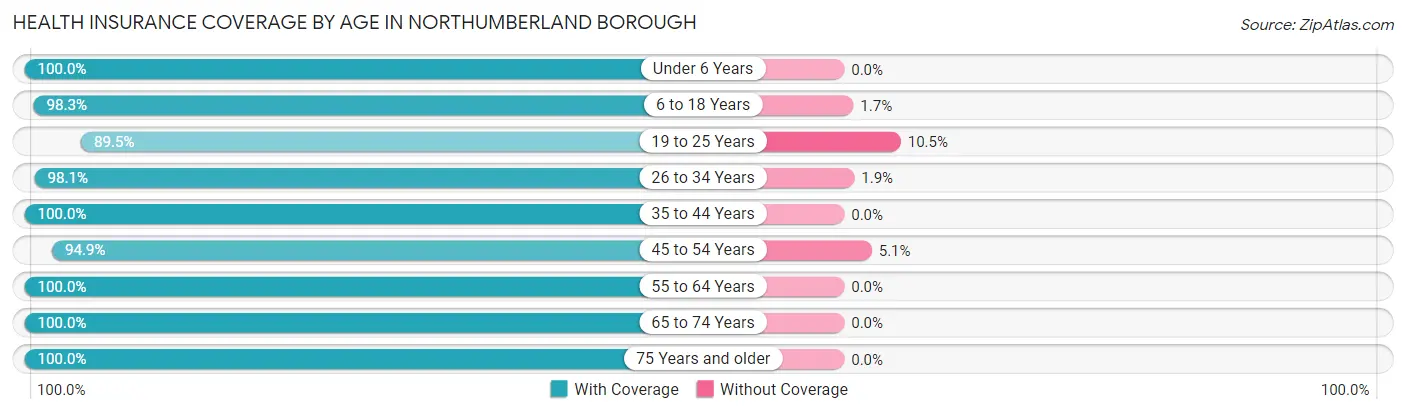
| Age Bracket | With Coverage | Without Coverage |
| Under 6 Years | 168 (100.0%) | 0 (0.0%) |
| 6 to 18 Years | 752 (98.3%) | 13 (1.7%) |
| 19 to 25 Years | 102 (89.5%) | 12 (10.5%) |
| 26 to 34 Years | 418 (98.1%) | 8 (1.9%) |
| 35 to 44 Years | 587 (100.0%) | 0 (0.0%) |
| 45 to 54 Years | 499 (94.9%) | 27 (5.1%) |
| 55 to 64 Years | 418 (100.0%) | 0 (0.0%) |
| 65 to 74 Years | 425 (100.0%) | 0 (0.0%) |
| 75 Years and older | 430 (100.0%) | 0 (0.0%) |
| Total | 3,799 (98.5%) | 60 (1.5%) |
Health Insurance Coverage by Citizenship Status in Northumberland borough
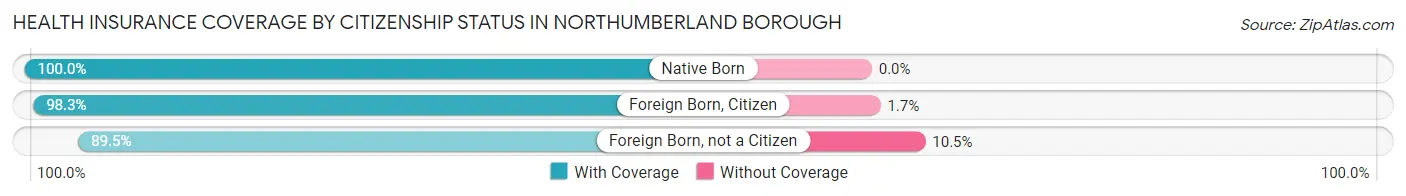
| Citizenship Status | With Coverage | Without Coverage |
| Native Born | 168 (100.0%) | 0 (0.0%) |
| Foreign Born, Citizen | 752 (98.3%) | 13 (1.7%) |
| Foreign Born, not a Citizen | 102 (89.5%) | 12 (10.5%) |
Health Insurance Coverage by Household Income in Northumberland borough
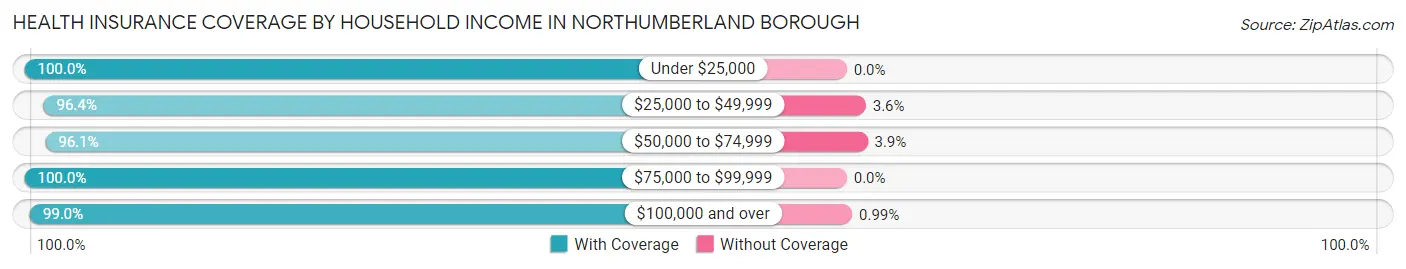
| Household Income | With Coverage | Without Coverage |
| Under $25,000 | 645 (100.0%) | 0 (0.0%) |
| $25,000 to $49,999 | 732 (96.4%) | 27 (3.6%) |
| $50,000 to $74,999 | 495 (96.1%) | 20 (3.9%) |
| $75,000 to $99,999 | 627 (100.0%) | 0 (0.0%) |
| $100,000 and over | 1,299 (99.0%) | 13 (1.0%) |
Public vs Private Health Insurance Coverage by Age in Northumberland borough
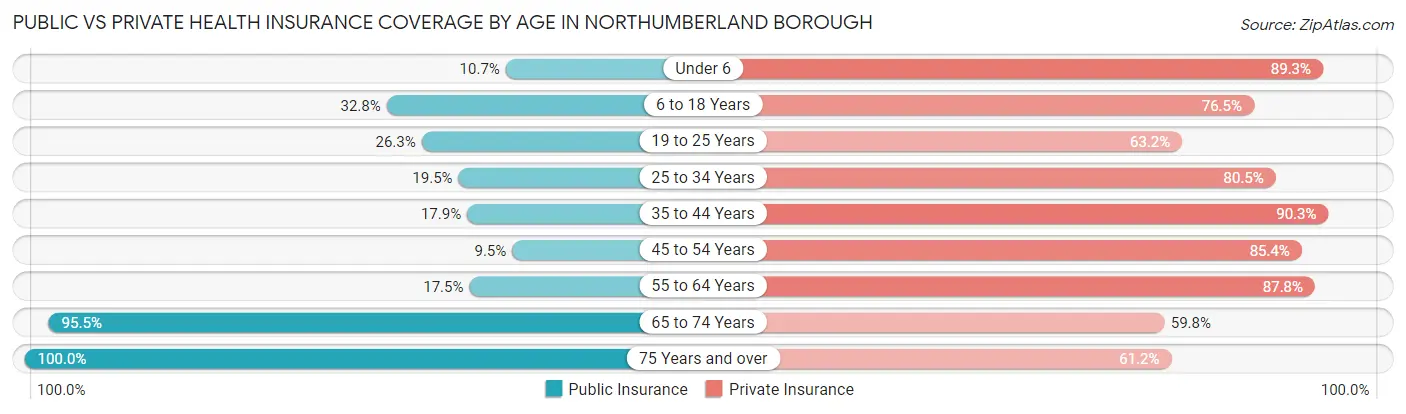
| Age Bracket | Public Insurance | Private Insurance |
| Under 6 | 18 (10.7%) | 150 (89.3%) |
| 6 to 18 Years | 251 (32.8%) | 585 (76.5%) |
| 19 to 25 Years | 30 (26.3%) | 72 (63.2%) |
| 25 to 34 Years | 83 (19.5%) | 343 (80.5%) |
| 35 to 44 Years | 105 (17.9%) | 530 (90.3%) |
| 45 to 54 Years | 50 (9.5%) | 449 (85.4%) |
| 55 to 64 Years | 73 (17.5%) | 367 (87.8%) |
| 65 to 74 Years | 406 (95.5%) | 254 (59.8%) |
| 75 Years and over | 430 (100.0%) | 263 (61.2%) |
| Total | 1,446 (37.5%) | 3,013 (78.1%) |
Disability Status by Sex by Age in Northumberland borough
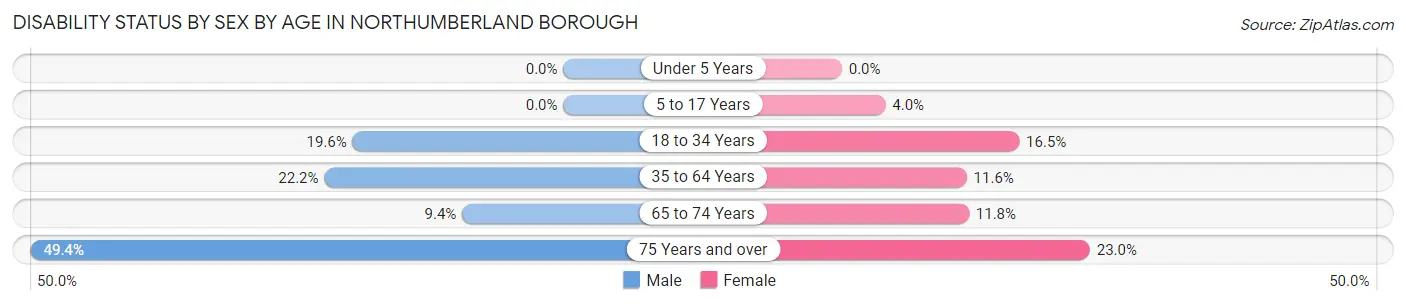
| Age Bracket | Male | Female |
| Under 5 Years | 0 (0.0%) | 0 (0.0%) |
| 5 to 17 Years | 0 (0.0%) | 15 (4.0%) |
| 18 to 34 Years | 53 (19.6%) | 53 (16.5%) |
| 35 to 64 Years | 175 (22.2%) | 86 (11.6%) |
| 65 to 74 Years | 20 (9.4%) | 25 (11.8%) |
| 75 Years and over | 88 (49.4%) | 58 (23.0%) |
Disability Class by Sex by Age in Northumberland borough
Disability Class: Hearing Difficulty
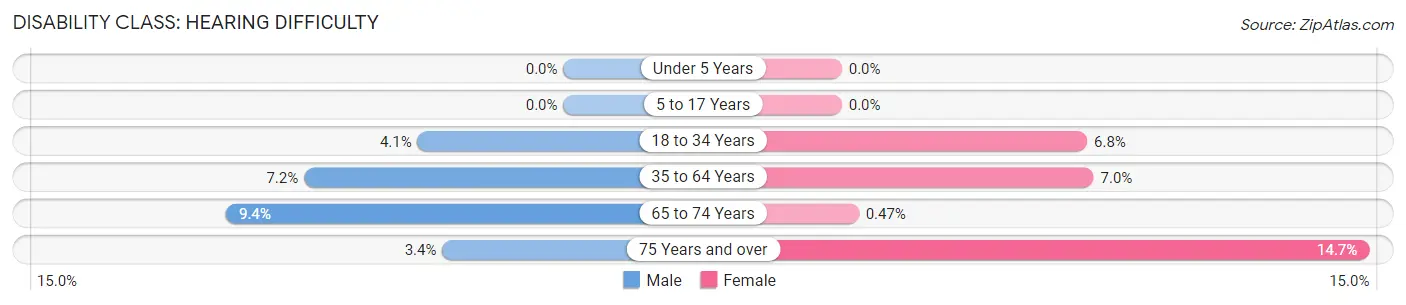
| Age Bracket | Male | Female |
| Under 5 Years | 0 (0.0%) | 0 (0.0%) |
| 5 to 17 Years | 0 (0.0%) | 0 (0.0%) |
| 18 to 34 Years | 11 (4.1%) | 22 (6.8%) |
| 35 to 64 Years | 57 (7.2%) | 52 (7.0%) |
| 65 to 74 Years | 20 (9.4%) | 1 (0.5%) |
| 75 Years and over | 6 (3.4%) | 37 (14.7%) |
Disability Class: Vision Difficulty
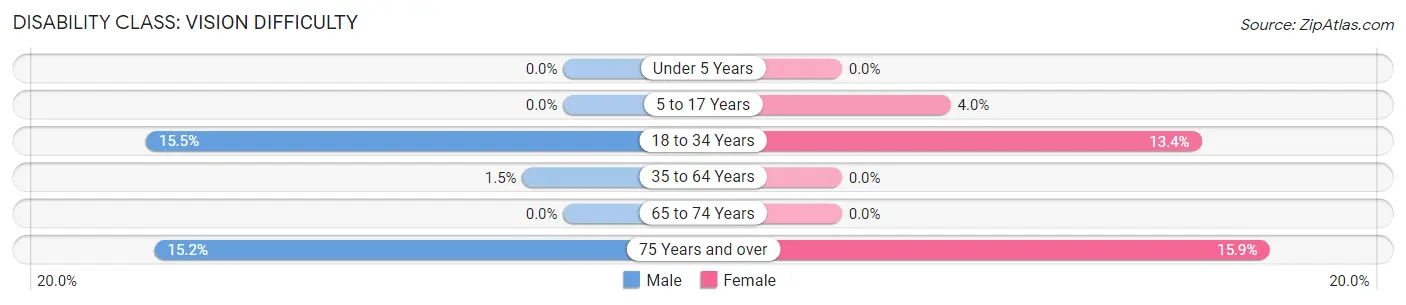
| Age Bracket | Male | Female |
| Under 5 Years | 0 (0.0%) | 0 (0.0%) |
| 5 to 17 Years | 0 (0.0%) | 15 (4.0%) |
| 18 to 34 Years | 42 (15.5%) | 43 (13.4%) |
| 35 to 64 Years | 12 (1.5%) | 0 (0.0%) |
| 65 to 74 Years | 0 (0.0%) | 0 (0.0%) |
| 75 Years and over | 27 (15.2%) | 40 (15.9%) |
Disability Class: Cognitive Difficulty
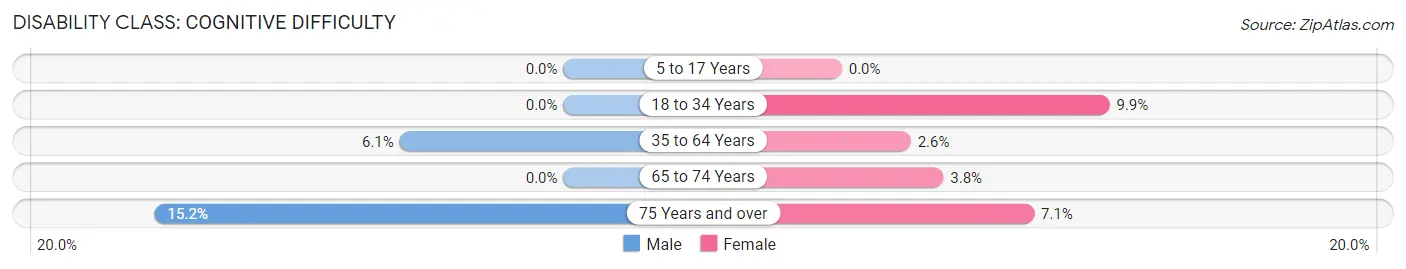
| Age Bracket | Male | Female |
| 5 to 17 Years | 0 (0.0%) | 0 (0.0%) |
| 18 to 34 Years | 0 (0.0%) | 32 (9.9%) |
| 35 to 64 Years | 48 (6.1%) | 19 (2.6%) |
| 65 to 74 Years | 0 (0.0%) | 8 (3.8%) |
| 75 Years and over | 27 (15.2%) | 18 (7.1%) |
Disability Class: Ambulatory Difficulty
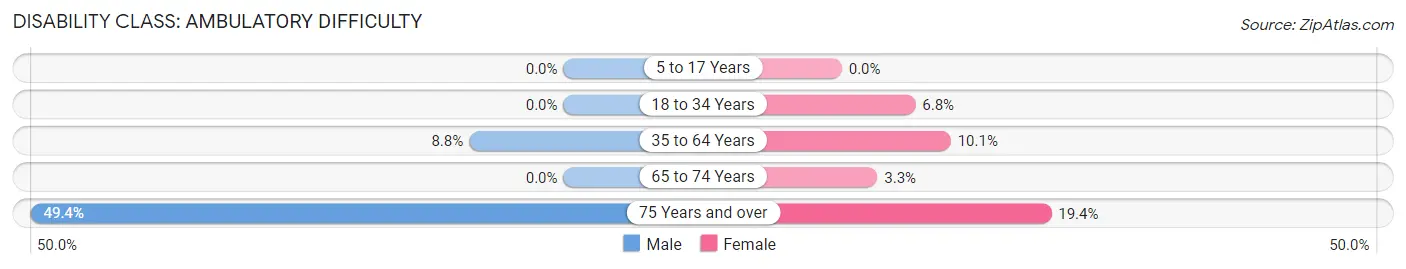
| Age Bracket | Male | Female |
| 5 to 17 Years | 0 (0.0%) | 0 (0.0%) |
| 18 to 34 Years | 0 (0.0%) | 22 (6.8%) |
| 35 to 64 Years | 69 (8.7%) | 75 (10.1%) |
| 65 to 74 Years | 0 (0.0%) | 7 (3.3%) |
| 75 Years and over | 88 (49.4%) | 49 (19.4%) |
Disability Class: Self-Care Difficulty
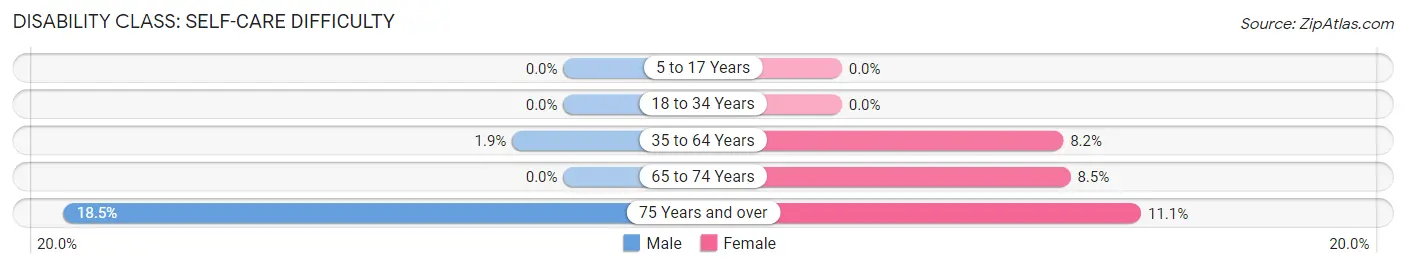
| Age Bracket | Male | Female |
| 5 to 17 Years | 0 (0.0%) | 0 (0.0%) |
| 18 to 34 Years | 0 (0.0%) | 0 (0.0%) |
| 35 to 64 Years | 15 (1.9%) | 61 (8.2%) |
| 65 to 74 Years | 0 (0.0%) | 18 (8.5%) |
| 75 Years and over | 33 (18.5%) | 28 (11.1%) |
Technology Access in Northumberland borough
Computing Device Access in Northumberland borough
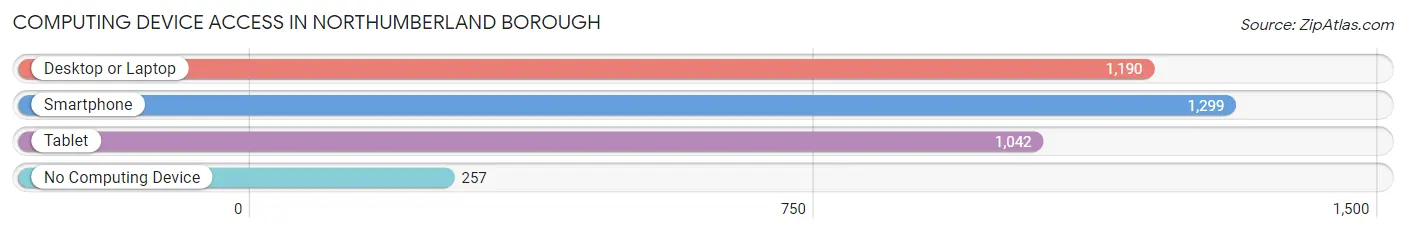
| Device Type | # Households | % Households |
| Desktop or Laptop | 1,190 | 67.1% |
| Smartphone | 1,299 | 73.3% |
| Tablet | 1,042 | 58.8% |
| No Computing Device | 257 | 14.5% |
| Total | 1,773 | 100.0% |
Internet Access in Northumberland borough
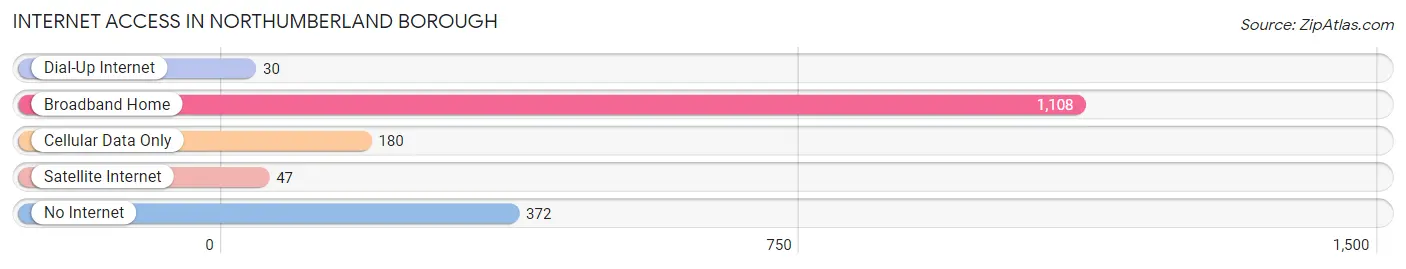
| Internet Type | # Households | % Households |
| Dial-Up Internet | 30 | 1.7% |
| Broadband Home | 1,108 | 62.5% |
| Cellular Data Only | 180 | 10.2% |
| Satellite Internet | 47 | 2.6% |
| No Internet | 372 | 21.0% |
| Total | 1,773 | 100.0% |
Northumberland borough Summary
Northumberland Borough is a borough located in Northumberland County, Pennsylvania, United States. The population was 3,722 at the 2010 census. It is the county seat of Northumberland County.
History
Northumberland Borough was founded in 1772 by a group of settlers from Philadelphia. The town was named after the county of Northumberland in England. The town was laid out in a grid pattern with a central square, which is now the site of the Northumberland County Courthouse. The town was incorporated in 1814.
In the 19th century, Northumberland was a major center of the iron and steel industry. The town was home to several iron and steel mills, as well as a number of other industries. The town was also a major transportation hub, with the Susquehanna River providing access to the Pennsylvania Canal and the Pennsylvania Railroad.
Geography
Northumberland Borough is located at 40 53 17 North 76 47 17 West 40 8879 76 7879
According to the United States Census Bureau, the borough has a total area of 1.2 square miles (3.1 km2), all of it land.
Demographics
As of the census of 2000, there were 3,722 people, 1,619 households, and 990 families residing in the borough. The population density was 3,093.3 people per square mile (1,192.2/km2). There were 1,741 housing units at an average density of 1,444.2 per square mile (558.7/km2). The racial makeup of the borough was 97.45% White, 0.81% African American, 0.19% Native American, 0.27% Asian, 0.05% Pacific Islander, 0.27% from other races, and 0.95% from two or more races. Hispanic or Latino of any race were 0.86% of the population.
Economy
Northumberland Borough is home to a variety of businesses, including manufacturing, retail, and service industries. The town is also home to a number of small businesses, including restaurants, shops, and professional services.
The town is also home to a number of government offices, including the Northumberland County Courthouse, the Northumberland County Jail, and the Northumberland County Historical Society.
The town is also home to a number of educational institutions, including the Northumberland County Career and Technology Center, the Northumberland County Area Vocational-Technical School, and the Northumberland County Community College.
The town is also home to a number of recreational facilities, including the Northumberland County Park, the Northumberland County Fairgrounds, and the Northumberland County Golf Course.
Conclusion
Northumberland Borough is a small town located in Northumberland County, Pennsylvania. The town has a rich history, and is home to a variety of businesses, government offices, educational institutions, and recreational facilities. The town is a great place to live, work, and play, and is a great place to call home.
Common Questions
What is Per Capita Income in Northumberland borough?
Per Capita income in Northumberland borough is $32,355.
What is the Median Family Income in Northumberland borough?
Median Family Income in Northumberland borough is $78,125.
What is the Median Household income in Northumberland borough?
Median Household Income in Northumberland borough is $56,964.
What is Income or Wage Gap in Northumberland borough?
Income or Wage Gap in Northumberland borough is 28.2%.
Women in Northumberland borough earn 71.8 cents for every dollar earned by a man.
What is Inequality or Gini Index in Northumberland borough?
Inequality or Gini Index in Northumberland borough is 0.42.
What is the Total Population of Northumberland borough?
Total Population of Northumberland borough is 3,892.
What is the Total Male Population of Northumberland borough?
Total Male Population of Northumberland borough is 1,921.
What is the Total Female Population of Northumberland borough?
Total Female Population of Northumberland borough is 1,971.
What is the Ratio of Males per 100 Females in Northumberland borough?
There are 97.46 Males per 100 Females in Northumberland borough.
What is the Ratio of Females per 100 Males in Northumberland borough?
There are 102.60 Females per 100 Males in Northumberland borough.
What is the Median Population Age in Northumberland borough?
Median Population Age in Northumberland borough is 42.1 Years.
What is the Average Family Size in Northumberland borough
Average Family Size in Northumberland borough is 2.7 People.
What is the Average Household Size in Northumberland borough
Average Household Size in Northumberland borough is 2.2 People.
How Large is the Labor Force in Northumberland borough?
There are 2,026 People in the Labor Forcein in Northumberland borough.
What is the Percentage of People in the Labor Force in Northumberland borough?
65.9% of People are in the Labor Force in Northumberland borough.
What is the Unemployment Rate in Northumberland borough?
Unemployment Rate in Northumberland borough is 1.4%.