Pleasant Hills borough, PA Map & Demographics
Pleasant Hills borough Overview
$45,422
PER CAPITA INCOME
$111,450
AVG FAMILY INCOME
$88,893
AVG HOUSEHOLD INCOME
12.2%
WAGE / INCOME GAP [ % ]
87.8¢/ $1
WAGE / INCOME GAP [ $ ]
0.40
INEQUALITY / GINI INDEX
8,456
TOTAL POPULATION
4,132
MALE POPULATION
4,324
FEMALE POPULATION
95.56
MALES / 100 FEMALES
104.65
FEMALES / 100 MALES
46.6
MEDIAN AGE
2.8
AVG FAMILY SIZE
2.4
AVG HOUSEHOLD SIZE
4,490
LABOR FORCE [ PEOPLE ]
62.2%
PERCENT IN LABOR FORCE
4.6%
UNEMPLOYMENT RATE
Income in Pleasant Hills borough
Income Overview in Pleasant Hills borough
Per Capita Income in Pleasant Hills borough is $45,422, while median incomes of families and households are $111,450 and $88,893 respectively.
| Characteristic | Number | Measure |
| Per Capita Income | 8,456 | $45,422 |
| Median Family Income | 2,399 | $111,450 |
| Mean Family Income | 2,399 | $125,023 |
| Median Household Income | 3,550 | $88,893 |
| Mean Household Income | 3,550 | $105,986 |
| Income Deficit | 2,399 | $0 |
| Wage / Income Gap (%) | 8,456 | 12.19% |
| Wage / Income Gap ($) | 8,456 | 87.81¢ per $1 |
| Gini / Inequality Index | 8,456 | 0.40 |
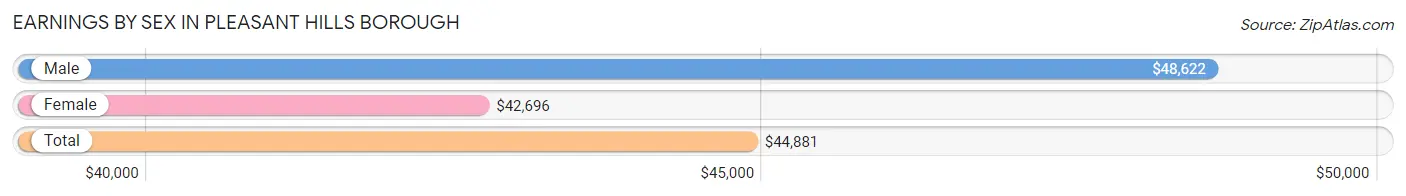
Earnings by Sex in Pleasant Hills borough
Average Earnings in Pleasant Hills borough are $44,881, $48,622 for men and $42,696 for women, a difference of 12.2%.
| Sex | Number | Average Earnings |
| Male | 2,512 (54.8%) | $48,622 |
| Female | 2,069 (45.2%) | $42,696 |
| Total | 4,581 (100.0%) | $44,881 |
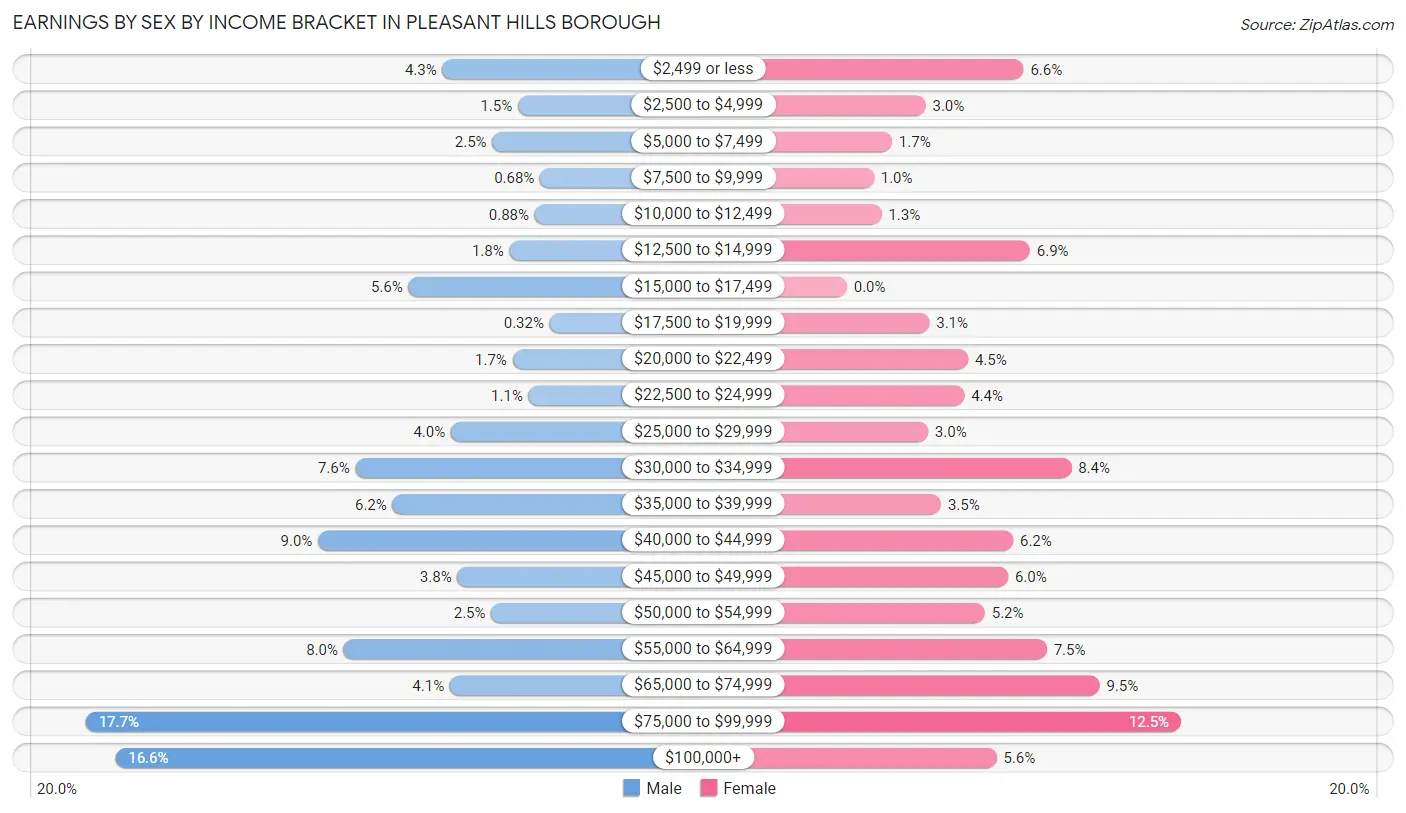
Earnings by Sex by Income Bracket in Pleasant Hills borough
The most common earnings brackets in Pleasant Hills borough are $75,000 to $99,999 for men (445 | 17.7%) and $75,000 to $99,999 for women (259 | 12.5%).
| Income | Male | Female |
| $2,499 or less | 109 (4.3%) | 137 (6.6%) |
| $2,500 to $4,999 | 38 (1.5%) | 61 (2.9%) |
| $5,000 to $7,499 | 62 (2.5%) | 35 (1.7%) |
| $7,500 to $9,999 | 17 (0.7%) | 21 (1.0%) |
| $10,000 to $12,499 | 22 (0.9%) | 27 (1.3%) |
| $12,500 to $14,999 | 46 (1.8%) | 142 (6.9%) |
| $15,000 to $17,499 | 141 (5.6%) | 0 (0.0%) |
| $17,500 to $19,999 | 8 (0.3%) | 64 (3.1%) |
| $20,000 to $22,499 | 43 (1.7%) | 94 (4.5%) |
| $22,500 to $24,999 | 28 (1.1%) | 91 (4.4%) |
| $25,000 to $29,999 | 101 (4.0%) | 63 (3.0%) |
| $30,000 to $34,999 | 191 (7.6%) | 174 (8.4%) |
| $35,000 to $39,999 | 156 (6.2%) | 73 (3.5%) |
| $40,000 to $44,999 | 226 (9.0%) | 129 (6.2%) |
| $45,000 to $49,999 | 95 (3.8%) | 125 (6.0%) |
| $50,000 to $54,999 | 63 (2.5%) | 107 (5.2%) |
| $55,000 to $64,999 | 202 (8.0%) | 155 (7.5%) |
| $65,000 to $74,999 | 102 (4.1%) | 196 (9.5%) |
| $75,000 to $99,999 | 445 (17.7%) | 259 (12.5%) |
| $100,000+ | 417 (16.6%) | 116 (5.6%) |
| Total | 2,512 (100.0%) | 2,069 (100.0%) |
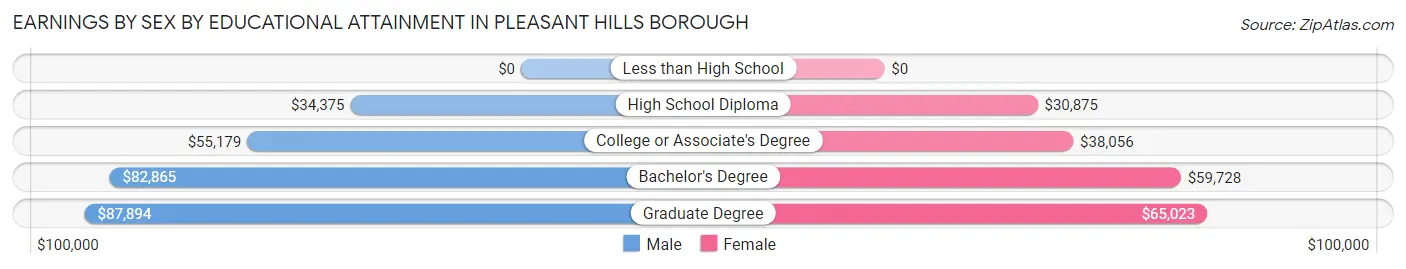
Earnings by Sex by Educational Attainment in Pleasant Hills borough
Average earnings in Pleasant Hills borough are $58,641 for men and $48,429 for women, a difference of 17.4%. Men with an educational attainment of graduate degree enjoy the highest average annual earnings of $87,894, while those with high school diploma education earn the least with $34,375. Women with an educational attainment of graduate degree earn the most with the average annual earnings of $65,023, while those with high school diploma education have the smallest earnings of $30,875.
| Educational Attainment | Male Income | Female Income |
| Less than High School | - | - |
| High School Diploma | $34,375 | $30,875 |
| College or Associate's Degree | $55,179 | $38,056 |
| Bachelor's Degree | $82,865 | $59,728 |
| Graduate Degree | $87,894 | $65,023 |
| Total | $58,641 | $48,429 |
Family Income in Pleasant Hills borough
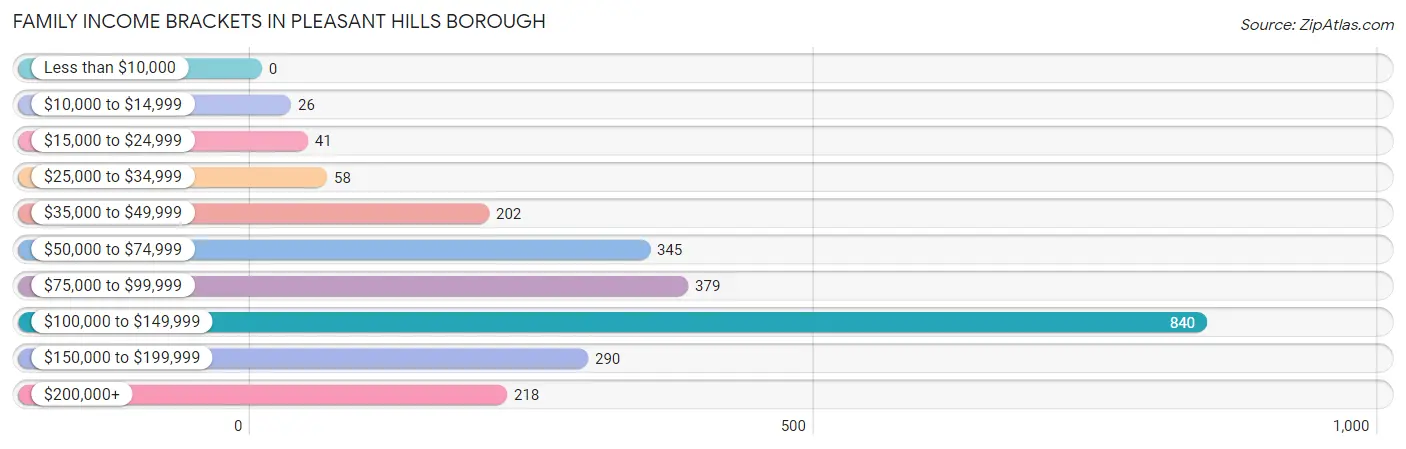
Family Income Brackets in Pleasant Hills borough
According to the Pleasant Hills borough family income data, there are 840 families falling into the $100,000 to $149,999 income range, which is the most common income bracket and makes up 35.0% of all families.
| Income Bracket | # Families | % Families |
| Less than $10,000 | 0 | 0.0% |
| $10,000 to $14,999 | 26 | 1.1% |
| $15,000 to $24,999 | 41 | 1.7% |
| $25,000 to $34,999 | 58 | 2.4% |
| $35,000 to $49,999 | 202 | 8.4% |
| $50,000 to $74,999 | 345 | 14.4% |
| $75,000 to $99,999 | 379 | 15.8% |
| $100,000 to $149,999 | 840 | 35.0% |
| $150,000 to $199,999 | 290 | 12.1% |
| $200,000+ | 218 | 9.1% |
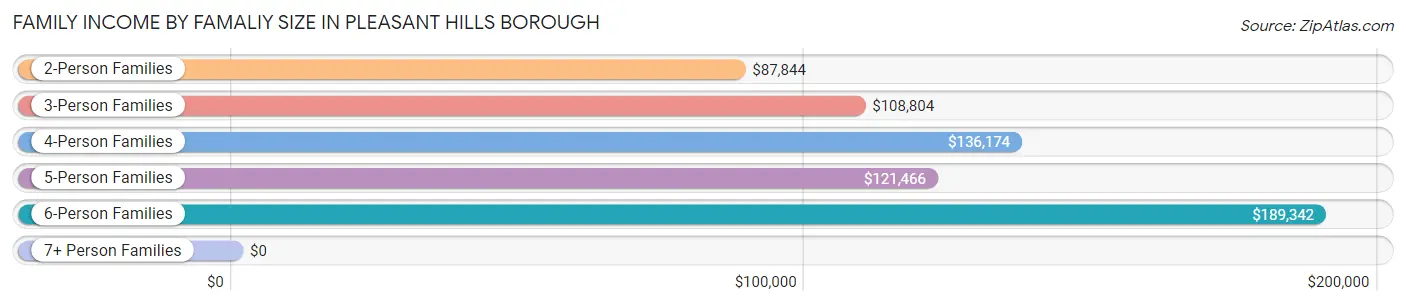
Family Income by Famaliy Size in Pleasant Hills borough
6-person families (38 | 1.6%) account for the highest median family income in Pleasant Hills borough with $189,342 per family, while 2-person families (1,335 | 55.6%) have the highest median income of $43,922 per family member.
| Income Bracket | # Families | Median Income |
| 2-Person Families | 1,335 (55.6%) | $87,844 |
| 3-Person Families | 443 (18.5%) | $108,804 |
| 4-Person Families | 393 (16.4%) | $136,174 |
| 5-Person Families | 190 (7.9%) | $121,466 |
| 6-Person Families | 38 (1.6%) | $189,342 |
| 7+ Person Families | 0 (0.0%) | $0 |
| Total | 2,399 (100.0%) | $111,450 |
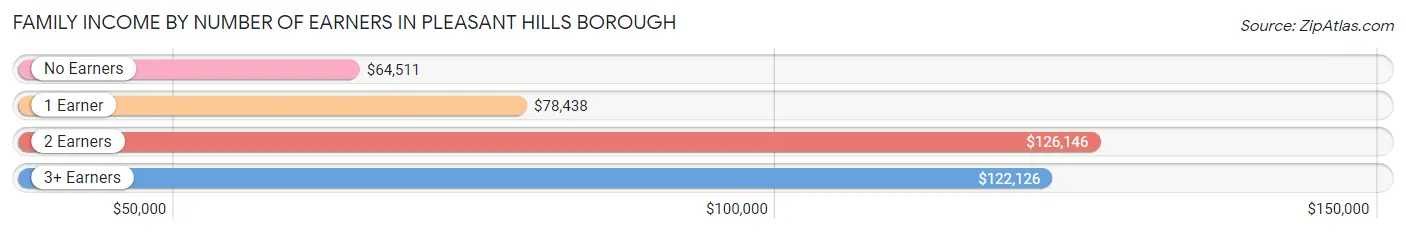
Family Income by Number of Earners in Pleasant Hills borough
The median family income in Pleasant Hills borough is $111,450, with families comprising 2 earners (841) having the highest median family income of $126,146, while families with no earners (464) have the lowest median family income of $64,511, accounting for 35.1% and 19.3% of families, respectively.
| Number of Earners | # Families | Median Income |
| No Earners | 464 (19.3%) | $64,511 |
| 1 Earner | 692 (28.8%) | $78,438 |
| 2 Earners | 841 (35.1%) | $126,146 |
| 3+ Earners | 402 (16.8%) | $122,126 |
| Total | 2,399 (100.0%) | $111,450 |
Household Income in Pleasant Hills borough
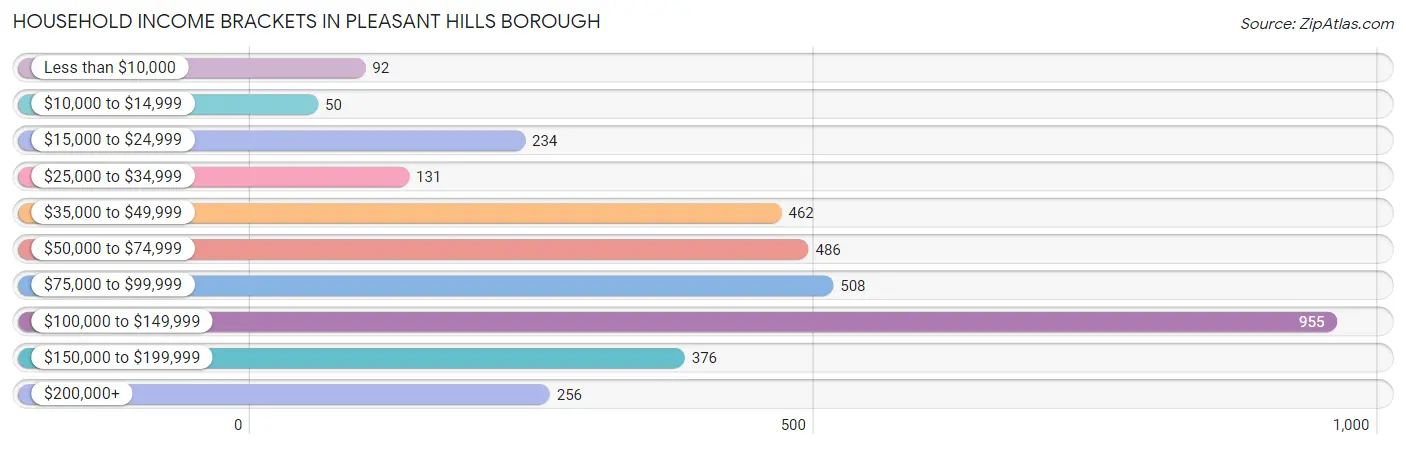
Household Income Brackets in Pleasant Hills borough
With 955 households falling in the category, the $100,000 to $149,999 income range is the most frequent in Pleasant Hills borough, accounting for 26.9% of all households. In contrast, only 50 households (1.4%) fall into the $10,000 to $14,999 income bracket, making it the least populous group.
| Income Bracket | # Households | % Households |
| Less than $10,000 | 92 | 2.6% |
| $10,000 to $14,999 | 50 | 1.4% |
| $15,000 to $24,999 | 234 | 6.6% |
| $25,000 to $34,999 | 131 | 3.7% |
| $35,000 to $49,999 | 462 | 13.0% |
| $50,000 to $74,999 | 486 | 13.7% |
| $75,000 to $99,999 | 508 | 14.3% |
| $100,000 to $149,999 | 955 | 26.9% |
| $150,000 to $199,999 | 376 | 10.6% |
| $200,000+ | 256 | 7.2% |
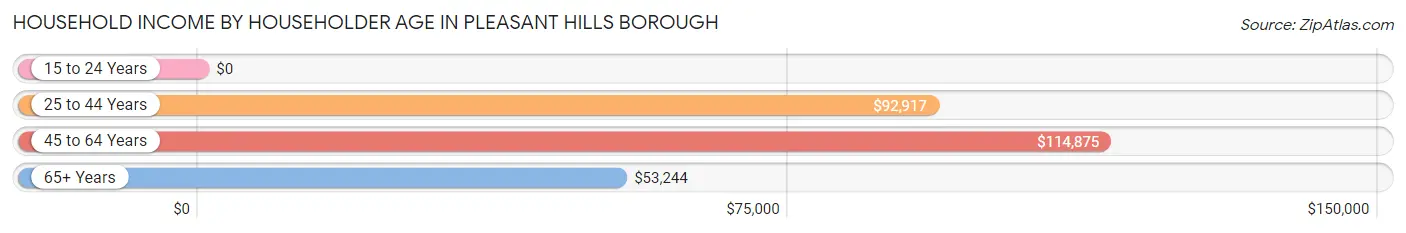
Household Income by Householder Age in Pleasant Hills borough
The median household income in Pleasant Hills borough is $88,893, with the highest median household income of $114,875 found in the 45 to 64 years age bracket for the primary householder. A total of 1,306 households (36.8%) fall into this category. Meanwhile, the 15 to 24 years age bracket for the primary householder has the lowest median household income of $0, with 43 households (1.2%) in this group.
| Income Bracket | # Households | Median Income |
| 15 to 24 Years | 43 (1.2%) | $0 |
| 25 to 44 Years | 898 (25.3%) | $92,917 |
| 45 to 64 Years | 1,306 (36.8%) | $114,875 |
| 65+ Years | 1,303 (36.7%) | $53,244 |
| Total | 3,550 (100.0%) | $88,893 |
Poverty in Pleasant Hills borough
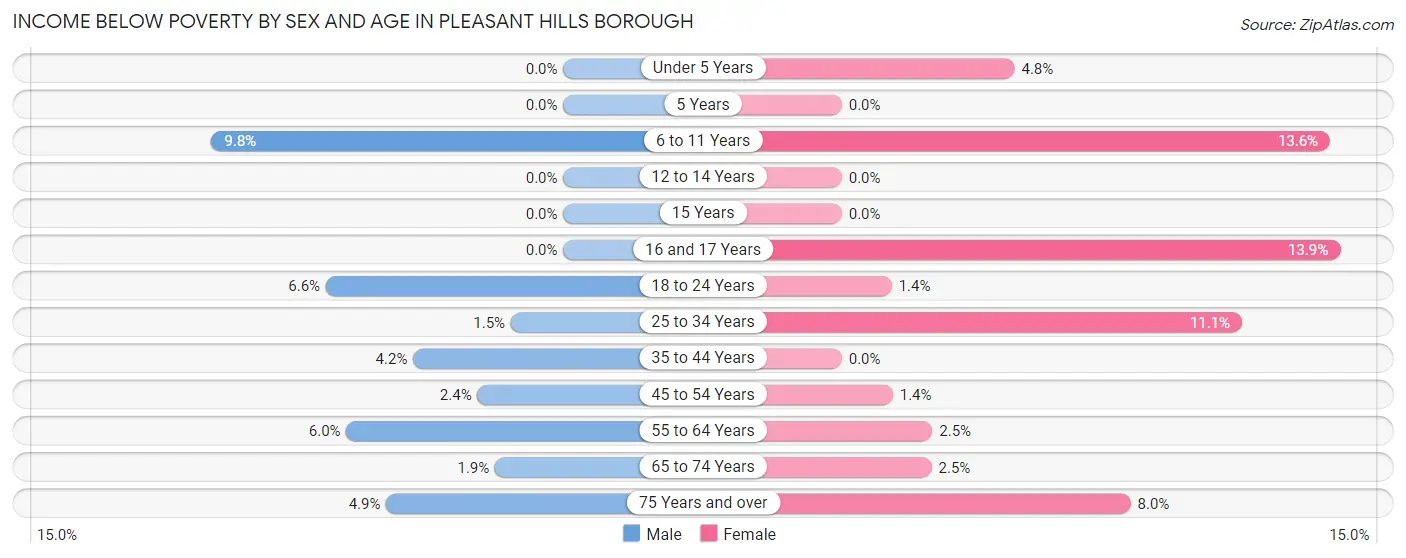
Income Below Poverty by Sex and Age in Pleasant Hills borough
With 3.5% poverty level for males and 4.8% for females among the residents of Pleasant Hills borough, 6 to 11 year old males and 16 and 17 year old females are the most vulnerable to poverty, with 20 males (9.8%) and 19 females (13.9%) in their respective age groups living below the poverty level.
| Age Bracket | Male | Female |
| Under 5 Years | 0 (0.0%) | 10 (4.8%) |
| 5 Years | 0 (0.0%) | 0 (0.0%) |
| 6 to 11 Years | 20 (9.8%) | 42 (13.6%) |
| 12 to 14 Years | 0 (0.0%) | 0 (0.0%) |
| 15 Years | 0 (0.0%) | 0 (0.0%) |
| 16 and 17 Years | 0 (0.0%) | 19 (13.9%) |
| 18 to 24 Years | 24 (6.6%) | 3 (1.4%) |
| 25 to 34 Years | 8 (1.5%) | 51 (11.1%) |
| 35 to 44 Years | 20 (4.2%) | 0 (0.0%) |
| 45 to 54 Years | 15 (2.4%) | 9 (1.4%) |
| 55 to 64 Years | 31 (6.0%) | 15 (2.5%) |
| 65 to 74 Years | 9 (1.9%) | 13 (2.5%) |
| 75 Years and over | 17 (4.9%) | 44 (8.0%) |
| Total | 144 (3.5%) | 206 (4.8%) |
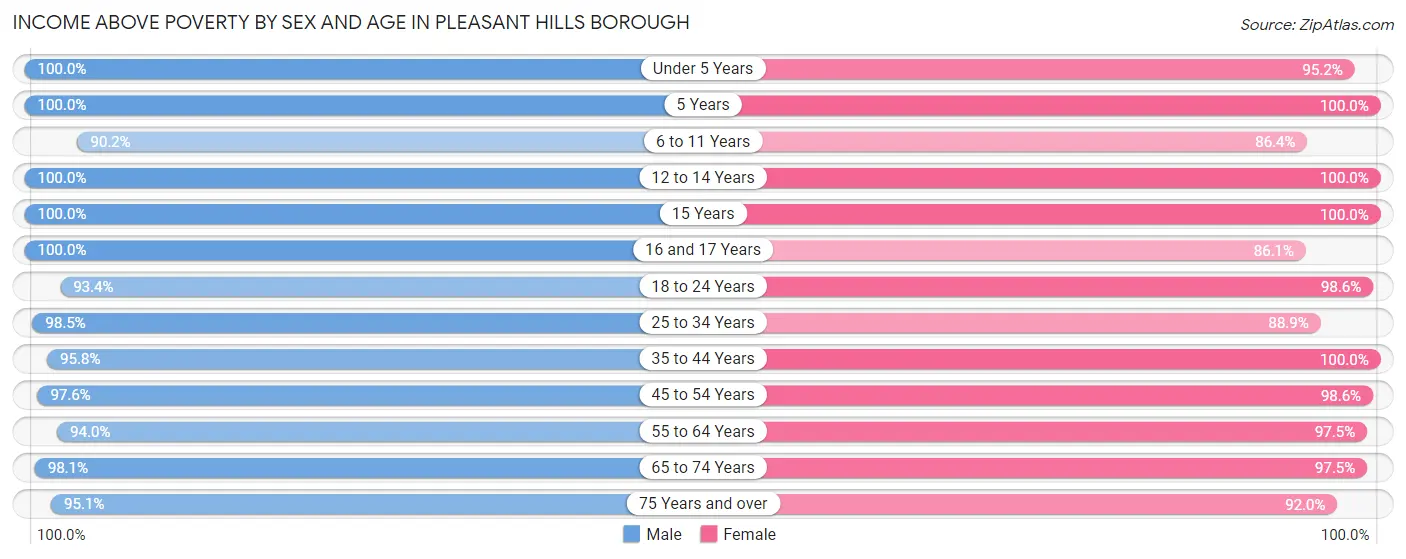
Income Above Poverty by Sex and Age in Pleasant Hills borough
According to the poverty statistics in Pleasant Hills borough, males aged under 5 years and females aged 5 years are the age groups that are most secure financially, with 100.0% of males and 100.0% of females in these age groups living above the poverty line.
| Age Bracket | Male | Female |
| Under 5 Years | 173 (100.0%) | 198 (95.2%) |
| 5 Years | 59 (100.0%) | 53 (100.0%) |
| 6 to 11 Years | 184 (90.2%) | 267 (86.4%) |
| 12 to 14 Years | 84 (100.0%) | 57 (100.0%) |
| 15 Years | 53 (100.0%) | 37 (100.0%) |
| 16 and 17 Years | 149 (100.0%) | 118 (86.1%) |
| 18 to 24 Years | 339 (93.4%) | 213 (98.6%) |
| 25 to 34 Years | 541 (98.5%) | 407 (88.9%) |
| 35 to 44 Years | 458 (95.8%) | 500 (100.0%) |
| 45 to 54 Years | 612 (97.6%) | 627 (98.6%) |
| 55 to 64 Years | 482 (94.0%) | 580 (97.5%) |
| 65 to 74 Years | 465 (98.1%) | 507 (97.5%) |
| 75 Years and over | 328 (95.1%) | 503 (92.0%) |
| Total | 3,927 (96.5%) | 4,067 (95.2%) |
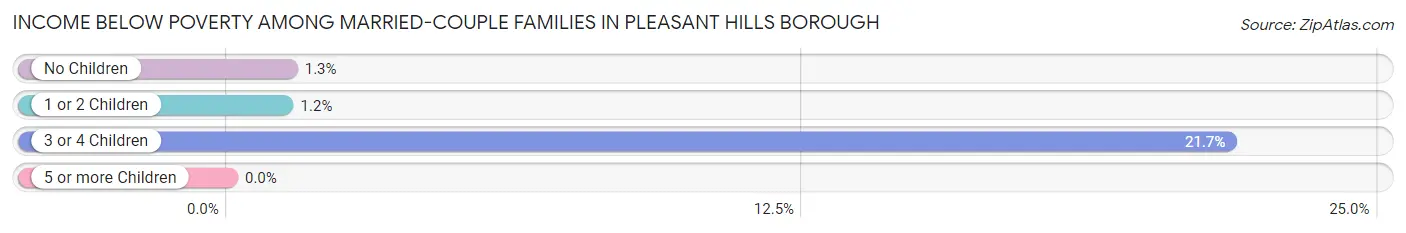
Income Below Poverty Among Married-Couple Families in Pleasant Hills borough
The poverty statistics for married-couple families in Pleasant Hills borough show that 2.2% or 44 of the total 1,988 families live below the poverty line. Families with 3 or 4 children have the highest poverty rate of 21.7%, comprising of 20 families. On the other hand, families with 1 or 2 children have the lowest poverty rate of 1.2%, which includes 8 families.
| Children | Above Poverty | Below Poverty |
| No Children | 1,218 (98.7%) | 16 (1.3%) |
| 1 or 2 Children | 654 (98.8%) | 8 (1.2%) |
| 3 or 4 Children | 72 (78.3%) | 20 (21.7%) |
| 5 or more Children | 0 (0.0%) | 0 (0.0%) |
| Total | 1,944 (97.8%) | 44 (2.2%) |
Income Below Poverty Among Single-Parent Households in Pleasant Hills borough
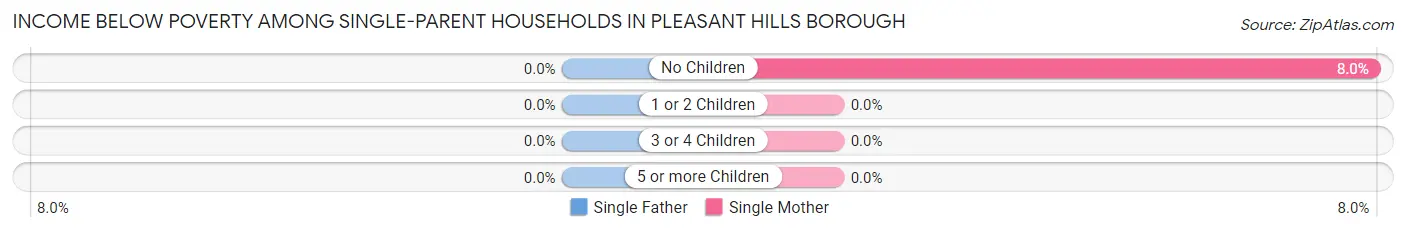
| Children | Single Father | Single Mother |
| No Children | 0 (0.0%) | 10 (8.0%) |
| 1 or 2 Children | 0 (0.0%) | 0 (0.0%) |
| 3 or 4 Children | 0 (0.0%) | 0 (0.0%) |
| 5 or more Children | 0 (0.0%) | 0 (0.0%) |
| Total | 0 (0.0%) | 10 (4.2%) |
Income Below Poverty Among Married-Couple vs Single-Parent Households in Pleasant Hills borough
The poverty data for Pleasant Hills borough shows that 44 of the married-couple family households (2.2%) and 10 of the single-parent households (2.4%) are living below the poverty level. Within the married-couple family households, those with 3 or 4 children have the highest poverty rate, with 20 households (21.7%) falling below the poverty line. Among the single-parent households, those with no children have the highest poverty rate, with 10 household (5.8%) living below poverty.
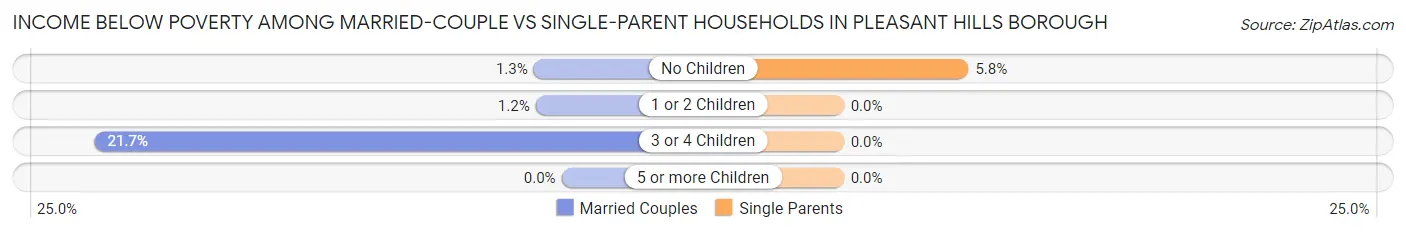
| Children | Married-Couple Families | Single-Parent Households |
| No Children | 16 (1.3%) | 10 (5.8%) |
| 1 or 2 Children | 8 (1.2%) | 0 (0.0%) |
| 3 or 4 Children | 20 (21.7%) | 0 (0.0%) |
| 5 or more Children | 0 (0.0%) | 0 (0.0%) |
| Total | 44 (2.2%) | 10 (2.4%) |
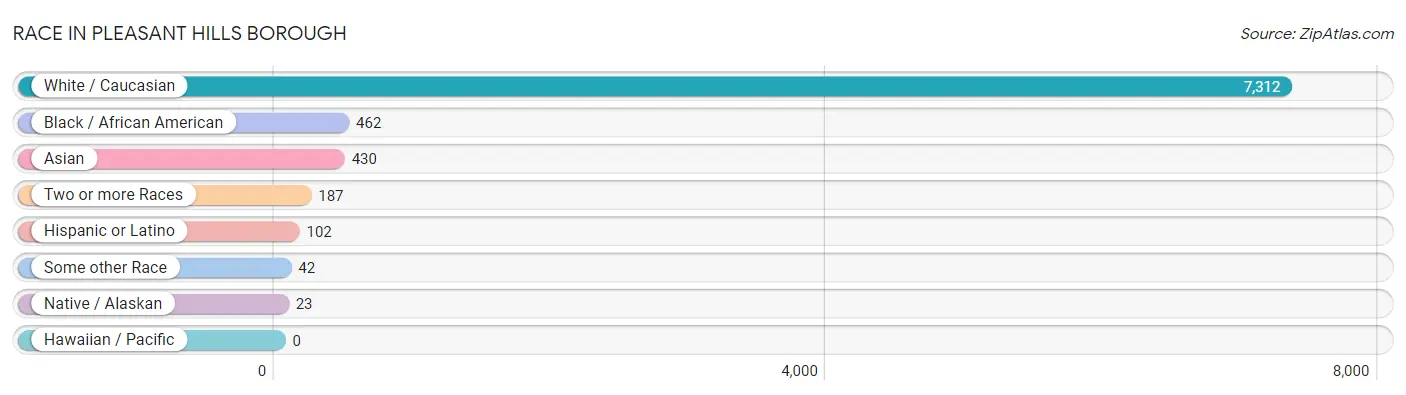
Race in Pleasant Hills borough
The most populous races in Pleasant Hills borough are White / Caucasian (7,312 | 86.5%), Black / African American (462 | 5.5%), and Asian (430 | 5.1%).
| Race | # Population | % Population |
| Asian | 430 | 5.1% |
| Black / African American | 462 | 5.5% |
| Hawaiian / Pacific | 0 | 0.0% |
| Hispanic or Latino | 102 | 1.2% |
| Native / Alaskan | 23 | 0.3% |
| White / Caucasian | 7,312 | 86.5% |
| Two or more Races | 187 | 2.2% |
| Some other Race | 42 | 0.5% |
| Total | 8,456 | 100.0% |
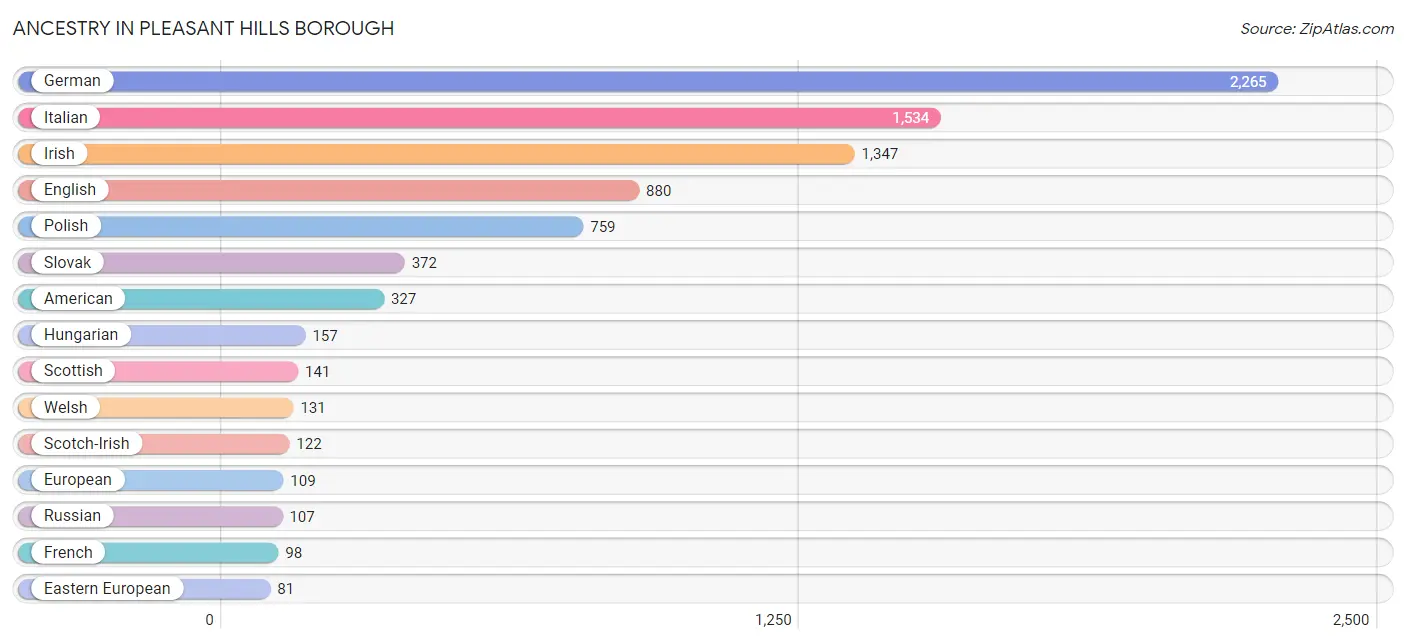
Ancestry in Pleasant Hills borough
The most populous ancestries reported in Pleasant Hills borough are German (2,265 | 26.8%), Italian (1,534 | 18.1%), Irish (1,347 | 15.9%), English (880 | 10.4%), and Polish (759 | 9.0%), together accounting for 80.2% of all Pleasant Hills borough residents.
| Ancestry | # Population | % Population |
| American | 327 | 3.9% |
| Arab | 60 | 0.7% |
| Austrian | 10 | 0.1% |
| Bhutanese | 27 | 0.3% |
| British | 47 | 0.6% |
| Carpatho Rusyn | 8 | 0.1% |
| Cherokee | 23 | 0.3% |
| Croatian | 18 | 0.2% |
| Cuban | 11 | 0.1% |
| Czech | 50 | 0.6% |
| Czechoslovakian | 9 | 0.1% |
| Danish | 8 | 0.1% |
| Dutch | 24 | 0.3% |
| Eastern European | 81 | 1.0% |
| English | 880 | 10.4% |
| European | 109 | 1.3% |
| French | 98 | 1.2% |
| French Canadian | 23 | 0.3% |
| German | 2,265 | 26.8% |
| Greek | 40 | 0.5% |
| Hungarian | 157 | 1.9% |
| Indian (Asian) | 40 | 0.5% |
| Irish | 1,347 | 15.9% |
| Italian | 1,534 | 18.1% |
| Jamaican | 73 | 0.9% |
| Korean | 10 | 0.1% |
| Lebanese | 8 | 0.1% |
| Lithuanian | 61 | 0.7% |
| Macedonian | 57 | 0.7% |
| Mexican | 40 | 0.5% |
| Nigerian | 9 | 0.1% |
| Northern European | 7 | 0.1% |
| Norwegian | 8 | 0.1% |
| Peruvian | 29 | 0.3% |
| Polish | 759 | 9.0% |
| Russian | 107 | 1.3% |
| Scotch-Irish | 122 | 1.4% |
| Scottish | 141 | 1.7% |
| Serbian | 28 | 0.3% |
| Slavic | 9 | 0.1% |
| Slovak | 372 | 4.4% |
| Slovene | 19 | 0.2% |
| South American | 29 | 0.3% |
| Spaniard | 22 | 0.3% |
| Sri Lankan | 14 | 0.2% |
| Subsaharan African | 29 | 0.3% |
| Swedish | 33 | 0.4% |
| Swiss | 18 | 0.2% |
| Syrian | 52 | 0.6% |
| Thai | 15 | 0.2% |
| Ukrainian | 34 | 0.4% |
| Welsh | 131 | 1.5% |
| Yugoslavian | 35 | 0.4% | View All 53 Rows |
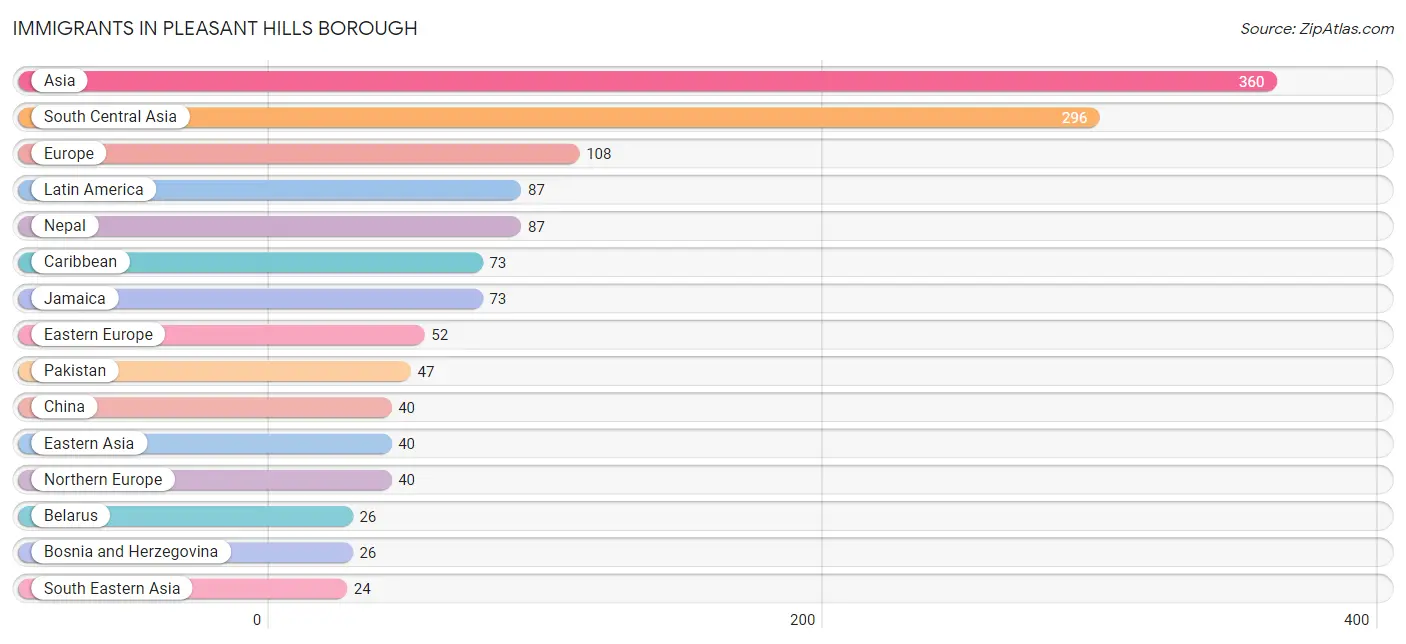
Immigrants in Pleasant Hills borough
The most numerous immigrant groups reported in Pleasant Hills borough came from Asia (360 | 4.3%), South Central Asia (296 | 3.5%), Europe (108 | 1.3%), Latin America (87 | 1.0%), and Nepal (87 | 1.0%), together accounting for 11.1% of all Pleasant Hills borough residents.
| Immigration Origin | # Population | % Population |
| Africa | 20 | 0.2% |
| Asia | 360 | 4.3% |
| Belarus | 26 | 0.3% |
| Bosnia and Herzegovina | 26 | 0.3% |
| Canada | 23 | 0.3% |
| Caribbean | 73 | 0.9% |
| China | 40 | 0.5% |
| Eastern Africa | 20 | 0.2% |
| Eastern Asia | 40 | 0.5% |
| Eastern Europe | 52 | 0.6% |
| England | 16 | 0.2% |
| Europe | 108 | 1.3% |
| India | 15 | 0.2% |
| Italy | 8 | 0.1% |
| Jamaica | 73 | 0.9% |
| Latin America | 87 | 1.0% |
| Nepal | 87 | 1.0% |
| Northern Europe | 40 | 0.5% |
| Norway | 8 | 0.1% |
| Pakistan | 47 | 0.6% |
| Peru | 14 | 0.2% |
| Philippines | 10 | 0.1% |
| Scotland | 16 | 0.2% |
| South America | 14 | 0.2% |
| South Central Asia | 296 | 3.5% |
| South Eastern Asia | 24 | 0.3% |
| Southern Europe | 16 | 0.2% |
| Spain | 8 | 0.1% |
| Vietnam | 14 | 0.2% | View All 29 Rows |
Sex and Age in Pleasant Hills borough
Sex and Age in Pleasant Hills borough
The most populous age groups in Pleasant Hills borough are 50 to 54 Years (339 | 8.2%) for men and 60 to 64 Years (403 | 9.3%) for women.
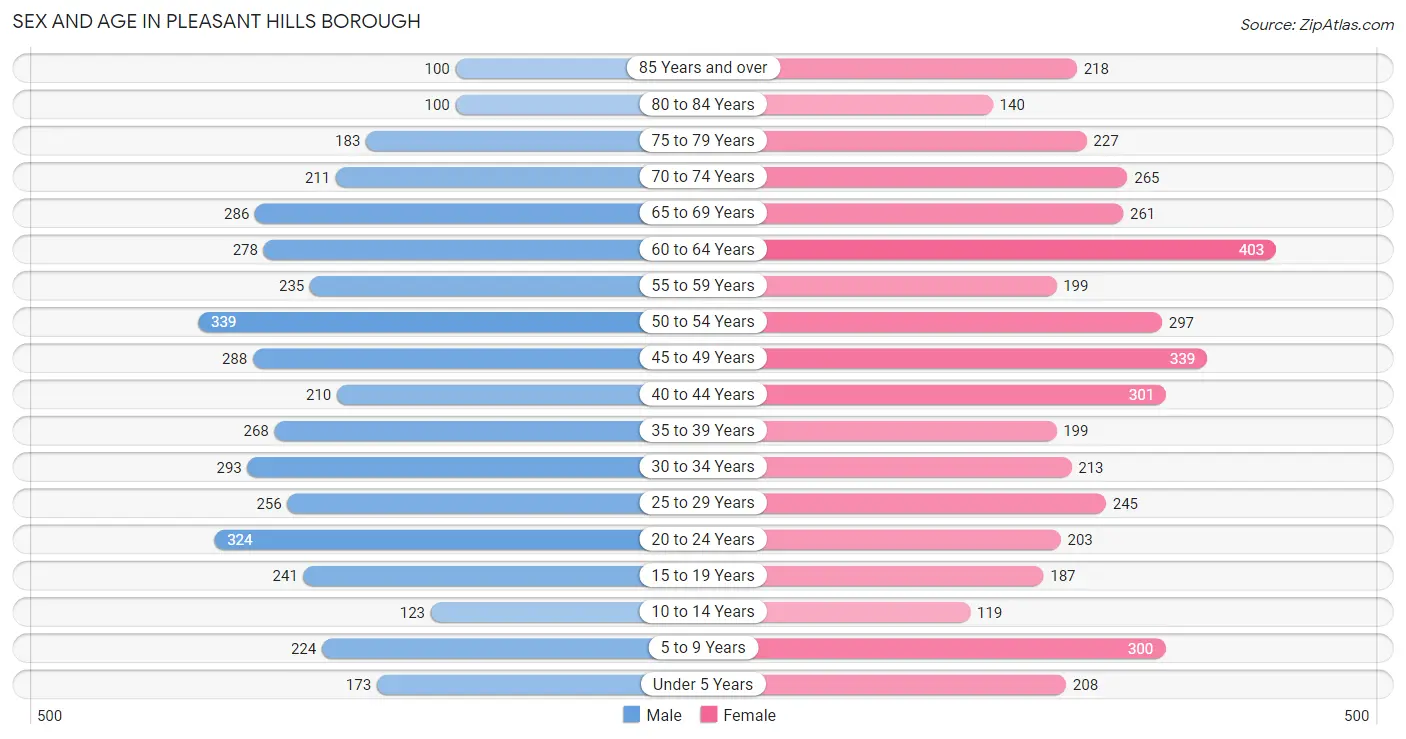
| Age Bracket | Male | Female |
| Under 5 Years | 173 (4.2%) | 208 (4.8%) |
| 5 to 9 Years | 224 (5.4%) | 300 (6.9%) |
| 10 to 14 Years | 123 (3.0%) | 119 (2.8%) |
| 15 to 19 Years | 241 (5.8%) | 187 (4.3%) |
| 20 to 24 Years | 324 (7.8%) | 203 (4.7%) |
| 25 to 29 Years | 256 (6.2%) | 245 (5.7%) |
| 30 to 34 Years | 293 (7.1%) | 213 (4.9%) |
| 35 to 39 Years | 268 (6.5%) | 199 (4.6%) |
| 40 to 44 Years | 210 (5.1%) | 301 (7.0%) |
| 45 to 49 Years | 288 (7.0%) | 339 (7.8%) |
| 50 to 54 Years | 339 (8.2%) | 297 (6.9%) |
| 55 to 59 Years | 235 (5.7%) | 199 (4.6%) |
| 60 to 64 Years | 278 (6.7%) | 403 (9.3%) |
| 65 to 69 Years | 286 (6.9%) | 261 (6.0%) |
| 70 to 74 Years | 211 (5.1%) | 265 (6.1%) |
| 75 to 79 Years | 183 (4.4%) | 227 (5.2%) |
| 80 to 84 Years | 100 (2.4%) | 140 (3.2%) |
| 85 Years and over | 100 (2.4%) | 218 (5.0%) |
| Total | 4,132 (100.0%) | 4,324 (100.0%) |
Families and Households in Pleasant Hills borough
Median Family Size in Pleasant Hills borough
The median family size in Pleasant Hills borough is 2.84 persons per family, with married-couple families (1,988 | 82.9%) accounting for the largest median family size of 2.93 persons per family. On the other hand, single female/mother families (237 | 9.9%) represent the smallest median family size with 2.40 persons per family.
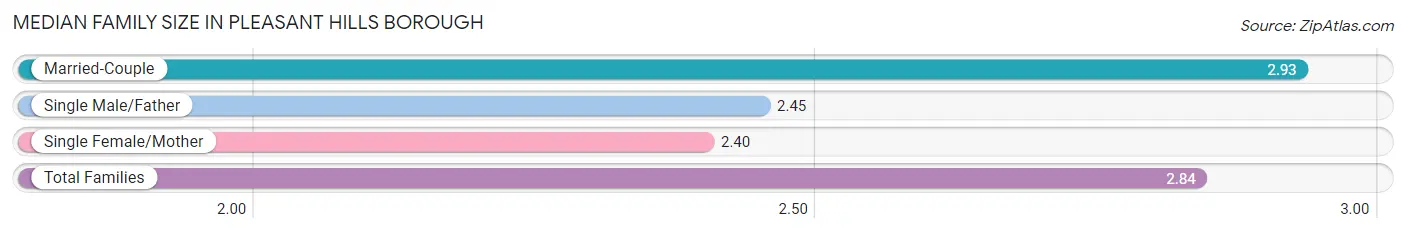
| Family Type | # Families | Family Size |
| Married-Couple | 1,988 (82.9%) | 2.93 |
| Single Male/Father | 174 (7.2%) | 2.45 |
| Single Female/Mother | 237 (9.9%) | 2.40 |
| Total Families | 2,399 (100.0%) | 2.84 |
Median Household Size in Pleasant Hills borough
The median household size in Pleasant Hills borough is 2.35 persons per household, with married-couple households (1,988 | 56.0%) accounting for the largest median household size of 2.93 persons per household. non-family households (1,151 | 32.4%) represent the smallest median household size with 1.22 persons per household.
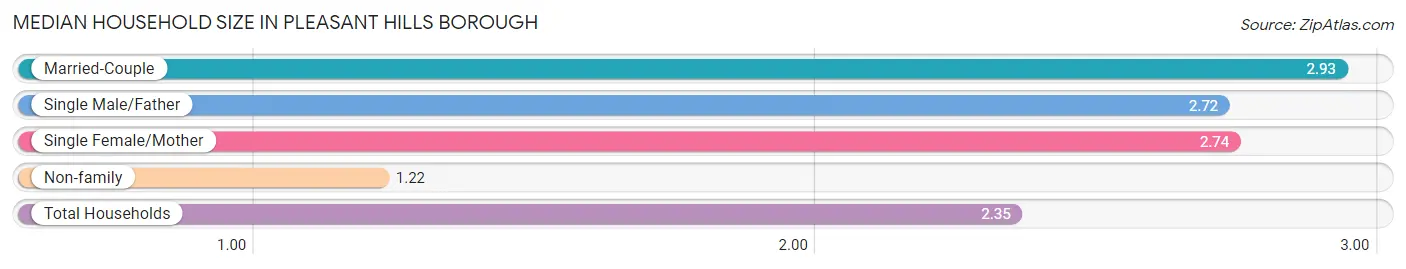
| Household Type | # Households | Household Size |
| Married-Couple | 1,988 (56.0%) | 2.93 |
| Single Male/Father | 174 (4.9%) | 2.72 |
| Single Female/Mother | 237 (6.7%) | 2.74 |
| Non-family | 1,151 (32.4%) | 1.22 |
| Total Households | 3,550 (100.0%) | 2.35 |
Household Size by Marriage Status in Pleasant Hills borough
Out of a total of 3,550 households in Pleasant Hills borough, 2,399 (67.6%) are family households, while 1,151 (32.4%) are nonfamily households. The most numerous type of family households are 2-person households, comprising 1,245, and the most common type of nonfamily households are 1-person households, comprising 921.
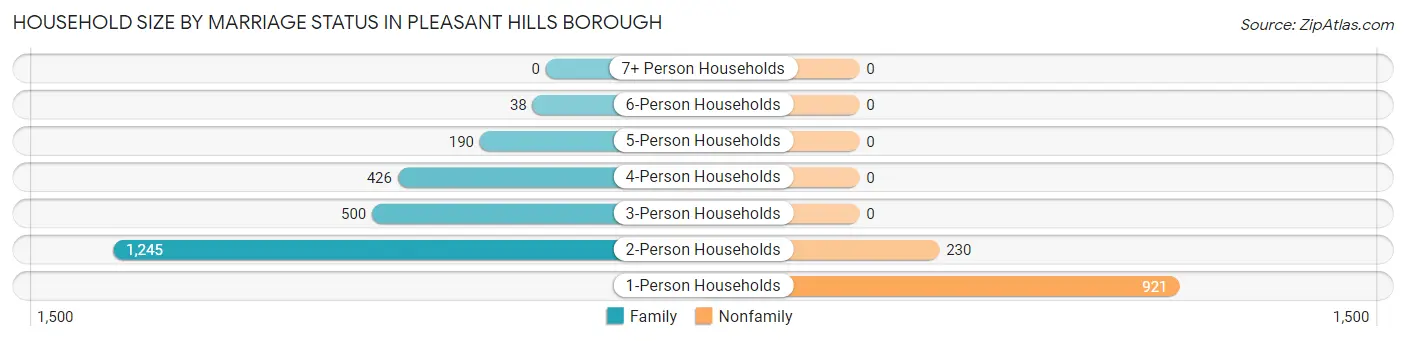
| Household Size | Family Households | Nonfamily Households |
| 1-Person Households | - | 921 (25.9%) |
| 2-Person Households | 1,245 (35.1%) | 230 (6.5%) |
| 3-Person Households | 500 (14.1%) | 0 (0.0%) |
| 4-Person Households | 426 (12.0%) | 0 (0.0%) |
| 5-Person Households | 190 (5.3%) | 0 (0.0%) |
| 6-Person Households | 38 (1.1%) | 0 (0.0%) |
| 7+ Person Households | 0 (0.0%) | 0 (0.0%) |
| Total | 2,399 (67.6%) | 1,151 (32.4%) |
Female Fertility in Pleasant Hills borough
Fertility by Age in Pleasant Hills borough
Average fertility rate in Pleasant Hills borough is 80.0 births per 1,000 women. Women in the age bracket of 20 to 34 years have the highest fertility rate with 120.0 births per 1,000 women. Women in the age bracket of 20 to 34 years acount for 56.4% of all women with births.
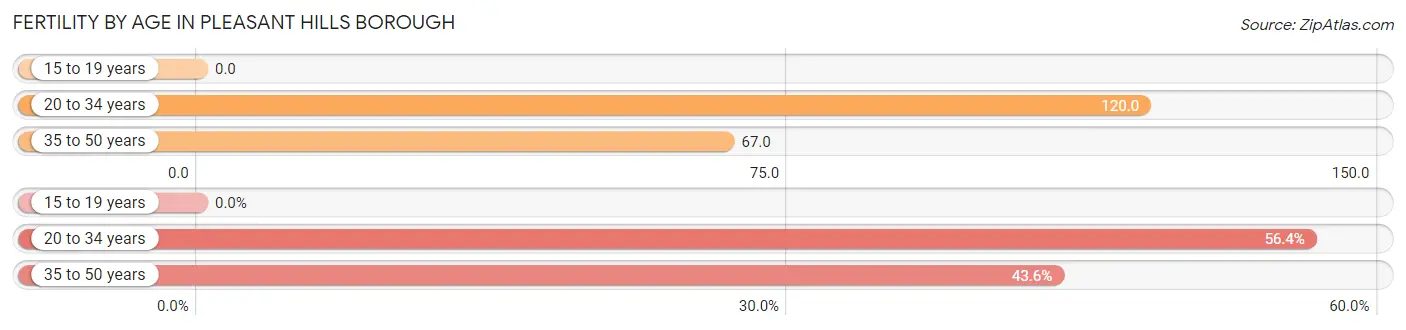
| Age Bracket | Women with Births | Births / 1,000 Women |
| 15 to 19 years | 0 (0.0%) | 0.0 |
| 20 to 34 years | 79 (56.4%) | 120.0 |
| 35 to 50 years | 61 (43.6%) | 67.0 |
| Total | 140 (100.0%) | 80.0 |
Fertility by Age by Marriage Status in Pleasant Hills borough
81.4% of women with births (140) in Pleasant Hills borough are married. The highest percentage of unmarried women with births falls into 20 to 34 years age bracket with 32.9% of them unmarried at the time of birth, while the lowest percentage of unmarried women with births belong to 35 to 50 years age bracket with 0.0% of them unmarried.
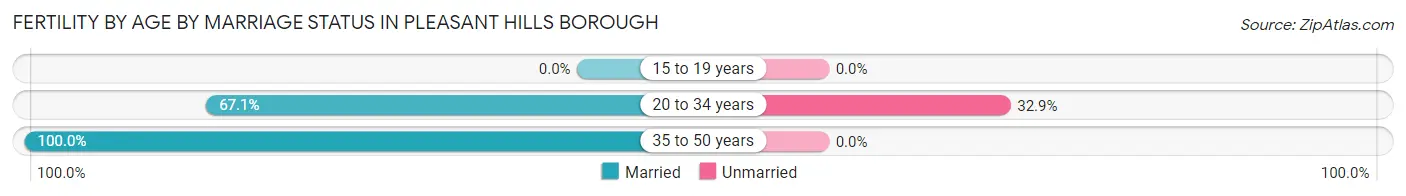
| Age Bracket | Married | Unmarried |
| 15 to 19 years | 0 (0.0%) | 0 (0.0%) |
| 20 to 34 years | 53 (67.1%) | 26 (32.9%) |
| 35 to 50 years | 61 (100.0%) | 0 (0.0%) |
| Total | 114 (81.4%) | 26 (18.6%) |
Fertility by Education in Pleasant Hills borough
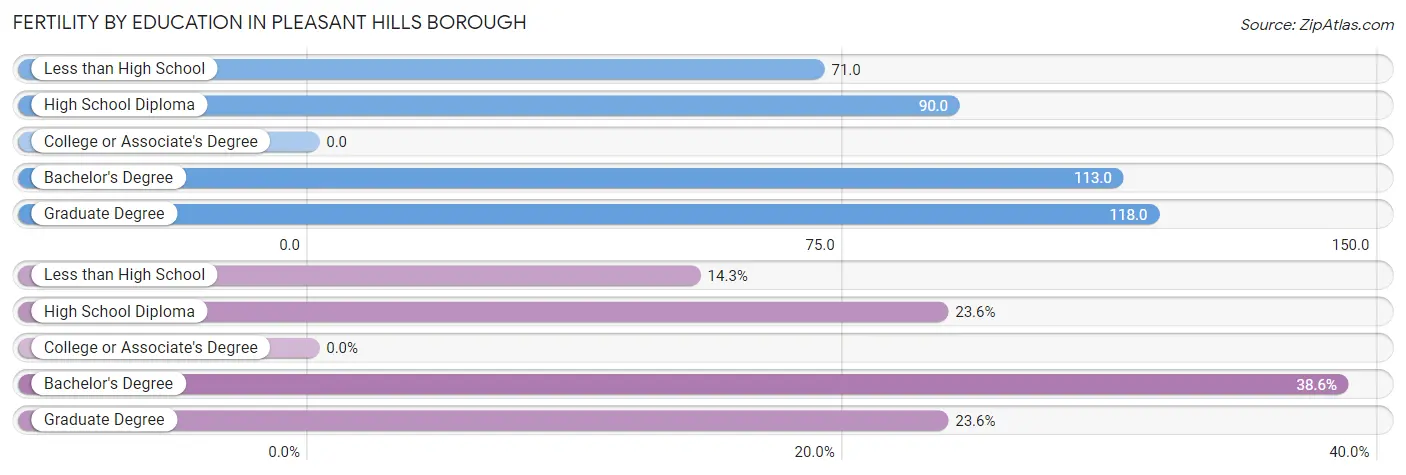
| Educational Attainment | Women with Births | Births / 1,000 Women |
| Less than High School | 20 (14.3%) | 71.0 |
| High School Diploma | 33 (23.6%) | 90.0 |
| College or Associate's Degree | 0 (0.0%) | 0.0 |
| Bachelor's Degree | 54 (38.6%) | 113.0 |
| Graduate Degree | 33 (23.6%) | 118.0 |
| Total | 140 (100.0%) | 80.0 |
Fertility by Education by Marriage Status in Pleasant Hills borough
18.6% of women with births in Pleasant Hills borough are unmarried. Women with the educational attainment of less than high school are most likely to be married with 100.0% of them married at childbirth, while women with the educational attainment of high school diploma are least likely to be married with 78.8% of them unmarried at childbirth.
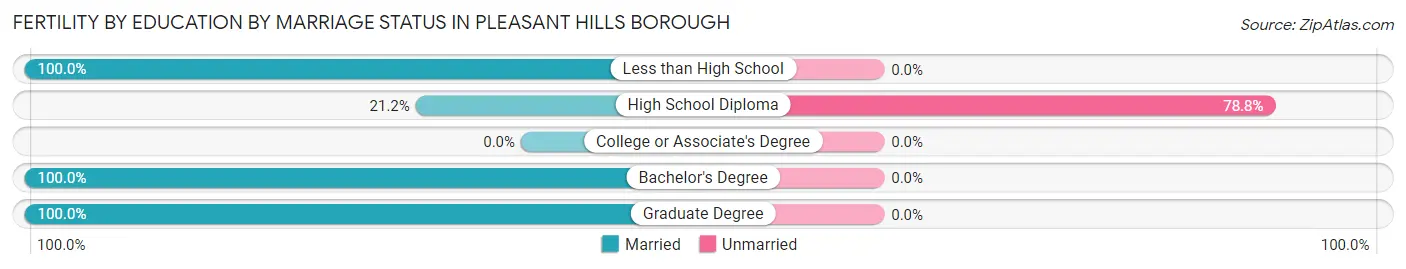
| Educational Attainment | Married | Unmarried |
| Less than High School | 20 (100.0%) | 0 (0.0%) |
| High School Diploma | 7 (21.2%) | 26 (78.8%) |
| College or Associate's Degree | 0 (0.0%) | 0 (0.0%) |
| Bachelor's Degree | 54 (100.0%) | 0 (0.0%) |
| Graduate Degree | 33 (100.0%) | 0 (0.0%) |
| Total | 114 (81.4%) | 26 (18.6%) |
Employment Characteristics in Pleasant Hills borough
Employment by Class of Employer in Pleasant Hills borough
Among the 4,287 employed individuals in Pleasant Hills borough, private company employees (2,466 | 57.5%), not-for-profit organizations (955 | 22.3%), and local government employees (287 | 6.7%) make up the most common classes of employment.
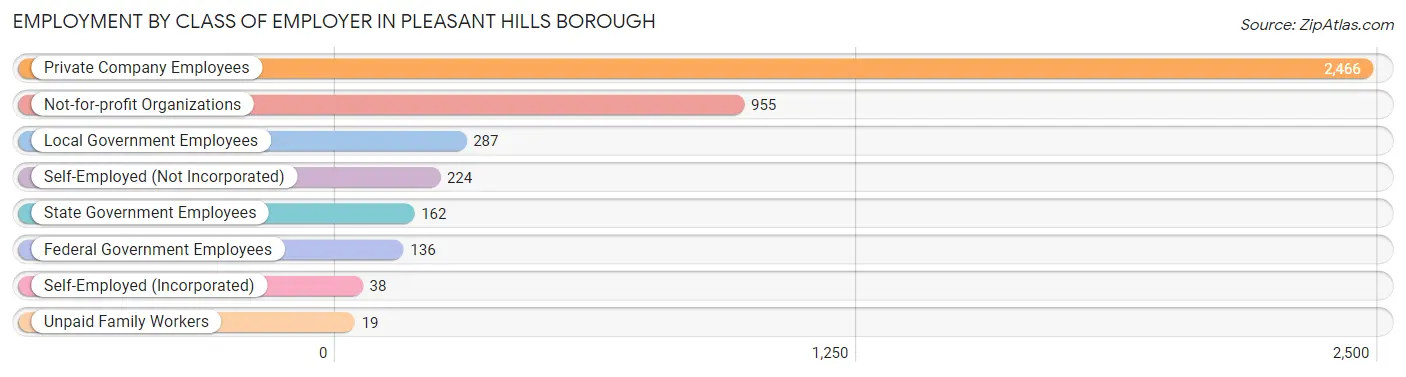
| Employer Class | # Employees | % Employees |
| Private Company Employees | 2,466 | 57.5% |
| Self-Employed (Incorporated) | 38 | 0.9% |
| Self-Employed (Not Incorporated) | 224 | 5.2% |
| Not-for-profit Organizations | 955 | 22.3% |
| Local Government Employees | 287 | 6.7% |
| State Government Employees | 162 | 3.8% |
| Federal Government Employees | 136 | 3.2% |
| Unpaid Family Workers | 19 | 0.4% |
| Total | 4,287 | 100.0% |
Employment Status by Age in Pleasant Hills borough
According to the labor force statistics for Pleasant Hills borough, out of the total population over 16 years of age (7,219), 62.2% or 4,490 individuals are in the labor force, with 4.6% or 207 of them unemployed. The age group with the highest labor force participation rate is 25 to 29 years, with 94.8% or 475 individuals in the labor force. Within the labor force, the 16 to 19 years age range has the highest percentage of unemployed individuals, with 45.7% or 95 of them being unemployed.
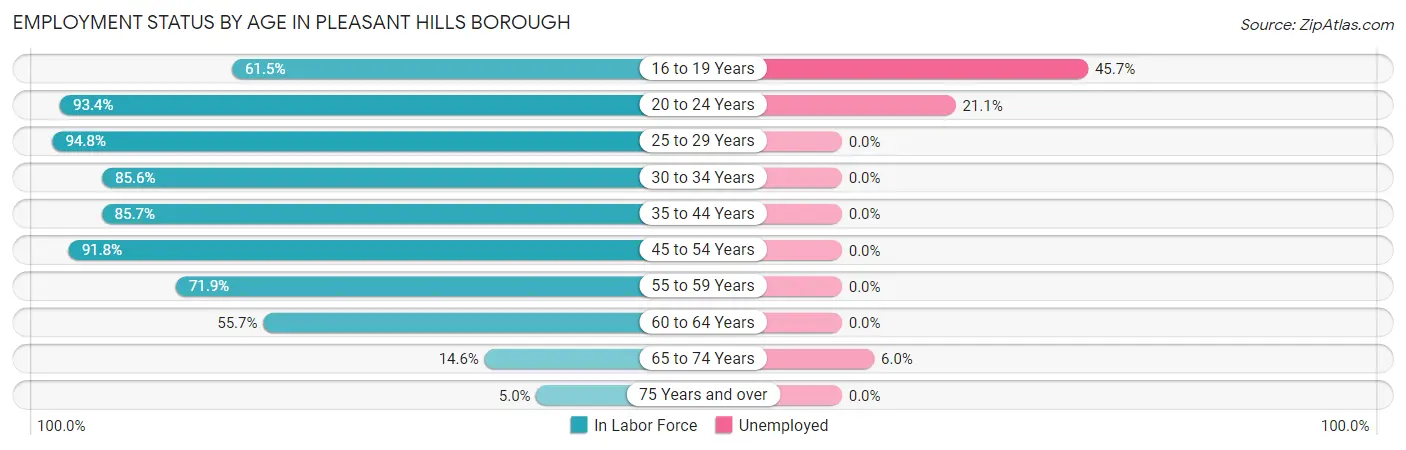
| Age Bracket | In Labor Force | Unemployed |
| 16 to 19 Years | 208 (61.5%) | 95 (45.7%) |
| 20 to 24 Years | 492 (93.4%) | 104 (21.1%) |
| 25 to 29 Years | 475 (94.8%) | 0 (0.0%) |
| 30 to 34 Years | 433 (85.6%) | 0 (0.0%) |
| 35 to 44 Years | 838 (85.7%) | 0 (0.0%) |
| 45 to 54 Years | 1,159 (91.8%) | 0 (0.0%) |
| 55 to 59 Years | 312 (71.9%) | 0 (0.0%) |
| 60 to 64 Years | 379 (55.7%) | 0 (0.0%) |
| 65 to 74 Years | 149 (14.6%) | 9 (6.0%) |
| 75 Years and over | 48 (5.0%) | 0 (0.0%) |
| Total | 4,490 (62.2%) | 207 (4.6%) |
Employment Status by Educational Attainment in Pleasant Hills borough
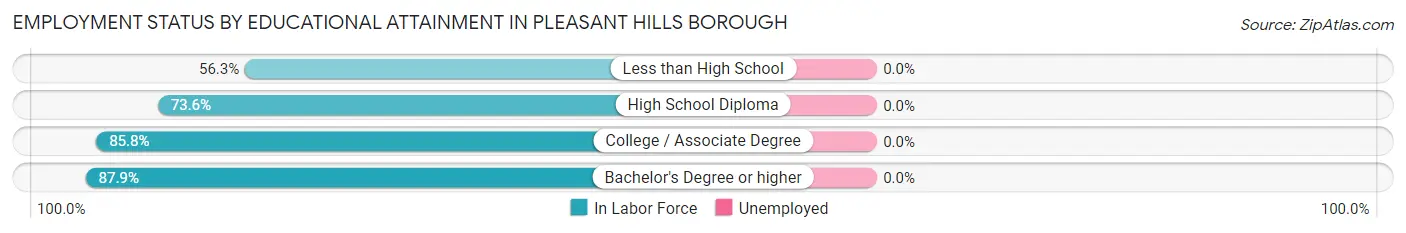
| Educational Attainment | In Labor Force | Unemployed |
| Less than High School | 135 (56.3%) | 0 (0.0%) |
| High School Diploma | 693 (73.6%) | 0 (0.0%) |
| College / Associate Degree | 1,169 (85.8%) | 0 (0.0%) |
| Bachelor's Degree or higher | 1,599 (87.9%) | 0 (0.0%) |
| Total | 3,595 (82.4%) | 0 (0.0%) |
Employment Occupations by Sex in Pleasant Hills borough
Management, Business, Science and Arts Occupations
The most common Management, Business, Science and Arts occupations in Pleasant Hills borough are Community & Social Service (539 | 12.6%), Computers, Engineering & Science (471 | 11.0%), Health Diagnosing & Treating (352 | 8.2%), Business & Financial (330 | 7.7%), and Management (305 | 7.1%).
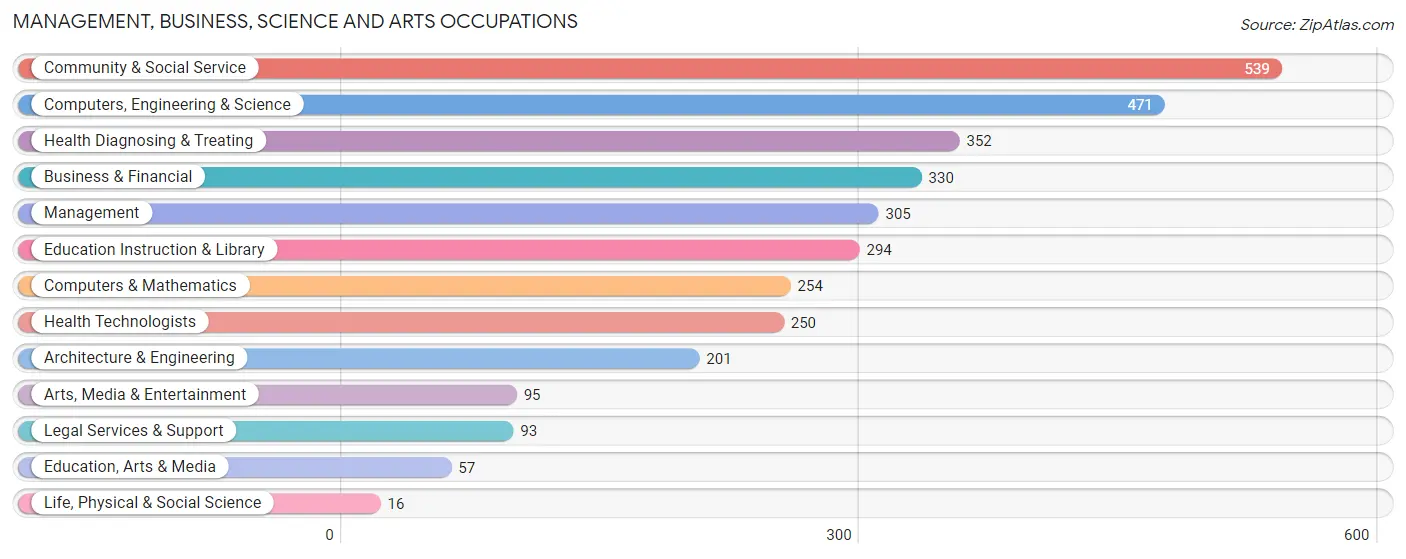
Management, Business, Science and Arts Occupations by Sex
Within the Management, Business, Science and Arts occupations in Pleasant Hills borough, the most male-oriented occupations are Architecture & Engineering (100.0%), Life, Physical & Social Science (100.0%), and Computers, Engineering & Science (79.6%), while the most female-oriented occupations are Arts, Media & Entertainment (90.5%), Education Instruction & Library (85.4%), and Community & Social Service (78.8%).
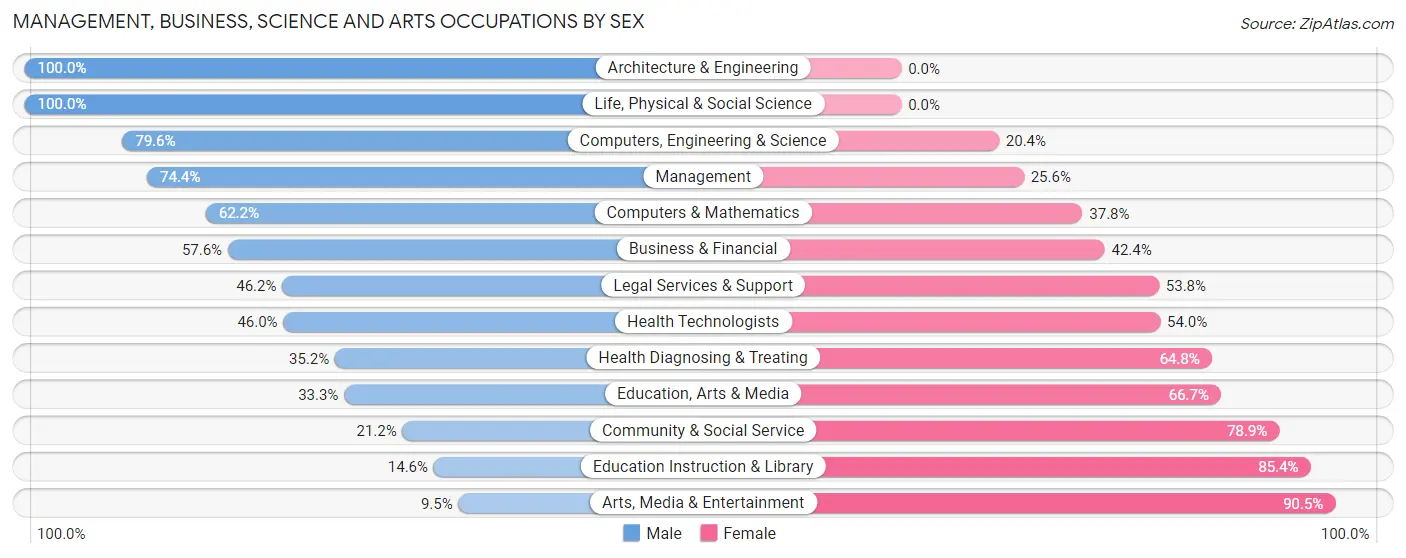
| Occupation | Male | Female |
| Management | 227 (74.4%) | 78 (25.6%) |
| Business & Financial | 190 (57.6%) | 140 (42.4%) |
| Computers, Engineering & Science | 375 (79.6%) | 96 (20.4%) |
| Computers & Mathematics | 158 (62.2%) | 96 (37.8%) |
| Architecture & Engineering | 201 (100.0%) | 0 (0.0%) |
| Life, Physical & Social Science | 16 (100.0%) | 0 (0.0%) |
| Community & Social Service | 114 (21.1%) | 425 (78.8%) |
| Education, Arts & Media | 19 (33.3%) | 38 (66.7%) |
| Legal Services & Support | 43 (46.2%) | 50 (53.8%) |
| Education Instruction & Library | 43 (14.6%) | 251 (85.4%) |
| Arts, Media & Entertainment | 9 (9.5%) | 86 (90.5%) |
| Health Diagnosing & Treating | 124 (35.2%) | 228 (64.8%) |
| Health Technologists | 115 (46.0%) | 135 (54.0%) |
| Total (Category) | 1,030 (51.6%) | 967 (48.4%) |
| Total (Overall) | 2,292 (53.6%) | 1,987 (46.4%) |
Services Occupations
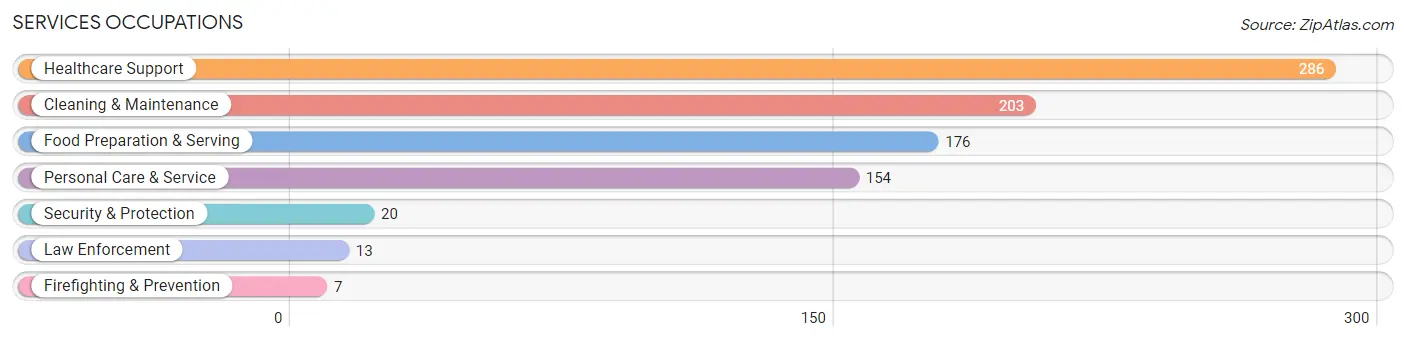
The most common Services occupations in Pleasant Hills borough are Healthcare Support (286 | 6.7%), Cleaning & Maintenance (203 | 4.7%), Food Preparation & Serving (176 | 4.1%), Personal Care & Service (154 | 3.6%), and Security & Protection (20 | 0.5%).
Services Occupations by Sex
Within the Services occupations in Pleasant Hills borough, the most male-oriented occupations are Law Enforcement (100.0%), Cleaning & Maintenance (100.0%), and Security & Protection (65.0%), while the most female-oriented occupations are Firefighting & Prevention (100.0%), Personal Care & Service (94.2%), and Food Preparation & Serving (67.0%).
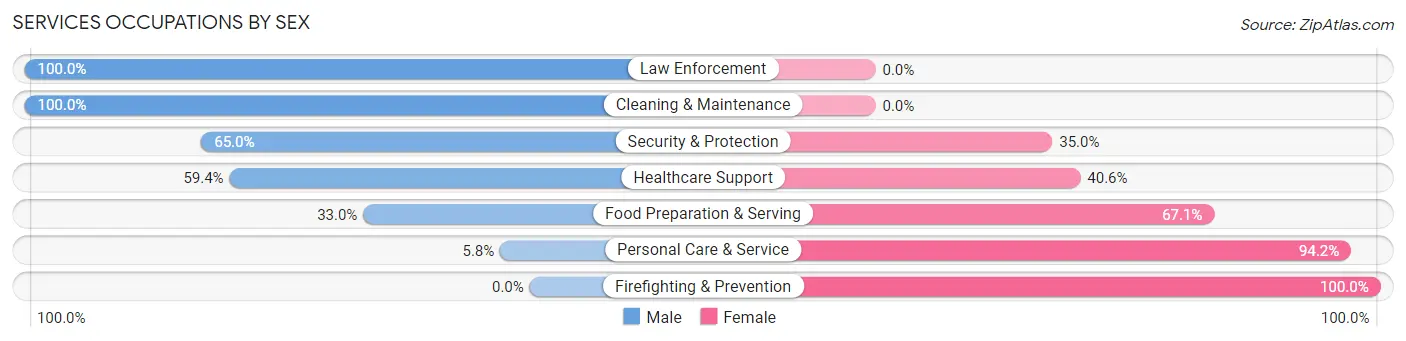
| Occupation | Male | Female |
| Healthcare Support | 170 (59.4%) | 116 (40.6%) |
| Security & Protection | 13 (65.0%) | 7 (35.0%) |
| Firefighting & Prevention | 0 (0.0%) | 7 (100.0%) |
| Law Enforcement | 13 (100.0%) | 0 (0.0%) |
| Food Preparation & Serving | 58 (33.0%) | 118 (67.0%) |
| Cleaning & Maintenance | 203 (100.0%) | 0 (0.0%) |
| Personal Care & Service | 9 (5.8%) | 145 (94.2%) |
| Total (Category) | 453 (54.0%) | 386 (46.0%) |
| Total (Overall) | 2,292 (53.6%) | 1,987 (46.4%) |
Sales and Office Occupations
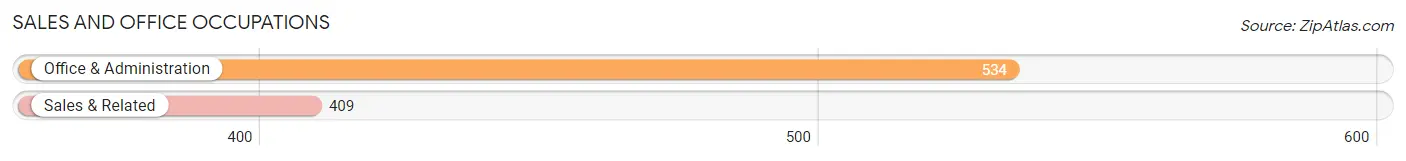
The most common Sales and Office occupations in Pleasant Hills borough are Office & Administration (534 | 12.5%), and Sales & Related (409 | 9.6%).
Sales and Office Occupations by Sex
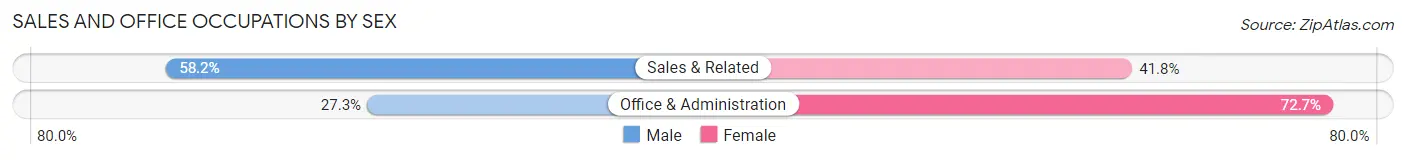
| Occupation | Male | Female |
| Sales & Related | 238 (58.2%) | 171 (41.8%) |
| Office & Administration | 146 (27.3%) | 388 (72.7%) |
| Total (Category) | 384 (40.7%) | 559 (59.3%) |
| Total (Overall) | 2,292 (53.6%) | 1,987 (46.4%) |
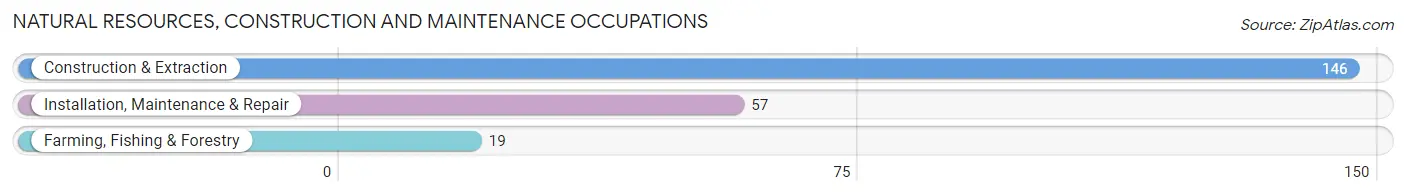
Natural Resources, Construction and Maintenance Occupations
The most common Natural Resources, Construction and Maintenance occupations in Pleasant Hills borough are Construction & Extraction (146 | 3.4%), Installation, Maintenance & Repair (57 | 1.3%), and Farming, Fishing & Forestry (19 | 0.4%).
Natural Resources, Construction and Maintenance Occupations by Sex
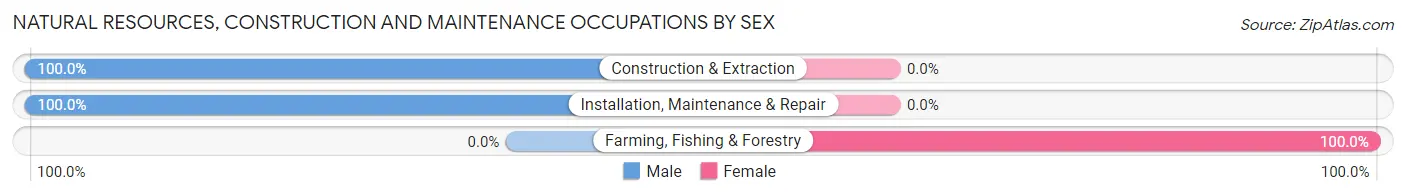
| Occupation | Male | Female |
| Farming, Fishing & Forestry | 0 (0.0%) | 19 (100.0%) |
| Construction & Extraction | 146 (100.0%) | 0 (0.0%) |
| Installation, Maintenance & Repair | 57 (100.0%) | 0 (0.0%) |
| Total (Category) | 203 (91.4%) | 19 (8.6%) |
| Total (Overall) | 2,292 (53.6%) | 1,987 (46.4%) |
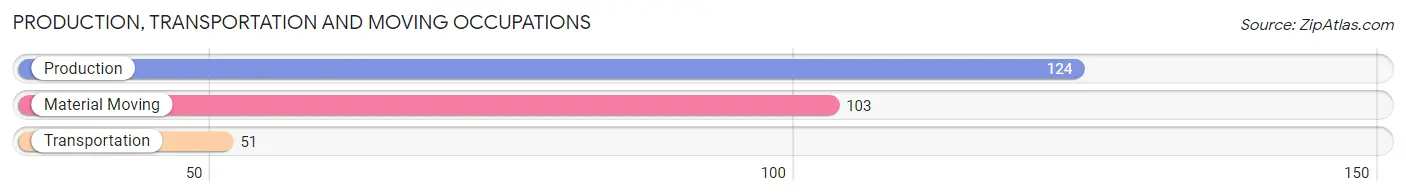
Production, Transportation and Moving Occupations
The most common Production, Transportation and Moving occupations in Pleasant Hills borough are Production (124 | 2.9%), Material Moving (103 | 2.4%), and Transportation (51 | 1.2%).
Production, Transportation and Moving Occupations by Sex
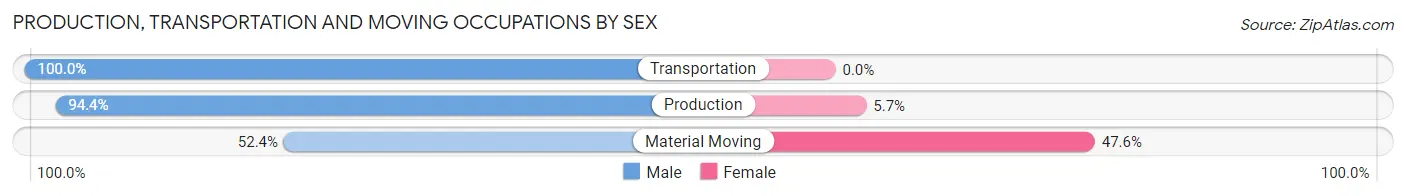
| Occupation | Male | Female |
| Production | 117 (94.4%) | 7 (5.7%) |
| Transportation | 51 (100.0%) | 0 (0.0%) |
| Material Moving | 54 (52.4%) | 49 (47.6%) |
| Total (Category) | 222 (79.9%) | 56 (20.1%) |
| Total (Overall) | 2,292 (53.6%) | 1,987 (46.4%) |
Employment Industries by Sex in Pleasant Hills borough
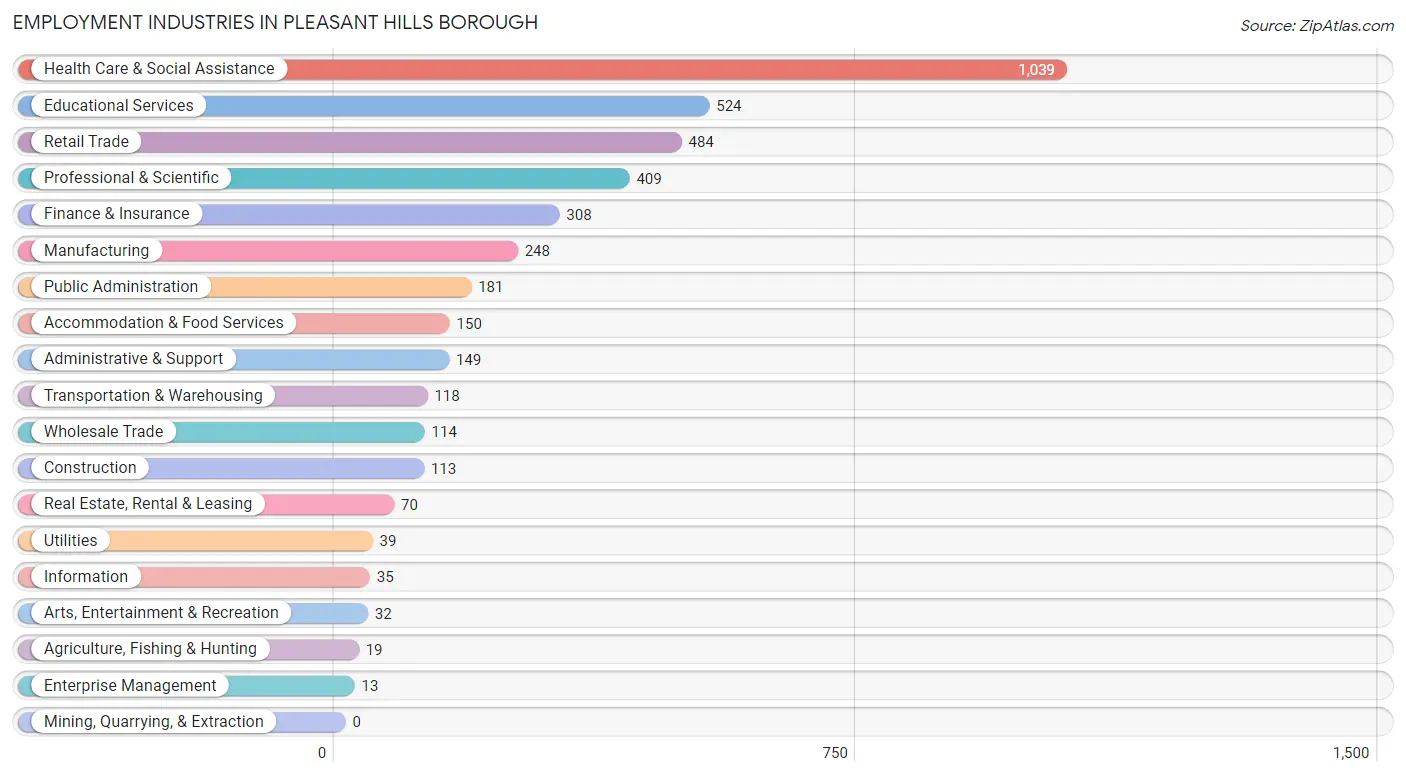
Employment Industries in Pleasant Hills borough
The major employment industries in Pleasant Hills borough include Health Care & Social Assistance (1,039 | 24.3%), Educational Services (524 | 12.2%), Retail Trade (484 | 11.3%), Professional & Scientific (409 | 9.6%), and Finance & Insurance (308 | 7.2%).
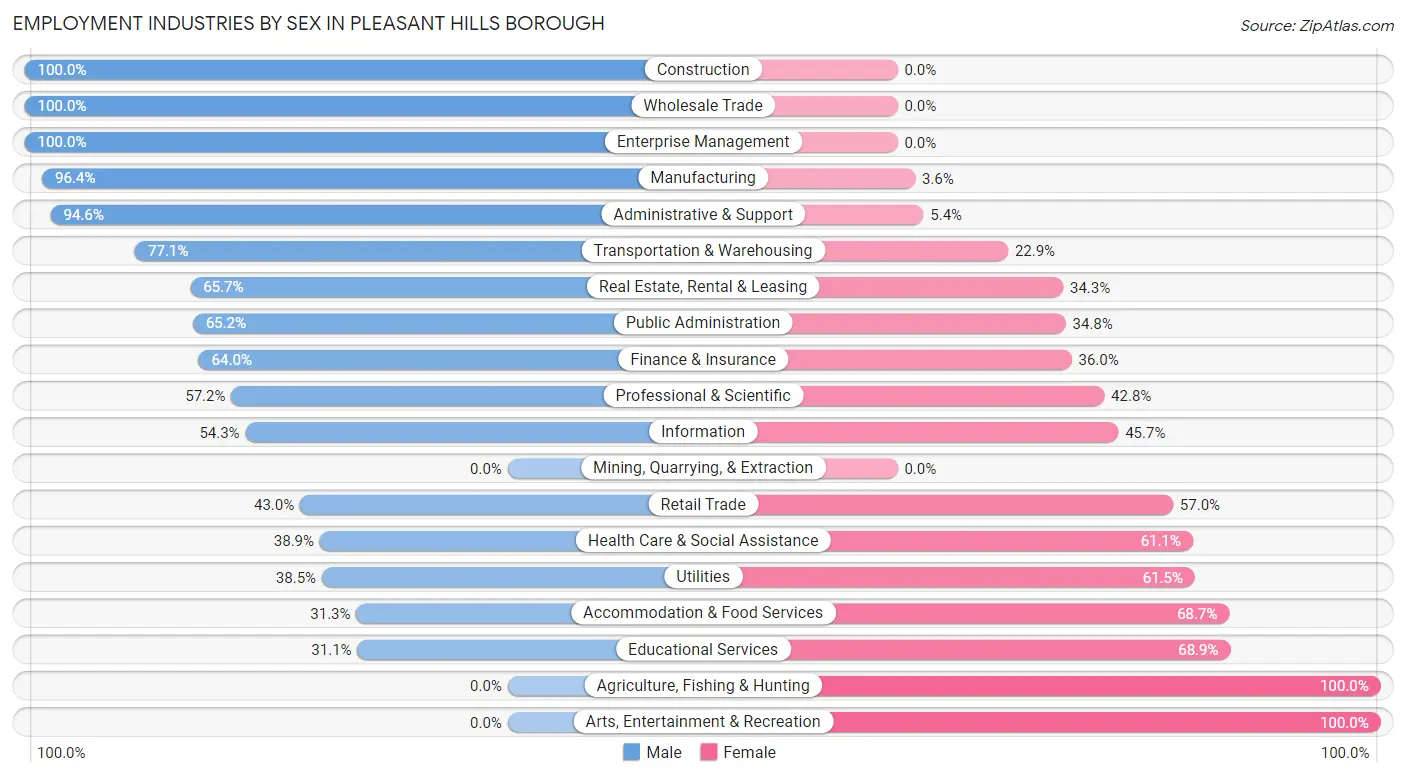
Employment Industries by Sex in Pleasant Hills borough
The Pleasant Hills borough industries that see more men than women are Construction (100.0%), Wholesale Trade (100.0%), and Enterprise Management (100.0%), whereas the industries that tend to have a higher number of women are Agriculture, Fishing & Hunting (100.0%), Arts, Entertainment & Recreation (100.0%), and Educational Services (68.9%).
| Industry | Male | Female |
| Agriculture, Fishing & Hunting | 0 (0.0%) | 19 (100.0%) |
| Mining, Quarrying, & Extraction | 0 (0.0%) | 0 (0.0%) |
| Construction | 113 (100.0%) | 0 (0.0%) |
| Manufacturing | 239 (96.4%) | 9 (3.6%) |
| Wholesale Trade | 114 (100.0%) | 0 (0.0%) |
| Retail Trade | 208 (43.0%) | 276 (57.0%) |
| Transportation & Warehousing | 91 (77.1%) | 27 (22.9%) |
| Utilities | 15 (38.5%) | 24 (61.5%) |
| Information | 19 (54.3%) | 16 (45.7%) |
| Finance & Insurance | 197 (64.0%) | 111 (36.0%) |
| Real Estate, Rental & Leasing | 46 (65.7%) | 24 (34.3%) |
| Professional & Scientific | 234 (57.2%) | 175 (42.8%) |
| Enterprise Management | 13 (100.0%) | 0 (0.0%) |
| Administrative & Support | 141 (94.6%) | 8 (5.4%) |
| Educational Services | 163 (31.1%) | 361 (68.9%) |
| Health Care & Social Assistance | 404 (38.9%) | 635 (61.1%) |
| Arts, Entertainment & Recreation | 0 (0.0%) | 32 (100.0%) |
| Accommodation & Food Services | 47 (31.3%) | 103 (68.7%) |
| Public Administration | 118 (65.2%) | 63 (34.8%) |
| Total | 2,292 (53.6%) | 1,987 (46.4%) |
Education in Pleasant Hills borough
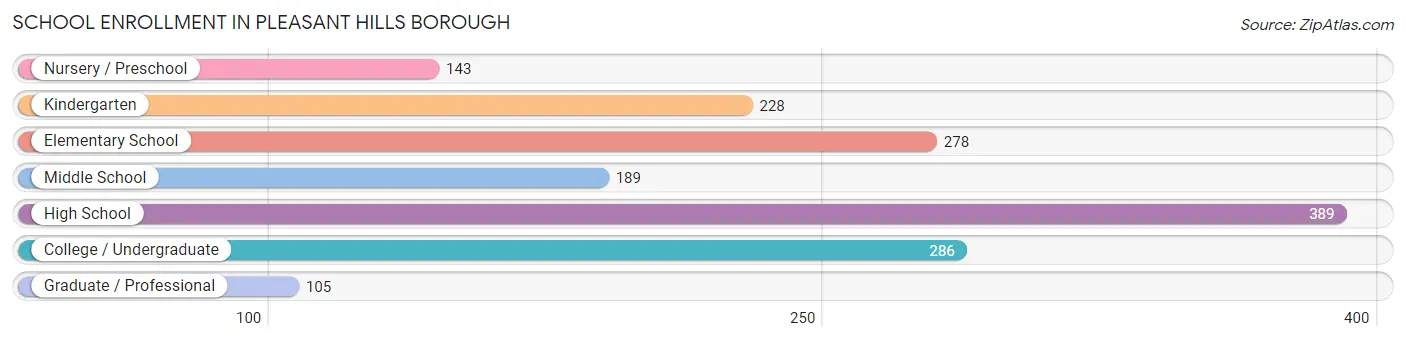
School Enrollment in Pleasant Hills borough
The most common levels of schooling among the 1,618 students in Pleasant Hills borough are high school (389 | 24.0%), college / undergraduate (286 | 17.7%), and elementary school (278 | 17.2%).
| School Level | # Students | % Students |
| Nursery / Preschool | 143 | 8.8% |
| Kindergarten | 228 | 14.1% |
| Elementary School | 278 | 17.2% |
| Middle School | 189 | 11.7% |
| High School | 389 | 24.0% |
| College / Undergraduate | 286 | 17.7% |
| Graduate / Professional | 105 | 6.5% |
| Total | 1,618 | 100.0% |
School Enrollment by Age by Funding Source in Pleasant Hills borough
Out of a total of 1,618 students who are enrolled in schools in Pleasant Hills borough, 209 (12.9%) attend a private institution, while the remaining 1,409 (87.1%) are enrolled in public schools. The age group of 25 to 34 year olds has the highest likelihood of being enrolled in private schools, with 50 (56.2% in the age bracket) enrolled. Conversely, the age group of 10 to 14 year olds has the lowest likelihood of being enrolled in a private school, with 236 (97.5% in the age bracket) attending a public institution.
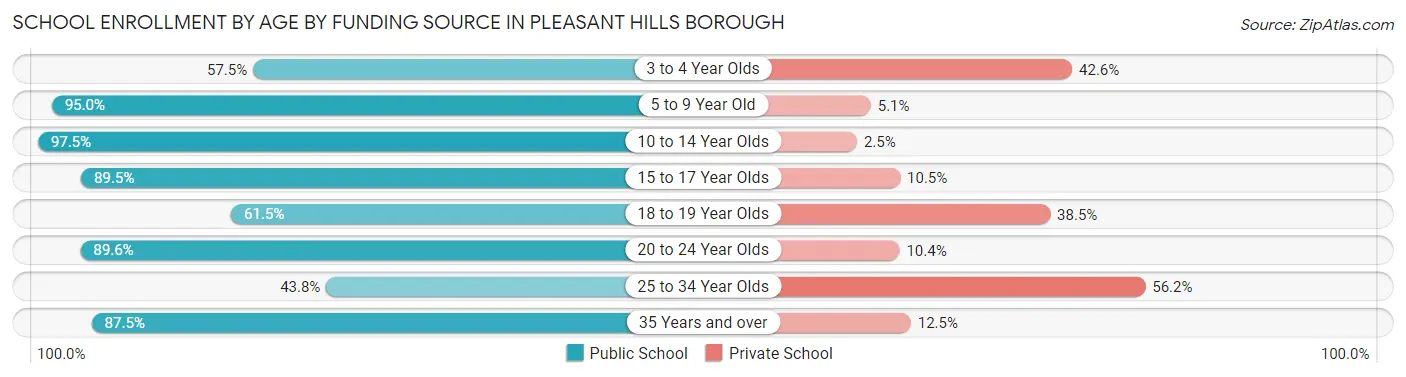
| Age Bracket | Public School | Private School |
| 3 to 4 Year Olds | 54 (57.5%) | 40 (42.5%) |
| 5 to 9 Year Old | 489 (95.0%) | 26 (5.1%) |
| 10 to 14 Year Olds | 236 (97.5%) | 6 (2.5%) |
| 15 to 17 Year Olds | 315 (89.5%) | 37 (10.5%) |
| 18 to 19 Year Olds | 32 (61.5%) | 20 (38.5%) |
| 20 to 24 Year Olds | 181 (89.6%) | 21 (10.4%) |
| 25 to 34 Year Olds | 39 (43.8%) | 50 (56.2%) |
| 35 Years and over | 63 (87.5%) | 9 (12.5%) |
| Total | 1,409 (87.1%) | 209 (12.9%) |
Educational Attainment by Field of Study in Pleasant Hills borough
Business (537 | 21.1%), education (474 | 18.6%), engineering (212 | 8.3%), communications (207 | 8.1%), and psychology (176 | 6.9%) are the most common fields of study among 2,549 individuals in Pleasant Hills borough who have obtained a bachelor's degree or higher.
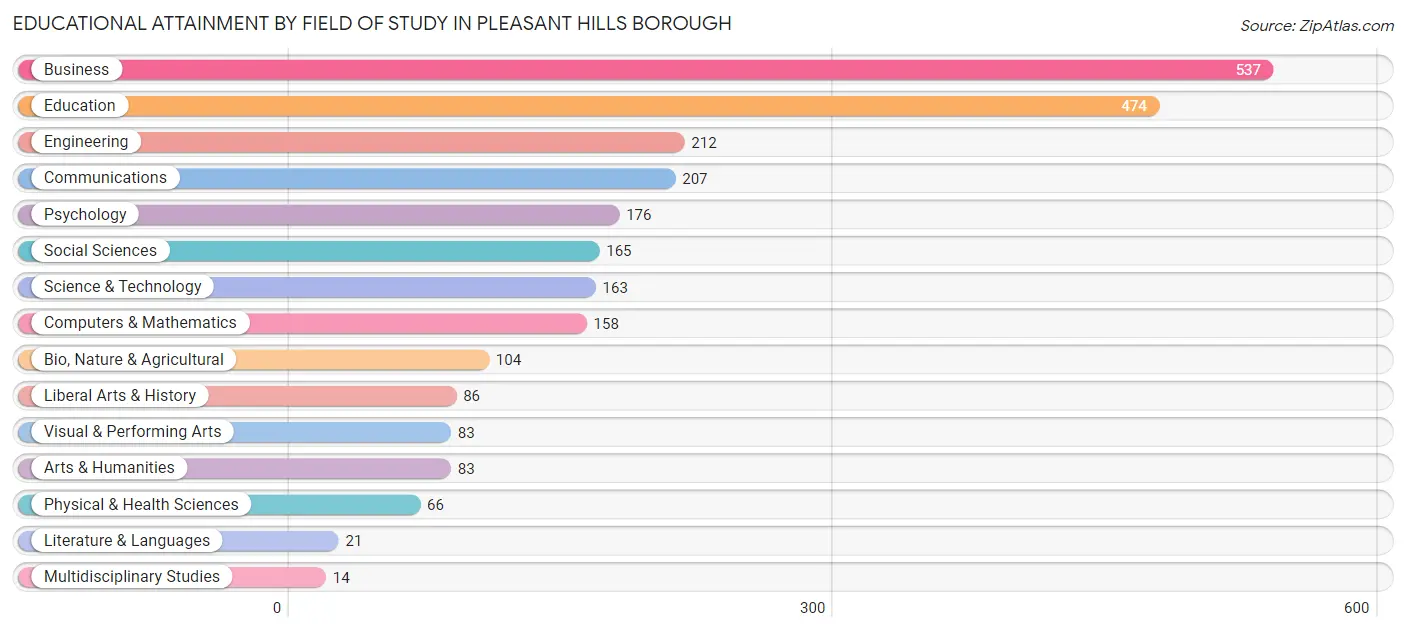
| Field of Study | # Graduates | % Graduates |
| Computers & Mathematics | 158 | 6.2% |
| Bio, Nature & Agricultural | 104 | 4.1% |
| Physical & Health Sciences | 66 | 2.6% |
| Psychology | 176 | 6.9% |
| Social Sciences | 165 | 6.5% |
| Engineering | 212 | 8.3% |
| Multidisciplinary Studies | 14 | 0.5% |
| Science & Technology | 163 | 6.4% |
| Business | 537 | 21.1% |
| Education | 474 | 18.6% |
| Literature & Languages | 21 | 0.8% |
| Liberal Arts & History | 86 | 3.4% |
| Visual & Performing Arts | 83 | 3.3% |
| Communications | 207 | 8.1% |
| Arts & Humanities | 83 | 3.3% |
| Total | 2,549 | 100.0% |
Transportation & Commute in Pleasant Hills borough
Vehicle Availability by Sex in Pleasant Hills borough
The most prevalent vehicle ownership categories in Pleasant Hills borough are males with 2 vehicles (1,007, accounting for 43.8%) and females with 2 vehicles (995, making up 50.7%).
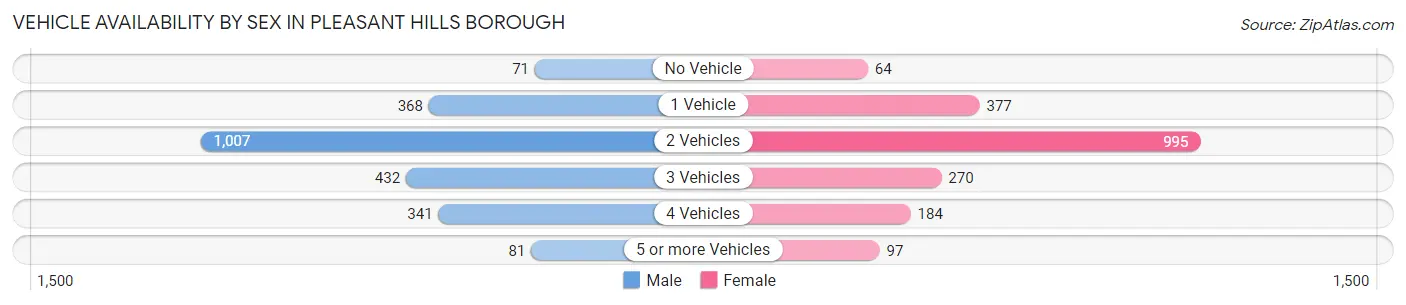
| Vehicles Available | Male | Female |
| No Vehicle | 71 (3.1%) | 64 (3.2%) |
| 1 Vehicle | 368 (16.0%) | 377 (19.0%) |
| 2 Vehicles | 1,007 (43.8%) | 995 (50.1%) |
| 3 Vehicles | 432 (18.8%) | 270 (13.6%) |
| 4 Vehicles | 341 (14.8%) | 184 (9.3%) |
| 5 or more Vehicles | 81 (3.5%) | 97 (4.9%) |
| Total | 2,300 (100.0%) | 1,987 (100.0%) |
Commute Time in Pleasant Hills borough
The most frequently occuring commute durations in Pleasant Hills borough are 45 to 59 minutes (527 commuters, 14.4%), 10 to 14 minutes (486 commuters, 13.3%), and 5 to 9 minutes (460 commuters, 12.6%).
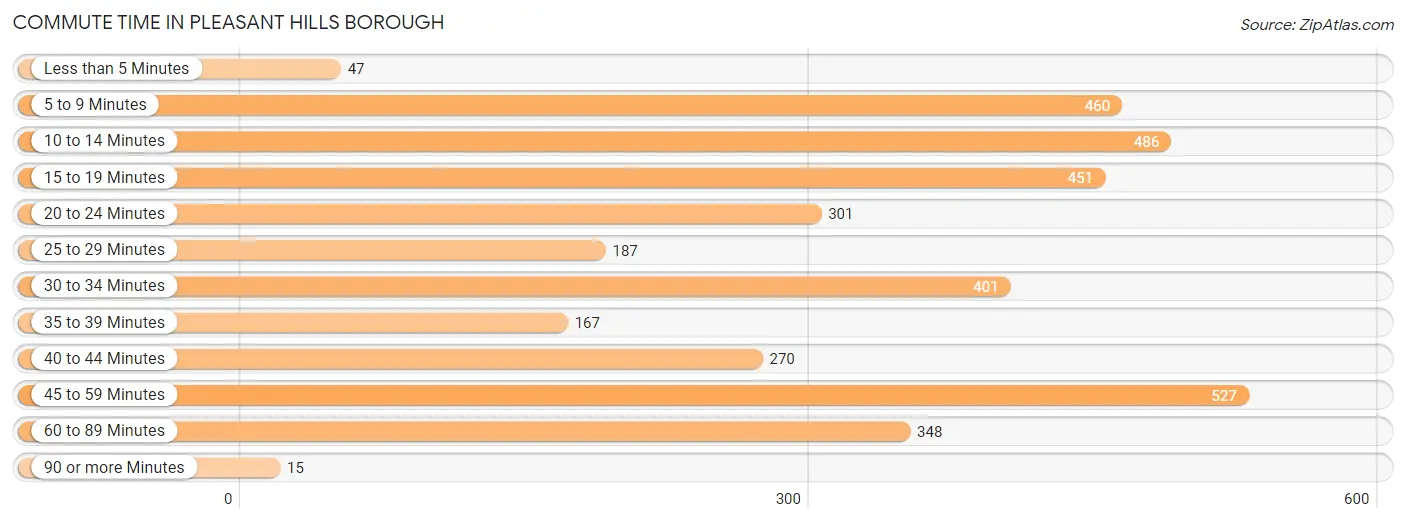
| Commute Time | # Commuters | % Commuters |
| Less than 5 Minutes | 47 | 1.3% |
| 5 to 9 Minutes | 460 | 12.6% |
| 10 to 14 Minutes | 486 | 13.3% |
| 15 to 19 Minutes | 451 | 12.3% |
| 20 to 24 Minutes | 301 | 8.2% |
| 25 to 29 Minutes | 187 | 5.1% |
| 30 to 34 Minutes | 401 | 11.0% |
| 35 to 39 Minutes | 167 | 4.6% |
| 40 to 44 Minutes | 270 | 7.4% |
| 45 to 59 Minutes | 527 | 14.4% |
| 60 to 89 Minutes | 348 | 9.5% |
| 90 or more Minutes | 15 | 0.4% |
Commute Time by Sex in Pleasant Hills borough
The most common commute times in Pleasant Hills borough are 45 to 59 minutes (326 commuters, 17.1%) for males and 10 to 14 minutes (276 commuters, 15.7%) for females.
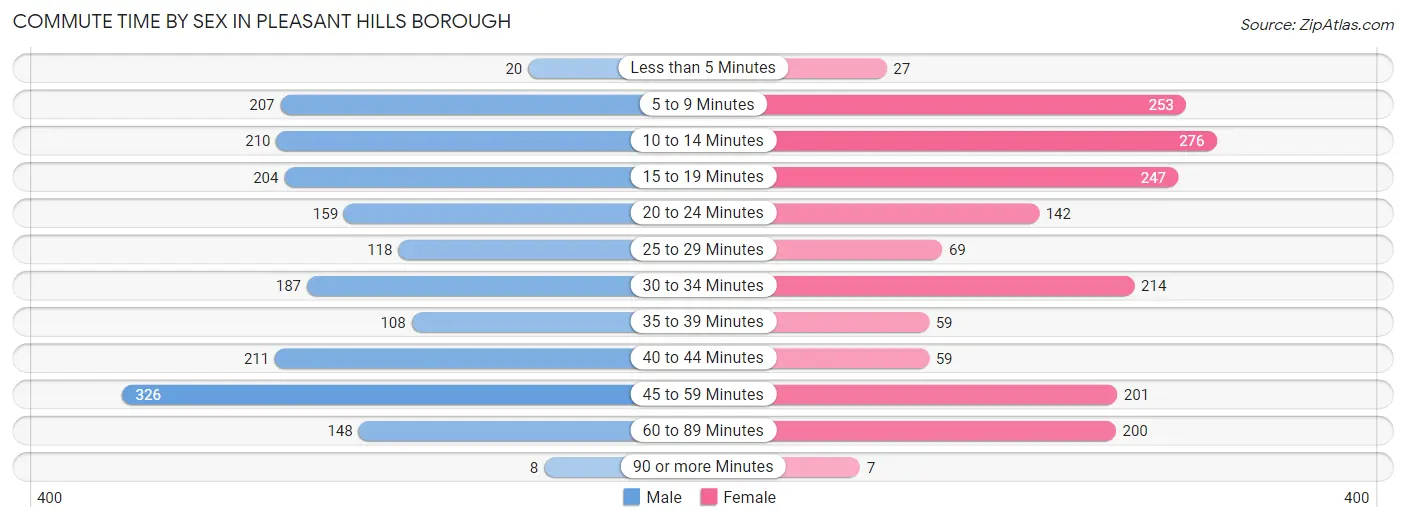
| Commute Time | Male | Female |
| Less than 5 Minutes | 20 (1.1%) | 27 (1.5%) |
| 5 to 9 Minutes | 207 (10.9%) | 253 (14.4%) |
| 10 to 14 Minutes | 210 (11.0%) | 276 (15.7%) |
| 15 to 19 Minutes | 204 (10.7%) | 247 (14.1%) |
| 20 to 24 Minutes | 159 (8.3%) | 142 (8.1%) |
| 25 to 29 Minutes | 118 (6.2%) | 69 (3.9%) |
| 30 to 34 Minutes | 187 (9.8%) | 214 (12.2%) |
| 35 to 39 Minutes | 108 (5.7%) | 59 (3.4%) |
| 40 to 44 Minutes | 211 (11.1%) | 59 (3.4%) |
| 45 to 59 Minutes | 326 (17.1%) | 201 (11.5%) |
| 60 to 89 Minutes | 148 (7.8%) | 200 (11.4%) |
| 90 or more Minutes | 8 (0.4%) | 7 (0.4%) |
Time of Departure to Work by Sex in Pleasant Hills borough
The most frequent times of departure to work in Pleasant Hills borough are 6:30 AM to 6:59 AM (271, 14.2%) for males and 8:00 AM to 8:29 AM (316, 18.0%) for females.
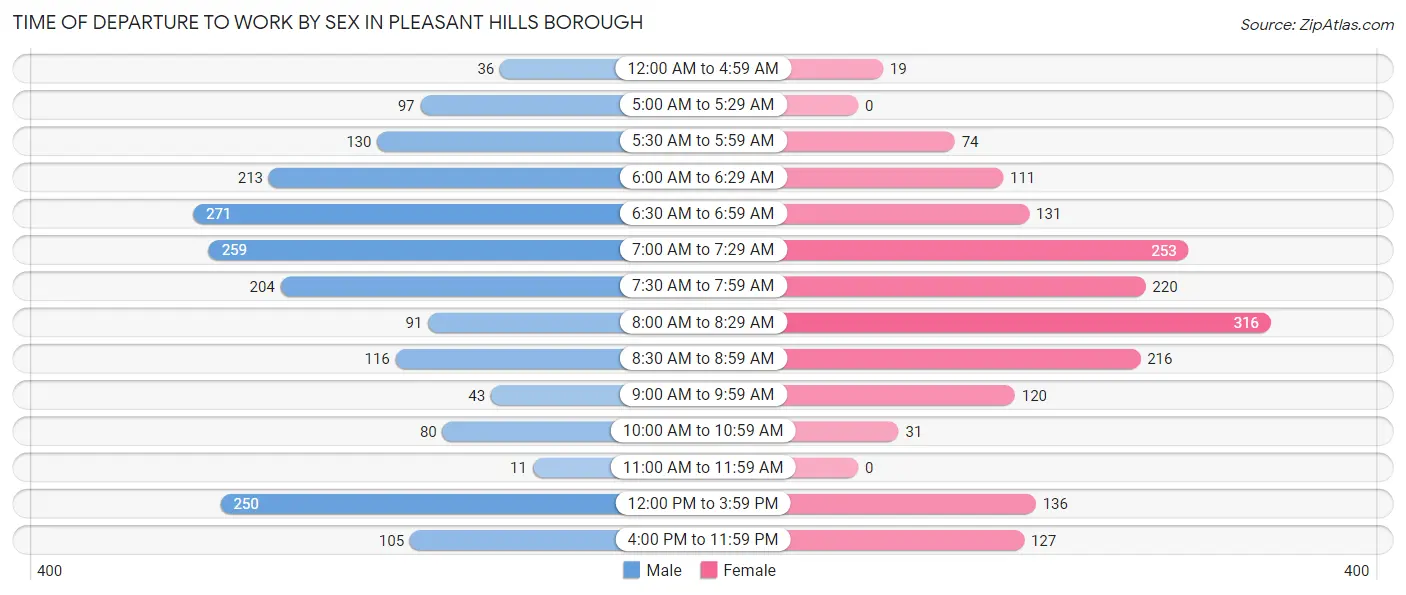
| Time of Departure | Male | Female |
| 12:00 AM to 4:59 AM | 36 (1.9%) | 19 (1.1%) |
| 5:00 AM to 5:29 AM | 97 (5.1%) | 0 (0.0%) |
| 5:30 AM to 5:59 AM | 130 (6.8%) | 74 (4.2%) |
| 6:00 AM to 6:29 AM | 213 (11.2%) | 111 (6.3%) |
| 6:30 AM to 6:59 AM | 271 (14.2%) | 131 (7.5%) |
| 7:00 AM to 7:29 AM | 259 (13.6%) | 253 (14.4%) |
| 7:30 AM to 7:59 AM | 204 (10.7%) | 220 (12.5%) |
| 8:00 AM to 8:29 AM | 91 (4.8%) | 316 (18.0%) |
| 8:30 AM to 8:59 AM | 116 (6.1%) | 216 (12.3%) |
| 9:00 AM to 9:59 AM | 43 (2.3%) | 120 (6.8%) |
| 10:00 AM to 10:59 AM | 80 (4.2%) | 31 (1.8%) |
| 11:00 AM to 11:59 AM | 11 (0.6%) | 0 (0.0%) |
| 12:00 PM to 3:59 PM | 250 (13.1%) | 136 (7.7%) |
| 4:00 PM to 11:59 PM | 105 (5.5%) | 127 (7.2%) |
| Total | 1,906 (100.0%) | 1,754 (100.0%) |
Housing Occupancy in Pleasant Hills borough
Occupancy by Ownership in Pleasant Hills borough
Of the total 3,550 dwellings in Pleasant Hills borough, owner-occupied units account for 2,780 (78.3%), while renter-occupied units make up 770 (21.7%).
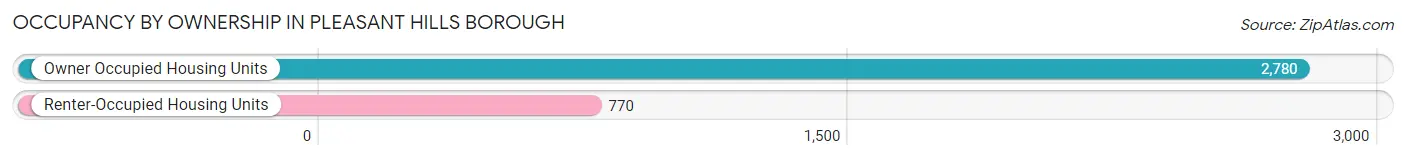
| Occupancy | # Housing Units | % Housing Units |
| Owner Occupied Housing Units | 2,780 | 78.3% |
| Renter-Occupied Housing Units | 770 | 21.7% |
| Total Occupied Housing Units | 3,550 | 100.0% |
Occupancy by Household Size in Pleasant Hills borough
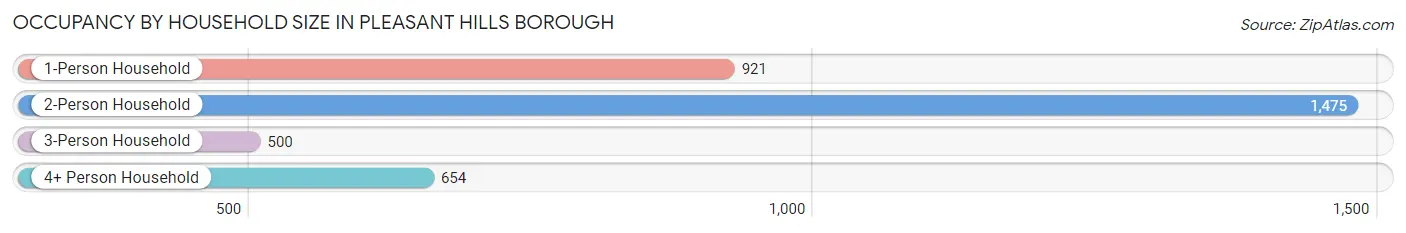
| Household Size | # Housing Units | % Housing Units |
| 1-Person Household | 921 | 25.9% |
| 2-Person Household | 1,475 | 41.5% |
| 3-Person Household | 500 | 14.1% |
| 4+ Person Household | 654 | 18.4% |
| Total Housing Units | 3,550 | 100.0% |
Occupancy by Ownership by Household Size in Pleasant Hills borough
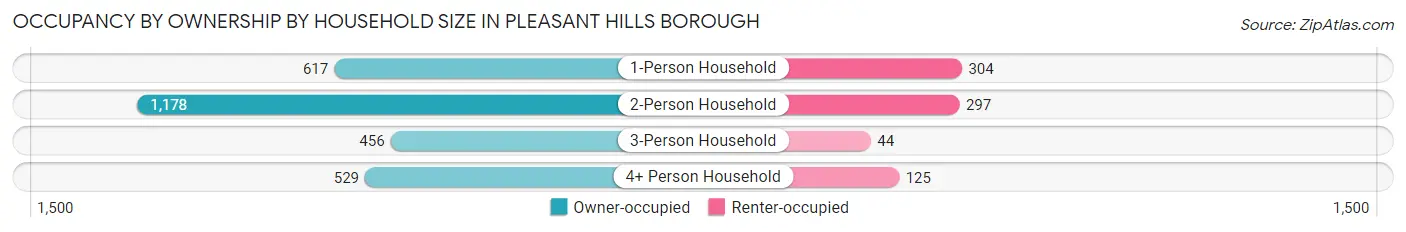
| Household Size | Owner-occupied | Renter-occupied |
| 1-Person Household | 617 (67.0%) | 304 (33.0%) |
| 2-Person Household | 1,178 (79.9%) | 297 (20.1%) |
| 3-Person Household | 456 (91.2%) | 44 (8.8%) |
| 4+ Person Household | 529 (80.9%) | 125 (19.1%) |
| Total Housing Units | 2,780 (78.3%) | 770 (21.7%) |
Occupancy by Educational Attainment in Pleasant Hills borough
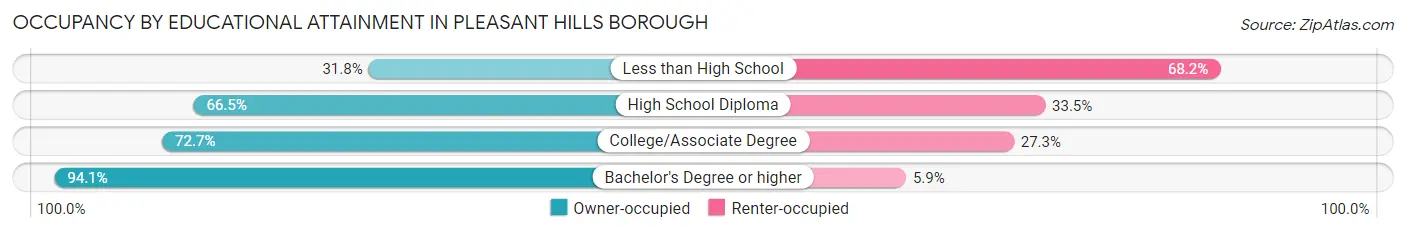
| Household Size | Owner-occupied | Renter-occupied |
| Less than High School | 35 (31.8%) | 75 (68.2%) |
| High School Diploma | 570 (66.5%) | 287 (33.5%) |
| College/Associate Degree | 869 (72.7%) | 326 (27.3%) |
| Bachelor's Degree or higher | 1,306 (94.1%) | 82 (5.9%) |
Occupancy by Age of Householder in Pleasant Hills borough
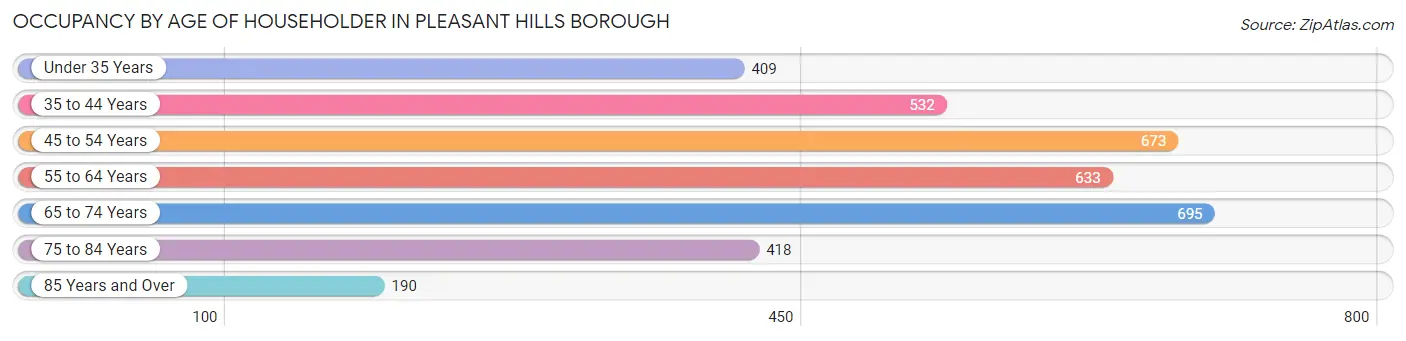
| Age Bracket | # Households | % Households |
| Under 35 Years | 409 | 11.5% |
| 35 to 44 Years | 532 | 15.0% |
| 45 to 54 Years | 673 | 19.0% |
| 55 to 64 Years | 633 | 17.8% |
| 65 to 74 Years | 695 | 19.6% |
| 75 to 84 Years | 418 | 11.8% |
| 85 Years and Over | 190 | 5.3% |
| Total | 3,550 | 100.0% |
Housing Finances in Pleasant Hills borough
Median Income by Occupancy in Pleasant Hills borough
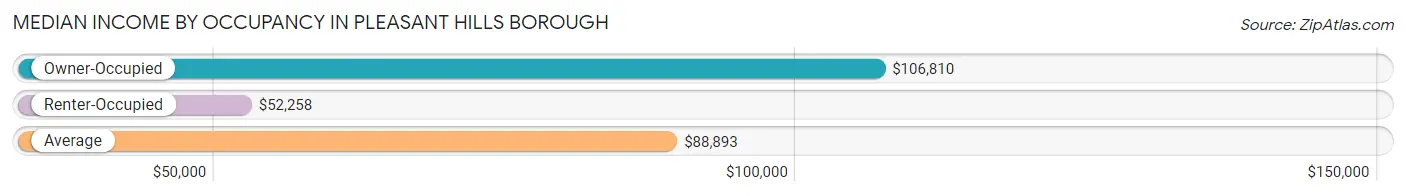
| Occupancy Type | # Households | Median Income |
| Owner-Occupied | 2,780 (78.3%) | $106,810 |
| Renter-Occupied | 770 (21.7%) | $52,258 |
| Average | 3,550 (100.0%) | $88,893 |
Occupancy by Householder Income Bracket in Pleasant Hills borough
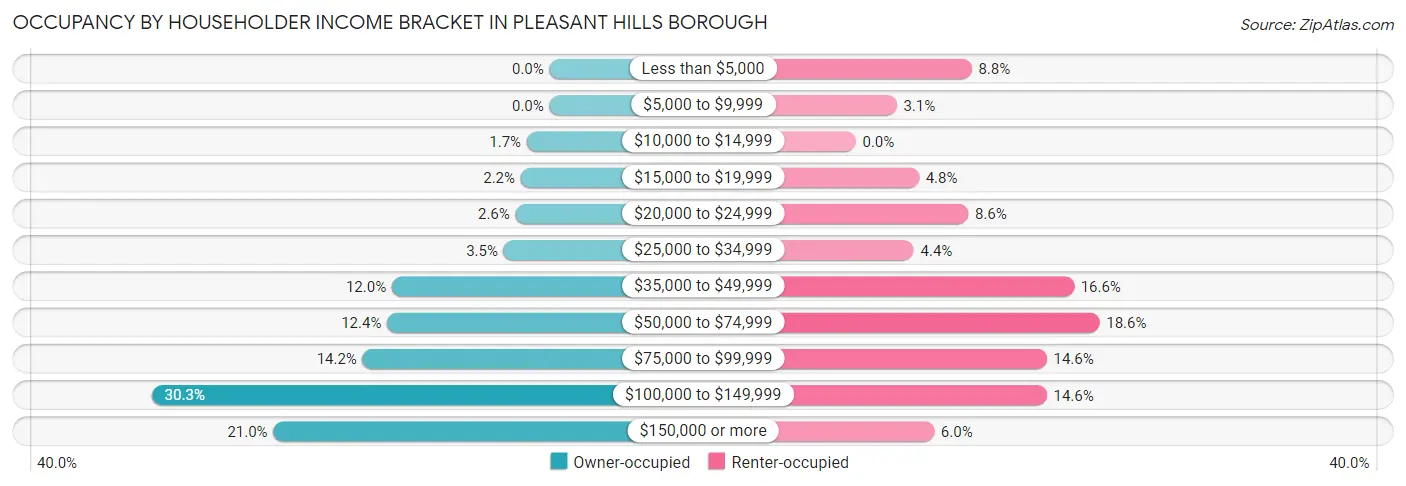
| Income Bracket | Owner-occupied | Renter-occupied |
| Less than $5,000 | 0 (0.0%) | 68 (8.8%) |
| $5,000 to $9,999 | 0 (0.0%) | 24 (3.1%) |
| $10,000 to $14,999 | 48 (1.7%) | 0 (0.0%) |
| $15,000 to $19,999 | 61 (2.2%) | 37 (4.8%) |
| $20,000 to $24,999 | 72 (2.6%) | 66 (8.6%) |
| $25,000 to $34,999 | 97 (3.5%) | 34 (4.4%) |
| $35,000 to $49,999 | 334 (12.0%) | 128 (16.6%) |
| $50,000 to $74,999 | 344 (12.4%) | 143 (18.6%) |
| $75,000 to $99,999 | 396 (14.2%) | 112 (14.5%) |
| $100,000 to $149,999 | 843 (30.3%) | 112 (14.5%) |
| $150,000 or more | 585 (21.0%) | 46 (6.0%) |
| Total | 2,780 (100.0%) | 770 (100.0%) |
Monthly Housing Cost Tiers in Pleasant Hills borough
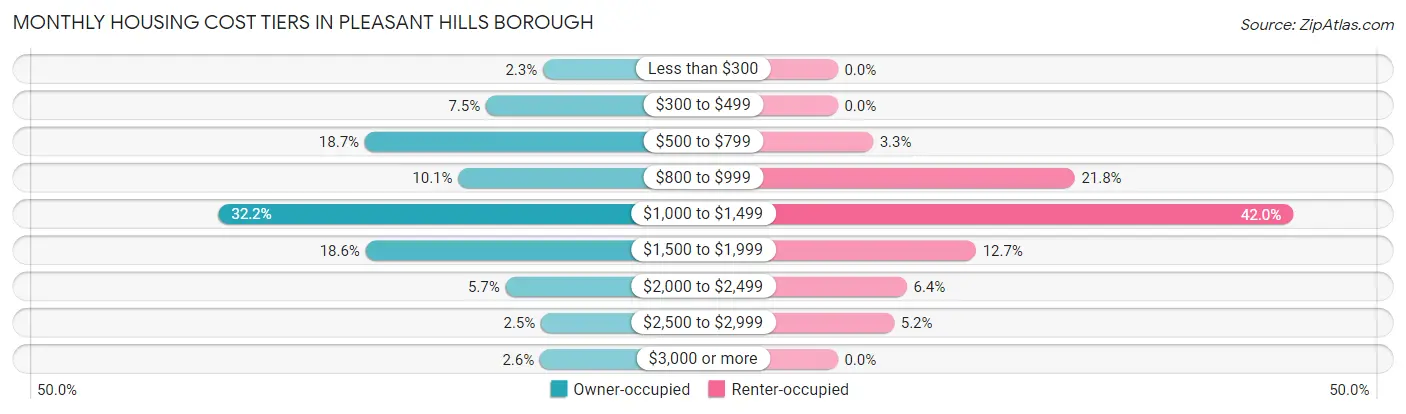
| Monthly Cost | Owner-occupied | Renter-occupied |
| Less than $300 | 63 (2.3%) | 0 (0.0%) |
| $300 to $499 | 209 (7.5%) | 0 (0.0%) |
| $500 to $799 | 519 (18.7%) | 25 (3.3%) |
| $800 to $999 | 280 (10.1%) | 168 (21.8%) |
| $1,000 to $1,499 | 894 (32.2%) | 323 (41.9%) |
| $1,500 to $1,999 | 517 (18.6%) | 98 (12.7%) |
| $2,000 to $2,499 | 159 (5.7%) | 49 (6.4%) |
| $2,500 to $2,999 | 68 (2.5%) | 40 (5.2%) |
| $3,000 or more | 71 (2.5%) | 0 (0.0%) |
| Total | 2,780 (100.0%) | 770 (100.0%) |
Physical Housing Characteristics in Pleasant Hills borough
Housing Structures in Pleasant Hills borough
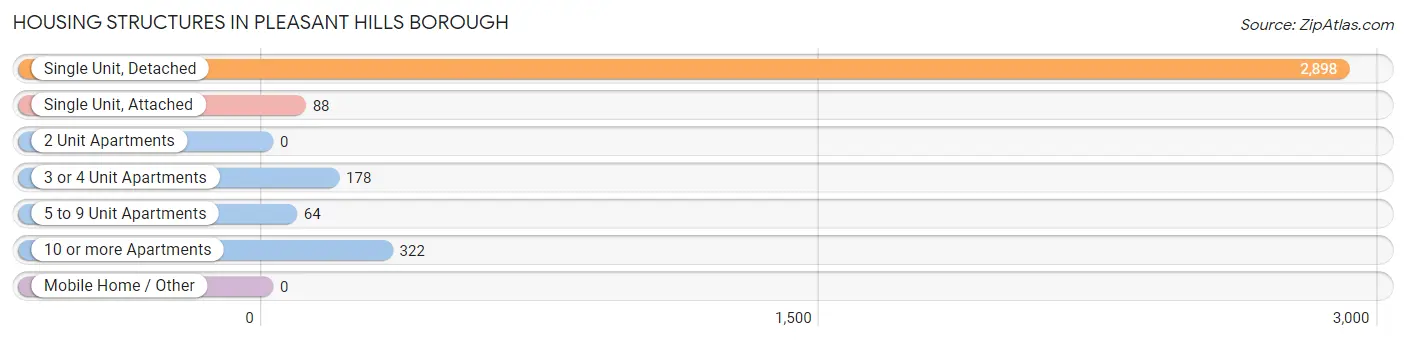
| Structure Type | # Housing Units | % Housing Units |
| Single Unit, Detached | 2,898 | 81.6% |
| Single Unit, Attached | 88 | 2.5% |
| 2 Unit Apartments | 0 | 0.0% |
| 3 or 4 Unit Apartments | 178 | 5.0% |
| 5 to 9 Unit Apartments | 64 | 1.8% |
| 10 or more Apartments | 322 | 9.1% |
| Mobile Home / Other | 0 | 0.0% |
| Total | 3,550 | 100.0% |
Housing Structures by Occupancy in Pleasant Hills borough
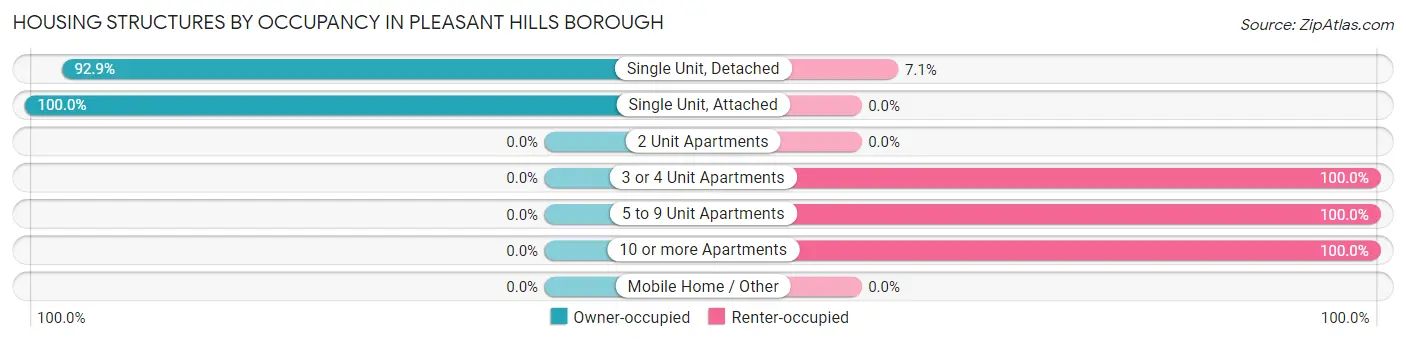
| Structure Type | Owner-occupied | Renter-occupied |
| Single Unit, Detached | 2,692 (92.9%) | 206 (7.1%) |
| Single Unit, Attached | 88 (100.0%) | 0 (0.0%) |
| 2 Unit Apartments | 0 (0.0%) | 0 (0.0%) |
| 3 or 4 Unit Apartments | 0 (0.0%) | 178 (100.0%) |
| 5 to 9 Unit Apartments | 0 (0.0%) | 64 (100.0%) |
| 10 or more Apartments | 0 (0.0%) | 322 (100.0%) |
| Mobile Home / Other | 0 (0.0%) | 0 (0.0%) |
| Total | 2,780 (78.3%) | 770 (21.7%) |
Housing Structures by Number of Rooms in Pleasant Hills borough
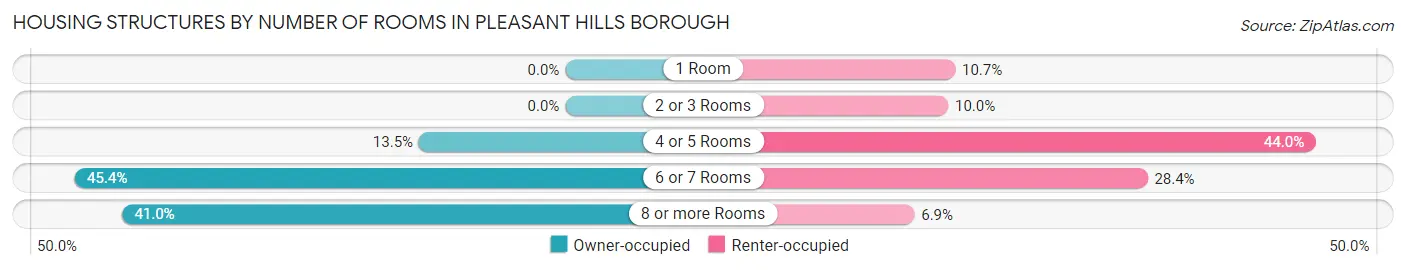
| Number of Rooms | Owner-occupied | Renter-occupied |
| 1 Room | 0 (0.0%) | 82 (10.6%) |
| 2 or 3 Rooms | 0 (0.0%) | 77 (10.0%) |
| 4 or 5 Rooms | 376 (13.5%) | 339 (44.0%) |
| 6 or 7 Rooms | 1,263 (45.4%) | 219 (28.4%) |
| 8 or more Rooms | 1,141 (41.0%) | 53 (6.9%) |
| Total | 2,780 (100.0%) | 770 (100.0%) |
Housing Structure by Heating Type in Pleasant Hills borough
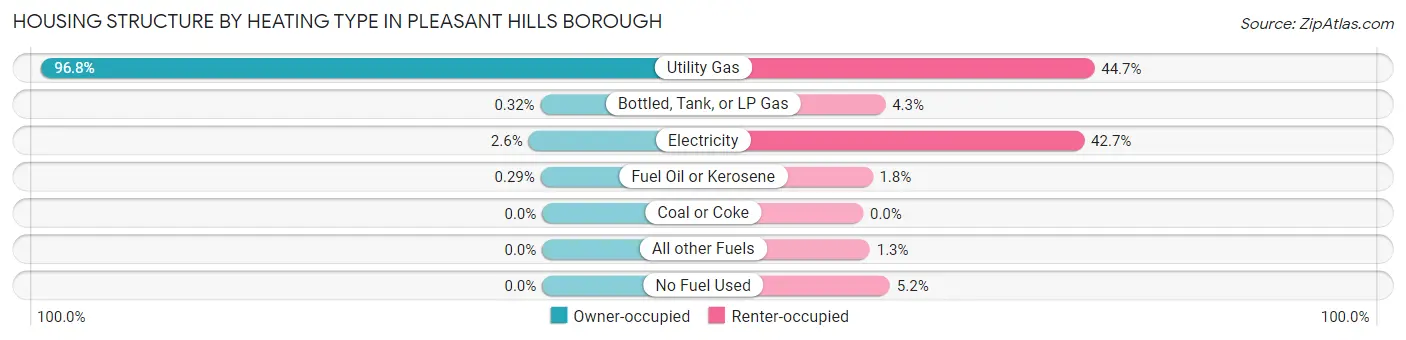
| Heating Type | Owner-occupied | Renter-occupied |
| Utility Gas | 2,690 (96.8%) | 344 (44.7%) |
| Bottled, Tank, or LP Gas | 9 (0.3%) | 33 (4.3%) |
| Electricity | 73 (2.6%) | 329 (42.7%) |
| Fuel Oil or Kerosene | 8 (0.3%) | 14 (1.8%) |
| Coal or Coke | 0 (0.0%) | 0 (0.0%) |
| All other Fuels | 0 (0.0%) | 10 (1.3%) |
| No Fuel Used | 0 (0.0%) | 40 (5.2%) |
| Total | 2,780 (100.0%) | 770 (100.0%) |
Household Vehicle Usage in Pleasant Hills borough
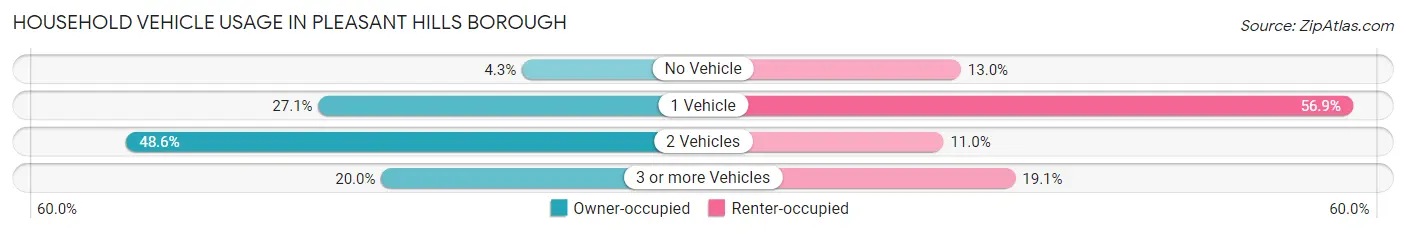
| Vehicles per Household | Owner-occupied | Renter-occupied |
| No Vehicle | 119 (4.3%) | 100 (13.0%) |
| 1 Vehicle | 753 (27.1%) | 438 (56.9%) |
| 2 Vehicles | 1,351 (48.6%) | 85 (11.0%) |
| 3 or more Vehicles | 557 (20.0%) | 147 (19.1%) |
| Total | 2,780 (100.0%) | 770 (100.0%) |
Real Estate & Mortgages in Pleasant Hills borough
Real Estate and Mortgage Overview in Pleasant Hills borough
| Characteristic | Without Mortgage | With Mortgage |
| Housing Units | 1,137 | 1,643 |
| Median Property Value | $221,800 | $213,300 |
| Median Household Income | $63,668 | $380 |
| Monthly Housing Costs | $676 | $71 |
| Real Estate Taxes | $3,892 | $13 |
Property Value by Mortgage Status in Pleasant Hills borough
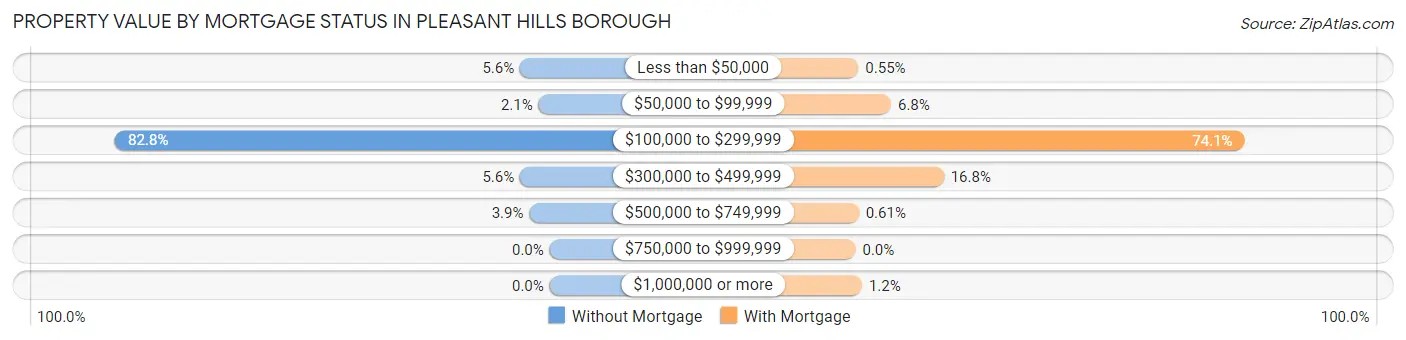
| Property Value | Without Mortgage | With Mortgage |
| Less than $50,000 | 64 (5.6%) | 9 (0.5%) |
| $50,000 to $99,999 | 24 (2.1%) | 111 (6.8%) |
| $100,000 to $299,999 | 941 (82.8%) | 1,217 (74.1%) |
| $300,000 to $499,999 | 64 (5.6%) | 276 (16.8%) |
| $500,000 to $749,999 | 44 (3.9%) | 10 (0.6%) |
| $750,000 to $999,999 | 0 (0.0%) | 0 (0.0%) |
| $1,000,000 or more | 0 (0.0%) | 20 (1.2%) |
| Total | 1,137 (100.0%) | 1,643 (100.0%) |
Household Income by Mortgage Status in Pleasant Hills borough
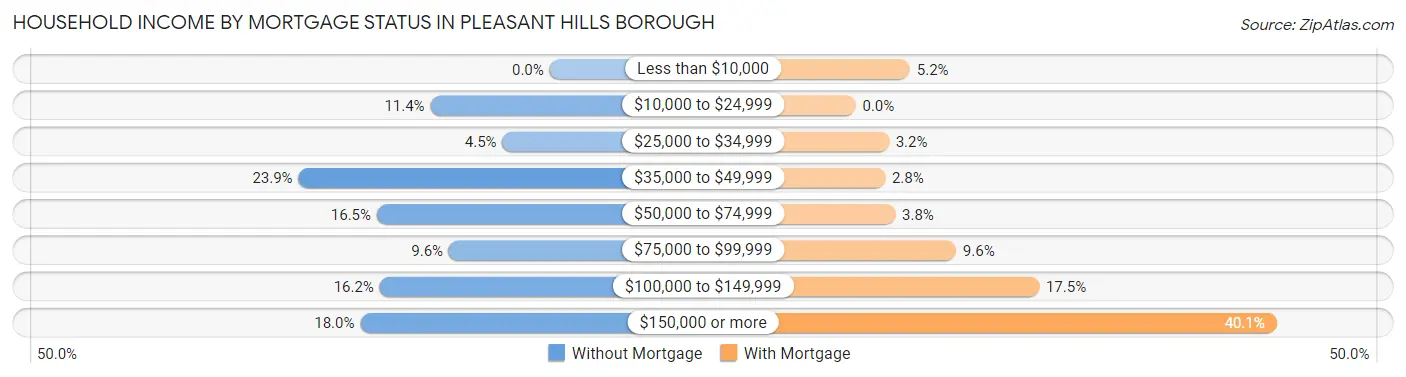
| Household Income | Without Mortgage | With Mortgage |
| Less than $10,000 | 0 (0.0%) | 85 (5.2%) |
| $10,000 to $24,999 | 129 (11.4%) | 0 (0.0%) |
| $25,000 to $34,999 | 51 (4.5%) | 52 (3.2%) |
| $35,000 to $49,999 | 272 (23.9%) | 46 (2.8%) |
| $50,000 to $74,999 | 187 (16.5%) | 62 (3.8%) |
| $75,000 to $99,999 | 109 (9.6%) | 157 (9.6%) |
| $100,000 to $149,999 | 184 (16.2%) | 287 (17.5%) |
| $150,000 or more | 205 (18.0%) | 659 (40.1%) |
| Total | 1,137 (100.0%) | 1,643 (100.0%) |
Property Value to Household Income Ratio in Pleasant Hills borough
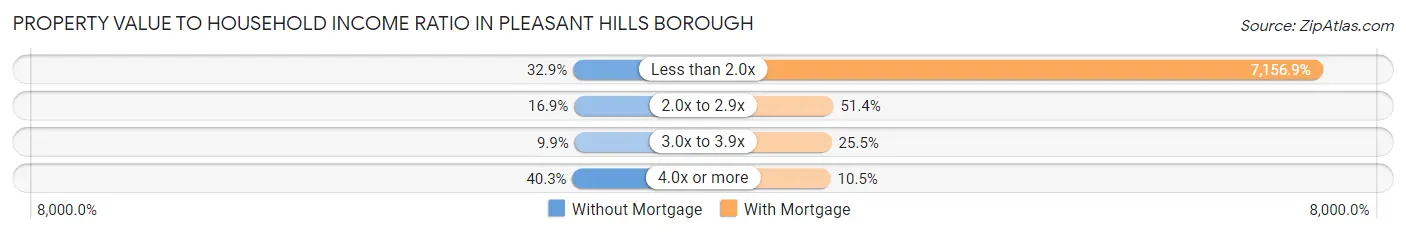
| Value-to-Income Ratio | Without Mortgage | With Mortgage |
| Less than 2.0x | 374 (32.9%) | 117,588 (7,156.9%) |
| 2.0x to 2.9x | 192 (16.9%) | 845 (51.4%) |
| 3.0x to 3.9x | 113 (9.9%) | 419 (25.5%) |
| 4.0x or more | 458 (40.3%) | 173 (10.5%) |
| Total | 1,137 (100.0%) | 1,643 (100.0%) |
Real Estate Taxes by Mortgage Status in Pleasant Hills borough
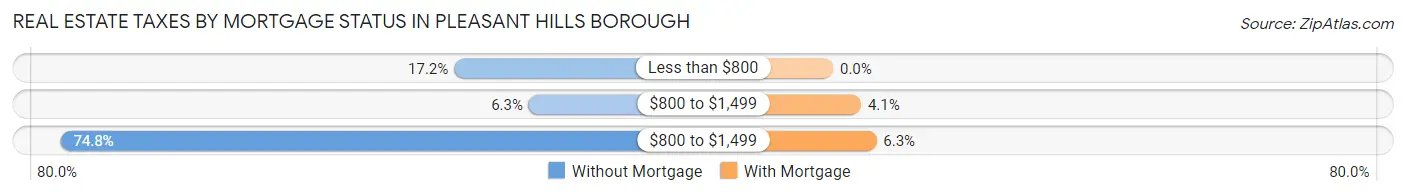
| Property Taxes | Without Mortgage | With Mortgage |
| Less than $800 | 196 (17.2%) | 0 (0.0%) |
| $800 to $1,499 | 72 (6.3%) | 67 (4.1%) |
| $800 to $1,499 | 850 (74.8%) | 104 (6.3%) |
| Total | 1,137 (100.0%) | 1,643 (100.0%) |
Health & Disability in Pleasant Hills borough
Health Insurance Coverage by Age in Pleasant Hills borough
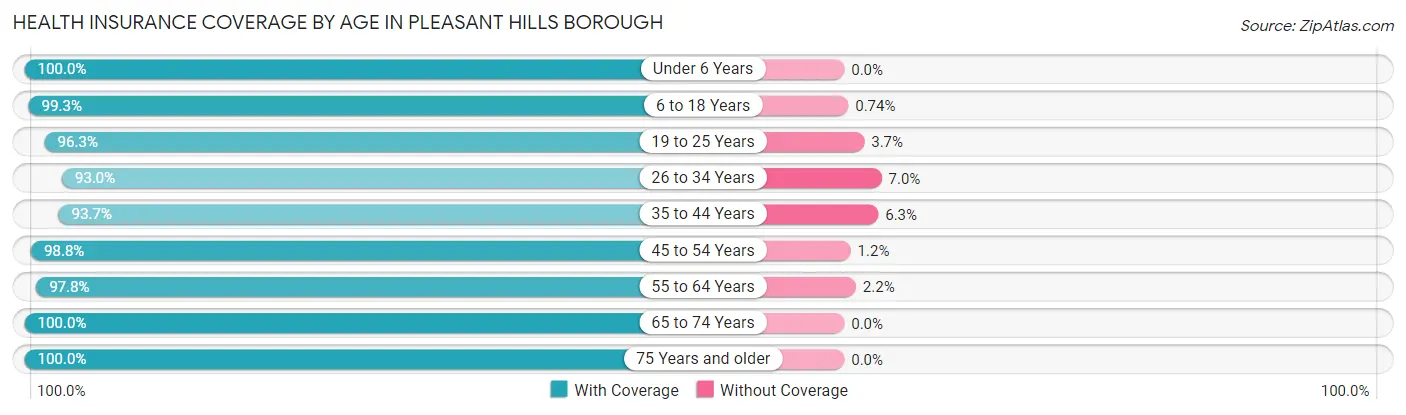
| Age Bracket | With Coverage | Without Coverage |
| Under 6 Years | 493 (100.0%) | 0 (0.0%) |
| 6 to 18 Years | 1,066 (99.3%) | 8 (0.7%) |
| 19 to 25 Years | 619 (96.3%) | 24 (3.7%) |
| 26 to 34 Years | 829 (93.0%) | 62 (7.0%) |
| 35 to 44 Years | 916 (93.7%) | 62 (6.3%) |
| 45 to 54 Years | 1,248 (98.8%) | 15 (1.2%) |
| 55 to 64 Years | 1,084 (97.8%) | 24 (2.2%) |
| 65 to 74 Years | 994 (100.0%) | 0 (0.0%) |
| 75 Years and older | 892 (100.0%) | 0 (0.0%) |
| Total | 8,141 (97.7%) | 195 (2.3%) |
Health Insurance Coverage by Citizenship Status in Pleasant Hills borough
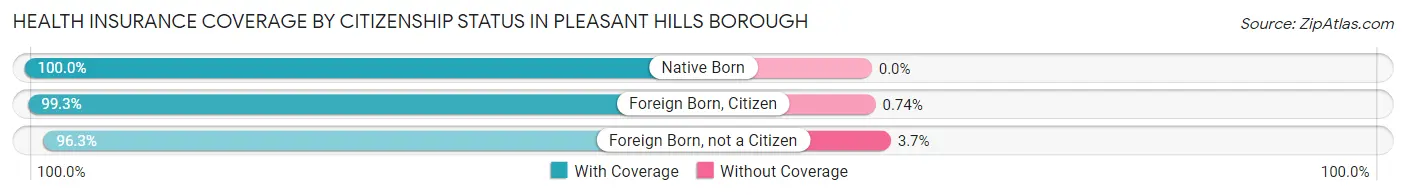
| Citizenship Status | With Coverage | Without Coverage |
| Native Born | 493 (100.0%) | 0 (0.0%) |
| Foreign Born, Citizen | 1,066 (99.3%) | 8 (0.7%) |
| Foreign Born, not a Citizen | 619 (96.3%) | 24 (3.7%) |
Health Insurance Coverage by Household Income in Pleasant Hills borough
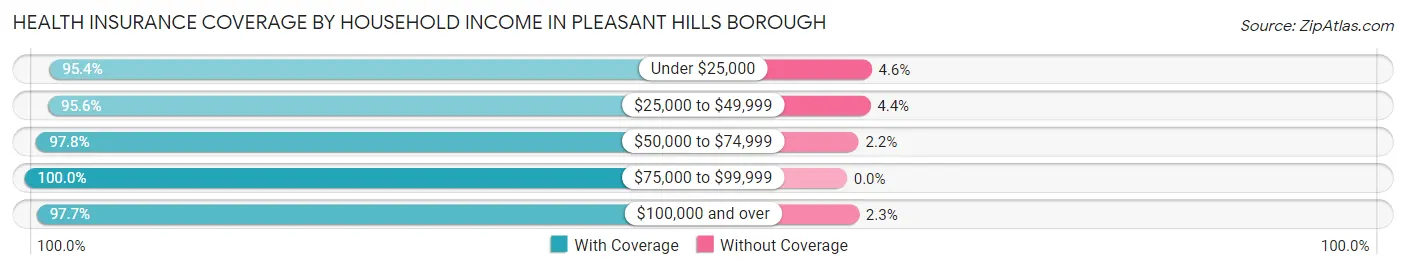
| Household Income | With Coverage | Without Coverage |
| Under $25,000 | 494 (95.4%) | 24 (4.6%) |
| $25,000 to $49,999 | 867 (95.6%) | 40 (4.4%) |
| $50,000 to $74,999 | 980 (97.8%) | 22 (2.2%) |
| $75,000 to $99,999 | 1,101 (100.0%) | 0 (0.0%) |
| $100,000 and over | 4,698 (97.7%) | 109 (2.3%) |
Public vs Private Health Insurance Coverage by Age in Pleasant Hills borough
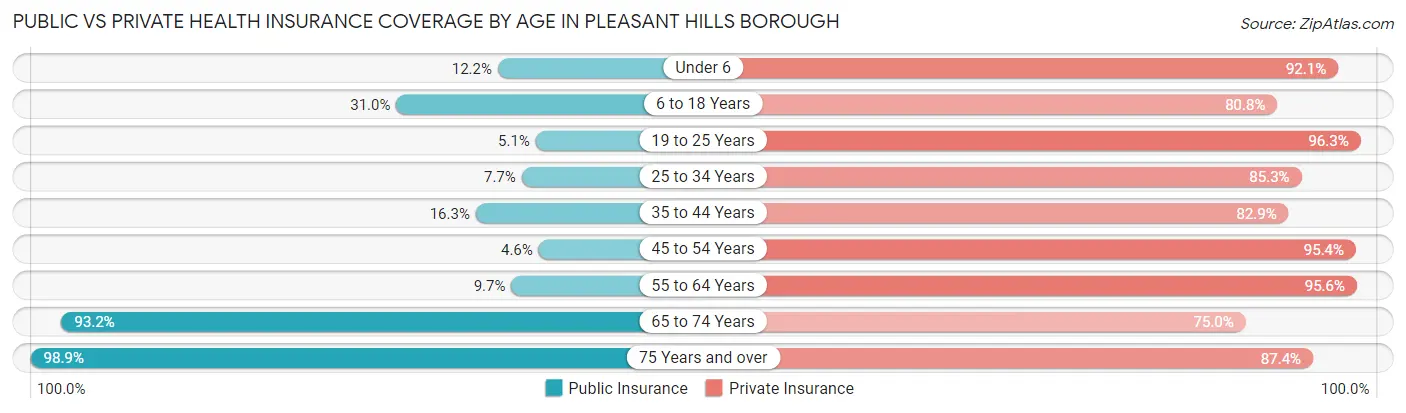
| Age Bracket | Public Insurance | Private Insurance |
| Under 6 | 60 (12.2%) | 454 (92.1%) |
| 6 to 18 Years | 333 (31.0%) | 868 (80.8%) |
| 19 to 25 Years | 33 (5.1%) | 619 (96.3%) |
| 25 to 34 Years | 69 (7.7%) | 760 (85.3%) |
| 35 to 44 Years | 159 (16.3%) | 811 (82.9%) |
| 45 to 54 Years | 58 (4.6%) | 1,205 (95.4%) |
| 55 to 64 Years | 107 (9.7%) | 1,059 (95.6%) |
| 65 to 74 Years | 926 (93.2%) | 745 (75.0%) |
| 75 Years and over | 882 (98.9%) | 780 (87.4%) |
| Total | 2,627 (31.5%) | 7,301 (87.6%) |
Disability Status by Sex by Age in Pleasant Hills borough
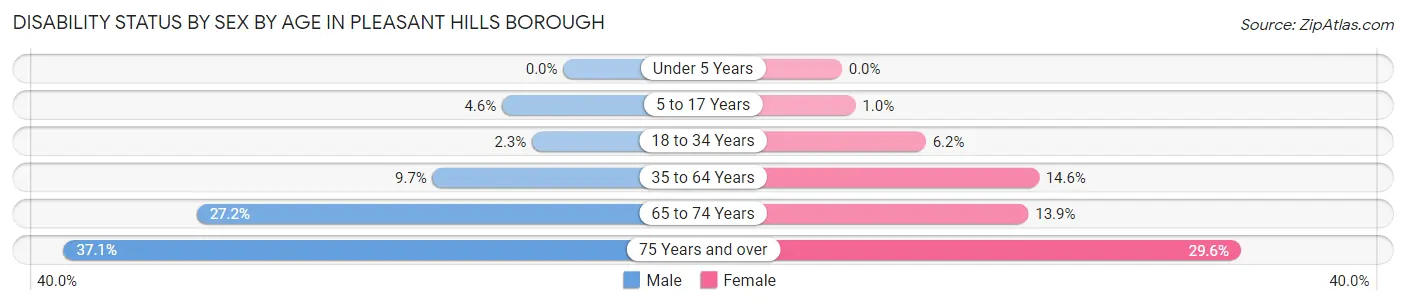
| Age Bracket | Male | Female |
| Under 5 Years | 0 (0.0%) | 0 (0.0%) |
| 5 to 17 Years | 25 (4.5%) | 6 (1.0%) |
| 18 to 34 Years | 21 (2.3%) | 42 (6.2%) |
| 35 to 64 Years | 157 (9.7%) | 253 (14.6%) |
| 65 to 74 Years | 129 (27.2%) | 72 (13.9%) |
| 75 Years and over | 128 (37.1%) | 162 (29.6%) |
Disability Class by Sex by Age in Pleasant Hills borough
Disability Class: Hearing Difficulty
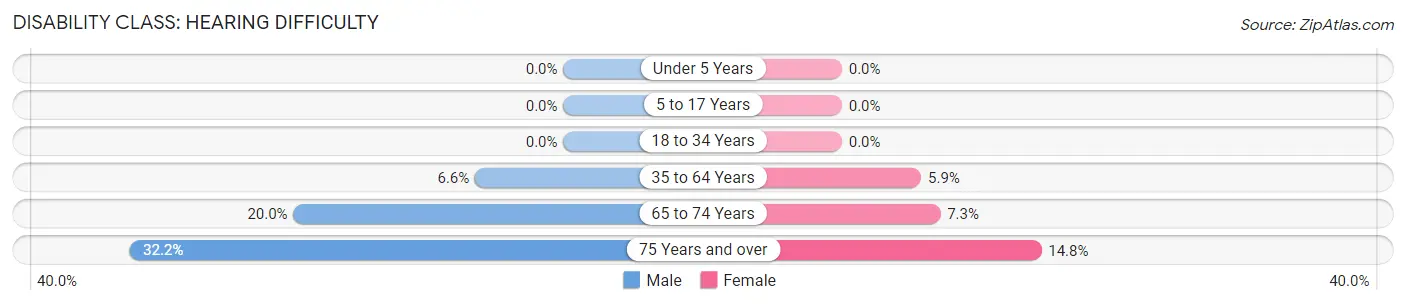
| Age Bracket | Male | Female |
| Under 5 Years | 0 (0.0%) | 0 (0.0%) |
| 5 to 17 Years | 0 (0.0%) | 0 (0.0%) |
| 18 to 34 Years | 0 (0.0%) | 0 (0.0%) |
| 35 to 64 Years | 106 (6.6%) | 102 (5.9%) |
| 65 to 74 Years | 95 (20.0%) | 38 (7.3%) |
| 75 Years and over | 111 (32.2%) | 81 (14.8%) |
Disability Class: Vision Difficulty
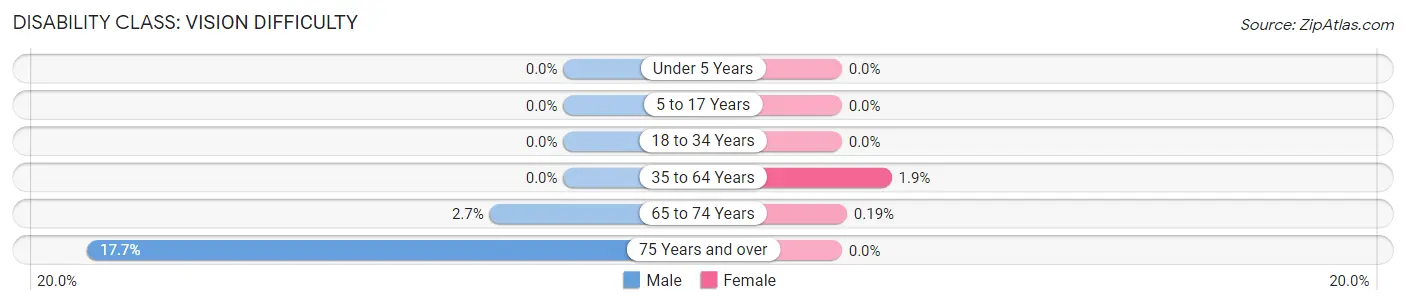
| Age Bracket | Male | Female |
| Under 5 Years | 0 (0.0%) | 0 (0.0%) |
| 5 to 17 Years | 0 (0.0%) | 0 (0.0%) |
| 18 to 34 Years | 0 (0.0%) | 0 (0.0%) |
| 35 to 64 Years | 0 (0.0%) | 32 (1.8%) |
| 65 to 74 Years | 13 (2.7%) | 1 (0.2%) |
| 75 Years and over | 61 (17.7%) | 0 (0.0%) |
Disability Class: Cognitive Difficulty
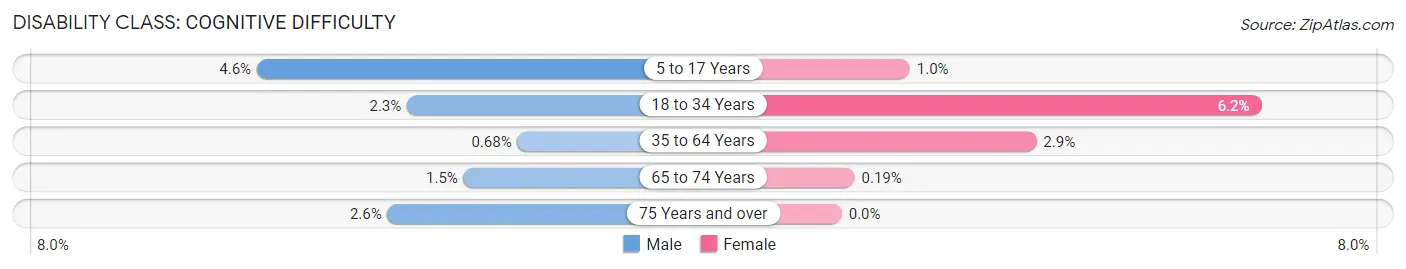
| Age Bracket | Male | Female |
| 5 to 17 Years | 25 (4.5%) | 6 (1.0%) |
| 18 to 34 Years | 21 (2.3%) | 42 (6.2%) |
| 35 to 64 Years | 11 (0.7%) | 50 (2.9%) |
| 65 to 74 Years | 7 (1.5%) | 1 (0.2%) |
| 75 Years and over | 9 (2.6%) | 0 (0.0%) |
Disability Class: Ambulatory Difficulty
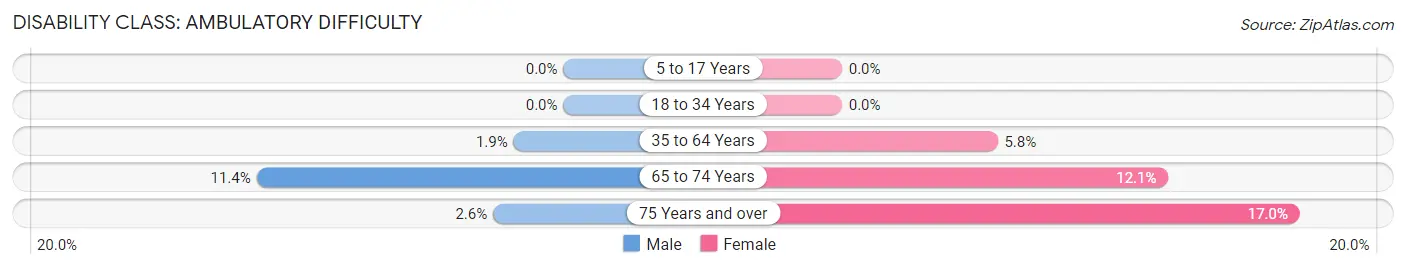
| Age Bracket | Male | Female |
| 5 to 17 Years | 0 (0.0%) | 0 (0.0%) |
| 18 to 34 Years | 0 (0.0%) | 0 (0.0%) |
| 35 to 64 Years | 30 (1.8%) | 100 (5.8%) |
| 65 to 74 Years | 54 (11.4%) | 63 (12.1%) |
| 75 Years and over | 9 (2.6%) | 93 (17.0%) |
Disability Class: Self-Care Difficulty
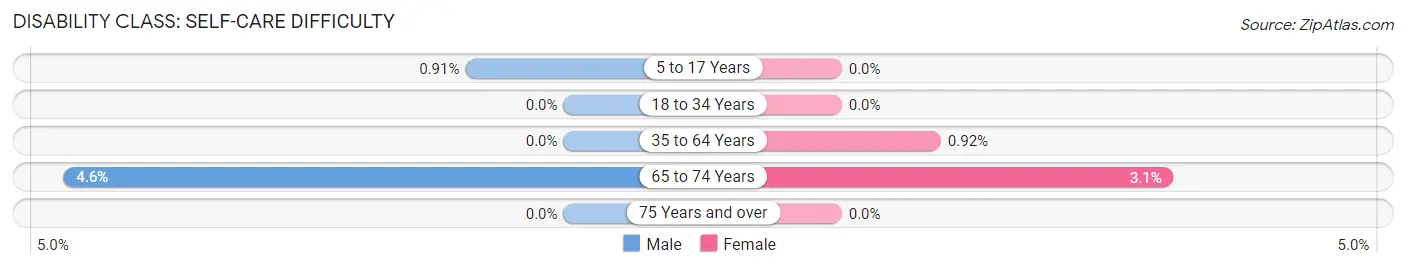
| Age Bracket | Male | Female |
| 5 to 17 Years | 5 (0.9%) | 0 (0.0%) |
| 18 to 34 Years | 0 (0.0%) | 0 (0.0%) |
| 35 to 64 Years | 0 (0.0%) | 16 (0.9%) |
| 65 to 74 Years | 22 (4.6%) | 16 (3.1%) |
| 75 Years and over | 0 (0.0%) | 0 (0.0%) |
Technology Access in Pleasant Hills borough
Computing Device Access in Pleasant Hills borough
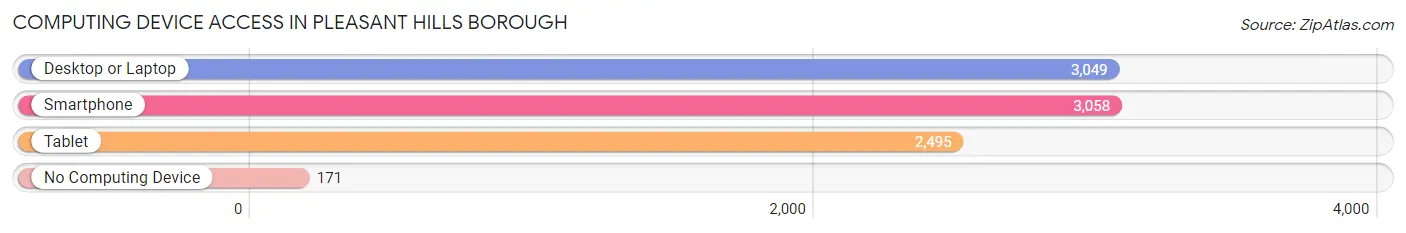
| Device Type | # Households | % Households |
| Desktop or Laptop | 3,049 | 85.9% |
| Smartphone | 3,058 | 86.1% |
| Tablet | 2,495 | 70.3% |
| No Computing Device | 171 | 4.8% |
| Total | 3,550 | 100.0% |
Internet Access in Pleasant Hills borough
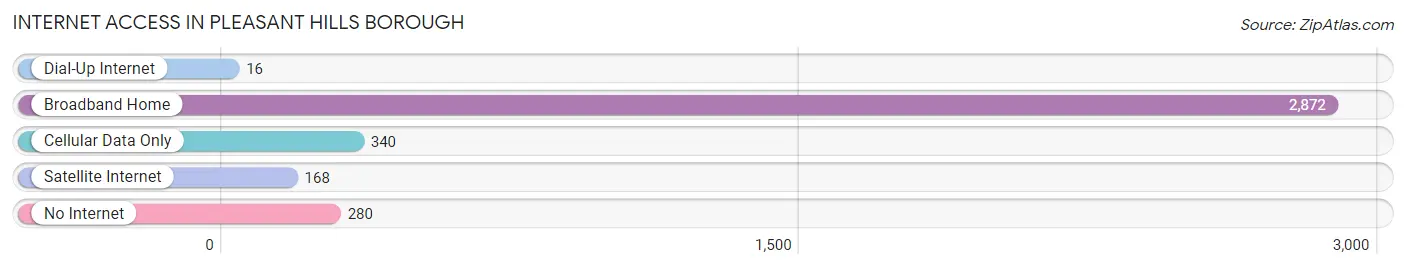
| Internet Type | # Households | % Households |
| Dial-Up Internet | 16 | 0.4% |
| Broadband Home | 2,872 | 80.9% |
| Cellular Data Only | 340 | 9.6% |
| Satellite Internet | 168 | 4.7% |
| No Internet | 280 | 7.9% |
| Total | 3,550 | 100.0% |
Pleasant Hills borough Summary
Pleasant Hills Borough is a small borough located in Allegheny County, Pennsylvania. It is situated approximately 10 miles south of Pittsburgh and is part of the Pittsburgh Metropolitan Statistical Area. The borough was incorporated in 1951 and has a population of 8,268 as of the 2010 census.
History
The area that is now Pleasant Hills Borough was originally inhabited by the Lenape Native Americans. The first European settlers arrived in the area in the late 1700s and early 1800s. The area was originally part of Elizabeth Township, which was established in 1788. In 1845, the area was split off from Elizabeth Township and became Jefferson Township.
In 1951, the area was incorporated as the Borough of Pleasant Hills. The name of the borough was chosen to reflect the pleasant rolling hills of the area.
Geography
Pleasant Hills Borough is located in Allegheny County, Pennsylvania. It is situated approximately 10 miles south of Pittsburgh and is part of the Pittsburgh Metropolitan Statistical Area. The borough has a total area of 2.2 square miles, all of which is land.
The borough is bordered by Baldwin Borough to the north, Whitehall Borough to the east, Jefferson Hills Borough to the south, and Bethel Park to the west.
Economy
The economy of Pleasant Hills Borough is largely based on retail and services. The borough is home to several shopping centers, including the Pleasant Hills Shopping Center, the Pleasant Hills Plaza, and the Pleasant Hills Towne Center.
The borough is also home to several businesses, including a number of restaurants, banks, and professional services.
Demographics
As of the 2010 census, the population of Pleasant Hills Borough was 8,268. The racial makeup of the borough was 92.3% White, 4.2% African American, 0.3% Native American, 1.2% Asian, 0.1% Pacific Islander, 0.7% from other races, and 1.2% from two or more races. Hispanic or Latino of any race were 1.7% of the population.
The median household income in the borough was $60,945, and the median family income was $71,917. The per capita income was $30,945. About 3.2% of families and 4.3% of the population were below the poverty line, including 5.2% of those under age 18 and 4.2% of those age 65 or over.
Common Questions
What is Per Capita Income in Pleasant Hills borough?
Per Capita income in Pleasant Hills borough is $45,422.
What is the Median Family Income in Pleasant Hills borough?
Median Family Income in Pleasant Hills borough is $111,450.
What is the Median Household income in Pleasant Hills borough?
Median Household Income in Pleasant Hills borough is $88,893.
What is Income or Wage Gap in Pleasant Hills borough?
Income or Wage Gap in Pleasant Hills borough is 12.2%.
Women in Pleasant Hills borough earn 87.8 cents for every dollar earned by a man.
What is Inequality or Gini Index in Pleasant Hills borough?
Inequality or Gini Index in Pleasant Hills borough is 0.40.
What is the Total Population of Pleasant Hills borough?
Total Population of Pleasant Hills borough is 8,456.
What is the Total Male Population of Pleasant Hills borough?
Total Male Population of Pleasant Hills borough is 4,132.
What is the Total Female Population of Pleasant Hills borough?
Total Female Population of Pleasant Hills borough is 4,324.
What is the Ratio of Males per 100 Females in Pleasant Hills borough?
There are 95.56 Males per 100 Females in Pleasant Hills borough.
What is the Ratio of Females per 100 Males in Pleasant Hills borough?
There are 104.65 Females per 100 Males in Pleasant Hills borough.
What is the Median Population Age in Pleasant Hills borough?
Median Population Age in Pleasant Hills borough is 46.6 Years.
What is the Average Family Size in Pleasant Hills borough
Average Family Size in Pleasant Hills borough is 2.8 People.
What is the Average Household Size in Pleasant Hills borough
Average Household Size in Pleasant Hills borough is 2.4 People.
How Large is the Labor Force in Pleasant Hills borough?
There are 4,490 People in the Labor Forcein in Pleasant Hills borough.
What is the Percentage of People in the Labor Force in Pleasant Hills borough?
62.2% of People are in the Labor Force in Pleasant Hills borough.
What is the Unemployment Rate in Pleasant Hills borough?
Unemployment Rate in Pleasant Hills borough is 4.6%.