West Chester borough, PA Map & Demographics
West Chester borough Overview
$41,443
PER CAPITA INCOME
$99,847
AVG FAMILY INCOME
$71,875
AVG HOUSEHOLD INCOME
57.8%
WAGE / INCOME GAP [ % ]
42.2¢/ $1
WAGE / INCOME GAP [ $ ]
$11,347
FAMILY INCOME DEFICIT
0.50
INEQUALITY / GINI INDEX
19,016
TOTAL POPULATION
8,635
MALE POPULATION
10,381
FEMALE POPULATION
83.18
MALES / 100 FEMALES
120.22
FEMALES / 100 MALES
24.6
MEDIAN AGE
2.9
AVG FAMILY SIZE
2.1
AVG HOUSEHOLD SIZE
11,850
LABOR FORCE [ PEOPLE ]
67.3%
PERCENT IN LABOR FORCE
7.3%
UNEMPLOYMENT RATE
Income in West Chester borough
Income Overview in West Chester borough
Per Capita Income in West Chester borough is $41,443, while median incomes of families and households are $99,847 and $71,875 respectively.
| Characteristic | Number | Measure |
| Per Capita Income | 19,016 | $41,443 |
| Median Family Income | 2,403 | $99,847 |
| Mean Family Income | 2,403 | $147,003 |
| Median Household Income | 6,996 | $71,875 |
| Mean Household Income | 6,996 | $104,370 |
| Income Deficit | 2,403 | $11,347 |
| Wage / Income Gap (%) | 19,016 | 57.83% |
| Wage / Income Gap ($) | 19,016 | 42.17¢ per $1 |
| Gini / Inequality Index | 19,016 | 0.50 |
Earnings by Sex in West Chester borough
Average Earnings in West Chester borough are $25,090, $38,425 for men and $16,202 for women, a difference of 57.8%.
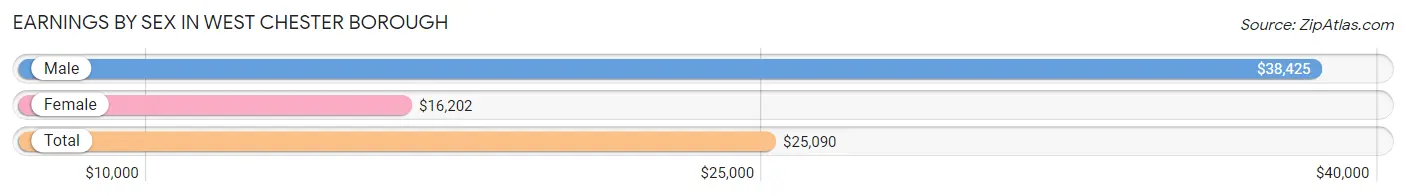
| Sex | Number | Average Earnings |
| Male | 6,681 (47.7%) | $38,425 |
| Female | 7,327 (52.3%) | $16,202 |
| Total | 14,008 (100.0%) | $25,090 |
Earnings by Sex by Income Bracket in West Chester borough
The most common earnings brackets in West Chester borough are $100,000+ for men (1,025 | 15.3%) and $2,499 or less for women (1,022 | 14.0%).
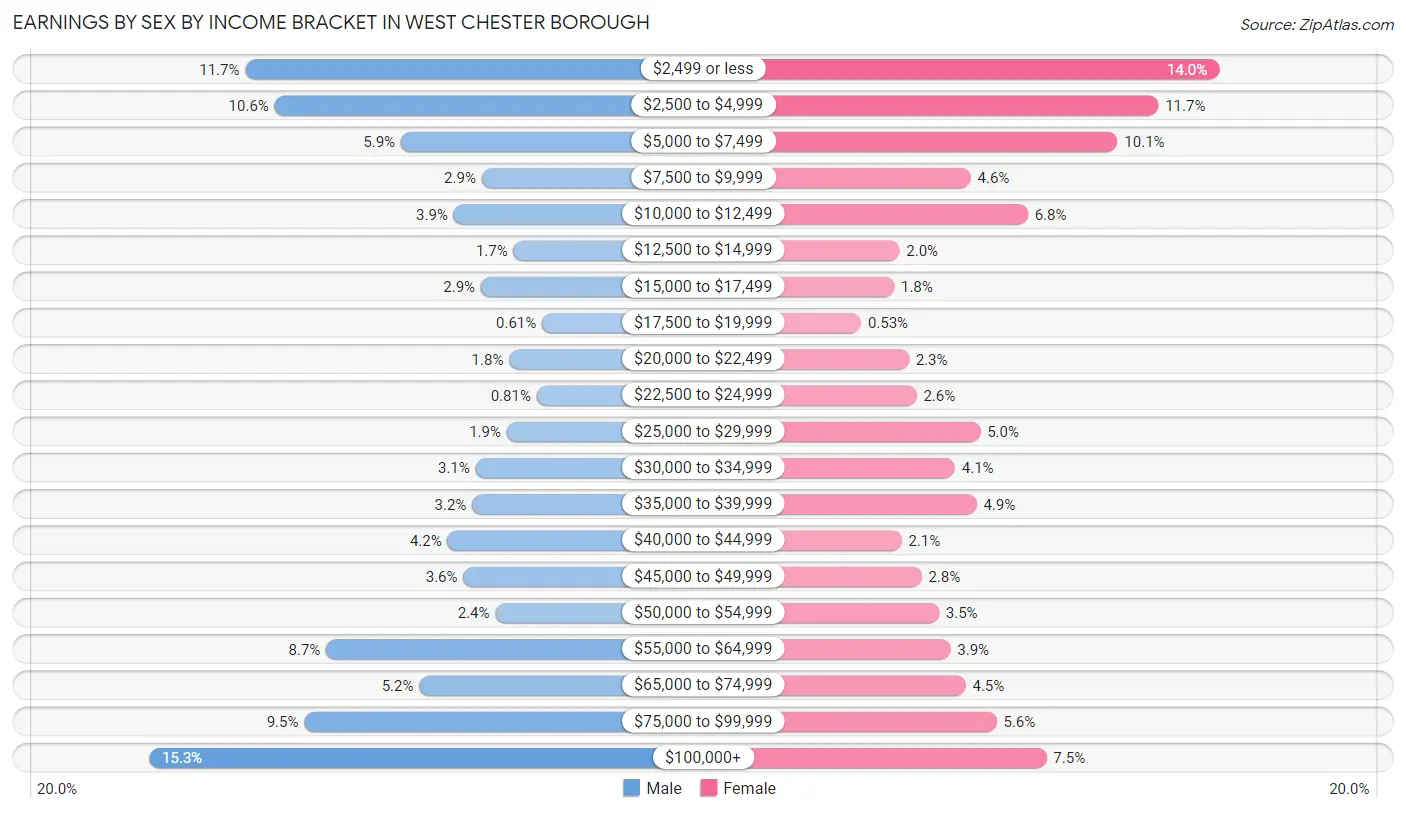
| Income | Male | Female |
| $2,499 or less | 784 (11.7%) | 1,022 (14.0%) |
| $2,500 to $4,999 | 710 (10.6%) | 855 (11.7%) |
| $5,000 to $7,499 | 394 (5.9%) | 743 (10.1%) |
| $7,500 to $9,999 | 192 (2.9%) | 340 (4.6%) |
| $10,000 to $12,499 | 262 (3.9%) | 497 (6.8%) |
| $12,500 to $14,999 | 112 (1.7%) | 144 (2.0%) |
| $15,000 to $17,499 | 194 (2.9%) | 130 (1.8%) |
| $17,500 to $19,999 | 41 (0.6%) | 39 (0.5%) |
| $20,000 to $22,499 | 123 (1.8%) | 170 (2.3%) |
| $22,500 to $24,999 | 54 (0.8%) | 191 (2.6%) |
| $25,000 to $29,999 | 129 (1.9%) | 366 (5.0%) |
| $30,000 to $34,999 | 207 (3.1%) | 297 (4.1%) |
| $35,000 to $39,999 | 216 (3.2%) | 356 (4.9%) |
| $40,000 to $44,999 | 277 (4.2%) | 150 (2.1%) |
| $45,000 to $49,999 | 238 (3.6%) | 205 (2.8%) |
| $50,000 to $54,999 | 158 (2.4%) | 253 (3.5%) |
| $55,000 to $64,999 | 581 (8.7%) | 284 (3.9%) |
| $65,000 to $74,999 | 348 (5.2%) | 326 (4.4%) |
| $75,000 to $99,999 | 636 (9.5%) | 411 (5.6%) |
| $100,000+ | 1,025 (15.3%) | 548 (7.5%) |
| Total | 6,681 (100.0%) | 7,327 (100.0%) |
Earnings by Sex by Educational Attainment in West Chester borough
Average earnings in West Chester borough are $66,450 for men and $49,891 for women, a difference of 24.9%. Men with an educational attainment of graduate degree enjoy the highest average annual earnings of $92,115, while those with less than high school education earn the least with $19,957. Women with an educational attainment of graduate degree earn the most with the average annual earnings of $66,250, while those with high school diploma education have the smallest earnings of $35,137.
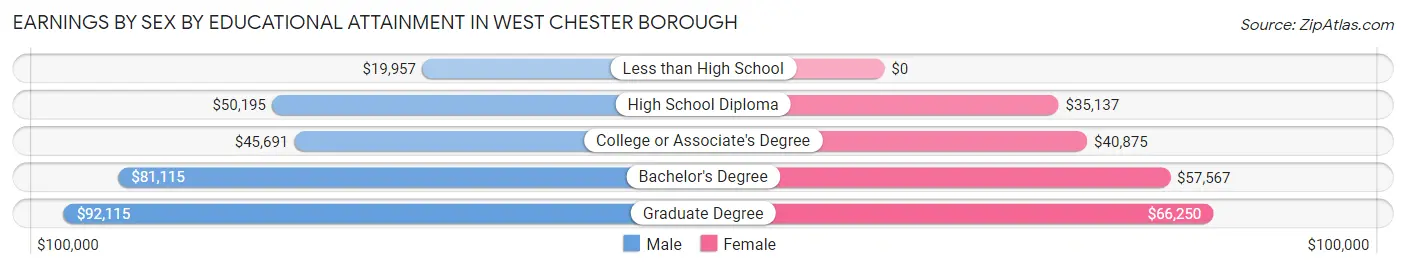
| Educational Attainment | Male Income | Female Income |
| Less than High School | $19,957 | $0 |
| High School Diploma | $50,195 | $35,137 |
| College or Associate's Degree | $45,691 | $40,875 |
| Bachelor's Degree | $81,115 | $57,567 |
| Graduate Degree | $92,115 | $66,250 |
| Total | $66,450 | $49,891 |
Family Income in West Chester borough
Family Income Brackets in West Chester borough
According to the West Chester borough family income data, there are 550 families falling into the $200,000+ income range, which is the most common income bracket and makes up 22.9% of all families. Conversely, the less than $10,000 income bracket is the least frequent group with only 34 families (1.4%) belonging to this category.
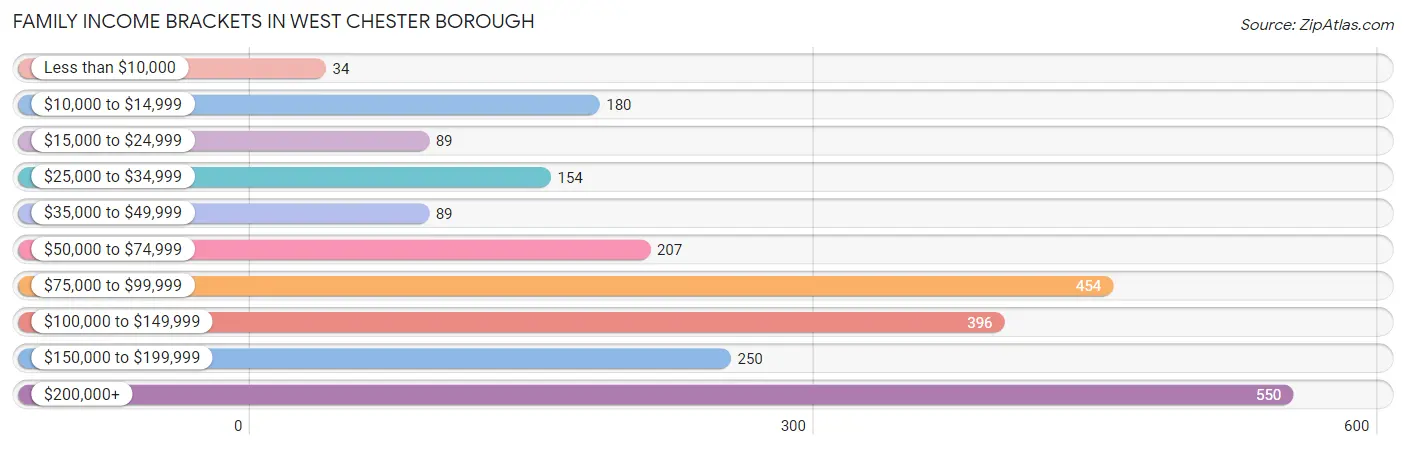
| Income Bracket | # Families | % Families |
| Less than $10,000 | 34 | 1.4% |
| $10,000 to $14,999 | 180 | 7.5% |
| $15,000 to $24,999 | 89 | 3.7% |
| $25,000 to $34,999 | 154 | 6.4% |
| $35,000 to $49,999 | 89 | 3.7% |
| $50,000 to $74,999 | 207 | 8.6% |
| $75,000 to $99,999 | 454 | 18.9% |
| $100,000 to $149,999 | 396 | 16.5% |
| $150,000 to $199,999 | 250 | 10.4% |
| $200,000+ | 550 | 22.9% |
Family Income by Famaliy Size in West Chester borough
4-person families (464 | 19.3%) account for the highest median family income in West Chester borough with $181,923 per family, while 2-person families (1,236 | 51.4%) have the highest median income of $49,210 per family member.
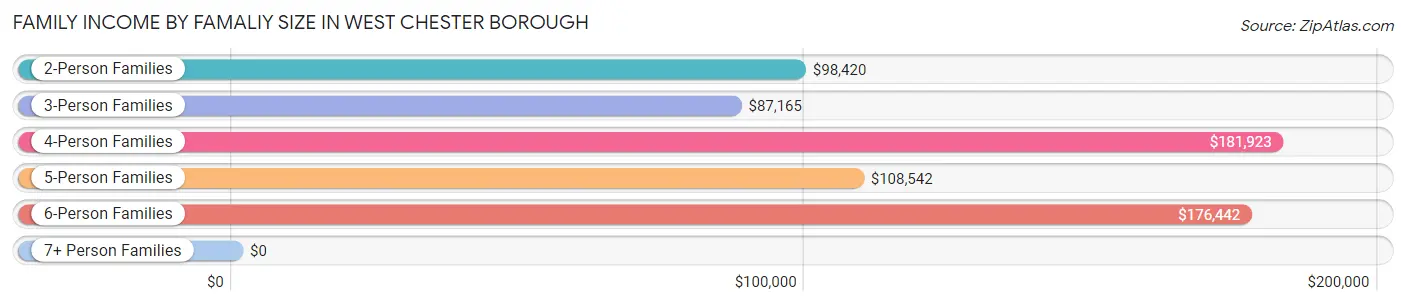
| Income Bracket | # Families | Median Income |
| 2-Person Families | 1,236 (51.4%) | $98,420 |
| 3-Person Families | 553 (23.0%) | $87,165 |
| 4-Person Families | 464 (19.3%) | $181,923 |
| 5-Person Families | 113 (4.7%) | $108,542 |
| 6-Person Families | 31 (1.3%) | $176,442 |
| 7+ Person Families | 6 (0.3%) | $0 |
| Total | 2,403 (100.0%) | $99,847 |
Family Income by Number of Earners in West Chester borough
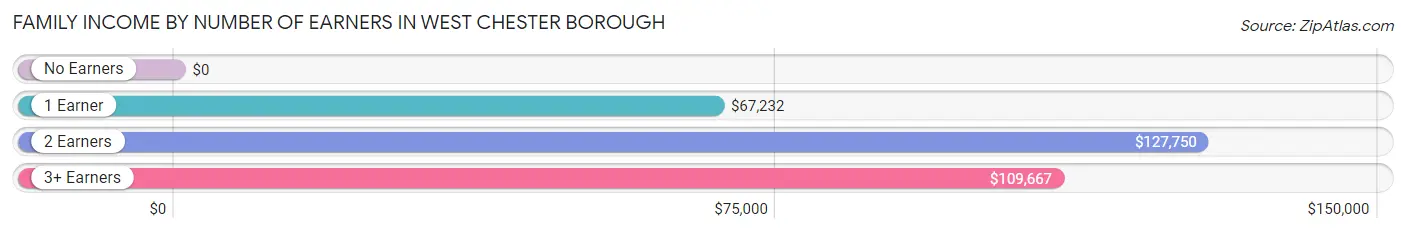
| Number of Earners | # Families | Median Income |
| No Earners | 299 (12.4%) | $0 |
| 1 Earner | 693 (28.8%) | $67,232 |
| 2 Earners | 1,173 (48.8%) | $127,750 |
| 3+ Earners | 238 (9.9%) | $109,667 |
| Total | 2,403 (100.0%) | $99,847 |
Household Income in West Chester borough
Household Income Brackets in West Chester borough
With 1,161 households falling in the category, the $75,000 to $99,999 income range is the most frequent in West Chester borough, accounting for 16.6% of all households. In contrast, only 294 households (4.2%) fall into the less than $10,000 income bracket, making it the least populous group.
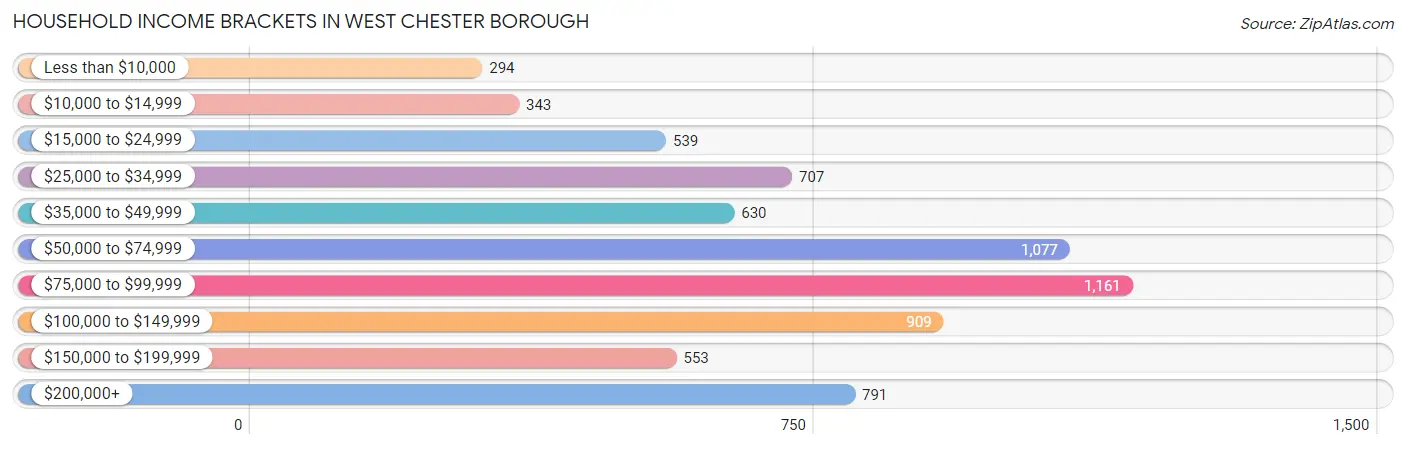
| Income Bracket | # Households | % Households |
| Less than $10,000 | 294 | 4.2% |
| $10,000 to $14,999 | 343 | 4.9% |
| $15,000 to $24,999 | 539 | 7.7% |
| $25,000 to $34,999 | 707 | 10.1% |
| $35,000 to $49,999 | 630 | 9.0% |
| $50,000 to $74,999 | 1,077 | 15.4% |
| $75,000 to $99,999 | 1,161 | 16.6% |
| $100,000 to $149,999 | 909 | 13.0% |
| $150,000 to $199,999 | 553 | 7.9% |
| $200,000+ | 791 | 11.3% |
Household Income by Householder Age in West Chester borough
The median household income in West Chester borough is $71,875, with the highest median household income of $92,031 found in the 45 to 64 years age bracket for the primary householder. A total of 1,570 households (22.4%) fall into this category. Meanwhile, the 65+ years age bracket for the primary householder has the lowest median household income of $43,453, with 1,271 households (18.2%) in this group.
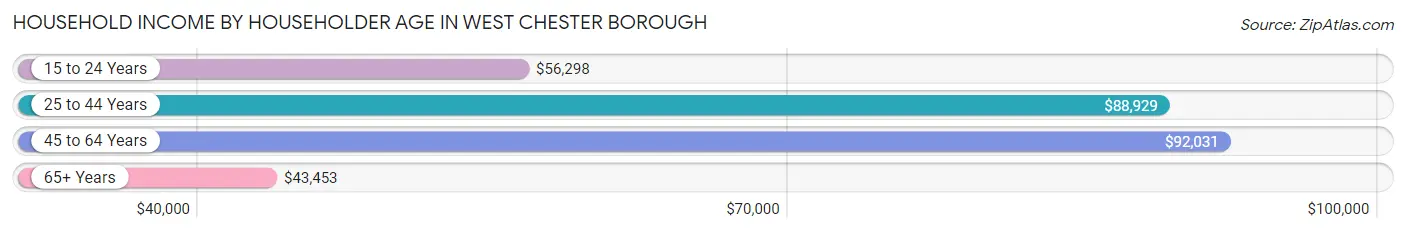
| Income Bracket | # Households | Median Income |
| 15 to 24 Years | 1,301 (18.6%) | $56,298 |
| 25 to 44 Years | 2,854 (40.8%) | $88,929 |
| 45 to 64 Years | 1,570 (22.4%) | $92,031 |
| 65+ Years | 1,271 (18.2%) | $43,453 |
| Total | 6,996 (100.0%) | $71,875 |
Poverty in West Chester borough
Income Below Poverty by Sex and Age in West Chester borough
With 20.9% poverty level for males and 21.1% for females among the residents of West Chester borough, 6 to 11 year old males and 12 to 14 year old females are the most vulnerable to poverty, with 202 males (66.7%) and 37 females (71.2%) in their respective age groups living below the poverty level.
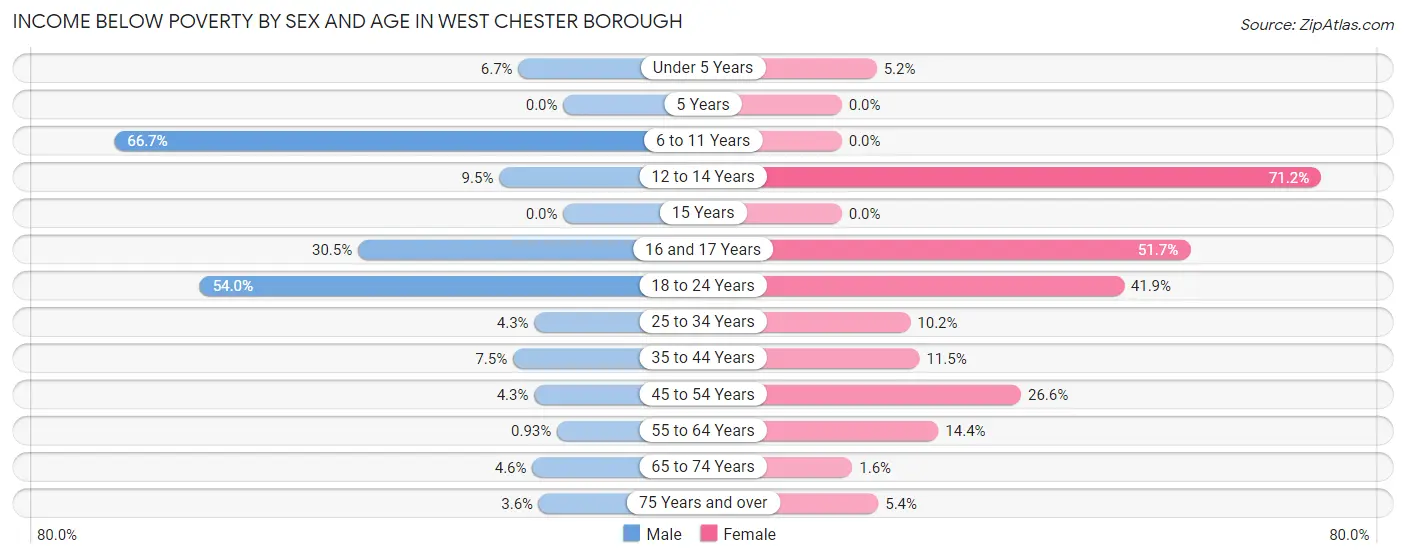
| Age Bracket | Male | Female |
| Under 5 Years | 14 (6.7%) | 7 (5.2%) |
| 5 Years | 0 (0.0%) | 0 (0.0%) |
| 6 to 11 Years | 202 (66.7%) | 0 (0.0%) |
| 12 to 14 Years | 12 (9.5%) | 37 (71.2%) |
| 15 Years | 0 (0.0%) | 0 (0.0%) |
| 16 and 17 Years | 25 (30.5%) | 106 (51.7%) |
| 18 to 24 Years | 1,021 (54.0%) | 916 (41.9%) |
| 25 to 34 Years | 73 (4.3%) | 167 (10.2%) |
| 35 to 44 Years | 59 (7.5%) | 80 (11.5%) |
| 45 to 54 Years | 27 (4.3%) | 210 (26.6%) |
| 55 to 64 Years | 5 (0.9%) | 90 (14.3%) |
| 65 to 74 Years | 20 (4.6%) | 10 (1.6%) |
| 75 Years and over | 7 (3.6%) | 22 (5.4%) |
| Total | 1,465 (20.9%) | 1,645 (21.1%) |
Income Above Poverty by Sex and Age in West Chester borough
According to the poverty statistics in West Chester borough, males aged 5 years and females aged 5 years are the age groups that are most secure financially, with 100.0% of males and 100.0% of females in these age groups living above the poverty line.
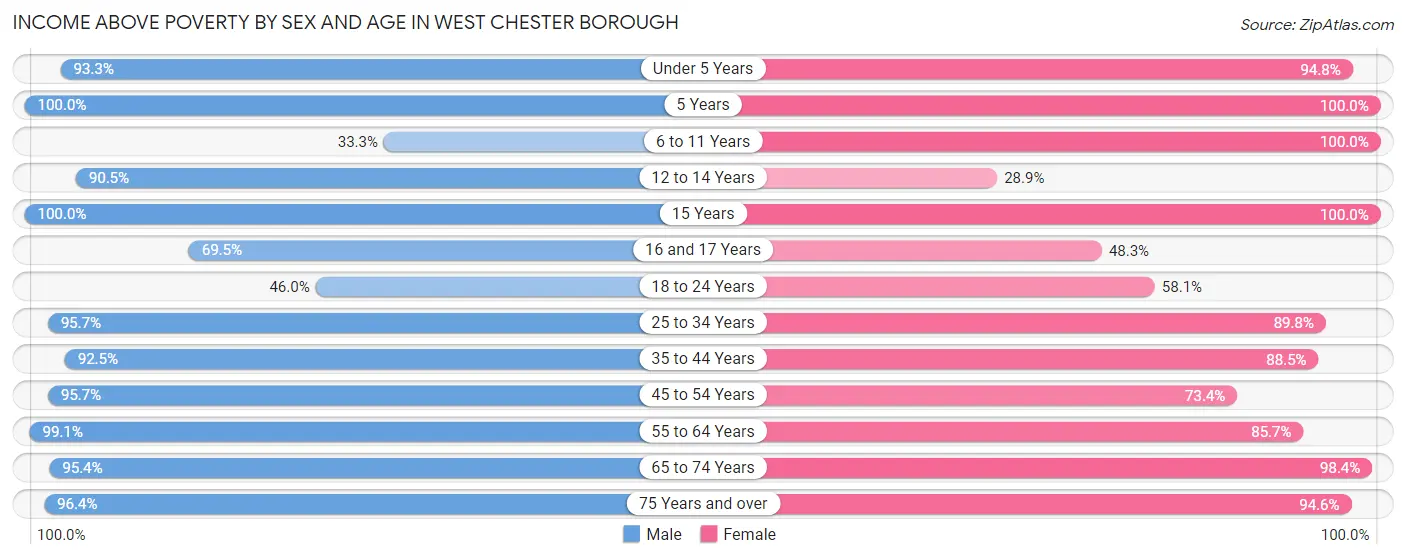
| Age Bracket | Male | Female |
| Under 5 Years | 196 (93.3%) | 128 (94.8%) |
| 5 Years | 41 (100.0%) | 15 (100.0%) |
| 6 to 11 Years | 101 (33.3%) | 359 (100.0%) |
| 12 to 14 Years | 114 (90.5%) | 15 (28.8%) |
| 15 Years | 91 (100.0%) | 64 (100.0%) |
| 16 and 17 Years | 57 (69.5%) | 99 (48.3%) |
| 18 to 24 Years | 870 (46.0%) | 1,271 (58.1%) |
| 25 to 34 Years | 1,623 (95.7%) | 1,474 (89.8%) |
| 35 to 44 Years | 731 (92.5%) | 613 (88.5%) |
| 45 to 54 Years | 599 (95.7%) | 579 (73.4%) |
| 55 to 64 Years | 532 (99.1%) | 537 (85.7%) |
| 65 to 74 Years | 415 (95.4%) | 626 (98.4%) |
| 75 Years and over | 186 (96.4%) | 384 (94.6%) |
| Total | 5,556 (79.1%) | 6,164 (78.9%) |
Income Below Poverty Among Married-Couple Families in West Chester borough
The poverty statistics for married-couple families in West Chester borough show that 3.7% or 54 of the total 1,459 families live below the poverty line. Families with no children have the highest poverty rate of 4.3%, comprising of 42 families. On the other hand, families with 3 or 4 children have the lowest poverty rate of 0.0%, which includes 0 families.
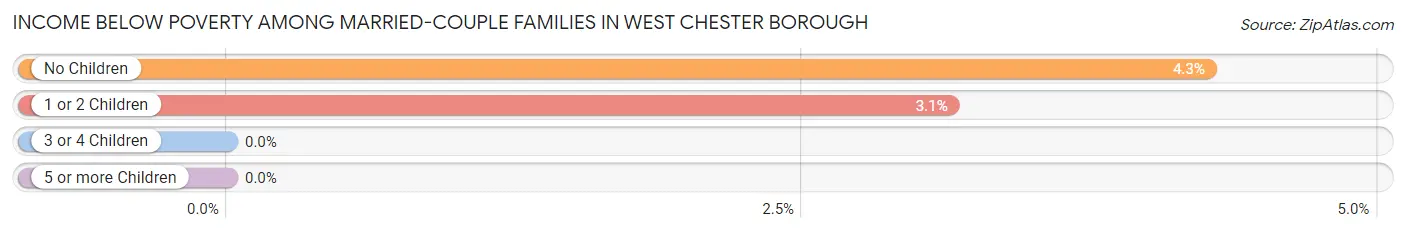
| Children | Above Poverty | Below Poverty |
| No Children | 943 (95.7%) | 42 (4.3%) |
| 1 or 2 Children | 370 (96.9%) | 12 (3.1%) |
| 3 or 4 Children | 92 (100.0%) | 0 (0.0%) |
| 5 or more Children | 0 (0.0%) | 0 (0.0%) |
| Total | 1,405 (96.3%) | 54 (3.7%) |
Income Below Poverty Among Single-Parent Households in West Chester borough
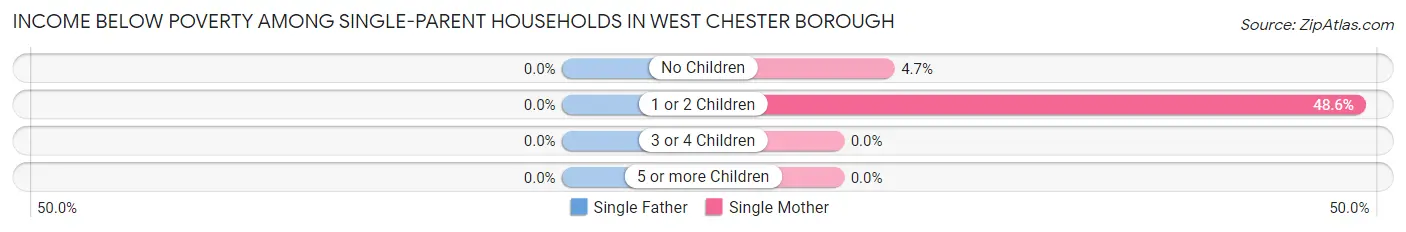
| Children | Single Father | Single Mother |
| No Children | 0 (0.0%) | 14 (4.7%) |
| 1 or 2 Children | 0 (0.0%) | 192 (48.6%) |
| 3 or 4 Children | 0 (0.0%) | 0 (0.0%) |
| 5 or more Children | 0 (0.0%) | 0 (0.0%) |
| Total | 0 (0.0%) | 206 (29.8%) |
Income Below Poverty Among Married-Couple vs Single-Parent Households in West Chester borough
The poverty data for West Chester borough shows that 54 of the married-couple family households (3.7%) and 206 of the single-parent households (21.8%) are living below the poverty level. Within the married-couple family households, those with no children have the highest poverty rate, with 42 households (4.3%) falling below the poverty line. Among the single-parent households, those with 1 or 2 children have the highest poverty rate, with 192 household (44.7%) living below poverty.
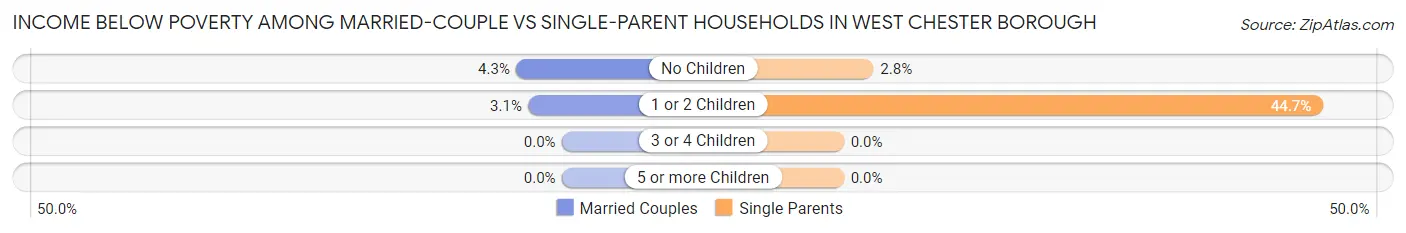
| Children | Married-Couple Families | Single-Parent Households |
| No Children | 42 (4.3%) | 14 (2.8%) |
| 1 or 2 Children | 12 (3.1%) | 192 (44.7%) |
| 3 or 4 Children | 0 (0.0%) | 0 (0.0%) |
| 5 or more Children | 0 (0.0%) | 0 (0.0%) |
| Total | 54 (3.7%) | 206 (21.8%) |
Race in West Chester borough
The most populous races in West Chester borough are White / Caucasian (14,237 | 74.9%), Black / African American (2,755 | 14.5%), and Hispanic or Latino (2,151 | 11.3%).
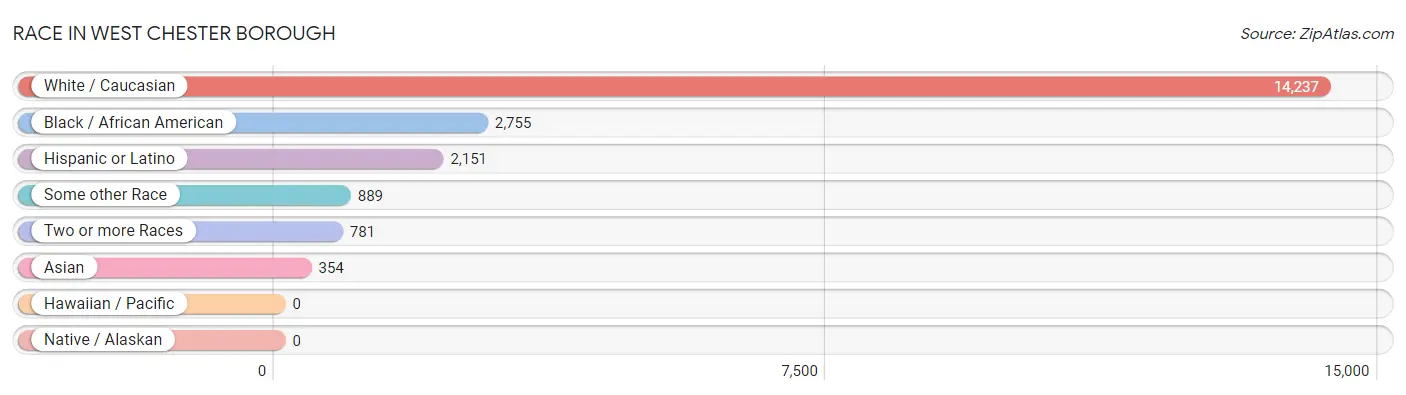
| Race | # Population | % Population |
| Asian | 354 | 1.9% |
| Black / African American | 2,755 | 14.5% |
| Hawaiian / Pacific | 0 | 0.0% |
| Hispanic or Latino | 2,151 | 11.3% |
| Native / Alaskan | 0 | 0.0% |
| White / Caucasian | 14,237 | 74.9% |
| Two or more Races | 781 | 4.1% |
| Some other Race | 889 | 4.7% |
| Total | 19,016 | 100.0% |
Ancestry in West Chester borough
The most populous ancestries reported in West Chester borough are Irish (3,968 | 20.9%), German (3,411 | 17.9%), Italian (3,025 | 15.9%), English (1,536 | 8.1%), and Puerto Rican (1,126 | 5.9%), together accounting for 68.7% of all West Chester borough residents.
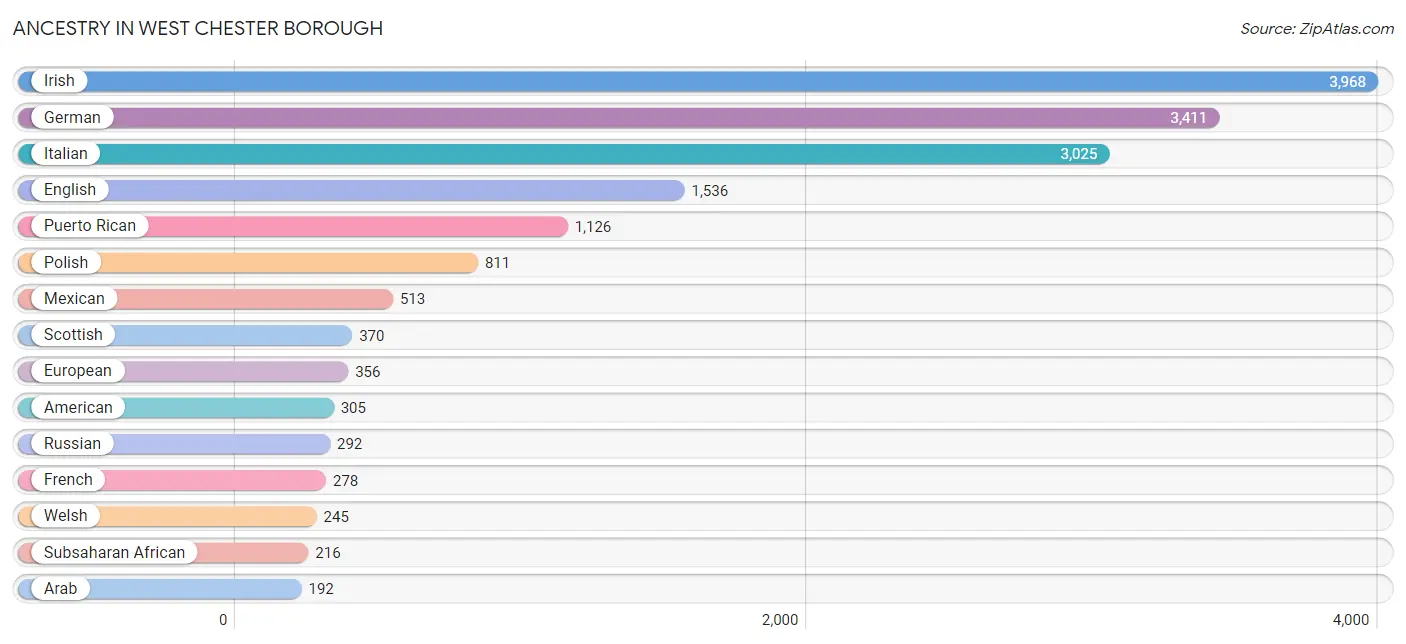
| Ancestry | # Population | % Population |
| African | 90 | 0.5% |
| American | 305 | 1.6% |
| Arab | 192 | 1.0% |
| Argentinean | 8 | 0.0% |
| Armenian | 22 | 0.1% |
| Australian | 11 | 0.1% |
| Austrian | 22 | 0.1% |
| Barbadian | 9 | 0.1% |
| Belgian | 6 | 0.0% |
| Bhutanese | 41 | 0.2% |
| Brazilian | 12 | 0.1% |
| British | 162 | 0.9% |
| Burmese | 43 | 0.2% |
| Canadian | 71 | 0.4% |
| Central American | 93 | 0.5% |
| Cherokee | 60 | 0.3% |
| Chilean | 29 | 0.2% |
| Colombian | 8 | 0.0% |
| Costa Rican | 22 | 0.1% |
| Cree | 3 | 0.0% |
| Croatian | 43 | 0.2% |
| Cuban | 62 | 0.3% |
| Czech | 72 | 0.4% |
| Czechoslovakian | 39 | 0.2% |
| Danish | 30 | 0.2% |
| Dominican | 92 | 0.5% |
| Dutch | 62 | 0.3% |
| Eastern European | 70 | 0.4% |
| Ecuadorian | 38 | 0.2% |
| Egyptian | 46 | 0.2% |
| English | 1,536 | 8.1% |
| Ethiopian | 10 | 0.1% |
| European | 356 | 1.9% |
| Filipino | 91 | 0.5% |
| French | 278 | 1.5% |
| French Canadian | 113 | 0.6% |
| German | 3,411 | 17.9% |
| Greek | 132 | 0.7% |
| Guatemalan | 53 | 0.3% |
| Haitian | 7 | 0.0% |
| Hungarian | 116 | 0.6% |
| Indian (Asian) | 74 | 0.4% |
| Iranian | 8 | 0.0% |
| Irish | 3,968 | 20.9% |
| Israeli | 43 | 0.2% |
| Italian | 3,025 | 15.9% |
| Jamaican | 92 | 0.5% |
| Japanese | 44 | 0.2% |
| Kenyan | 12 | 0.1% |
| Korean | 61 | 0.3% |
| Lebanese | 39 | 0.2% |
| Lithuanian | 121 | 0.6% |
| Mexican | 513 | 2.7% |
| Moroccan | 16 | 0.1% |
| New Zealander | 10 | 0.1% |
| Nigerian | 13 | 0.1% |
| Norwegian | 129 | 0.7% |
| Pakistani | 23 | 0.1% |
| Panamanian | 18 | 0.1% |
| Pennsylvania German | 9 | 0.1% |
| Peruvian | 4 | 0.0% |
| Polish | 811 | 4.3% |
| Portuguese | 19 | 0.1% |
| Puerto Rican | 1,126 | 5.9% |
| Romanian | 30 | 0.2% |
| Russian | 292 | 1.5% |
| Scotch-Irish | 78 | 0.4% |
| Scottish | 370 | 1.9% |
| Sierra Leonean | 50 | 0.3% |
| Slavic | 13 | 0.1% |
| Slovak | 84 | 0.4% |
| Slovene | 8 | 0.0% |
| South African | 41 | 0.2% |
| South American | 87 | 0.5% |
| Spaniard | 55 | 0.3% |
| Spanish | 15 | 0.1% |
| Sri Lankan | 29 | 0.2% |
| Subsaharan African | 216 | 1.1% |
| Swedish | 94 | 0.5% |
| Swiss | 71 | 0.4% |
| Syrian | 81 | 0.4% |
| Thai | 93 | 0.5% |
| Trinidadian and Tobagonian | 49 | 0.3% |
| Ukrainian | 43 | 0.2% |
| Welsh | 245 | 1.3% |
| West Indian | 10 | 0.1% | View All 86 Rows |
Immigrants in West Chester borough
The most numerous immigrant groups reported in West Chester borough came from Latin America (371 | 1.9%), Central America (278 | 1.5%), Asia (250 | 1.3%), Mexico (238 | 1.3%), and Europe (151 | 0.8%), together accounting for 6.8% of all West Chester borough residents.
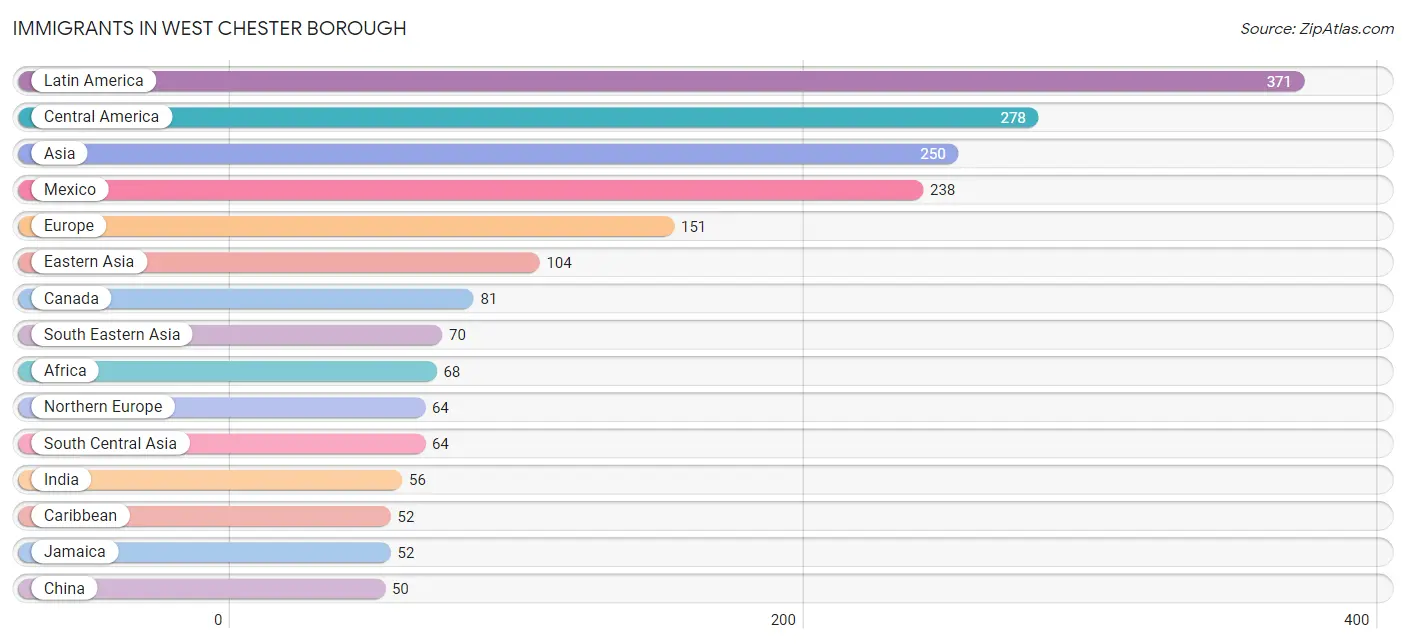
| Immigration Origin | # Population | % Population |
| Africa | 68 | 0.4% |
| Argentina | 8 | 0.0% |
| Asia | 250 | 1.3% |
| Australia | 8 | 0.0% |
| Canada | 81 | 0.4% |
| Caribbean | 52 | 0.3% |
| Central America | 278 | 1.5% |
| Chile | 29 | 0.2% |
| China | 50 | 0.3% |
| Costa Rica | 22 | 0.1% |
| Eastern Africa | 12 | 0.1% |
| Eastern Asia | 104 | 0.5% |
| Eastern Europe | 42 | 0.2% |
| England | 7 | 0.0% |
| Europe | 151 | 0.8% |
| France | 19 | 0.1% |
| India | 56 | 0.3% |
| Iran | 8 | 0.0% |
| Ireland | 10 | 0.1% |
| Italy | 18 | 0.1% |
| Jamaica | 52 | 0.3% |
| Japan | 44 | 0.2% |
| Kenya | 12 | 0.1% |
| Korea | 10 | 0.1% |
| Latin America | 371 | 1.9% |
| Lebanon | 12 | 0.1% |
| Lithuania | 16 | 0.1% |
| Mexico | 238 | 1.3% |
| Northern Europe | 64 | 0.3% |
| Oceania | 50 | 0.3% |
| Panama | 18 | 0.1% |
| Peru | 4 | 0.0% |
| Philippines | 10 | 0.1% |
| Poland | 8 | 0.0% |
| Russia | 18 | 0.1% |
| Sierra Leone | 37 | 0.2% |
| South Africa | 19 | 0.1% |
| South America | 41 | 0.2% |
| South Central Asia | 64 | 0.3% |
| South Eastern Asia | 70 | 0.4% |
| Southern Europe | 26 | 0.1% |
| Spain | 8 | 0.0% |
| Taiwan | 11 | 0.1% |
| Thailand | 38 | 0.2% |
| Vietnam | 22 | 0.1% |
| Western Africa | 37 | 0.2% |
| Western Asia | 12 | 0.1% |
| Western Europe | 19 | 0.1% | View All 48 Rows |
Sex and Age in West Chester borough
Sex and Age in West Chester borough
The most populous age groups in West Chester borough are 20 to 24 Years (1,918 | 22.2%) for men and 15 to 19 Years (2,515 | 24.2%) for women.
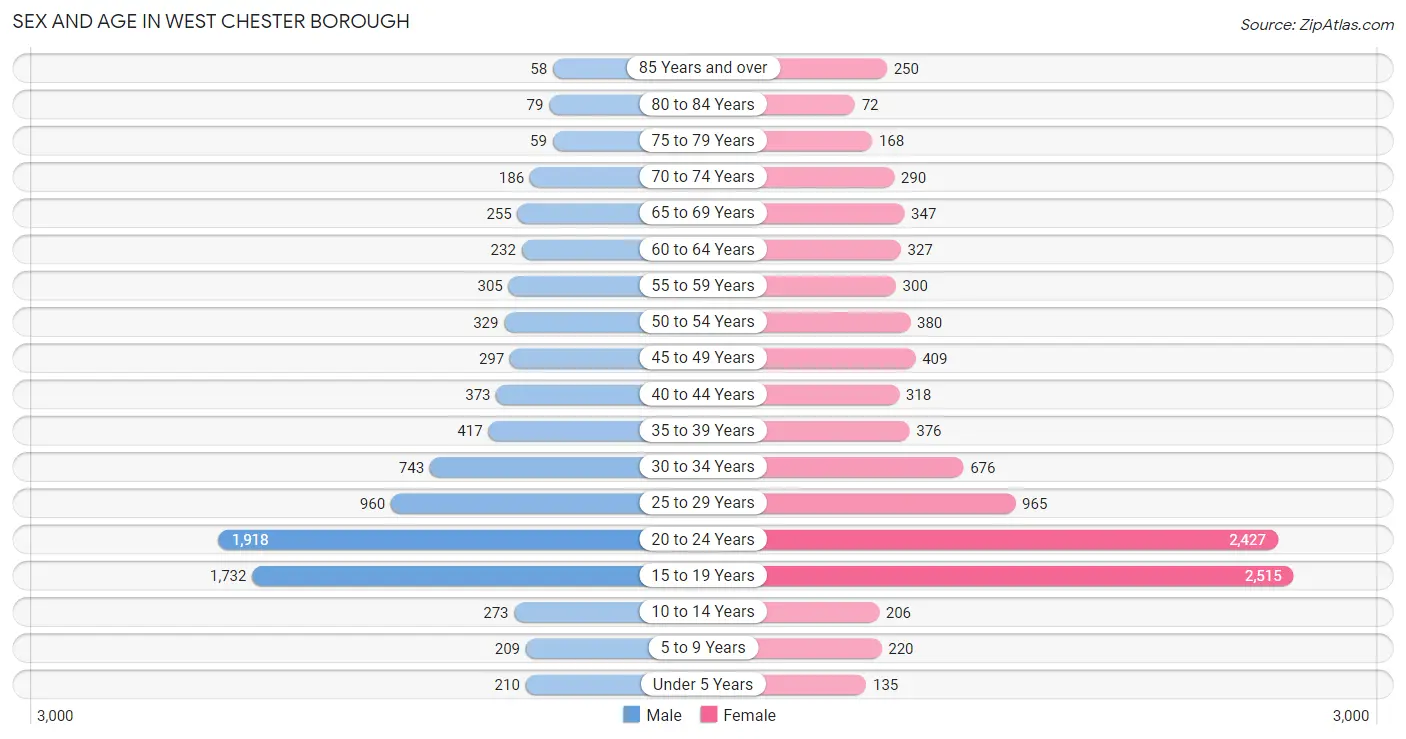
| Age Bracket | Male | Female |
| Under 5 Years | 210 (2.4%) | 135 (1.3%) |
| 5 to 9 Years | 209 (2.4%) | 220 (2.1%) |
| 10 to 14 Years | 273 (3.2%) | 206 (2.0%) |
| 15 to 19 Years | 1,732 (20.1%) | 2,515 (24.2%) |
| 20 to 24 Years | 1,918 (22.2%) | 2,427 (23.4%) |
| 25 to 29 Years | 960 (11.1%) | 965 (9.3%) |
| 30 to 34 Years | 743 (8.6%) | 676 (6.5%) |
| 35 to 39 Years | 417 (4.8%) | 376 (3.6%) |
| 40 to 44 Years | 373 (4.3%) | 318 (3.1%) |
| 45 to 49 Years | 297 (3.4%) | 409 (3.9%) |
| 50 to 54 Years | 329 (3.8%) | 380 (3.7%) |
| 55 to 59 Years | 305 (3.5%) | 300 (2.9%) |
| 60 to 64 Years | 232 (2.7%) | 327 (3.2%) |
| 65 to 69 Years | 255 (2.9%) | 347 (3.3%) |
| 70 to 74 Years | 186 (2.1%) | 290 (2.8%) |
| 75 to 79 Years | 59 (0.7%) | 168 (1.6%) |
| 80 to 84 Years | 79 (0.9%) | 72 (0.7%) |
| 85 Years and over | 58 (0.7%) | 250 (2.4%) |
| Total | 8,635 (100.0%) | 10,381 (100.0%) |
Families and Households in West Chester borough
Median Family Size in West Chester borough
The median family size in West Chester borough is 2.89 persons per family, with single female/mother families (692 | 28.8%) accounting for the largest median family size of 3.3 persons per family. On the other hand, single male/father families (252 | 10.5%) represent the smallest median family size with 2.18 persons per family.
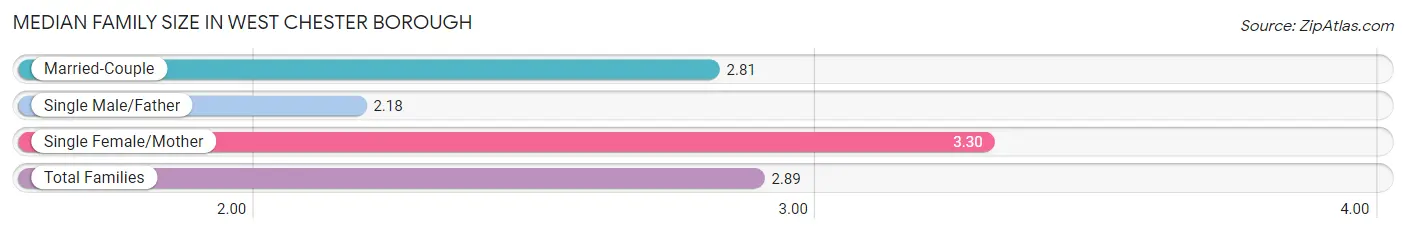
| Family Type | # Families | Family Size |
| Married-Couple | 1,459 (60.7%) | 2.81 |
| Single Male/Father | 252 (10.5%) | 2.18 |
| Single Female/Mother | 692 (28.8%) | 3.30 |
| Total Families | 2,403 (100.0%) | 2.89 |
Median Household Size in West Chester borough
The median household size in West Chester borough is 2.10 persons per household, with single female/mother households (692 | 9.9%) accounting for the largest median household size of 3.36 persons per household. non-family households (4,593 | 65.6%) represent the smallest median household size with 1.65 persons per household.
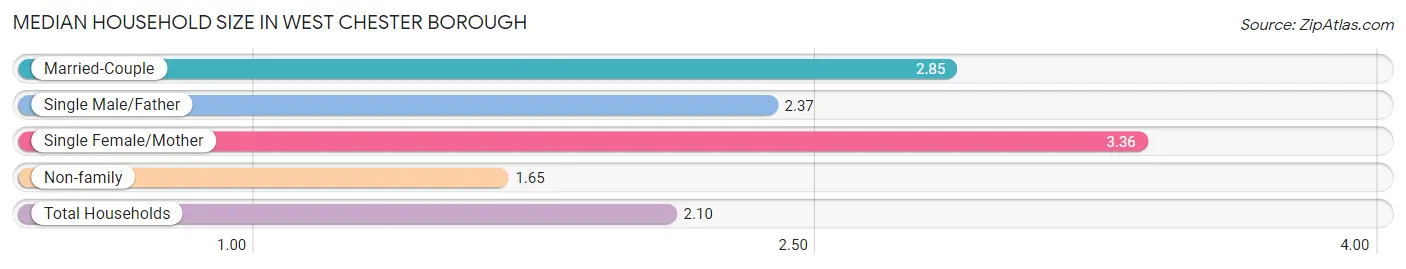
| Household Type | # Households | Household Size |
| Married-Couple | 1,459 (20.8%) | 2.85 |
| Single Male/Father | 252 (3.6%) | 2.37 |
| Single Female/Mother | 692 (9.9%) | 3.36 |
| Non-family | 4,593 (65.6%) | 1.65 |
| Total Households | 6,996 (100.0%) | 2.10 |
Household Size by Marriage Status in West Chester borough
Out of a total of 6,996 households in West Chester borough, 2,403 (34.4%) are family households, while 4,593 (65.6%) are nonfamily households. The most numerous type of family households are 2-person households, comprising 1,160, and the most common type of nonfamily households are 1-person households, comprising 2,916.
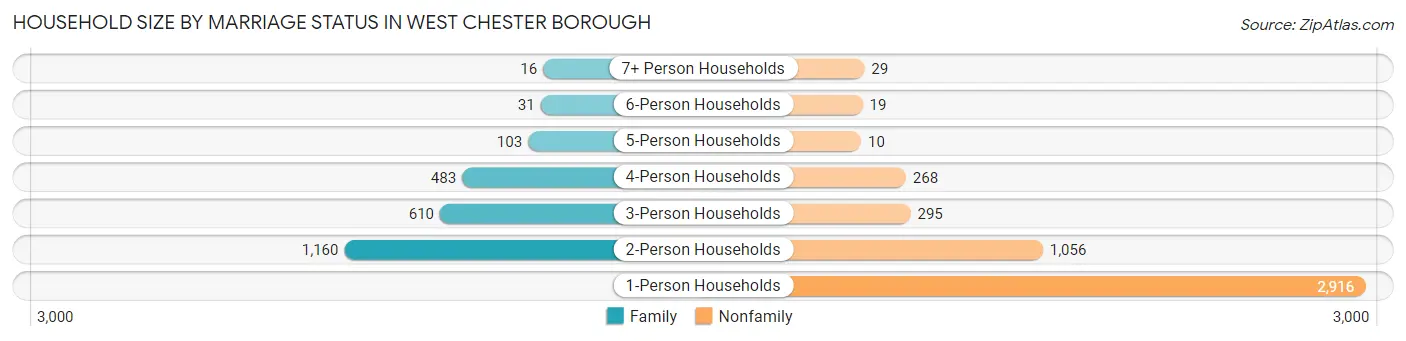
| Household Size | Family Households | Nonfamily Households |
| 1-Person Households | - | 2,916 (41.7%) |
| 2-Person Households | 1,160 (16.6%) | 1,056 (15.1%) |
| 3-Person Households | 610 (8.7%) | 295 (4.2%) |
| 4-Person Households | 483 (6.9%) | 268 (3.8%) |
| 5-Person Households | 103 (1.5%) | 10 (0.1%) |
| 6-Person Households | 31 (0.4%) | 19 (0.3%) |
| 7+ Person Households | 16 (0.2%) | 29 (0.4%) |
| Total | 2,403 (34.4%) | 4,593 (65.6%) |
Female Fertility in West Chester borough
Fertility by Age in West Chester borough
Average fertility rate in West Chester borough is 5.0 births per 1,000 women. Women in the age bracket of 35 to 50 years have the highest fertility rate with 17.0 births per 1,000 women. Women in the age bracket of 20 to 34 years acount for 54.8% of all women with births.
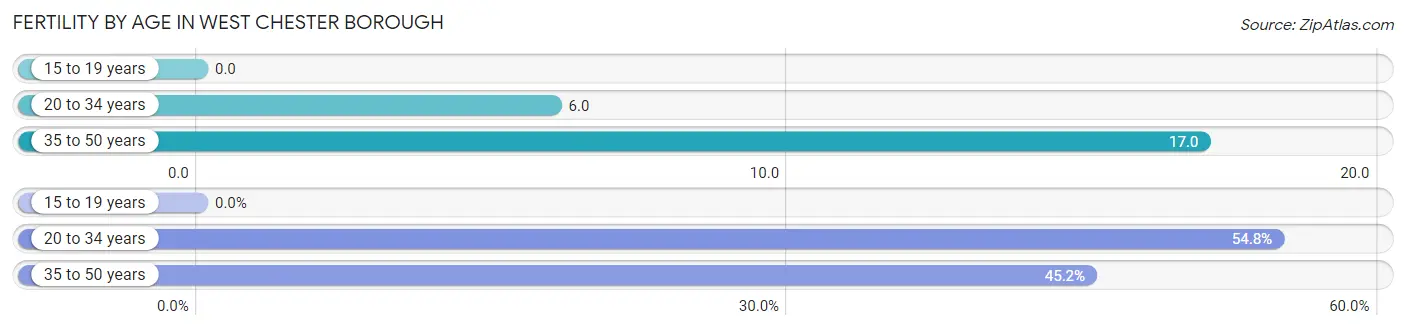
| Age Bracket | Women with Births | Births / 1,000 Women |
| 15 to 19 years | 0 (0.0%) | 0.0 |
| 20 to 34 years | 23 (54.8%) | 6.0 |
| 35 to 50 years | 19 (45.2%) | 17.0 |
| Total | 42 (100.0%) | 5.0 |
Fertility by Age by Marriage Status in West Chester borough
71.4% of women with births (42) in West Chester borough are married. The highest percentage of unmarried women with births falls into 35 to 50 years age bracket with 52.6% of them unmarried at the time of birth, while the lowest percentage of unmarried women with births belong to 20 to 34 years age bracket with 8.7% of them unmarried.
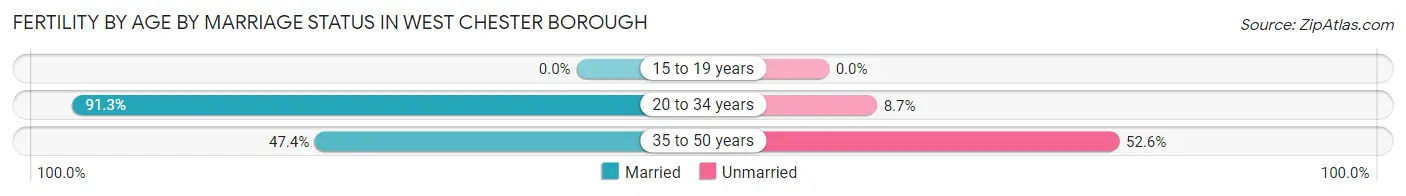
| Age Bracket | Married | Unmarried |
| 15 to 19 years | 0 (0.0%) | 0 (0.0%) |
| 20 to 34 years | 21 (91.3%) | 2 (8.7%) |
| 35 to 50 years | 9 (47.4%) | 10 (52.6%) |
| Total | 30 (71.4%) | 12 (28.6%) |
Fertility by Education in West Chester borough
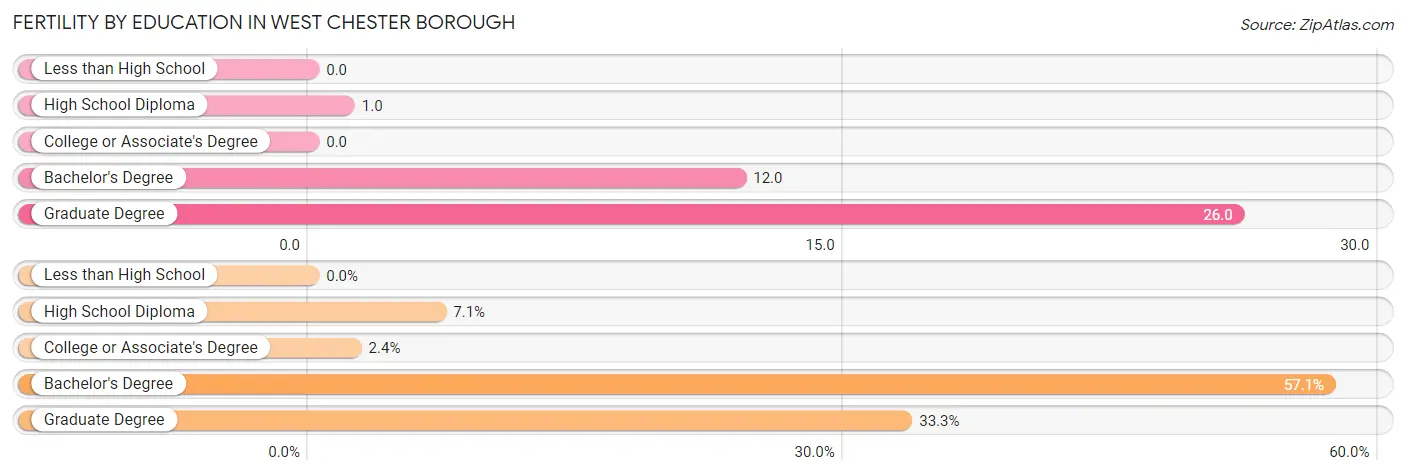
| Educational Attainment | Women with Births | Births / 1,000 Women |
| Less than High School | 0 (0.0%) | 0.0 |
| High School Diploma | 3 (7.1%) | 1.0 |
| College or Associate's Degree | 1 (2.4%) | 0.0 |
| Bachelor's Degree | 24 (57.1%) | 12.0 |
| Graduate Degree | 14 (33.3%) | 26.0 |
| Total | 42 (100.0%) | 5.0 |
Fertility by Education by Marriage Status in West Chester borough
28.6% of women with births in West Chester borough are unmarried. Women with the educational attainment of graduate degree are most likely to be married with 100.0% of them married at childbirth, while women with the educational attainment of high school diploma are least likely to be married with 100.0% of them unmarried at childbirth.
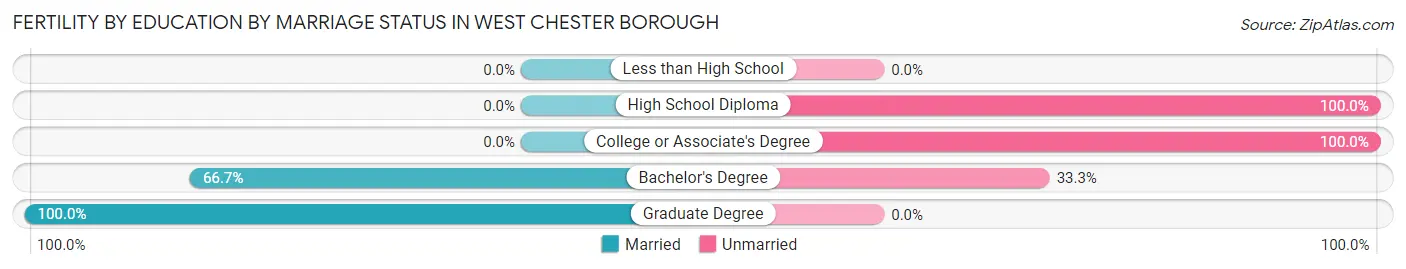
| Educational Attainment | Married | Unmarried |
| Less than High School | 0 (0.0%) | 0 (0.0%) |
| High School Diploma | 0 (0.0%) | 3 (100.0%) |
| College or Associate's Degree | 0 (0.0%) | 1 (100.0%) |
| Bachelor's Degree | 16 (66.7%) | 8 (33.3%) |
| Graduate Degree | 14 (100.0%) | 0 (0.0%) |
| Total | 30 (71.4%) | 12 (28.6%) |
Employment Characteristics in West Chester borough
Employment by Class of Employer in West Chester borough
Among the 10,640 employed individuals in West Chester borough, private company employees (7,843 | 73.7%), not-for-profit organizations (1,011 | 9.5%), and local government employees (593 | 5.6%) make up the most common classes of employment.
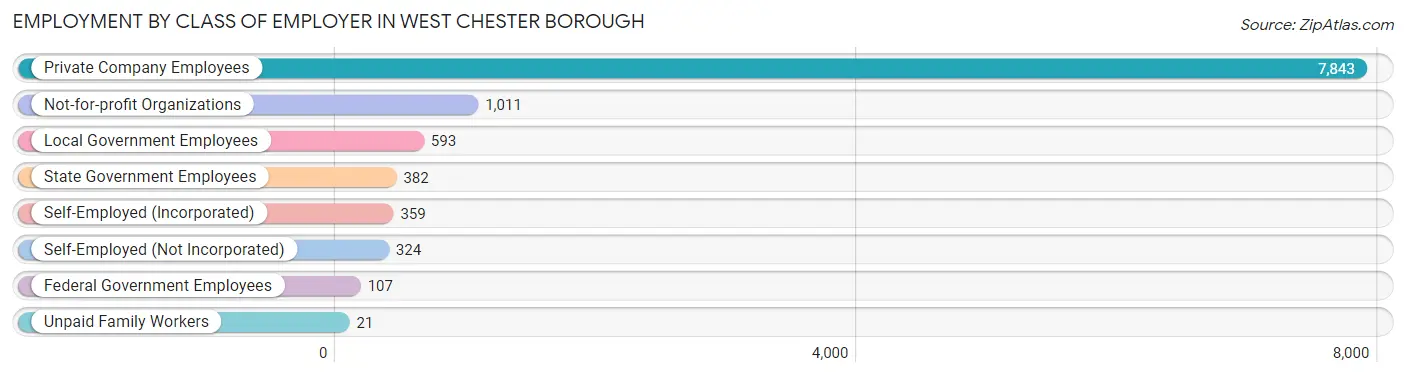
| Employer Class | # Employees | % Employees |
| Private Company Employees | 7,843 | 73.7% |
| Self-Employed (Incorporated) | 359 | 3.4% |
| Self-Employed (Not Incorporated) | 324 | 3.0% |
| Not-for-profit Organizations | 1,011 | 9.5% |
| Local Government Employees | 593 | 5.6% |
| State Government Employees | 382 | 3.6% |
| Federal Government Employees | 107 | 1.0% |
| Unpaid Family Workers | 21 | 0.2% |
| Total | 10,640 | 100.0% |
Employment Status by Age in West Chester borough
According to the labor force statistics for West Chester borough, out of the total population over 16 years of age (17,608), 67.3% or 11,850 individuals are in the labor force, with 7.3% or 865 of them unemployed. The age group with the highest labor force participation rate is 25 to 29 years, with 97.5% or 1,877 individuals in the labor force. Within the labor force, the 16 to 19 years age range has the highest percentage of unemployed individuals, with 15.4% or 281 of them being unemployed.
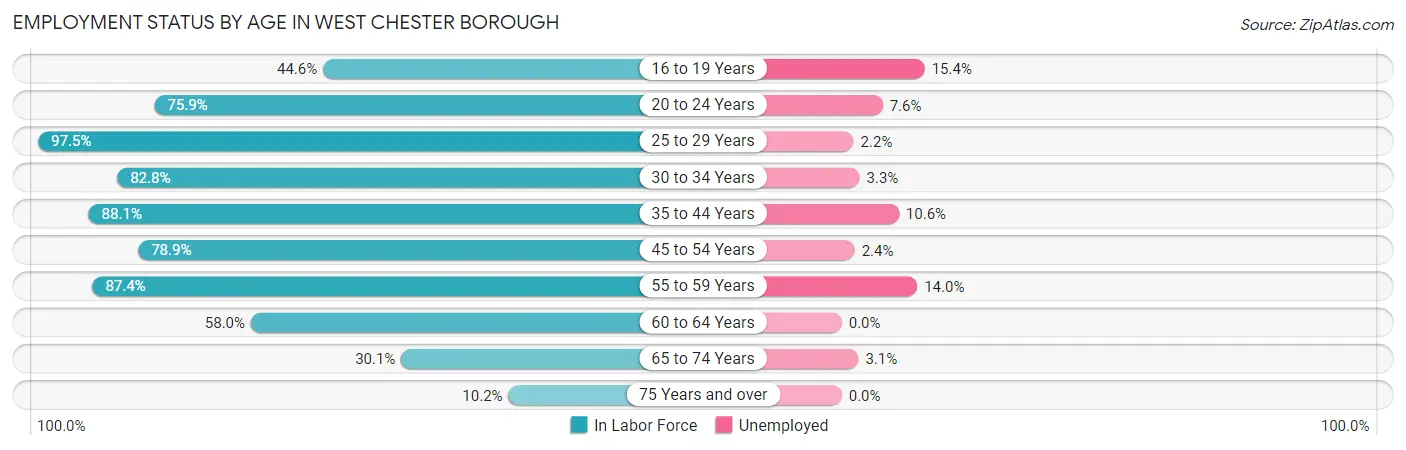
| Age Bracket | In Labor Force | Unemployed |
| 16 to 19 Years | 1,825 (44.6%) | 281 (15.4%) |
| 20 to 24 Years | 3,298 (75.9%) | 251 (7.6%) |
| 25 to 29 Years | 1,877 (97.5%) | 41 (2.2%) |
| 30 to 34 Years | 1,175 (82.8%) | 39 (3.3%) |
| 35 to 44 Years | 1,307 (88.1%) | 139 (10.6%) |
| 45 to 54 Years | 1,116 (78.9%) | 27 (2.4%) |
| 55 to 59 Years | 529 (87.4%) | 74 (14.0%) |
| 60 to 64 Years | 324 (58.0%) | 0 (0.0%) |
| 65 to 74 Years | 324 (30.1%) | 10 (3.1%) |
| 75 Years and over | 70 (10.2%) | 0 (0.0%) |
| Total | 11,850 (67.3%) | 865 (7.3%) |
Employment Status by Educational Attainment in West Chester borough
According to labor force statistics for West Chester borough, 85.4% of individuals (6,326) out of the total population between 25 and 64 years of age (7,407) are in the labor force, with 5.1% or 323 of them being unemployed. The group with the highest labor force participation rate are those with the educational attainment of bachelor's degree or higher, with 94.8% or 4,154 individuals in the labor force. Within the labor force, individuals with college / associate degree education have the highest percentage of unemployment, with 14.2% or 138 of them being unemployed.
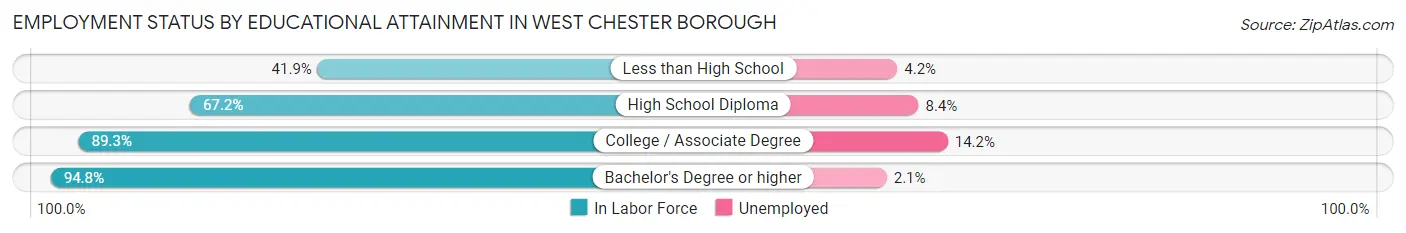
| Educational Attainment | In Labor Force | Unemployed |
| Less than High School | 166 (41.9%) | 17 (4.2%) |
| High School Diploma | 1,035 (67.2%) | 129 (8.4%) |
| College / Associate Degree | 972 (89.3%) | 155 (14.2%) |
| Bachelor's Degree or higher | 4,154 (94.8%) | 92 (2.1%) |
| Total | 6,326 (85.4%) | 378 (5.1%) |
Employment Occupations by Sex in West Chester borough
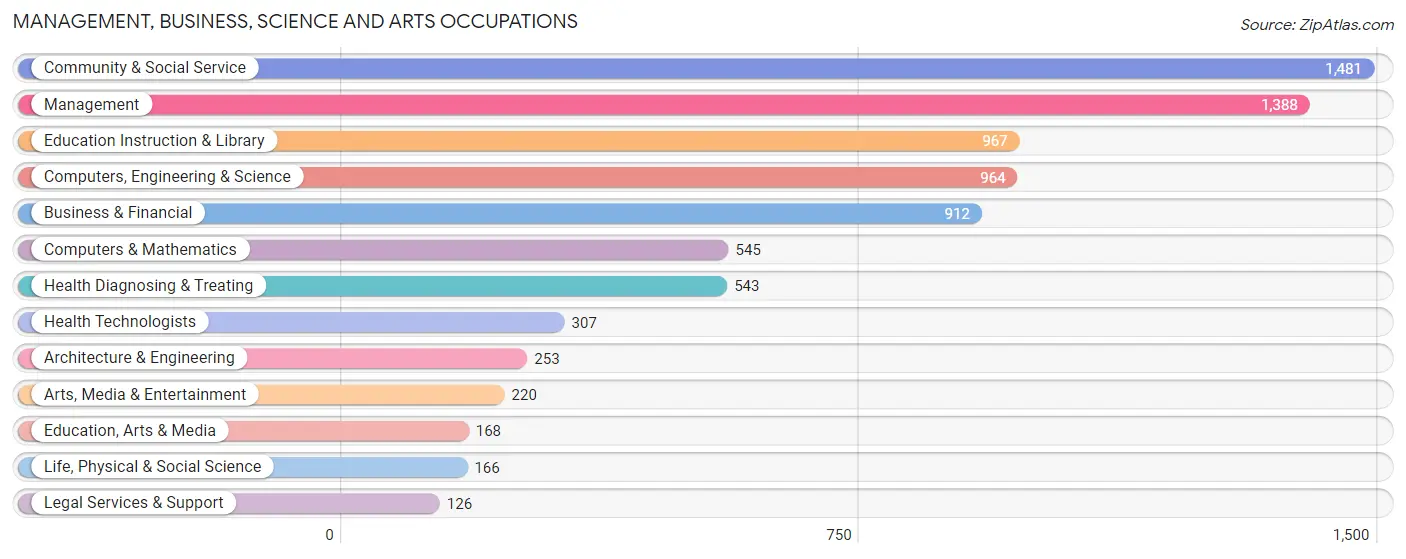
Management, Business, Science and Arts Occupations
The most common Management, Business, Science and Arts occupations in West Chester borough are Community & Social Service (1,481 | 13.5%), Management (1,388 | 12.6%), Education Instruction & Library (967 | 8.8%), Computers, Engineering & Science (964 | 8.8%), and Business & Financial (912 | 8.3%).
Management, Business, Science and Arts Occupations by Sex
Within the Management, Business, Science and Arts occupations in West Chester borough, the most male-oriented occupations are Computers & Mathematics (83.7%), Computers, Engineering & Science (67.8%), and Architecture & Engineering (54.9%), while the most female-oriented occupations are Health Technologists (83.1%), Education, Arts & Media (78.6%), and Health Diagnosing & Treating (74.0%).
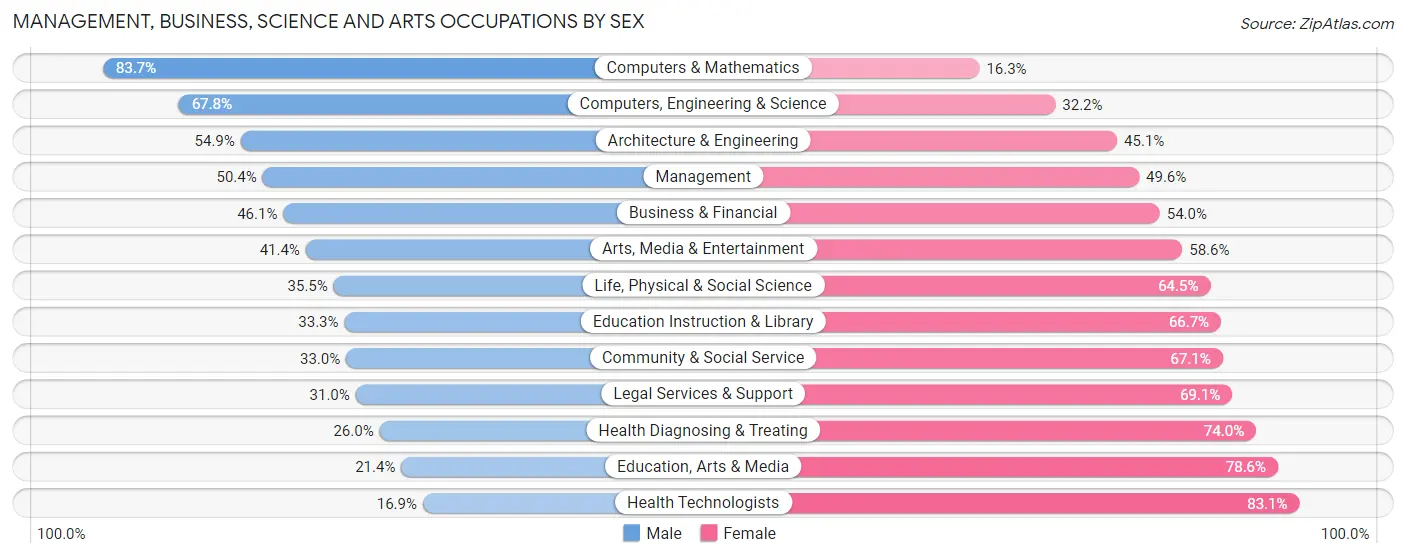
| Occupation | Male | Female |
| Management | 699 (50.4%) | 689 (49.6%) |
| Business & Financial | 420 (46.1%) | 492 (53.9%) |
| Computers, Engineering & Science | 654 (67.8%) | 310 (32.2%) |
| Computers & Mathematics | 456 (83.7%) | 89 (16.3%) |
| Architecture & Engineering | 139 (54.9%) | 114 (45.1%) |
| Life, Physical & Social Science | 59 (35.5%) | 107 (64.5%) |
| Community & Social Service | 488 (33.0%) | 993 (67.0%) |
| Education, Arts & Media | 36 (21.4%) | 132 (78.6%) |
| Legal Services & Support | 39 (30.9%) | 87 (69.1%) |
| Education Instruction & Library | 322 (33.3%) | 645 (66.7%) |
| Arts, Media & Entertainment | 91 (41.4%) | 129 (58.6%) |
| Health Diagnosing & Treating | 141 (26.0%) | 402 (74.0%) |
| Health Technologists | 52 (16.9%) | 255 (83.1%) |
| Total (Category) | 2,402 (45.4%) | 2,886 (54.6%) |
| Total (Overall) | 5,140 (46.8%) | 5,846 (53.2%) |
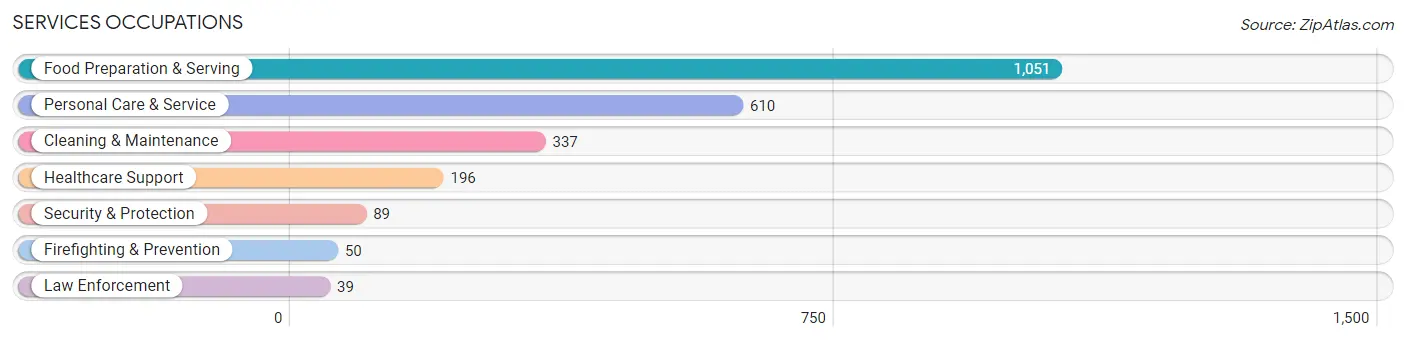
Services Occupations
The most common Services occupations in West Chester borough are Food Preparation & Serving (1,051 | 9.6%), Personal Care & Service (610 | 5.6%), Cleaning & Maintenance (337 | 3.1%), Healthcare Support (196 | 1.8%), and Security & Protection (89 | 0.8%).
Services Occupations by Sex
Within the Services occupations in West Chester borough, the most male-oriented occupations are Law Enforcement (100.0%), Security & Protection (87.6%), and Firefighting & Prevention (78.0%), while the most female-oriented occupations are Healthcare Support (83.2%), Food Preparation & Serving (71.1%), and Personal Care & Service (59.2%).
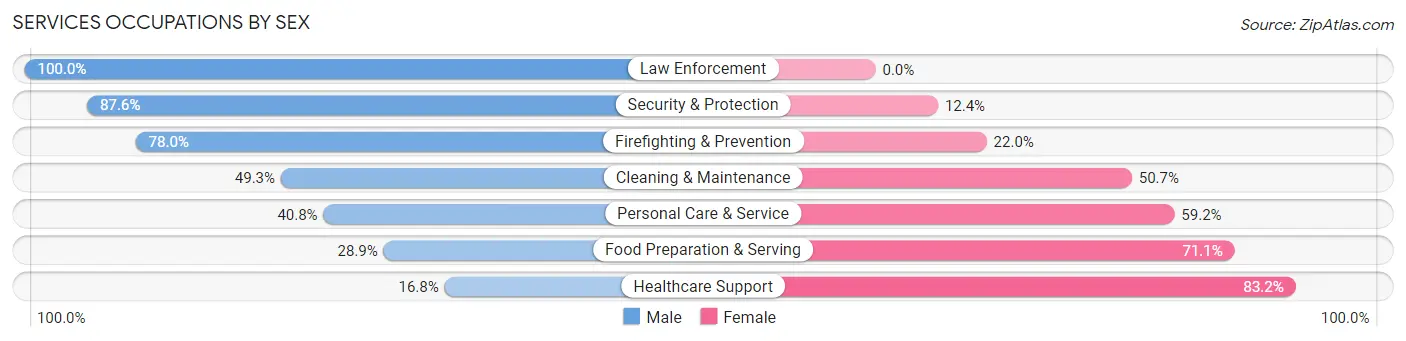
| Occupation | Male | Female |
| Healthcare Support | 33 (16.8%) | 163 (83.2%) |
| Security & Protection | 78 (87.6%) | 11 (12.4%) |
| Firefighting & Prevention | 39 (78.0%) | 11 (22.0%) |
| Law Enforcement | 39 (100.0%) | 0 (0.0%) |
| Food Preparation & Serving | 304 (28.9%) | 747 (71.1%) |
| Cleaning & Maintenance | 166 (49.3%) | 171 (50.7%) |
| Personal Care & Service | 249 (40.8%) | 361 (59.2%) |
| Total (Category) | 830 (36.4%) | 1,453 (63.6%) |
| Total (Overall) | 5,140 (46.8%) | 5,846 (53.2%) |
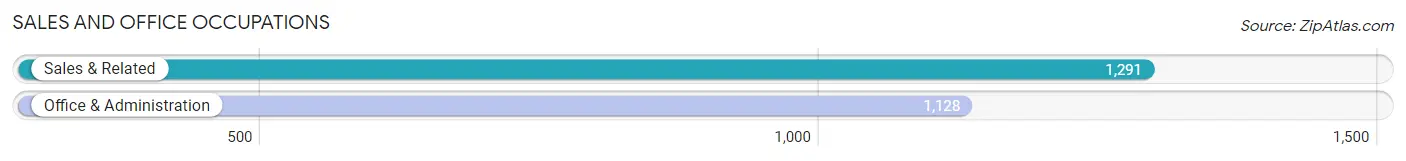
Sales and Office Occupations
The most common Sales and Office occupations in West Chester borough are Sales & Related (1,291 | 11.7%), and Office & Administration (1,128 | 10.3%).
Sales and Office Occupations by Sex
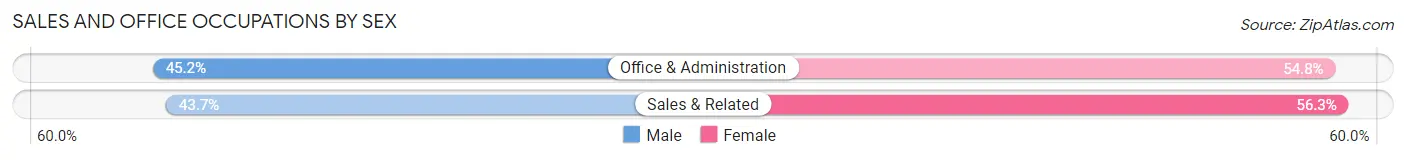
| Occupation | Male | Female |
| Sales & Related | 564 (43.7%) | 727 (56.3%) |
| Office & Administration | 510 (45.2%) | 618 (54.8%) |
| Total (Category) | 1,074 (44.4%) | 1,345 (55.6%) |
| Total (Overall) | 5,140 (46.8%) | 5,846 (53.2%) |
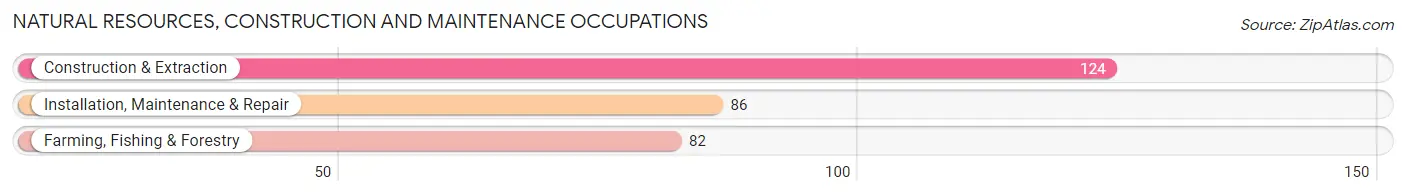
Natural Resources, Construction and Maintenance Occupations
The most common Natural Resources, Construction and Maintenance occupations in West Chester borough are Construction & Extraction (124 | 1.1%), Installation, Maintenance & Repair (86 | 0.8%), and Farming, Fishing & Forestry (82 | 0.7%).
Natural Resources, Construction and Maintenance Occupations by Sex
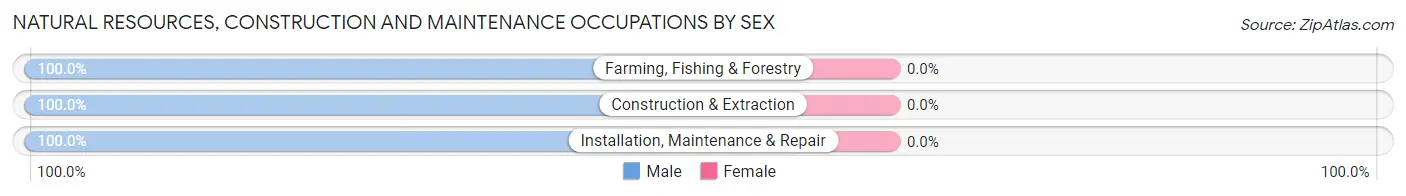
| Occupation | Male | Female |
| Farming, Fishing & Forestry | 82 (100.0%) | 0 (0.0%) |
| Construction & Extraction | 124 (100.0%) | 0 (0.0%) |
| Installation, Maintenance & Repair | 86 (100.0%) | 0 (0.0%) |
| Total (Category) | 292 (100.0%) | 0 (0.0%) |
| Total (Overall) | 5,140 (46.8%) | 5,846 (53.2%) |
Production, Transportation and Moving Occupations
The most common Production, Transportation and Moving occupations in West Chester borough are Material Moving (323 | 2.9%), Transportation (194 | 1.8%), and Production (187 | 1.7%).
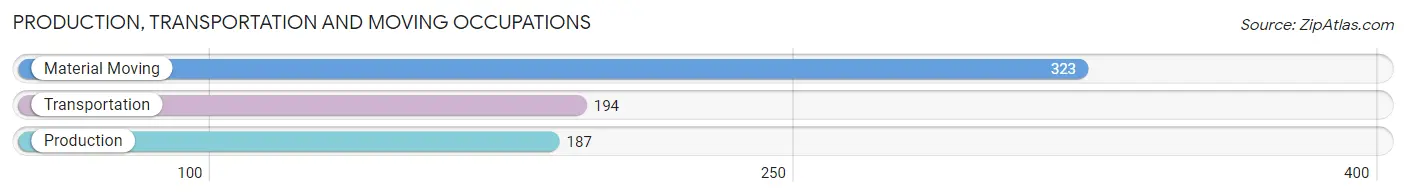
Production, Transportation and Moving Occupations by Sex
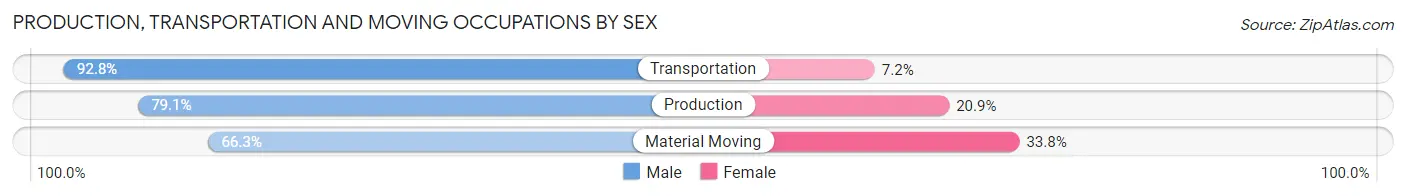
| Occupation | Male | Female |
| Production | 148 (79.1%) | 39 (20.9%) |
| Transportation | 180 (92.8%) | 14 (7.2%) |
| Material Moving | 214 (66.2%) | 109 (33.8%) |
| Total (Category) | 542 (77.0%) | 162 (23.0%) |
| Total (Overall) | 5,140 (46.8%) | 5,846 (53.2%) |
Employment Industries by Sex in West Chester borough
Employment Industries in West Chester borough
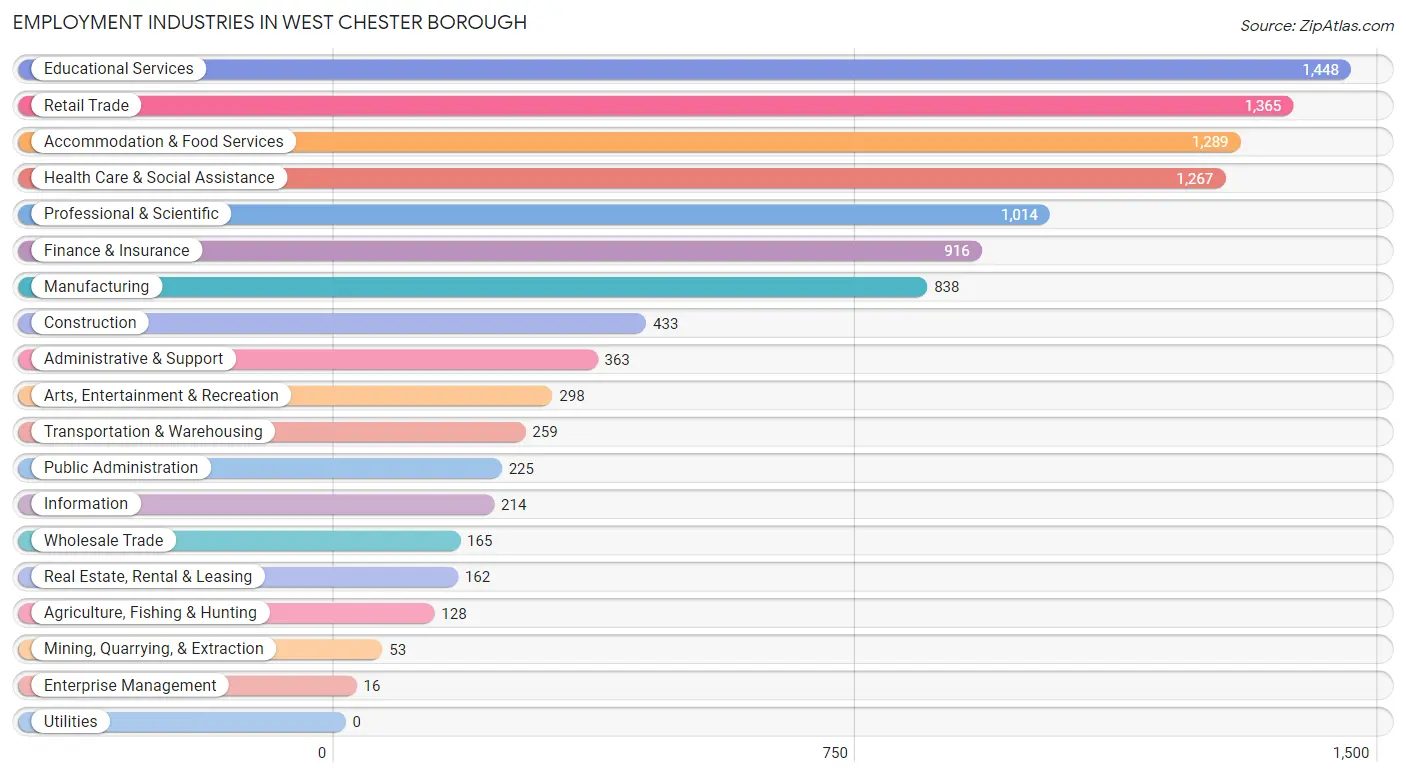
The major employment industries in West Chester borough include Educational Services (1,448 | 13.2%), Retail Trade (1,365 | 12.4%), Accommodation & Food Services (1,289 | 11.7%), Health Care & Social Assistance (1,267 | 11.5%), and Professional & Scientific (1,014 | 9.2%).
Employment Industries by Sex in West Chester borough
The West Chester borough industries that see more men than women are Mining, Quarrying, & Extraction (100.0%), Agriculture, Fishing & Hunting (91.4%), and Finance & Insurance (78.8%), whereas the industries that tend to have a higher number of women are Health Care & Social Assistance (74.4%), Information (70.6%), and Accommodation & Food Services (68.7%).
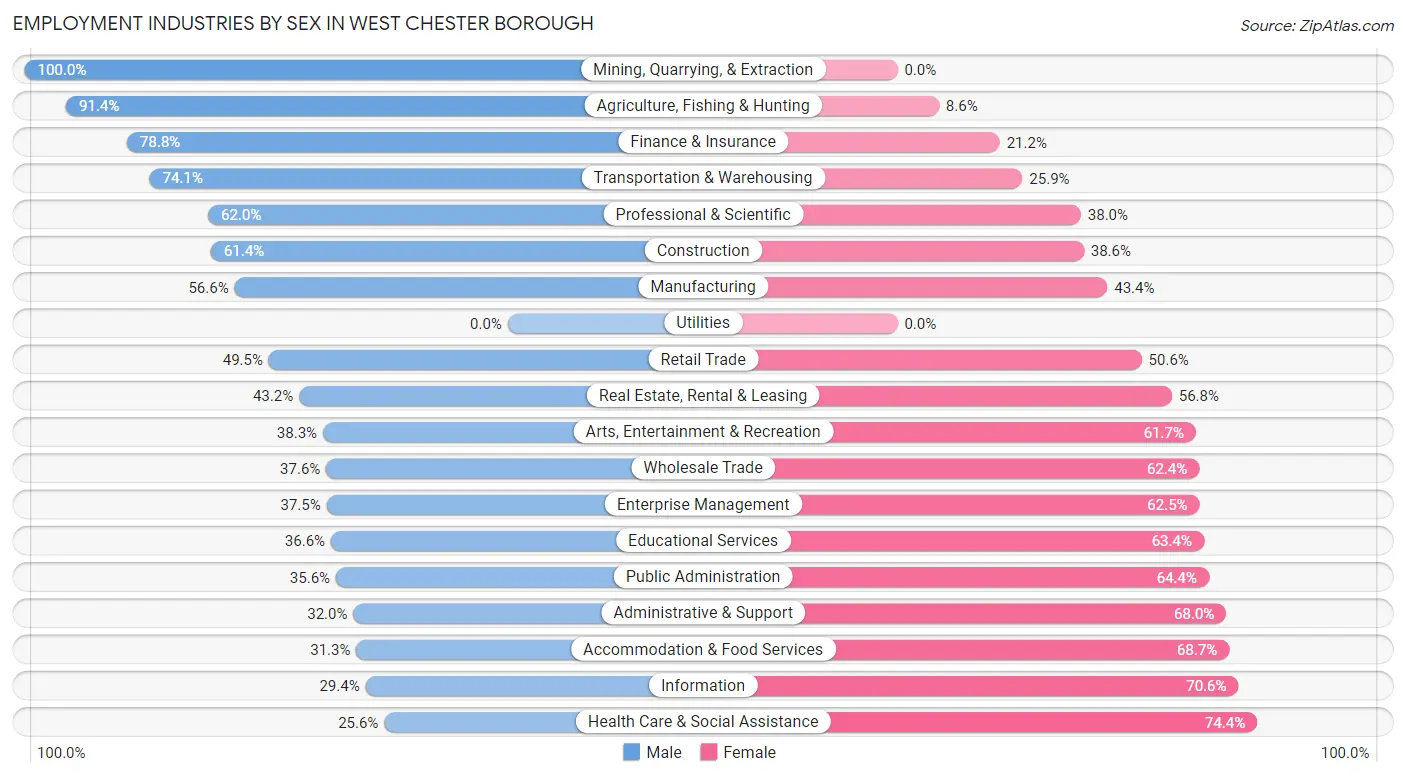
| Industry | Male | Female |
| Agriculture, Fishing & Hunting | 117 (91.4%) | 11 (8.6%) |
| Mining, Quarrying, & Extraction | 53 (100.0%) | 0 (0.0%) |
| Construction | 266 (61.4%) | 167 (38.6%) |
| Manufacturing | 474 (56.6%) | 364 (43.4%) |
| Wholesale Trade | 62 (37.6%) | 103 (62.4%) |
| Retail Trade | 675 (49.4%) | 690 (50.5%) |
| Transportation & Warehousing | 192 (74.1%) | 67 (25.9%) |
| Utilities | 0 (0.0%) | 0 (0.0%) |
| Information | 63 (29.4%) | 151 (70.6%) |
| Finance & Insurance | 722 (78.8%) | 194 (21.2%) |
| Real Estate, Rental & Leasing | 70 (43.2%) | 92 (56.8%) |
| Professional & Scientific | 629 (62.0%) | 385 (38.0%) |
| Enterprise Management | 6 (37.5%) | 10 (62.5%) |
| Administrative & Support | 116 (32.0%) | 247 (68.0%) |
| Educational Services | 530 (36.6%) | 918 (63.4%) |
| Health Care & Social Assistance | 324 (25.6%) | 943 (74.4%) |
| Arts, Entertainment & Recreation | 114 (38.3%) | 184 (61.7%) |
| Accommodation & Food Services | 404 (31.3%) | 885 (68.7%) |
| Public Administration | 80 (35.6%) | 145 (64.4%) |
| Total | 5,140 (46.8%) | 5,846 (53.2%) |
Education in West Chester borough
School Enrollment in West Chester borough
The most common levels of schooling among the 8,215 students in West Chester borough are college / undergraduate (6,138 | 74.7%), high school (540 | 6.6%), and graduate / professional (486 | 5.9%).
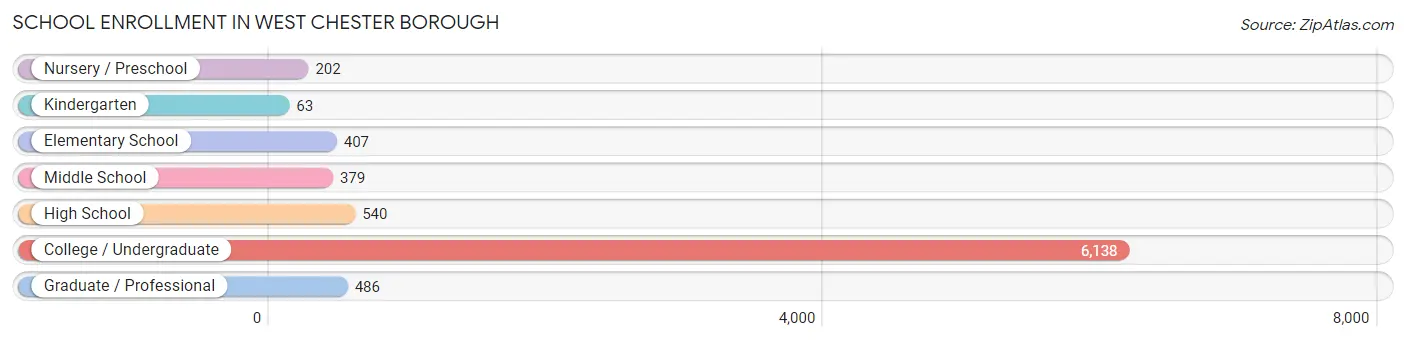
| School Level | # Students | % Students |
| Nursery / Preschool | 202 | 2.5% |
| Kindergarten | 63 | 0.8% |
| Elementary School | 407 | 5.0% |
| Middle School | 379 | 4.6% |
| High School | 540 | 6.6% |
| College / Undergraduate | 6,138 | 74.7% |
| Graduate / Professional | 486 | 5.9% |
| Total | 8,215 | 100.0% |
School Enrollment by Age by Funding Source in West Chester borough
Out of a total of 8,215 students who are enrolled in schools in West Chester borough, 928 (11.3%) attend a private institution, while the remaining 7,287 (88.7%) are enrolled in public schools. The age group of 35 years and over has the highest likelihood of being enrolled in private schools, with 67 (37.4% in the age bracket) enrolled. Conversely, the age group of 18 to 19 year olds has the lowest likelihood of being enrolled in a private school, with 3,559 (95.9% in the age bracket) attending a public institution.
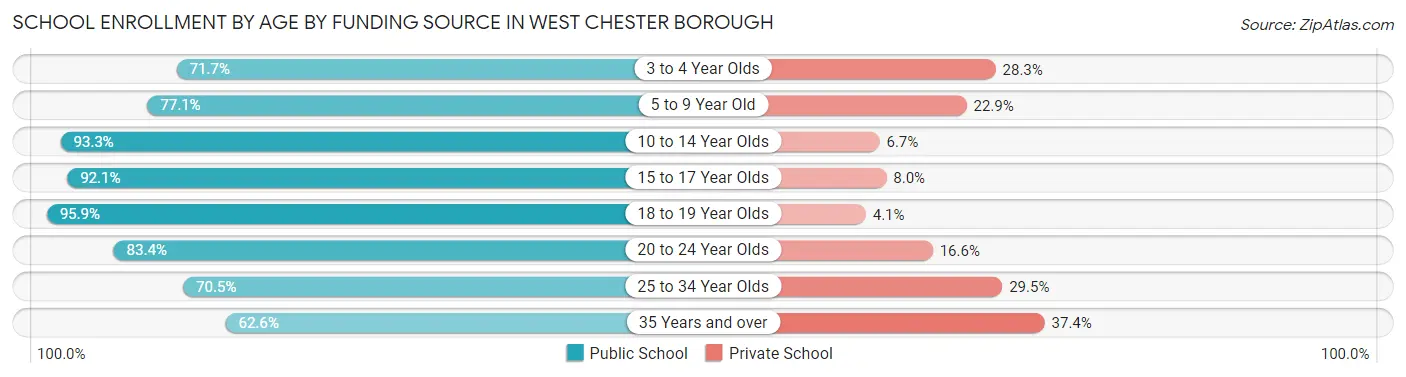
| Age Bracket | Public School | Private School |
| 3 to 4 Year Olds | 114 (71.7%) | 45 (28.3%) |
| 5 to 9 Year Old | 327 (77.1%) | 97 (22.9%) |
| 10 to 14 Year Olds | 447 (93.3%) | 32 (6.7%) |
| 15 to 17 Year Olds | 405 (92.0%) | 35 (8.0%) |
| 18 to 19 Year Olds | 3,559 (95.9%) | 153 (4.1%) |
| 20 to 24 Year Olds | 2,142 (83.4%) | 426 (16.6%) |
| 25 to 34 Year Olds | 179 (70.5%) | 75 (29.5%) |
| 35 Years and over | 112 (62.6%) | 67 (37.4%) |
| Total | 7,287 (88.7%) | 928 (11.3%) |
Educational Attainment by Field of Study in West Chester borough
Business (1,072 | 19.0%), education (700 | 12.4%), social sciences (580 | 10.3%), science & technology (450 | 8.0%), and engineering (401 | 7.1%) are the most common fields of study among 5,638 individuals in West Chester borough who have obtained a bachelor's degree or higher.
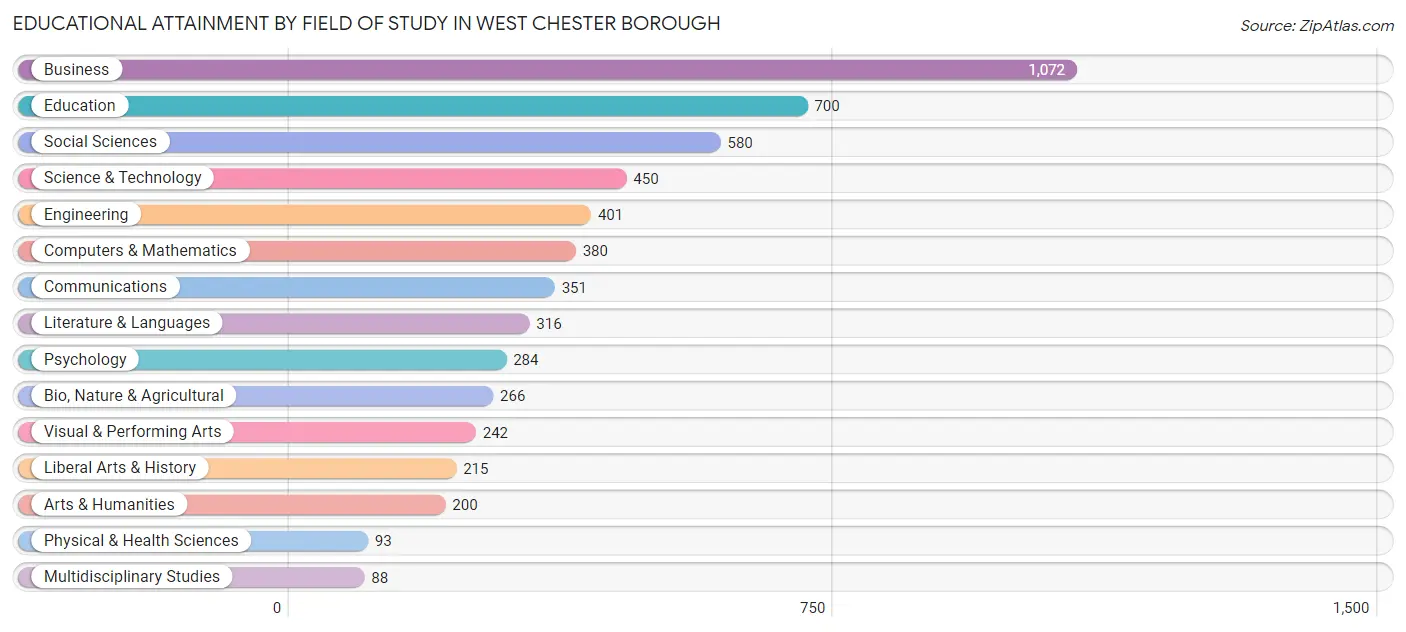
| Field of Study | # Graduates | % Graduates |
| Computers & Mathematics | 380 | 6.7% |
| Bio, Nature & Agricultural | 266 | 4.7% |
| Physical & Health Sciences | 93 | 1.7% |
| Psychology | 284 | 5.0% |
| Social Sciences | 580 | 10.3% |
| Engineering | 401 | 7.1% |
| Multidisciplinary Studies | 88 | 1.6% |
| Science & Technology | 450 | 8.0% |
| Business | 1,072 | 19.0% |
| Education | 700 | 12.4% |
| Literature & Languages | 316 | 5.6% |
| Liberal Arts & History | 215 | 3.8% |
| Visual & Performing Arts | 242 | 4.3% |
| Communications | 351 | 6.2% |
| Arts & Humanities | 200 | 3.5% |
| Total | 5,638 | 100.0% |
Transportation & Commute in West Chester borough
Vehicle Availability by Sex in West Chester borough
The most prevalent vehicle ownership categories in West Chester borough are males with 2 vehicles (1,854, accounting for 42.2%) and females with 2 vehicles (1,949, making up 40.1%).
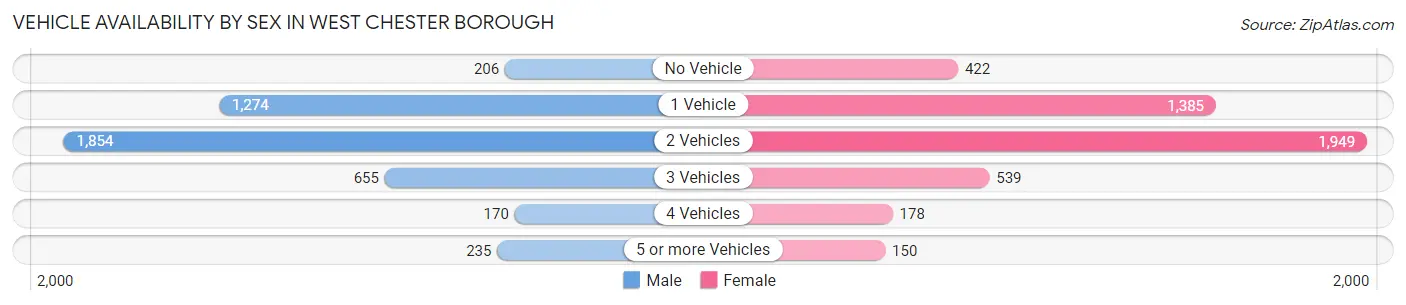
| Vehicles Available | Male | Female |
| No Vehicle | 206 (4.7%) | 422 (9.1%) |
| 1 Vehicle | 1,274 (29.0%) | 1,385 (30.0%) |
| 2 Vehicles | 1,854 (42.2%) | 1,949 (42.2%) |
| 3 Vehicles | 655 (14.9%) | 539 (11.7%) |
| 4 Vehicles | 170 (3.9%) | 178 (3.8%) |
| 5 or more Vehicles | 235 (5.3%) | 150 (3.2%) |
| Total | 4,394 (100.0%) | 4,623 (100.0%) |
Commute Time in West Chester borough
The most frequently occuring commute durations in West Chester borough are 15 to 19 minutes (1,775 commuters, 18.8%), 10 to 14 minutes (1,682 commuters, 17.8%), and 20 to 24 minutes (1,287 commuters, 13.6%).
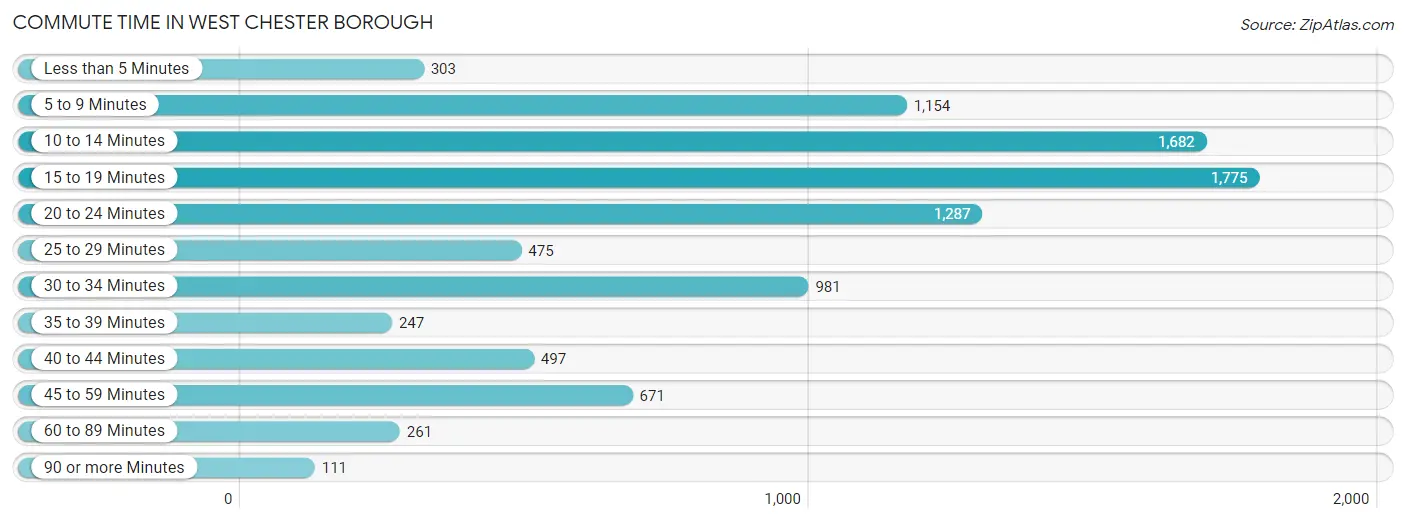
| Commute Time | # Commuters | % Commuters |
| Less than 5 Minutes | 303 | 3.2% |
| 5 to 9 Minutes | 1,154 | 12.2% |
| 10 to 14 Minutes | 1,682 | 17.8% |
| 15 to 19 Minutes | 1,775 | 18.8% |
| 20 to 24 Minutes | 1,287 | 13.6% |
| 25 to 29 Minutes | 475 | 5.0% |
| 30 to 34 Minutes | 981 | 10.4% |
| 35 to 39 Minutes | 247 | 2.6% |
| 40 to 44 Minutes | 497 | 5.3% |
| 45 to 59 Minutes | 671 | 7.1% |
| 60 to 89 Minutes | 261 | 2.8% |
| 90 or more Minutes | 111 | 1.2% |
Commute Time by Sex in West Chester borough
The most common commute times in West Chester borough are 15 to 19 minutes (981 commuters, 22.1%) for males and 10 to 14 minutes (1,021 commuters, 20.4%) for females.
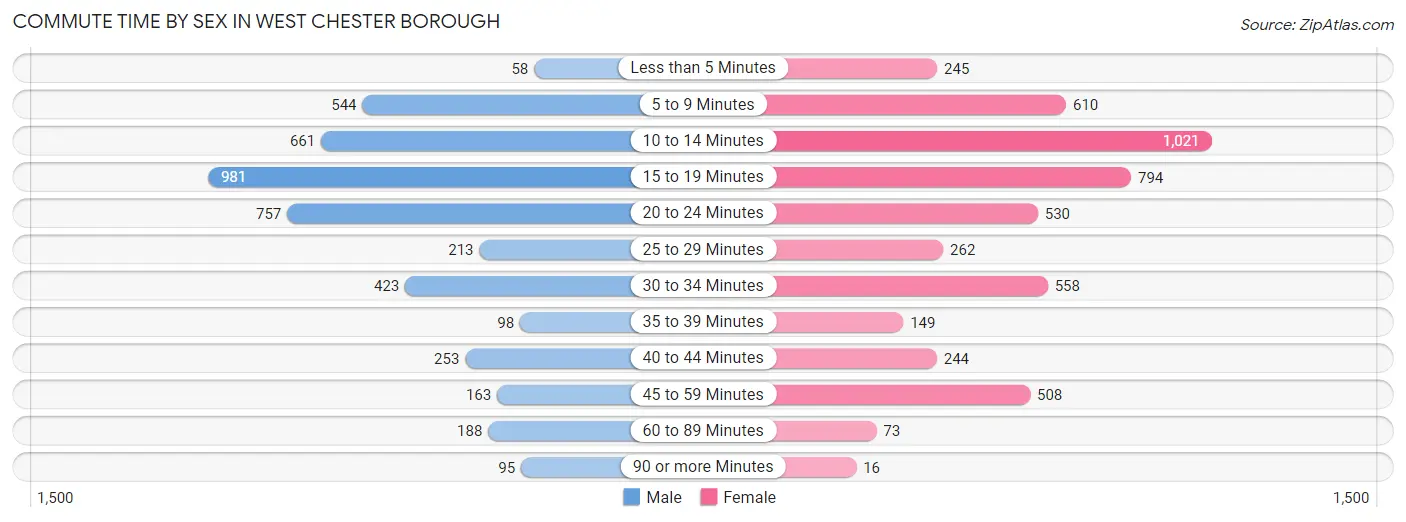
| Commute Time | Male | Female |
| Less than 5 Minutes | 58 (1.3%) | 245 (4.9%) |
| 5 to 9 Minutes | 544 (12.3%) | 610 (12.2%) |
| 10 to 14 Minutes | 661 (14.9%) | 1,021 (20.4%) |
| 15 to 19 Minutes | 981 (22.1%) | 794 (15.9%) |
| 20 to 24 Minutes | 757 (17.1%) | 530 (10.6%) |
| 25 to 29 Minutes | 213 (4.8%) | 262 (5.2%) |
| 30 to 34 Minutes | 423 (9.5%) | 558 (11.1%) |
| 35 to 39 Minutes | 98 (2.2%) | 149 (3.0%) |
| 40 to 44 Minutes | 253 (5.7%) | 244 (4.9%) |
| 45 to 59 Minutes | 163 (3.7%) | 508 (10.1%) |
| 60 to 89 Minutes | 188 (4.2%) | 73 (1.5%) |
| 90 or more Minutes | 95 (2.1%) | 16 (0.3%) |
Time of Departure to Work by Sex in West Chester borough
The most frequent times of departure to work in West Chester borough are 7:00 AM to 7:29 AM (589, 13.3%) for males and 12:00 PM to 3:59 PM (764, 15.2%) for females.
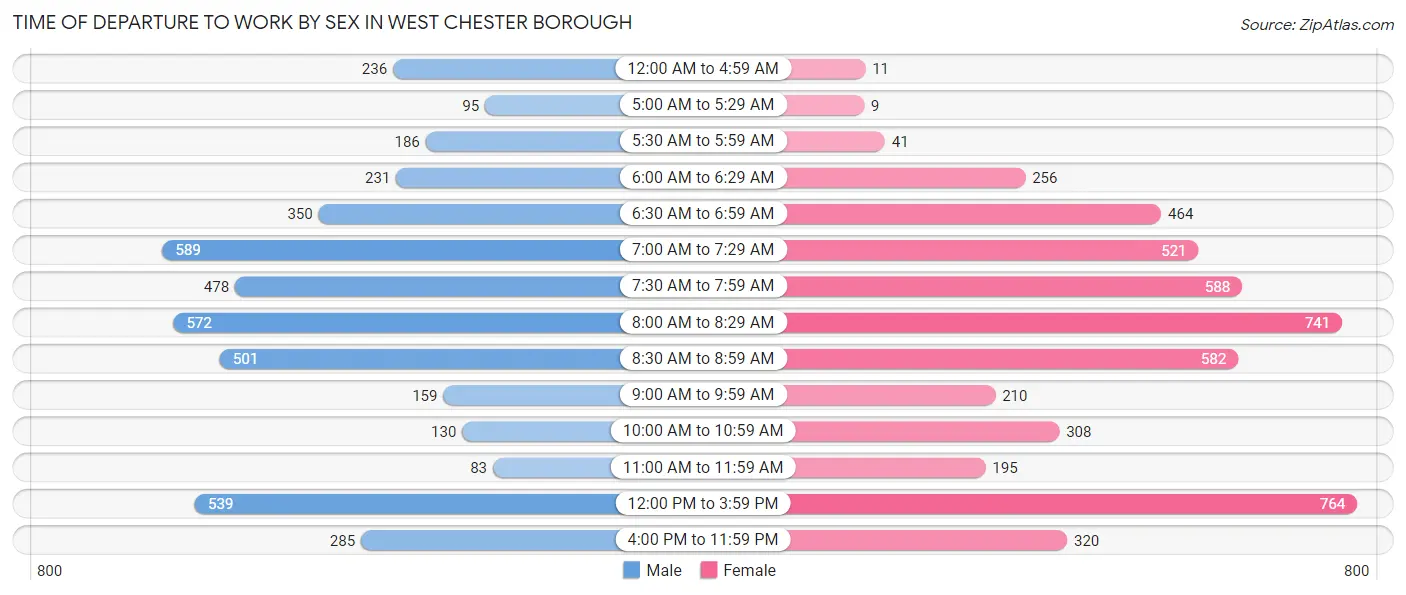
| Time of Departure | Male | Female |
| 12:00 AM to 4:59 AM | 236 (5.3%) | 11 (0.2%) |
| 5:00 AM to 5:29 AM | 95 (2.1%) | 9 (0.2%) |
| 5:30 AM to 5:59 AM | 186 (4.2%) | 41 (0.8%) |
| 6:00 AM to 6:29 AM | 231 (5.2%) | 256 (5.1%) |
| 6:30 AM to 6:59 AM | 350 (7.9%) | 464 (9.3%) |
| 7:00 AM to 7:29 AM | 589 (13.3%) | 521 (10.4%) |
| 7:30 AM to 7:59 AM | 478 (10.8%) | 588 (11.7%) |
| 8:00 AM to 8:29 AM | 572 (12.9%) | 741 (14.8%) |
| 8:30 AM to 8:59 AM | 501 (11.3%) | 582 (11.6%) |
| 9:00 AM to 9:59 AM | 159 (3.6%) | 210 (4.2%) |
| 10:00 AM to 10:59 AM | 130 (2.9%) | 308 (6.1%) |
| 11:00 AM to 11:59 AM | 83 (1.9%) | 195 (3.9%) |
| 12:00 PM to 3:59 PM | 539 (12.2%) | 764 (15.2%) |
| 4:00 PM to 11:59 PM | 285 (6.4%) | 320 (6.4%) |
| Total | 4,434 (100.0%) | 5,010 (100.0%) |
Housing Occupancy in West Chester borough
Occupancy by Ownership in West Chester borough
Of the total 6,996 dwellings in West Chester borough, owner-occupied units account for 2,302 (32.9%), while renter-occupied units make up 4,694 (67.1%).
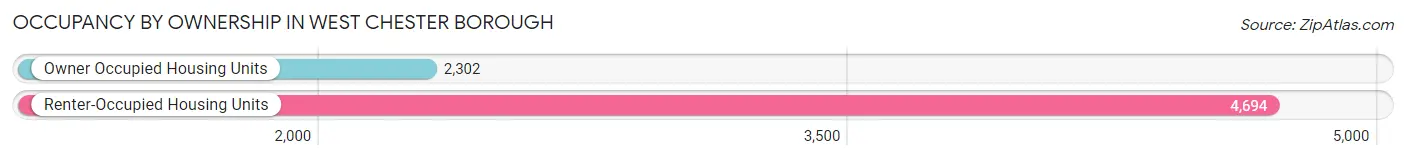
| Occupancy | # Housing Units | % Housing Units |
| Owner Occupied Housing Units | 2,302 | 32.9% |
| Renter-Occupied Housing Units | 4,694 | 67.1% |
| Total Occupied Housing Units | 6,996 | 100.0% |
Occupancy by Household Size in West Chester borough
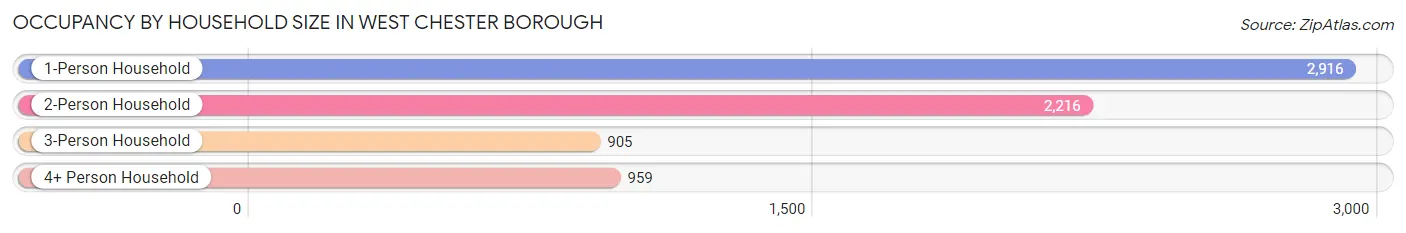
| Household Size | # Housing Units | % Housing Units |
| 1-Person Household | 2,916 | 41.7% |
| 2-Person Household | 2,216 | 31.7% |
| 3-Person Household | 905 | 12.9% |
| 4+ Person Household | 959 | 13.7% |
| Total Housing Units | 6,996 | 100.0% |
Occupancy by Ownership by Household Size in West Chester borough
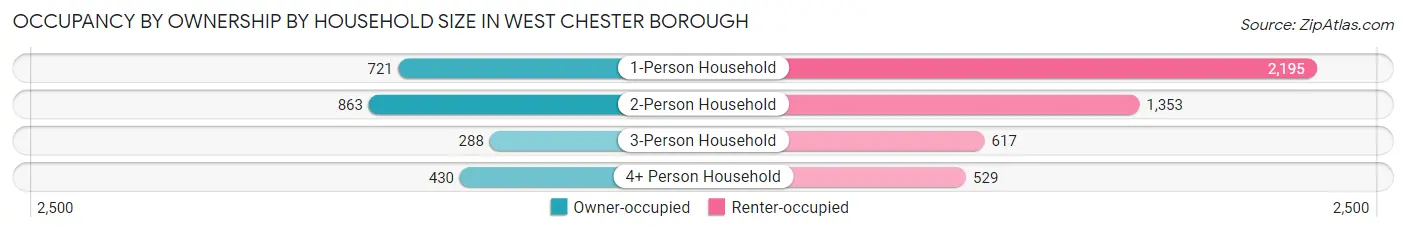
| Household Size | Owner-occupied | Renter-occupied |
| 1-Person Household | 721 (24.7%) | 2,195 (75.3%) |
| 2-Person Household | 863 (38.9%) | 1,353 (61.1%) |
| 3-Person Household | 288 (31.8%) | 617 (68.2%) |
| 4+ Person Household | 430 (44.8%) | 529 (55.2%) |
| Total Housing Units | 2,302 (32.9%) | 4,694 (67.1%) |
Occupancy by Educational Attainment in West Chester borough
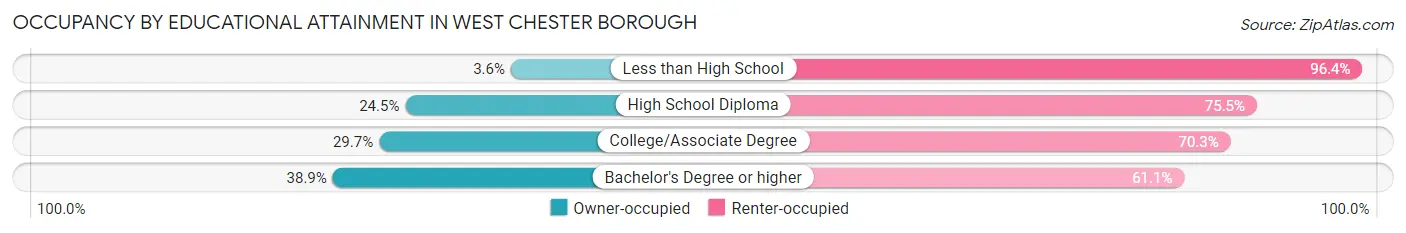
| Household Size | Owner-occupied | Renter-occupied |
| Less than High School | 10 (3.6%) | 267 (96.4%) |
| High School Diploma | 326 (24.5%) | 1,003 (75.5%) |
| College/Associate Degree | 428 (29.7%) | 1,011 (70.3%) |
| Bachelor's Degree or higher | 1,538 (38.9%) | 2,413 (61.1%) |
Occupancy by Age of Householder in West Chester borough
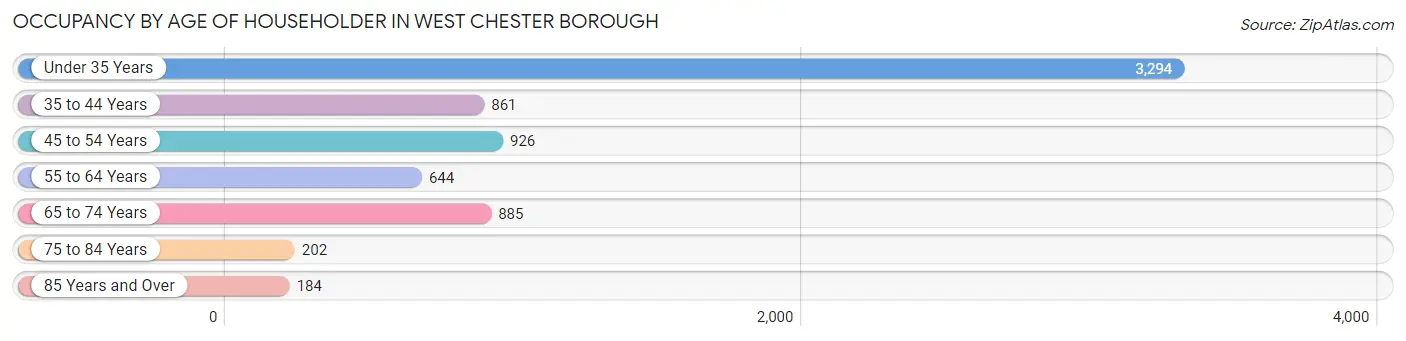
| Age Bracket | # Households | % Households |
| Under 35 Years | 3,294 | 47.1% |
| 35 to 44 Years | 861 | 12.3% |
| 45 to 54 Years | 926 | 13.2% |
| 55 to 64 Years | 644 | 9.2% |
| 65 to 74 Years | 885 | 12.7% |
| 75 to 84 Years | 202 | 2.9% |
| 85 Years and Over | 184 | 2.6% |
| Total | 6,996 | 100.0% |
Housing Finances in West Chester borough
Median Income by Occupancy in West Chester borough
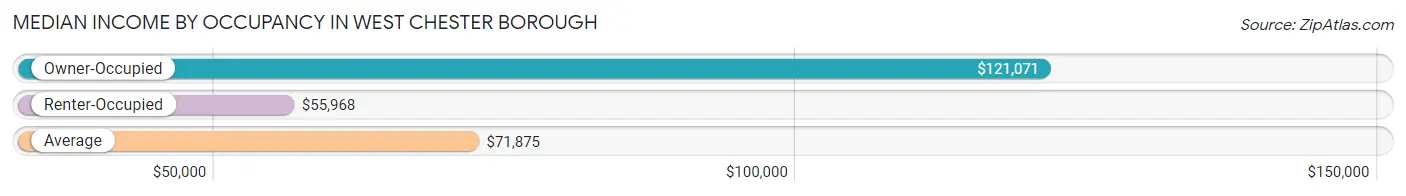
| Occupancy Type | # Households | Median Income |
| Owner-Occupied | 2,302 (32.9%) | $121,071 |
| Renter-Occupied | 4,694 (67.1%) | $55,968 |
| Average | 6,996 (100.0%) | $71,875 |
Occupancy by Householder Income Bracket in West Chester borough
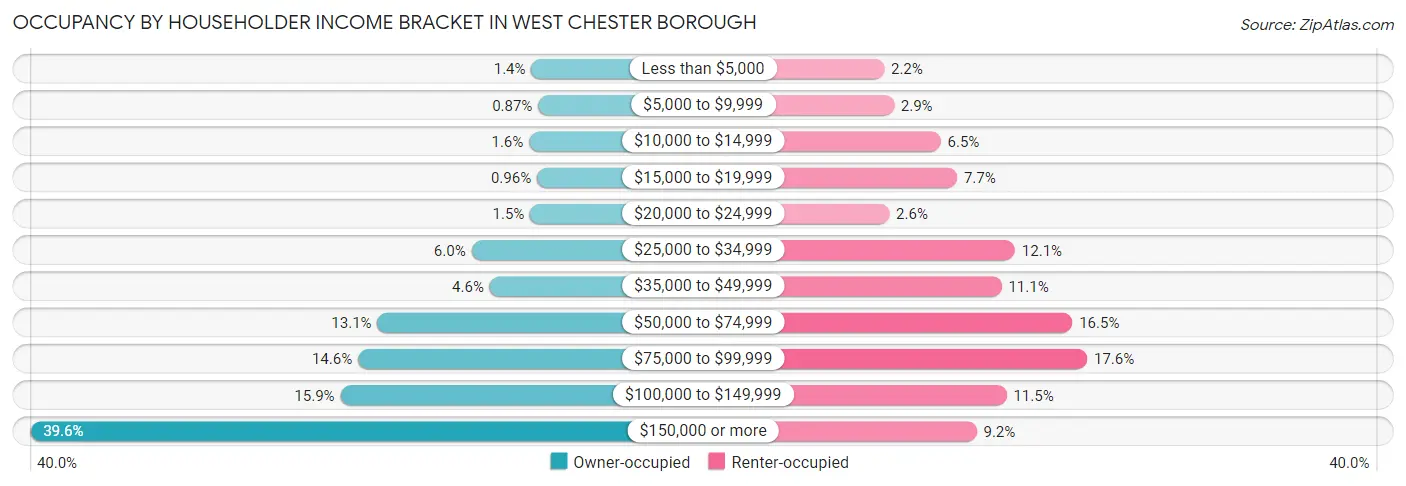
| Income Bracket | Owner-occupied | Renter-occupied |
| Less than $5,000 | 32 (1.4%) | 102 (2.2%) |
| $5,000 to $9,999 | 20 (0.9%) | 137 (2.9%) |
| $10,000 to $14,999 | 36 (1.6%) | 304 (6.5%) |
| $15,000 to $19,999 | 22 (1.0%) | 363 (7.7%) |
| $20,000 to $24,999 | 34 (1.5%) | 120 (2.6%) |
| $25,000 to $34,999 | 137 (5.9%) | 570 (12.1%) |
| $35,000 to $49,999 | 105 (4.6%) | 522 (11.1%) |
| $50,000 to $74,999 | 302 (13.1%) | 775 (16.5%) |
| $75,000 to $99,999 | 336 (14.6%) | 828 (17.6%) |
| $100,000 to $149,999 | 367 (15.9%) | 540 (11.5%) |
| $150,000 or more | 911 (39.6%) | 433 (9.2%) |
| Total | 2,302 (100.0%) | 4,694 (100.0%) |
Monthly Housing Cost Tiers in West Chester borough
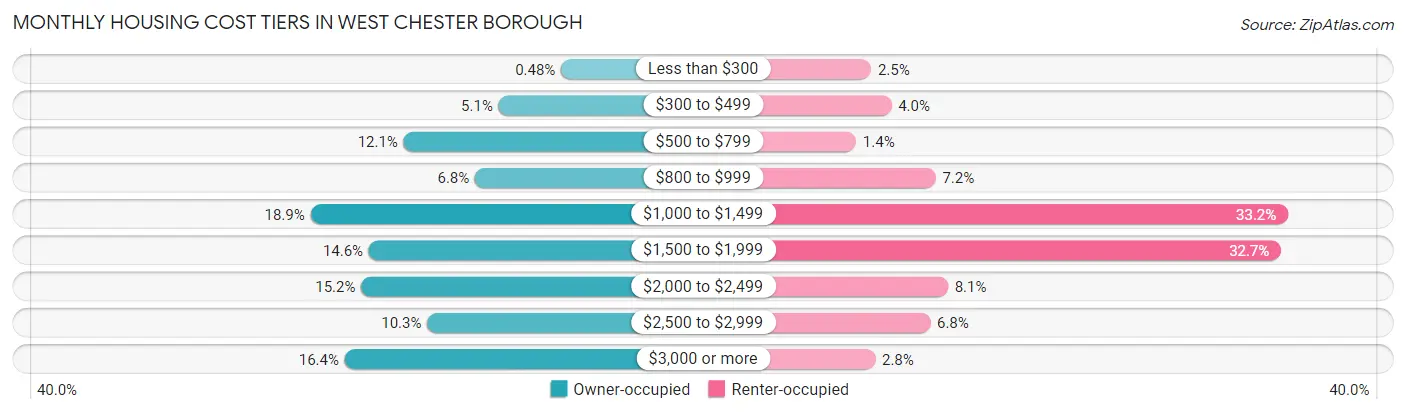
| Monthly Cost | Owner-occupied | Renter-occupied |
| Less than $300 | 11 (0.5%) | 116 (2.5%) |
| $300 to $499 | 117 (5.1%) | 186 (4.0%) |
| $500 to $799 | 278 (12.1%) | 64 (1.4%) |
| $800 to $999 | 157 (6.8%) | 339 (7.2%) |
| $1,000 to $1,499 | 436 (18.9%) | 1,558 (33.2%) |
| $1,500 to $1,999 | 337 (14.6%) | 1,534 (32.7%) |
| $2,000 to $2,499 | 350 (15.2%) | 381 (8.1%) |
| $2,500 to $2,999 | 238 (10.3%) | 320 (6.8%) |
| $3,000 or more | 378 (16.4%) | 130 (2.8%) |
| Total | 2,302 (100.0%) | 4,694 (100.0%) |
Physical Housing Characteristics in West Chester borough
Housing Structures in West Chester borough
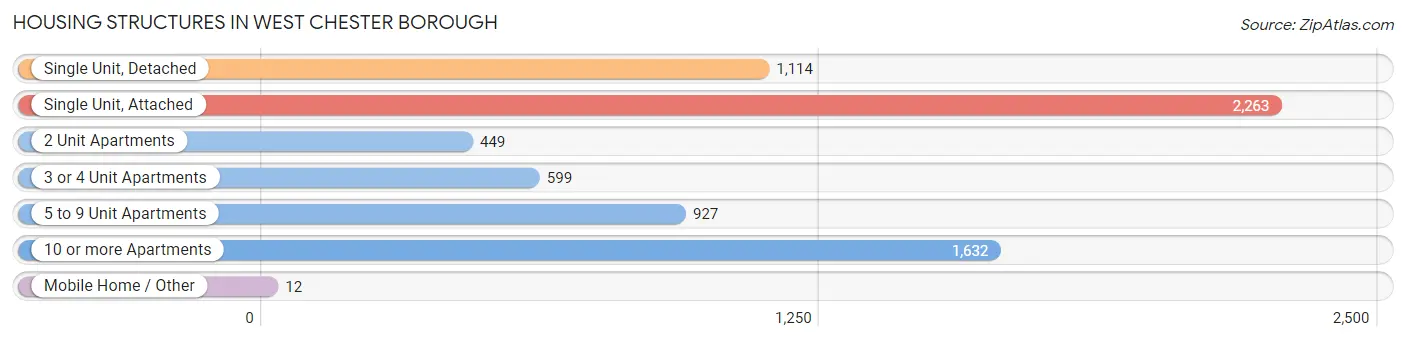
| Structure Type | # Housing Units | % Housing Units |
| Single Unit, Detached | 1,114 | 15.9% |
| Single Unit, Attached | 2,263 | 32.4% |
| 2 Unit Apartments | 449 | 6.4% |
| 3 or 4 Unit Apartments | 599 | 8.6% |
| 5 to 9 Unit Apartments | 927 | 13.3% |
| 10 or more Apartments | 1,632 | 23.3% |
| Mobile Home / Other | 12 | 0.2% |
| Total | 6,996 | 100.0% |
Housing Structures by Occupancy in West Chester borough
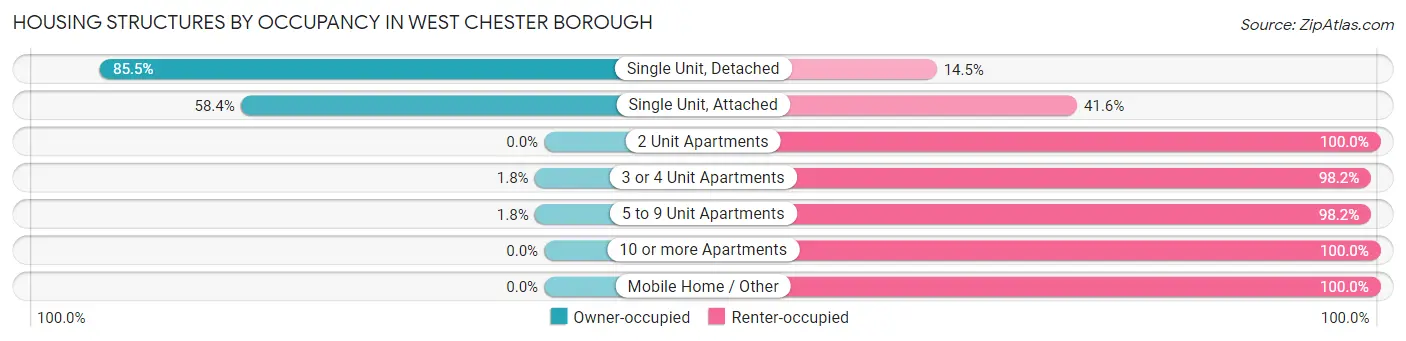
| Structure Type | Owner-occupied | Renter-occupied |
| Single Unit, Detached | 952 (85.5%) | 162 (14.5%) |
| Single Unit, Attached | 1,322 (58.4%) | 941 (41.6%) |
| 2 Unit Apartments | 0 (0.0%) | 449 (100.0%) |
| 3 or 4 Unit Apartments | 11 (1.8%) | 588 (98.2%) |
| 5 to 9 Unit Apartments | 17 (1.8%) | 910 (98.2%) |
| 10 or more Apartments | 0 (0.0%) | 1,632 (100.0%) |
| Mobile Home / Other | 0 (0.0%) | 12 (100.0%) |
| Total | 2,302 (32.9%) | 4,694 (67.1%) |
Housing Structures by Number of Rooms in West Chester borough
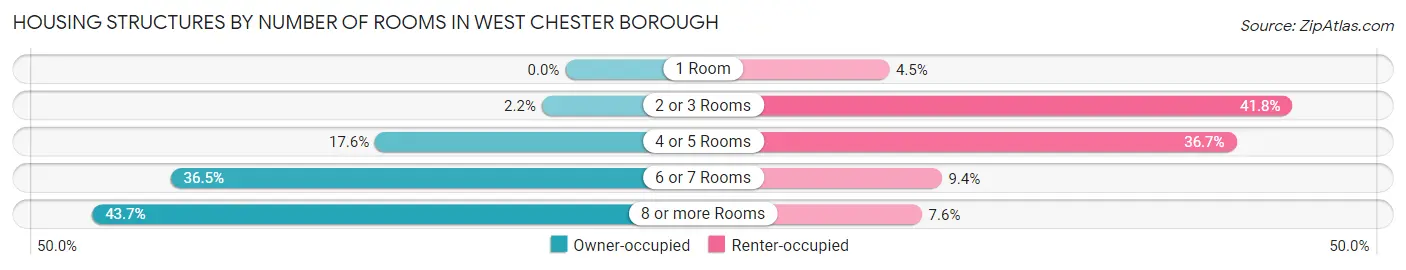
| Number of Rooms | Owner-occupied | Renter-occupied |
| 1 Room | 0 (0.0%) | 213 (4.5%) |
| 2 or 3 Rooms | 50 (2.2%) | 1,964 (41.8%) |
| 4 or 5 Rooms | 405 (17.6%) | 1,721 (36.7%) |
| 6 or 7 Rooms | 840 (36.5%) | 441 (9.4%) |
| 8 or more Rooms | 1,007 (43.7%) | 355 (7.6%) |
| Total | 2,302 (100.0%) | 4,694 (100.0%) |
Housing Structure by Heating Type in West Chester borough
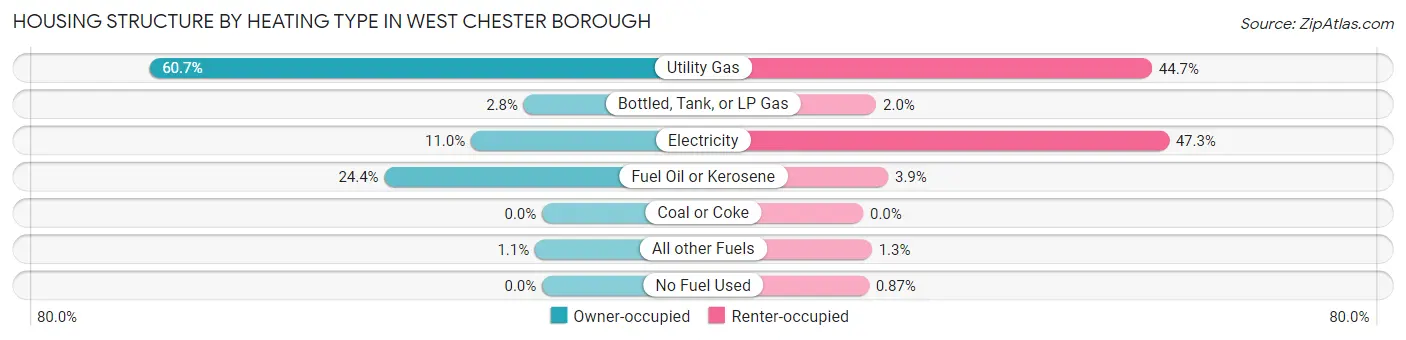
| Heating Type | Owner-occupied | Renter-occupied |
| Utility Gas | 1,398 (60.7%) | 2,096 (44.7%) |
| Bottled, Tank, or LP Gas | 65 (2.8%) | 95 (2.0%) |
| Electricity | 253 (11.0%) | 2,218 (47.2%) |
| Fuel Oil or Kerosene | 561 (24.4%) | 181 (3.9%) |
| Coal or Coke | 0 (0.0%) | 0 (0.0%) |
| All other Fuels | 25 (1.1%) | 63 (1.3%) |
| No Fuel Used | 0 (0.0%) | 41 (0.9%) |
| Total | 2,302 (100.0%) | 4,694 (100.0%) |
Household Vehicle Usage in West Chester borough
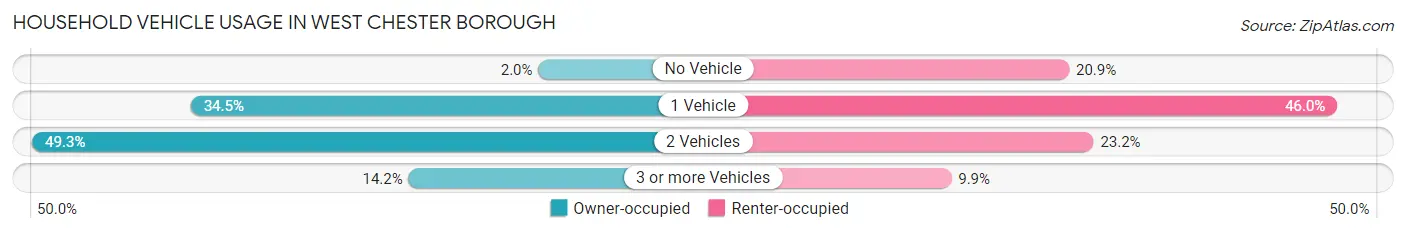
| Vehicles per Household | Owner-occupied | Renter-occupied |
| No Vehicle | 47 (2.0%) | 982 (20.9%) |
| 1 Vehicle | 794 (34.5%) | 2,157 (46.0%) |
| 2 Vehicles | 1,135 (49.3%) | 1,089 (23.2%) |
| 3 or more Vehicles | 326 (14.2%) | 466 (9.9%) |
| Total | 2,302 (100.0%) | 4,694 (100.0%) |
Real Estate & Mortgages in West Chester borough
Real Estate and Mortgage Overview in West Chester borough
| Characteristic | Without Mortgage | With Mortgage |
| Housing Units | 832 | 1,470 |
| Median Property Value | $464,600 | $462,000 |
| Median Household Income | $73,056 | $737 |
| Monthly Housing Costs | $824 | $378 |
| Real Estate Taxes | $4,864 | $10 |
Property Value by Mortgage Status in West Chester borough
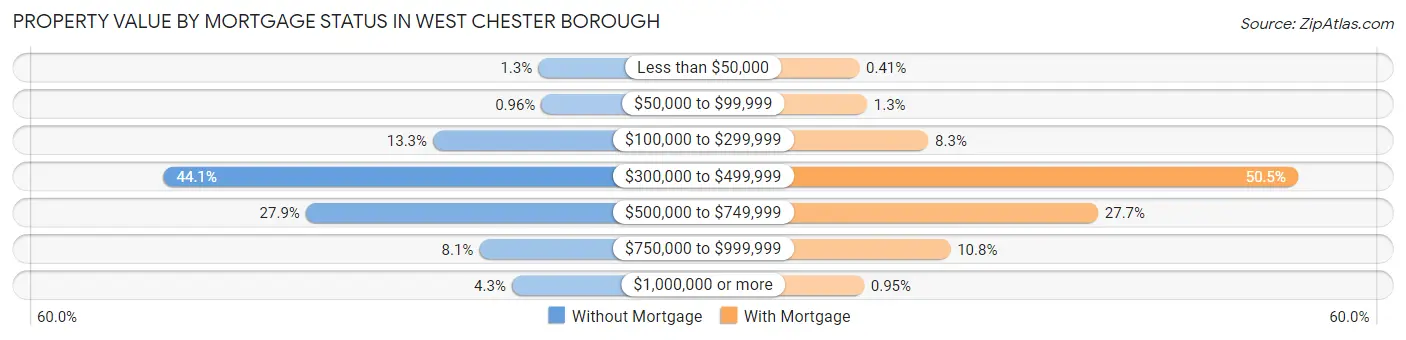
| Property Value | Without Mortgage | With Mortgage |
| Less than $50,000 | 11 (1.3%) | 6 (0.4%) |
| $50,000 to $99,999 | 8 (1.0%) | 19 (1.3%) |
| $100,000 to $299,999 | 111 (13.3%) | 122 (8.3%) |
| $300,000 to $499,999 | 367 (44.1%) | 743 (50.5%) |
| $500,000 to $749,999 | 232 (27.9%) | 407 (27.7%) |
| $750,000 to $999,999 | 67 (8.1%) | 159 (10.8%) |
| $1,000,000 or more | 36 (4.3%) | 14 (0.9%) |
| Total | 832 (100.0%) | 1,470 (100.0%) |
Household Income by Mortgage Status in West Chester borough
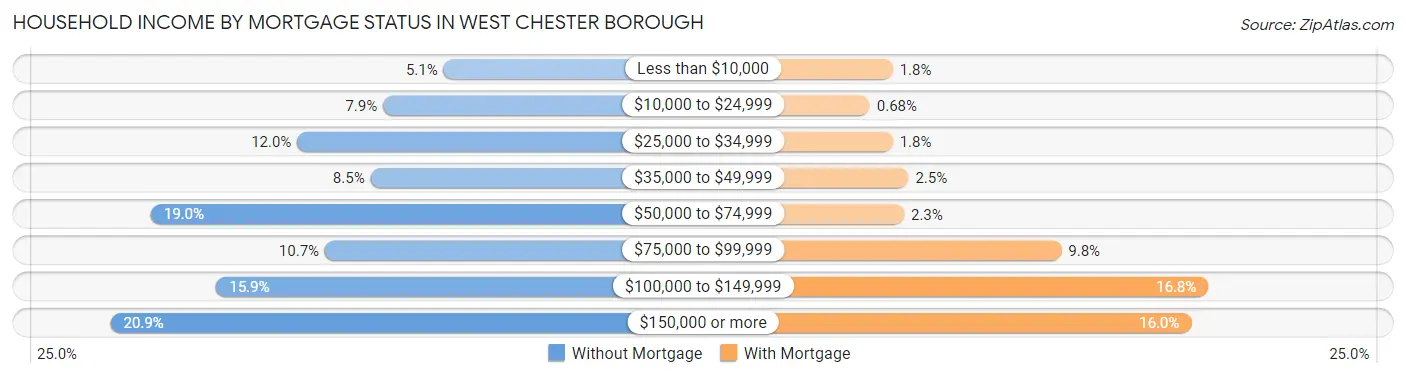
| Household Income | Without Mortgage | With Mortgage |
| Less than $10,000 | 42 (5.1%) | 26 (1.8%) |
| $10,000 to $24,999 | 66 (7.9%) | 10 (0.7%) |
| $25,000 to $34,999 | 100 (12.0%) | 26 (1.8%) |
| $35,000 to $49,999 | 71 (8.5%) | 37 (2.5%) |
| $50,000 to $74,999 | 158 (19.0%) | 34 (2.3%) |
| $75,000 to $99,999 | 89 (10.7%) | 144 (9.8%) |
| $100,000 to $149,999 | 132 (15.9%) | 247 (16.8%) |
| $150,000 or more | 174 (20.9%) | 235 (16.0%) |
| Total | 832 (100.0%) | 1,470 (100.0%) |
Property Value to Household Income Ratio in West Chester borough
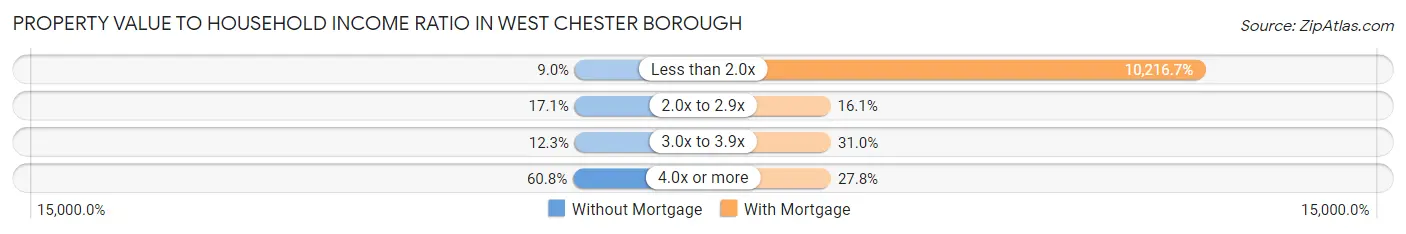
| Value-to-Income Ratio | Without Mortgage | With Mortgage |
| Less than 2.0x | 75 (9.0%) | 150,185 (10,216.7%) |
| 2.0x to 2.9x | 142 (17.1%) | 237 (16.1%) |
| 3.0x to 3.9x | 102 (12.3%) | 455 (30.9%) |
| 4.0x or more | 506 (60.8%) | 409 (27.8%) |
| Total | 832 (100.0%) | 1,470 (100.0%) |
Real Estate Taxes by Mortgage Status in West Chester borough
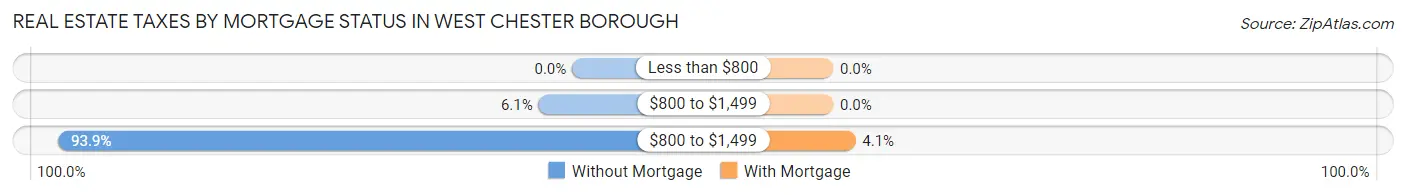
| Property Taxes | Without Mortgage | With Mortgage |
| Less than $800 | 0 (0.0%) | 0 (0.0%) |
| $800 to $1,499 | 51 (6.1%) | 0 (0.0%) |
| $800 to $1,499 | 781 (93.9%) | 60 (4.1%) |
| Total | 832 (100.0%) | 1,470 (100.0%) |
Health & Disability in West Chester borough
Health Insurance Coverage by Age in West Chester borough
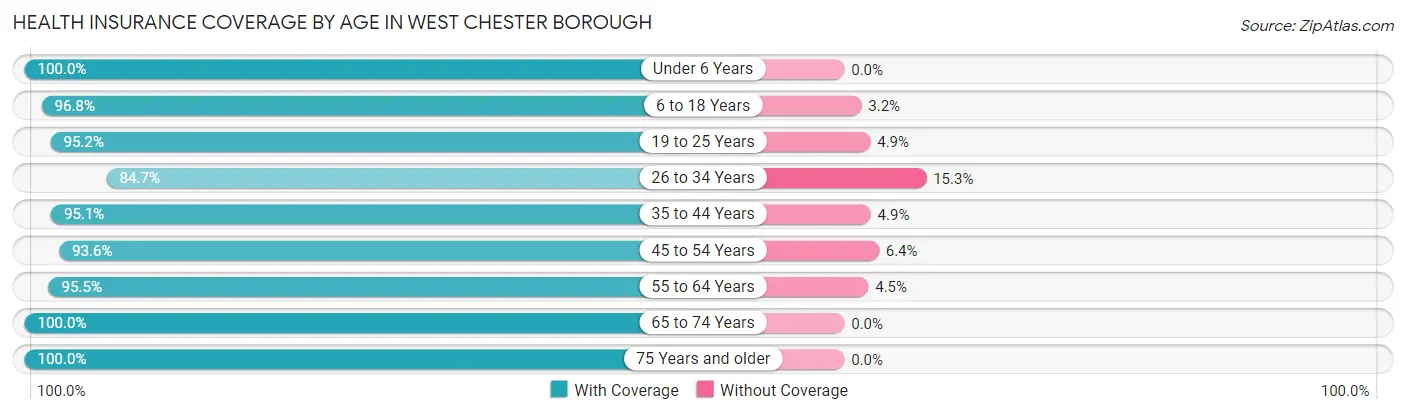
| Age Bracket | With Coverage | Without Coverage |
| Under 6 Years | 401 (100.0%) | 0 (0.0%) |
| 6 to 18 Years | 2,651 (96.8%) | 87 (3.2%) |
| 19 to 25 Years | 6,690 (95.2%) | 341 (4.9%) |
| 26 to 34 Years | 2,557 (84.7%) | 461 (15.3%) |
| 35 to 44 Years | 1,410 (95.1%) | 73 (4.9%) |
| 45 to 54 Years | 1,324 (93.6%) | 91 (6.4%) |
| 55 to 64 Years | 1,112 (95.5%) | 52 (4.5%) |
| 65 to 74 Years | 1,071 (100.0%) | 0 (0.0%) |
| 75 Years and older | 599 (100.0%) | 0 (0.0%) |
| Total | 17,815 (94.2%) | 1,105 (5.8%) |
Health Insurance Coverage by Citizenship Status in West Chester borough
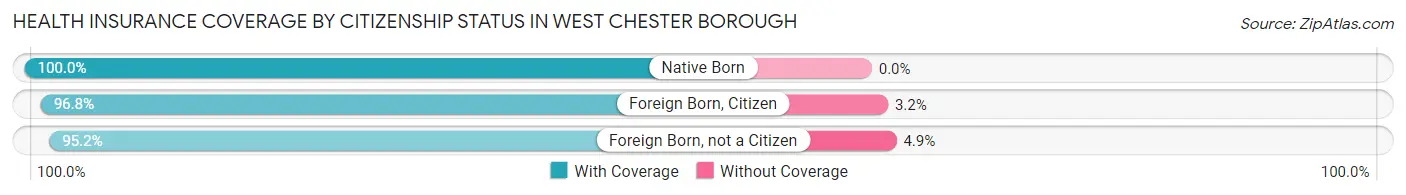
| Citizenship Status | With Coverage | Without Coverage |
| Native Born | 401 (100.0%) | 0 (0.0%) |
| Foreign Born, Citizen | 2,651 (96.8%) | 87 (3.2%) |
| Foreign Born, not a Citizen | 6,690 (95.2%) | 341 (4.9%) |
Health Insurance Coverage by Household Income in West Chester borough
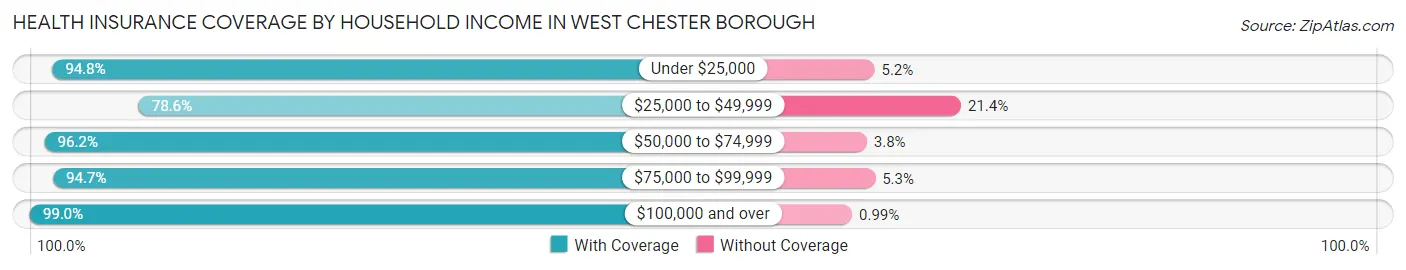
| Household Income | With Coverage | Without Coverage |
| Under $25,000 | 2,241 (94.8%) | 123 (5.2%) |
| $25,000 to $49,999 | 1,726 (78.6%) | 470 (21.4%) |
| $50,000 to $74,999 | 1,688 (96.2%) | 66 (3.8%) |
| $75,000 to $99,999 | 2,380 (94.7%) | 134 (5.3%) |
| $100,000 and over | 5,793 (99.0%) | 58 (1.0%) |
Public vs Private Health Insurance Coverage by Age in West Chester borough
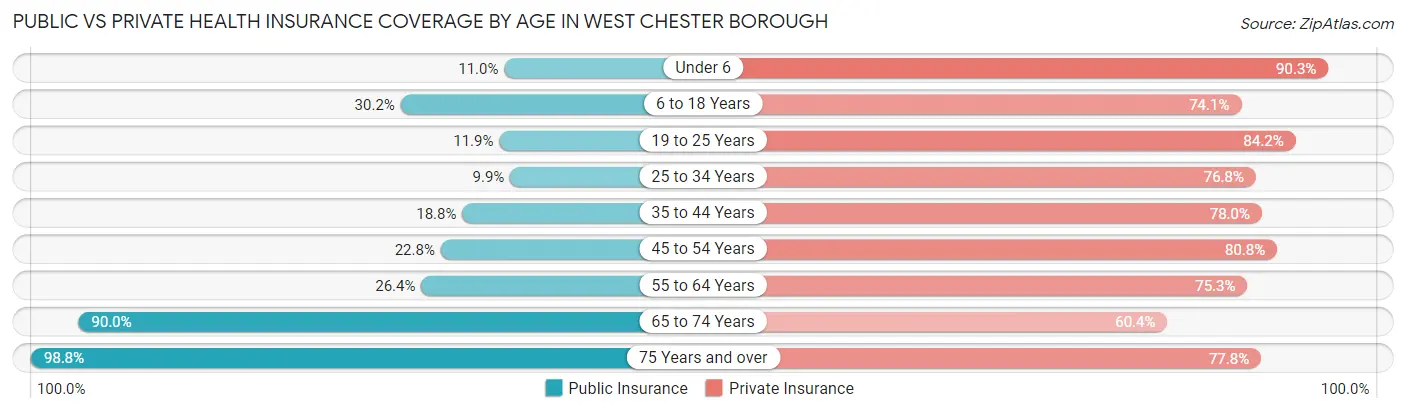
| Age Bracket | Public Insurance | Private Insurance |
| Under 6 | 44 (11.0%) | 362 (90.3%) |
| 6 to 18 Years | 827 (30.2%) | 2,030 (74.1%) |
| 19 to 25 Years | 836 (11.9%) | 5,922 (84.2%) |
| 25 to 34 Years | 298 (9.9%) | 2,319 (76.8%) |
| 35 to 44 Years | 278 (18.8%) | 1,156 (77.9%) |
| 45 to 54 Years | 322 (22.8%) | 1,143 (80.8%) |
| 55 to 64 Years | 307 (26.4%) | 876 (75.3%) |
| 65 to 74 Years | 964 (90.0%) | 647 (60.4%) |
| 75 Years and over | 592 (98.8%) | 466 (77.8%) |
| Total | 4,468 (23.6%) | 14,921 (78.9%) |
Disability Status by Sex by Age in West Chester borough
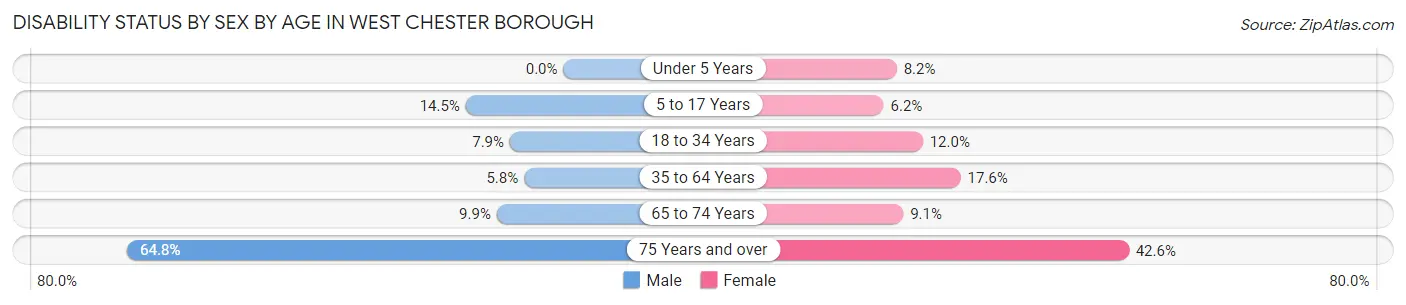
| Age Bracket | Male | Female |
| Under 5 Years | 0 (0.0%) | 11 (8.2%) |
| 5 to 17 Years | 95 (14.5%) | 44 (6.2%) |
| 18 to 34 Years | 411 (7.9%) | 757 (12.0%) |
| 35 to 64 Years | 114 (5.8%) | 372 (17.6%) |
| 65 to 74 Years | 43 (9.9%) | 58 (9.1%) |
| 75 Years and over | 125 (64.8%) | 173 (42.6%) |
Disability Class by Sex by Age in West Chester borough
Disability Class: Hearing Difficulty
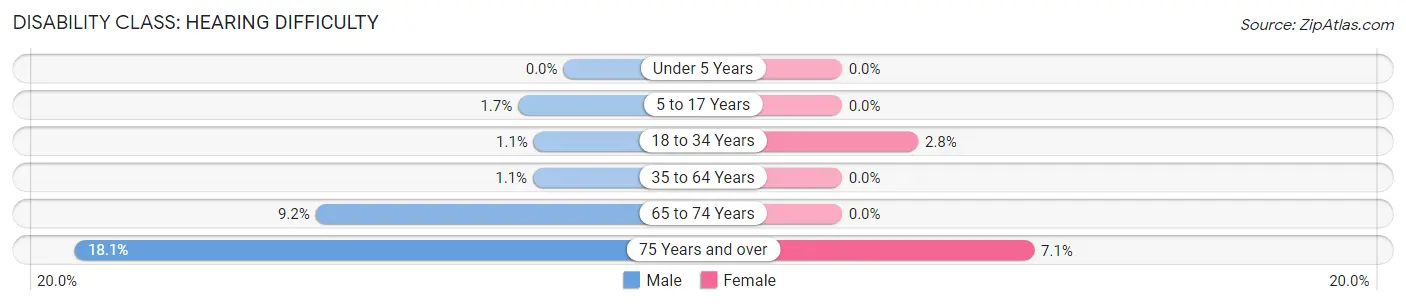
| Age Bracket | Male | Female |
| Under 5 Years | 0 (0.0%) | 0 (0.0%) |
| 5 to 17 Years | 11 (1.7%) | 0 (0.0%) |
| 18 to 34 Years | 57 (1.1%) | 178 (2.8%) |
| 35 to 64 Years | 22 (1.1%) | 0 (0.0%) |
| 65 to 74 Years | 40 (9.2%) | 0 (0.0%) |
| 75 Years and over | 35 (18.1%) | 29 (7.1%) |
Disability Class: Vision Difficulty
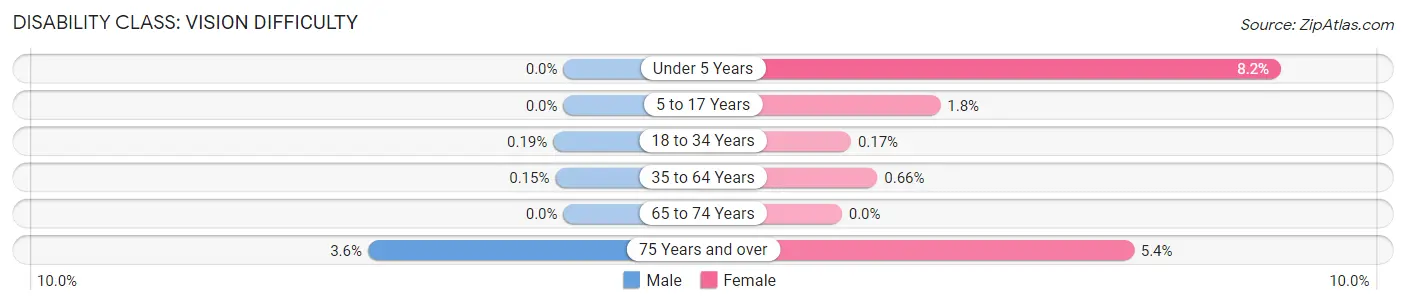
| Age Bracket | Male | Female |
| Under 5 Years | 0 (0.0%) | 11 (8.2%) |
| 5 to 17 Years | 0 (0.0%) | 13 (1.8%) |
| 18 to 34 Years | 10 (0.2%) | 11 (0.2%) |
| 35 to 64 Years | 3 (0.2%) | 14 (0.7%) |
| 65 to 74 Years | 0 (0.0%) | 0 (0.0%) |
| 75 Years and over | 7 (3.6%) | 22 (5.4%) |
Disability Class: Cognitive Difficulty
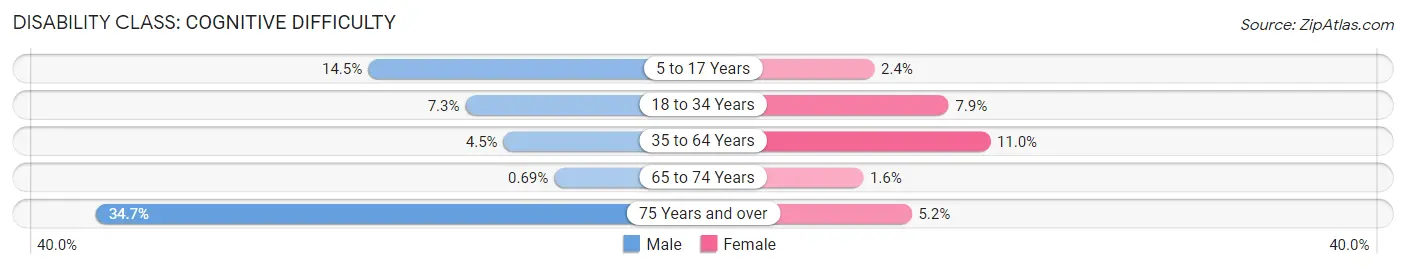
| Age Bracket | Male | Female |
| 5 to 17 Years | 95 (14.5%) | 17 (2.4%) |
| 18 to 34 Years | 377 (7.3%) | 499 (7.9%) |
| 35 to 64 Years | 87 (4.4%) | 232 (11.0%) |
| 65 to 74 Years | 3 (0.7%) | 10 (1.6%) |
| 75 Years and over | 67 (34.7%) | 21 (5.2%) |
Disability Class: Ambulatory Difficulty
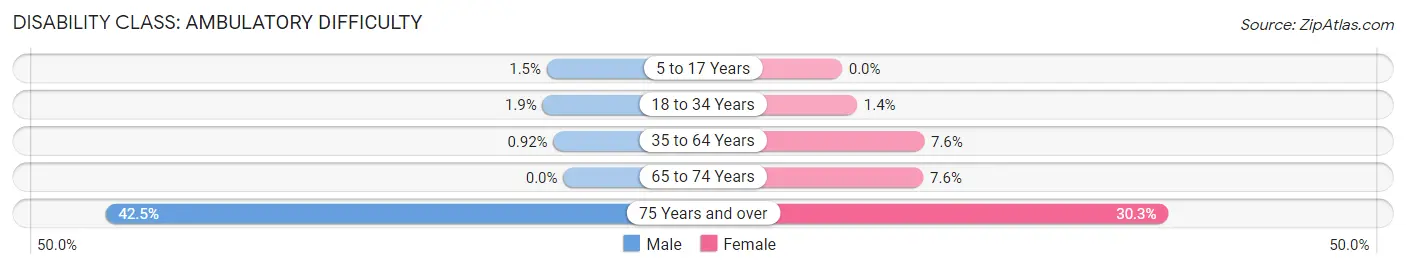
| Age Bracket | Male | Female |
| 5 to 17 Years | 10 (1.5%) | 0 (0.0%) |
| 18 to 34 Years | 100 (1.9%) | 88 (1.4%) |
| 35 to 64 Years | 18 (0.9%) | 161 (7.6%) |
| 65 to 74 Years | 0 (0.0%) | 48 (7.5%) |
| 75 Years and over | 82 (42.5%) | 123 (30.3%) |
Disability Class: Self-Care Difficulty
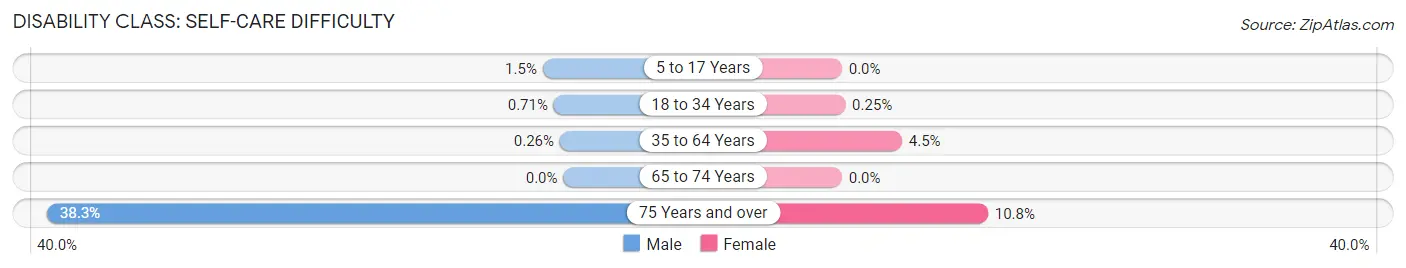
| Age Bracket | Male | Female |
| 5 to 17 Years | 10 (1.5%) | 0 (0.0%) |
| 18 to 34 Years | 37 (0.7%) | 16 (0.3%) |
| 35 to 64 Years | 5 (0.3%) | 94 (4.5%) |
| 65 to 74 Years | 0 (0.0%) | 0 (0.0%) |
| 75 Years and over | 74 (38.3%) | 44 (10.8%) |
Technology Access in West Chester borough
Computing Device Access in West Chester borough
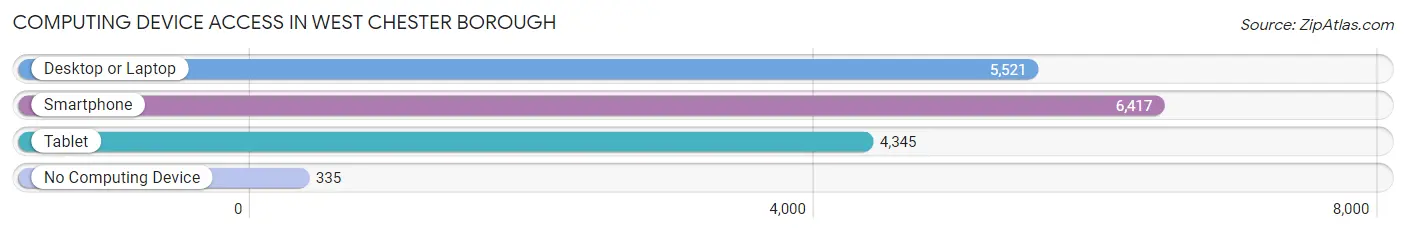
| Device Type | # Households | % Households |
| Desktop or Laptop | 5,521 | 78.9% |
| Smartphone | 6,417 | 91.7% |
| Tablet | 4,345 | 62.1% |
| No Computing Device | 335 | 4.8% |
| Total | 6,996 | 100.0% |
Internet Access in West Chester borough
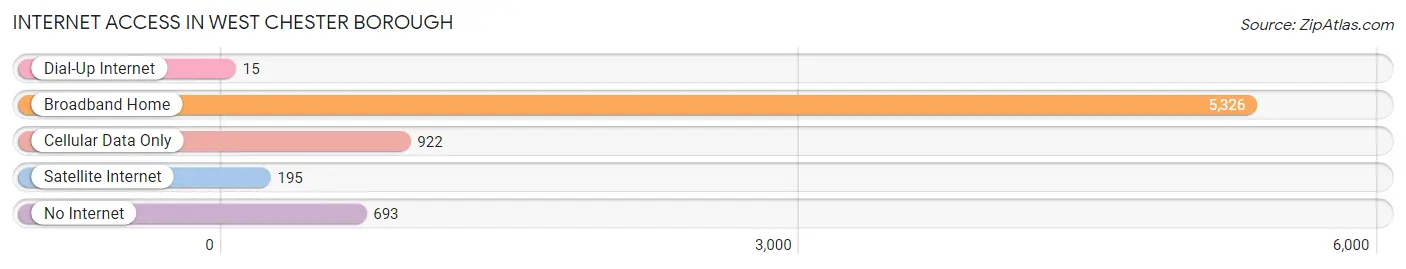
| Internet Type | # Households | % Households |
| Dial-Up Internet | 15 | 0.2% |
| Broadband Home | 5,326 | 76.1% |
| Cellular Data Only | 922 | 13.2% |
| Satellite Internet | 195 | 2.8% |
| No Internet | 693 | 9.9% |
| Total | 6,996 | 100.0% |
West Chester borough Summary
West Chester Borough is a borough located in Chester County, Pennsylvania. It is the county seat of Chester County and is located approximately 20 miles west of Philadelphia. The borough has a population of 19,846 as of the 2010 census and is part of the Greater Philadelphia metropolitan area.
History
West Chester was founded in 1799 by a group of Quakers from Philadelphia. The town was originally known as Turk’s Head, after the inn of the same name that was located there. The name was changed to West Chester in 1810. The town was incorporated as a borough in 1833.
West Chester was an important center of the Underground Railroad during the 19th century. It was also the site of the first public school in the United States, established in 1799.
Geography
West Chester is located at 39°57'N 75°37'W (39.95, -75.62). According to the United States Census Bureau, the borough has a total area of 2.3 square miles (6.0 km2), all of it land.
Economy
West Chester is home to a variety of businesses, including retail stores, restaurants, and professional services. The borough is also home to West Chester University, which has an enrollment of over 16,000 students.
The borough is served by the SEPTA Regional Rail system, with service to Philadelphia, Wilmington, and other destinations.
Demographics
As of the 2010 census, the population of West Chester was 19,846. The racial makeup of the borough was 87.3% White, 5.3% African American, 0.3% Native American, 3.2% Asian, 0.1% Pacific Islander, 1.7% from other races, and 2.2% from two or more races. Hispanic or Latino of any race were 4.2% of the population.
The median income for a household in the borough was $50,945, and the median income for a family was $63,945. The per capita income for the borough was $25,945. About 8.2% of families and 11.2% of the population were below the poverty line, including 15.2% of those under age 18 and 8.2% of those age 65 or over.
West Chester is a diverse community with a variety of cultures and backgrounds. The borough is home to a large number of churches, synagogues, and other places of worship. The borough also has a vibrant arts and culture scene, with a variety of galleries, museums, and performing arts venues.
Common Questions
What is Per Capita Income in West Chester borough?
Per Capita income in West Chester borough is $41,443.
What is the Median Family Income in West Chester borough?
Median Family Income in West Chester borough is $99,847.
What is the Median Household income in West Chester borough?
Median Household Income in West Chester borough is $71,875.
What is Income or Wage Gap in West Chester borough?
Income or Wage Gap in West Chester borough is 57.8%.
Women in West Chester borough earn 42.2 cents for every dollar earned by a man.
What is Family Income Deficit in West Chester borough?
Family Income Deficit in West Chester borough is $11,347.
Families that are below poverty line in West Chester borough earn $11,347 less on average than the poverty threshold level.
What is Inequality or Gini Index in West Chester borough?
Inequality or Gini Index in West Chester borough is 0.50.
What is the Total Population of West Chester borough?
Total Population of West Chester borough is 19,016.
What is the Total Male Population of West Chester borough?
Total Male Population of West Chester borough is 8,635.
What is the Total Female Population of West Chester borough?
Total Female Population of West Chester borough is 10,381.
What is the Ratio of Males per 100 Females in West Chester borough?
There are 83.18 Males per 100 Females in West Chester borough.
What is the Ratio of Females per 100 Males in West Chester borough?
There are 120.22 Females per 100 Males in West Chester borough.
What is the Median Population Age in West Chester borough?
Median Population Age in West Chester borough is 24.6 Years.
What is the Average Family Size in West Chester borough
Average Family Size in West Chester borough is 2.9 People.
What is the Average Household Size in West Chester borough
Average Household Size in West Chester borough is 2.1 People.
How Large is the Labor Force in West Chester borough?
There are 11,850 People in the Labor Forcein in West Chester borough.
What is the Percentage of People in the Labor Force in West Chester borough?
67.3% of People are in the Labor Force in West Chester borough.
What is the Unemployment Rate in West Chester borough?
Unemployment Rate in West Chester borough is 7.3%.