Channahon, IL Map & Demographics
Channahon Map
Channahon Overview
$45,112
PER CAPITA INCOME
$130,409
AVG FAMILY INCOME
$112,771
AVG HOUSEHOLD INCOME
48.9%
WAGE / INCOME GAP [ % ]
51.1¢/ $1
WAGE / INCOME GAP [ $ ]
$10,780
FAMILY INCOME DEFICIT
0.36
INEQUALITY / GINI INDEX
13,807
TOTAL POPULATION
6,681
MALE POPULATION
7,126
FEMALE POPULATION
93.76
MALES / 100 FEMALES
106.66
FEMALES / 100 MALES
38.6
MEDIAN AGE
3.5
AVG FAMILY SIZE
3.2
AVG HOUSEHOLD SIZE
7,433
LABOR FORCE [ PEOPLE ]
70.2%
PERCENT IN LABOR FORCE
8.0%
UNEMPLOYMENT RATE
Channahon Zip Codes
Income in Channahon
Income Overview in Channahon
Per Capita Income in Channahon is $45,112, while median incomes of families and households are $130,409 and $112,771 respectively.
| Characteristic | Number | Measure |
| Per Capita Income | 13,807 | $45,112 |
| Median Family Income | 3,609 | $130,409 |
| Mean Family Income | 3,609 | $150,123 |
| Median Household Income | 4,347 | $112,771 |
| Mean Household Income | 4,347 | $140,103 |
| Income Deficit | 3,609 | $10,780 |
| Wage / Income Gap (%) | 13,807 | 48.95% |
| Wage / Income Gap ($) | 13,807 | 51.05¢ per $1 |
| Gini / Inequality Index | 13,807 | 0.36 |
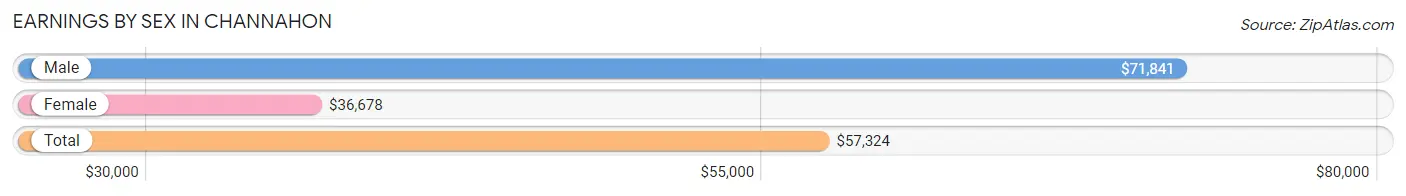
Earnings by Sex in Channahon
Average Earnings in Channahon are $57,324, $71,841 for men and $36,678 for women, a difference of 48.9%.
| Sex | Number | Average Earnings |
| Male | 4,084 (53.2%) | $71,841 |
| Female | 3,585 (46.8%) | $36,678 |
| Total | 7,669 (100.0%) | $57,324 |
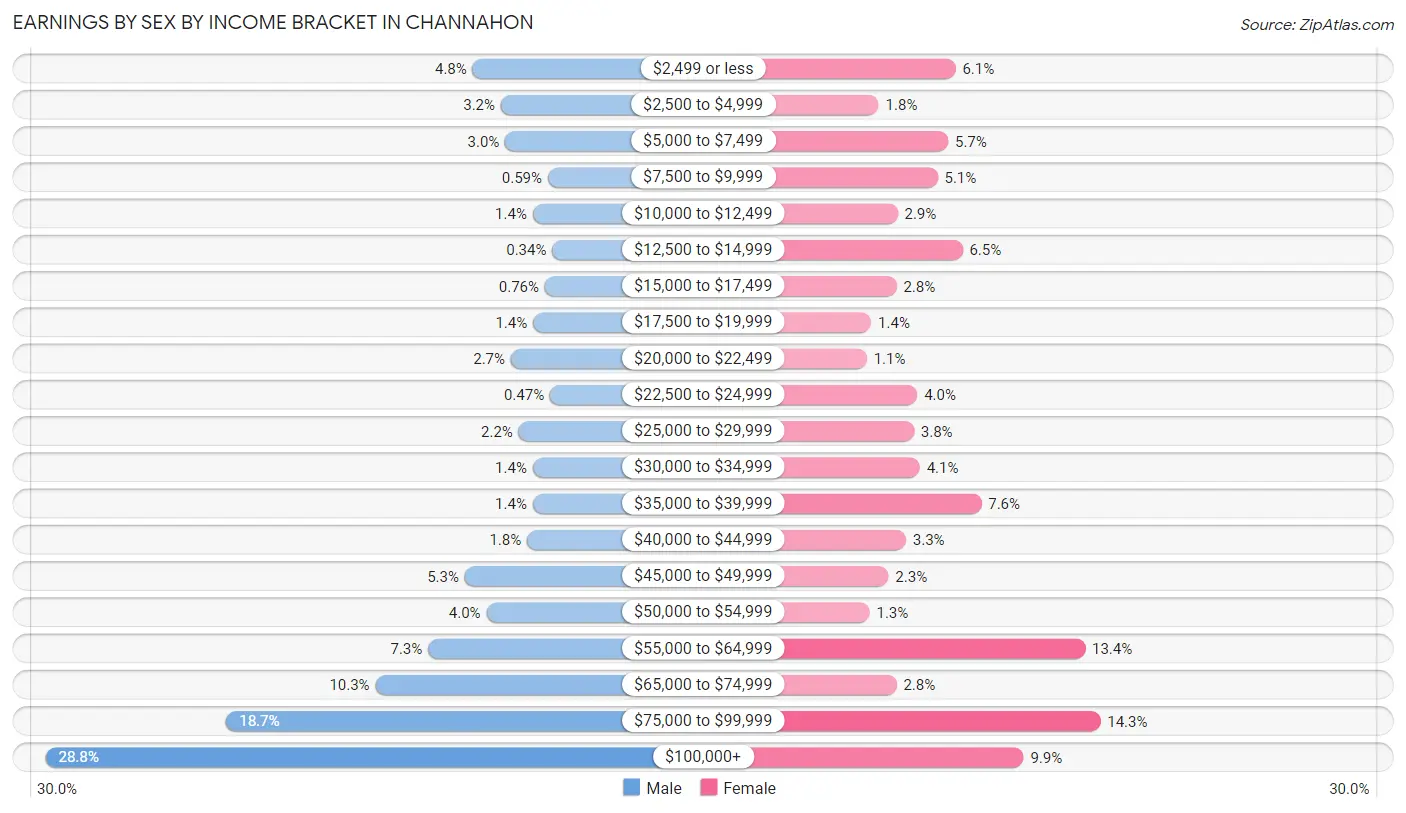
Earnings by Sex by Income Bracket in Channahon
The most common earnings brackets in Channahon are $100,000+ for men (1,177 | 28.8%) and $75,000 to $99,999 for women (511 | 14.2%).
| Income | Male | Female |
| $2,499 or less | 197 (4.8%) | 219 (6.1%) |
| $2,500 to $4,999 | 132 (3.2%) | 64 (1.8%) |
| $5,000 to $7,499 | 122 (3.0%) | 204 (5.7%) |
| $7,500 to $9,999 | 24 (0.6%) | 183 (5.1%) |
| $10,000 to $12,499 | 59 (1.4%) | 102 (2.9%) |
| $12,500 to $14,999 | 14 (0.3%) | 233 (6.5%) |
| $15,000 to $17,499 | 31 (0.8%) | 100 (2.8%) |
| $17,500 to $19,999 | 58 (1.4%) | 49 (1.4%) |
| $20,000 to $22,499 | 109 (2.7%) | 40 (1.1%) |
| $22,500 to $24,999 | 19 (0.5%) | 142 (4.0%) |
| $25,000 to $29,999 | 91 (2.2%) | 135 (3.8%) |
| $30,000 to $34,999 | 59 (1.4%) | 147 (4.1%) |
| $35,000 to $39,999 | 59 (1.4%) | 271 (7.6%) |
| $40,000 to $44,999 | 72 (1.8%) | 119 (3.3%) |
| $45,000 to $49,999 | 215 (5.3%) | 84 (2.3%) |
| $50,000 to $54,999 | 165 (4.0%) | 46 (1.3%) |
| $55,000 to $64,999 | 299 (7.3%) | 480 (13.4%) |
| $65,000 to $74,999 | 420 (10.3%) | 100 (2.8%) |
| $75,000 to $99,999 | 762 (18.7%) | 511 (14.2%) |
| $100,000+ | 1,177 (28.8%) | 356 (9.9%) |
| Total | 4,084 (100.0%) | 3,585 (100.0%) |
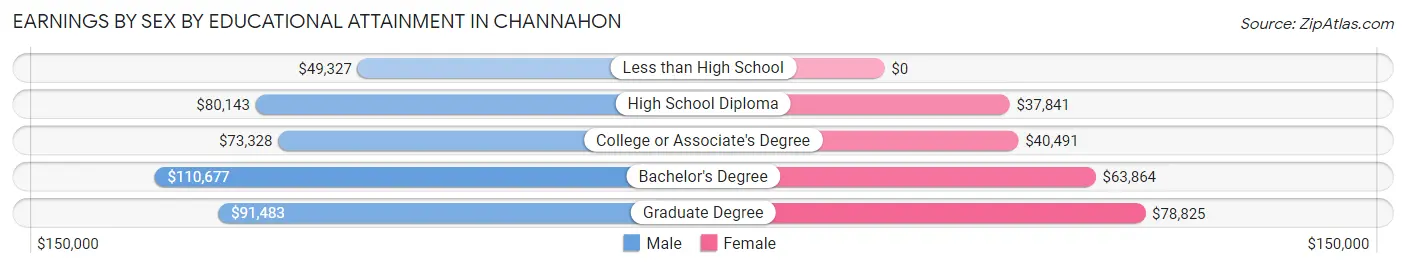
Earnings by Sex by Educational Attainment in Channahon
Average earnings in Channahon are $87,031 for men and $55,531 for women, a difference of 36.2%. Men with an educational attainment of bachelor's degree enjoy the highest average annual earnings of $110,677, while those with less than high school education earn the least with $49,327. Women with an educational attainment of graduate degree earn the most with the average annual earnings of $78,825, while those with high school diploma education have the smallest earnings of $37,841.
| Educational Attainment | Male Income | Female Income |
| Less than High School | $49,327 | $0 |
| High School Diploma | $80,143 | $37,841 |
| College or Associate's Degree | $73,328 | $40,491 |
| Bachelor's Degree | $110,677 | $63,864 |
| Graduate Degree | $91,483 | $78,825 |
| Total | $87,031 | $55,531 |
Family Income in Channahon
Family Income Brackets in Channahon
According to the Channahon family income data, there are 917 families falling into the $100,000 to $149,999 income range, which is the most common income bracket and makes up 25.4% of all families. Conversely, the less than $10,000 income bracket is the least frequent group with only 22 families (0.6%) belonging to this category.
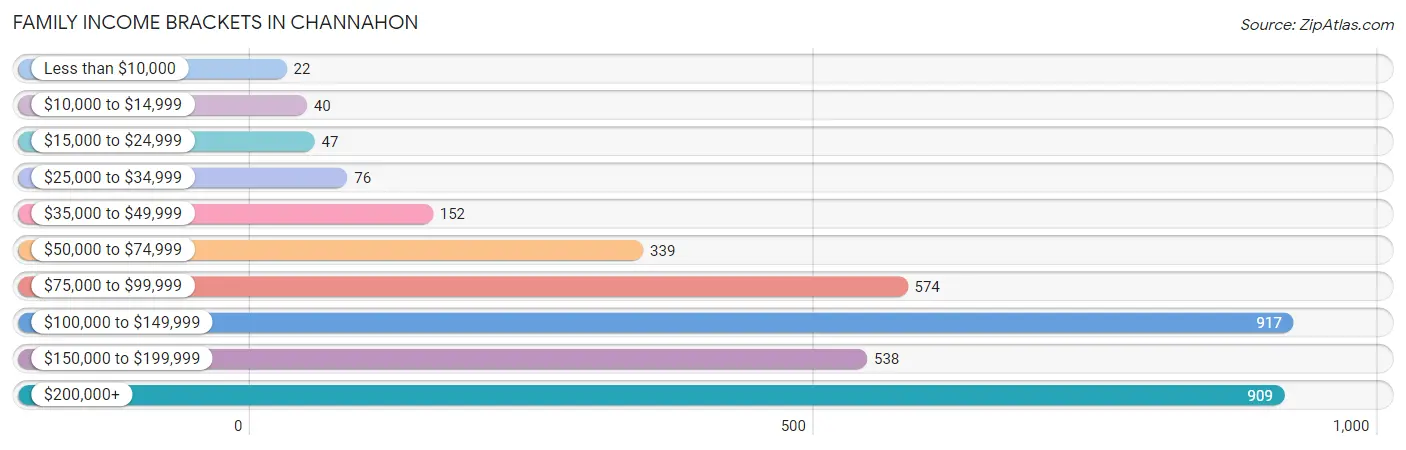
| Income Bracket | # Families | % Families |
| Less than $10,000 | 22 | 0.6% |
| $10,000 to $14,999 | 40 | 1.1% |
| $15,000 to $24,999 | 47 | 1.3% |
| $25,000 to $34,999 | 76 | 2.1% |
| $35,000 to $49,999 | 152 | 4.2% |
| $50,000 to $74,999 | 339 | 9.4% |
| $75,000 to $99,999 | 574 | 15.9% |
| $100,000 to $149,999 | 917 | 25.4% |
| $150,000 to $199,999 | 538 | 14.9% |
| $200,000+ | 909 | 25.2% |
Family Income by Famaliy Size in Channahon
5-person families (482 | 13.4%) account for the highest median family income in Channahon with $158,250 per family, while 2-person families (1,271 | 35.2%) have the highest median income of $51,645 per family member.
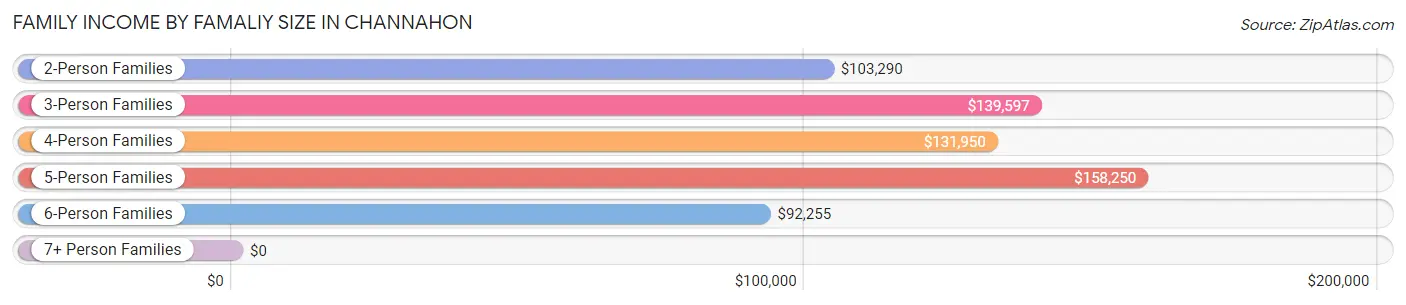
| Income Bracket | # Families | Median Income |
| 2-Person Families | 1,271 (35.2%) | $103,290 |
| 3-Person Families | 774 (21.4%) | $139,597 |
| 4-Person Families | 803 (22.3%) | $131,950 |
| 5-Person Families | 482 (13.4%) | $158,250 |
| 6-Person Families | 255 (7.1%) | $92,255 |
| 7+ Person Families | 24 (0.7%) | $0 |
| Total | 3,609 (100.0%) | $130,409 |
Family Income by Number of Earners in Channahon
The median family income in Channahon is $130,409, with families comprising 3+ earners (661) having the highest median family income of $224,566, while families with no earners (301) have the lowest median family income of $83,958, accounting for 18.3% and 8.3% of families, respectively.
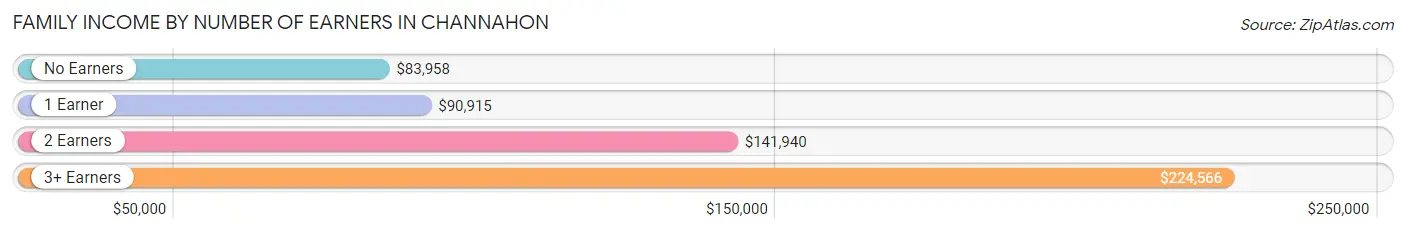
| Number of Earners | # Families | Median Income |
| No Earners | 301 (8.3%) | $83,958 |
| 1 Earner | 1,021 (28.3%) | $90,915 |
| 2 Earners | 1,626 (45.1%) | $141,940 |
| 3+ Earners | 661 (18.3%) | $224,566 |
| Total | 3,609 (100.0%) | $130,409 |
Household Income in Channahon
Household Income Brackets in Channahon
With 1,061 households falling in the category, the $100,000 to $149,999 income range is the most frequent in Channahon, accounting for 24.4% of all households. In contrast, only 35 households (0.8%) fall into the $10,000 to $14,999 income bracket, making it the least populous group.
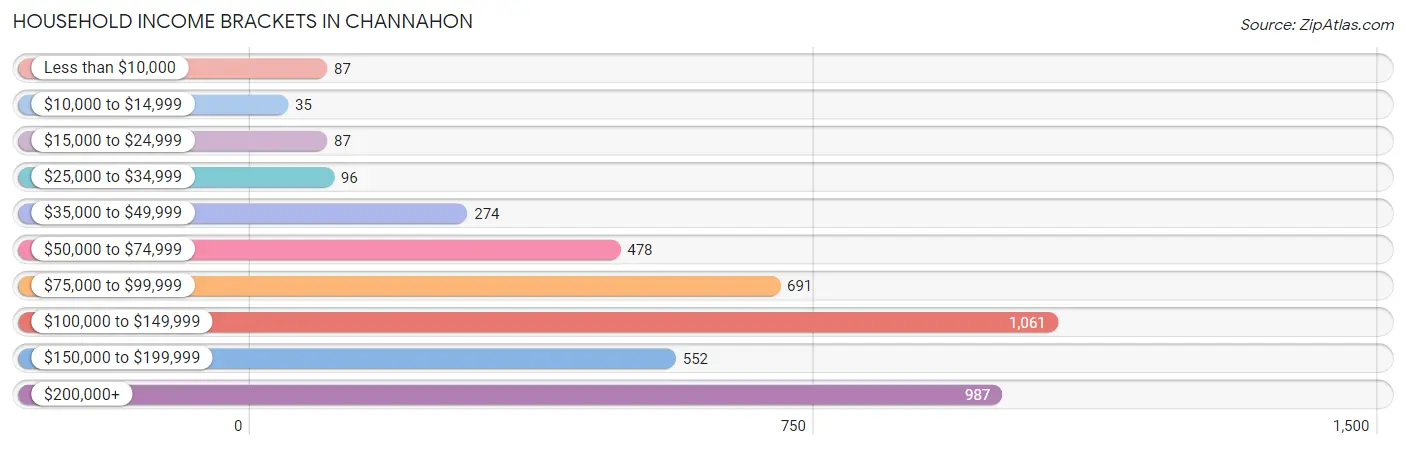
| Income Bracket | # Households | % Households |
| Less than $10,000 | 87 | 2.0% |
| $10,000 to $14,999 | 35 | 0.8% |
| $15,000 to $24,999 | 87 | 2.0% |
| $25,000 to $34,999 | 96 | 2.2% |
| $35,000 to $49,999 | 274 | 6.3% |
| $50,000 to $74,999 | 478 | 11.0% |
| $75,000 to $99,999 | 691 | 15.9% |
| $100,000 to $149,999 | 1,061 | 24.4% |
| $150,000 to $199,999 | 552 | 12.7% |
| $200,000+ | 987 | 22.7% |
Household Income by Householder Age in Channahon
The median household income in Channahon is $112,771, with the highest median household income of $141,810 found in the 45 to 64 years age bracket for the primary householder. A total of 2,004 households (46.1%) fall into this category. Meanwhile, the 15 to 24 years age bracket for the primary householder has the lowest median household income of $0, with 78 households (1.8%) in this group.
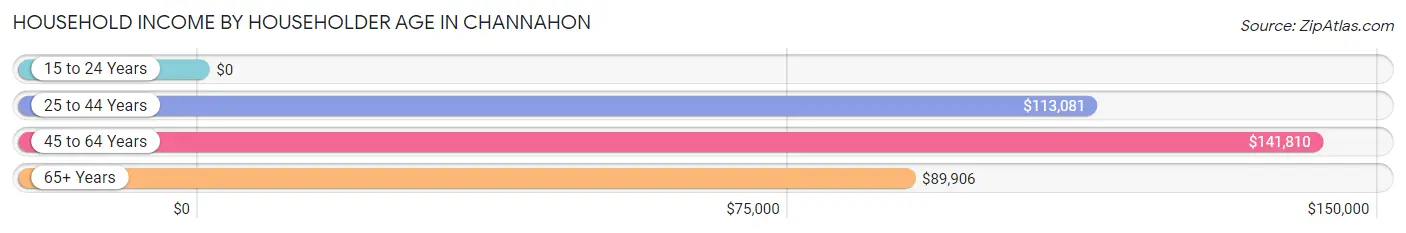
| Income Bracket | # Households | Median Income |
| 15 to 24 Years | 78 (1.8%) | $0 |
| 25 to 44 Years | 1,234 (28.4%) | $113,081 |
| 45 to 64 Years | 2,004 (46.1%) | $141,810 |
| 65+ Years | 1,031 (23.7%) | $89,906 |
| Total | 4,347 (100.0%) | $112,771 |
Poverty in Channahon
Income Below Poverty by Sex and Age in Channahon
With 3.4% poverty level for males and 4.8% for females among the residents of Channahon, 15 year old males and 35 to 44 year old females are the most vulnerable to poverty, with 23 males (19.3%) and 80 females (7.4%) in their respective age groups living below the poverty level.
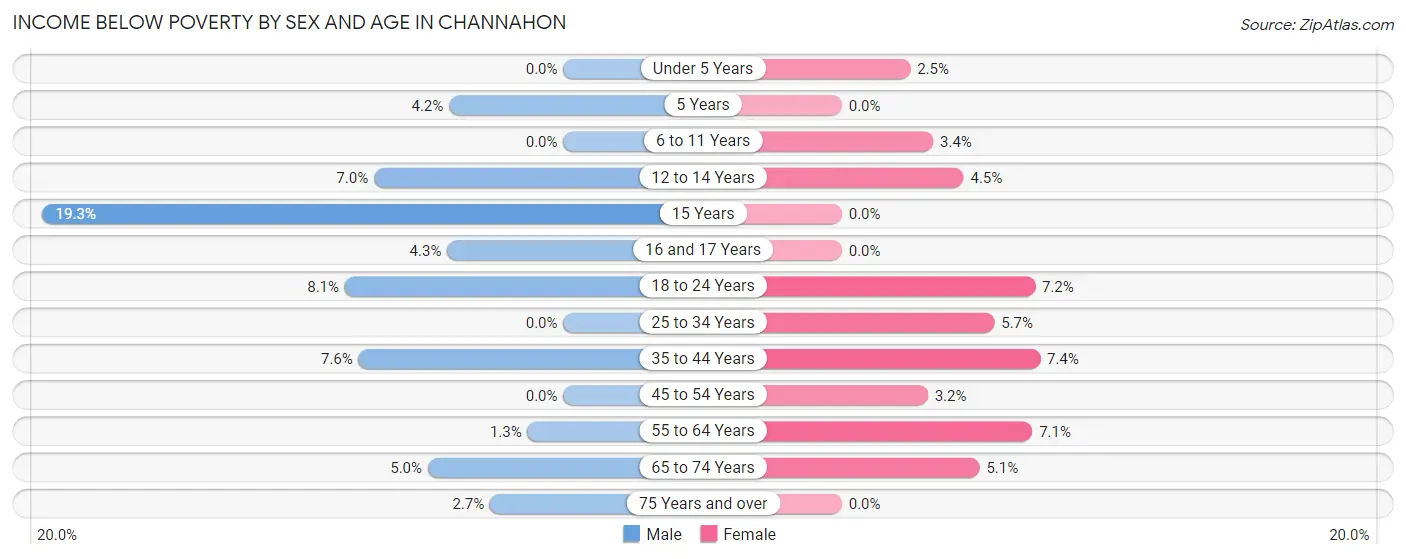
| Age Bracket | Male | Female |
| Under 5 Years | 0 (0.0%) | 9 (2.5%) |
| 5 Years | 7 (4.2%) | 0 (0.0%) |
| 6 to 11 Years | 0 (0.0%) | 24 (3.4%) |
| 12 to 14 Years | 27 (7.0%) | 18 (4.5%) |
| 15 Years | 23 (19.3%) | 0 (0.0%) |
| 16 and 17 Years | 11 (4.3%) | 0 (0.0%) |
| 18 to 24 Years | 52 (8.1%) | 58 (7.2%) |
| 25 to 34 Years | 0 (0.0%) | 32 (5.7%) |
| 35 to 44 Years | 57 (7.6%) | 80 (7.4%) |
| 45 to 54 Years | 0 (0.0%) | 29 (3.2%) |
| 55 to 64 Years | 12 (1.3%) | 63 (7.1%) |
| 65 to 74 Years | 26 (5.0%) | 30 (5.1%) |
| 75 Years and over | 9 (2.7%) | 0 (0.0%) |
| Total | 224 (3.4%) | 343 (4.8%) |
Income Above Poverty by Sex and Age in Channahon
According to the poverty statistics in Channahon, males aged under 5 years and females aged 5 years are the age groups that are most secure financially, with 100.0% of males and 100.0% of females in these age groups living above the poverty line.
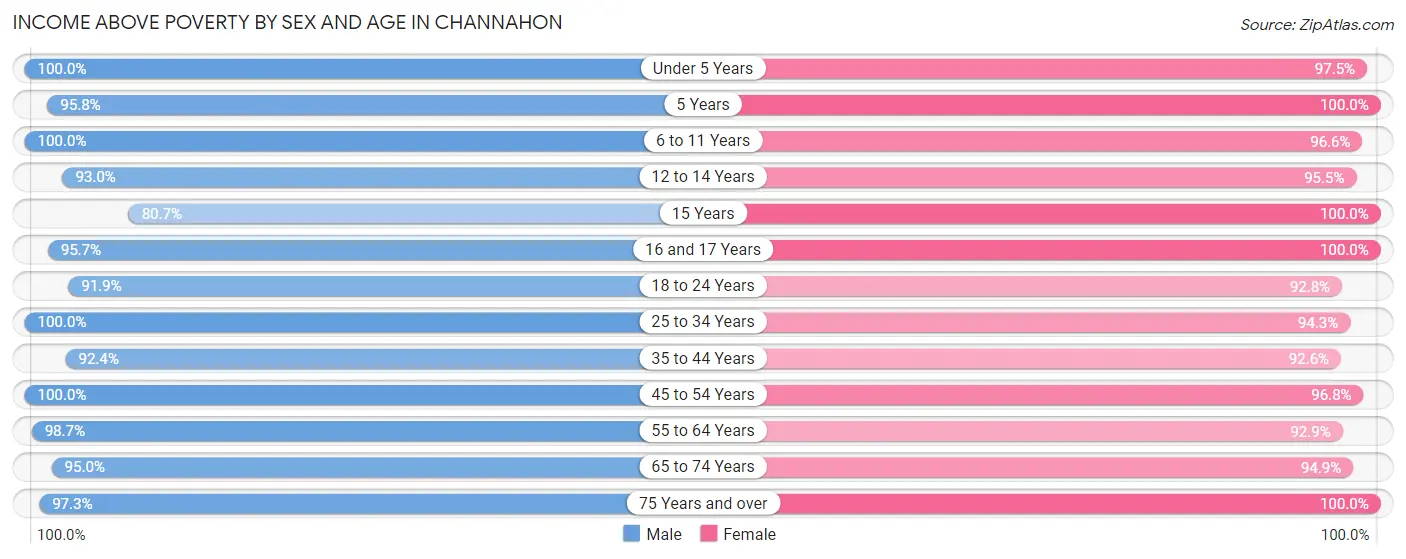
| Age Bracket | Male | Female |
| Under 5 Years | 315 (100.0%) | 346 (97.5%) |
| 5 Years | 158 (95.8%) | 29 (100.0%) |
| 6 to 11 Years | 576 (100.0%) | 684 (96.6%) |
| 12 to 14 Years | 357 (93.0%) | 380 (95.5%) |
| 15 Years | 96 (80.7%) | 170 (100.0%) |
| 16 and 17 Years | 244 (95.7%) | 231 (100.0%) |
| 18 to 24 Years | 589 (91.9%) | 751 (92.8%) |
| 25 to 34 Years | 601 (100.0%) | 533 (94.3%) |
| 35 to 44 Years | 693 (92.4%) | 1,007 (92.6%) |
| 45 to 54 Years | 1,122 (100.0%) | 880 (96.8%) |
| 55 to 64 Years | 893 (98.7%) | 828 (92.9%) |
| 65 to 74 Years | 491 (95.0%) | 557 (94.9%) |
| 75 Years and over | 322 (97.3%) | 387 (100.0%) |
| Total | 6,457 (96.7%) | 6,783 (95.2%) |
Income Below Poverty Among Married-Couple Families in Channahon
The poverty statistics for married-couple families in Channahon show that 2.1% or 65 of the total 3,110 families live below the poverty line. Families with 3 or 4 children have the highest poverty rate of 5.2%, comprising of 18 families. On the other hand, families with 1 or 2 children have the lowest poverty rate of 0.0%, which includes 0 families.
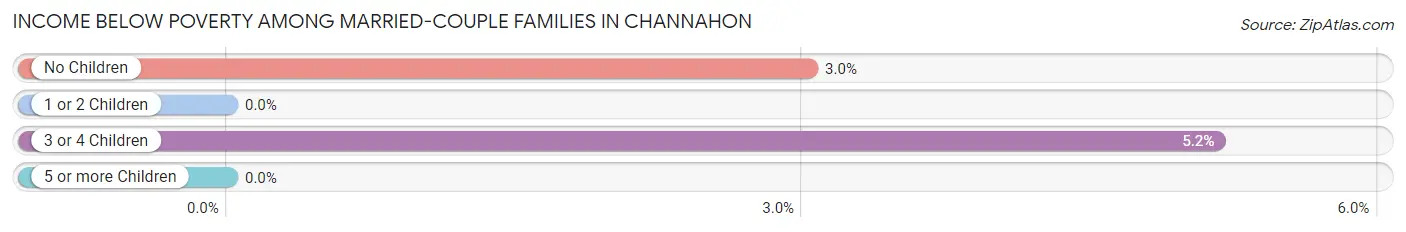
| Children | Above Poverty | Below Poverty |
| No Children | 1,503 (97.0%) | 47 (3.0%) |
| 1 or 2 Children | 1,209 (100.0%) | 0 (0.0%) |
| 3 or 4 Children | 331 (94.8%) | 18 (5.2%) |
| 5 or more Children | 2 (100.0%) | 0 (0.0%) |
| Total | 3,045 (97.9%) | 65 (2.1%) |
Income Below Poverty Among Single-Parent Households in Channahon
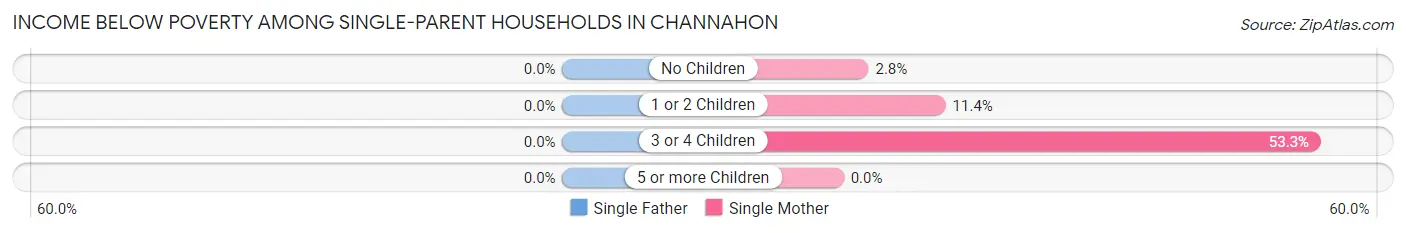
| Children | Single Father | Single Mother |
| No Children | 0 (0.0%) | 3 (2.8%) |
| 1 or 2 Children | 0 (0.0%) | 22 (11.4%) |
| 3 or 4 Children | 0 (0.0%) | 8 (53.3%) |
| 5 or more Children | 0 (0.0%) | 0 (0.0%) |
| Total | 0 (0.0%) | 33 (10.4%) |
Income Below Poverty Among Married-Couple vs Single-Parent Households in Channahon
The poverty data for Channahon shows that 65 of the married-couple family households (2.1%) and 33 of the single-parent households (6.6%) are living below the poverty level. Within the married-couple family households, those with 3 or 4 children have the highest poverty rate, with 18 households (5.2%) falling below the poverty line. Among the single-parent households, those with 3 or 4 children have the highest poverty rate, with 8 household (20.5%) living below poverty.
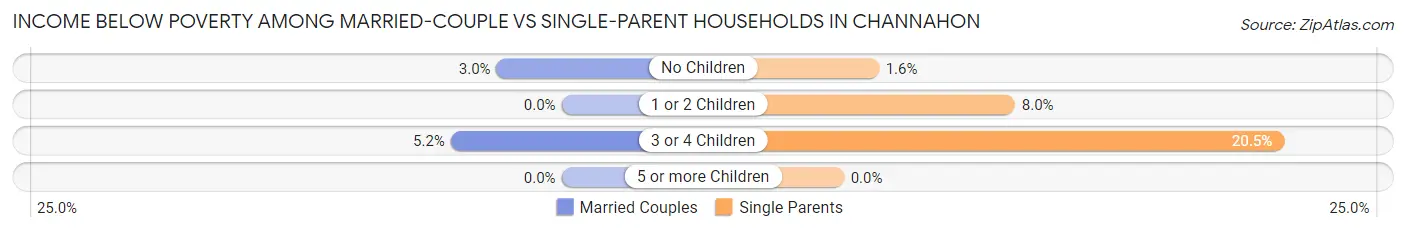
| Children | Married-Couple Families | Single-Parent Households |
| No Children | 47 (3.0%) | 3 (1.6%) |
| 1 or 2 Children | 0 (0.0%) | 22 (8.0%) |
| 3 or 4 Children | 18 (5.2%) | 8 (20.5%) |
| 5 or more Children | 0 (0.0%) | 0 (0.0%) |
| Total | 65 (2.1%) | 33 (6.6%) |
Race in Channahon
The most populous races in Channahon are White / Caucasian (13,061 | 94.6%), Hispanic or Latino (1,626 | 11.8%), and Two or more Races (338 | 2.5%).
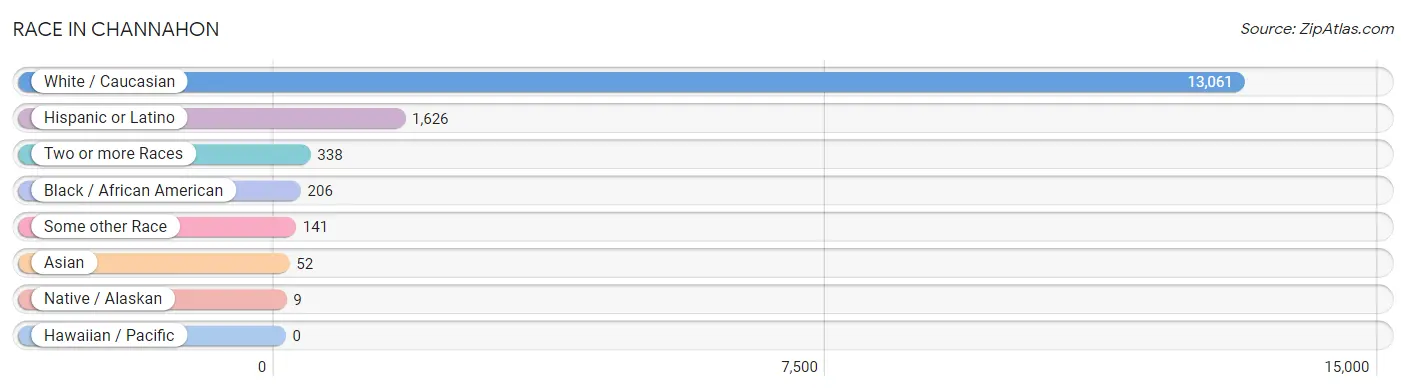
| Race | # Population | % Population |
| Asian | 52 | 0.4% |
| Black / African American | 206 | 1.5% |
| Hawaiian / Pacific | 0 | 0.0% |
| Hispanic or Latino | 1,626 | 11.8% |
| Native / Alaskan | 9 | 0.1% |
| White / Caucasian | 13,061 | 94.6% |
| Two or more Races | 338 | 2.5% |
| Some other Race | 141 | 1.0% |
| Total | 13,807 | 100.0% |
Ancestry in Channahon
The most populous ancestries reported in Channahon are German (3,147 | 22.8%), Irish (3,101 | 22.5%), Italian (2,114 | 15.3%), Polish (1,496 | 10.8%), and English (1,364 | 9.9%), together accounting for 81.3% of all Channahon residents.
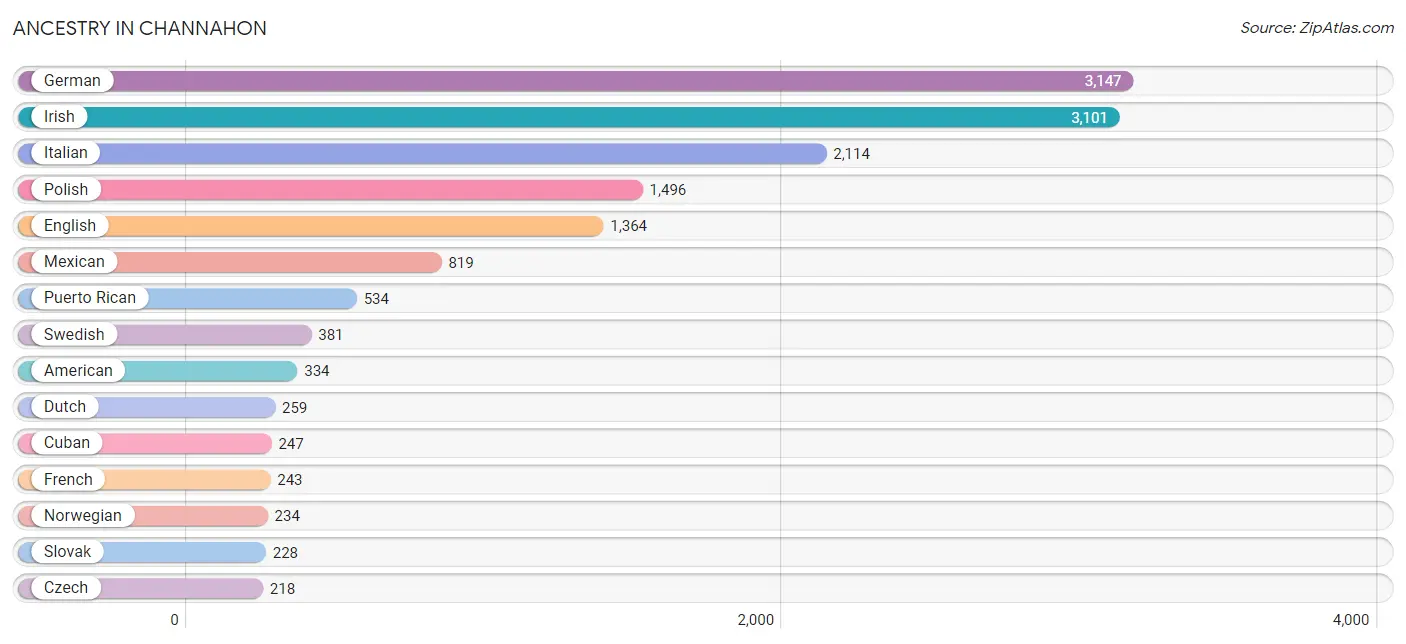
| Ancestry | # Population | % Population |
| American | 334 | 2.4% |
| Arab | 8 | 0.1% |
| Austrian | 45 | 0.3% |
| Bhutanese | 8 | 0.1% |
| Burmese | 19 | 0.1% |
| Canadian | 45 | 0.3% |
| Central American | 26 | 0.2% |
| Cherokee | 34 | 0.3% |
| Choctaw | 4 | 0.0% |
| Croatian | 118 | 0.9% |
| Cuban | 247 | 1.8% |
| Czech | 218 | 1.6% |
| Czechoslovakian | 38 | 0.3% |
| Danish | 23 | 0.2% |
| Dutch | 259 | 1.9% |
| Eastern European | 11 | 0.1% |
| English | 1,364 | 9.9% |
| European | 18 | 0.1% |
| Finnish | 7 | 0.1% |
| French | 243 | 1.8% |
| French Canadian | 27 | 0.2% |
| German | 3,147 | 22.8% |
| Greek | 87 | 0.6% |
| Guatemalan | 26 | 0.2% |
| Hungarian | 39 | 0.3% |
| Irish | 3,101 | 22.5% |
| Italian | 2,114 | 15.3% |
| Korean | 7 | 0.1% |
| Lithuanian | 201 | 1.5% |
| Luxembourger | 62 | 0.4% |
| Mexican | 819 | 5.9% |
| Norwegian | 234 | 1.7% |
| Pakistani | 138 | 1.0% |
| Polish | 1,496 | 10.8% |
| Portuguese | 7 | 0.1% |
| Puerto Rican | 534 | 3.9% |
| Romanian | 29 | 0.2% |
| Russian | 73 | 0.5% |
| Scandinavian | 46 | 0.3% |
| Scotch-Irish | 78 | 0.6% |
| Scottish | 59 | 0.4% |
| Serbian | 11 | 0.1% |
| Slavic | 26 | 0.2% |
| Slovak | 228 | 1.7% |
| Slovene | 38 | 0.3% |
| Swedish | 381 | 2.8% |
| Syrian | 8 | 0.1% |
| Thai | 52 | 0.4% |
| Ukrainian | 78 | 0.6% |
| Welsh | 65 | 0.5% |
| Yugoslavian | 12 | 0.1% | View All 51 Rows |
Immigrants in Channahon
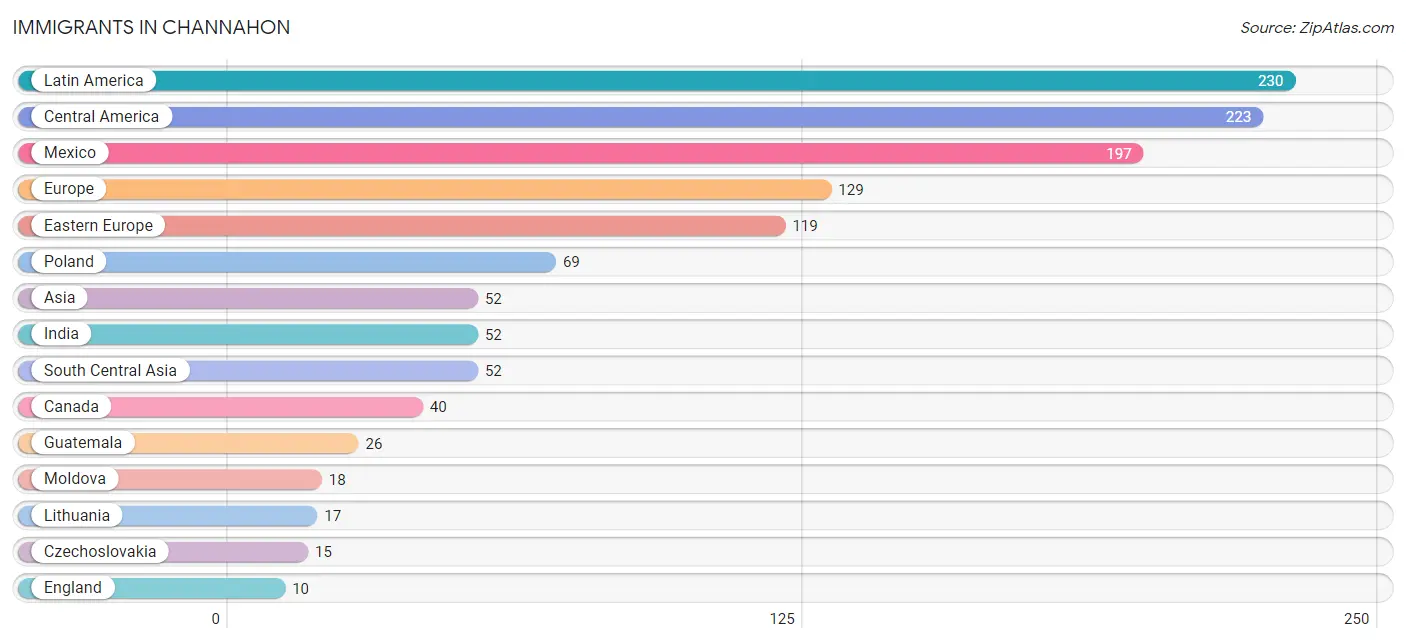
The most numerous immigrant groups reported in Channahon came from Latin America (230 | 1.7%), Central America (223 | 1.6%), Mexico (197 | 1.4%), Europe (129 | 0.9%), and Eastern Europe (119 | 0.9%), together accounting for 6.5% of all Channahon residents.
| Immigration Origin | # Population | % Population |
| Argentina | 7 | 0.1% |
| Asia | 52 | 0.4% |
| Canada | 40 | 0.3% |
| Central America | 223 | 1.6% |
| Czechoslovakia | 15 | 0.1% |
| Eastern Europe | 119 | 0.9% |
| England | 10 | 0.1% |
| Europe | 129 | 0.9% |
| Guatemala | 26 | 0.2% |
| India | 52 | 0.4% |
| Latin America | 230 | 1.7% |
| Lithuania | 17 | 0.1% |
| Mexico | 197 | 1.4% |
| Moldova | 18 | 0.1% |
| Northern Europe | 10 | 0.1% |
| Poland | 69 | 0.5% |
| South America | 7 | 0.1% |
| South Central Asia | 52 | 0.4% | View All 18 Rows |
Sex and Age in Channahon
Sex and Age in Channahon
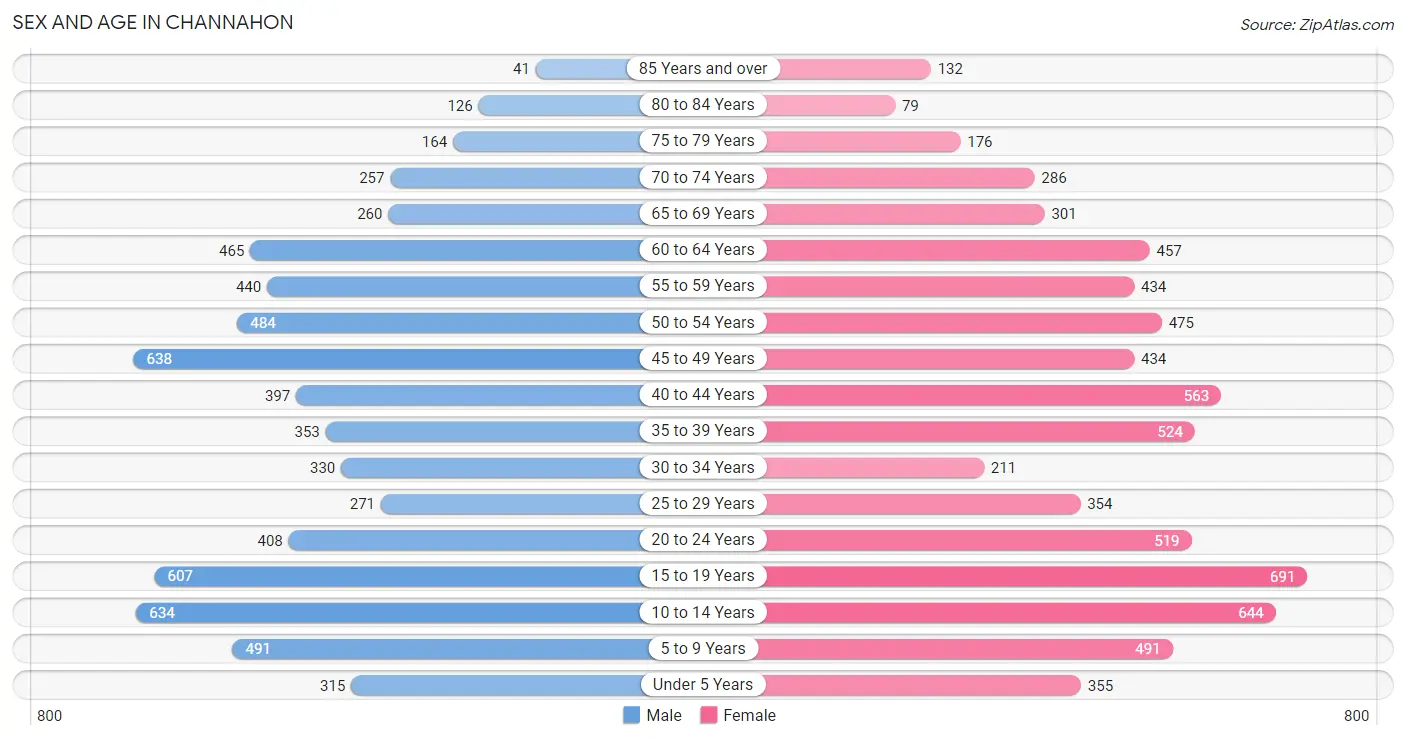
The most populous age groups in Channahon are 45 to 49 Years (638 | 9.6%) for men and 15 to 19 Years (691 | 9.7%) for women.
| Age Bracket | Male | Female |
| Under 5 Years | 315 (4.7%) | 355 (5.0%) |
| 5 to 9 Years | 491 (7.3%) | 491 (6.9%) |
| 10 to 14 Years | 634 (9.5%) | 644 (9.0%) |
| 15 to 19 Years | 607 (9.1%) | 691 (9.7%) |
| 20 to 24 Years | 408 (6.1%) | 519 (7.3%) |
| 25 to 29 Years | 271 (4.1%) | 354 (5.0%) |
| 30 to 34 Years | 330 (4.9%) | 211 (3.0%) |
| 35 to 39 Years | 353 (5.3%) | 524 (7.3%) |
| 40 to 44 Years | 397 (5.9%) | 563 (7.9%) |
| 45 to 49 Years | 638 (9.6%) | 434 (6.1%) |
| 50 to 54 Years | 484 (7.2%) | 475 (6.7%) |
| 55 to 59 Years | 440 (6.6%) | 434 (6.1%) |
| 60 to 64 Years | 465 (7.0%) | 457 (6.4%) |
| 65 to 69 Years | 260 (3.9%) | 301 (4.2%) |
| 70 to 74 Years | 257 (3.8%) | 286 (4.0%) |
| 75 to 79 Years | 164 (2.5%) | 176 (2.5%) |
| 80 to 84 Years | 126 (1.9%) | 79 (1.1%) |
| 85 Years and over | 41 (0.6%) | 132 (1.8%) |
| Total | 6,681 (100.0%) | 7,126 (100.0%) |
Families and Households in Channahon
Median Family Size in Channahon
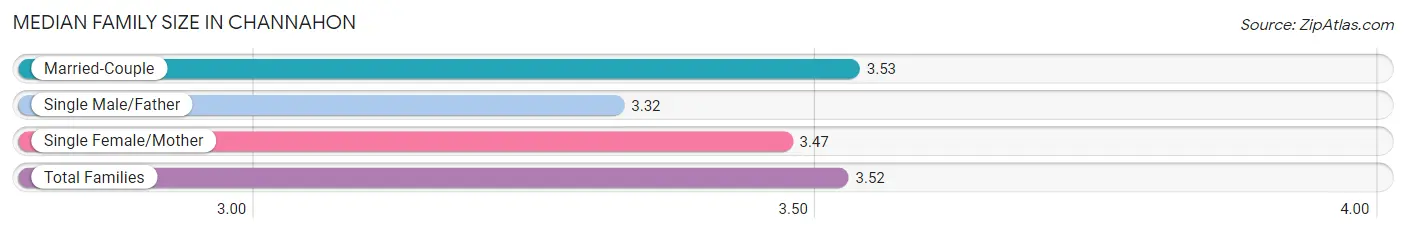
The median family size in Channahon is 3.52 persons per family, with married-couple families (3,110 | 86.2%) accounting for the largest median family size of 3.53 persons per family. On the other hand, single male/father families (183 | 5.1%) represent the smallest median family size with 3.32 persons per family.
| Family Type | # Families | Family Size |
| Married-Couple | 3,110 (86.2%) | 3.53 |
| Single Male/Father | 183 (5.1%) | 3.32 |
| Single Female/Mother | 316 (8.8%) | 3.47 |
| Total Families | 3,609 (100.0%) | 3.52 |
Median Household Size in Channahon
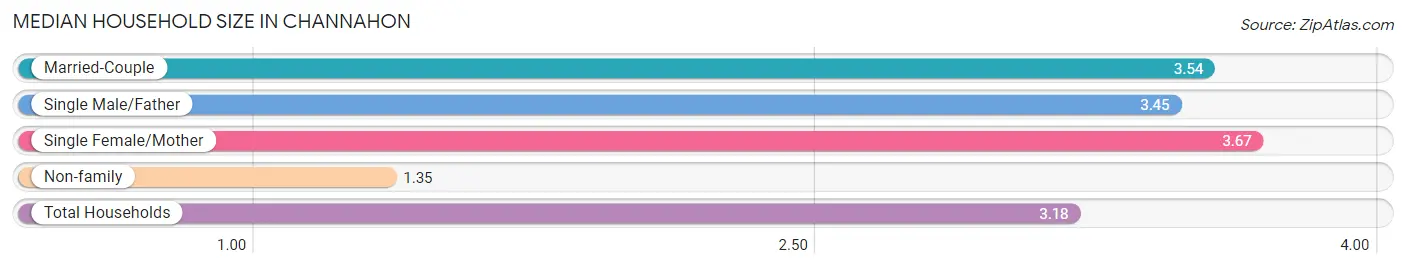
The median household size in Channahon is 3.18 persons per household, with single female/mother households (316 | 7.3%) accounting for the largest median household size of 3.67 persons per household. non-family households (738 | 17.0%) represent the smallest median household size with 1.35 persons per household.
| Household Type | # Households | Household Size |
| Married-Couple | 3,110 (71.5%) | 3.54 |
| Single Male/Father | 183 (4.2%) | 3.45 |
| Single Female/Mother | 316 (7.3%) | 3.67 |
| Non-family | 738 (17.0%) | 1.35 |
| Total Households | 4,347 (100.0%) | 3.18 |
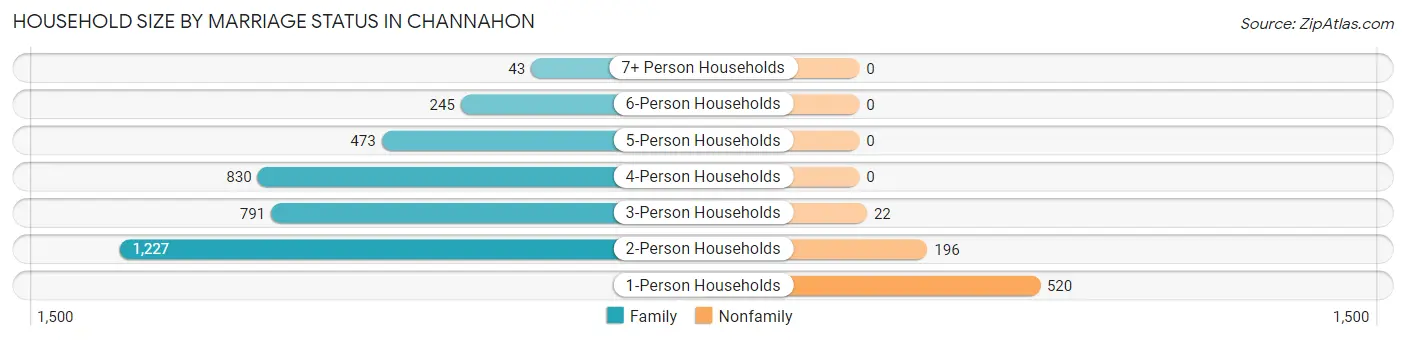
Household Size by Marriage Status in Channahon
Out of a total of 4,347 households in Channahon, 3,609 (83.0%) are family households, while 738 (17.0%) are nonfamily households. The most numerous type of family households are 2-person households, comprising 1,227, and the most common type of nonfamily households are 1-person households, comprising 520.
| Household Size | Family Households | Nonfamily Households |
| 1-Person Households | - | 520 (12.0%) |
| 2-Person Households | 1,227 (28.2%) | 196 (4.5%) |
| 3-Person Households | 791 (18.2%) | 22 (0.5%) |
| 4-Person Households | 830 (19.1%) | 0 (0.0%) |
| 5-Person Households | 473 (10.9%) | 0 (0.0%) |
| 6-Person Households | 245 (5.6%) | 0 (0.0%) |
| 7+ Person Households | 43 (1.0%) | 0 (0.0%) |
| Total | 3,609 (83.0%) | 738 (17.0%) |
Female Fertility in Channahon
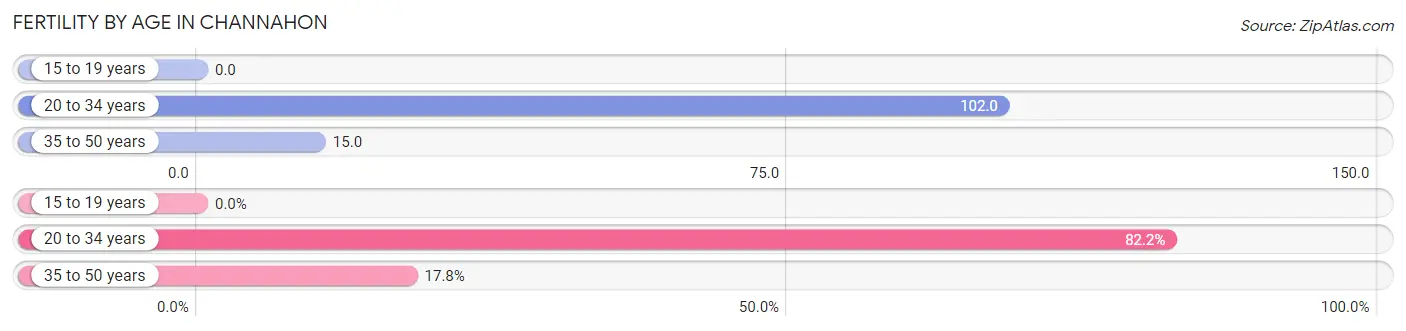
Fertility by Age in Channahon
Average fertility rate in Channahon is 40.0 births per 1,000 women. Women in the age bracket of 20 to 34 years have the highest fertility rate with 102.0 births per 1,000 women. Women in the age bracket of 20 to 34 years acount for 82.2% of all women with births.
| Age Bracket | Women with Births | Births / 1,000 Women |
| 15 to 19 years | 0 (0.0%) | 0.0 |
| 20 to 34 years | 111 (82.2%) | 102.0 |
| 35 to 50 years | 24 (17.8%) | 15.0 |
| Total | 135 (100.0%) | 40.0 |
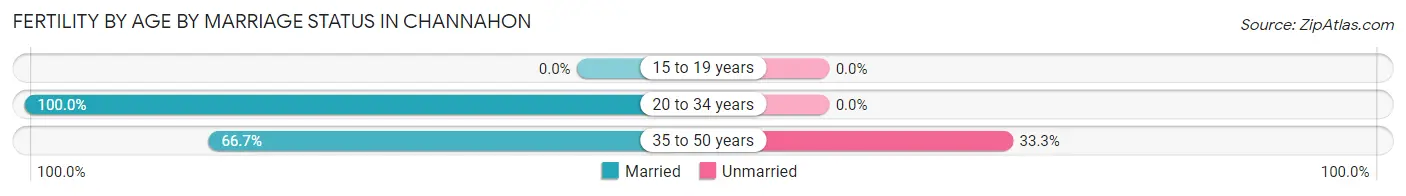
Fertility by Age by Marriage Status in Channahon
94.1% of women with births (135) in Channahon are married. The highest percentage of unmarried women with births falls into 35 to 50 years age bracket with 33.3% of them unmarried at the time of birth, while the lowest percentage of unmarried women with births belong to 20 to 34 years age bracket with 0.0% of them unmarried.
| Age Bracket | Married | Unmarried |
| 15 to 19 years | 0 (0.0%) | 0 (0.0%) |
| 20 to 34 years | 111 (100.0%) | 0 (0.0%) |
| 35 to 50 years | 16 (66.7%) | 8 (33.3%) |
| Total | 127 (94.1%) | 8 (5.9%) |
Fertility by Education in Channahon
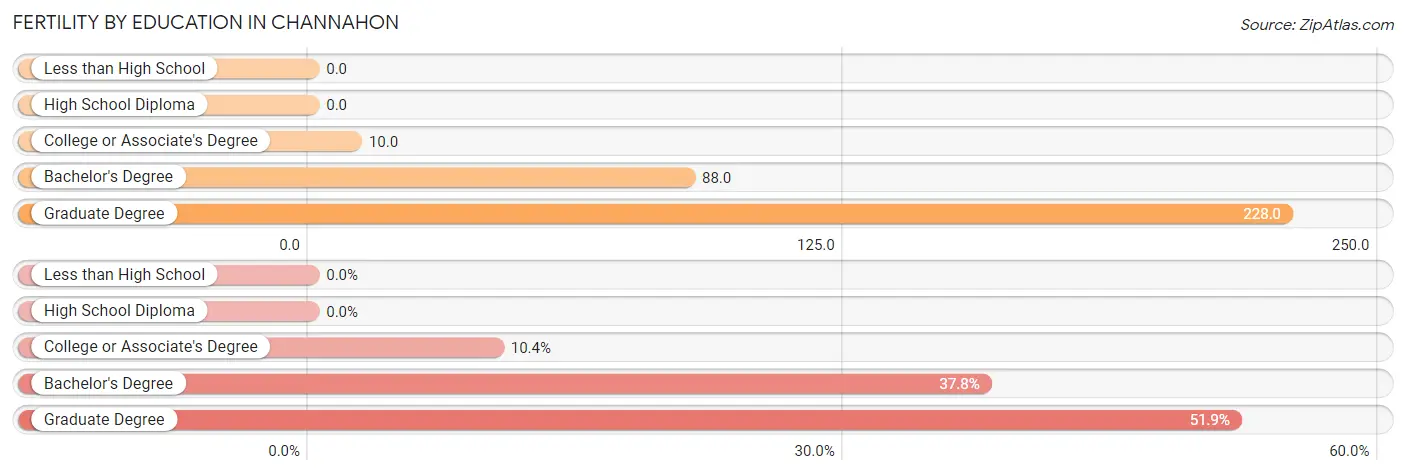
| Educational Attainment | Women with Births | Births / 1,000 Women |
| Less than High School | 0 (0.0%) | 0.0 |
| High School Diploma | 0 (0.0%) | 0.0 |
| College or Associate's Degree | 14 (10.4%) | 10.0 |
| Bachelor's Degree | 51 (37.8%) | 88.0 |
| Graduate Degree | 70 (51.8%) | 228.0 |
| Total | 135 (100.0%) | 40.0 |
Fertility by Education by Marriage Status in Channahon
5.9% of women with births in Channahon are unmarried. Women with the educational attainment of college or associate's degree are most likely to be married with 100.0% of them married at childbirth, while women with the educational attainment of bachelor's degree are least likely to be married with 15.7% of them unmarried at childbirth.
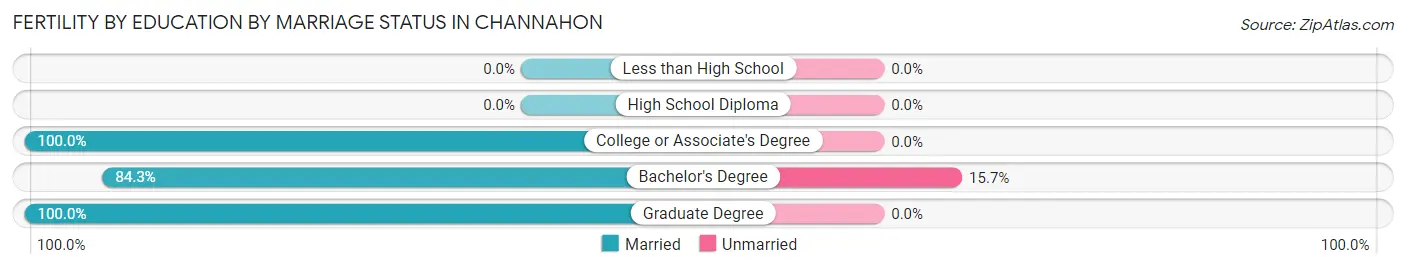
| Educational Attainment | Married | Unmarried |
| Less than High School | 0 (0.0%) | 0 (0.0%) |
| High School Diploma | 0 (0.0%) | 0 (0.0%) |
| College or Associate's Degree | 14 (100.0%) | 0 (0.0%) |
| Bachelor's Degree | 43 (84.3%) | 8 (15.7%) |
| Graduate Degree | 70 (100.0%) | 0 (0.0%) |
| Total | 127 (94.1%) | 8 (5.9%) |
Employment Characteristics in Channahon
Employment by Class of Employer in Channahon
Among the 6,779 employed individuals in Channahon, private company employees (5,231 | 77.2%), local government employees (676 | 10.0%), and not-for-profit organizations (345 | 5.1%) make up the most common classes of employment.
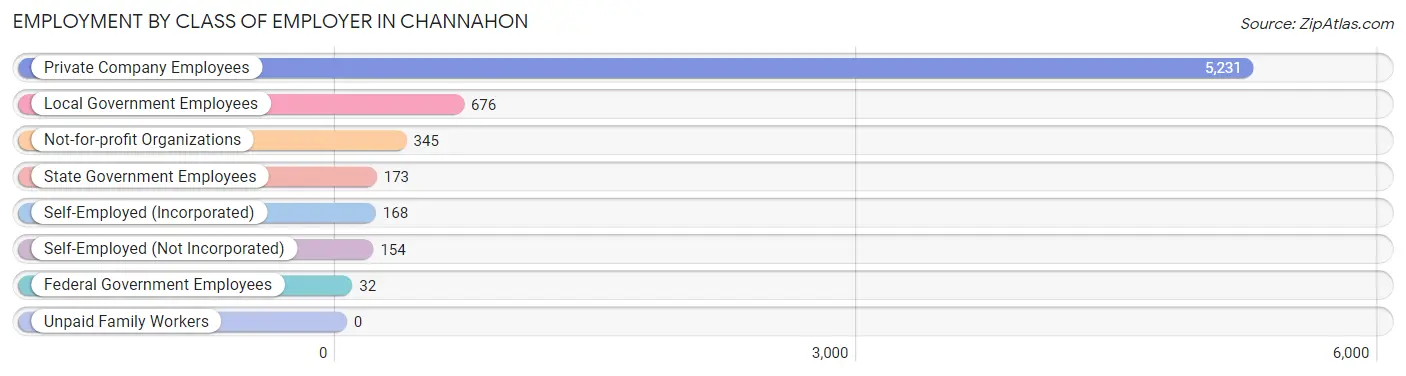
| Employer Class | # Employees | % Employees |
| Private Company Employees | 5,231 | 77.2% |
| Self-Employed (Incorporated) | 168 | 2.5% |
| Self-Employed (Not Incorporated) | 154 | 2.3% |
| Not-for-profit Organizations | 345 | 5.1% |
| Local Government Employees | 676 | 10.0% |
| State Government Employees | 173 | 2.5% |
| Federal Government Employees | 32 | 0.5% |
| Unpaid Family Workers | 0 | 0.0% |
| Total | 6,779 | 100.0% |
Employment Status by Age in Channahon
According to the labor force statistics for Channahon, out of the total population over 16 years of age (10,588), 70.2% or 7,433 individuals are in the labor force, with 8.0% or 595 of them unemployed. The age group with the highest labor force participation rate is 35 to 44 years, with 89.6% or 1,646 individuals in the labor force. Within the labor force, the 75 years and over age range has the highest percentage of unemployed individuals, with 29.8% or 17 of them being unemployed.
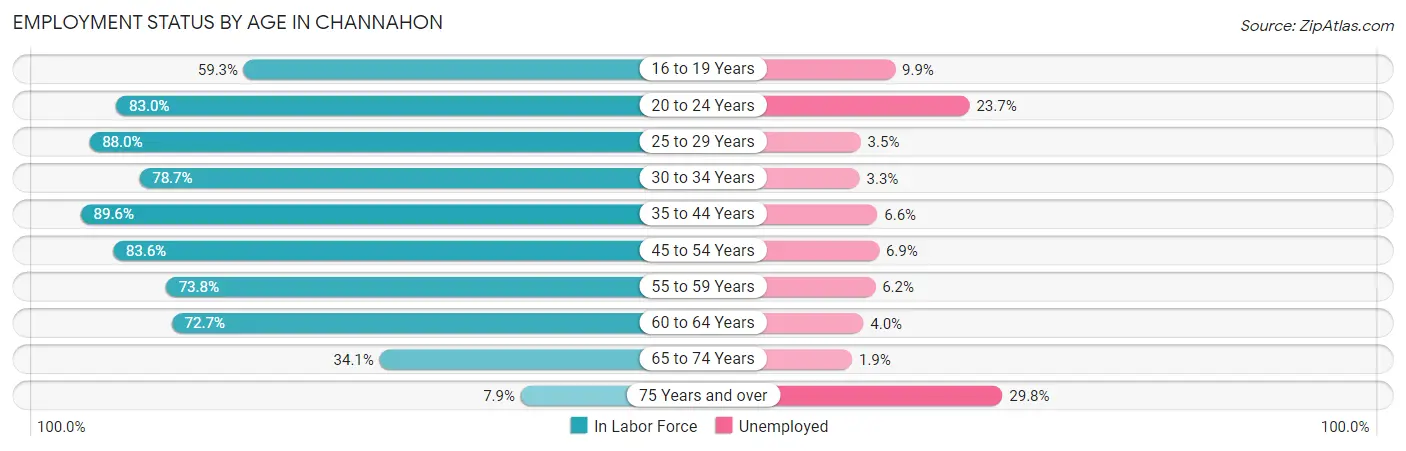
| Age Bracket | In Labor Force | Unemployed |
| 16 to 19 Years | 598 (59.3%) | 59 (9.9%) |
| 20 to 24 Years | 769 (83.0%) | 182 (23.7%) |
| 25 to 29 Years | 550 (88.0%) | 19 (3.5%) |
| 30 to 34 Years | 426 (78.7%) | 14 (3.3%) |
| 35 to 44 Years | 1,646 (89.6%) | 109 (6.6%) |
| 45 to 54 Years | 1,698 (83.6%) | 117 (6.9%) |
| 55 to 59 Years | 645 (73.8%) | 40 (6.2%) |
| 60 to 64 Years | 670 (72.7%) | 27 (4.0%) |
| 65 to 74 Years | 376 (34.1%) | 7 (1.9%) |
| 75 Years and over | 57 (7.9%) | 17 (29.8%) |
| Total | 7,433 (70.2%) | 595 (8.0%) |
Employment Status by Educational Attainment in Channahon
According to labor force statistics for Channahon, 82.5% of individuals (5,635) out of the total population between 25 and 64 years of age (6,830) are in the labor force, with 5.8% or 327 of them being unemployed. The group with the highest labor force participation rate are those with the educational attainment of bachelor's degree or higher, with 89.1% or 2,109 individuals in the labor force. Within the labor force, individuals with high school diploma education have the highest percentage of unemployment, with 12.4% or 154 of them being unemployed.
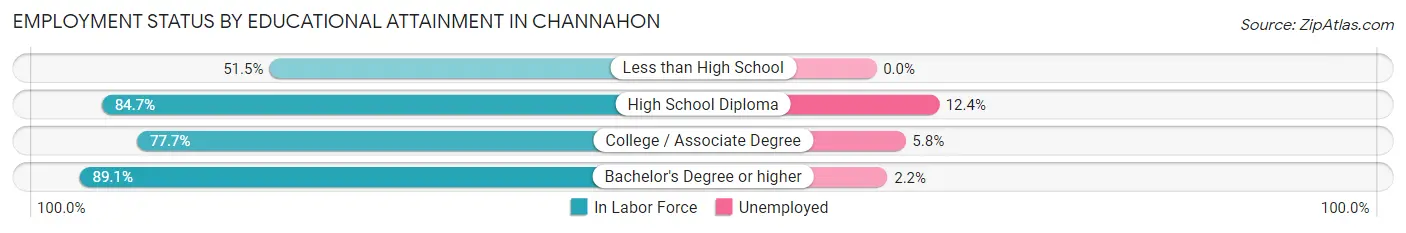
| Educational Attainment | In Labor Force | Unemployed |
| Less than High School | 86 (51.5%) | 0 (0.0%) |
| High School Diploma | 1,240 (84.7%) | 182 (12.4%) |
| College / Associate Degree | 2,200 (77.7%) | 164 (5.8%) |
| Bachelor's Degree or higher | 2,109 (89.1%) | 52 (2.2%) |
| Total | 5,635 (82.5%) | 396 (5.8%) |
Employment Occupations by Sex in Channahon
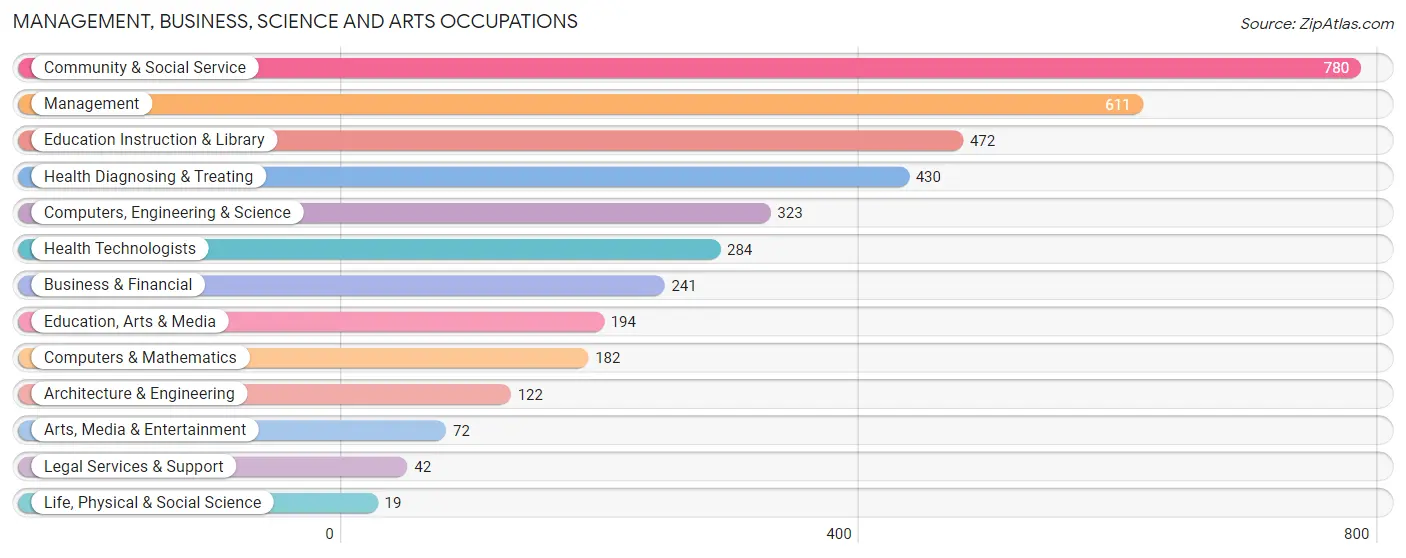
Management, Business, Science and Arts Occupations
The most common Management, Business, Science and Arts occupations in Channahon are Community & Social Service (780 | 11.4%), Management (611 | 8.9%), Education Instruction & Library (472 | 6.9%), Health Diagnosing & Treating (430 | 6.3%), and Computers, Engineering & Science (323 | 4.7%).
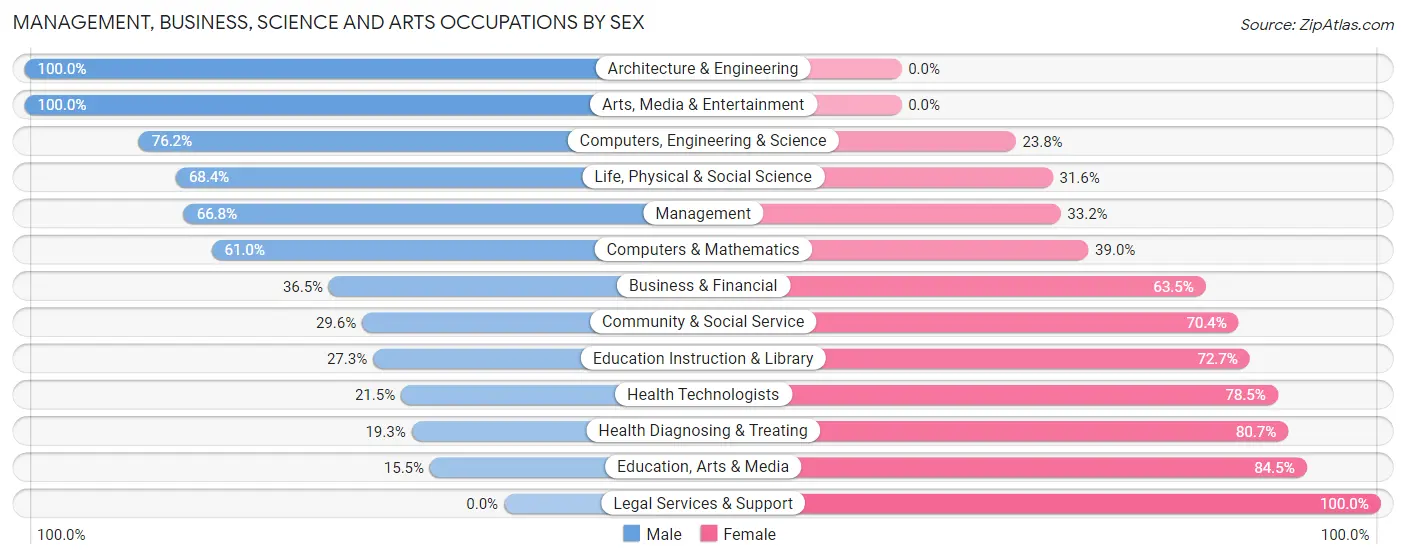
Management, Business, Science and Arts Occupations by Sex
Within the Management, Business, Science and Arts occupations in Channahon, the most male-oriented occupations are Architecture & Engineering (100.0%), Arts, Media & Entertainment (100.0%), and Computers, Engineering & Science (76.2%), while the most female-oriented occupations are Legal Services & Support (100.0%), Education, Arts & Media (84.5%), and Health Diagnosing & Treating (80.7%).
| Occupation | Male | Female |
| Management | 408 (66.8%) | 203 (33.2%) |
| Business & Financial | 88 (36.5%) | 153 (63.5%) |
| Computers, Engineering & Science | 246 (76.2%) | 77 (23.8%) |
| Computers & Mathematics | 111 (61.0%) | 71 (39.0%) |
| Architecture & Engineering | 122 (100.0%) | 0 (0.0%) |
| Life, Physical & Social Science | 13 (68.4%) | 6 (31.6%) |
| Community & Social Service | 231 (29.6%) | 549 (70.4%) |
| Education, Arts & Media | 30 (15.5%) | 164 (84.5%) |
| Legal Services & Support | 0 (0.0%) | 42 (100.0%) |
| Education Instruction & Library | 129 (27.3%) | 343 (72.7%) |
| Arts, Media & Entertainment | 72 (100.0%) | 0 (0.0%) |
| Health Diagnosing & Treating | 83 (19.3%) | 347 (80.7%) |
| Health Technologists | 61 (21.5%) | 223 (78.5%) |
| Total (Category) | 1,056 (44.3%) | 1,329 (55.7%) |
| Total (Overall) | 3,601 (52.6%) | 3,242 (47.4%) |
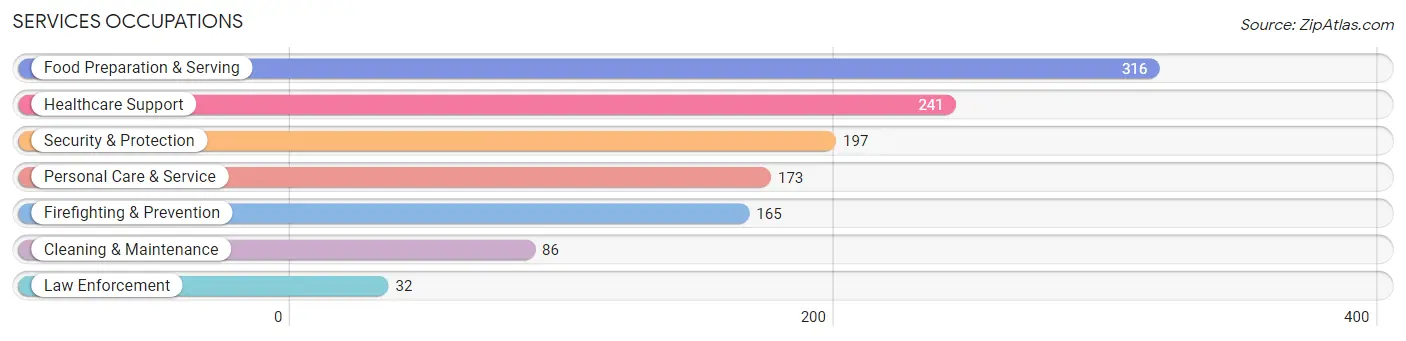
Services Occupations
The most common Services occupations in Channahon are Food Preparation & Serving (316 | 4.6%), Healthcare Support (241 | 3.5%), Security & Protection (197 | 2.9%), Personal Care & Service (173 | 2.5%), and Firefighting & Prevention (165 | 2.4%).
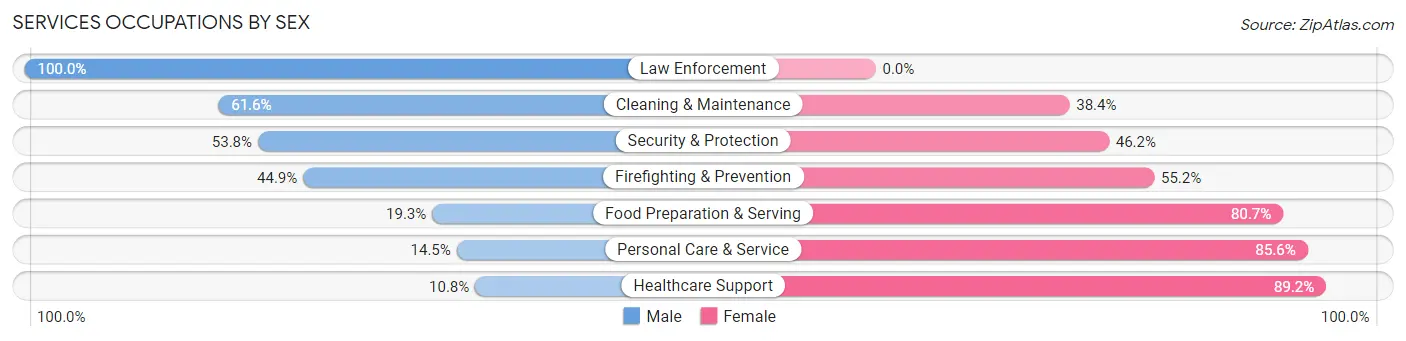
Services Occupations by Sex
Within the Services occupations in Channahon, the most male-oriented occupations are Law Enforcement (100.0%), Cleaning & Maintenance (61.6%), and Security & Protection (53.8%), while the most female-oriented occupations are Healthcare Support (89.2%), Personal Care & Service (85.6%), and Food Preparation & Serving (80.7%).
| Occupation | Male | Female |
| Healthcare Support | 26 (10.8%) | 215 (89.2%) |
| Security & Protection | 106 (53.8%) | 91 (46.2%) |
| Firefighting & Prevention | 74 (44.9%) | 91 (55.1%) |
| Law Enforcement | 32 (100.0%) | 0 (0.0%) |
| Food Preparation & Serving | 61 (19.3%) | 255 (80.7%) |
| Cleaning & Maintenance | 53 (61.6%) | 33 (38.4%) |
| Personal Care & Service | 25 (14.4%) | 148 (85.6%) |
| Total (Category) | 271 (26.8%) | 742 (73.3%) |
| Total (Overall) | 3,601 (52.6%) | 3,242 (47.4%) |
Sales and Office Occupations
The most common Sales and Office occupations in Channahon are Sales & Related (1,026 | 15.0%), and Office & Administration (698 | 10.2%).
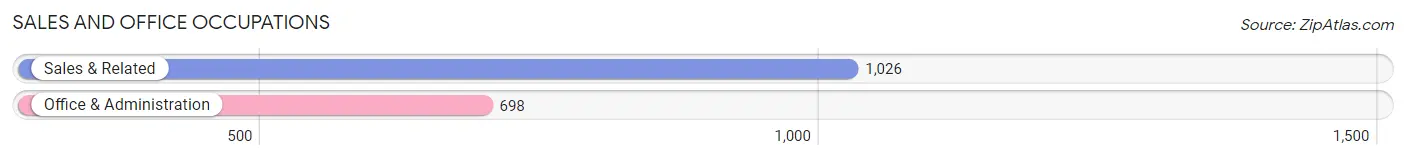
Sales and Office Occupations by Sex

| Occupation | Male | Female |
| Sales & Related | 670 (65.3%) | 356 (34.7%) |
| Office & Administration | 105 (15.0%) | 593 (85.0%) |
| Total (Category) | 775 (45.0%) | 949 (55.0%) |
| Total (Overall) | 3,601 (52.6%) | 3,242 (47.4%) |
Natural Resources, Construction and Maintenance Occupations
The most common Natural Resources, Construction and Maintenance occupations in Channahon are Construction & Extraction (427 | 6.2%), and Installation, Maintenance & Repair (199 | 2.9%).
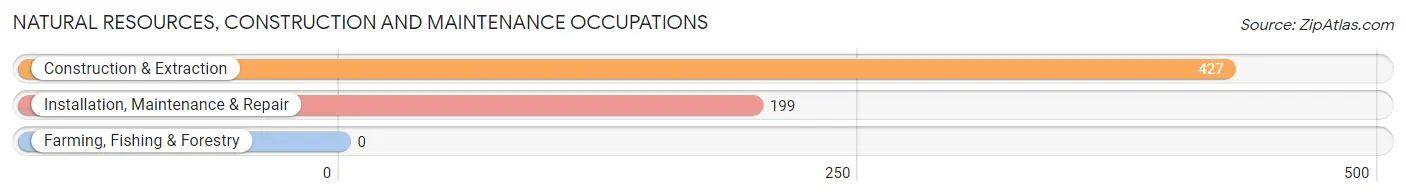
Natural Resources, Construction and Maintenance Occupations by Sex
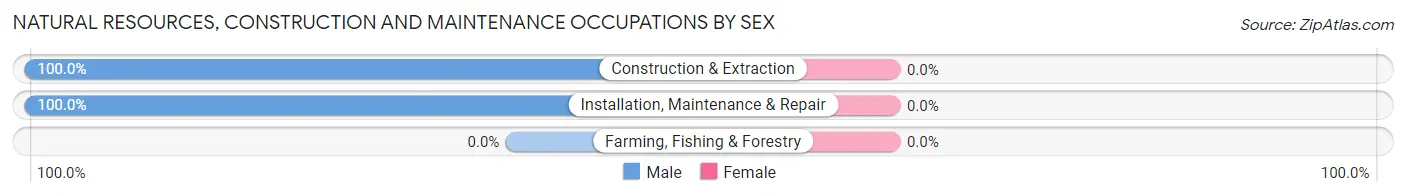
| Occupation | Male | Female |
| Farming, Fishing & Forestry | 0 (0.0%) | 0 (0.0%) |
| Construction & Extraction | 427 (100.0%) | 0 (0.0%) |
| Installation, Maintenance & Repair | 199 (100.0%) | 0 (0.0%) |
| Total (Category) | 626 (100.0%) | 0 (0.0%) |
| Total (Overall) | 3,601 (52.6%) | 3,242 (47.4%) |
Production, Transportation and Moving Occupations
The most common Production, Transportation and Moving occupations in Channahon are Material Moving (406 | 5.9%), Production (392 | 5.7%), and Transportation (297 | 4.3%).
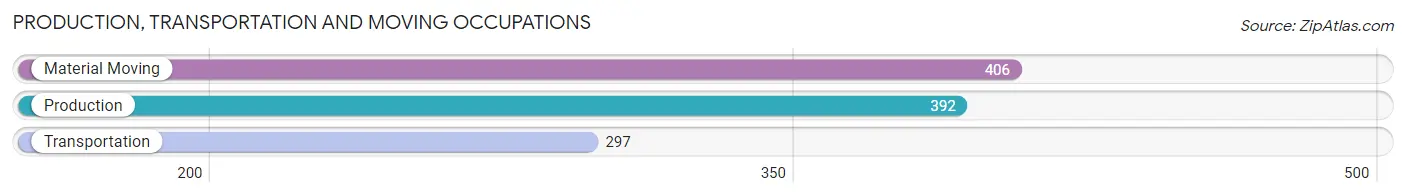
Production, Transportation and Moving Occupations by Sex
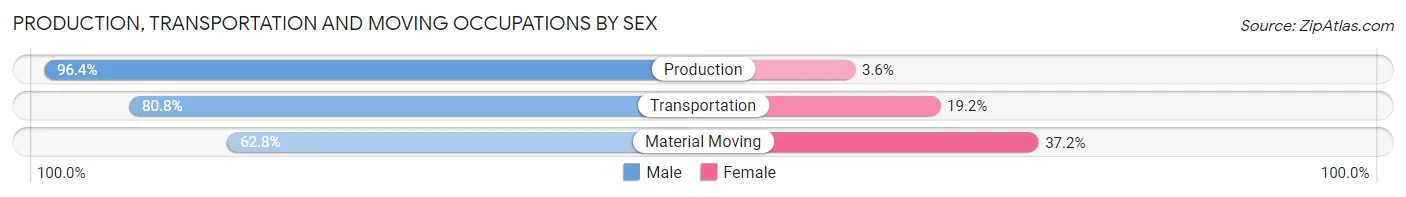
| Occupation | Male | Female |
| Production | 378 (96.4%) | 14 (3.6%) |
| Transportation | 240 (80.8%) | 57 (19.2%) |
| Material Moving | 255 (62.8%) | 151 (37.2%) |
| Total (Category) | 873 (79.7%) | 222 (20.3%) |
| Total (Overall) | 3,601 (52.6%) | 3,242 (47.4%) |
Employment Industries by Sex in Channahon
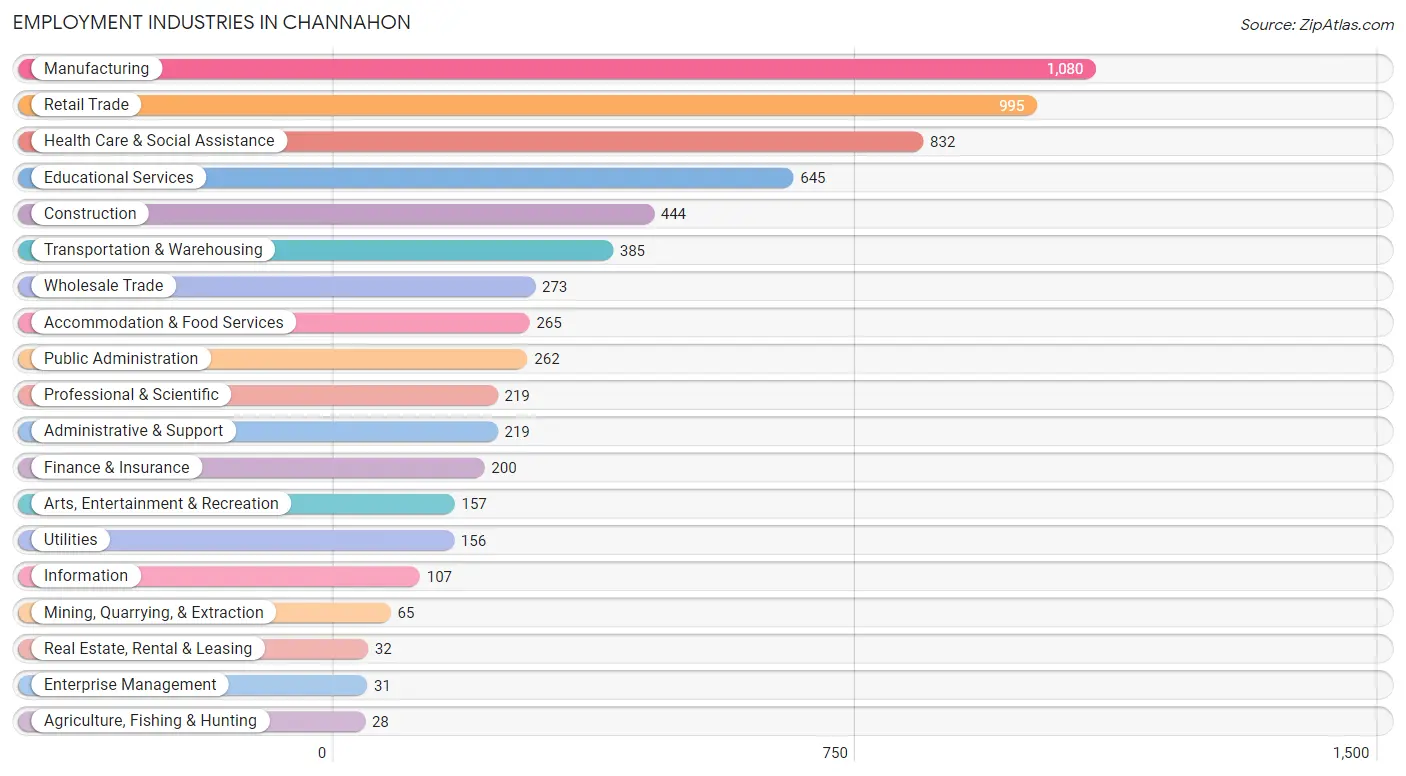
Employment Industries in Channahon
The major employment industries in Channahon include Manufacturing (1,080 | 15.8%), Retail Trade (995 | 14.5%), Health Care & Social Assistance (832 | 12.2%), Educational Services (645 | 9.4%), and Construction (444 | 6.5%).
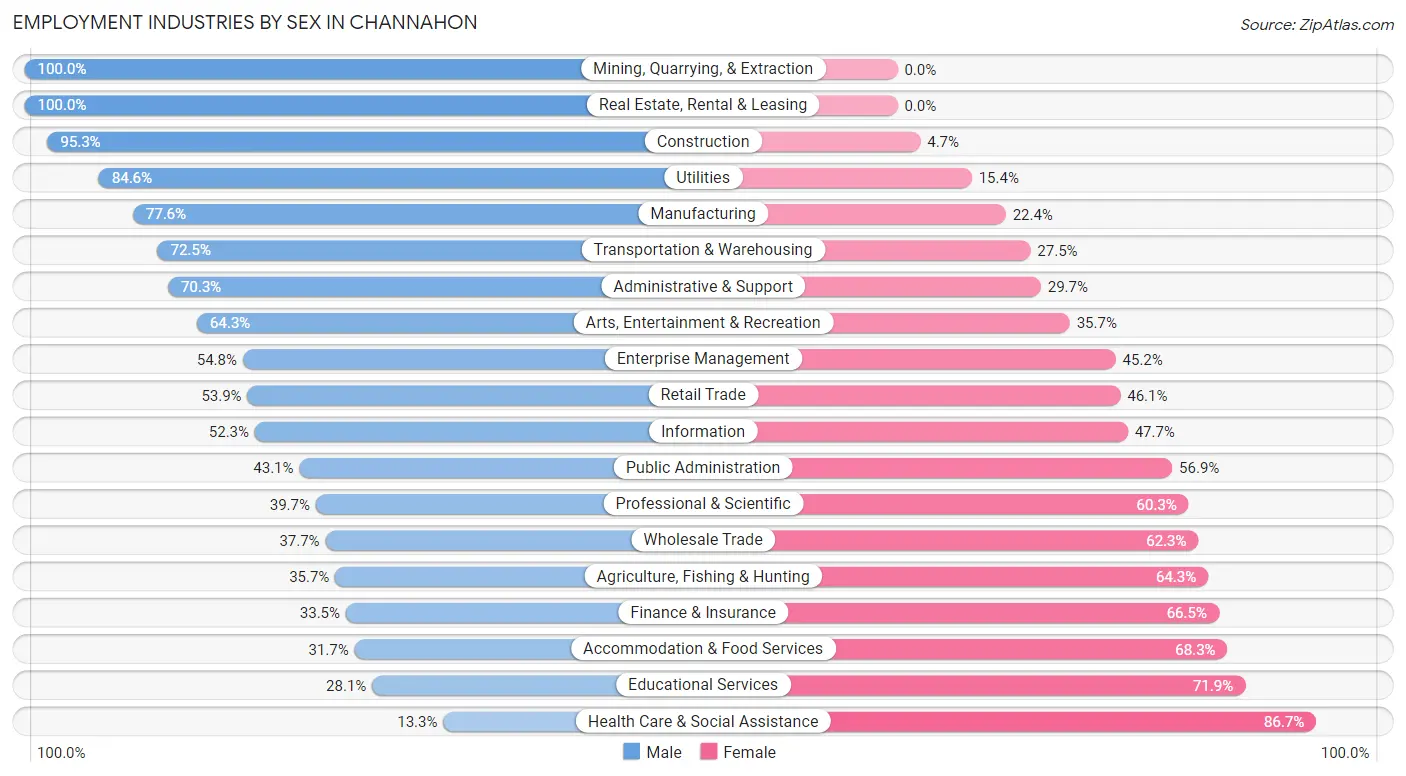
Employment Industries by Sex in Channahon
The Channahon industries that see more men than women are Mining, Quarrying, & Extraction (100.0%), Real Estate, Rental & Leasing (100.0%), and Construction (95.3%), whereas the industries that tend to have a higher number of women are Health Care & Social Assistance (86.7%), Educational Services (71.9%), and Accommodation & Food Services (68.3%).
| Industry | Male | Female |
| Agriculture, Fishing & Hunting | 10 (35.7%) | 18 (64.3%) |
| Mining, Quarrying, & Extraction | 65 (100.0%) | 0 (0.0%) |
| Construction | 423 (95.3%) | 21 (4.7%) |
| Manufacturing | 838 (77.6%) | 242 (22.4%) |
| Wholesale Trade | 103 (37.7%) | 170 (62.3%) |
| Retail Trade | 536 (53.9%) | 459 (46.1%) |
| Transportation & Warehousing | 279 (72.5%) | 106 (27.5%) |
| Utilities | 132 (84.6%) | 24 (15.4%) |
| Information | 56 (52.3%) | 51 (47.7%) |
| Finance & Insurance | 67 (33.5%) | 133 (66.5%) |
| Real Estate, Rental & Leasing | 32 (100.0%) | 0 (0.0%) |
| Professional & Scientific | 87 (39.7%) | 132 (60.3%) |
| Enterprise Management | 17 (54.8%) | 14 (45.2%) |
| Administrative & Support | 154 (70.3%) | 65 (29.7%) |
| Educational Services | 181 (28.1%) | 464 (71.9%) |
| Health Care & Social Assistance | 111 (13.3%) | 721 (86.7%) |
| Arts, Entertainment & Recreation | 101 (64.3%) | 56 (35.7%) |
| Accommodation & Food Services | 84 (31.7%) | 181 (68.3%) |
| Public Administration | 113 (43.1%) | 149 (56.9%) |
| Total | 3,601 (52.6%) | 3,242 (47.4%) |
Education in Channahon
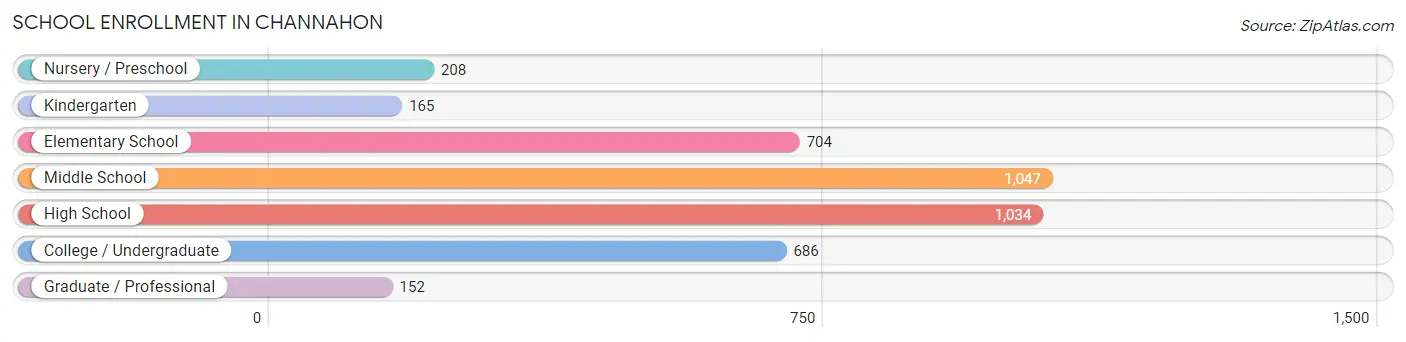
School Enrollment in Channahon
The most common levels of schooling among the 3,996 students in Channahon are middle school (1,047 | 26.2%), high school (1,034 | 25.9%), and elementary school (704 | 17.6%).
| School Level | # Students | % Students |
| Nursery / Preschool | 208 | 5.2% |
| Kindergarten | 165 | 4.1% |
| Elementary School | 704 | 17.6% |
| Middle School | 1,047 | 26.2% |
| High School | 1,034 | 25.9% |
| College / Undergraduate | 686 | 17.2% |
| Graduate / Professional | 152 | 3.8% |
| Total | 3,996 | 100.0% |
School Enrollment by Age by Funding Source in Channahon
Out of a total of 3,996 students who are enrolled in schools in Channahon, 511 (12.8%) attend a private institution, while the remaining 3,485 (87.2%) are enrolled in public schools. The age group of 35 years and over has the highest likelihood of being enrolled in private schools, with 59 (53.1% in the age bracket) enrolled. Conversely, the age group of 5 to 9 year old has the lowest likelihood of being enrolled in a private school, with 849 (95.6% in the age bracket) attending a public institution.
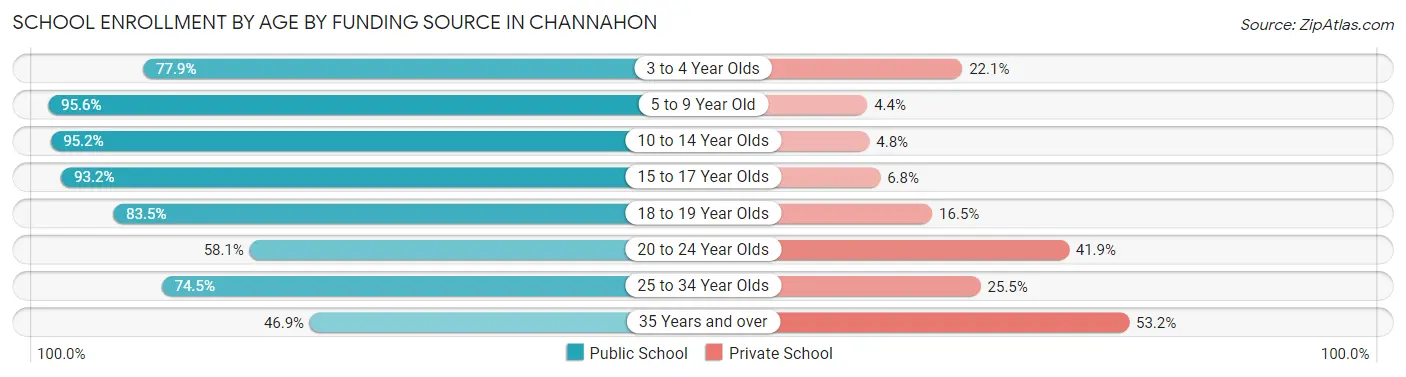
| Age Bracket | Public School | Private School |
| 3 to 4 Year Olds | 120 (77.9%) | 34 (22.1%) |
| 5 to 9 Year Old | 849 (95.6%) | 39 (4.4%) |
| 10 to 14 Year Olds | 1,155 (95.2%) | 58 (4.8%) |
| 15 to 17 Year Olds | 684 (93.2%) | 50 (6.8%) |
| 18 to 19 Year Olds | 294 (83.5%) | 58 (16.5%) |
| 20 to 24 Year Olds | 259 (58.1%) | 187 (41.9%) |
| 25 to 34 Year Olds | 73 (74.5%) | 25 (25.5%) |
| 35 Years and over | 52 (46.9%) | 59 (53.1%) |
| Total | 3,485 (87.2%) | 511 (12.8%) |
Educational Attainment by Field of Study in Channahon
Business (662 | 23.1%), education (421 | 14.7%), bio, nature & agricultural (391 | 13.7%), computers & mathematics (248 | 8.7%), and science & technology (185 | 6.5%) are the most common fields of study among 2,865 individuals in Channahon who have obtained a bachelor's degree or higher.
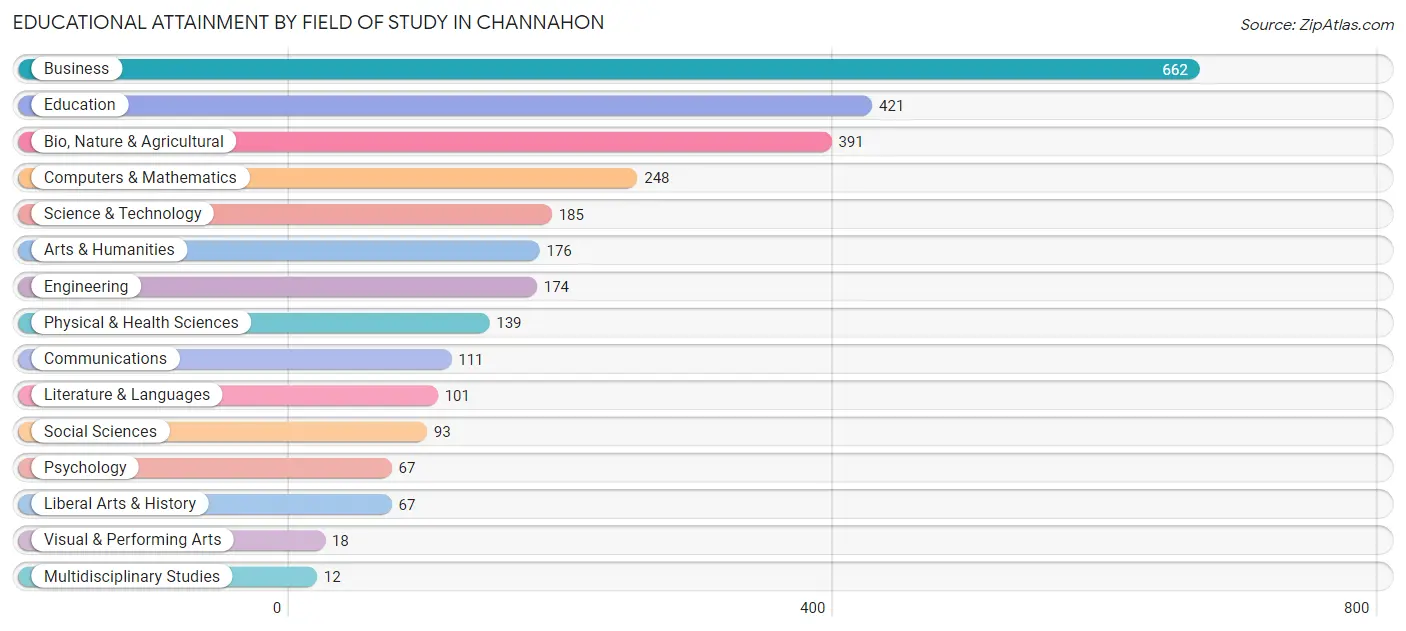
| Field of Study | # Graduates | % Graduates |
| Computers & Mathematics | 248 | 8.7% |
| Bio, Nature & Agricultural | 391 | 13.7% |
| Physical & Health Sciences | 139 | 4.9% |
| Psychology | 67 | 2.3% |
| Social Sciences | 93 | 3.3% |
| Engineering | 174 | 6.1% |
| Multidisciplinary Studies | 12 | 0.4% |
| Science & Technology | 185 | 6.5% |
| Business | 662 | 23.1% |
| Education | 421 | 14.7% |
| Literature & Languages | 101 | 3.5% |
| Liberal Arts & History | 67 | 2.3% |
| Visual & Performing Arts | 18 | 0.6% |
| Communications | 111 | 3.9% |
| Arts & Humanities | 176 | 6.1% |
| Total | 2,865 | 100.0% |
Transportation & Commute in Channahon
Vehicle Availability by Sex in Channahon
The most prevalent vehicle ownership categories in Channahon are males with 2 vehicles (1,302, accounting for 36.6%) and females with 2 vehicles (1,012, making up 40.4%).
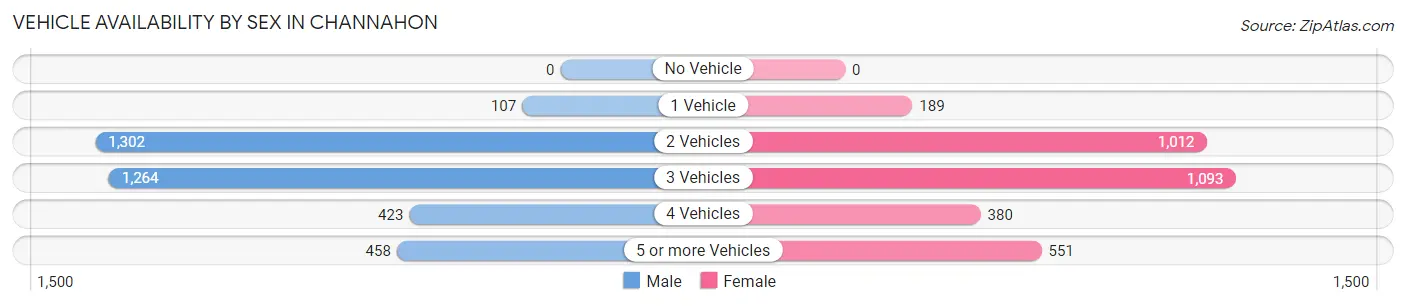
| Vehicles Available | Male | Female |
| No Vehicle | 0 (0.0%) | 0 (0.0%) |
| 1 Vehicle | 107 (3.0%) | 189 (5.9%) |
| 2 Vehicles | 1,302 (36.6%) | 1,012 (31.4%) |
| 3 Vehicles | 1,264 (35.6%) | 1,093 (33.9%) |
| 4 Vehicles | 423 (11.9%) | 380 (11.8%) |
| 5 or more Vehicles | 458 (12.9%) | 551 (17.1%) |
| Total | 3,554 (100.0%) | 3,225 (100.0%) |
Commute Time in Channahon
The most frequently occuring commute durations in Channahon are 20 to 24 minutes (766 commuters, 12.2%), 15 to 19 minutes (744 commuters, 11.8%), and 60 to 89 minutes (722 commuters, 11.5%).
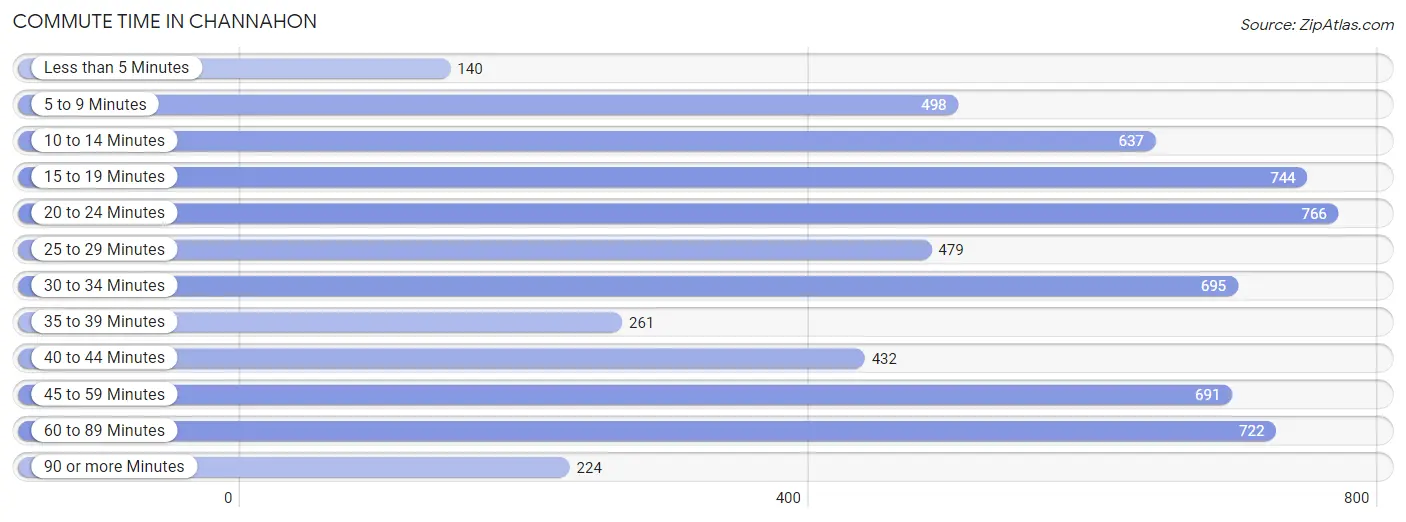
| Commute Time | # Commuters | % Commuters |
| Less than 5 Minutes | 140 | 2.2% |
| 5 to 9 Minutes | 498 | 7.9% |
| 10 to 14 Minutes | 637 | 10.1% |
| 15 to 19 Minutes | 744 | 11.8% |
| 20 to 24 Minutes | 766 | 12.2% |
| 25 to 29 Minutes | 479 | 7.6% |
| 30 to 34 Minutes | 695 | 11.1% |
| 35 to 39 Minutes | 261 | 4.2% |
| 40 to 44 Minutes | 432 | 6.9% |
| 45 to 59 Minutes | 691 | 11.0% |
| 60 to 89 Minutes | 722 | 11.5% |
| 90 or more Minutes | 224 | 3.6% |
Commute Time by Sex in Channahon
The most common commute times in Channahon are 60 to 89 minutes (527 commuters, 15.6%) for males and 20 to 24 minutes (450 commuters, 15.4%) for females.
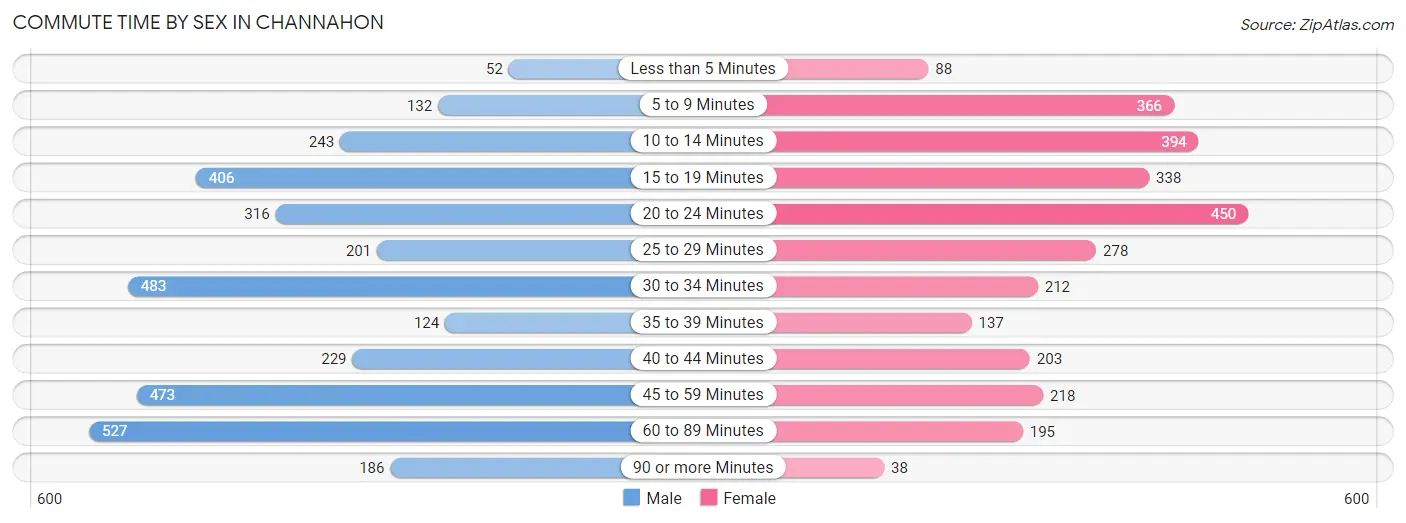
| Commute Time | Male | Female |
| Less than 5 Minutes | 52 (1.5%) | 88 (3.0%) |
| 5 to 9 Minutes | 132 (3.9%) | 366 (12.6%) |
| 10 to 14 Minutes | 243 (7.2%) | 394 (13.5%) |
| 15 to 19 Minutes | 406 (12.0%) | 338 (11.6%) |
| 20 to 24 Minutes | 316 (9.4%) | 450 (15.4%) |
| 25 to 29 Minutes | 201 (6.0%) | 278 (9.5%) |
| 30 to 34 Minutes | 483 (14.3%) | 212 (7.3%) |
| 35 to 39 Minutes | 124 (3.7%) | 137 (4.7%) |
| 40 to 44 Minutes | 229 (6.8%) | 203 (7.0%) |
| 45 to 59 Minutes | 473 (14.0%) | 218 (7.5%) |
| 60 to 89 Minutes | 527 (15.6%) | 195 (6.7%) |
| 90 or more Minutes | 186 (5.5%) | 38 (1.3%) |
Time of Departure to Work by Sex in Channahon
The most frequent times of departure to work in Channahon are 12:00 AM to 4:59 AM (447, 13.3%) for males and 7:00 AM to 7:29 AM (408, 14.0%) for females.
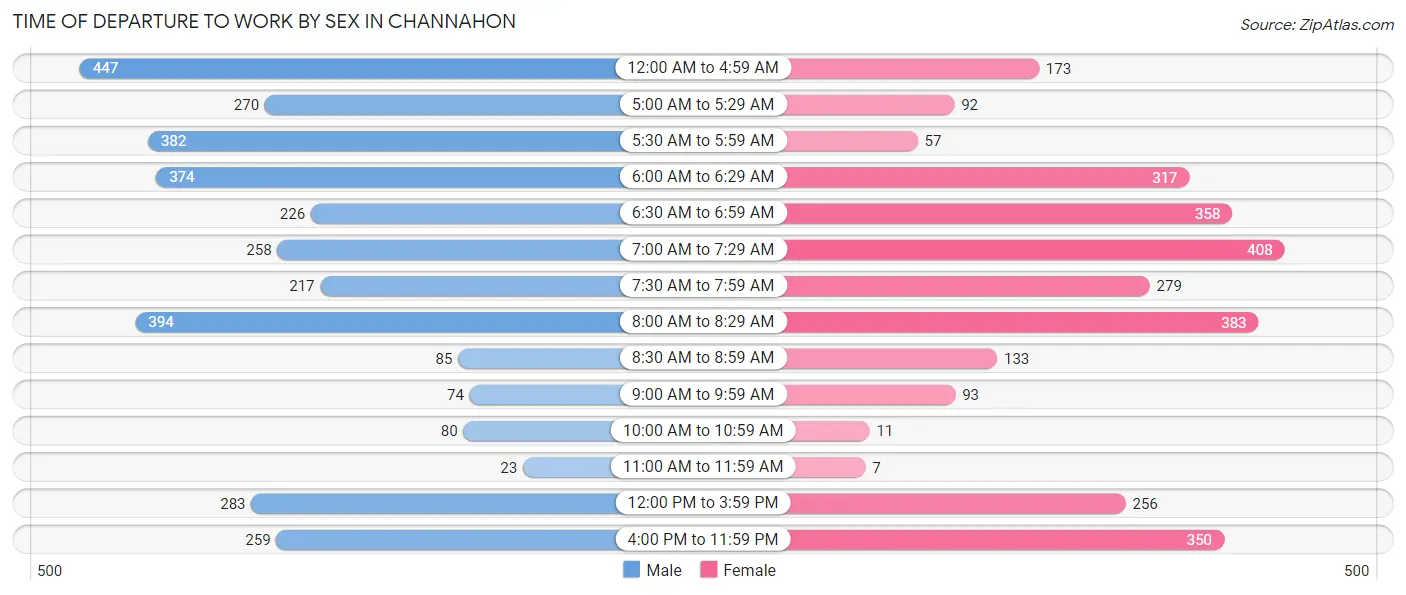
| Time of Departure | Male | Female |
| 12:00 AM to 4:59 AM | 447 (13.3%) | 173 (5.9%) |
| 5:00 AM to 5:29 AM | 270 (8.0%) | 92 (3.2%) |
| 5:30 AM to 5:59 AM | 382 (11.3%) | 57 (1.9%) |
| 6:00 AM to 6:29 AM | 374 (11.1%) | 317 (10.9%) |
| 6:30 AM to 6:59 AM | 226 (6.7%) | 358 (12.3%) |
| 7:00 AM to 7:29 AM | 258 (7.6%) | 408 (14.0%) |
| 7:30 AM to 7:59 AM | 217 (6.4%) | 279 (9.6%) |
| 8:00 AM to 8:29 AM | 394 (11.7%) | 383 (13.1%) |
| 8:30 AM to 8:59 AM | 85 (2.5%) | 133 (4.6%) |
| 9:00 AM to 9:59 AM | 74 (2.2%) | 93 (3.2%) |
| 10:00 AM to 10:59 AM | 80 (2.4%) | 11 (0.4%) |
| 11:00 AM to 11:59 AM | 23 (0.7%) | 7 (0.2%) |
| 12:00 PM to 3:59 PM | 283 (8.4%) | 256 (8.8%) |
| 4:00 PM to 11:59 PM | 259 (7.7%) | 350 (12.0%) |
| Total | 3,372 (100.0%) | 2,917 (100.0%) |
Housing Occupancy in Channahon
Occupancy by Ownership in Channahon
Of the total 4,347 dwellings in Channahon, owner-occupied units account for 3,869 (89.0%), while renter-occupied units make up 478 (11.0%).
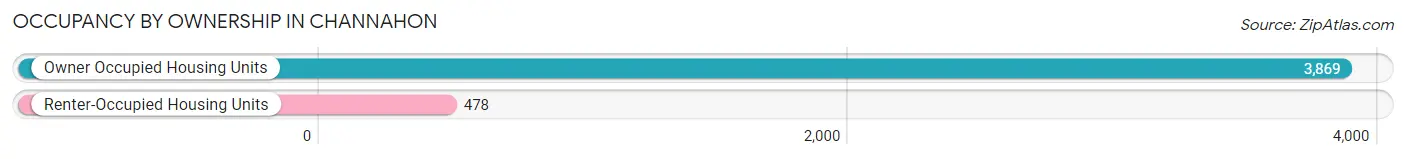
| Occupancy | # Housing Units | % Housing Units |
| Owner Occupied Housing Units | 3,869 | 89.0% |
| Renter-Occupied Housing Units | 478 | 11.0% |
| Total Occupied Housing Units | 4,347 | 100.0% |
Occupancy by Household Size in Channahon
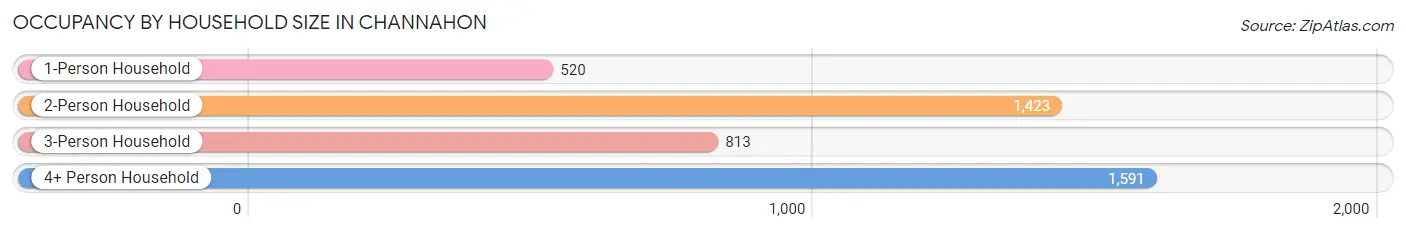
| Household Size | # Housing Units | % Housing Units |
| 1-Person Household | 520 | 12.0% |
| 2-Person Household | 1,423 | 32.7% |
| 3-Person Household | 813 | 18.7% |
| 4+ Person Household | 1,591 | 36.6% |
| Total Housing Units | 4,347 | 100.0% |
Occupancy by Ownership by Household Size in Channahon
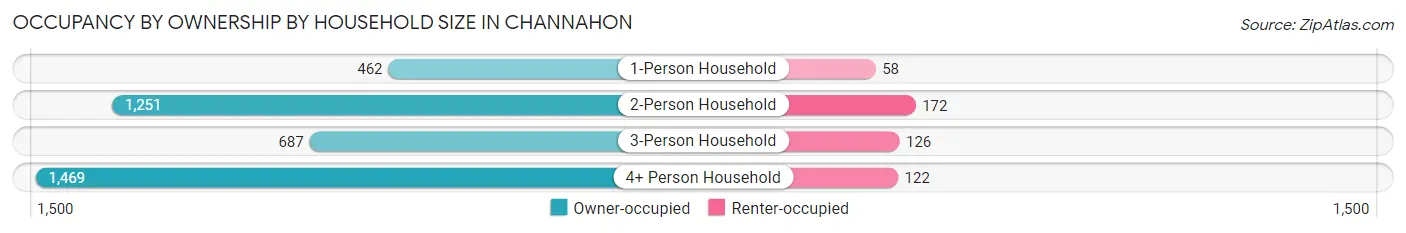
| Household Size | Owner-occupied | Renter-occupied |
| 1-Person Household | 462 (88.8%) | 58 (11.2%) |
| 2-Person Household | 1,251 (87.9%) | 172 (12.1%) |
| 3-Person Household | 687 (84.5%) | 126 (15.5%) |
| 4+ Person Household | 1,469 (92.3%) | 122 (7.7%) |
| Total Housing Units | 3,869 (89.0%) | 478 (11.0%) |
Occupancy by Educational Attainment in Channahon
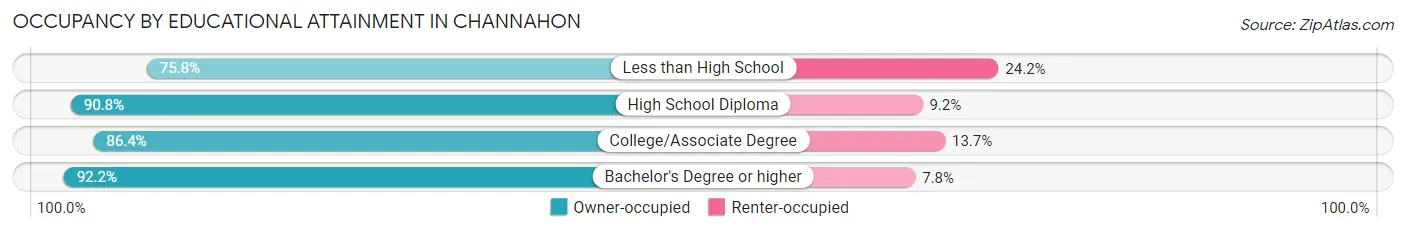
| Household Size | Owner-occupied | Renter-occupied |
| Less than High School | 100 (75.8%) | 32 (24.2%) |
| High School Diploma | 822 (90.8%) | 83 (9.2%) |
| College/Associate Degree | 1,556 (86.4%) | 246 (13.7%) |
| Bachelor's Degree or higher | 1,391 (92.2%) | 117 (7.8%) |
Occupancy by Age of Householder in Channahon
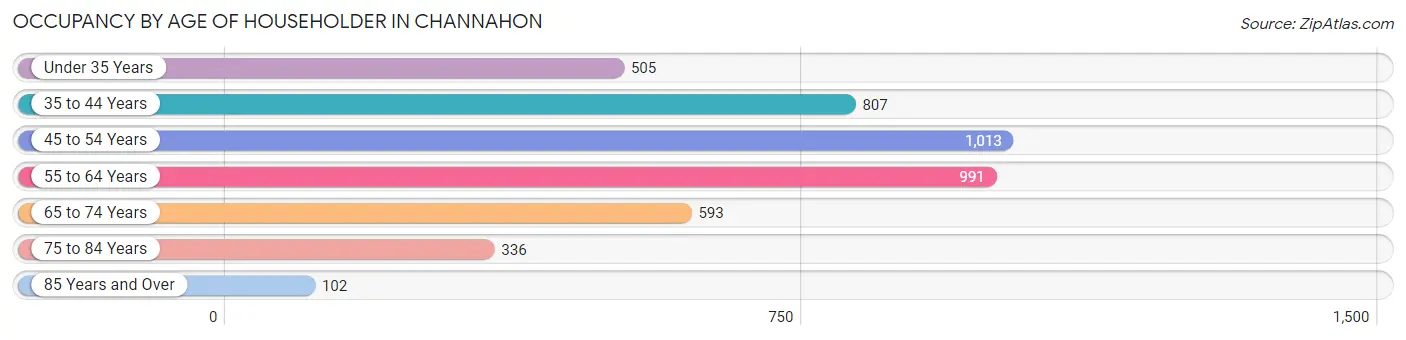
| Age Bracket | # Households | % Households |
| Under 35 Years | 505 | 11.6% |
| 35 to 44 Years | 807 | 18.6% |
| 45 to 54 Years | 1,013 | 23.3% |
| 55 to 64 Years | 991 | 22.8% |
| 65 to 74 Years | 593 | 13.6% |
| 75 to 84 Years | 336 | 7.7% |
| 85 Years and Over | 102 | 2.4% |
| Total | 4,347 | 100.0% |
Housing Finances in Channahon
Median Income by Occupancy in Channahon
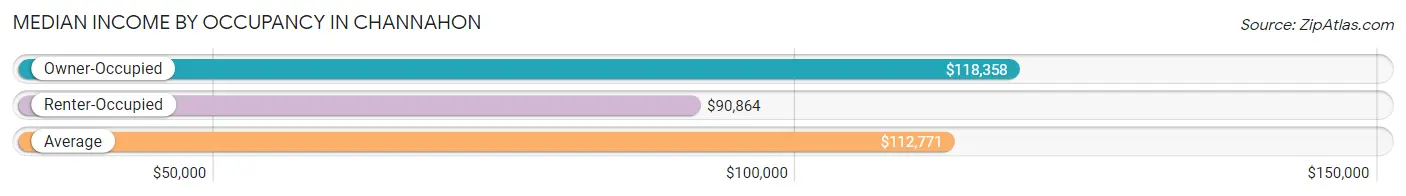
| Occupancy Type | # Households | Median Income |
| Owner-Occupied | 3,869 (89.0%) | $118,358 |
| Renter-Occupied | 478 (11.0%) | $90,864 |
| Average | 4,347 (100.0%) | $112,771 |
Occupancy by Householder Income Bracket in Channahon
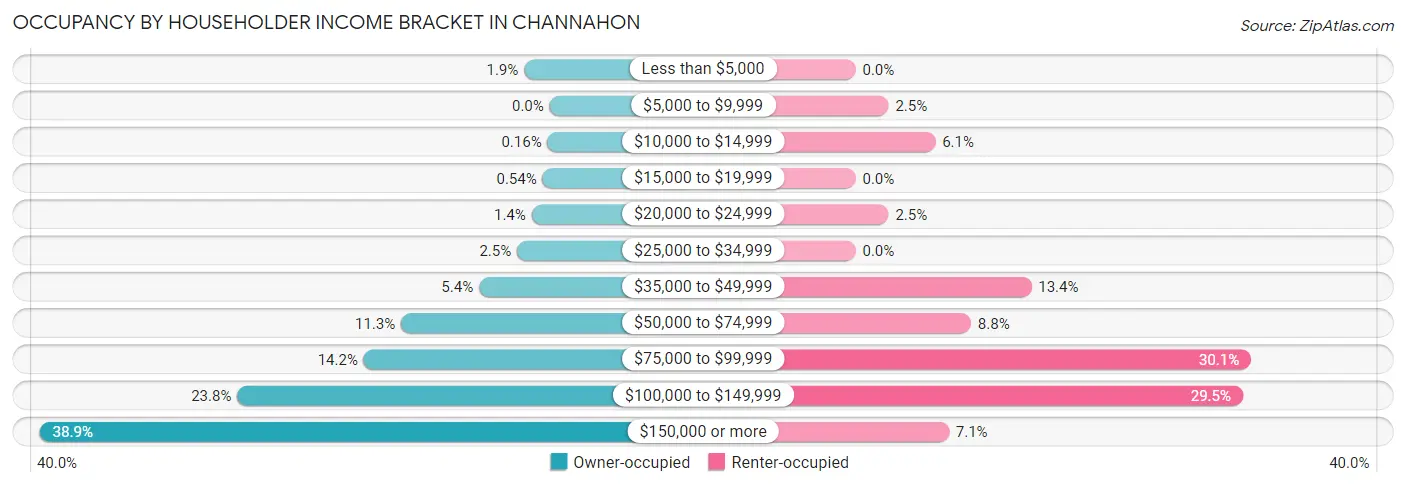
| Income Bracket | Owner-occupied | Renter-occupied |
| Less than $5,000 | 75 (1.9%) | 0 (0.0%) |
| $5,000 to $9,999 | 0 (0.0%) | 12 (2.5%) |
| $10,000 to $14,999 | 6 (0.2%) | 29 (6.1%) |
| $15,000 to $19,999 | 21 (0.5%) | 0 (0.0%) |
| $20,000 to $24,999 | 53 (1.4%) | 12 (2.5%) |
| $25,000 to $34,999 | 96 (2.5%) | 0 (0.0%) |
| $35,000 to $49,999 | 208 (5.4%) | 64 (13.4%) |
| $50,000 to $74,999 | 438 (11.3%) | 42 (8.8%) |
| $75,000 to $99,999 | 548 (14.2%) | 144 (30.1%) |
| $100,000 to $149,999 | 921 (23.8%) | 141 (29.5%) |
| $150,000 or more | 1,503 (38.9%) | 34 (7.1%) |
| Total | 3,869 (100.0%) | 478 (100.0%) |
Monthly Housing Cost Tiers in Channahon
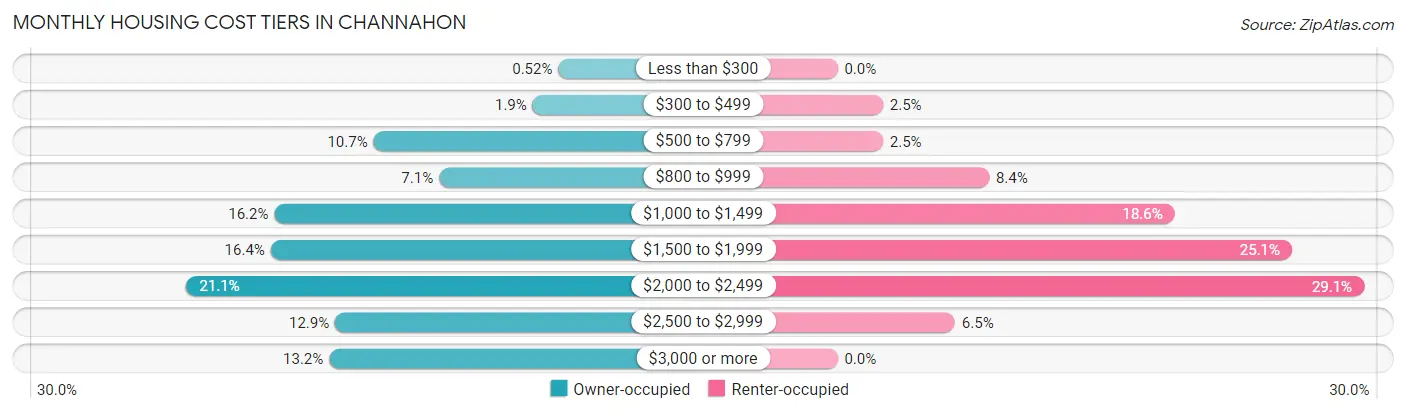
| Monthly Cost | Owner-occupied | Renter-occupied |
| Less than $300 | 20 (0.5%) | 0 (0.0%) |
| $300 to $499 | 75 (1.9%) | 12 (2.5%) |
| $500 to $799 | 415 (10.7%) | 12 (2.5%) |
| $800 to $999 | 275 (7.1%) | 40 (8.4%) |
| $1,000 to $1,499 | 627 (16.2%) | 89 (18.6%) |
| $1,500 to $1,999 | 635 (16.4%) | 120 (25.1%) |
| $2,000 to $2,499 | 815 (21.1%) | 139 (29.1%) |
| $2,500 to $2,999 | 497 (12.9%) | 31 (6.5%) |
| $3,000 or more | 510 (13.2%) | 0 (0.0%) |
| Total | 3,869 (100.0%) | 478 (100.0%) |
Physical Housing Characteristics in Channahon
Housing Structures in Channahon
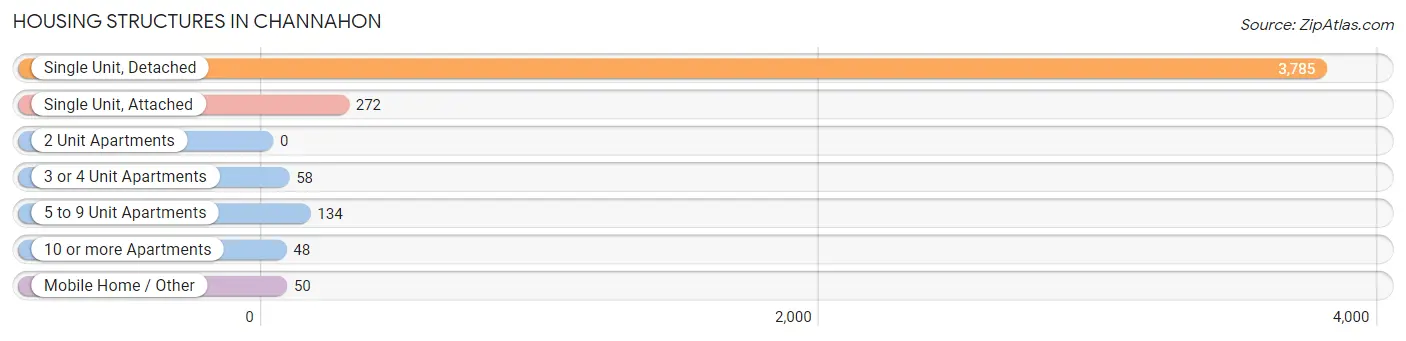
| Structure Type | # Housing Units | % Housing Units |
| Single Unit, Detached | 3,785 | 87.1% |
| Single Unit, Attached | 272 | 6.3% |
| 2 Unit Apartments | 0 | 0.0% |
| 3 or 4 Unit Apartments | 58 | 1.3% |
| 5 to 9 Unit Apartments | 134 | 3.1% |
| 10 or more Apartments | 48 | 1.1% |
| Mobile Home / Other | 50 | 1.1% |
| Total | 4,347 | 100.0% |
Housing Structures by Occupancy in Channahon
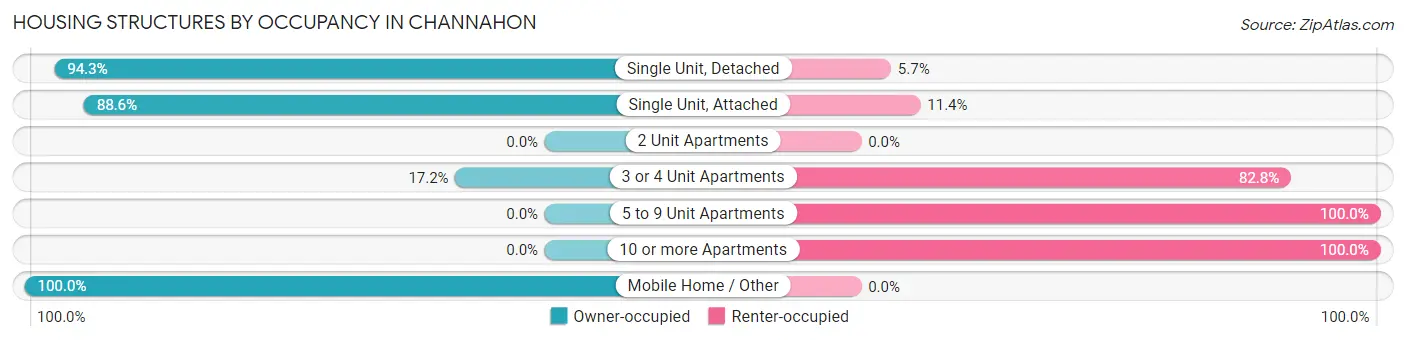
| Structure Type | Owner-occupied | Renter-occupied |
| Single Unit, Detached | 3,568 (94.3%) | 217 (5.7%) |
| Single Unit, Attached | 241 (88.6%) | 31 (11.4%) |
| 2 Unit Apartments | 0 (0.0%) | 0 (0.0%) |
| 3 or 4 Unit Apartments | 10 (17.2%) | 48 (82.8%) |
| 5 to 9 Unit Apartments | 0 (0.0%) | 134 (100.0%) |
| 10 or more Apartments | 0 (0.0%) | 48 (100.0%) |
| Mobile Home / Other | 50 (100.0%) | 0 (0.0%) |
| Total | 3,869 (89.0%) | 478 (11.0%) |
Housing Structures by Number of Rooms in Channahon
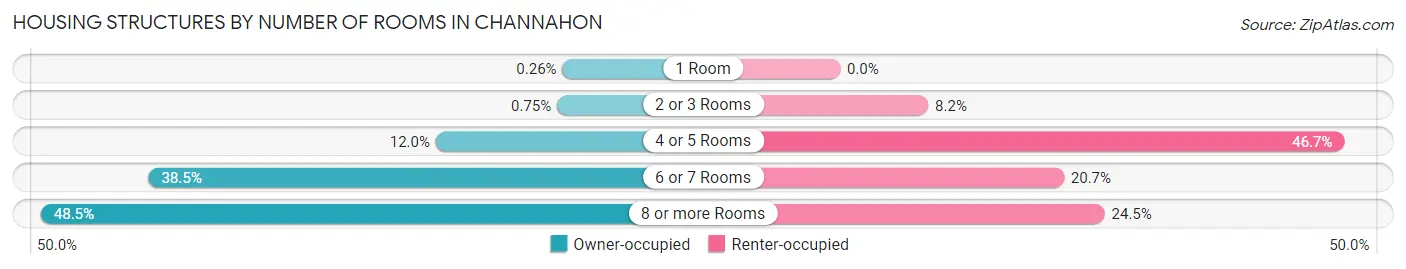
| Number of Rooms | Owner-occupied | Renter-occupied |
| 1 Room | 10 (0.3%) | 0 (0.0%) |
| 2 or 3 Rooms | 29 (0.7%) | 39 (8.2%) |
| 4 or 5 Rooms | 463 (12.0%) | 223 (46.7%) |
| 6 or 7 Rooms | 1,491 (38.5%) | 99 (20.7%) |
| 8 or more Rooms | 1,876 (48.5%) | 117 (24.5%) |
| Total | 3,869 (100.0%) | 478 (100.0%) |
Housing Structure by Heating Type in Channahon
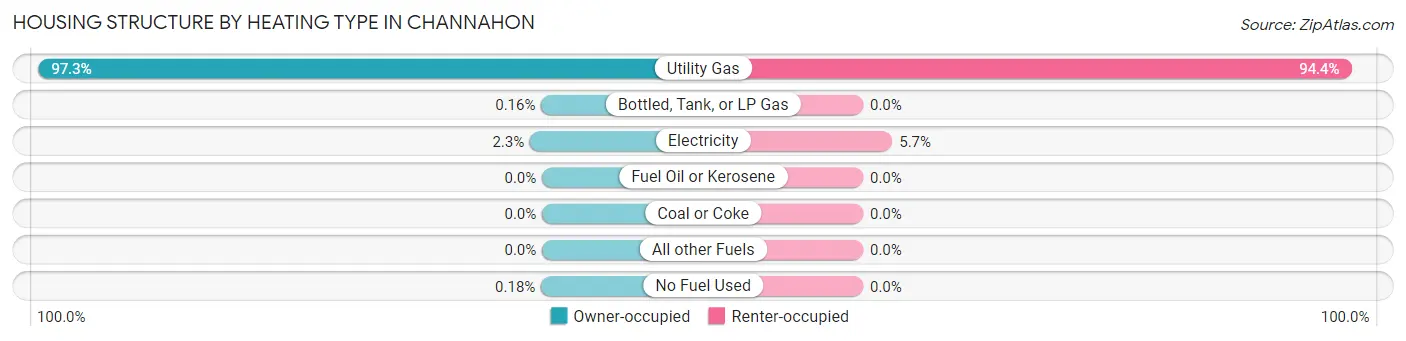
| Heating Type | Owner-occupied | Renter-occupied |
| Utility Gas | 3,766 (97.3%) | 451 (94.4%) |
| Bottled, Tank, or LP Gas | 6 (0.2%) | 0 (0.0%) |
| Electricity | 90 (2.3%) | 27 (5.7%) |
| Fuel Oil or Kerosene | 0 (0.0%) | 0 (0.0%) |
| Coal or Coke | 0 (0.0%) | 0 (0.0%) |
| All other Fuels | 0 (0.0%) | 0 (0.0%) |
| No Fuel Used | 7 (0.2%) | 0 (0.0%) |
| Total | 3,869 (100.0%) | 478 (100.0%) |
Household Vehicle Usage in Channahon
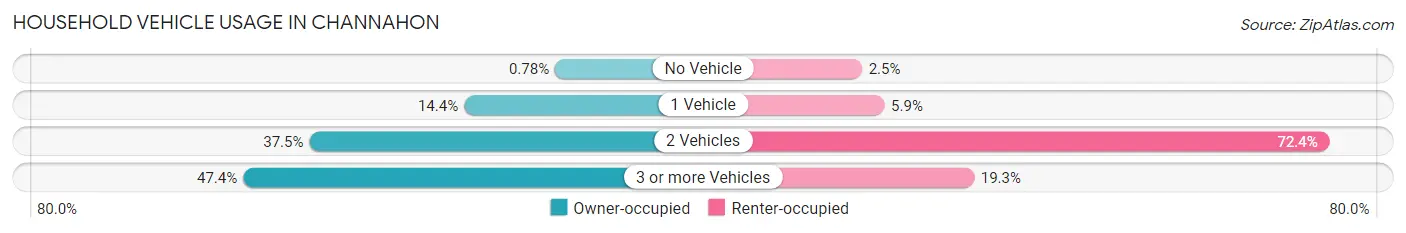
| Vehicles per Household | Owner-occupied | Renter-occupied |
| No Vehicle | 30 (0.8%) | 12 (2.5%) |
| 1 Vehicle | 556 (14.4%) | 28 (5.9%) |
| 2 Vehicles | 1,450 (37.5%) | 346 (72.4%) |
| 3 or more Vehicles | 1,833 (47.4%) | 92 (19.3%) |
| Total | 3,869 (100.0%) | 478 (100.0%) |
Real Estate & Mortgages in Channahon
Real Estate and Mortgage Overview in Channahon
| Characteristic | Without Mortgage | With Mortgage |
| Housing Units | 956 | 2,913 |
| Median Property Value | $238,600 | $301,600 |
| Median Household Income | $94,932 | $1,218 |
| Monthly Housing Costs | $806 | $510 |
| Real Estate Taxes | $5,767 | $57 |
Property Value by Mortgage Status in Channahon
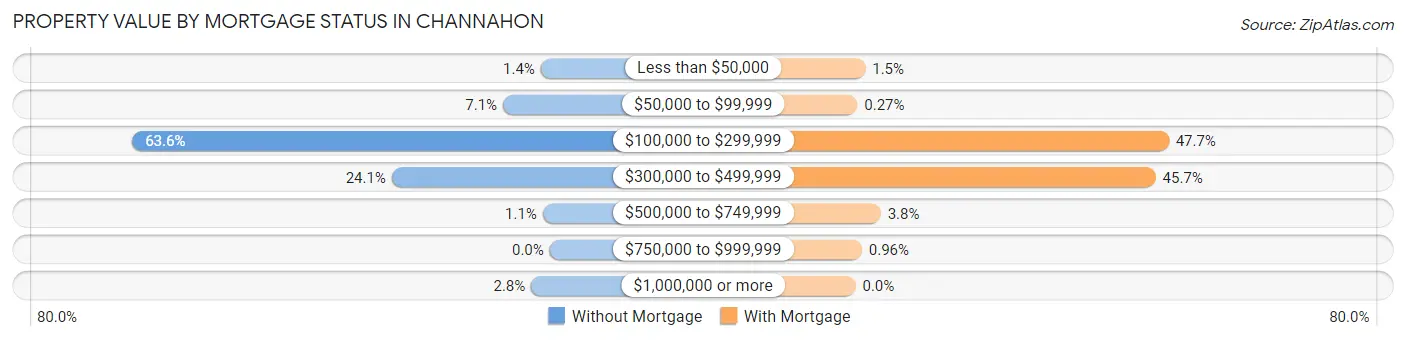
| Property Value | Without Mortgage | With Mortgage |
| Less than $50,000 | 13 (1.4%) | 43 (1.5%) |
| $50,000 to $99,999 | 68 (7.1%) | 8 (0.3%) |
| $100,000 to $299,999 | 608 (63.6%) | 1,390 (47.7%) |
| $300,000 to $499,999 | 230 (24.1%) | 1,332 (45.7%) |
| $500,000 to $749,999 | 10 (1.1%) | 112 (3.8%) |
| $750,000 to $999,999 | 0 (0.0%) | 28 (1.0%) |
| $1,000,000 or more | 27 (2.8%) | 0 (0.0%) |
| Total | 956 (100.0%) | 2,913 (100.0%) |
Household Income by Mortgage Status in Channahon
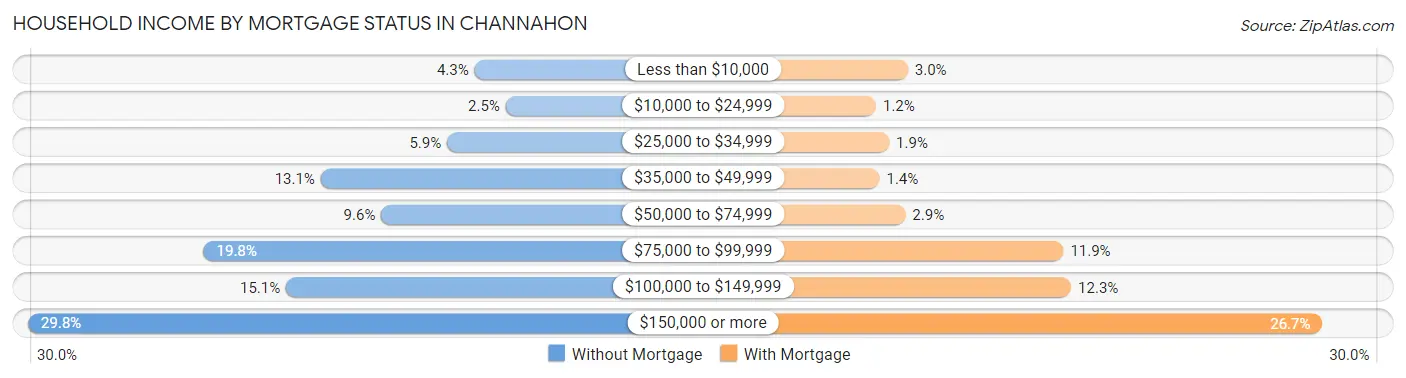
| Household Income | Without Mortgage | With Mortgage |
| Less than $10,000 | 41 (4.3%) | 87 (3.0%) |
| $10,000 to $24,999 | 24 (2.5%) | 34 (1.2%) |
| $25,000 to $34,999 | 56 (5.9%) | 56 (1.9%) |
| $35,000 to $49,999 | 125 (13.1%) | 40 (1.4%) |
| $50,000 to $74,999 | 92 (9.6%) | 83 (2.9%) |
| $75,000 to $99,999 | 189 (19.8%) | 346 (11.9%) |
| $100,000 to $149,999 | 144 (15.1%) | 359 (12.3%) |
| $150,000 or more | 285 (29.8%) | 777 (26.7%) |
| Total | 956 (100.0%) | 2,913 (100.0%) |
Property Value to Household Income Ratio in Channahon
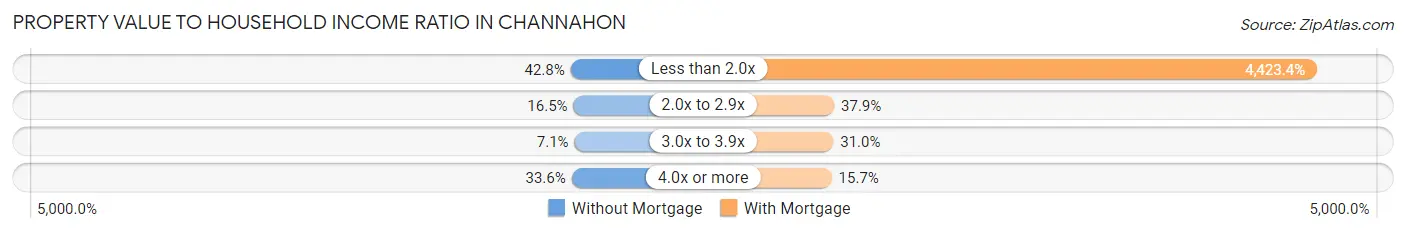
| Value-to-Income Ratio | Without Mortgage | With Mortgage |
| Less than 2.0x | 409 (42.8%) | 128,854 (4,423.4%) |
| 2.0x to 2.9x | 158 (16.5%) | 1,105 (37.9%) |
| 3.0x to 3.9x | 68 (7.1%) | 902 (31.0%) |
| 4.0x or more | 321 (33.6%) | 458 (15.7%) |
| Total | 956 (100.0%) | 2,913 (100.0%) |
Real Estate Taxes by Mortgage Status in Channahon
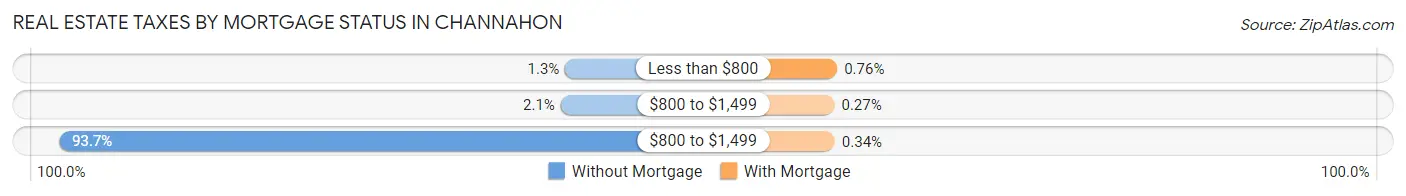
| Property Taxes | Without Mortgage | With Mortgage |
| Less than $800 | 12 (1.3%) | 22 (0.8%) |
| $800 to $1,499 | 20 (2.1%) | 8 (0.3%) |
| $800 to $1,499 | 896 (93.7%) | 10 (0.3%) |
| Total | 956 (100.0%) | 2,913 (100.0%) |
Health & Disability in Channahon
Health Insurance Coverage by Age in Channahon
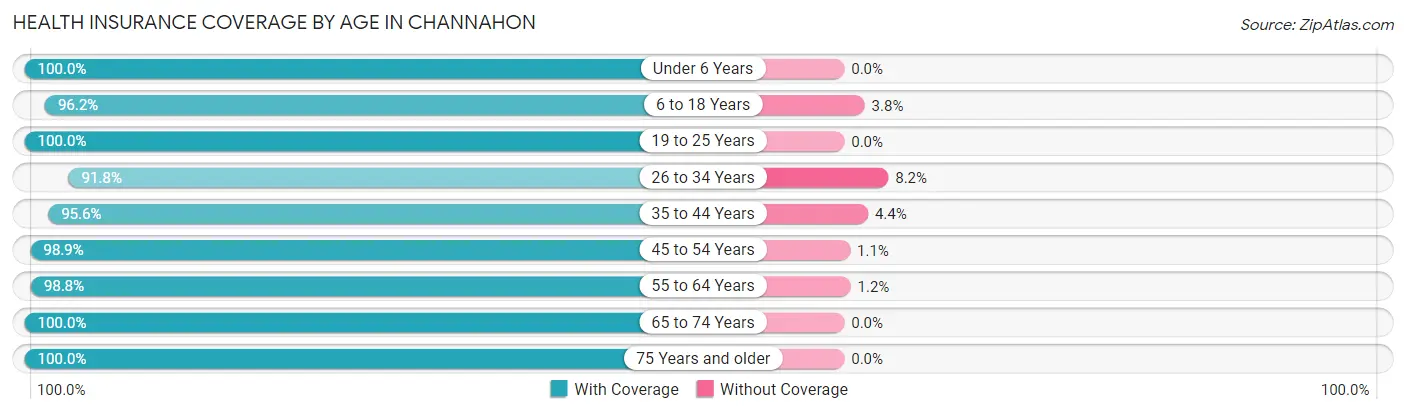
| Age Bracket | With Coverage | Without Coverage |
| Under 6 Years | 864 (100.0%) | 0 (0.0%) |
| 6 to 18 Years | 3,015 (96.2%) | 119 (3.8%) |
| 19 to 25 Years | 1,274 (100.0%) | 0 (0.0%) |
| 26 to 34 Years | 963 (91.8%) | 86 (8.2%) |
| 35 to 44 Years | 1,756 (95.6%) | 81 (4.4%) |
| 45 to 54 Years | 2,009 (98.9%) | 22 (1.1%) |
| 55 to 64 Years | 1,775 (98.8%) | 21 (1.2%) |
| 65 to 74 Years | 1,104 (100.0%) | 0 (0.0%) |
| 75 Years and older | 718 (100.0%) | 0 (0.0%) |
| Total | 13,478 (97.6%) | 329 (2.4%) |
Health Insurance Coverage by Citizenship Status in Channahon
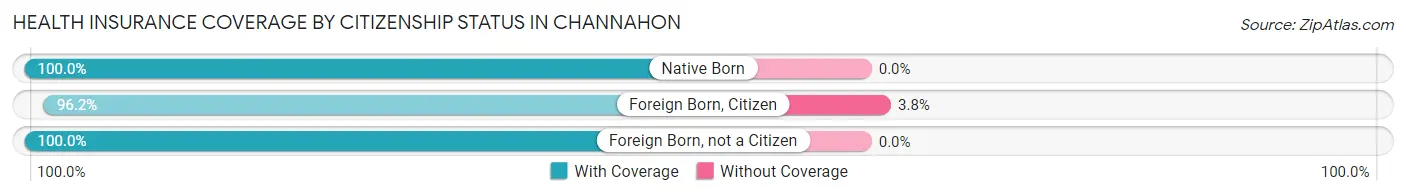
| Citizenship Status | With Coverage | Without Coverage |
| Native Born | 864 (100.0%) | 0 (0.0%) |
| Foreign Born, Citizen | 3,015 (96.2%) | 119 (3.8%) |
| Foreign Born, not a Citizen | 1,274 (100.0%) | 0 (0.0%) |
Health Insurance Coverage by Household Income in Channahon
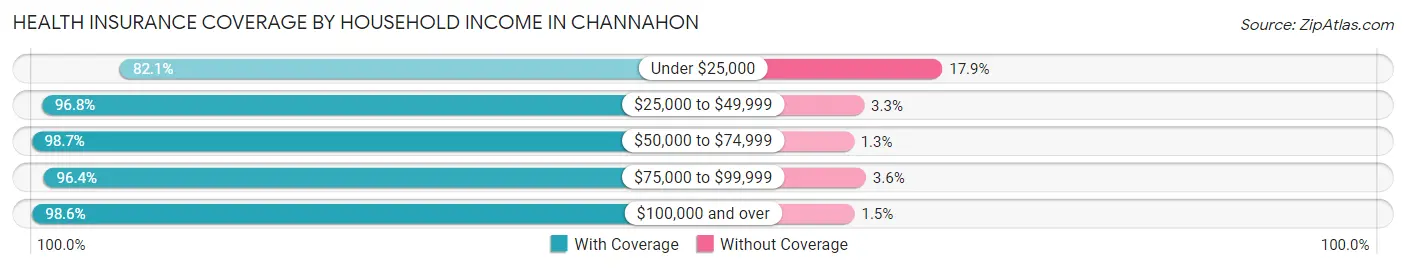
| Household Income | With Coverage | Without Coverage |
| Under $25,000 | 335 (82.1%) | 73 (17.9%) |
| $25,000 to $49,999 | 864 (96.8%) | 29 (3.3%) |
| $50,000 to $74,999 | 1,303 (98.7%) | 17 (1.3%) |
| $75,000 to $99,999 | 2,154 (96.4%) | 80 (3.6%) |
| $100,000 and over | 8,819 (98.6%) | 130 (1.5%) |
Public vs Private Health Insurance Coverage by Age in Channahon
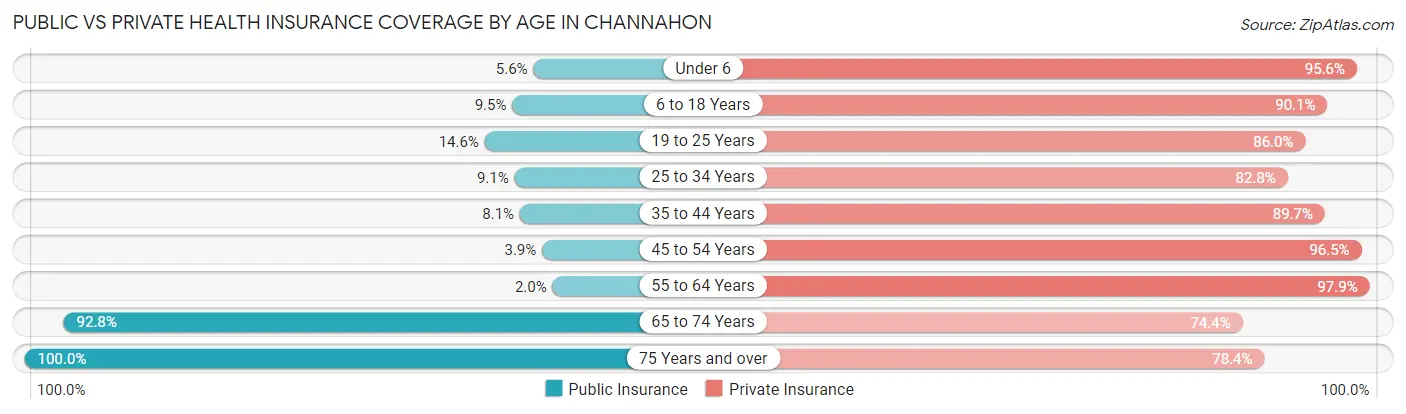
| Age Bracket | Public Insurance | Private Insurance |
| Under 6 | 48 (5.6%) | 826 (95.6%) |
| 6 to 18 Years | 297 (9.5%) | 2,824 (90.1%) |
| 19 to 25 Years | 186 (14.6%) | 1,096 (86.0%) |
| 25 to 34 Years | 95 (9.1%) | 868 (82.8%) |
| 35 to 44 Years | 148 (8.1%) | 1,647 (89.7%) |
| 45 to 54 Years | 80 (3.9%) | 1,959 (96.5%) |
| 55 to 64 Years | 36 (2.0%) | 1,759 (97.9%) |
| 65 to 74 Years | 1,024 (92.7%) | 821 (74.4%) |
| 75 Years and over | 718 (100.0%) | 563 (78.4%) |
| Total | 2,632 (19.1%) | 12,363 (89.5%) |
Disability Status by Sex by Age in Channahon
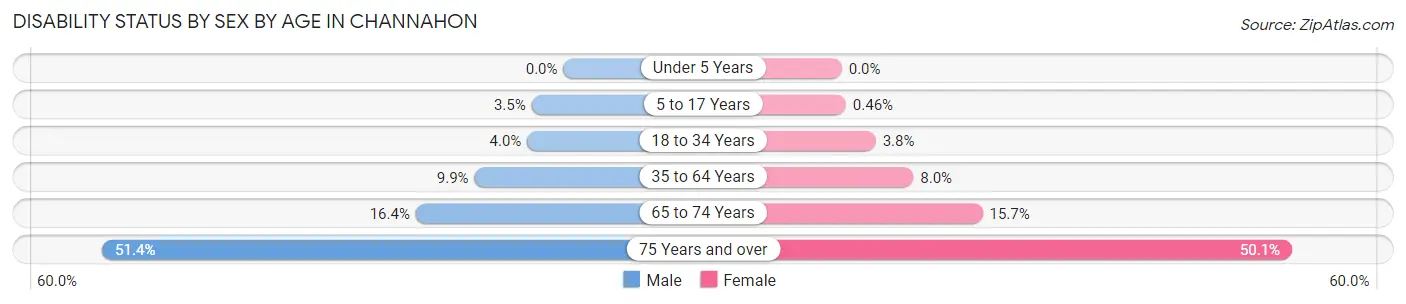
| Age Bracket | Male | Female |
| Under 5 Years | 0 (0.0%) | 0 (0.0%) |
| 5 to 17 Years | 53 (3.5%) | 7 (0.5%) |
| 18 to 34 Years | 50 (4.0%) | 52 (3.8%) |
| 35 to 64 Years | 275 (9.9%) | 230 (8.0%) |
| 65 to 74 Years | 85 (16.4%) | 92 (15.7%) |
| 75 Years and over | 170 (51.4%) | 194 (50.1%) |
Disability Class by Sex by Age in Channahon
Disability Class: Hearing Difficulty
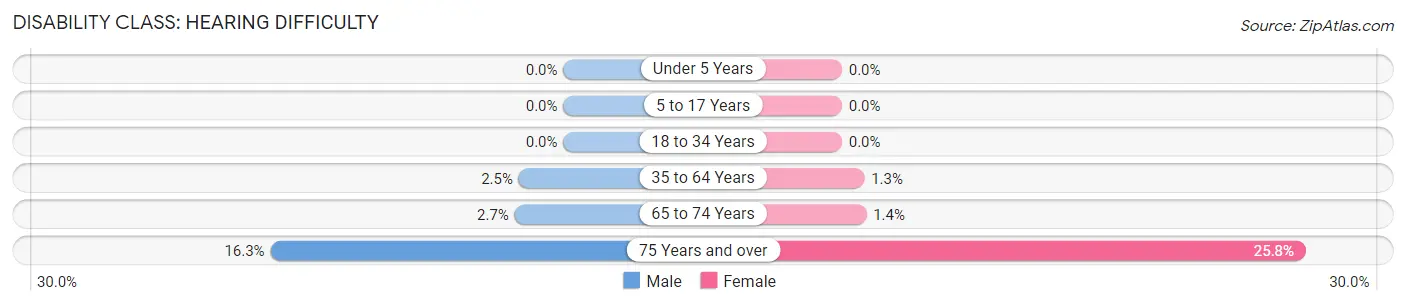
| Age Bracket | Male | Female |
| Under 5 Years | 0 (0.0%) | 0 (0.0%) |
| 5 to 17 Years | 0 (0.0%) | 0 (0.0%) |
| 18 to 34 Years | 0 (0.0%) | 0 (0.0%) |
| 35 to 64 Years | 69 (2.5%) | 36 (1.3%) |
| 65 to 74 Years | 14 (2.7%) | 8 (1.4%) |
| 75 Years and over | 54 (16.3%) | 100 (25.8%) |
Disability Class: Vision Difficulty
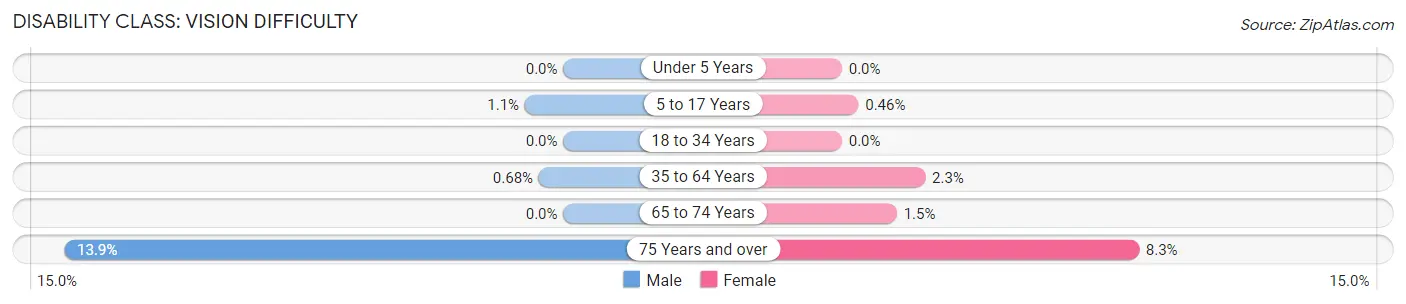
| Age Bracket | Male | Female |
| Under 5 Years | 0 (0.0%) | 0 (0.0%) |
| 5 to 17 Years | 16 (1.1%) | 7 (0.5%) |
| 18 to 34 Years | 0 (0.0%) | 0 (0.0%) |
| 35 to 64 Years | 19 (0.7%) | 67 (2.3%) |
| 65 to 74 Years | 0 (0.0%) | 9 (1.5%) |
| 75 Years and over | 46 (13.9%) | 32 (8.3%) |
Disability Class: Cognitive Difficulty
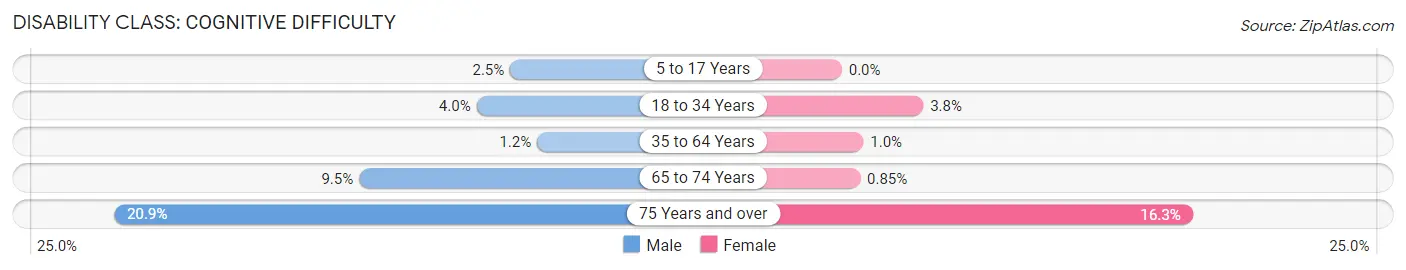
| Age Bracket | Male | Female |
| 5 to 17 Years | 37 (2.5%) | 0 (0.0%) |
| 18 to 34 Years | 50 (4.0%) | 52 (3.8%) |
| 35 to 64 Years | 34 (1.2%) | 29 (1.0%) |
| 65 to 74 Years | 49 (9.5%) | 5 (0.9%) |
| 75 Years and over | 69 (20.8%) | 63 (16.3%) |
Disability Class: Ambulatory Difficulty
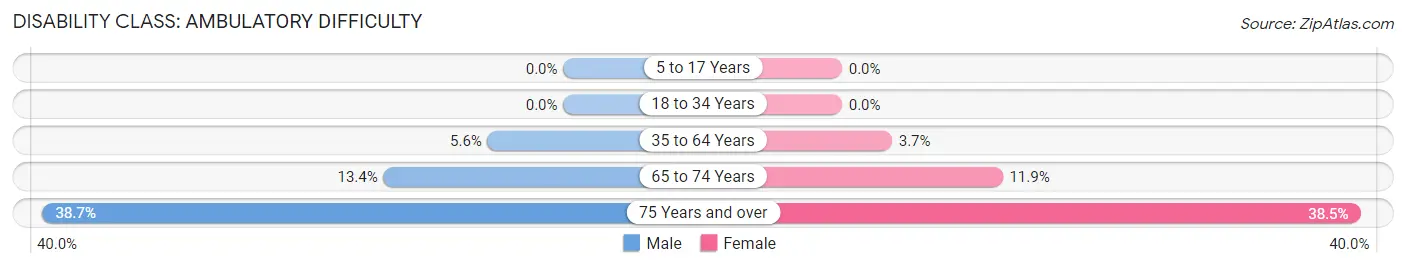
| Age Bracket | Male | Female |
| 5 to 17 Years | 0 (0.0%) | 0 (0.0%) |
| 18 to 34 Years | 0 (0.0%) | 0 (0.0%) |
| 35 to 64 Years | 156 (5.6%) | 107 (3.7%) |
| 65 to 74 Years | 69 (13.4%) | 70 (11.9%) |
| 75 Years and over | 128 (38.7%) | 149 (38.5%) |
Disability Class: Self-Care Difficulty
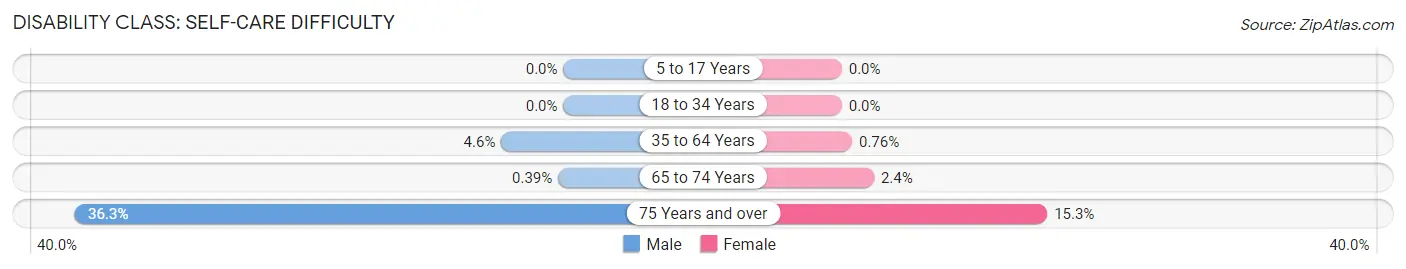
| Age Bracket | Male | Female |
| 5 to 17 Years | 0 (0.0%) | 0 (0.0%) |
| 18 to 34 Years | 0 (0.0%) | 0 (0.0%) |
| 35 to 64 Years | 128 (4.6%) | 22 (0.8%) |
| 65 to 74 Years | 2 (0.4%) | 14 (2.4%) |
| 75 Years and over | 120 (36.2%) | 59 (15.2%) |
Technology Access in Channahon
Computing Device Access in Channahon
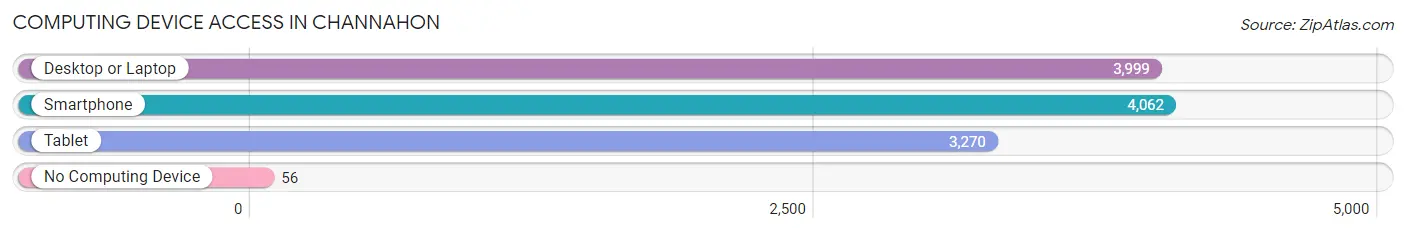
| Device Type | # Households | % Households |
| Desktop or Laptop | 3,999 | 92.0% |
| Smartphone | 4,062 | 93.4% |
| Tablet | 3,270 | 75.2% |
| No Computing Device | 56 | 1.3% |
| Total | 4,347 | 100.0% |
Internet Access in Channahon
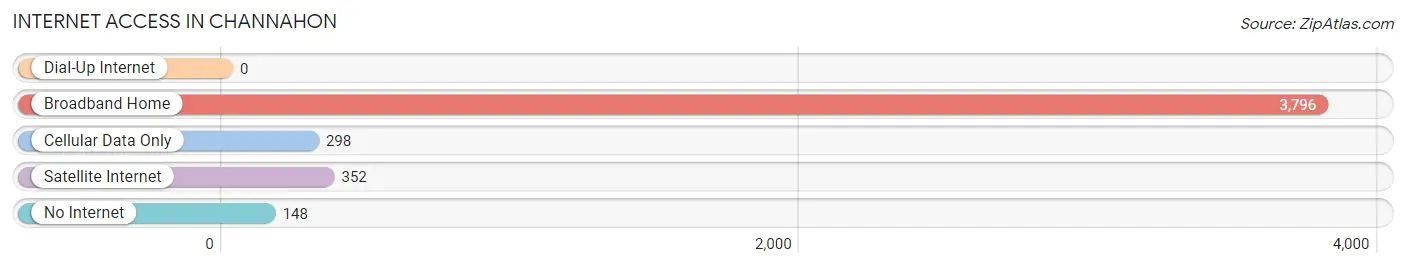
| Internet Type | # Households | % Households |
| Dial-Up Internet | 0 | 0.0% |
| Broadband Home | 3,796 | 87.3% |
| Cellular Data Only | 298 | 6.9% |
| Satellite Internet | 352 | 8.1% |
| No Internet | 148 | 3.4% |
| Total | 4,347 | 100.0% |
Channahon Summary
Channahon is a village located in Will and Grundy counties in the state of Illinois. It is part of the Chicago metropolitan area and is located approximately 40 miles southwest of the city. The population of Channahon was 12,560 as of the 2010 census.
History
The area that is now Channahon was first settled in the early 19th century by French-Canadian fur traders. The first permanent settlers arrived in the 1830s and the village was officially incorporated in 1855. The name Channahon is derived from the Potawatomi word for “meeting of the waters”, referring to the convergence of the Des Plaines and Kankakee rivers.
The village was an important stop on the Illinois and Michigan Canal, which was completed in 1848. The canal provided a transportation route for goods and people between the Great Lakes and the Mississippi River. The canal was eventually replaced by the Illinois Waterway in 1933.
Geography
Channahon is located at 41°20'N 88°14'W (41.33, -88.23). According to the United States Census Bureau, the village has a total area of 8.3 square miles, of which 8.2 square miles is land and 0.1 square miles is water.
The village is located at the confluence of the Des Plaines and Kankakee rivers. The Des Plaines River forms the western boundary of the village, while the Kankakee River forms the eastern boundary. The village is also located near the intersection of Interstate 55 and Interstate 80.
Economy
The economy of Channahon is largely based on manufacturing and retail. The village is home to several large manufacturing companies, including Caterpillar, Inc., John Deere, and Navistar International. The village is also home to several retail stores, including Walmart, Target, and Kohl’s.
Demographics
As of the 2010 census, the population of Channahon was 12,560. The racial makeup of the village was 87.3% White, 5.2% African American, 0.4% Native American, 1.7% Asian, 0.1% Pacific Islander, 3.2% from other races, and 2.1% from two or more races. Hispanic or Latino of any race were 8.7% of the population.
The median income for a household in the village was $68,945, and the median income for a family was $76,945. The per capita income for the village was $27,945. About 4.2% of families and 5.3% of the population were below the poverty line, including 6.3% of those under age 18 and 4.2% of those age 65 or over.
Common Questions
What is Per Capita Income in Channahon?
Per Capita income in Channahon is $45,112.
What is the Median Family Income in Channahon?
Median Family Income in Channahon is $130,409.
What is the Median Household income in Channahon?
Median Household Income in Channahon is $112,771.
What is Income or Wage Gap in Channahon?
Income or Wage Gap in Channahon is 48.9%.
Women in Channahon earn 51.1 cents for every dollar earned by a man.
What is Family Income Deficit in Channahon?
Family Income Deficit in Channahon is $10,780.
Families that are below poverty line in Channahon earn $10,780 less on average than the poverty threshold level.
What is Inequality or Gini Index in Channahon?
Inequality or Gini Index in Channahon is 0.36.
What is the Total Population of Channahon?
Total Population of Channahon is 13,807.
What is the Total Male Population of Channahon?
Total Male Population of Channahon is 6,681.
What is the Total Female Population of Channahon?
Total Female Population of Channahon is 7,126.
What is the Ratio of Males per 100 Females in Channahon?
There are 93.76 Males per 100 Females in Channahon.
What is the Ratio of Females per 100 Males in Channahon?
There are 106.66 Females per 100 Males in Channahon.
What is the Median Population Age in Channahon?
Median Population Age in Channahon is 38.6 Years.
What is the Average Family Size in Channahon
Average Family Size in Channahon is 3.5 People.
What is the Average Household Size in Channahon
Average Household Size in Channahon is 3.2 People.
How Large is the Labor Force in Channahon?
There are 7,433 People in the Labor Forcein in Channahon.
What is the Percentage of People in the Labor Force in Channahon?
70.2% of People are in the Labor Force in Channahon.
What is the Unemployment Rate in Channahon?
Unemployment Rate in Channahon is 8.0%.