Fairmont City, IL Map & Demographics
Fairmont City Map
Fairmont City Overview
$22,251
PER CAPITA INCOME
$64,671
AVG FAMILY INCOME
$42,417
AVG HOUSEHOLD INCOME
34.3%
WAGE / INCOME GAP [ % ]
65.7¢/ $1
WAGE / INCOME GAP [ $ ]
$9,900
FAMILY INCOME DEFICIT
0.42
INEQUALITY / GINI INDEX
2,125
TOTAL POPULATION
1,062
MALE POPULATION
1,063
FEMALE POPULATION
99.91
MALES / 100 FEMALES
100.09
FEMALES / 100 MALES
40.8
MEDIAN AGE
3.8
AVG FAMILY SIZE
2.8
AVG HOUSEHOLD SIZE
934
LABOR FORCE [ PEOPLE ]
52.3%
PERCENT IN LABOR FORCE
1.2%
UNEMPLOYMENT RATE
Fairmont City Area Codes
Income in Fairmont City
Income Overview in Fairmont City
Per Capita Income in Fairmont City is $22,251, while median incomes of families and households are $64,671 and $42,417 respectively.
| Characteristic | Number | Measure |
| Per Capita Income | 2,125 | $22,251 |
| Median Family Income | 405 | $64,671 |
| Mean Family Income | 405 | $71,548 |
| Median Household Income | 766 | $42,417 |
| Mean Household Income | 766 | $55,612 |
| Income Deficit | 405 | $9,900 |
| Wage / Income Gap (%) | 2,125 | 34.31% |
| Wage / Income Gap ($) | 2,125 | 65.69¢ per $1 |
| Gini / Inequality Index | 2,125 | 0.42 |
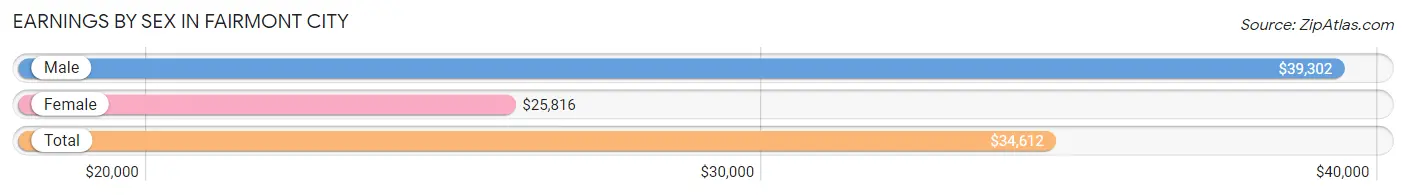
Earnings by Sex in Fairmont City
Average Earnings in Fairmont City are $34,612, $39,302 for men and $25,816 for women, a difference of 34.3%.
| Sex | Number | Average Earnings |
| Male | 624 (63.8%) | $39,302 |
| Female | 354 (36.2%) | $25,816 |
| Total | 978 (100.0%) | $34,612 |
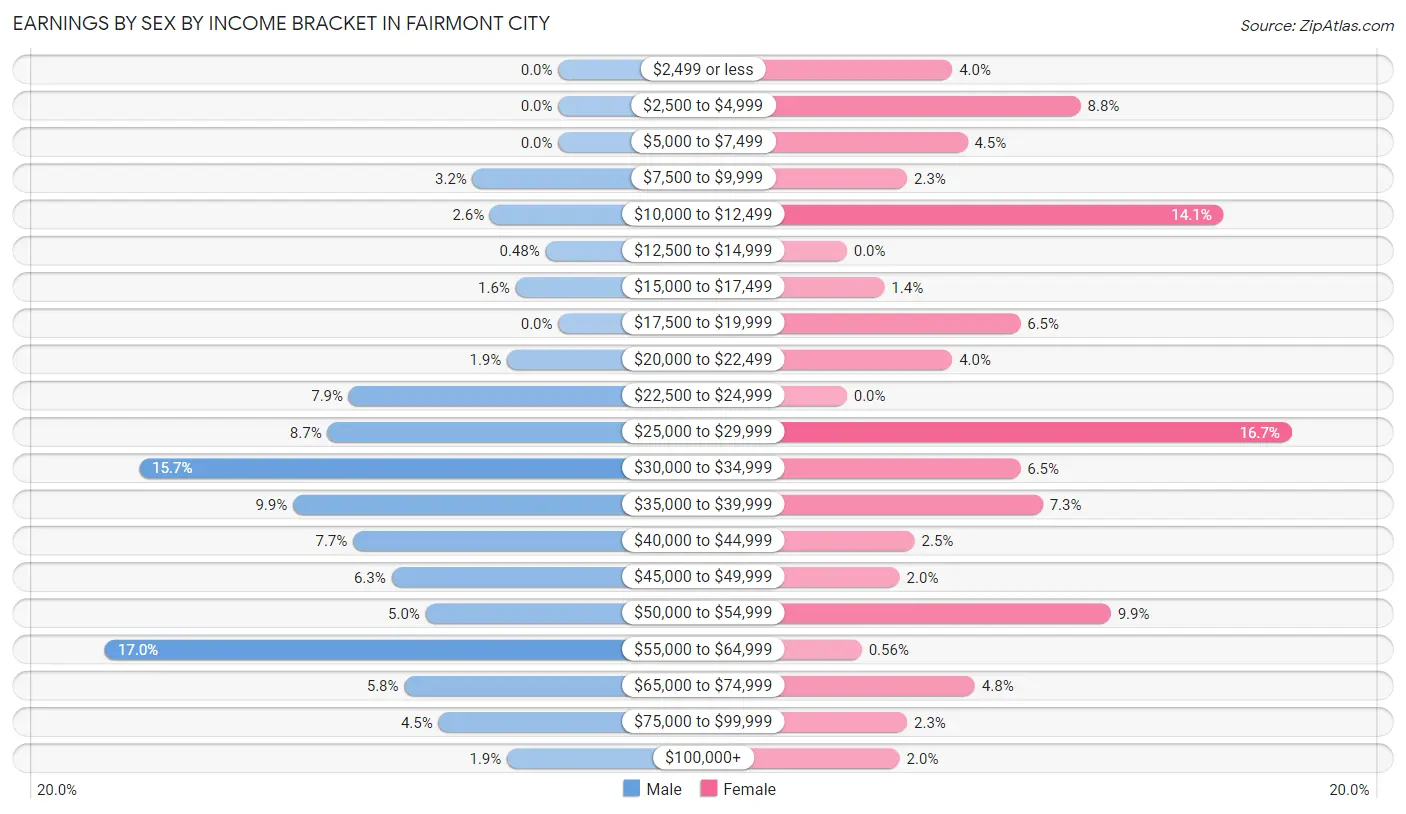
Earnings by Sex by Income Bracket in Fairmont City
The most common earnings brackets in Fairmont City are $55,000 to $64,999 for men (106 | 17.0%) and $25,000 to $29,999 for women (59 | 16.7%).
| Income | Male | Female |
| $2,499 or less | 0 (0.0%) | 14 (4.0%) |
| $2,500 to $4,999 | 0 (0.0%) | 31 (8.8%) |
| $5,000 to $7,499 | 0 (0.0%) | 16 (4.5%) |
| $7,500 to $9,999 | 20 (3.2%) | 8 (2.3%) |
| $10,000 to $12,499 | 16 (2.6%) | 50 (14.1%) |
| $12,500 to $14,999 | 3 (0.5%) | 0 (0.0%) |
| $15,000 to $17,499 | 10 (1.6%) | 5 (1.4%) |
| $17,500 to $19,999 | 0 (0.0%) | 23 (6.5%) |
| $20,000 to $22,499 | 12 (1.9%) | 14 (4.0%) |
| $22,500 to $24,999 | 49 (7.9%) | 0 (0.0%) |
| $25,000 to $29,999 | 54 (8.6%) | 59 (16.7%) |
| $30,000 to $34,999 | 98 (15.7%) | 23 (6.5%) |
| $35,000 to $39,999 | 62 (9.9%) | 26 (7.3%) |
| $40,000 to $44,999 | 48 (7.7%) | 9 (2.5%) |
| $45,000 to $49,999 | 39 (6.2%) | 7 (2.0%) |
| $50,000 to $54,999 | 31 (5.0%) | 35 (9.9%) |
| $55,000 to $64,999 | 106 (17.0%) | 2 (0.6%) |
| $65,000 to $74,999 | 36 (5.8%) | 17 (4.8%) |
| $75,000 to $99,999 | 28 (4.5%) | 8 (2.3%) |
| $100,000+ | 12 (1.9%) | 7 (2.0%) |
| Total | 624 (100.0%) | 354 (100.0%) |
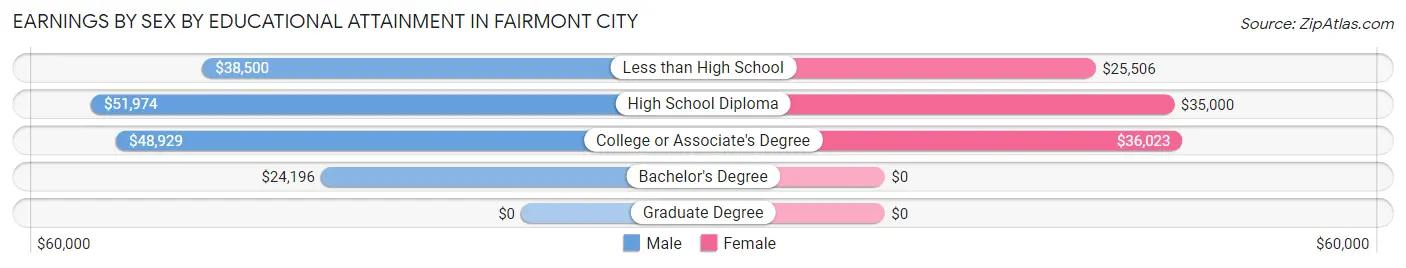
Earnings by Sex by Educational Attainment in Fairmont City
Average earnings in Fairmont City are $42,950 for men and $26,378 for women, a difference of 38.6%. Men with an educational attainment of high school diploma enjoy the highest average annual earnings of $51,974, while those with bachelor's degree education earn the least with $24,196. Women with an educational attainment of college or associate's degree earn the most with the average annual earnings of $36,023, while those with less than high school education have the smallest earnings of $25,506.
| Educational Attainment | Male Income | Female Income |
| Less than High School | $38,500 | $25,506 |
| High School Diploma | $51,974 | $35,000 |
| College or Associate's Degree | $48,929 | $36,023 |
| Bachelor's Degree | $24,196 | $0 |
| Graduate Degree | - | - |
| Total | $42,950 | $26,378 |
Family Income in Fairmont City
Family Income Brackets in Fairmont City
According to the Fairmont City family income data, there are 87 families falling into the $100,000 to $149,999 income range, which is the most common income bracket and makes up 21.5% of all families.
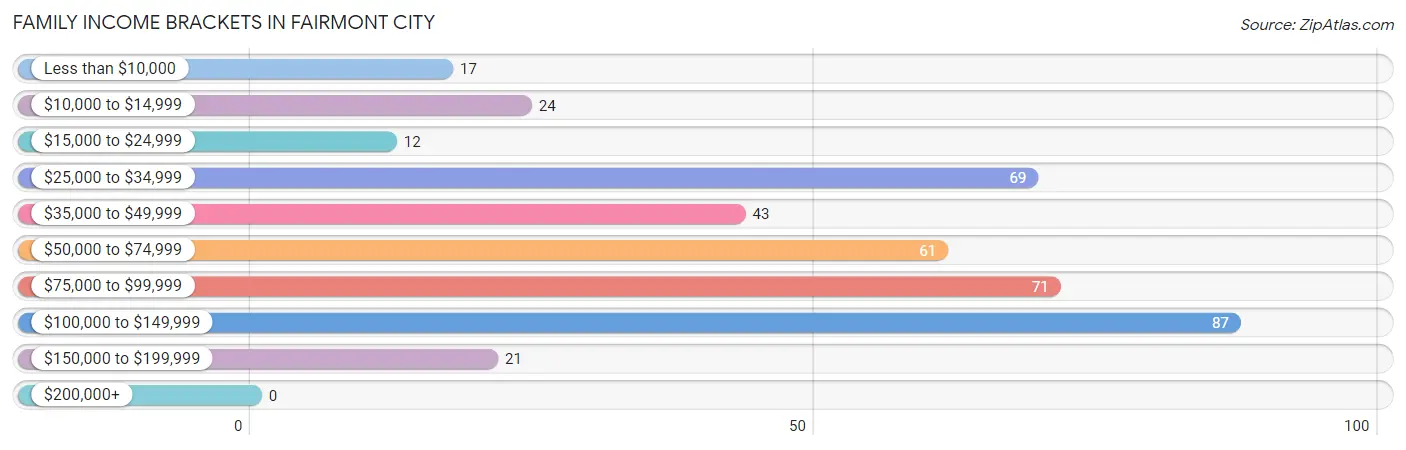
| Income Bracket | # Families | % Families |
| Less than $10,000 | 17 | 4.2% |
| $10,000 to $14,999 | 24 | 5.9% |
| $15,000 to $24,999 | 12 | 3.0% |
| $25,000 to $34,999 | 69 | 17.0% |
| $35,000 to $49,999 | 43 | 10.6% |
| $50,000 to $74,999 | 61 | 15.1% |
| $75,000 to $99,999 | 71 | 17.5% |
| $100,000 to $149,999 | 87 | 21.5% |
| $150,000 to $199,999 | 21 | 5.2% |
| $200,000+ | 0 | 0.0% |
Family Income by Famaliy Size in Fairmont City
3-person families (108 | 26.7%) account for the highest median family income in Fairmont City with $95,500 per family, while 3-person families (108 | 26.7%) have the highest median income of $31,833 per family member.
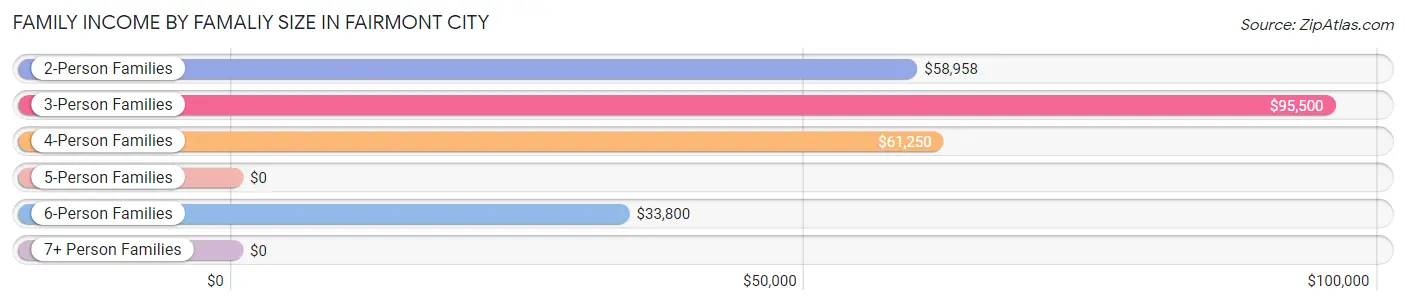
| Income Bracket | # Families | Median Income |
| 2-Person Families | 107 (26.4%) | $58,958 |
| 3-Person Families | 108 (26.7%) | $95,500 |
| 4-Person Families | 80 (19.8%) | $61,250 |
| 5-Person Families | 21 (5.2%) | $0 |
| 6-Person Families | 80 (19.8%) | $33,800 |
| 7+ Person Families | 9 (2.2%) | $0 |
| Total | 405 (100.0%) | $64,671 |
Family Income by Number of Earners in Fairmont City
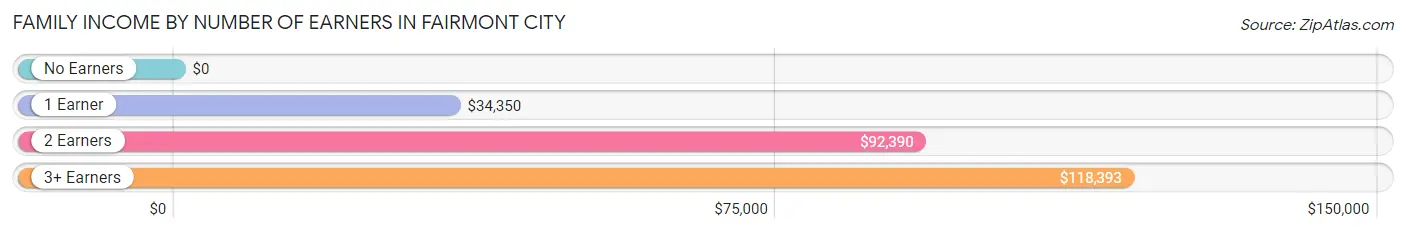
| Number of Earners | # Families | Median Income |
| No Earners | 45 (11.1%) | $0 |
| 1 Earner | 170 (42.0%) | $34,350 |
| 2 Earners | 141 (34.8%) | $92,390 |
| 3+ Earners | 49 (12.1%) | $118,393 |
| Total | 405 (100.0%) | $64,671 |
Household Income in Fairmont City
Household Income Brackets in Fairmont City
With 151 households falling in the category, the $35,000 to $49,999 income range is the most frequent in Fairmont City, accounting for 19.7% of all households.
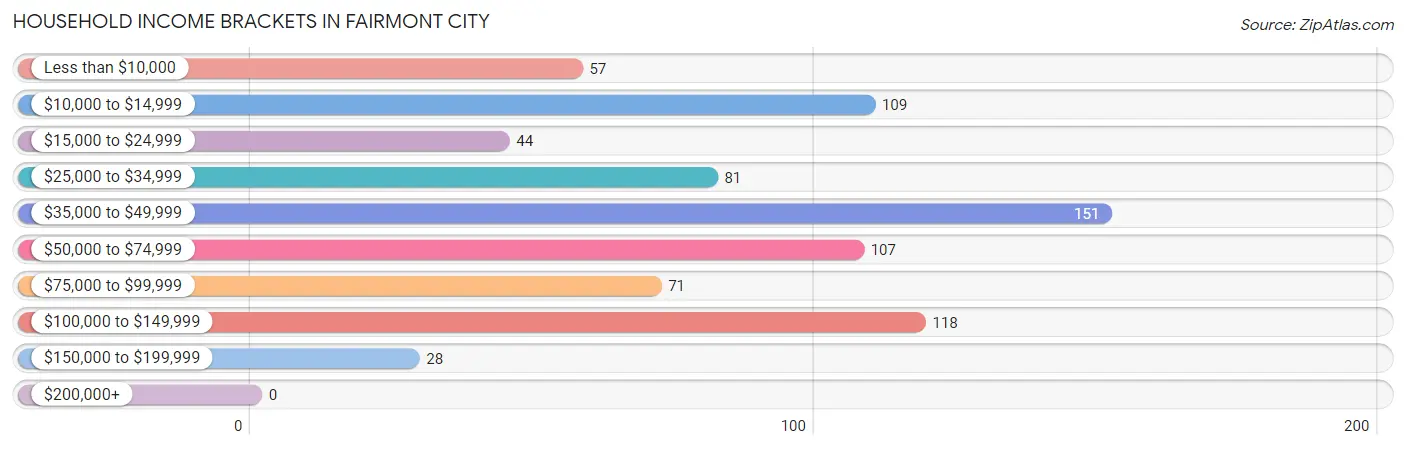
| Income Bracket | # Households | % Households |
| Less than $10,000 | 57 | 7.4% |
| $10,000 to $14,999 | 109 | 14.2% |
| $15,000 to $24,999 | 44 | 5.7% |
| $25,000 to $34,999 | 81 | 10.6% |
| $35,000 to $49,999 | 151 | 19.7% |
| $50,000 to $74,999 | 107 | 14.0% |
| $75,000 to $99,999 | 71 | 9.3% |
| $100,000 to $149,999 | 118 | 15.4% |
| $150,000 to $199,999 | 28 | 3.7% |
| $200,000+ | 0 | 0.0% |
Household Income by Householder Age in Fairmont City
The median household income in Fairmont City is $42,417, with the highest median household income of $74,531 found in the 45 to 64 years age bracket for the primary householder. A total of 278 households (36.3%) fall into this category. Meanwhile, the 15 to 24 years age bracket for the primary householder has the lowest median household income of $0, with 23 households (3.0%) in this group.
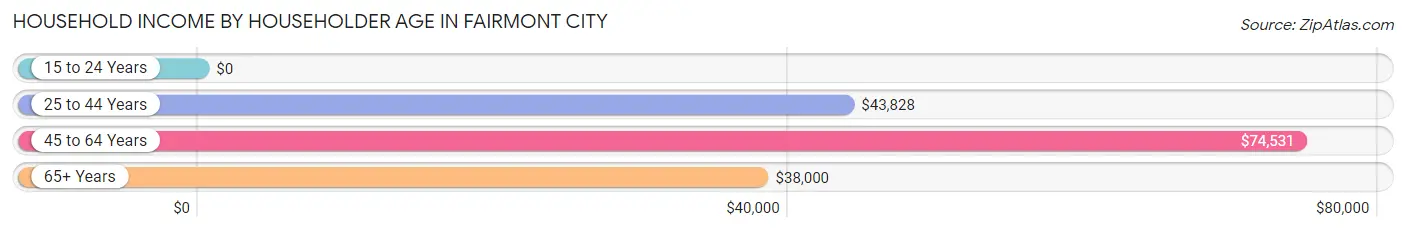
| Income Bracket | # Households | Median Income |
| 15 to 24 Years | 23 (3.0%) | $0 |
| 25 to 44 Years | 215 (28.1%) | $43,828 |
| 45 to 64 Years | 278 (36.3%) | $74,531 |
| 65+ Years | 250 (32.6%) | $38,000 |
| Total | 766 (100.0%) | $42,417 |
Poverty in Fairmont City
Income Below Poverty by Sex and Age in Fairmont City
With 22.3% poverty level for males and 36.8% for females among the residents of Fairmont City, 12 to 14 year old males and 6 to 11 year old females are the most vulnerable to poverty, with 3 males (100.0%) and 63 females (85.1%) in their respective age groups living below the poverty level.
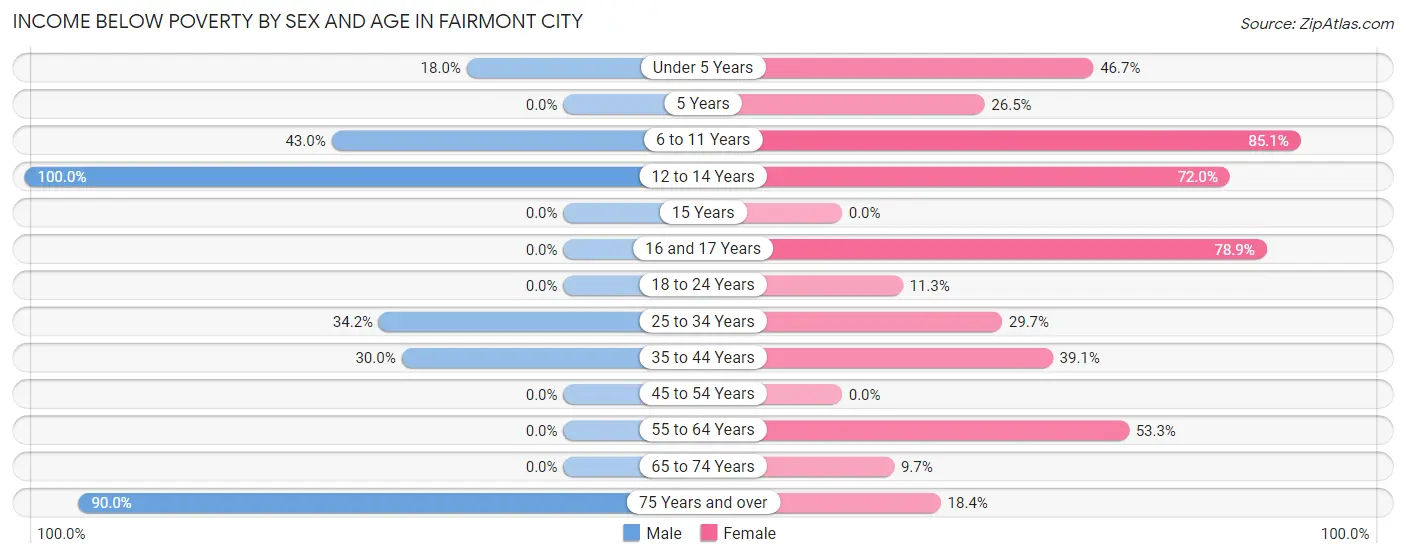
| Age Bracket | Male | Female |
| Under 5 Years | 7 (17.9%) | 28 (46.7%) |
| 5 Years | 0 (0.0%) | 9 (26.5%) |
| 6 to 11 Years | 34 (43.0%) | 63 (85.1%) |
| 12 to 14 Years | 3 (100.0%) | 18 (72.0%) |
| 15 Years | 0 (0.0%) | 0 (0.0%) |
| 16 and 17 Years | 0 (0.0%) | 41 (78.8%) |
| 18 to 24 Years | 0 (0.0%) | 8 (11.3%) |
| 25 to 34 Years | 51 (34.2%) | 41 (29.7%) |
| 35 to 44 Years | 70 (30.0%) | 72 (39.1%) |
| 45 to 54 Years | 0 (0.0%) | 0 (0.0%) |
| 55 to 64 Years | 0 (0.0%) | 82 (53.2%) |
| 65 to 74 Years | 0 (0.0%) | 9 (9.7%) |
| 75 Years and over | 72 (90.0%) | 20 (18.3%) |
| Total | 237 (22.3%) | 391 (36.8%) |
Income Above Poverty by Sex and Age in Fairmont City
According to the poverty statistics in Fairmont City, males aged 5 years and females aged 15 years are the age groups that are most secure financially, with 100.0% of males and 100.0% of females in these age groups living above the poverty line.
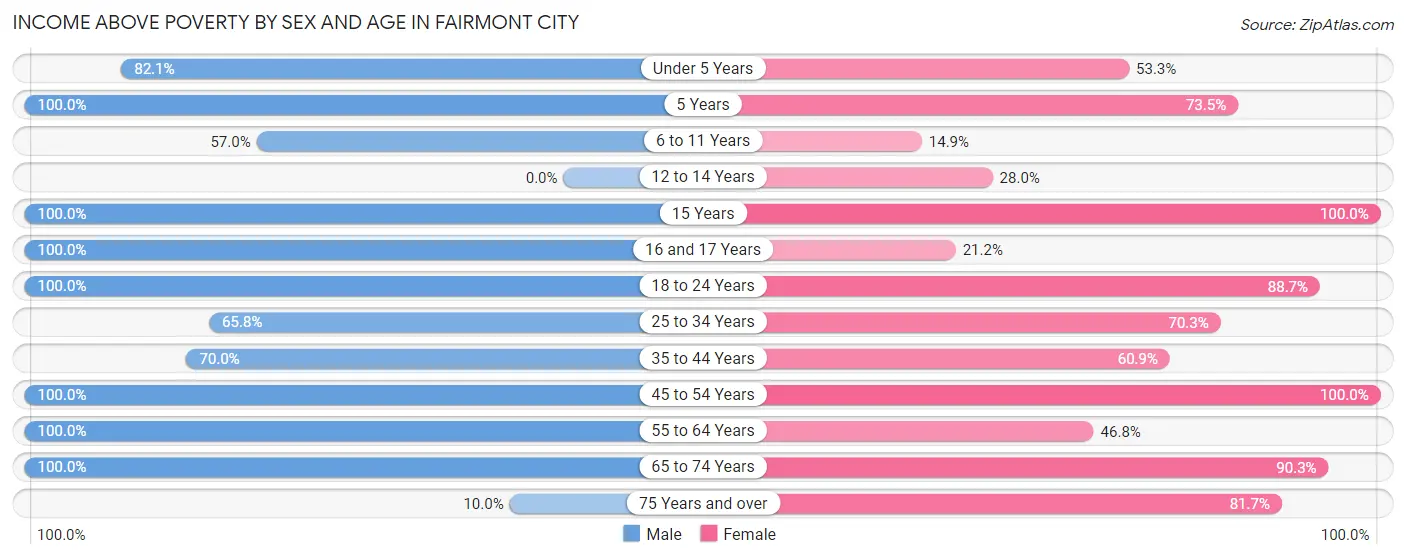
| Age Bracket | Male | Female |
| Under 5 Years | 32 (82.1%) | 32 (53.3%) |
| 5 Years | 13 (100.0%) | 25 (73.5%) |
| 6 to 11 Years | 45 (57.0%) | 11 (14.9%) |
| 12 to 14 Years | 0 (0.0%) | 7 (28.0%) |
| 15 Years | 6 (100.0%) | 7 (100.0%) |
| 16 and 17 Years | 21 (100.0%) | 11 (21.1%) |
| 18 to 24 Years | 79 (100.0%) | 63 (88.7%) |
| 25 to 34 Years | 98 (65.8%) | 97 (70.3%) |
| 35 to 44 Years | 163 (70.0%) | 112 (60.9%) |
| 45 to 54 Years | 110 (100.0%) | 62 (100.0%) |
| 55 to 64 Years | 170 (100.0%) | 72 (46.8%) |
| 65 to 74 Years | 80 (100.0%) | 84 (90.3%) |
| 75 Years and over | 8 (10.0%) | 89 (81.7%) |
| Total | 825 (77.7%) | 672 (63.2%) |
Income Below Poverty Among Married-Couple Families in Fairmont City
The poverty statistics for married-couple families in Fairmont City show that 22.3% or 71 of the total 318 families live below the poverty line. Families with 3 or 4 children have the highest poverty rate of 85.5%, comprising of 65 families. On the other hand, families with no children have the lowest poverty rate of 0.0%, which includes 0 families.
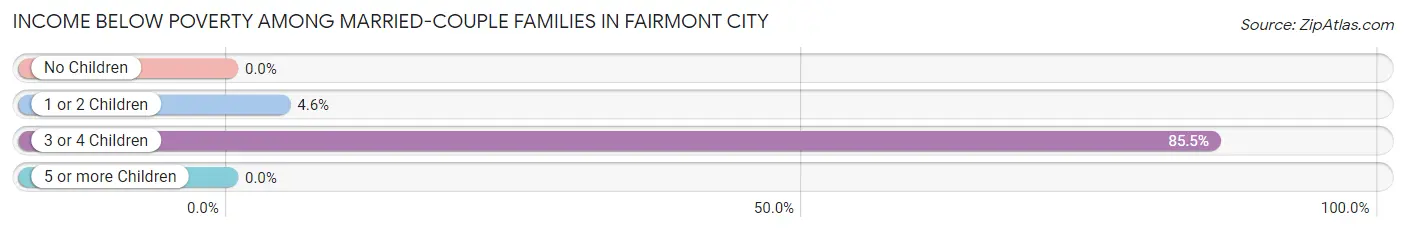
| Children | Above Poverty | Below Poverty |
| No Children | 110 (100.0%) | 0 (0.0%) |
| 1 or 2 Children | 126 (95.5%) | 6 (4.5%) |
| 3 or 4 Children | 11 (14.5%) | 65 (85.5%) |
| 5 or more Children | 0 (0.0%) | 0 (0.0%) |
| Total | 247 (77.7%) | 71 (22.3%) |
Income Below Poverty Among Single-Parent Households in Fairmont City
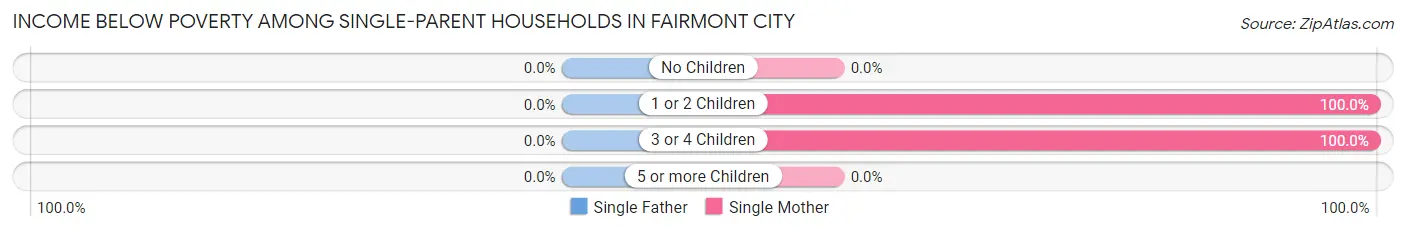
| Children | Single Father | Single Mother |
| No Children | 0 (0.0%) | 0 (0.0%) |
| 1 or 2 Children | 0 (0.0%) | 33 (100.0%) |
| 3 or 4 Children | 0 (0.0%) | 8 (100.0%) |
| 5 or more Children | 0 (0.0%) | 0 (0.0%) |
| Total | 0 (0.0%) | 41 (82.0%) |
Income Below Poverty Among Married-Couple vs Single-Parent Households in Fairmont City
The poverty data for Fairmont City shows that 71 of the married-couple family households (22.3%) and 41 of the single-parent households (47.1%) are living below the poverty level. Within the married-couple family households, those with 3 or 4 children have the highest poverty rate, with 65 households (85.5%) falling below the poverty line. Among the single-parent households, those with 1 or 2 children have the highest poverty rate, with 33 household (78.6%) living below poverty.
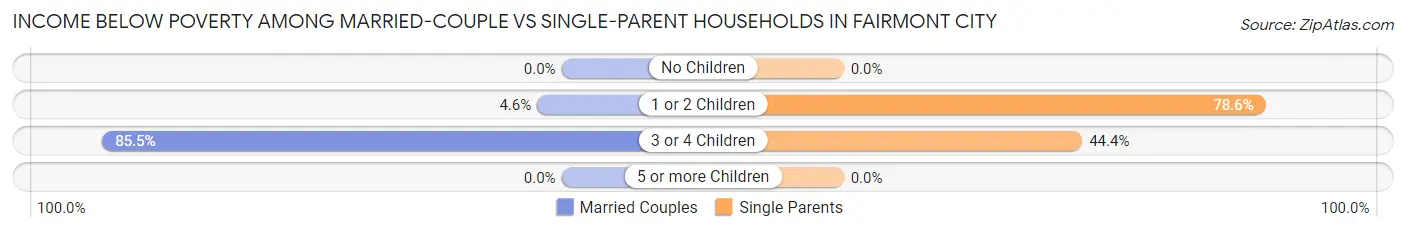
| Children | Married-Couple Families | Single-Parent Households |
| No Children | 0 (0.0%) | 0 (0.0%) |
| 1 or 2 Children | 6 (4.5%) | 33 (78.6%) |
| 3 or 4 Children | 65 (85.5%) | 8 (44.4%) |
| 5 or more Children | 0 (0.0%) | 0 (0.0%) |
| Total | 71 (22.3%) | 41 (47.1%) |
Race in Fairmont City
The most populous races in Fairmont City are Hispanic or Latino (1,389 | 65.4%), White / Caucasian (816 | 38.4%), and Some other Race (755 | 35.5%).
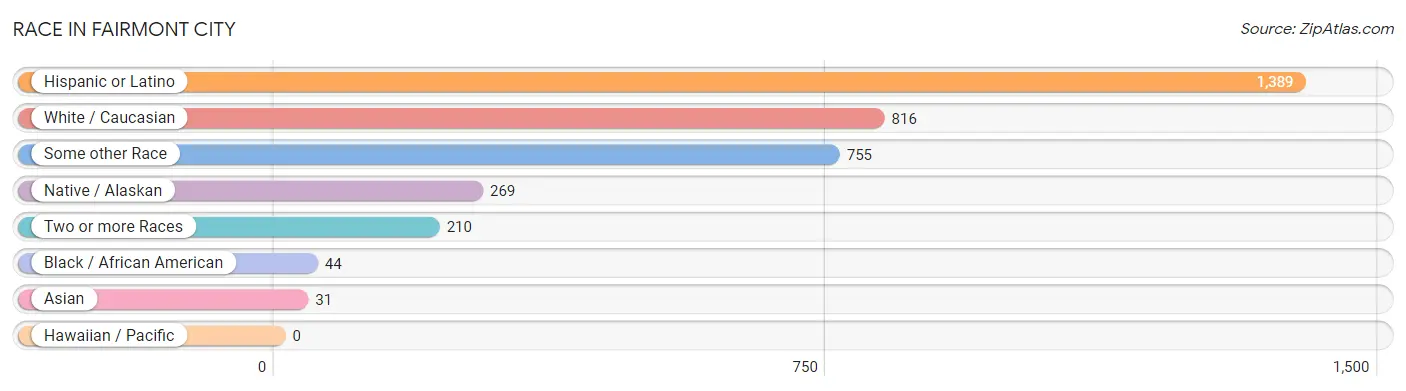
| Race | # Population | % Population |
| Asian | 31 | 1.5% |
| Black / African American | 44 | 2.1% |
| Hawaiian / Pacific | 0 | 0.0% |
| Hispanic or Latino | 1,389 | 65.4% |
| Native / Alaskan | 269 | 12.7% |
| White / Caucasian | 816 | 38.4% |
| Two or more Races | 210 | 9.9% |
| Some other Race | 755 | 35.5% |
| Total | 2,125 | 100.0% |
Ancestry in Fairmont City
The most populous ancestries reported in Fairmont City are Mexican (1,345 | 63.3%), Blackfeet (133 | 6.3%), Mexican American Indian (108 | 5.1%), German (99 | 4.7%), and Irish (52 | 2.5%), together accounting for 81.7% of all Fairmont City residents.
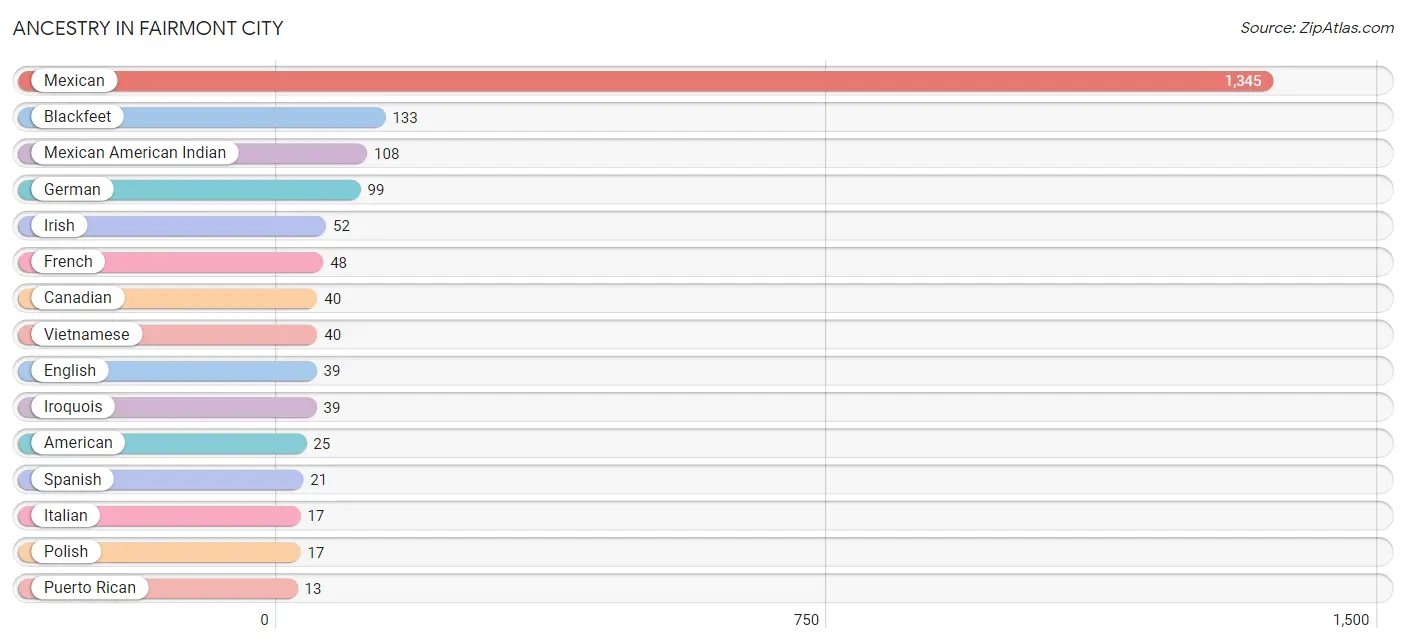
| Ancestry | # Population | % Population |
| American | 25 | 1.2% |
| Austrian | 7 | 0.3% |
| Blackfeet | 133 | 6.3% |
| British | 5 | 0.2% |
| Canadian | 40 | 1.9% |
| Croatian | 6 | 0.3% |
| English | 39 | 1.8% |
| French | 48 | 2.3% |
| French American Indian | 3 | 0.1% |
| German | 99 | 4.7% |
| Irish | 52 | 2.5% |
| Iroquois | 39 | 1.8% |
| Italian | 17 | 0.8% |
| Lithuanian | 5 | 0.2% |
| Mexican | 1,345 | 63.3% |
| Mexican American Indian | 108 | 5.1% |
| Polish | 17 | 0.8% |
| Puerto Rican | 13 | 0.6% |
| Spaniard | 10 | 0.5% |
| Spanish | 21 | 1.0% |
| Vietnamese | 40 | 1.9% | View All 21 Rows |
Immigrants in Fairmont City
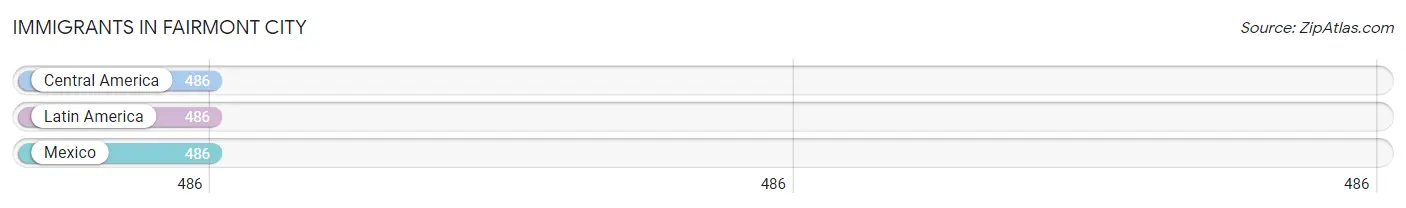
The most numerous immigrant groups reported in Fairmont City came from Central America (486 | 22.9%), Latin America (486 | 22.9%), and Mexico (486 | 22.9%), together accounting for 68.6% of all Fairmont City residents.
| Immigration Origin | # Population | % Population |
| Central America | 486 | 22.9% |
| Latin America | 486 | 22.9% |
| Mexico | 486 | 22.9% | View All 3 Rows |
Sex and Age in Fairmont City
Sex and Age in Fairmont City
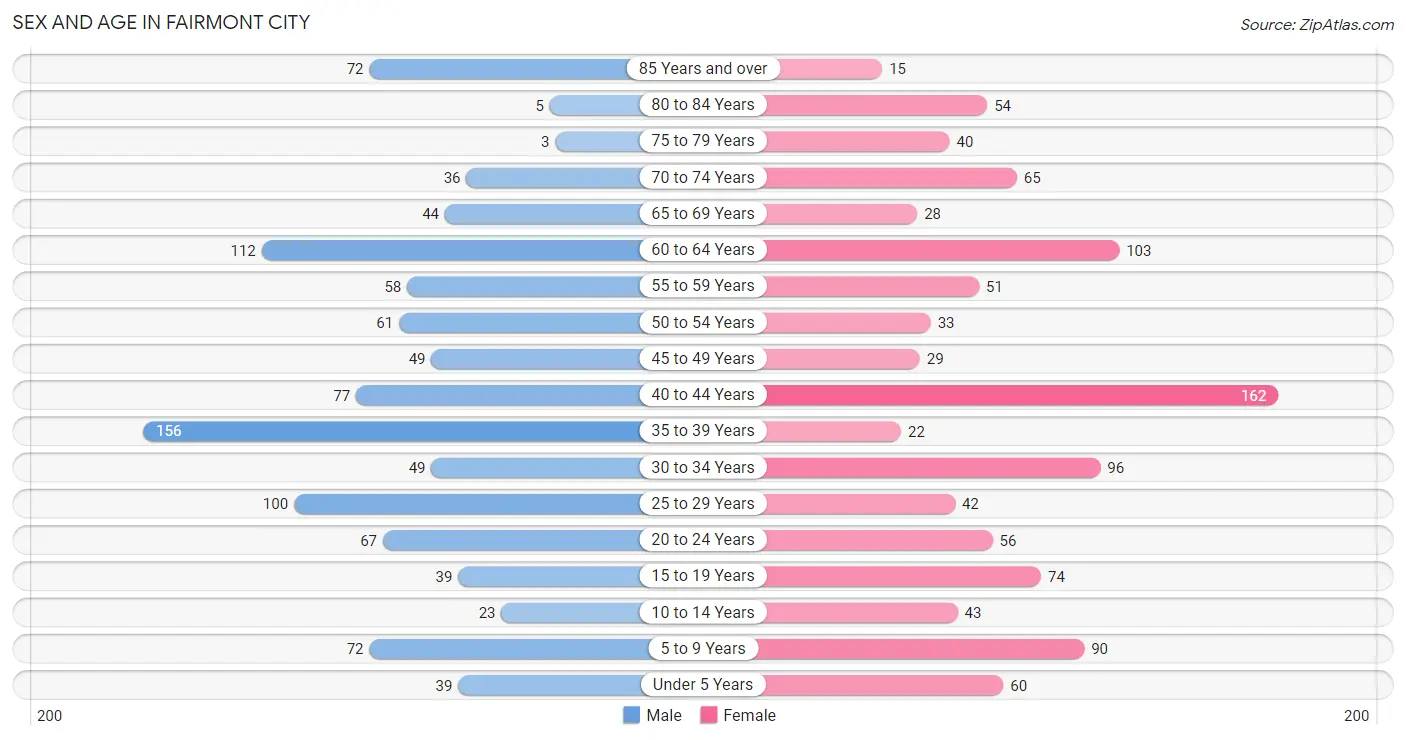
The most populous age groups in Fairmont City are 35 to 39 Years (156 | 14.7%) for men and 40 to 44 Years (162 | 15.2%) for women.
| Age Bracket | Male | Female |
| Under 5 Years | 39 (3.7%) | 60 (5.6%) |
| 5 to 9 Years | 72 (6.8%) | 90 (8.5%) |
| 10 to 14 Years | 23 (2.2%) | 43 (4.1%) |
| 15 to 19 Years | 39 (3.7%) | 74 (7.0%) |
| 20 to 24 Years | 67 (6.3%) | 56 (5.3%) |
| 25 to 29 Years | 100 (9.4%) | 42 (4.0%) |
| 30 to 34 Years | 49 (4.6%) | 96 (9.0%) |
| 35 to 39 Years | 156 (14.7%) | 22 (2.1%) |
| 40 to 44 Years | 77 (7.2%) | 162 (15.2%) |
| 45 to 49 Years | 49 (4.6%) | 29 (2.7%) |
| 50 to 54 Years | 61 (5.7%) | 33 (3.1%) |
| 55 to 59 Years | 58 (5.5%) | 51 (4.8%) |
| 60 to 64 Years | 112 (10.5%) | 103 (9.7%) |
| 65 to 69 Years | 44 (4.1%) | 28 (2.6%) |
| 70 to 74 Years | 36 (3.4%) | 65 (6.1%) |
| 75 to 79 Years | 3 (0.3%) | 40 (3.8%) |
| 80 to 84 Years | 5 (0.5%) | 54 (5.1%) |
| 85 Years and over | 72 (6.8%) | 15 (1.4%) |
| Total | 1,062 (100.0%) | 1,063 (100.0%) |
Families and Households in Fairmont City
Median Family Size in Fairmont City
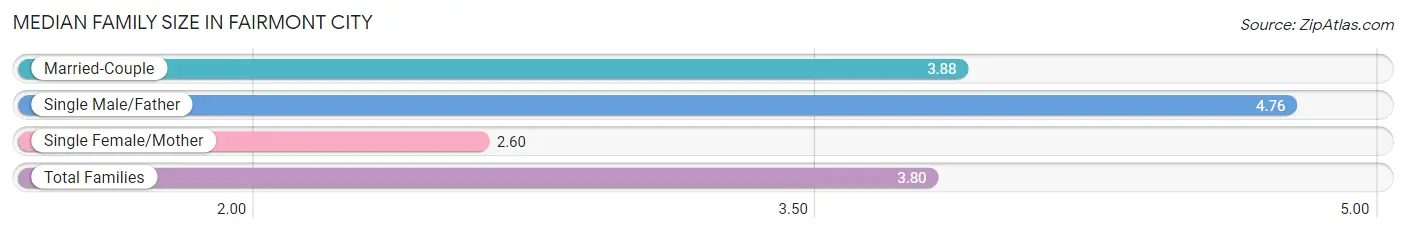
The median family size in Fairmont City is 3.80 persons per family, with single male/father families (37 | 9.1%) accounting for the largest median family size of 4.76 persons per family. On the other hand, single female/mother families (50 | 12.3%) represent the smallest median family size with 2.60 persons per family.
| Family Type | # Families | Family Size |
| Married-Couple | 318 (78.5%) | 3.88 |
| Single Male/Father | 37 (9.1%) | 4.76 |
| Single Female/Mother | 50 (12.3%) | 2.60 |
| Total Families | 405 (100.0%) | 3.80 |
Median Household Size in Fairmont City
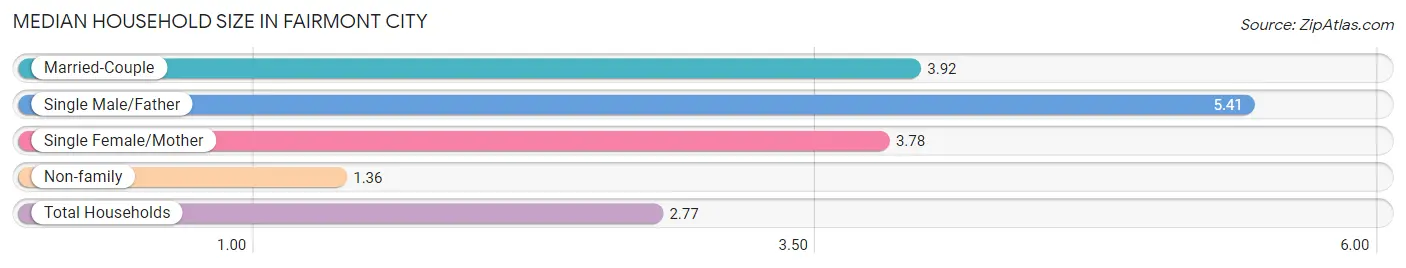
The median household size in Fairmont City is 2.77 persons per household, with single male/father households (37 | 4.8%) accounting for the largest median household size of 5.41 persons per household. non-family households (361 | 47.1%) represent the smallest median household size with 1.36 persons per household.
| Household Type | # Households | Household Size |
| Married-Couple | 318 (41.5%) | 3.92 |
| Single Male/Father | 37 (4.8%) | 5.41 |
| Single Female/Mother | 50 (6.5%) | 3.78 |
| Non-family | 361 (47.1%) | 1.36 |
| Total Households | 766 (100.0%) | 2.77 |
Household Size by Marriage Status in Fairmont City
Out of a total of 766 households in Fairmont City, 405 (52.9%) are family households, while 361 (47.1%) are nonfamily households. The most numerous type of family households are 3-person households, comprising 134, and the most common type of nonfamily households are 1-person households, comprising 315.
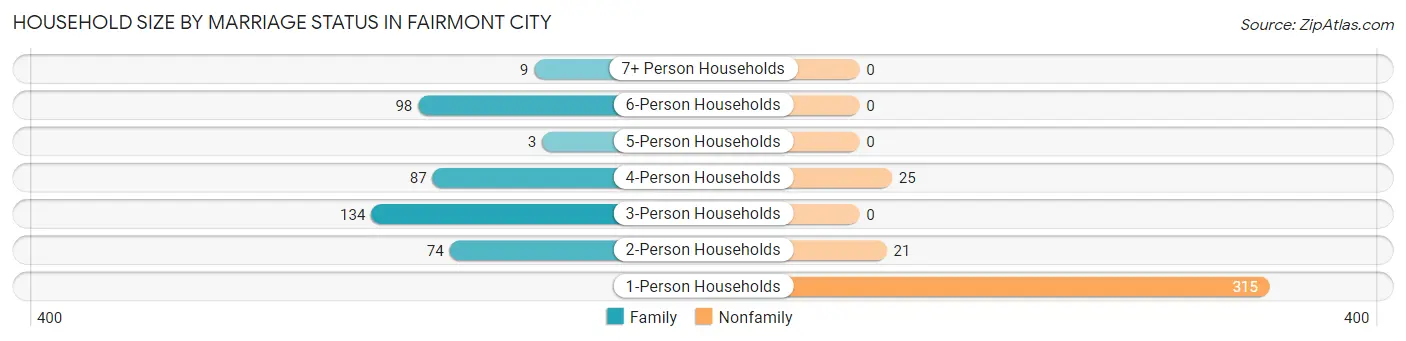
| Household Size | Family Households | Nonfamily Households |
| 1-Person Households | - | 315 (41.1%) |
| 2-Person Households | 74 (9.7%) | 21 (2.7%) |
| 3-Person Households | 134 (17.5%) | 0 (0.0%) |
| 4-Person Households | 87 (11.4%) | 25 (3.3%) |
| 5-Person Households | 3 (0.4%) | 0 (0.0%) |
| 6-Person Households | 98 (12.8%) | 0 (0.0%) |
| 7+ Person Households | 9 (1.2%) | 0 (0.0%) |
| Total | 405 (52.9%) | 361 (47.1%) |
Female Fertility in Fairmont City
Fertility by Age in Fairmont City
Average fertility rate in Fairmont City is 29.0 births per 1,000 women. Women in the age bracket of 20 to 34 years have the highest fertility rate with 46.0 births per 1,000 women. Women in the age bracket of 20 to 34 years acount for 64.3% of all women with births.
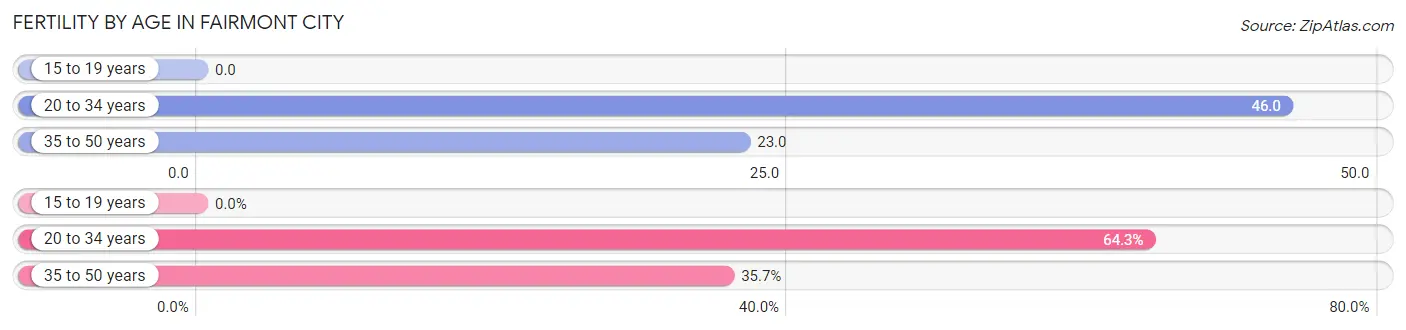
| Age Bracket | Women with Births | Births / 1,000 Women |
| 15 to 19 years | 0 (0.0%) | 0.0 |
| 20 to 34 years | 9 (64.3%) | 46.0 |
| 35 to 50 years | 5 (35.7%) | 23.0 |
| Total | 14 (100.0%) | 29.0 |
Fertility by Age by Marriage Status in Fairmont City
78.6% of women with births (14) in Fairmont City are married. The highest percentage of unmarried women with births falls into 20 to 34 years age bracket with 33.3% of them unmarried at the time of birth, while the lowest percentage of unmarried women with births belong to 35 to 50 years age bracket with 0.0% of them unmarried.
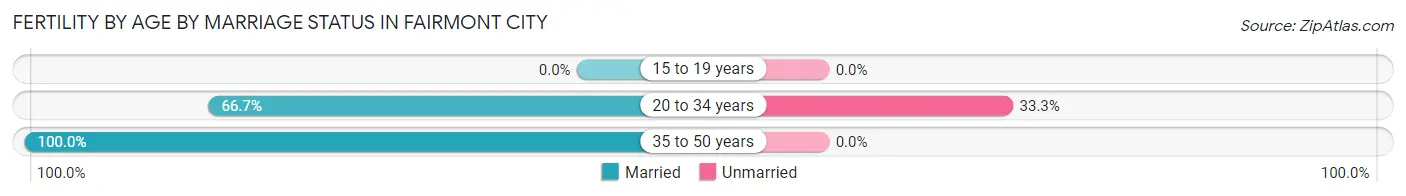
| Age Bracket | Married | Unmarried |
| 15 to 19 years | 0 (0.0%) | 0 (0.0%) |
| 20 to 34 years | 6 (66.7%) | 3 (33.3%) |
| 35 to 50 years | 5 (100.0%) | 0 (0.0%) |
| Total | 11 (78.6%) | 3 (21.4%) |
Fertility by Education in Fairmont City
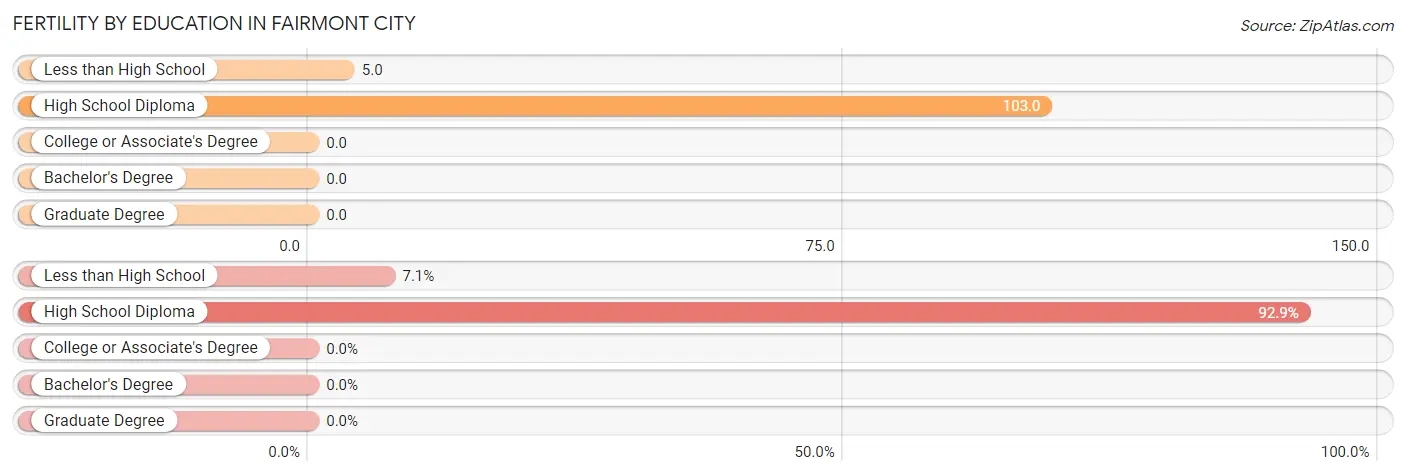
| Educational Attainment | Women with Births | Births / 1,000 Women |
| Less than High School | 1 (7.1%) | 5.0 |
| High School Diploma | 13 (92.9%) | 103.0 |
| College or Associate's Degree | 0 (0.0%) | 0.0 |
| Bachelor's Degree | 0 (0.0%) | 0.0 |
| Graduate Degree | 0 (0.0%) | 0.0 |
| Total | 14 (100.0%) | 29.0 |
Fertility by Education by Marriage Status in Fairmont City
21.4% of women with births in Fairmont City are unmarried. Women with the educational attainment of less than high school are most likely to be married with 100.0% of them married at childbirth, while women with the educational attainment of high school diploma are least likely to be married with 23.1% of them unmarried at childbirth.
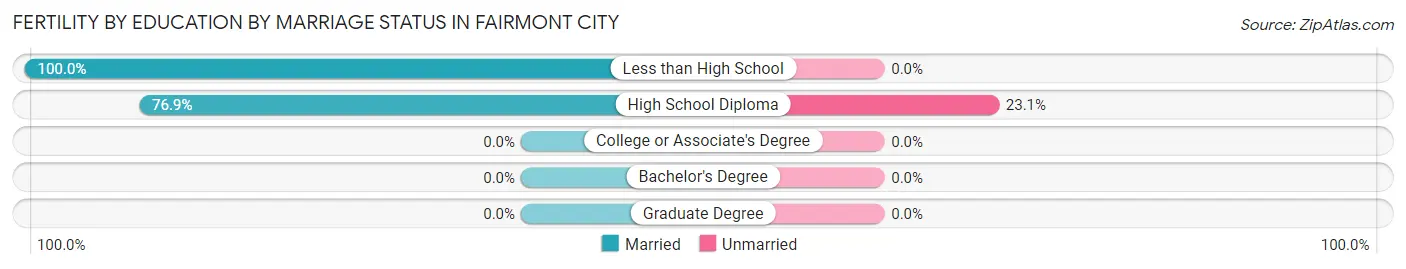
| Educational Attainment | Married | Unmarried |
| Less than High School | 1 (100.0%) | 0 (0.0%) |
| High School Diploma | 10 (76.9%) | 3 (23.1%) |
| College or Associate's Degree | 0 (0.0%) | 0 (0.0%) |
| Bachelor's Degree | 0 (0.0%) | 0 (0.0%) |
| Graduate Degree | 0 (0.0%) | 0 (0.0%) |
| Total | 11 (78.6%) | 3 (21.4%) |
Employment Characteristics in Fairmont City
Employment by Class of Employer in Fairmont City
Among the 891 employed individuals in Fairmont City, private company employees (657 | 73.7%), self-employed (not incorporated) (95 | 10.7%), and not-for-profit organizations (64 | 7.2%) make up the most common classes of employment.
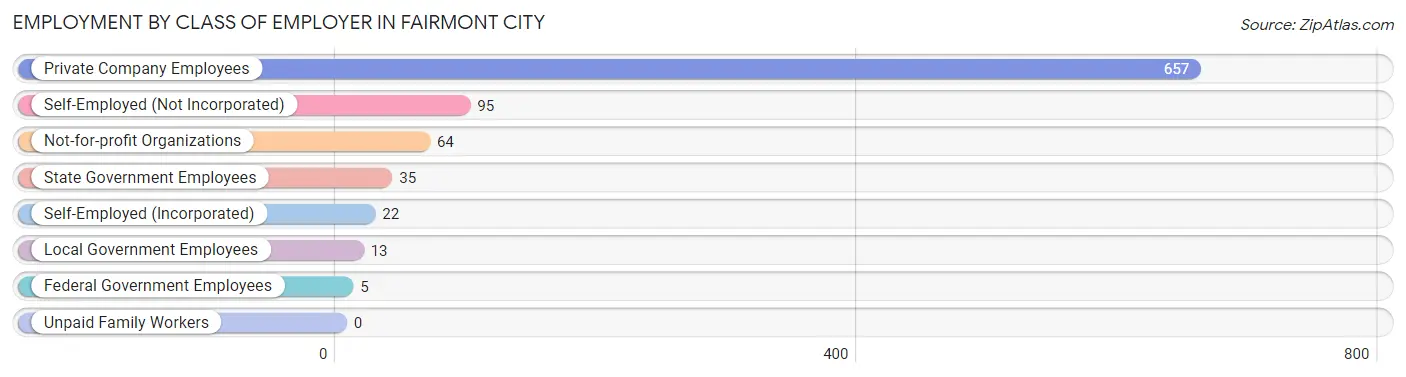
| Employer Class | # Employees | % Employees |
| Private Company Employees | 657 | 73.7% |
| Self-Employed (Incorporated) | 22 | 2.5% |
| Self-Employed (Not Incorporated) | 95 | 10.7% |
| Not-for-profit Organizations | 64 | 7.2% |
| Local Government Employees | 13 | 1.5% |
| State Government Employees | 35 | 3.9% |
| Federal Government Employees | 5 | 0.6% |
| Unpaid Family Workers | 0 | 0.0% |
| Total | 891 | 100.0% |
Employment Status by Age in Fairmont City
According to the labor force statistics for Fairmont City, out of the total population over 16 years of age (1,785), 52.3% or 934 individuals are in the labor force, with 1.2% or 11 of them unemployed. The age group with the highest labor force participation rate is 30 to 34 years, with 82.8% or 120 individuals in the labor force. Within the labor force, the 30 to 34 years age range has the highest percentage of unemployed individuals, with 6.7% or 8 of them being unemployed.
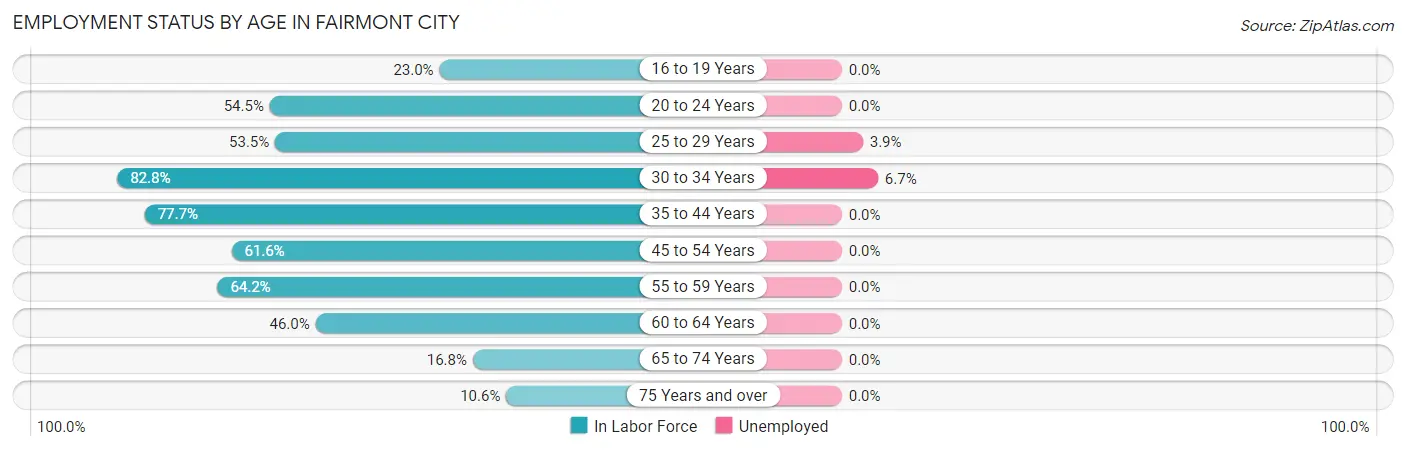
| Age Bracket | In Labor Force | Unemployed |
| 16 to 19 Years | 23 (23.0%) | 0 (0.0%) |
| 20 to 24 Years | 67 (54.5%) | 0 (0.0%) |
| 25 to 29 Years | 76 (53.5%) | 3 (3.9%) |
| 30 to 34 Years | 120 (82.8%) | 8 (6.7%) |
| 35 to 44 Years | 324 (77.7%) | 0 (0.0%) |
| 45 to 54 Years | 106 (61.6%) | 0 (0.0%) |
| 55 to 59 Years | 70 (64.2%) | 0 (0.0%) |
| 60 to 64 Years | 99 (46.0%) | 0 (0.0%) |
| 65 to 74 Years | 29 (16.8%) | 0 (0.0%) |
| 75 Years and over | 20 (10.6%) | 0 (0.0%) |
| Total | 934 (52.3%) | 11 (1.2%) |
Employment Status by Educational Attainment in Fairmont City
According to labor force statistics for Fairmont City, 66.3% of individuals (796) out of the total population between 25 and 64 years of age (1,200) are in the labor force, with 1.4% or 11 of them being unemployed. The group with the highest labor force participation rate are those with the educational attainment of bachelor's degree or higher, with 74.6% or 191 individuals in the labor force. Within the labor force, individuals with less than high school education have the highest percentage of unemployment, with 2.8% or 8 of them being unemployed.
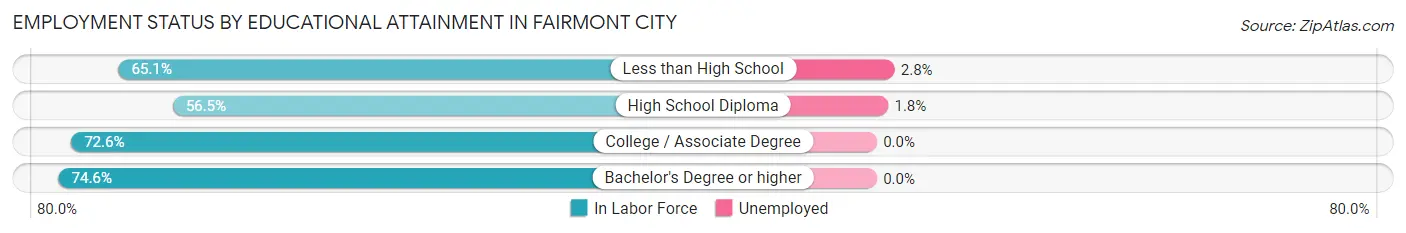
| Educational Attainment | In Labor Force | Unemployed |
| Less than High School | 283 (65.1%) | 12 (2.8%) |
| High School Diploma | 170 (56.5%) | 5 (1.8%) |
| College / Associate Degree | 151 (72.6%) | 0 (0.0%) |
| Bachelor's Degree or higher | 191 (74.6%) | 0 (0.0%) |
| Total | 796 (66.3%) | 17 (1.4%) |
Employment Occupations by Sex in Fairmont City
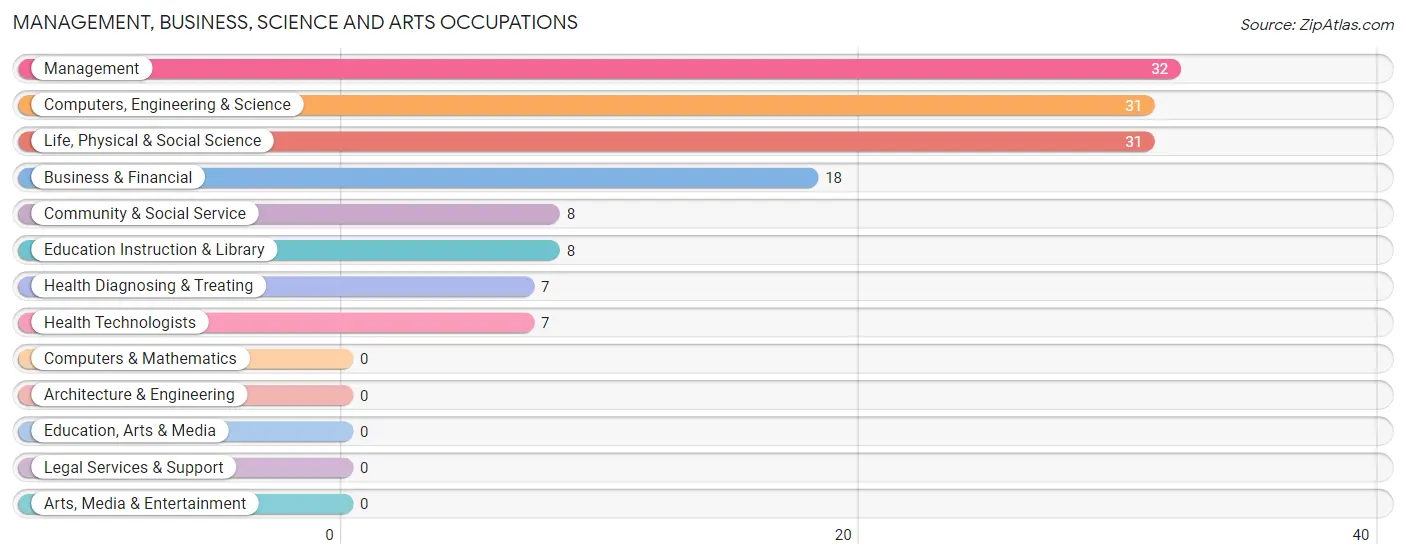
Management, Business, Science and Arts Occupations
The most common Management, Business, Science and Arts occupations in Fairmont City are Management (32 | 3.5%), Computers, Engineering & Science (31 | 3.4%), Life, Physical & Social Science (31 | 3.4%), Business & Financial (18 | 1.9%), and Community & Social Service (8 | 0.9%).
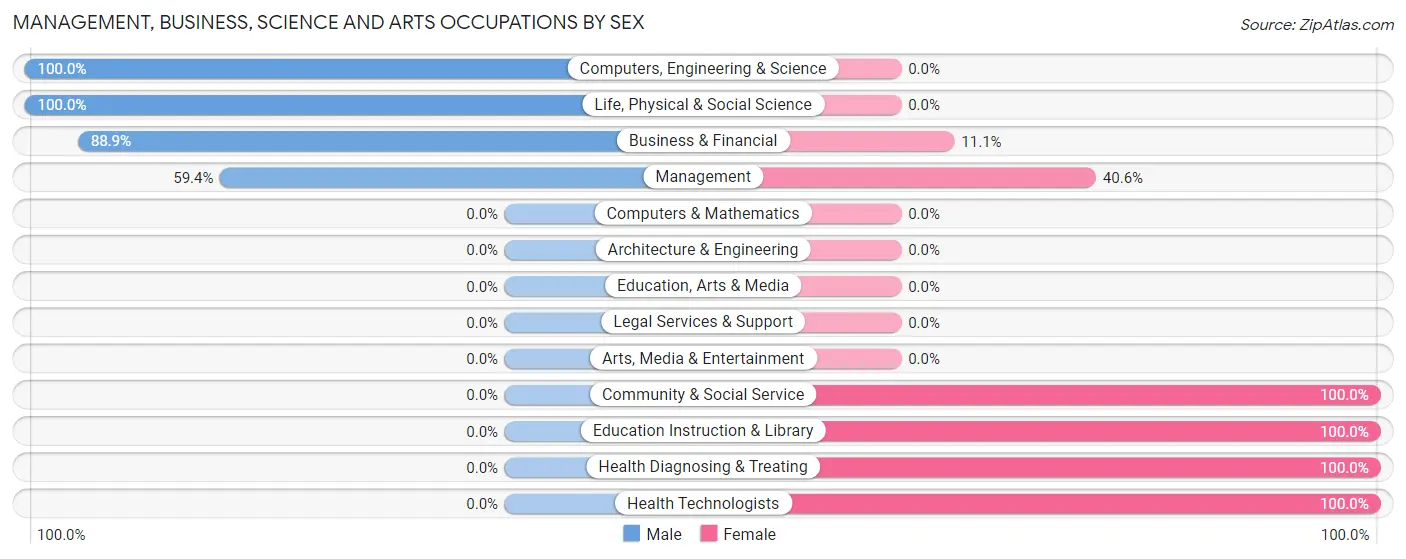
Management, Business, Science and Arts Occupations by Sex
Within the Management, Business, Science and Arts occupations in Fairmont City, the most male-oriented occupations are Computers, Engineering & Science (100.0%), Life, Physical & Social Science (100.0%), and Business & Financial (88.9%), while the most female-oriented occupations are Community & Social Service (100.0%), Education Instruction & Library (100.0%), and Health Diagnosing & Treating (100.0%).
| Occupation | Male | Female |
| Management | 19 (59.4%) | 13 (40.6%) |
| Business & Financial | 16 (88.9%) | 2 (11.1%) |
| Computers, Engineering & Science | 31 (100.0%) | 0 (0.0%) |
| Computers & Mathematics | 0 (0.0%) | 0 (0.0%) |
| Architecture & Engineering | 0 (0.0%) | 0 (0.0%) |
| Life, Physical & Social Science | 31 (100.0%) | 0 (0.0%) |
| Community & Social Service | 0 (0.0%) | 8 (100.0%) |
| Education, Arts & Media | 0 (0.0%) | 0 (0.0%) |
| Legal Services & Support | 0 (0.0%) | 0 (0.0%) |
| Education Instruction & Library | 0 (0.0%) | 8 (100.0%) |
| Arts, Media & Entertainment | 0 (0.0%) | 0 (0.0%) |
| Health Diagnosing & Treating | 0 (0.0%) | 7 (100.0%) |
| Health Technologists | 0 (0.0%) | 7 (100.0%) |
| Total (Category) | 66 (68.8%) | 30 (31.2%) |
| Total (Overall) | 624 (67.6%) | 299 (32.4%) |
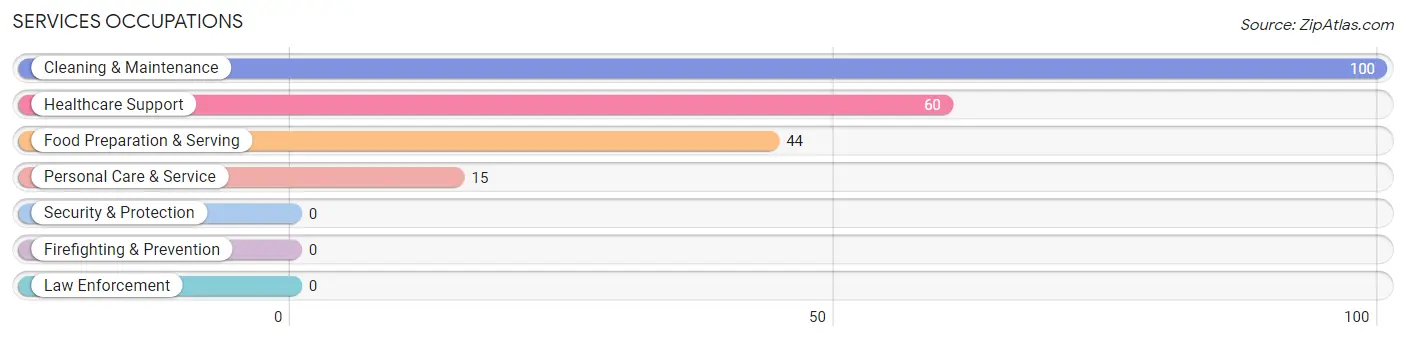
Services Occupations
The most common Services occupations in Fairmont City are Cleaning & Maintenance (100 | 10.8%), Healthcare Support (60 | 6.5%), Food Preparation & Serving (44 | 4.8%), and Personal Care & Service (15 | 1.6%).
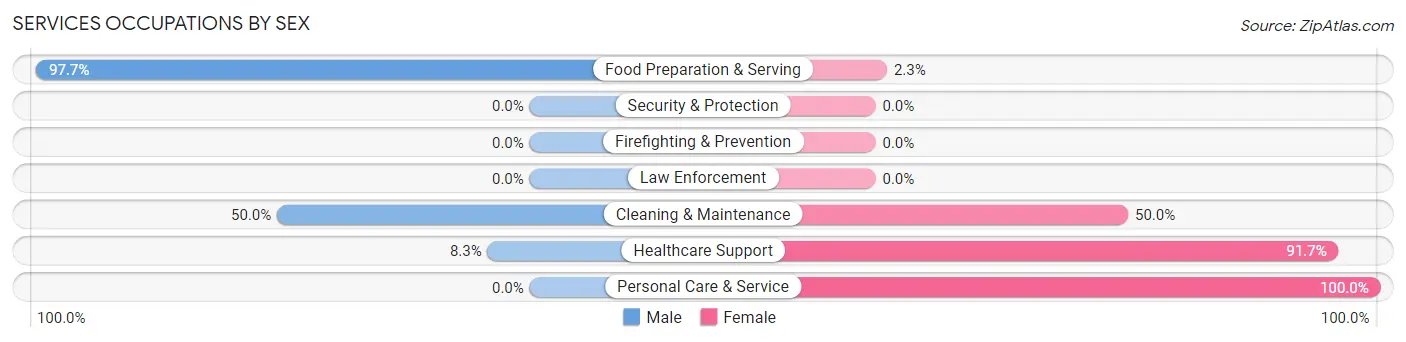
Services Occupations by Sex
Within the Services occupations in Fairmont City, the most male-oriented occupations are Food Preparation & Serving (97.7%), Cleaning & Maintenance (50.0%), and Healthcare Support (8.3%), while the most female-oriented occupations are Personal Care & Service (100.0%), Healthcare Support (91.7%), and Cleaning & Maintenance (50.0%).
| Occupation | Male | Female |
| Healthcare Support | 5 (8.3%) | 55 (91.7%) |
| Security & Protection | 0 (0.0%) | 0 (0.0%) |
| Firefighting & Prevention | 0 (0.0%) | 0 (0.0%) |
| Law Enforcement | 0 (0.0%) | 0 (0.0%) |
| Food Preparation & Serving | 43 (97.7%) | 1 (2.3%) |
| Cleaning & Maintenance | 50 (50.0%) | 50 (50.0%) |
| Personal Care & Service | 0 (0.0%) | 15 (100.0%) |
| Total (Category) | 98 (44.8%) | 121 (55.2%) |
| Total (Overall) | 624 (67.6%) | 299 (32.4%) |
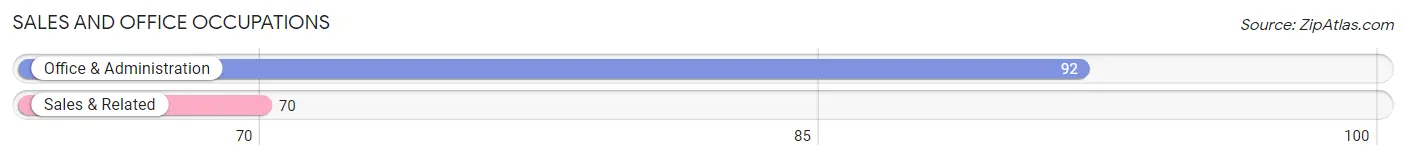
Sales and Office Occupations
The most common Sales and Office occupations in Fairmont City are Office & Administration (92 | 10.0%), and Sales & Related (70 | 7.6%).
Sales and Office Occupations by Sex
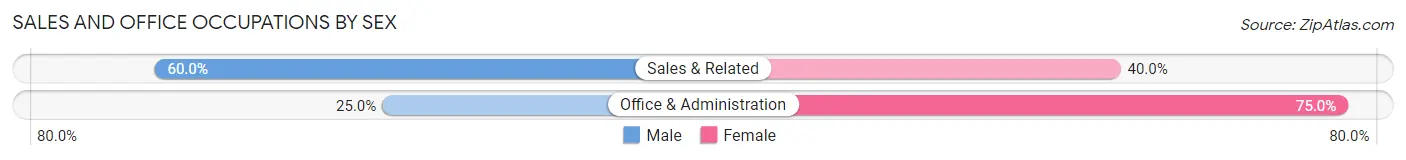
| Occupation | Male | Female |
| Sales & Related | 42 (60.0%) | 28 (40.0%) |
| Office & Administration | 23 (25.0%) | 69 (75.0%) |
| Total (Category) | 65 (40.1%) | 97 (59.9%) |
| Total (Overall) | 624 (67.6%) | 299 (32.4%) |
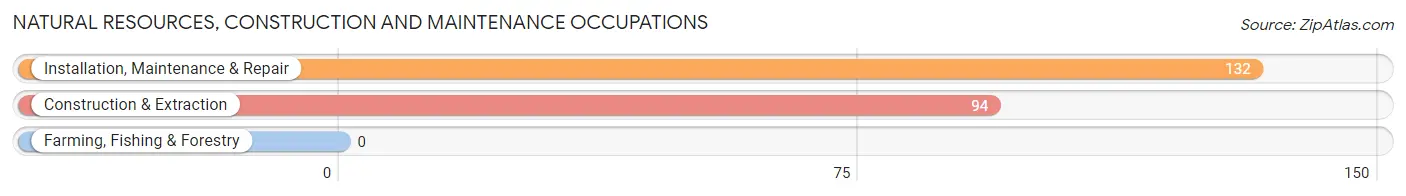
Natural Resources, Construction and Maintenance Occupations
The most common Natural Resources, Construction and Maintenance occupations in Fairmont City are Installation, Maintenance & Repair (132 | 14.3%), and Construction & Extraction (94 | 10.2%).
Natural Resources, Construction and Maintenance Occupations by Sex
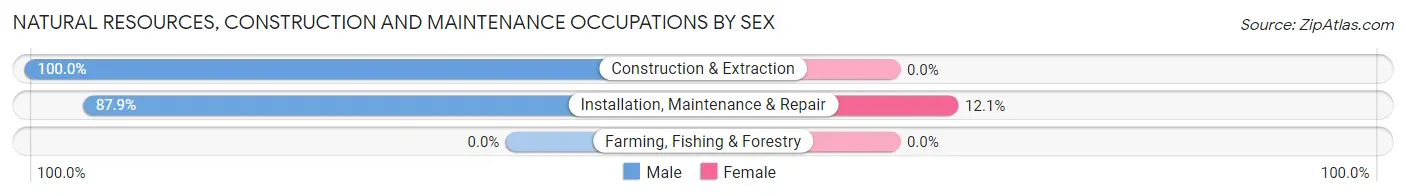
| Occupation | Male | Female |
| Farming, Fishing & Forestry | 0 (0.0%) | 0 (0.0%) |
| Construction & Extraction | 94 (100.0%) | 0 (0.0%) |
| Installation, Maintenance & Repair | 116 (87.9%) | 16 (12.1%) |
| Total (Category) | 210 (92.9%) | 16 (7.1%) |
| Total (Overall) | 624 (67.6%) | 299 (32.4%) |
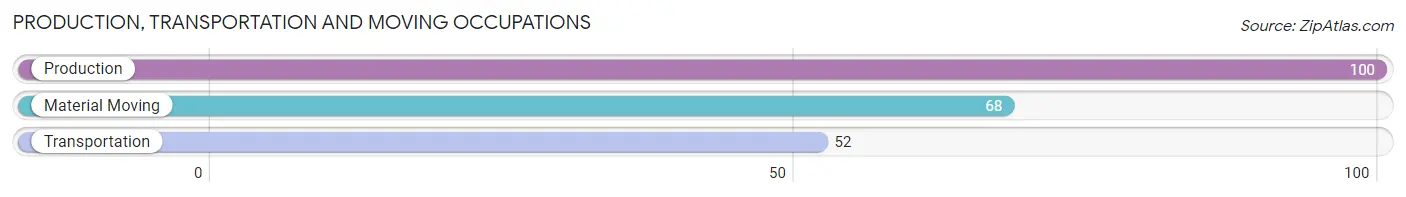
Production, Transportation and Moving Occupations
The most common Production, Transportation and Moving occupations in Fairmont City are Production (100 | 10.8%), Material Moving (68 | 7.4%), and Transportation (52 | 5.6%).
Production, Transportation and Moving Occupations by Sex
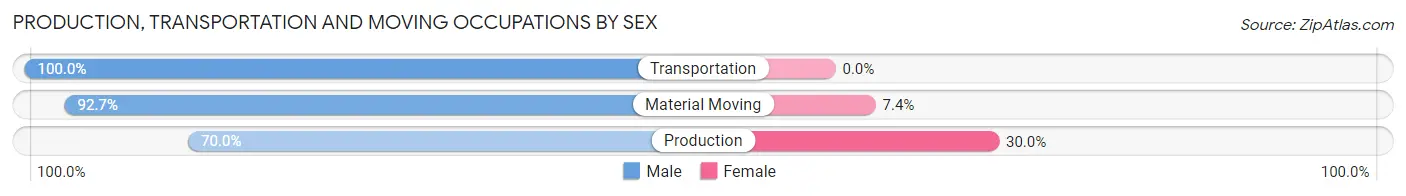
| Occupation | Male | Female |
| Production | 70 (70.0%) | 30 (30.0%) |
| Transportation | 52 (100.0%) | 0 (0.0%) |
| Material Moving | 63 (92.6%) | 5 (7.3%) |
| Total (Category) | 185 (84.1%) | 35 (15.9%) |
| Total (Overall) | 624 (67.6%) | 299 (32.4%) |
Employment Industries by Sex in Fairmont City
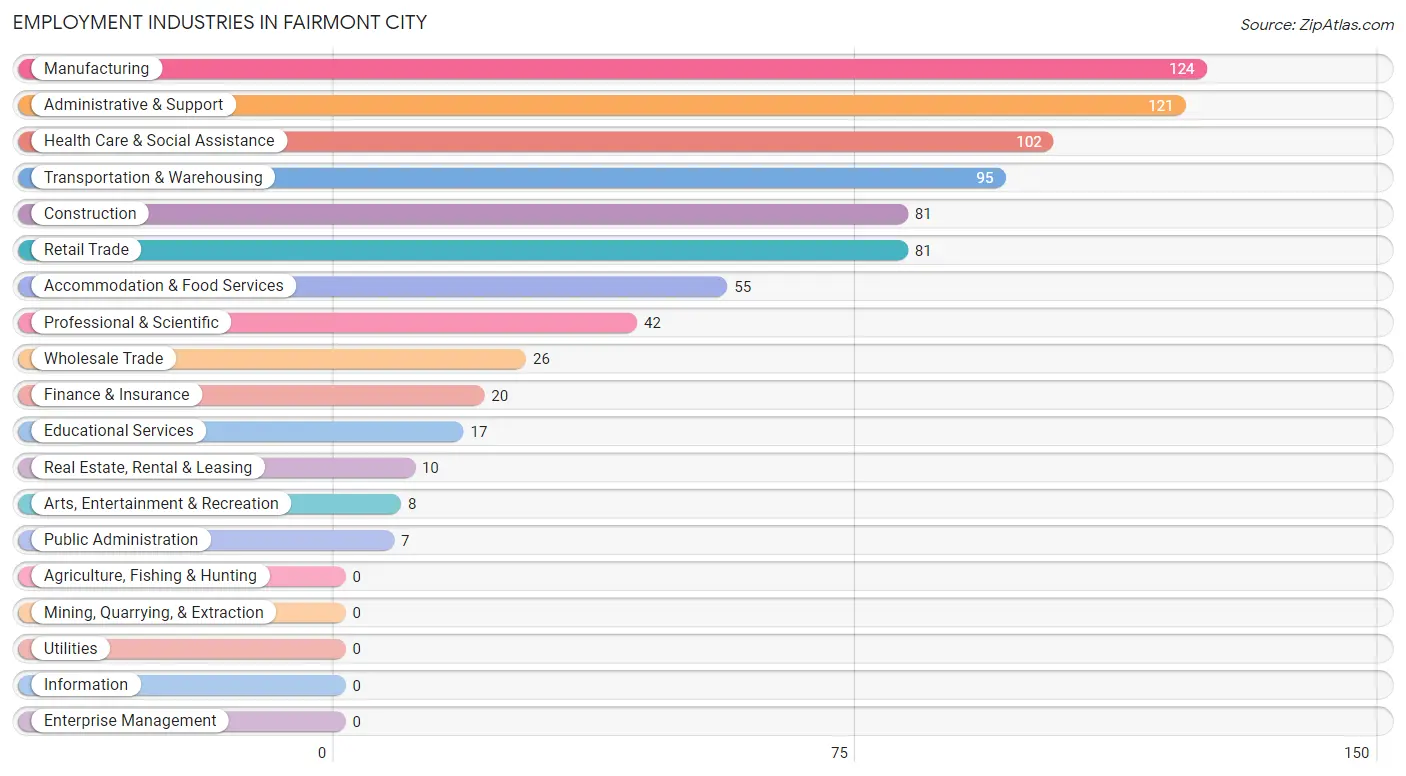
Employment Industries in Fairmont City
The major employment industries in Fairmont City include Manufacturing (124 | 13.4%), Administrative & Support (121 | 13.1%), Health Care & Social Assistance (102 | 11.1%), Transportation & Warehousing (95 | 10.3%), and Construction (81 | 8.8%).
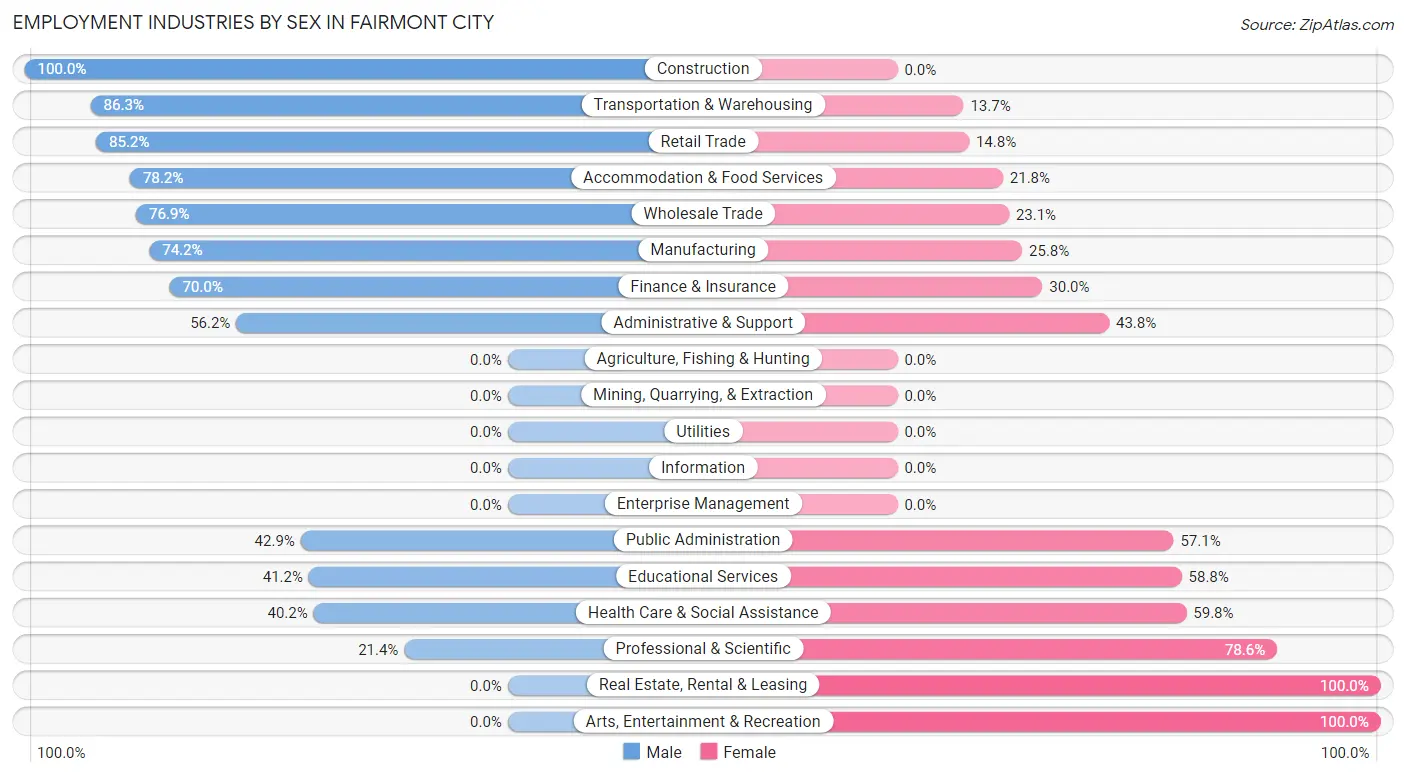
Employment Industries by Sex in Fairmont City
The Fairmont City industries that see more men than women are Construction (100.0%), Transportation & Warehousing (86.3%), and Retail Trade (85.2%), whereas the industries that tend to have a higher number of women are Real Estate, Rental & Leasing (100.0%), Arts, Entertainment & Recreation (100.0%), and Professional & Scientific (78.6%).
| Industry | Male | Female |
| Agriculture, Fishing & Hunting | 0 (0.0%) | 0 (0.0%) |
| Mining, Quarrying, & Extraction | 0 (0.0%) | 0 (0.0%) |
| Construction | 81 (100.0%) | 0 (0.0%) |
| Manufacturing | 92 (74.2%) | 32 (25.8%) |
| Wholesale Trade | 20 (76.9%) | 6 (23.1%) |
| Retail Trade | 69 (85.2%) | 12 (14.8%) |
| Transportation & Warehousing | 82 (86.3%) | 13 (13.7%) |
| Utilities | 0 (0.0%) | 0 (0.0%) |
| Information | 0 (0.0%) | 0 (0.0%) |
| Finance & Insurance | 14 (70.0%) | 6 (30.0%) |
| Real Estate, Rental & Leasing | 0 (0.0%) | 10 (100.0%) |
| Professional & Scientific | 9 (21.4%) | 33 (78.6%) |
| Enterprise Management | 0 (0.0%) | 0 (0.0%) |
| Administrative & Support | 68 (56.2%) | 53 (43.8%) |
| Educational Services | 7 (41.2%) | 10 (58.8%) |
| Health Care & Social Assistance | 41 (40.2%) | 61 (59.8%) |
| Arts, Entertainment & Recreation | 0 (0.0%) | 8 (100.0%) |
| Accommodation & Food Services | 43 (78.2%) | 12 (21.8%) |
| Public Administration | 3 (42.9%) | 4 (57.1%) |
| Total | 624 (67.6%) | 299 (32.4%) |
Education in Fairmont City
School Enrollment in Fairmont City
The most common levels of schooling among the 443 students in Fairmont City are elementary school (119 | 26.9%), high school (101 | 22.8%), and college / undergraduate (80 | 18.1%).
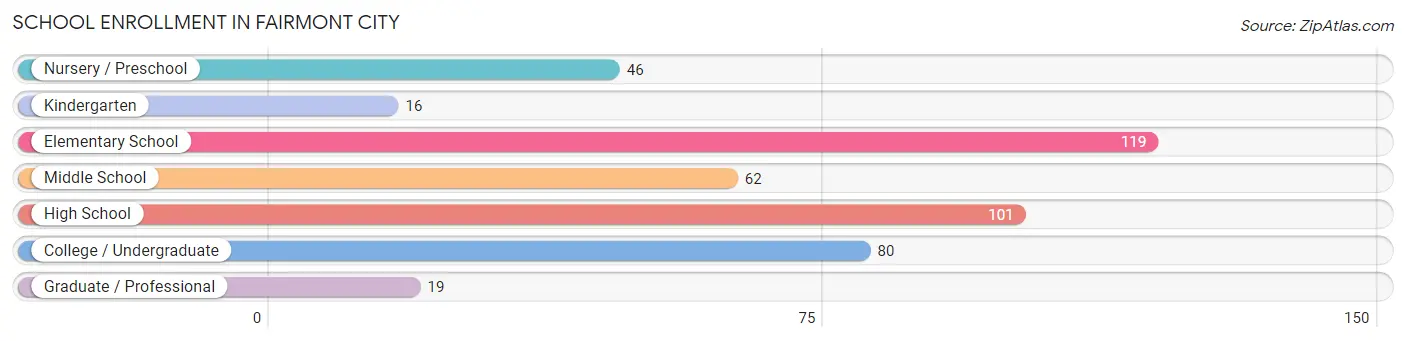
| School Level | # Students | % Students |
| Nursery / Preschool | 46 | 10.4% |
| Kindergarten | 16 | 3.6% |
| Elementary School | 119 | 26.9% |
| Middle School | 62 | 14.0% |
| High School | 101 | 22.8% |
| College / Undergraduate | 80 | 18.1% |
| Graduate / Professional | 19 | 4.3% |
| Total | 443 | 100.0% |
School Enrollment by Age by Funding Source in Fairmont City
Out of a total of 443 students who are enrolled in schools in Fairmont City, 90 (20.3%) attend a private institution, while the remaining 353 (79.7%) are enrolled in public schools. The age group of 3 to 4 year olds has the highest likelihood of being enrolled in private schools, with 11 (73.3% in the age bracket) enrolled. Conversely, the age group of 18 to 19 year olds has the lowest likelihood of being enrolled in a private school, with 15 (100.0% in the age bracket) attending a public institution.
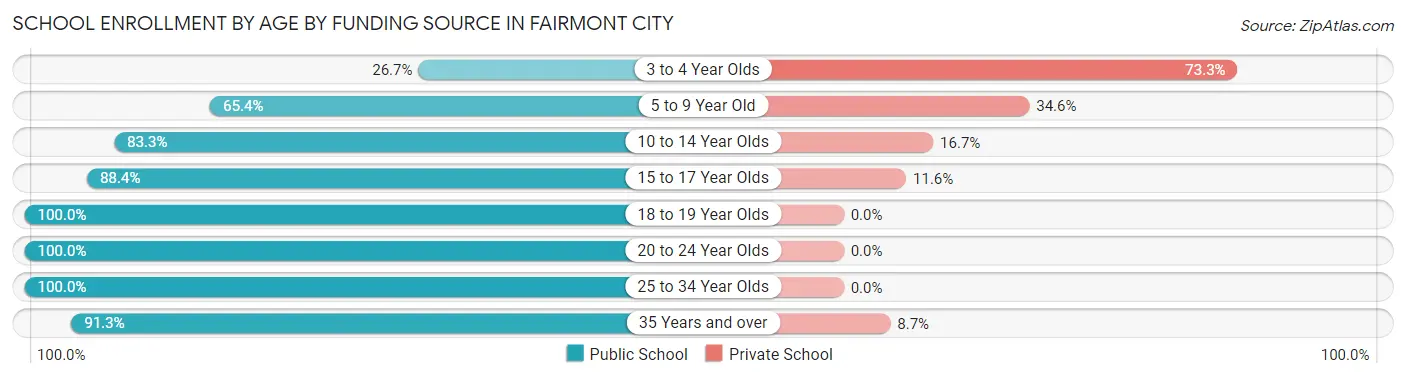
| Age Bracket | Public School | Private School |
| 3 to 4 Year Olds | 4 (26.7%) | 11 (73.3%) |
| 5 to 9 Year Old | 106 (65.4%) | 56 (34.6%) |
| 10 to 14 Year Olds | 55 (83.3%) | 11 (16.7%) |
| 15 to 17 Year Olds | 76 (88.4%) | 10 (11.6%) |
| 18 to 19 Year Olds | 15 (100.0%) | 0 (0.0%) |
| 20 to 24 Year Olds | 32 (100.0%) | 0 (0.0%) |
| 25 to 34 Year Olds | 44 (100.0%) | 0 (0.0%) |
| 35 Years and over | 21 (91.3%) | 2 (8.7%) |
| Total | 353 (79.7%) | 90 (20.3%) |
Educational Attainment by Field of Study in Fairmont City
Engineering (65 | 25.0%), business (57 | 21.9%), science & technology (44 | 16.9%), arts & humanities (34 | 13.1%), and communications (28 | 10.8%) are the most common fields of study among 260 individuals in Fairmont City who have obtained a bachelor's degree or higher.
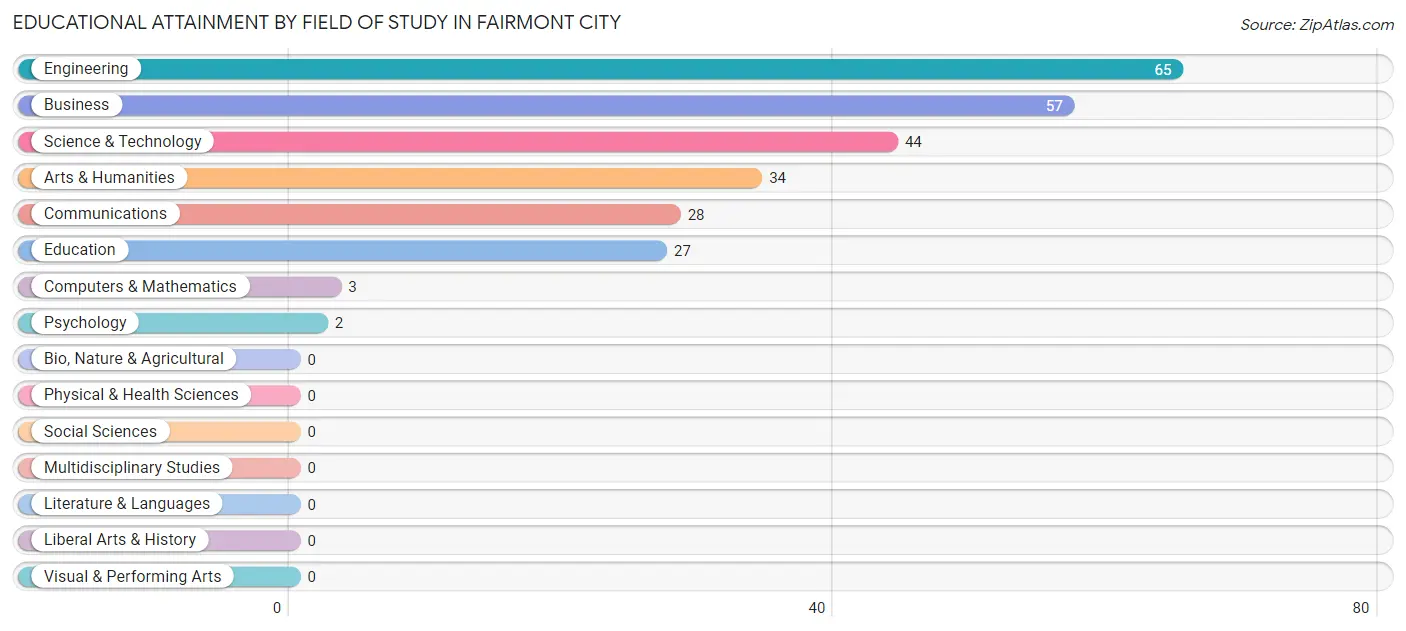
| Field of Study | # Graduates | % Graduates |
| Computers & Mathematics | 3 | 1.1% |
| Bio, Nature & Agricultural | 0 | 0.0% |
| Physical & Health Sciences | 0 | 0.0% |
| Psychology | 2 | 0.8% |
| Social Sciences | 0 | 0.0% |
| Engineering | 65 | 25.0% |
| Multidisciplinary Studies | 0 | 0.0% |
| Science & Technology | 44 | 16.9% |
| Business | 57 | 21.9% |
| Education | 27 | 10.4% |
| Literature & Languages | 0 | 0.0% |
| Liberal Arts & History | 0 | 0.0% |
| Visual & Performing Arts | 0 | 0.0% |
| Communications | 28 | 10.8% |
| Arts & Humanities | 34 | 13.1% |
| Total | 260 | 100.0% |
Transportation & Commute in Fairmont City
Vehicle Availability by Sex in Fairmont City
The most prevalent vehicle ownership categories in Fairmont City are males with 4 vehicles (211, accounting for 35.0%) and females with 4 vehicles (29, making up 73.0%).
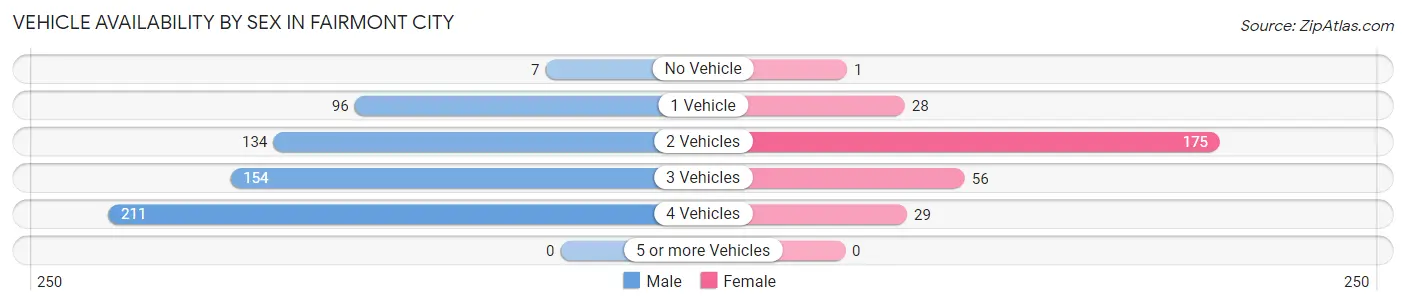
| Vehicles Available | Male | Female |
| No Vehicle | 7 (1.2%) | 1 (0.4%) |
| 1 Vehicle | 96 (16.0%) | 28 (9.7%) |
| 2 Vehicles | 134 (22.3%) | 175 (60.6%) |
| 3 Vehicles | 154 (25.6%) | 56 (19.4%) |
| 4 Vehicles | 211 (35.0%) | 29 (10.0%) |
| 5 or more Vehicles | 0 (0.0%) | 0 (0.0%) |
| Total | 602 (100.0%) | 289 (100.0%) |
Commute Time in Fairmont City
The most frequently occuring commute durations in Fairmont City are 20 to 24 minutes (208 commuters, 25.4%), 15 to 19 minutes (200 commuters, 24.4%), and 10 to 14 minutes (122 commuters, 14.9%).
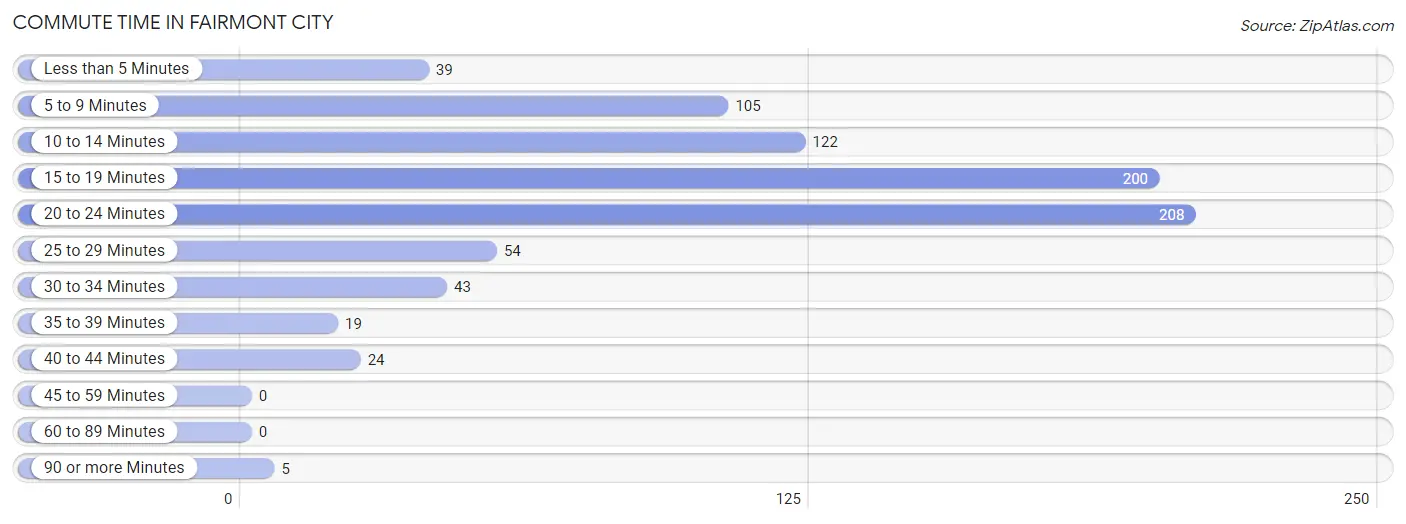
| Commute Time | # Commuters | % Commuters |
| Less than 5 Minutes | 39 | 4.8% |
| 5 to 9 Minutes | 105 | 12.8% |
| 10 to 14 Minutes | 122 | 14.9% |
| 15 to 19 Minutes | 200 | 24.4% |
| 20 to 24 Minutes | 208 | 25.4% |
| 25 to 29 Minutes | 54 | 6.6% |
| 30 to 34 Minutes | 43 | 5.2% |
| 35 to 39 Minutes | 19 | 2.3% |
| 40 to 44 Minutes | 24 | 2.9% |
| 45 to 59 Minutes | 0 | 0.0% |
| 60 to 89 Minutes | 0 | 0.0% |
| 90 or more Minutes | 5 | 0.6% |
Commute Time by Sex in Fairmont City
The most common commute times in Fairmont City are 20 to 24 minutes (127 commuters, 21.9%) for males and 20 to 24 minutes (81 commuters, 33.8%) for females.
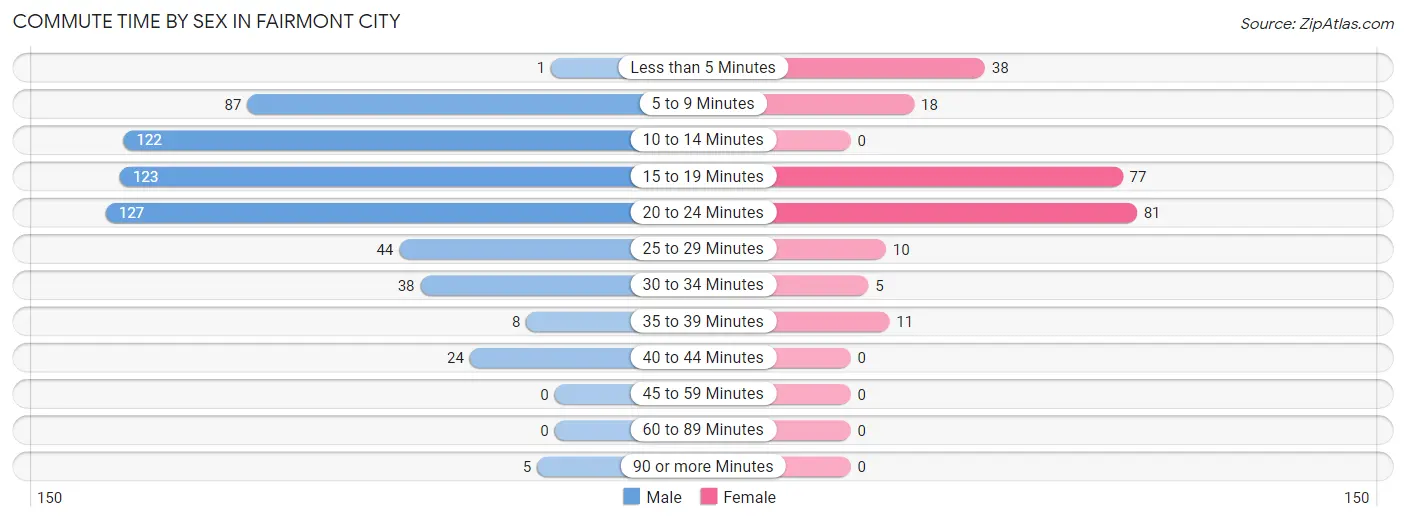
| Commute Time | Male | Female |
| Less than 5 Minutes | 1 (0.2%) | 38 (15.8%) |
| 5 to 9 Minutes | 87 (15.0%) | 18 (7.5%) |
| 10 to 14 Minutes | 122 (21.1%) | 0 (0.0%) |
| 15 to 19 Minutes | 123 (21.2%) | 77 (32.1%) |
| 20 to 24 Minutes | 127 (21.9%) | 81 (33.8%) |
| 25 to 29 Minutes | 44 (7.6%) | 10 (4.2%) |
| 30 to 34 Minutes | 38 (6.6%) | 5 (2.1%) |
| 35 to 39 Minutes | 8 (1.4%) | 11 (4.6%) |
| 40 to 44 Minutes | 24 (4.2%) | 0 (0.0%) |
| 45 to 59 Minutes | 0 (0.0%) | 0 (0.0%) |
| 60 to 89 Minutes | 0 (0.0%) | 0 (0.0%) |
| 90 or more Minutes | 5 (0.9%) | 0 (0.0%) |
Time of Departure to Work by Sex in Fairmont City
The most frequent times of departure to work in Fairmont City are 12:00 AM to 4:59 AM (119, 20.5%) for males and 5:30 AM to 5:59 AM (50, 20.8%) for females.
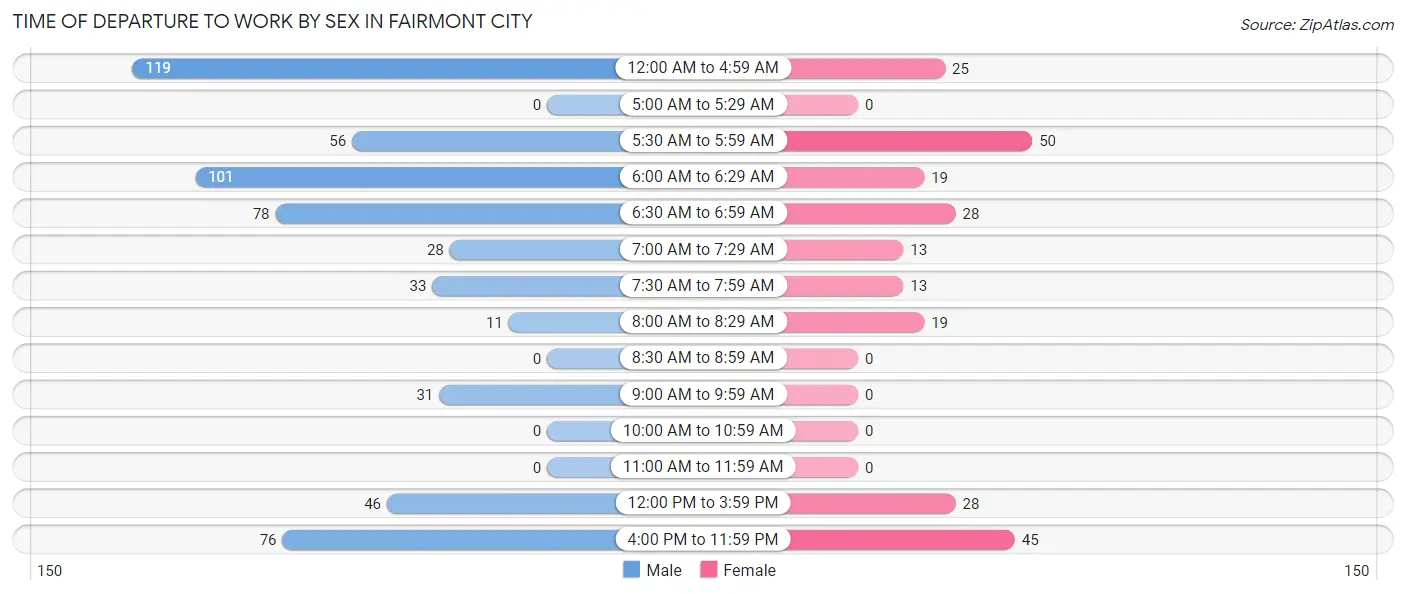
| Time of Departure | Male | Female |
| 12:00 AM to 4:59 AM | 119 (20.5%) | 25 (10.4%) |
| 5:00 AM to 5:29 AM | 0 (0.0%) | 0 (0.0%) |
| 5:30 AM to 5:59 AM | 56 (9.7%) | 50 (20.8%) |
| 6:00 AM to 6:29 AM | 101 (17.4%) | 19 (7.9%) |
| 6:30 AM to 6:59 AM | 78 (13.5%) | 28 (11.7%) |
| 7:00 AM to 7:29 AM | 28 (4.8%) | 13 (5.4%) |
| 7:30 AM to 7:59 AM | 33 (5.7%) | 13 (5.4%) |
| 8:00 AM to 8:29 AM | 11 (1.9%) | 19 (7.9%) |
| 8:30 AM to 8:59 AM | 0 (0.0%) | 0 (0.0%) |
| 9:00 AM to 9:59 AM | 31 (5.3%) | 0 (0.0%) |
| 10:00 AM to 10:59 AM | 0 (0.0%) | 0 (0.0%) |
| 11:00 AM to 11:59 AM | 0 (0.0%) | 0 (0.0%) |
| 12:00 PM to 3:59 PM | 46 (7.9%) | 28 (11.7%) |
| 4:00 PM to 11:59 PM | 76 (13.1%) | 45 (18.8%) |
| Total | 579 (100.0%) | 240 (100.0%) |
Housing Occupancy in Fairmont City
Occupancy by Ownership in Fairmont City
Of the total 766 dwellings in Fairmont City, owner-occupied units account for 536 (70.0%), while renter-occupied units make up 230 (30.0%).
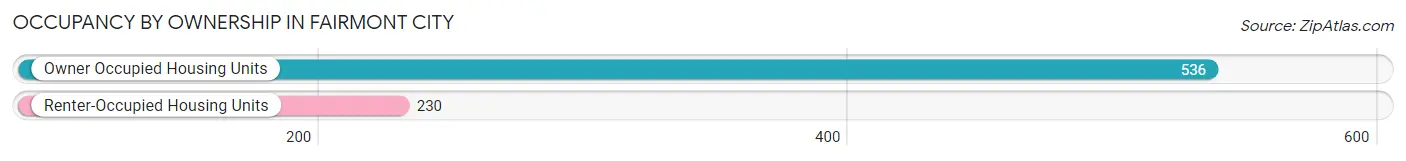
| Occupancy | # Housing Units | % Housing Units |
| Owner Occupied Housing Units | 536 | 70.0% |
| Renter-Occupied Housing Units | 230 | 30.0% |
| Total Occupied Housing Units | 766 | 100.0% |
Occupancy by Household Size in Fairmont City
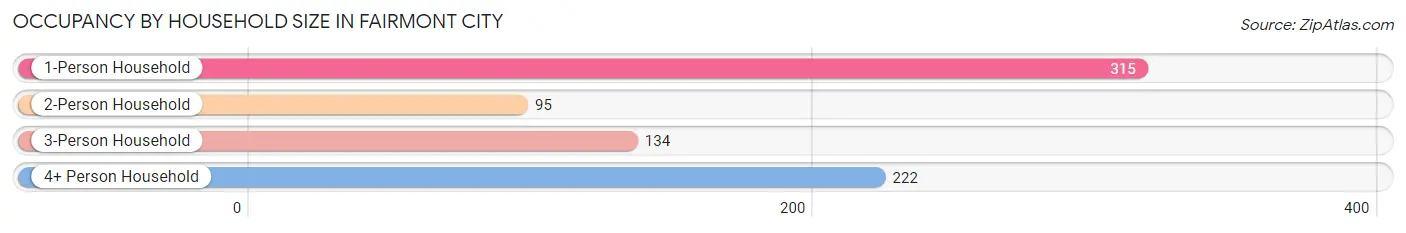
| Household Size | # Housing Units | % Housing Units |
| 1-Person Household | 315 | 41.1% |
| 2-Person Household | 95 | 12.4% |
| 3-Person Household | 134 | 17.5% |
| 4+ Person Household | 222 | 29.0% |
| Total Housing Units | 766 | 100.0% |
Occupancy by Ownership by Household Size in Fairmont City
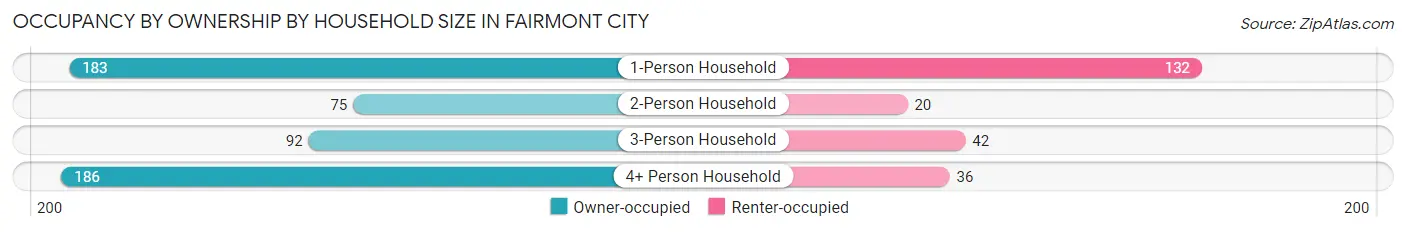
| Household Size | Owner-occupied | Renter-occupied |
| 1-Person Household | 183 (58.1%) | 132 (41.9%) |
| 2-Person Household | 75 (78.9%) | 20 (21.0%) |
| 3-Person Household | 92 (68.7%) | 42 (31.3%) |
| 4+ Person Household | 186 (83.8%) | 36 (16.2%) |
| Total Housing Units | 536 (70.0%) | 230 (30.0%) |
Occupancy by Educational Attainment in Fairmont City
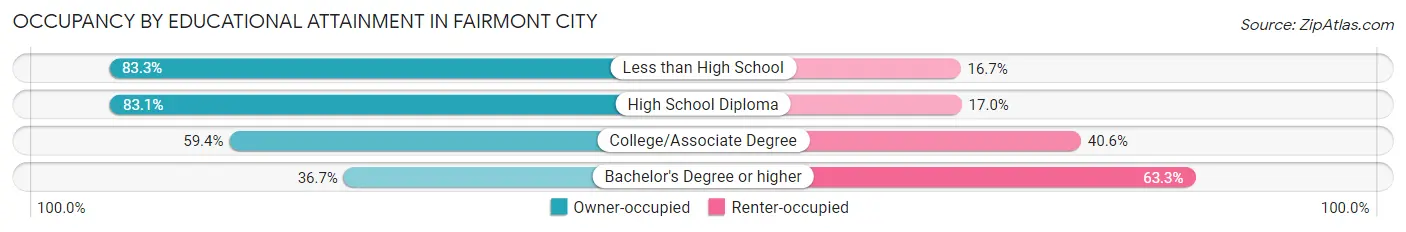
| Household Size | Owner-occupied | Renter-occupied |
| Less than High School | 204 (83.3%) | 41 (16.7%) |
| High School Diploma | 196 (83.1%) | 40 (17.0%) |
| College/Associate Degree | 82 (59.4%) | 56 (40.6%) |
| Bachelor's Degree or higher | 54 (36.7%) | 93 (63.3%) |
Occupancy by Age of Householder in Fairmont City
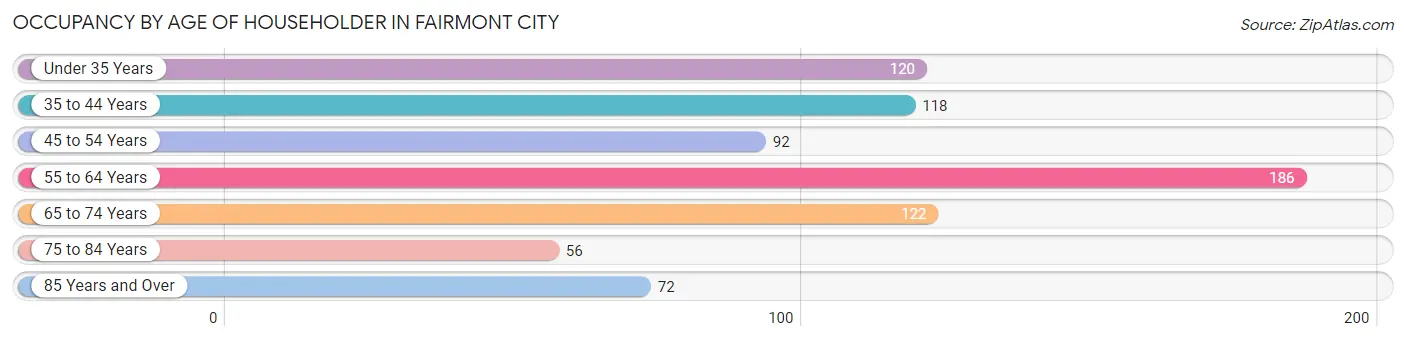
| Age Bracket | # Households | % Households |
| Under 35 Years | 120 | 15.7% |
| 35 to 44 Years | 118 | 15.4% |
| 45 to 54 Years | 92 | 12.0% |
| 55 to 64 Years | 186 | 24.3% |
| 65 to 74 Years | 122 | 15.9% |
| 75 to 84 Years | 56 | 7.3% |
| 85 Years and Over | 72 | 9.4% |
| Total | 766 | 100.0% |
Housing Finances in Fairmont City
Median Income by Occupancy in Fairmont City
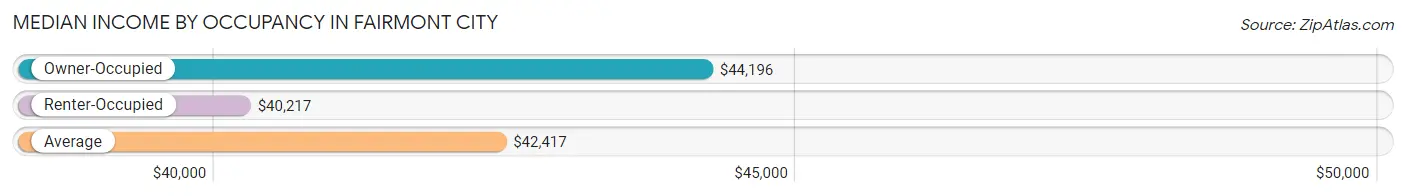
| Occupancy Type | # Households | Median Income |
| Owner-Occupied | 536 (70.0%) | $44,196 |
| Renter-Occupied | 230 (30.0%) | $40,217 |
| Average | 766 (100.0%) | $42,417 |
Occupancy by Householder Income Bracket in Fairmont City
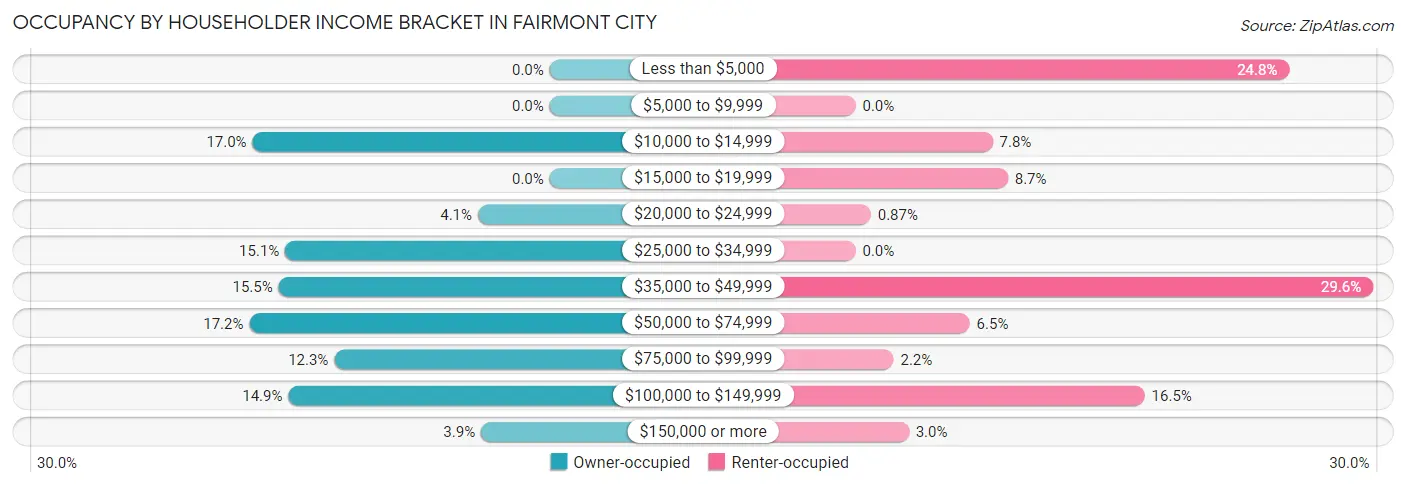
| Income Bracket | Owner-occupied | Renter-occupied |
| Less than $5,000 | 0 (0.0%) | 57 (24.8%) |
| $5,000 to $9,999 | 0 (0.0%) | 0 (0.0%) |
| $10,000 to $14,999 | 91 (17.0%) | 18 (7.8%) |
| $15,000 to $19,999 | 0 (0.0%) | 20 (8.7%) |
| $20,000 to $24,999 | 22 (4.1%) | 2 (0.9%) |
| $25,000 to $34,999 | 81 (15.1%) | 0 (0.0%) |
| $35,000 to $49,999 | 83 (15.5%) | 68 (29.6%) |
| $50,000 to $74,999 | 92 (17.2%) | 15 (6.5%) |
| $75,000 to $99,999 | 66 (12.3%) | 5 (2.2%) |
| $100,000 to $149,999 | 80 (14.9%) | 38 (16.5%) |
| $150,000 or more | 21 (3.9%) | 7 (3.0%) |
| Total | 536 (100.0%) | 230 (100.0%) |
Monthly Housing Cost Tiers in Fairmont City
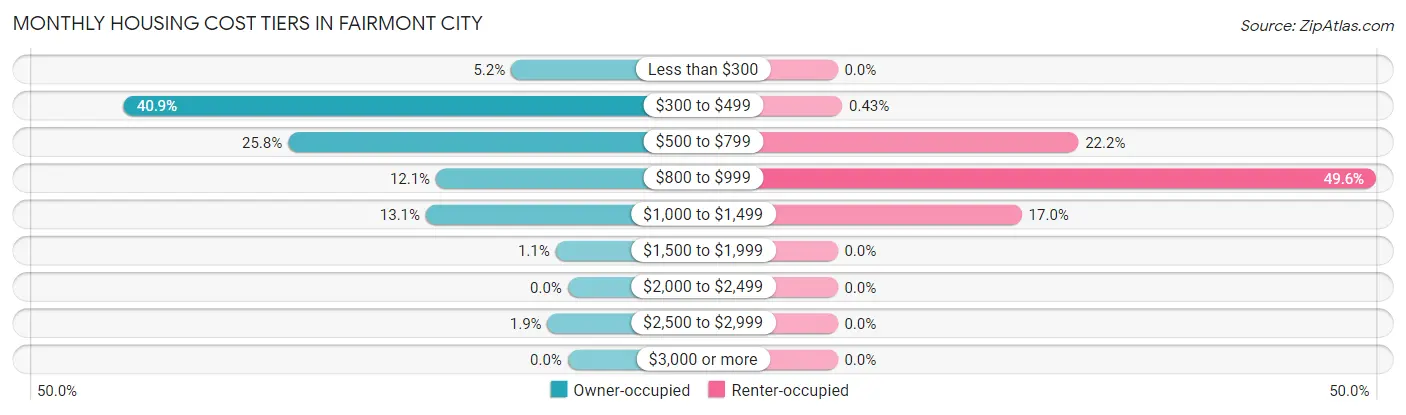
| Monthly Cost | Owner-occupied | Renter-occupied |
| Less than $300 | 28 (5.2%) | 0 (0.0%) |
| $300 to $499 | 219 (40.9%) | 1 (0.4%) |
| $500 to $799 | 138 (25.8%) | 51 (22.2%) |
| $800 to $999 | 65 (12.1%) | 114 (49.6%) |
| $1,000 to $1,499 | 70 (13.1%) | 39 (17.0%) |
| $1,500 to $1,999 | 6 (1.1%) | 0 (0.0%) |
| $2,000 to $2,499 | 0 (0.0%) | 0 (0.0%) |
| $2,500 to $2,999 | 10 (1.9%) | 0 (0.0%) |
| $3,000 or more | 0 (0.0%) | 0 (0.0%) |
| Total | 536 (100.0%) | 230 (100.0%) |
Physical Housing Characteristics in Fairmont City
Housing Structures in Fairmont City
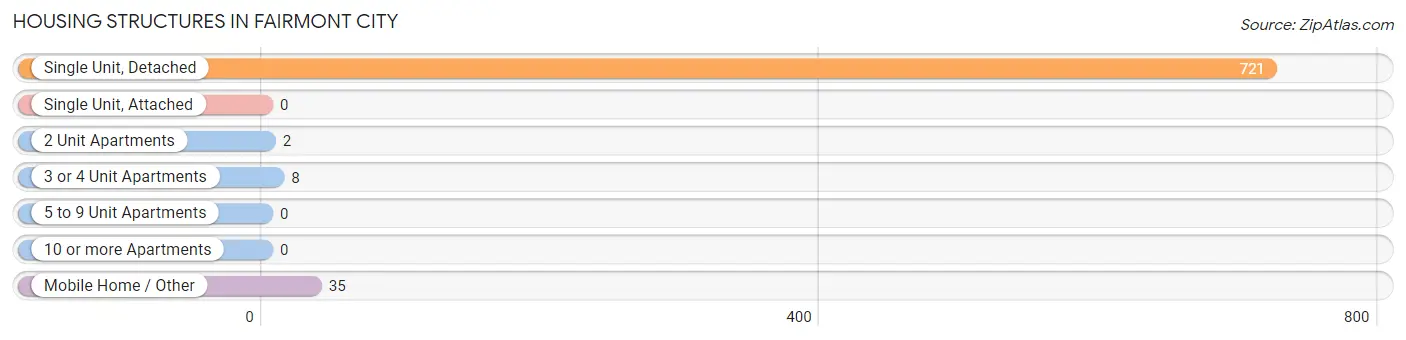
| Structure Type | # Housing Units | % Housing Units |
| Single Unit, Detached | 721 | 94.1% |
| Single Unit, Attached | 0 | 0.0% |
| 2 Unit Apartments | 2 | 0.3% |
| 3 or 4 Unit Apartments | 8 | 1.0% |
| 5 to 9 Unit Apartments | 0 | 0.0% |
| 10 or more Apartments | 0 | 0.0% |
| Mobile Home / Other | 35 | 4.6% |
| Total | 766 | 100.0% |
Housing Structures by Occupancy in Fairmont City
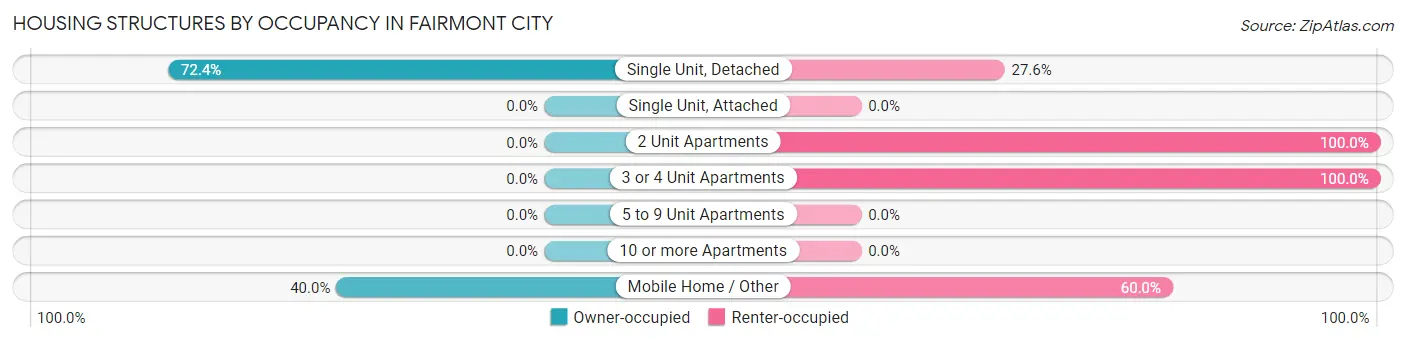
| Structure Type | Owner-occupied | Renter-occupied |
| Single Unit, Detached | 522 (72.4%) | 199 (27.6%) |
| Single Unit, Attached | 0 (0.0%) | 0 (0.0%) |
| 2 Unit Apartments | 0 (0.0%) | 2 (100.0%) |
| 3 or 4 Unit Apartments | 0 (0.0%) | 8 (100.0%) |
| 5 to 9 Unit Apartments | 0 (0.0%) | 0 (0.0%) |
| 10 or more Apartments | 0 (0.0%) | 0 (0.0%) |
| Mobile Home / Other | 14 (40.0%) | 21 (60.0%) |
| Total | 536 (70.0%) | 230 (30.0%) |
Housing Structures by Number of Rooms in Fairmont City
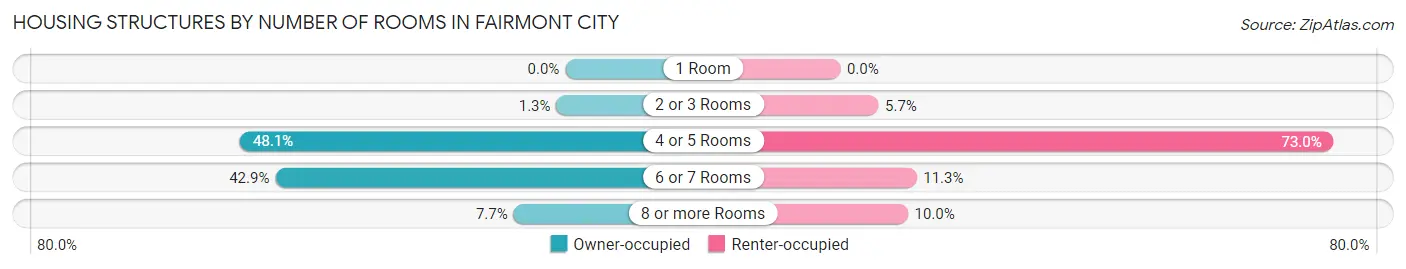
| Number of Rooms | Owner-occupied | Renter-occupied |
| 1 Room | 0 (0.0%) | 0 (0.0%) |
| 2 or 3 Rooms | 7 (1.3%) | 13 (5.7%) |
| 4 or 5 Rooms | 258 (48.1%) | 168 (73.0%) |
| 6 or 7 Rooms | 230 (42.9%) | 26 (11.3%) |
| 8 or more Rooms | 41 (7.6%) | 23 (10.0%) |
| Total | 536 (100.0%) | 230 (100.0%) |
Housing Structure by Heating Type in Fairmont City
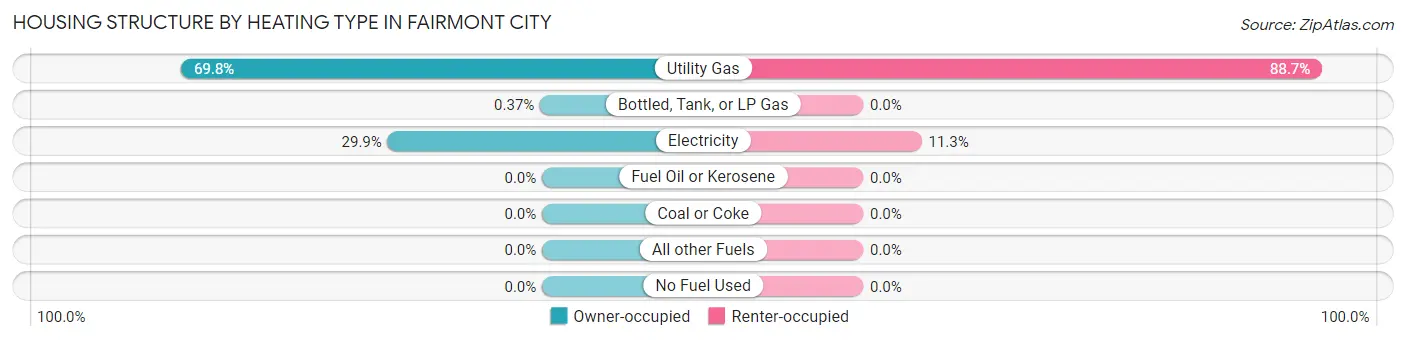
| Heating Type | Owner-occupied | Renter-occupied |
| Utility Gas | 374 (69.8%) | 204 (88.7%) |
| Bottled, Tank, or LP Gas | 2 (0.4%) | 0 (0.0%) |
| Electricity | 160 (29.8%) | 26 (11.3%) |
| Fuel Oil or Kerosene | 0 (0.0%) | 0 (0.0%) |
| Coal or Coke | 0 (0.0%) | 0 (0.0%) |
| All other Fuels | 0 (0.0%) | 0 (0.0%) |
| No Fuel Used | 0 (0.0%) | 0 (0.0%) |
| Total | 536 (100.0%) | 230 (100.0%) |
Household Vehicle Usage in Fairmont City
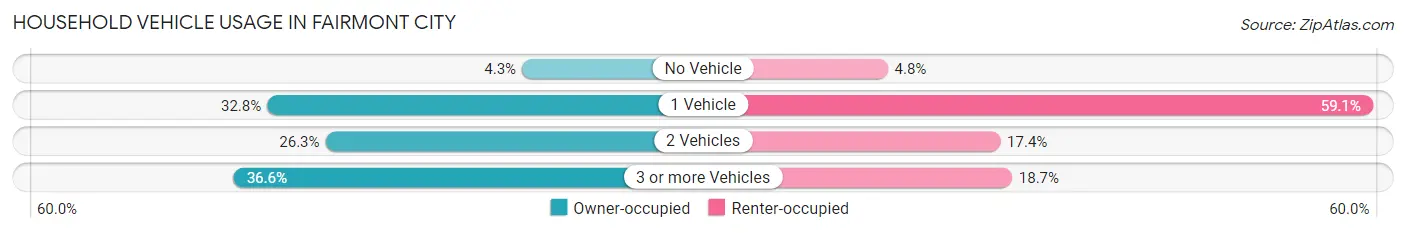
| Vehicles per Household | Owner-occupied | Renter-occupied |
| No Vehicle | 23 (4.3%) | 11 (4.8%) |
| 1 Vehicle | 176 (32.8%) | 136 (59.1%) |
| 2 Vehicles | 141 (26.3%) | 40 (17.4%) |
| 3 or more Vehicles | 196 (36.6%) | 43 (18.7%) |
| Total | 536 (100.0%) | 230 (100.0%) |
Real Estate & Mortgages in Fairmont City
Real Estate and Mortgage Overview in Fairmont City
| Characteristic | Without Mortgage | With Mortgage |
| Housing Units | 366 | 170 |
| Median Property Value | $71,100 | $75,900 |
| Median Household Income | $34,727 | $6 |
| Monthly Housing Costs | $463 | $0 |
| Real Estate Taxes | $1,118 | $8 |
Property Value by Mortgage Status in Fairmont City
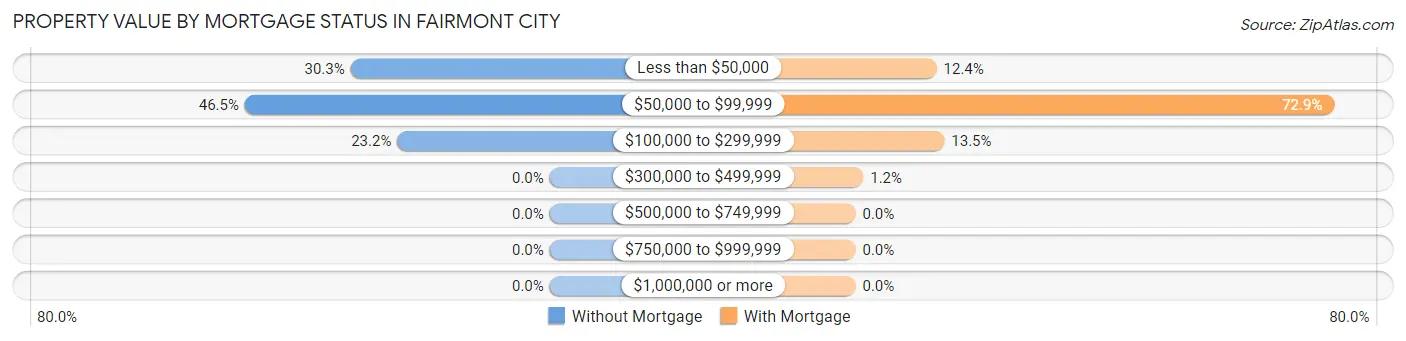
| Property Value | Without Mortgage | With Mortgage |
| Less than $50,000 | 111 (30.3%) | 21 (12.3%) |
| $50,000 to $99,999 | 170 (46.5%) | 124 (72.9%) |
| $100,000 to $299,999 | 85 (23.2%) | 23 (13.5%) |
| $300,000 to $499,999 | 0 (0.0%) | 2 (1.2%) |
| $500,000 to $749,999 | 0 (0.0%) | 0 (0.0%) |
| $750,000 to $999,999 | 0 (0.0%) | 0 (0.0%) |
| $1,000,000 or more | 0 (0.0%) | 0 (0.0%) |
| Total | 366 (100.0%) | 170 (100.0%) |
Household Income by Mortgage Status in Fairmont City
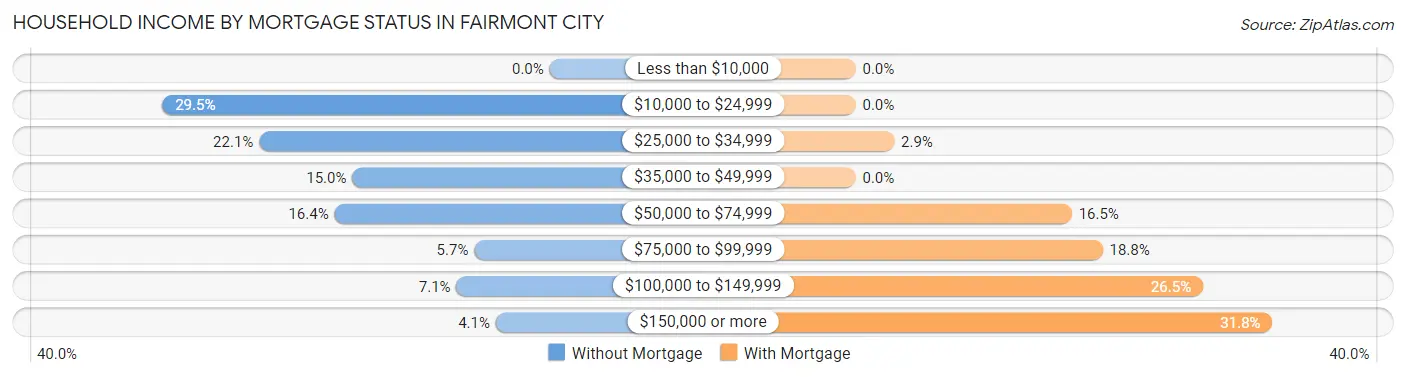
| Household Income | Without Mortgage | With Mortgage |
| Less than $10,000 | 0 (0.0%) | 0 (0.0%) |
| $10,000 to $24,999 | 108 (29.5%) | 0 (0.0%) |
| $25,000 to $34,999 | 81 (22.1%) | 5 (2.9%) |
| $35,000 to $49,999 | 55 (15.0%) | 0 (0.0%) |
| $50,000 to $74,999 | 60 (16.4%) | 28 (16.5%) |
| $75,000 to $99,999 | 21 (5.7%) | 32 (18.8%) |
| $100,000 to $149,999 | 26 (7.1%) | 45 (26.5%) |
| $150,000 or more | 15 (4.1%) | 54 (31.8%) |
| Total | 366 (100.0%) | 170 (100.0%) |
Property Value to Household Income Ratio in Fairmont City
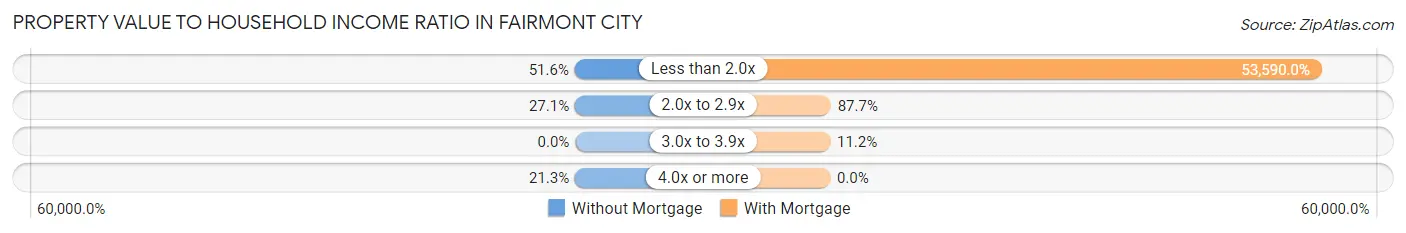
| Value-to-Income Ratio | Without Mortgage | With Mortgage |
| Less than 2.0x | 189 (51.6%) | 91,103 (53,590.0%) |
| 2.0x to 2.9x | 99 (27.1%) | 149 (87.6%) |
| 3.0x to 3.9x | 0 (0.0%) | 19 (11.2%) |
| 4.0x or more | 78 (21.3%) | 0 (0.0%) |
| Total | 366 (100.0%) | 170 (100.0%) |
Real Estate Taxes by Mortgage Status in Fairmont City
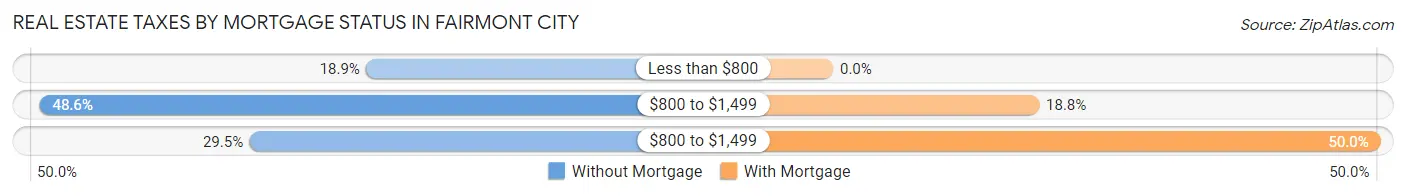
| Property Taxes | Without Mortgage | With Mortgage |
| Less than $800 | 69 (18.9%) | 0 (0.0%) |
| $800 to $1,499 | 178 (48.6%) | 32 (18.8%) |
| $800 to $1,499 | 108 (29.5%) | 85 (50.0%) |
| Total | 366 (100.0%) | 170 (100.0%) |
Health & Disability in Fairmont City
Health Insurance Coverage by Age in Fairmont City
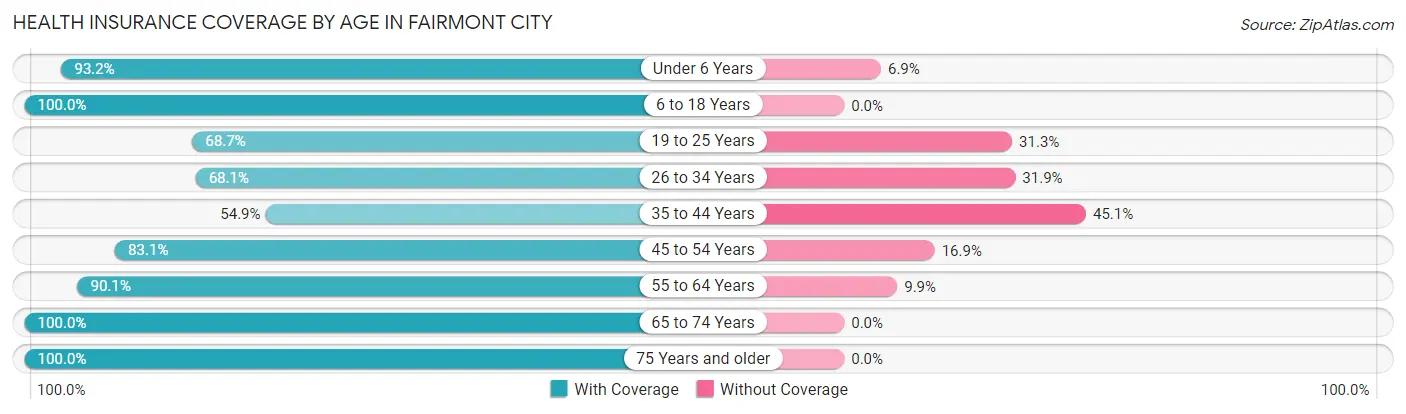
| Age Bracket | With Coverage | Without Coverage |
| Under 6 Years | 136 (93.1%) | 10 (6.9%) |
| 6 to 18 Years | 291 (100.0%) | 0 (0.0%) |
| 19 to 25 Years | 90 (68.7%) | 41 (31.3%) |
| 26 to 34 Years | 192 (68.1%) | 90 (31.9%) |
| 35 to 44 Years | 229 (54.9%) | 188 (45.1%) |
| 45 to 54 Years | 143 (83.1%) | 29 (16.9%) |
| 55 to 64 Years | 292 (90.1%) | 32 (9.9%) |
| 65 to 74 Years | 173 (100.0%) | 0 (0.0%) |
| 75 Years and older | 189 (100.0%) | 0 (0.0%) |
| Total | 1,735 (81.7%) | 390 (18.3%) |
Health Insurance Coverage by Citizenship Status in Fairmont City
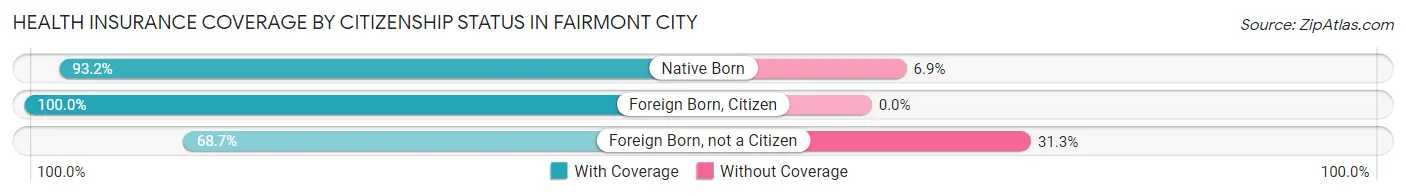
| Citizenship Status | With Coverage | Without Coverage |
| Native Born | 136 (93.1%) | 10 (6.9%) |
| Foreign Born, Citizen | 291 (100.0%) | 0 (0.0%) |
| Foreign Born, not a Citizen | 90 (68.7%) | 41 (31.3%) |
Health Insurance Coverage by Household Income in Fairmont City
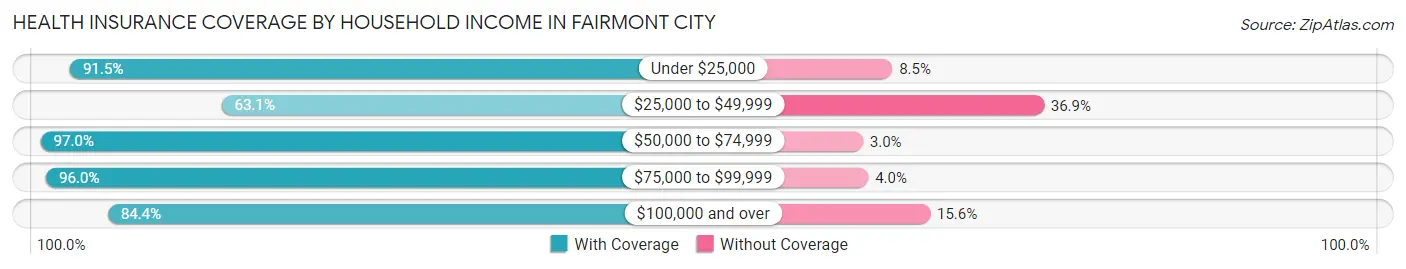
| Household Income | With Coverage | Without Coverage |
| Under $25,000 | 258 (91.5%) | 24 (8.5%) |
| $25,000 to $49,999 | 441 (63.1%) | 258 (36.9%) |
| $50,000 to $74,999 | 387 (97.0%) | 12 (3.0%) |
| $75,000 to $99,999 | 167 (96.0%) | 7 (4.0%) |
| $100,000 and over | 482 (84.4%) | 89 (15.6%) |
Public vs Private Health Insurance Coverage by Age in Fairmont City
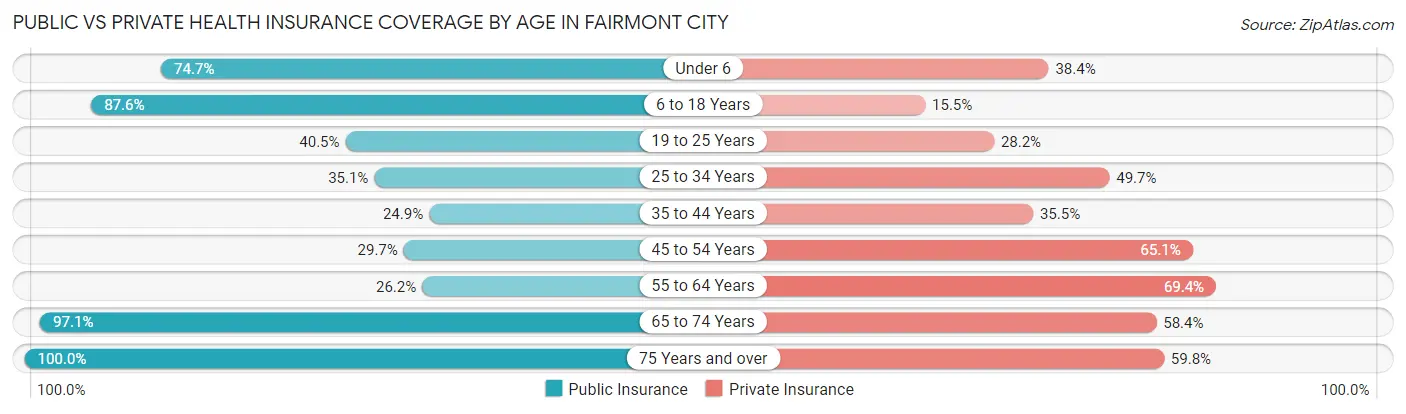
| Age Bracket | Public Insurance | Private Insurance |
| Under 6 | 109 (74.7%) | 56 (38.4%) |
| 6 to 18 Years | 255 (87.6%) | 45 (15.5%) |
| 19 to 25 Years | 53 (40.5%) | 37 (28.2%) |
| 25 to 34 Years | 99 (35.1%) | 140 (49.6%) |
| 35 to 44 Years | 104 (24.9%) | 148 (35.5%) |
| 45 to 54 Years | 51 (29.6%) | 112 (65.1%) |
| 55 to 64 Years | 85 (26.2%) | 225 (69.4%) |
| 65 to 74 Years | 168 (97.1%) | 101 (58.4%) |
| 75 Years and over | 189 (100.0%) | 113 (59.8%) |
| Total | 1,113 (52.4%) | 977 (46.0%) |
Disability Status by Sex by Age in Fairmont City
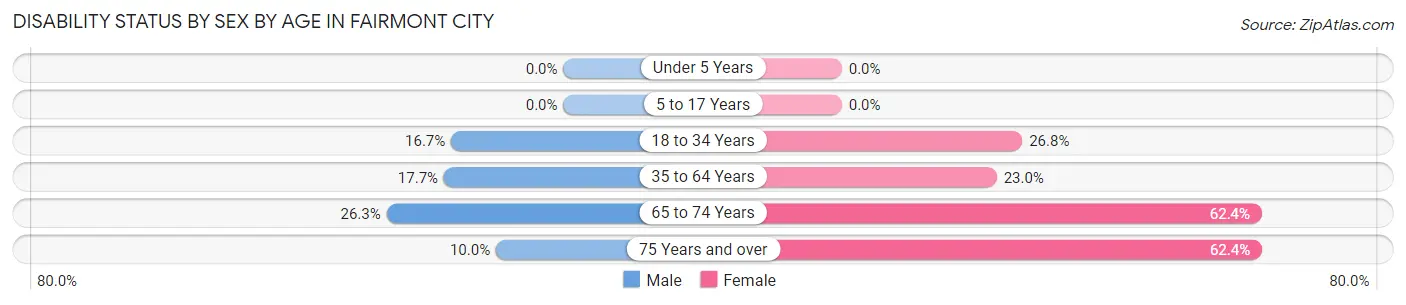
| Age Bracket | Male | Female |
| Under 5 Years | 0 (0.0%) | 0 (0.0%) |
| 5 to 17 Years | 0 (0.0%) | 0 (0.0%) |
| 18 to 34 Years | 38 (16.7%) | 56 (26.8%) |
| 35 to 64 Years | 91 (17.7%) | 92 (23.0%) |
| 65 to 74 Years | 21 (26.3%) | 58 (62.4%) |
| 75 Years and over | 8 (10.0%) | 68 (62.4%) |
Disability Class by Sex by Age in Fairmont City
Disability Class: Hearing Difficulty
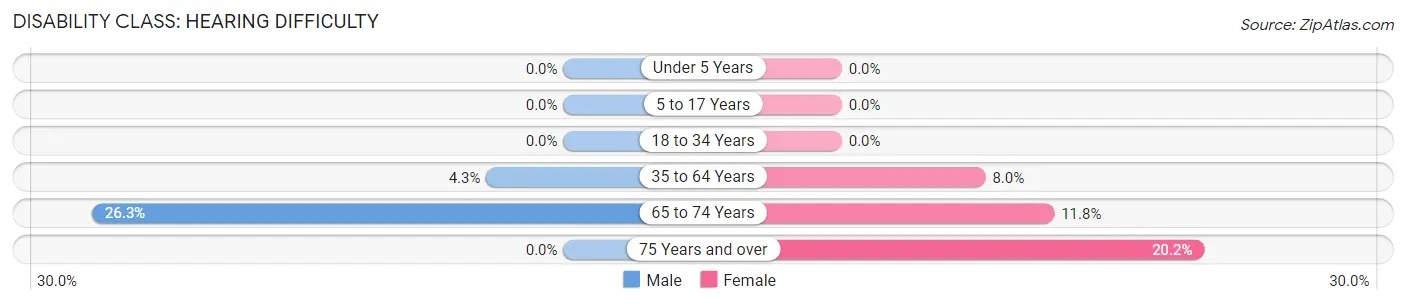
| Age Bracket | Male | Female |
| Under 5 Years | 0 (0.0%) | 0 (0.0%) |
| 5 to 17 Years | 0 (0.0%) | 0 (0.0%) |
| 18 to 34 Years | 0 (0.0%) | 0 (0.0%) |
| 35 to 64 Years | 22 (4.3%) | 32 (8.0%) |
| 65 to 74 Years | 21 (26.3%) | 11 (11.8%) |
| 75 Years and over | 0 (0.0%) | 22 (20.2%) |
Disability Class: Vision Difficulty
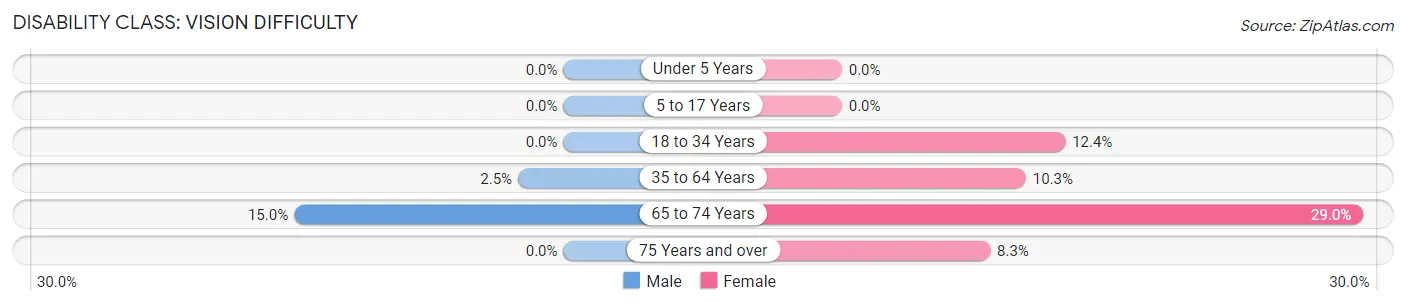
| Age Bracket | Male | Female |
| Under 5 Years | 0 (0.0%) | 0 (0.0%) |
| 5 to 17 Years | 0 (0.0%) | 0 (0.0%) |
| 18 to 34 Years | 0 (0.0%) | 26 (12.4%) |
| 35 to 64 Years | 13 (2.5%) | 41 (10.2%) |
| 65 to 74 Years | 12 (15.0%) | 27 (29.0%) |
| 75 Years and over | 0 (0.0%) | 9 (8.3%) |
Disability Class: Cognitive Difficulty
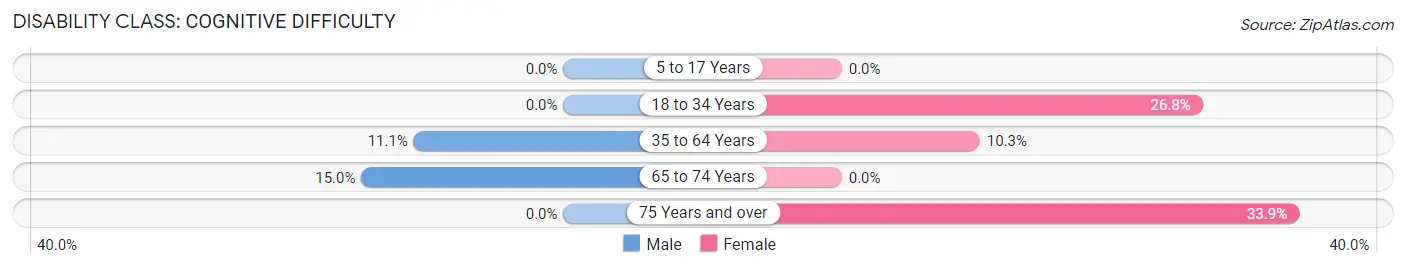
| Age Bracket | Male | Female |
| 5 to 17 Years | 0 (0.0%) | 0 (0.0%) |
| 18 to 34 Years | 0 (0.0%) | 56 (26.8%) |
| 35 to 64 Years | 57 (11.1%) | 41 (10.2%) |
| 65 to 74 Years | 12 (15.0%) | 0 (0.0%) |
| 75 Years and over | 0 (0.0%) | 37 (33.9%) |
Disability Class: Ambulatory Difficulty
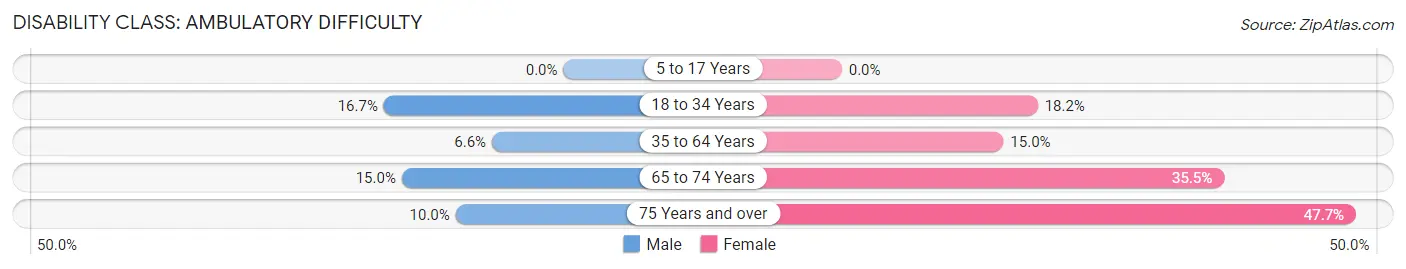
| Age Bracket | Male | Female |
| 5 to 17 Years | 0 (0.0%) | 0 (0.0%) |
| 18 to 34 Years | 38 (16.7%) | 38 (18.2%) |
| 35 to 64 Years | 34 (6.6%) | 60 (15.0%) |
| 65 to 74 Years | 12 (15.0%) | 33 (35.5%) |
| 75 Years and over | 8 (10.0%) | 52 (47.7%) |
Disability Class: Self-Care Difficulty
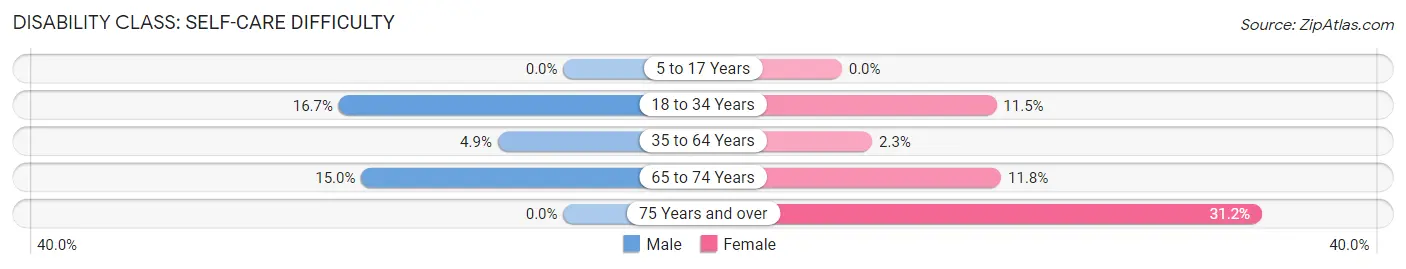
| Age Bracket | Male | Female |
| 5 to 17 Years | 0 (0.0%) | 0 (0.0%) |
| 18 to 34 Years | 38 (16.7%) | 24 (11.5%) |
| 35 to 64 Years | 25 (4.9%) | 9 (2.2%) |
| 65 to 74 Years | 12 (15.0%) | 11 (11.8%) |
| 75 Years and over | 0 (0.0%) | 34 (31.2%) |
Technology Access in Fairmont City
Computing Device Access in Fairmont City
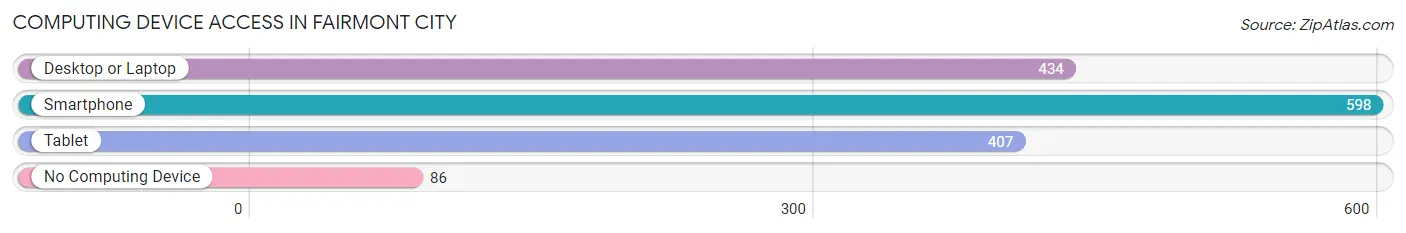
| Device Type | # Households | % Households |
| Desktop or Laptop | 434 | 56.7% |
| Smartphone | 598 | 78.1% |
| Tablet | 407 | 53.1% |
| No Computing Device | 86 | 11.2% |
| Total | 766 | 100.0% |
Internet Access in Fairmont City
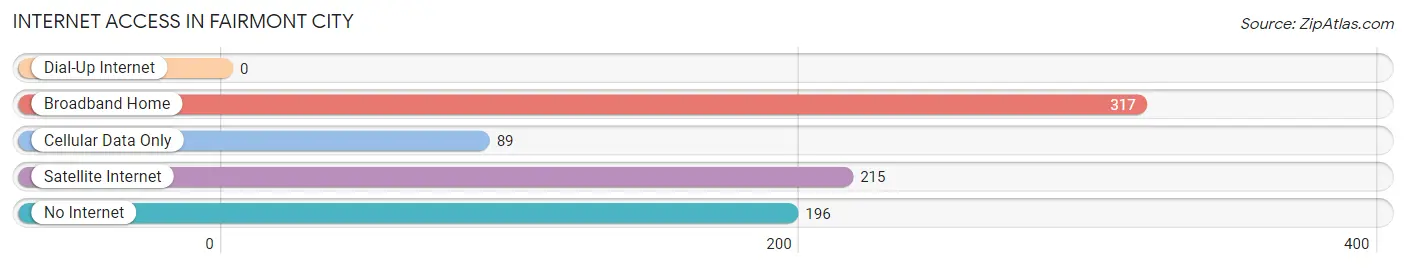
| Internet Type | # Households | % Households |
| Dial-Up Internet | 0 | 0.0% |
| Broadband Home | 317 | 41.4% |
| Cellular Data Only | 89 | 11.6% |
| Satellite Internet | 215 | 28.1% |
| No Internet | 196 | 25.6% |
| Total | 766 | 100.0% |
Fairmont City Summary
Introduction
Fairmont City is a small village located in St. Clair County, Illinois. It is situated on the banks of the Mississippi River, just south of the city of East St. Louis. The village has a population of approximately 2,000 people and is part of the Greater St. Louis metropolitan area. Fairmont City is a diverse community with a rich history and culture.
History
Fairmont City was founded in 1855 by a group of German immigrants. The village was originally known as “German Settlement” and was located on the banks of the Mississippi River. The settlers were attracted to the area due to its fertile soil and abundant natural resources. The village was renamed Fairmont City in 1868, after the Fairmont Coal Company, which had purchased the land for mining.
The village grew steadily throughout the late 19th and early 20th centuries, and by the 1920s, it had become a thriving community. The village was home to a variety of businesses, including a brickyard, a flour mill, a sawmill, and a coal mine. The village also had a school, a post office, and a variety of churches.
In the 1950s, the village began to decline as the coal industry declined and the population began to move away. The village was further impacted by the construction of Interstate 64, which cut through the village and caused the loss of many homes and businesses.
Geography
Fairmont City is located in St. Clair County, Illinois, on the banks of the Mississippi River. The village is situated just south of the city of East St. Louis and is part of the Greater St. Louis metropolitan area. The village is located at an elevation of approximately 500 feet above sea level.
The village is located in a flat, low-lying area, with the Mississippi River to the east and the Cahokia Creek to the west. The village is surrounded by agricultural land, with corn and soybean fields to the north and south. The village is also located near several parks, including the Cahokia Mounds State Historic Site and the Horseshoe Lake State Park.
Economy
Fairmont City’s economy is largely based on agriculture and manufacturing. The village is home to several small businesses, including a grocery store, a hardware store, and a gas station. The village also has a few restaurants and bars.
The village is also home to several manufacturing companies, including a steel mill, a plastics factory, and a paper mill. The village is also home to a number of trucking companies, which transport goods to and from the village.
Demographics
As of the 2010 census, Fairmont City had a population of 2,000 people. The village is predominantly white, with approximately 75% of the population identifying as white. The remaining 25% of the population is made up of African Americans, Hispanics, and other ethnicities.
The median household income in Fairmont City is $37,000, which is slightly lower than the national average. The village has a poverty rate of approximately 20%, which is higher than the national average.
Conclusion
Fairmont City is a small village located in St. Clair County, Illinois. The village has a rich history and culture, and is home to a diverse population. The village’s economy is largely based on agriculture and manufacturing, and the village is home to several small businesses. The village has a median household income of $37,000 and a poverty rate of approximately 20%.
Common Questions
What is Per Capita Income in Fairmont City?
Per Capita income in Fairmont City is $22,251.
What is the Median Family Income in Fairmont City?
Median Family Income in Fairmont City is $64,671.
What is the Median Household income in Fairmont City?
Median Household Income in Fairmont City is $42,417.
What is Income or Wage Gap in Fairmont City?
Income or Wage Gap in Fairmont City is 34.3%.
Women in Fairmont City earn 65.7 cents for every dollar earned by a man.
What is Family Income Deficit in Fairmont City?
Family Income Deficit in Fairmont City is $9,900.
Families that are below poverty line in Fairmont City earn $9,900 less on average than the poverty threshold level.
What is Inequality or Gini Index in Fairmont City?
Inequality or Gini Index in Fairmont City is 0.42.
What is the Total Population of Fairmont City?
Total Population of Fairmont City is 2,125.
What is the Total Male Population of Fairmont City?
Total Male Population of Fairmont City is 1,062.
What is the Total Female Population of Fairmont City?
Total Female Population of Fairmont City is 1,063.
What is the Ratio of Males per 100 Females in Fairmont City?
There are 99.91 Males per 100 Females in Fairmont City.
What is the Ratio of Females per 100 Males in Fairmont City?
There are 100.09 Females per 100 Males in Fairmont City.
What is the Median Population Age in Fairmont City?
Median Population Age in Fairmont City is 40.8 Years.
What is the Average Family Size in Fairmont City
Average Family Size in Fairmont City is 3.8 People.
What is the Average Household Size in Fairmont City
Average Household Size in Fairmont City is 2.8 People.
How Large is the Labor Force in Fairmont City?
There are 934 People in the Labor Forcein in Fairmont City.
What is the Percentage of People in the Labor Force in Fairmont City?
52.3% of People are in the Labor Force in Fairmont City.
What is the Unemployment Rate in Fairmont City?
Unemployment Rate in Fairmont City is 1.2%.