Zip Codes with the Highest Percentage of Population Employed in Life, Physical & Social Science in Glenview, IL
RELATED REPORTS & OPTIONS
Life, Physical & Social Science
Glenview
Compare Zip Codes
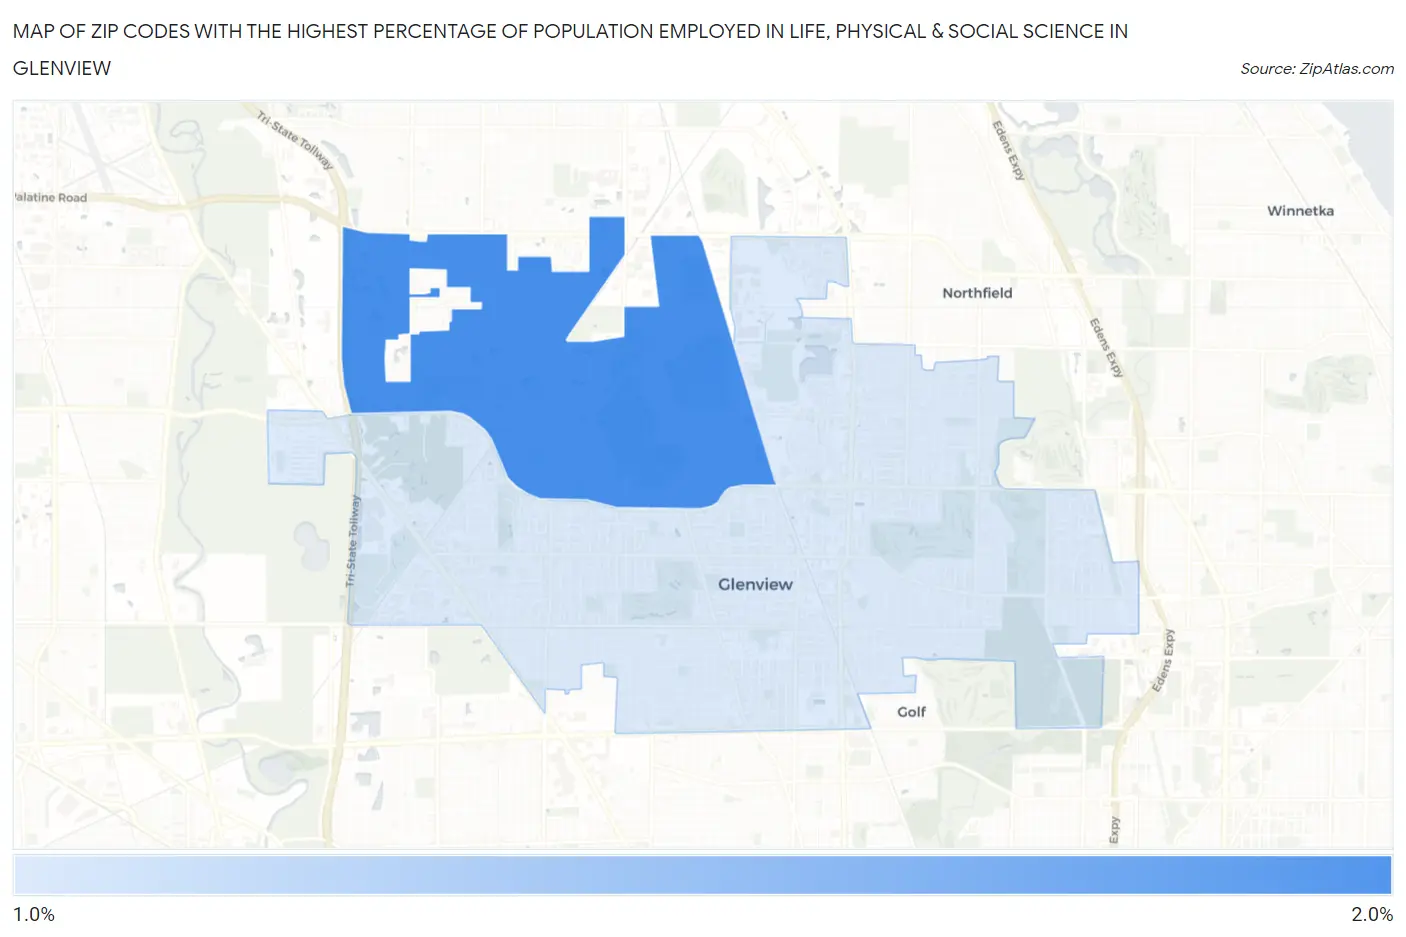
Map of Zip Codes with the Highest Percentage of Population Employed in Life, Physical & Social Science in Glenview
1.6%
1.8%
Zip Codes with the Highest Percentage of Population Employed in Life, Physical & Social Science in Glenview, IL
| Zip Code | % Employed | vs State | vs National | |
| 1. | 60026 | 1.8% | 0.98%(+0.847)#136 | 1.1%(+0.735)#4,235 |
| 2. | 60025 | 1.6% | 0.98%(+0.667)#162 | 1.1%(+0.554)#4,969 |
1
Common Questions
What are the Top Zip Codes with the Highest Percentage of Population Employed in Life, Physical & Social Science in Glenview, IL?
Top Zip Codes with the Highest Percentage of Population Employed in Life, Physical & Social Science in Glenview, IL are:
What zip code has the Highest Percentage of Population Employed in Life, Physical & Social Science in Glenview, IL?
60026 has the Highest Percentage of Population Employed in Life, Physical & Social Science in Glenview, IL with 1.8%.
What is the Percentage of Population Employed in Life, Physical & Social Science in Glenview, IL?
Percentage of Population Employed in Life, Physical & Social Science in Glenview is 1.5%.
What is the Percentage of Population Employed in Life, Physical & Social Science in Illinois?
Percentage of Population Employed in Life, Physical & Social Science in Illinois is 0.98%.
What is the Percentage of Population Employed in Life, Physical & Social Science in the United States?
Percentage of Population Employed in Life, Physical & Social Science in the United States is 1.1%.