Fox Lake Hills, IL Map & Demographics
Fox Lake Hills Map
Fox Lake Hills Overview
$44,811
PER CAPITA INCOME
$117,455
AVG FAMILY INCOME
$100,875
AVG HOUSEHOLD INCOME
59.1%
WAGE / INCOME GAP [ % ]
40.9¢/ $1
WAGE / INCOME GAP [ $ ]
0.34
INEQUALITY / GINI INDEX
2,398
TOTAL POPULATION
1,160
MALE POPULATION
1,238
FEMALE POPULATION
93.70
MALES / 100 FEMALES
106.72
FEMALES / 100 MALES
42.6
MEDIAN AGE
3.1
AVG FAMILY SIZE
2.6
AVG HOUSEHOLD SIZE
1,286
LABOR FORCE [ PEOPLE ]
67.7%
PERCENT IN LABOR FORCE
6.8%
UNEMPLOYMENT RATE
Income in Fox Lake Hills
Income Overview in Fox Lake Hills
Per Capita Income in Fox Lake Hills is $44,811, while median incomes of families and households are $117,455 and $100,875 respectively.
| Characteristic | Number | Measure |
| Per Capita Income | 2,398 | $44,811 |
| Median Family Income | 671 | $117,455 |
| Mean Family Income | 671 | $131,220 |
| Median Household Income | 915 | $100,875 |
| Mean Household Income | 915 | $115,637 |
| Income Deficit | 671 | $0 |
| Wage / Income Gap (%) | 2,398 | 59.10% |
| Wage / Income Gap ($) | 2,398 | 40.90¢ per $1 |
| Gini / Inequality Index | 2,398 | 0.34 |
Earnings by Sex in Fox Lake Hills
Average Earnings in Fox Lake Hills are $50,505, $85,208 for men and $34,846 for women, a difference of 59.1%.
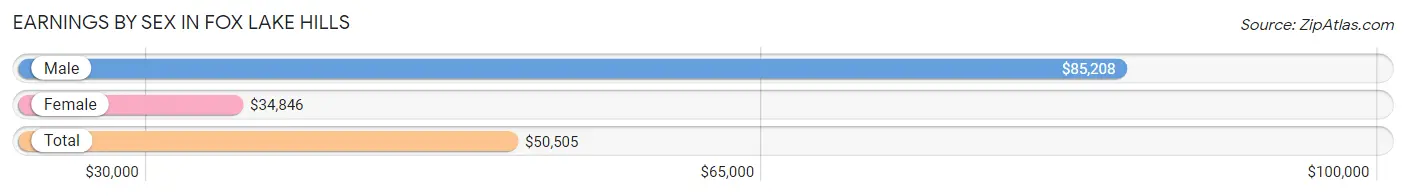
| Sex | Number | Average Earnings |
| Male | 599 (46.8%) | $85,208 |
| Female | 680 (53.2%) | $34,846 |
| Total | 1,279 (100.0%) | $50,505 |
Earnings by Sex by Income Bracket in Fox Lake Hills
The most common earnings brackets in Fox Lake Hills are $100,000+ for men (190 | 31.7%) and $75,000 to $99,999 for women (86 | 12.7%).
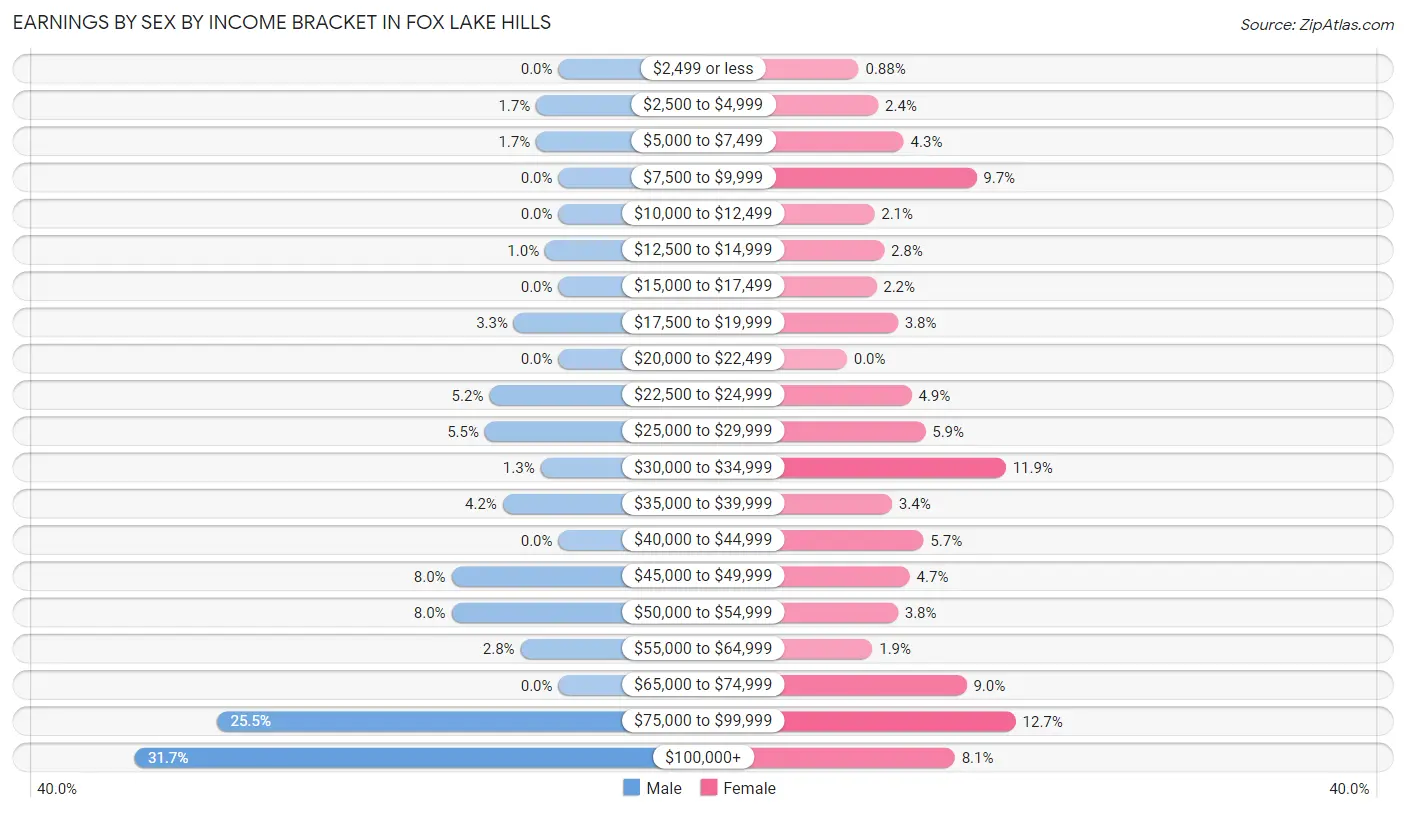
| Income | Male | Female |
| $2,499 or less | 0 (0.0%) | 6 (0.9%) |
| $2,500 to $4,999 | 10 (1.7%) | 16 (2.4%) |
| $5,000 to $7,499 | 10 (1.7%) | 29 (4.3%) |
| $7,500 to $9,999 | 0 (0.0%) | 66 (9.7%) |
| $10,000 to $12,499 | 0 (0.0%) | 14 (2.1%) |
| $12,500 to $14,999 | 6 (1.0%) | 19 (2.8%) |
| $15,000 to $17,499 | 0 (0.0%) | 15 (2.2%) |
| $17,500 to $19,999 | 20 (3.3%) | 26 (3.8%) |
| $20,000 to $22,499 | 0 (0.0%) | 0 (0.0%) |
| $22,500 to $24,999 | 31 (5.2%) | 33 (4.9%) |
| $25,000 to $29,999 | 33 (5.5%) | 40 (5.9%) |
| $30,000 to $34,999 | 8 (1.3%) | 81 (11.9%) |
| $35,000 to $39,999 | 25 (4.2%) | 23 (3.4%) |
| $40,000 to $44,999 | 0 (0.0%) | 39 (5.7%) |
| $45,000 to $49,999 | 48 (8.0%) | 32 (4.7%) |
| $50,000 to $54,999 | 48 (8.0%) | 26 (3.8%) |
| $55,000 to $64,999 | 17 (2.8%) | 13 (1.9%) |
| $65,000 to $74,999 | 0 (0.0%) | 61 (9.0%) |
| $75,000 to $99,999 | 153 (25.5%) | 86 (12.7%) |
| $100,000+ | 190 (31.7%) | 55 (8.1%) |
| Total | 599 (100.0%) | 680 (100.0%) |
Earnings by Sex by Educational Attainment in Fox Lake Hills
Average earnings in Fox Lake Hills are $86,597 for men and $41,026 for women, a difference of 52.6%. Men with an educational attainment of graduate degree enjoy the highest average annual earnings of $118,625, while those with less than high school education earn the least with $49,028. Women with an educational attainment of graduate degree earn the most with the average annual earnings of $67,188, while those with high school diploma education have the smallest earnings of $34,151.
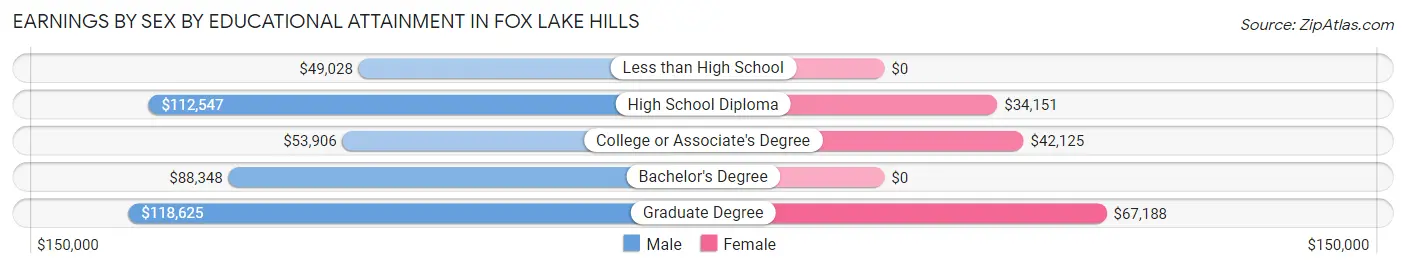
| Educational Attainment | Male Income | Female Income |
| Less than High School | $49,028 | $0 |
| High School Diploma | $112,547 | $34,151 |
| College or Associate's Degree | $53,906 | $42,125 |
| Bachelor's Degree | $88,348 | $0 |
| Graduate Degree | $118,625 | $67,188 |
| Total | $86,597 | $41,026 |
Family Income in Fox Lake Hills
Family Income Brackets in Fox Lake Hills
According to the Fox Lake Hills family income data, there are 249 families falling into the $100,000 to $149,999 income range, which is the most common income bracket and makes up 37.1% of all families. Conversely, the $10,000 to $14,999 income bracket is the least frequent group with only 9 families (1.3%) belonging to this category.
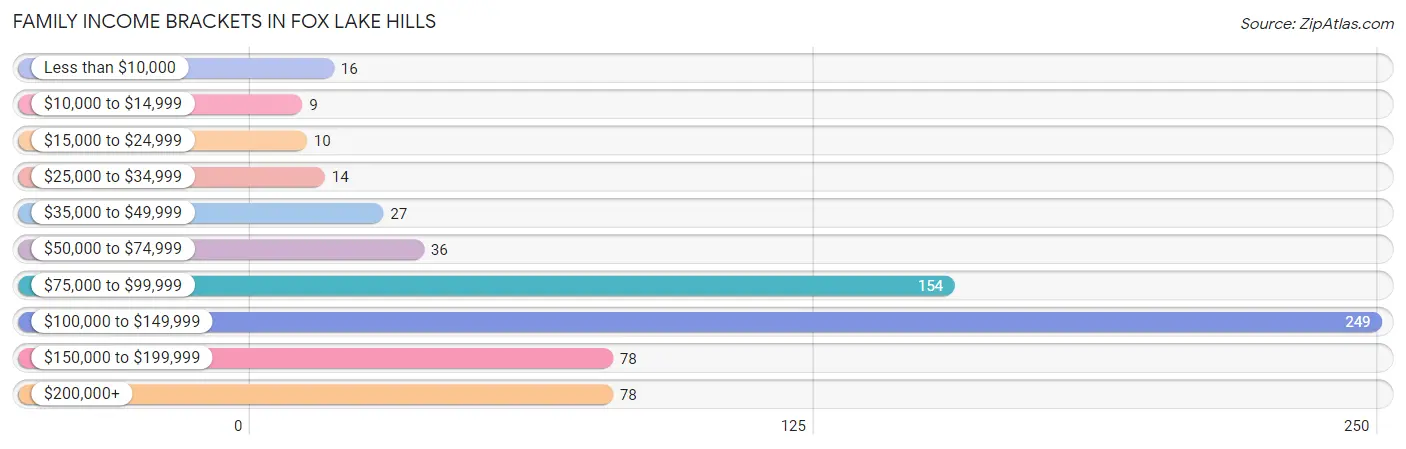
| Income Bracket | # Families | % Families |
| Less than $10,000 | 16 | 2.4% |
| $10,000 to $14,999 | 9 | 1.3% |
| $15,000 to $24,999 | 10 | 1.5% |
| $25,000 to $34,999 | 14 | 2.1% |
| $35,000 to $49,999 | 27 | 4.0% |
| $50,000 to $74,999 | 36 | 5.4% |
| $75,000 to $99,999 | 154 | 23.0% |
| $100,000 to $149,999 | 249 | 37.1% |
| $150,000 to $199,999 | 78 | 11.6% |
| $200,000+ | 78 | 11.6% |
Family Income by Famaliy Size in Fox Lake Hills
6-person families (38 | 5.7%) account for the highest median family income in Fox Lake Hills with $168,750 per family, while 2-person families (360 | 53.6%) have the highest median income of $55,625 per family member.
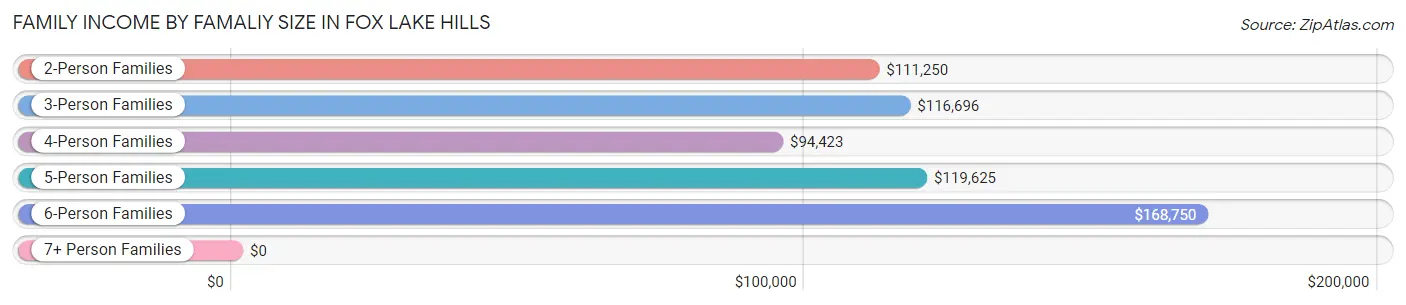
| Income Bracket | # Families | Median Income |
| 2-Person Families | 360 (53.6%) | $111,250 |
| 3-Person Families | 120 (17.9%) | $116,696 |
| 4-Person Families | 70 (10.4%) | $94,423 |
| 5-Person Families | 83 (12.4%) | $119,625 |
| 6-Person Families | 38 (5.7%) | $168,750 |
| 7+ Person Families | 0 (0.0%) | $0 |
| Total | 671 (100.0%) | $117,455 |
Family Income by Number of Earners in Fox Lake Hills
The median family income in Fox Lake Hills is $117,455, with families comprising 3+ earners (48) having the highest median family income of $180,000, while families with 1 earner (234) have the lowest median family income of $86,280, accounting for 7.1% and 34.9% of families, respectively.
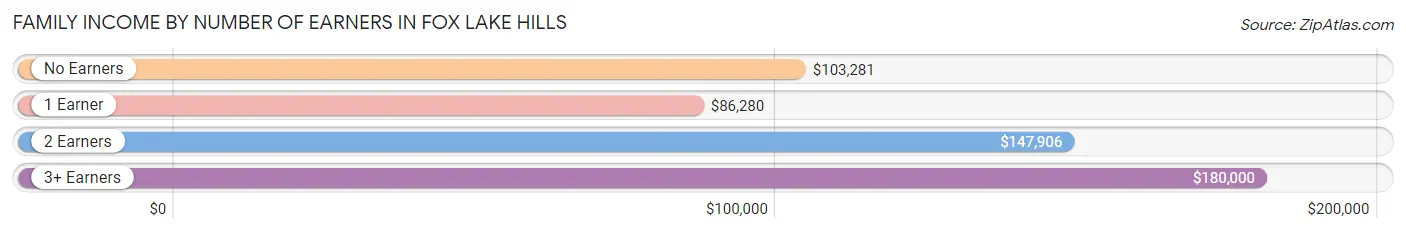
| Number of Earners | # Families | Median Income |
| No Earners | 75 (11.2%) | $103,281 |
| 1 Earner | 234 (34.9%) | $86,280 |
| 2 Earners | 314 (46.8%) | $147,906 |
| 3+ Earners | 48 (7.1%) | $180,000 |
| Total | 671 (100.0%) | $117,455 |
Household Income in Fox Lake Hills
Household Income Brackets in Fox Lake Hills
With 289 households falling in the category, the $100,000 to $149,999 income range is the most frequent in Fox Lake Hills, accounting for 31.6% of all households. In contrast, only 9 households (1.0%) fall into the $10,000 to $14,999 income bracket, making it the least populous group.
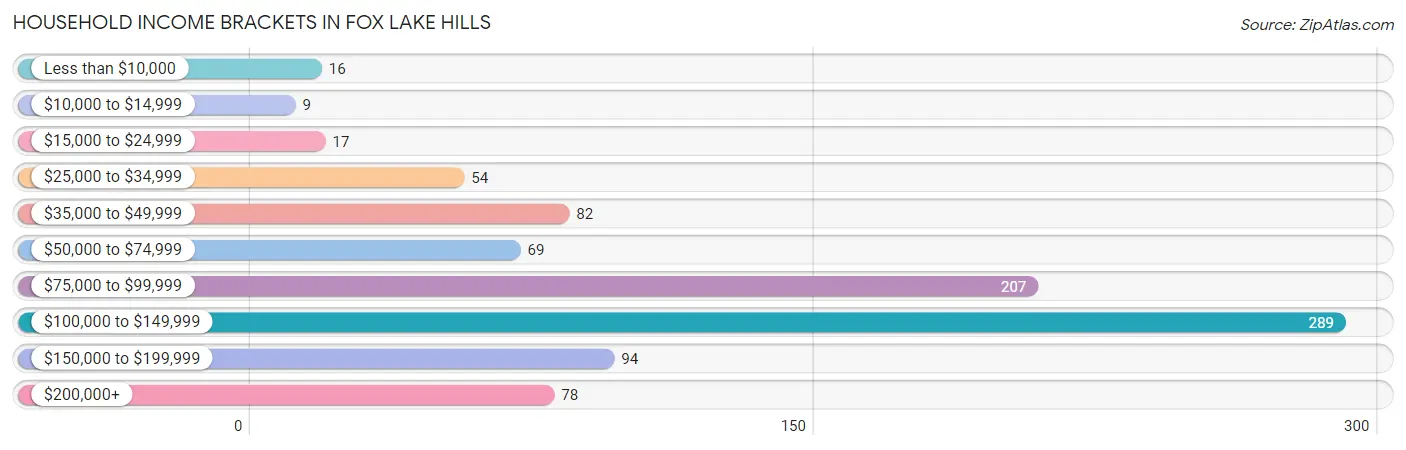
| Income Bracket | # Households | % Households |
| Less than $10,000 | 16 | 1.7% |
| $10,000 to $14,999 | 9 | 1.0% |
| $15,000 to $24,999 | 17 | 1.9% |
| $25,000 to $34,999 | 54 | 5.9% |
| $35,000 to $49,999 | 82 | 9.0% |
| $50,000 to $74,999 | 69 | 7.5% |
| $75,000 to $99,999 | 207 | 22.6% |
| $100,000 to $149,999 | 289 | 31.6% |
| $150,000 to $199,999 | 94 | 10.3% |
| $200,000+ | 78 | 8.5% |
Household Income by Householder Age in Fox Lake Hills
The median household income in Fox Lake Hills is $100,875, with the highest median household income of $119,188 found in the 25 to 44 years age bracket for the primary householder. A total of 227 households (24.8%) fall into this category. Meanwhile, the 15 to 24 years age bracket for the primary householder has the lowest median household income of $0, with 17 households (1.9%) in this group.
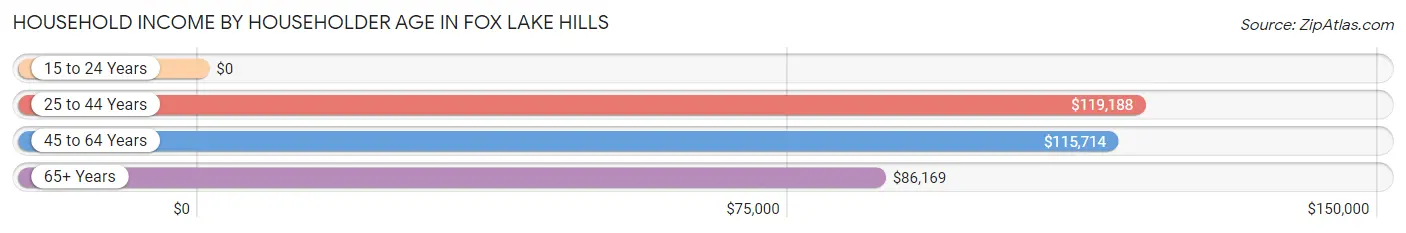
| Income Bracket | # Households | Median Income |
| 15 to 24 Years | 17 (1.9%) | $0 |
| 25 to 44 Years | 227 (24.8%) | $119,188 |
| 45 to 64 Years | 416 (45.5%) | $115,714 |
| 65+ Years | 255 (27.9%) | $86,169 |
| Total | 915 (100.0%) | $100,875 |
Poverty in Fox Lake Hills
Income Below Poverty by Sex and Age in Fox Lake Hills
With 8.1% poverty level for males and 5.9% for females among the residents of Fox Lake Hills, 16 and 17 year old males and 15 year old females are the most vulnerable to poverty, with 15 males (46.9%) and 9 females (60.0%) in their respective age groups living below the poverty level.
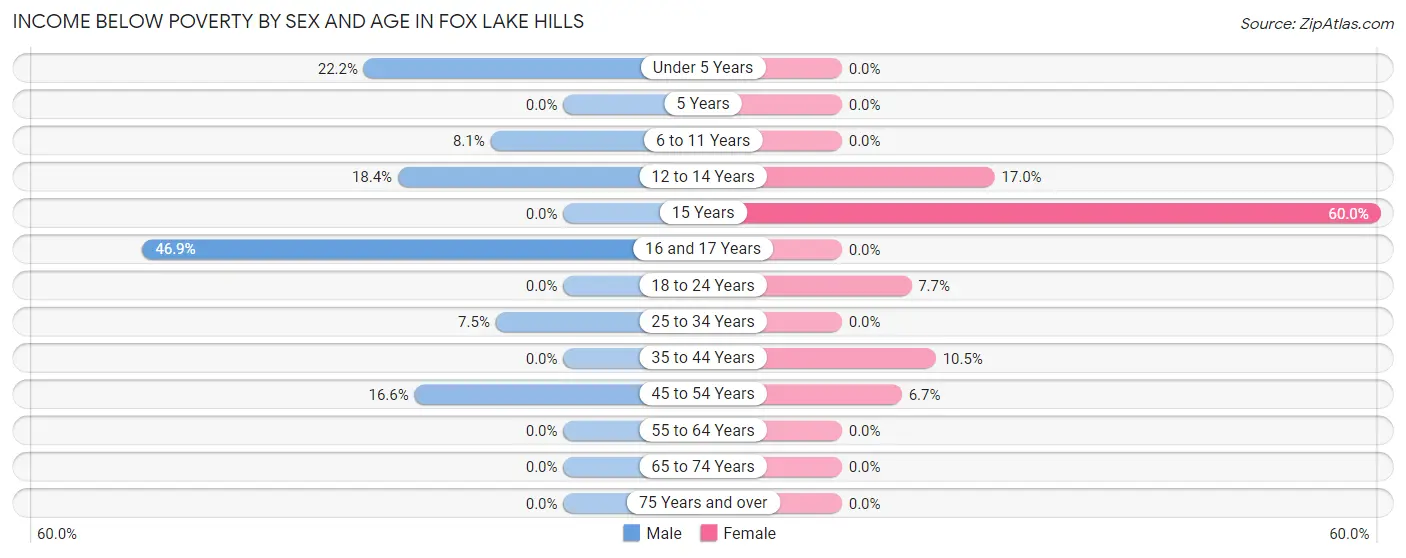
| Age Bracket | Male | Female |
| Under 5 Years | 26 (22.2%) | 0 (0.0%) |
| 5 Years | 0 (0.0%) | 0 (0.0%) |
| 6 to 11 Years | 9 (8.1%) | 0 (0.0%) |
| 12 to 14 Years | 7 (18.4%) | 17 (17.0%) |
| 15 Years | 0 (0.0%) | 9 (60.0%) |
| 16 and 17 Years | 15 (46.9%) | 0 (0.0%) |
| 18 to 24 Years | 0 (0.0%) | 15 (7.7%) |
| 25 to 34 Years | 7 (7.5%) | 0 (0.0%) |
| 35 to 44 Years | 0 (0.0%) | 16 (10.5%) |
| 45 to 54 Years | 30 (16.6%) | 16 (6.7%) |
| 55 to 64 Years | 0 (0.0%) | 0 (0.0%) |
| 65 to 74 Years | 0 (0.0%) | 0 (0.0%) |
| 75 Years and over | 0 (0.0%) | 0 (0.0%) |
| Total | 94 (8.1%) | 73 (5.9%) |
Income Above Poverty by Sex and Age in Fox Lake Hills
According to the poverty statistics in Fox Lake Hills, males aged 5 years and females aged under 5 years are the age groups that are most secure financially, with 100.0% of males and 100.0% of females in these age groups living above the poverty line.
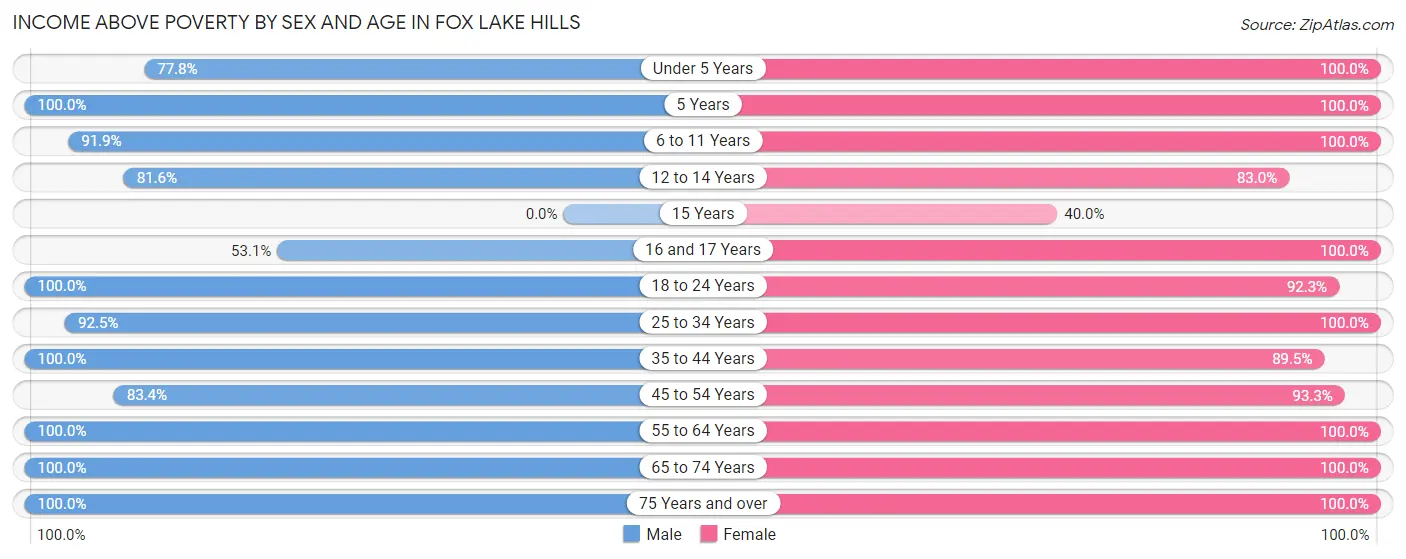
| Age Bracket | Male | Female |
| Under 5 Years | 91 (77.8%) | 22 (100.0%) |
| 5 Years | 12 (100.0%) | 10 (100.0%) |
| 6 to 11 Years | 102 (91.9%) | 74 (100.0%) |
| 12 to 14 Years | 31 (81.6%) | 83 (83.0%) |
| 15 Years | 0 (0.0%) | 6 (40.0%) |
| 16 and 17 Years | 17 (53.1%) | 7 (100.0%) |
| 18 to 24 Years | 20 (100.0%) | 179 (92.3%) |
| 25 to 34 Years | 86 (92.5%) | 71 (100.0%) |
| 35 to 44 Years | 191 (100.0%) | 137 (89.5%) |
| 45 to 54 Years | 151 (83.4%) | 224 (93.3%) |
| 55 to 64 Years | 191 (100.0%) | 116 (100.0%) |
| 65 to 74 Years | 85 (100.0%) | 185 (100.0%) |
| 75 Years and over | 89 (100.0%) | 51 (100.0%) |
| Total | 1,066 (91.9%) | 1,165 (94.1%) |
Income Below Poverty Among Married-Couple Families in Fox Lake Hills
The poverty statistics for married-couple families in Fox Lake Hills show that 1.3% or 7 of the total 538 families live below the poverty line. Families with 3 or 4 children have the highest poverty rate of 12.3%, comprising of 7 families. On the other hand, families with no children have the lowest poverty rate of 0.0%, which includes 0 families.
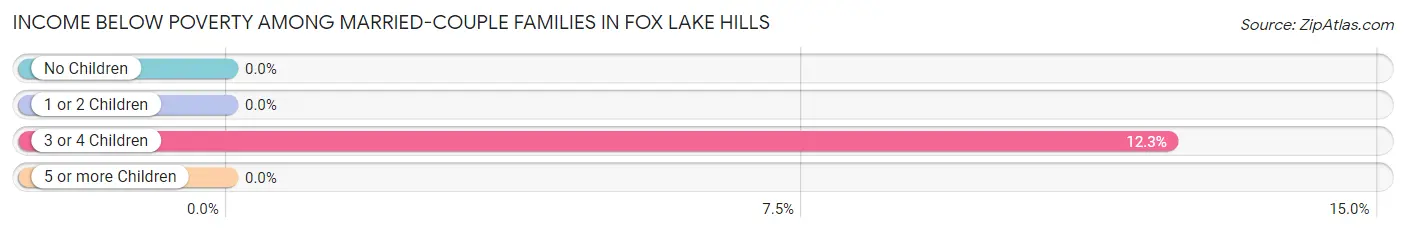
| Children | Above Poverty | Below Poverty |
| No Children | 357 (100.0%) | 0 (0.0%) |
| 1 or 2 Children | 124 (100.0%) | 0 (0.0%) |
| 3 or 4 Children | 50 (87.7%) | 7 (12.3%) |
| 5 or more Children | 0 (0.0%) | 0 (0.0%) |
| Total | 531 (98.7%) | 7 (1.3%) |
Income Below Poverty Among Single-Parent Households in Fox Lake Hills
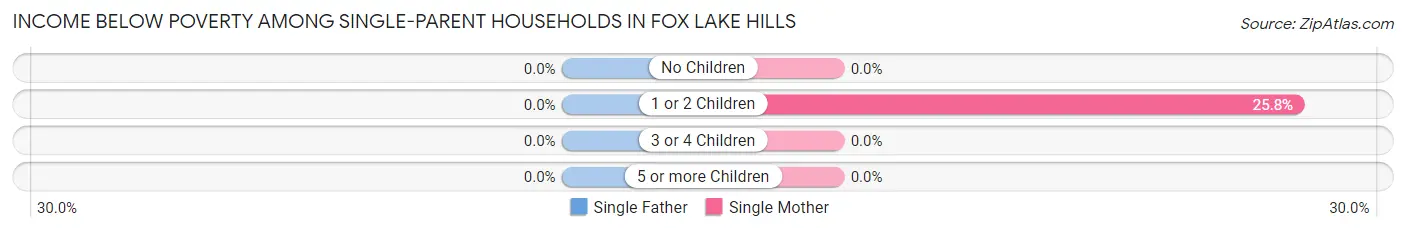
| Children | Single Father | Single Mother |
| No Children | 0 (0.0%) | 0 (0.0%) |
| 1 or 2 Children | 0 (0.0%) | 25 (25.8%) |
| 3 or 4 Children | 0 (0.0%) | 0 (0.0%) |
| 5 or more Children | 0 (0.0%) | 0 (0.0%) |
| Total | 0 (0.0%) | 25 (20.3%) |
Income Below Poverty Among Married-Couple vs Single-Parent Households in Fox Lake Hills
The poverty data for Fox Lake Hills shows that 7 of the married-couple family households (1.3%) and 25 of the single-parent households (18.8%) are living below the poverty level. Within the married-couple family households, those with 3 or 4 children have the highest poverty rate, with 7 households (12.3%) falling below the poverty line. Among the single-parent households, those with 1 or 2 children have the highest poverty rate, with 25 household (23.4%) living below poverty.
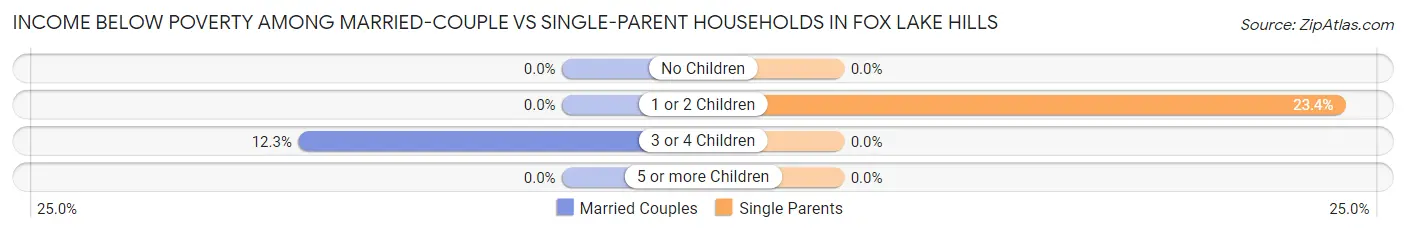
| Children | Married-Couple Families | Single-Parent Households |
| No Children | 0 (0.0%) | 0 (0.0%) |
| 1 or 2 Children | 0 (0.0%) | 25 (23.4%) |
| 3 or 4 Children | 7 (12.3%) | 0 (0.0%) |
| 5 or more Children | 0 (0.0%) | 0 (0.0%) |
| Total | 7 (1.3%) | 25 (18.8%) |
Race in Fox Lake Hills
The most populous races in Fox Lake Hills are White / Caucasian (1,958 | 81.7%), Hispanic or Latino (389 | 16.2%), and Two or more Races (378 | 15.8%).
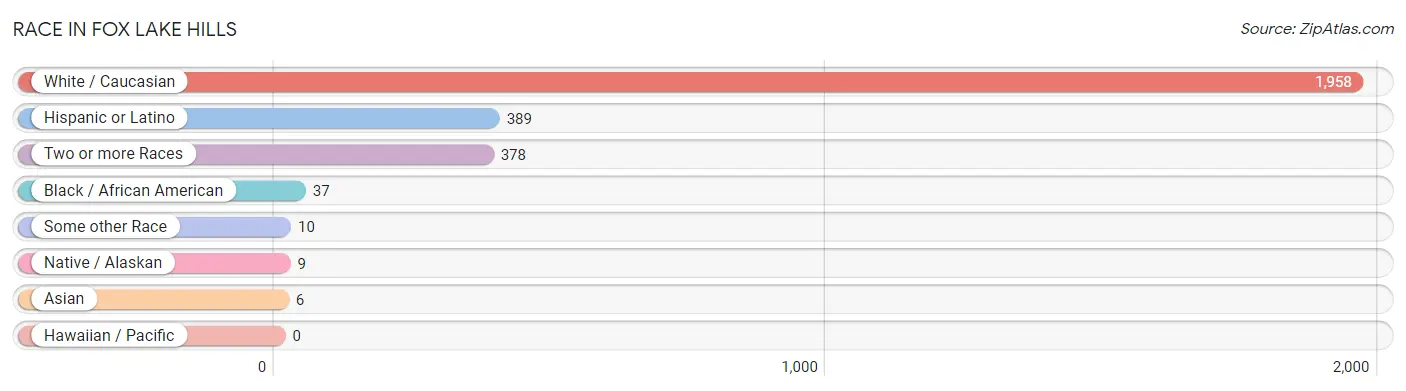
| Race | # Population | % Population |
| Asian | 6 | 0.3% |
| Black / African American | 37 | 1.5% |
| Hawaiian / Pacific | 0 | 0.0% |
| Hispanic or Latino | 389 | 16.2% |
| Native / Alaskan | 9 | 0.4% |
| White / Caucasian | 1,958 | 81.7% |
| Two or more Races | 378 | 15.8% |
| Some other Race | 10 | 0.4% |
| Total | 2,398 | 100.0% |
Ancestry in Fox Lake Hills
The most populous ancestries reported in Fox Lake Hills are German (671 | 28.0%), Irish (351 | 14.6%), Polish (255 | 10.6%), Mexican (251 | 10.5%), and Italian (179 | 7.5%), together accounting for 71.2% of all Fox Lake Hills residents.
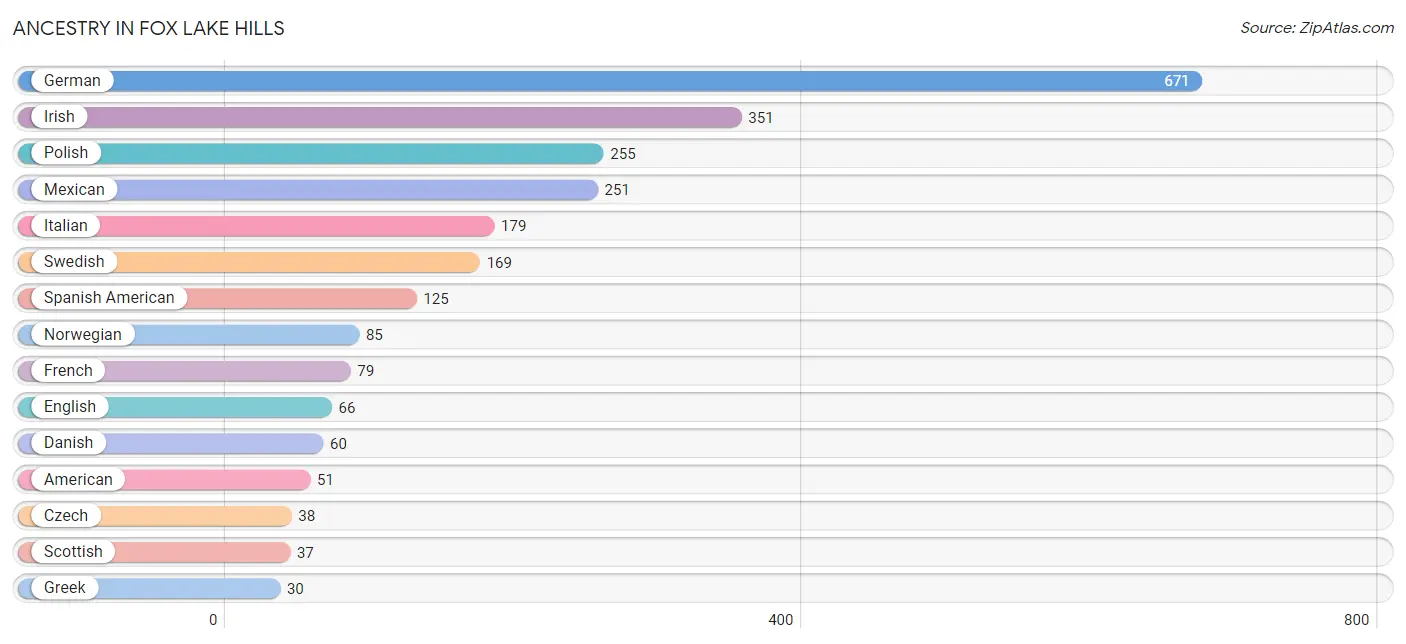
| Ancestry | # Population | % Population |
| American | 51 | 2.1% |
| Belgian | 9 | 0.4% |
| British | 15 | 0.6% |
| Central American Indian | 10 | 0.4% |
| Cherokee | 11 | 0.5% |
| Chippewa | 5 | 0.2% |
| Czech | 38 | 1.6% |
| Danish | 60 | 2.5% |
| Dominican | 6 | 0.3% |
| Dutch | 25 | 1.0% |
| English | 66 | 2.8% |
| French | 79 | 3.3% |
| French Canadian | 10 | 0.4% |
| German | 671 | 28.0% |
| Greek | 30 | 1.3% |
| Indian (Asian) | 6 | 0.3% |
| Irish | 351 | 14.6% |
| Italian | 179 | 7.5% |
| Lithuanian | 9 | 0.4% |
| Mexican | 251 | 10.5% |
| Mexican American Indian | 12 | 0.5% |
| Native Hawaiian | 9 | 0.4% |
| Norwegian | 85 | 3.5% |
| Polish | 255 | 10.6% |
| Puerto Rican | 7 | 0.3% |
| Romanian | 23 | 1.0% |
| Russian | 19 | 0.8% |
| Scottish | 37 | 1.5% |
| Spanish American | 125 | 5.2% |
| Spanish American Indian | 8 | 0.3% |
| Swedish | 169 | 7.0% |
| Ukrainian | 9 | 0.4% |
| Welsh | 15 | 0.6% | View All 33 Rows |
Immigrants in Fox Lake Hills
The most numerous immigrant groups reported in Fox Lake Hills came from Oceania (152 | 6.3%), Central America (49 | 2.0%), Latin America (49 | 2.0%), Mexico (49 | 2.0%), and Eastern Europe (41 | 1.7%), together accounting for 14.2% of all Fox Lake Hills residents.
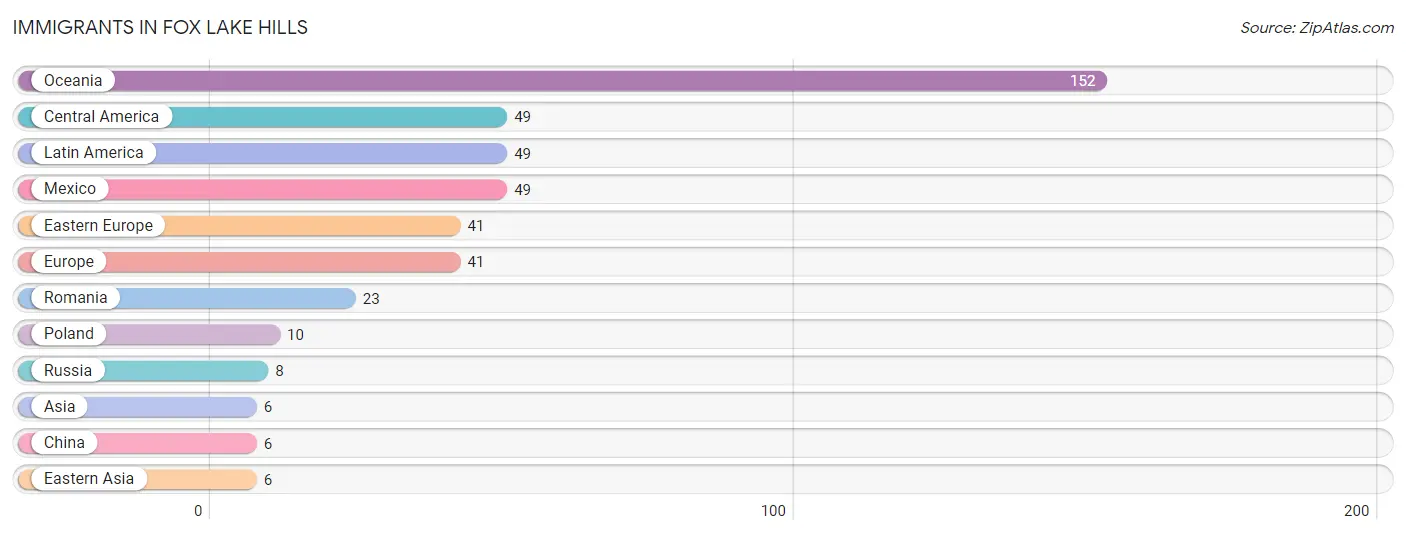
| Immigration Origin | # Population | % Population |
| Asia | 6 | 0.3% |
| Central America | 49 | 2.0% |
| China | 6 | 0.3% |
| Eastern Asia | 6 | 0.3% |
| Eastern Europe | 41 | 1.7% |
| Europe | 41 | 1.7% |
| Latin America | 49 | 2.0% |
| Mexico | 49 | 2.0% |
| Oceania | 152 | 6.3% |
| Poland | 10 | 0.4% |
| Romania | 23 | 1.0% |
| Russia | 8 | 0.3% | View All 12 Rows |
Sex and Age in Fox Lake Hills
Sex and Age in Fox Lake Hills
The most populous age groups in Fox Lake Hills are 55 to 59 Years (143 | 12.3%) for men and 45 to 49 Years (153 | 12.4%) for women.
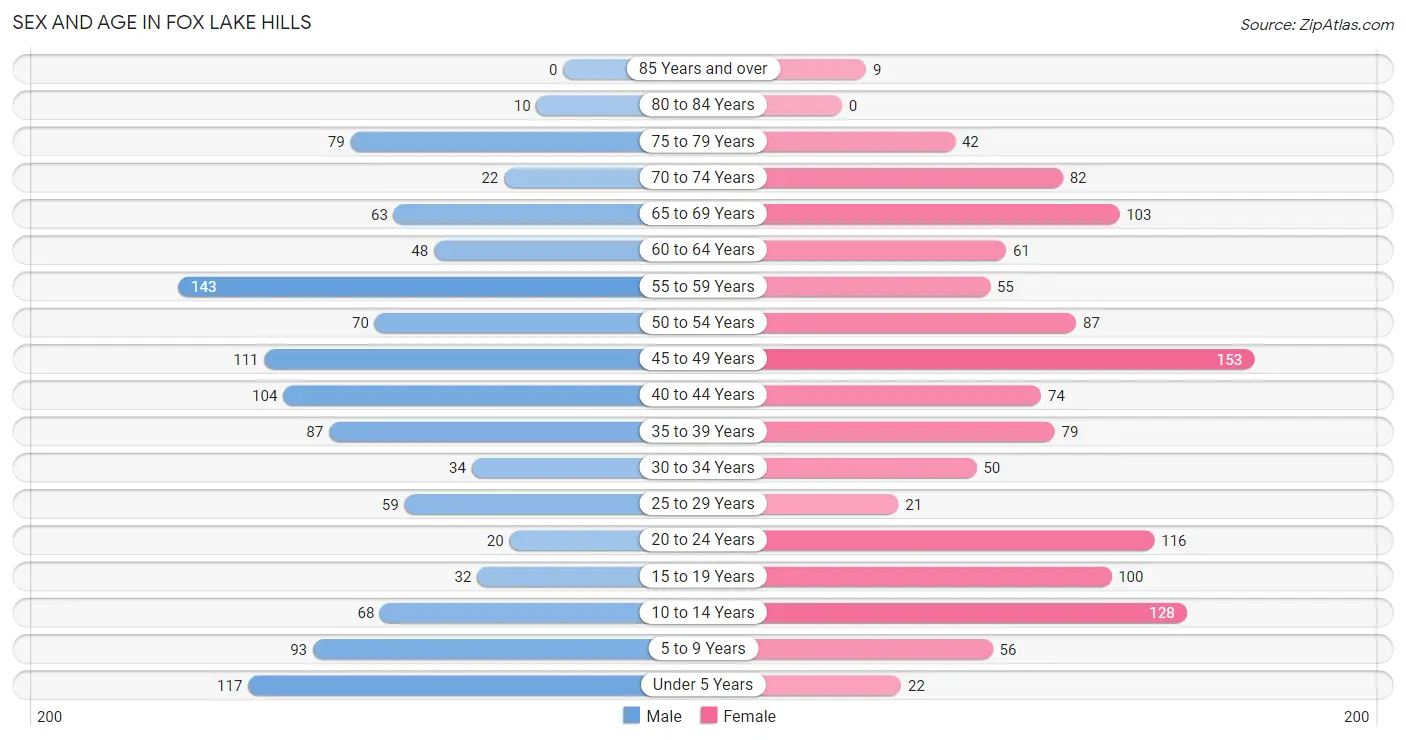
| Age Bracket | Male | Female |
| Under 5 Years | 117 (10.1%) | 22 (1.8%) |
| 5 to 9 Years | 93 (8.0%) | 56 (4.5%) |
| 10 to 14 Years | 68 (5.9%) | 128 (10.3%) |
| 15 to 19 Years | 32 (2.8%) | 100 (8.1%) |
| 20 to 24 Years | 20 (1.7%) | 116 (9.4%) |
| 25 to 29 Years | 59 (5.1%) | 21 (1.7%) |
| 30 to 34 Years | 34 (2.9%) | 50 (4.0%) |
| 35 to 39 Years | 87 (7.5%) | 79 (6.4%) |
| 40 to 44 Years | 104 (9.0%) | 74 (6.0%) |
| 45 to 49 Years | 111 (9.6%) | 153 (12.4%) |
| 50 to 54 Years | 70 (6.0%) | 87 (7.0%) |
| 55 to 59 Years | 143 (12.3%) | 55 (4.4%) |
| 60 to 64 Years | 48 (4.1%) | 61 (4.9%) |
| 65 to 69 Years | 63 (5.4%) | 103 (8.3%) |
| 70 to 74 Years | 22 (1.9%) | 82 (6.6%) |
| 75 to 79 Years | 79 (6.8%) | 42 (3.4%) |
| 80 to 84 Years | 10 (0.9%) | 0 (0.0%) |
| 85 Years and over | 0 (0.0%) | 9 (0.7%) |
| Total | 1,160 (100.0%) | 1,238 (100.0%) |
Families and Households in Fox Lake Hills
Median Family Size in Fox Lake Hills
The median family size in Fox Lake Hills is 3.10 persons per family, with single female/mother families (123 | 18.3%) accounting for the largest median family size of 4.26 persons per family. On the other hand, single male/father families (10 | 1.5%) represent the smallest median family size with 2.00 persons per family.
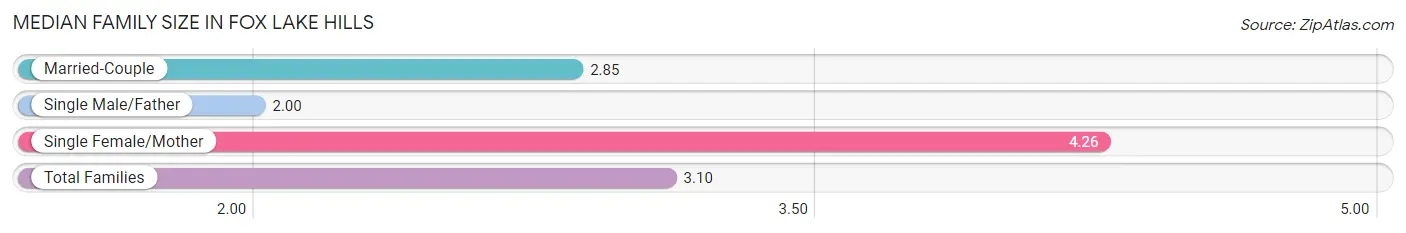
| Family Type | # Families | Family Size |
| Married-Couple | 538 (80.2%) | 2.85 |
| Single Male/Father | 10 (1.5%) | 2.00 |
| Single Female/Mother | 123 (18.3%) | 4.26 |
| Total Families | 671 (100.0%) | 3.10 |
Median Household Size in Fox Lake Hills
The median household size in Fox Lake Hills is 2.62 persons per household, with single female/mother households (123 | 13.4%) accounting for the largest median household size of 4.4 persons per household. non-family households (244 | 26.7%) represent the smallest median household size with 1.20 persons per household.
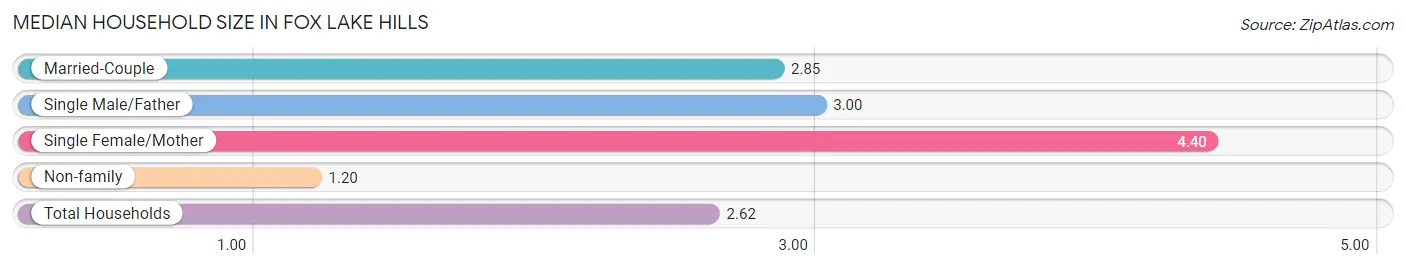
| Household Type | # Households | Household Size |
| Married-Couple | 538 (58.8%) | 2.85 |
| Single Male/Father | 10 (1.1%) | 3.00 |
| Single Female/Mother | 123 (13.4%) | 4.40 |
| Non-family | 244 (26.7%) | 1.20 |
| Total Households | 915 (100.0%) | 2.62 |
Household Size by Marriage Status in Fox Lake Hills
Out of a total of 915 households in Fox Lake Hills, 671 (73.3%) are family households, while 244 (26.7%) are nonfamily households. The most numerous type of family households are 2-person households, comprising 342, and the most common type of nonfamily households are 1-person households, comprising 197.
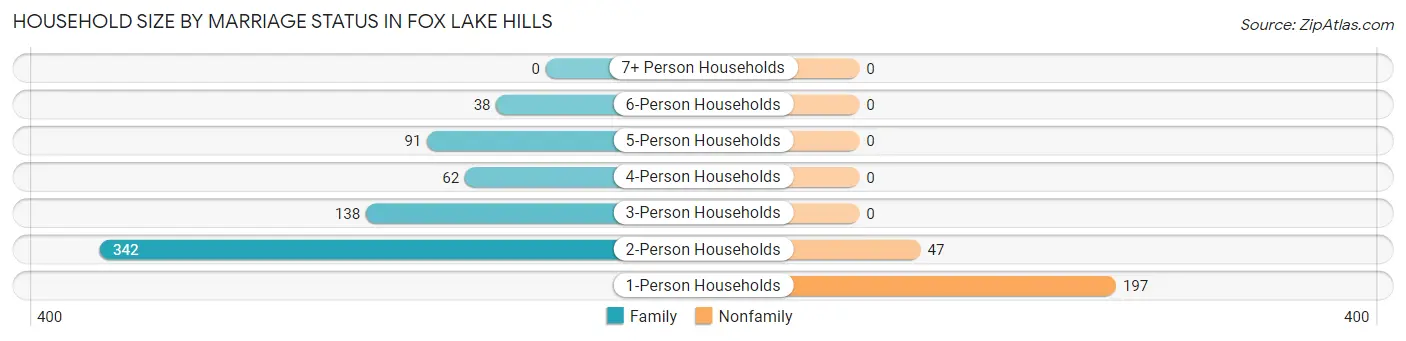
| Household Size | Family Households | Nonfamily Households |
| 1-Person Households | - | 197 (21.5%) |
| 2-Person Households | 342 (37.4%) | 47 (5.1%) |
| 3-Person Households | 138 (15.1%) | 0 (0.0%) |
| 4-Person Households | 62 (6.8%) | 0 (0.0%) |
| 5-Person Households | 91 (10.0%) | 0 (0.0%) |
| 6-Person Households | 38 (4.2%) | 0 (0.0%) |
| 7+ Person Households | 0 (0.0%) | 0 (0.0%) |
| Total | 671 (73.3%) | 244 (26.7%) |
Female Fertility in Fox Lake Hills
Fertility by Age in Fox Lake Hills
Average fertility rate in Fox Lake Hills is 33.0 births per 1,000 women. Women in the age bracket of 20 to 34 years have the highest fertility rate with 70.0 births per 1,000 women. Women in the age bracket of 20 to 34 years acount for 65.0% of all women with births.
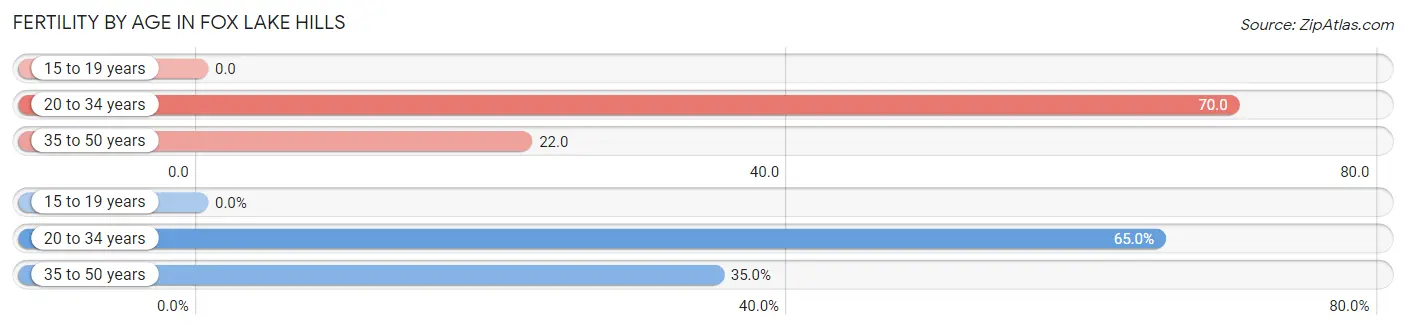
| Age Bracket | Women with Births | Births / 1,000 Women |
| 15 to 19 years | 0 (0.0%) | 0.0 |
| 20 to 34 years | 13 (65.0%) | 70.0 |
| 35 to 50 years | 7 (35.0%) | 22.0 |
| Total | 20 (100.0%) | 33.0 |
Fertility by Age by Marriage Status in Fox Lake Hills
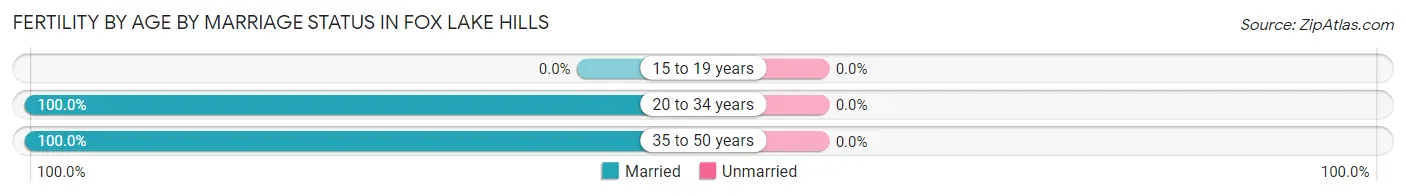
| Age Bracket | Married | Unmarried |
| 15 to 19 years | 0 (0.0%) | 0 (0.0%) |
| 20 to 34 years | 13 (100.0%) | 0 (0.0%) |
| 35 to 50 years | 7 (100.0%) | 0 (0.0%) |
| Total | 20 (100.0%) | 0 (0.0%) |
Fertility by Education in Fox Lake Hills
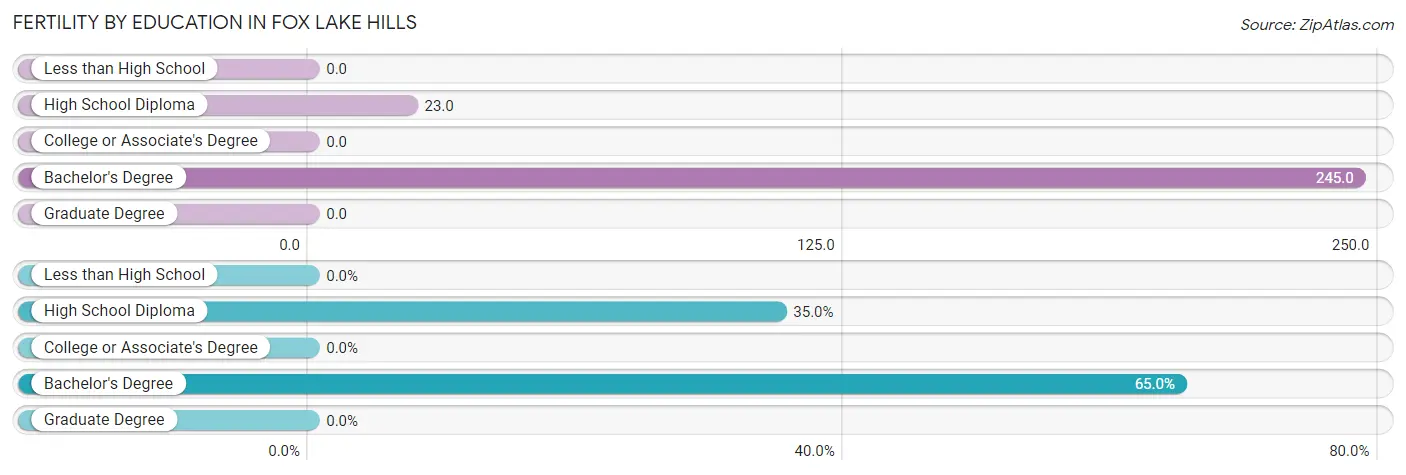
| Educational Attainment | Women with Births | Births / 1,000 Women |
| Less than High School | 0 (0.0%) | 0.0 |
| High School Diploma | 7 (35.0%) | 23.0 |
| College or Associate's Degree | 0 (0.0%) | 0.0 |
| Bachelor's Degree | 13 (65.0%) | 245.0 |
| Graduate Degree | 0 (0.0%) | 0.0 |
| Total | 20 (100.0%) | 33.0 |
Fertility by Education by Marriage Status in Fox Lake Hills
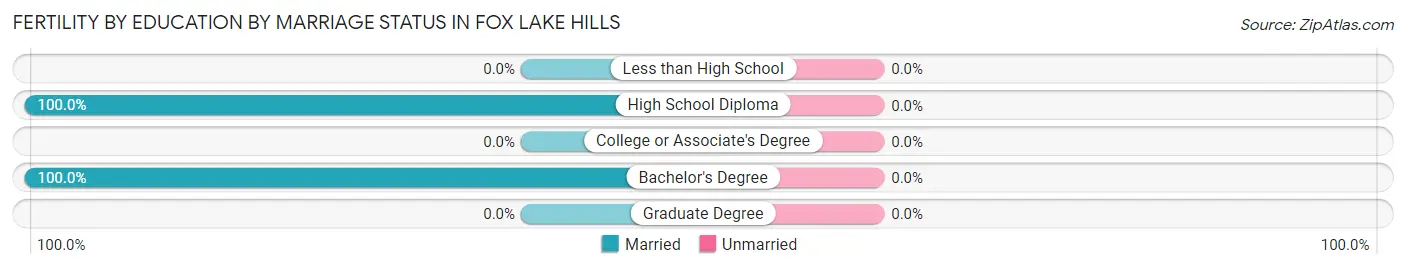
| Educational Attainment | Married | Unmarried |
| Less than High School | 0 (0.0%) | 0 (0.0%) |
| High School Diploma | 7 (100.0%) | 0 (0.0%) |
| College or Associate's Degree | 0 (0.0%) | 0 (0.0%) |
| Bachelor's Degree | 13 (100.0%) | 0 (0.0%) |
| Graduate Degree | 0 (0.0%) | 0 (0.0%) |
| Total | 20 (100.0%) | 0 (0.0%) |
Employment Characteristics in Fox Lake Hills
Employment by Class of Employer in Fox Lake Hills
Among the 1,191 employed individuals in Fox Lake Hills, private company employees (782 | 65.7%), self-employed (not incorporated) (132 | 11.1%), and local government employees (125 | 10.5%) make up the most common classes of employment.
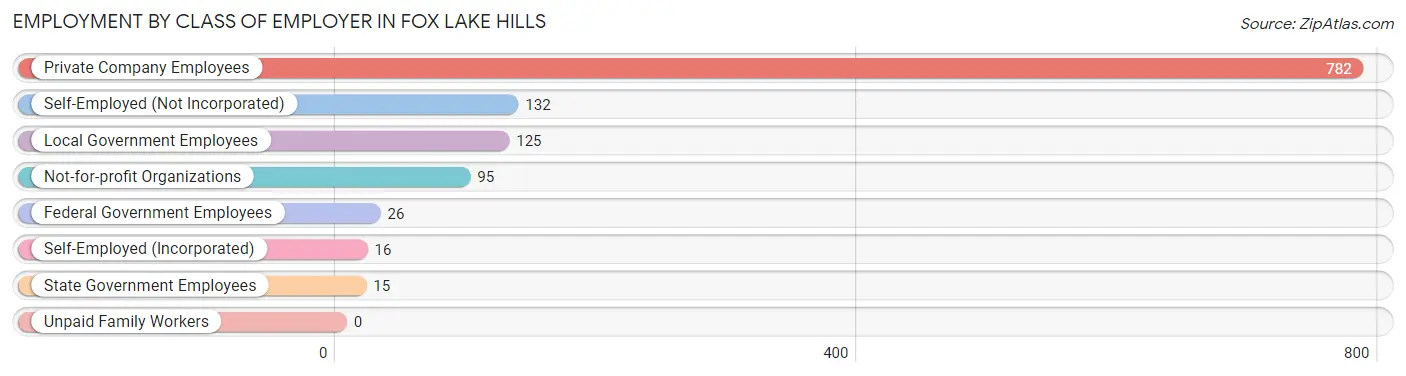
| Employer Class | # Employees | % Employees |
| Private Company Employees | 782 | 65.7% |
| Self-Employed (Incorporated) | 16 | 1.3% |
| Self-Employed (Not Incorporated) | 132 | 11.1% |
| Not-for-profit Organizations | 95 | 8.0% |
| Local Government Employees | 125 | 10.5% |
| State Government Employees | 15 | 1.3% |
| Federal Government Employees | 26 | 2.2% |
| Unpaid Family Workers | 0 | 0.0% |
| Total | 1,191 | 100.0% |
Employment Status by Age in Fox Lake Hills
According to the labor force statistics for Fox Lake Hills, out of the total population over 16 years of age (1,899), 67.7% or 1,286 individuals are in the labor force, with 6.8% or 87 of them unemployed. The age group with the highest labor force participation rate is 30 to 34 years, with 97.6% or 82 individuals in the labor force. Within the labor force, the 16 to 19 years age range has the highest percentage of unemployed individuals, with 61.5% or 32 of them being unemployed.
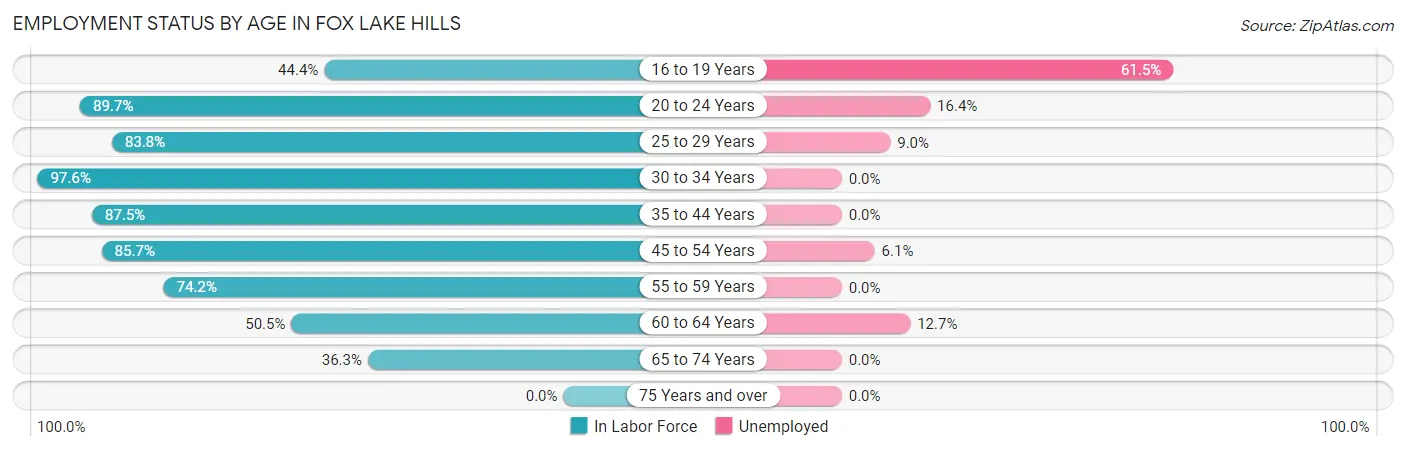
| Age Bracket | In Labor Force | Unemployed |
| 16 to 19 Years | 52 (44.4%) | 32 (61.5%) |
| 20 to 24 Years | 122 (89.7%) | 20 (16.4%) |
| 25 to 29 Years | 67 (83.8%) | 6 (9.0%) |
| 30 to 34 Years | 82 (97.6%) | 0 (0.0%) |
| 35 to 44 Years | 301 (87.5%) | 0 (0.0%) |
| 45 to 54 Years | 361 (85.7%) | 22 (6.1%) |
| 55 to 59 Years | 147 (74.2%) | 0 (0.0%) |
| 60 to 64 Years | 55 (50.5%) | 7 (12.7%) |
| 65 to 74 Years | 98 (36.3%) | 0 (0.0%) |
| 75 Years and over | 0 (0.0%) | 0 (0.0%) |
| Total | 1,286 (67.7%) | 87 (6.8%) |
Employment Status by Educational Attainment in Fox Lake Hills
According to labor force statistics for Fox Lake Hills, 82.0% of individuals (1,014) out of the total population between 25 and 64 years of age (1,236) are in the labor force, with 3.5% or 35 of them being unemployed. The group with the highest labor force participation rate are those with the educational attainment of bachelor's degree or higher, with 86.7% or 267 individuals in the labor force. Within the labor force, individuals with bachelor's degree or higher education have the highest percentage of unemployment, with 4.5% or 12 of them being unemployed.
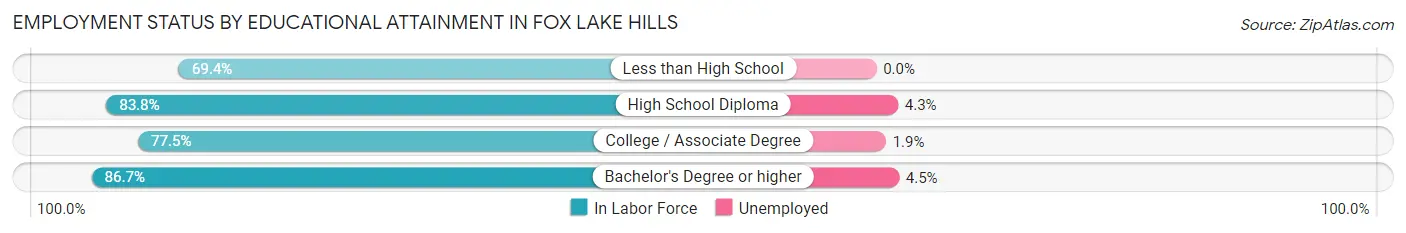
| Educational Attainment | In Labor Force | Unemployed |
| Less than High School | 25 (69.4%) | 0 (0.0%) |
| High School Diploma | 398 (83.8%) | 20 (4.3%) |
| College / Associate Degree | 323 (77.5%) | 8 (1.9%) |
| Bachelor's Degree or higher | 267 (86.7%) | 14 (4.5%) |
| Total | 1,014 (82.0%) | 43 (3.5%) |
Employment Occupations by Sex in Fox Lake Hills
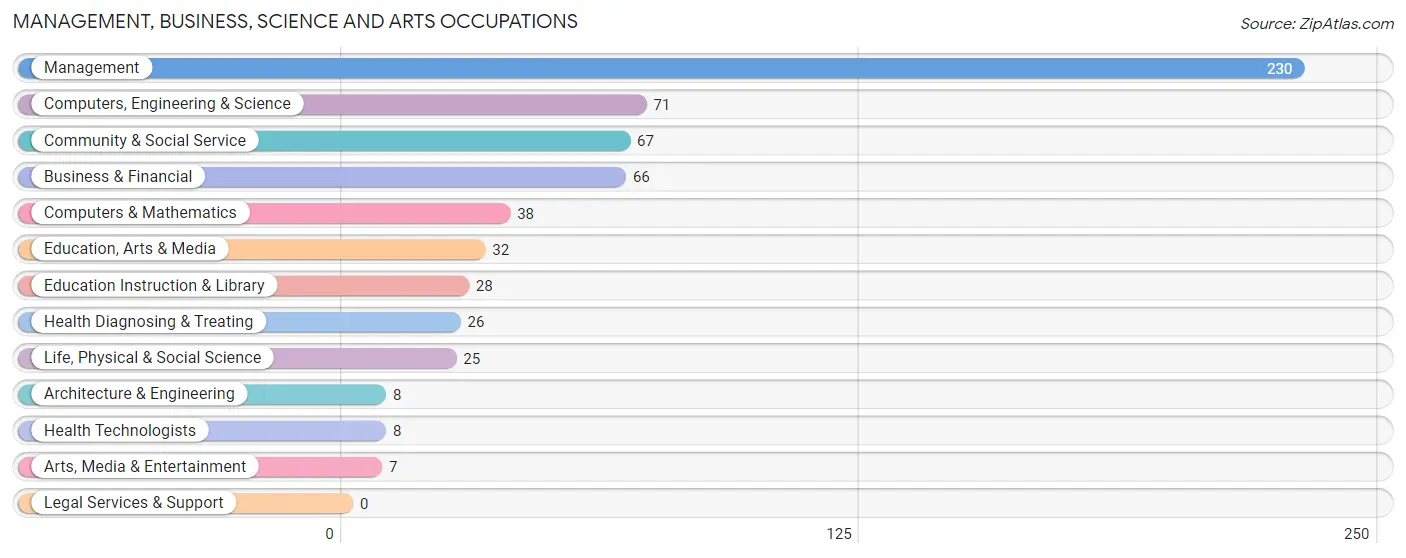
Management, Business, Science and Arts Occupations
The most common Management, Business, Science and Arts occupations in Fox Lake Hills are Management (230 | 19.2%), Computers, Engineering & Science (71 | 5.9%), Community & Social Service (67 | 5.6%), Business & Financial (66 | 5.5%), and Computers & Mathematics (38 | 3.2%).
Management, Business, Science and Arts Occupations by Sex
Within the Management, Business, Science and Arts occupations in Fox Lake Hills, the most male-oriented occupations are Architecture & Engineering (100.0%), Health Technologists (100.0%), and Computers & Mathematics (84.2%), while the most female-oriented occupations are Life, Physical & Social Science (100.0%), Education, Arts & Media (100.0%), and Arts, Media & Entertainment (100.0%).
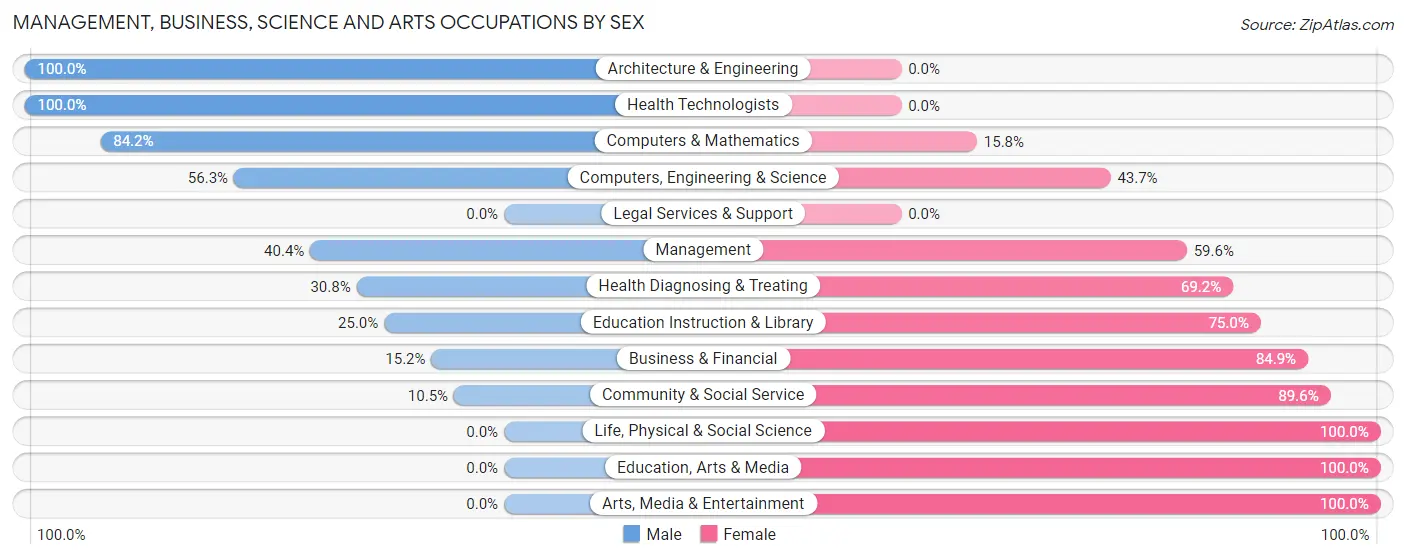
| Occupation | Male | Female |
| Management | 93 (40.4%) | 137 (59.6%) |
| Business & Financial | 10 (15.1%) | 56 (84.9%) |
| Computers, Engineering & Science | 40 (56.3%) | 31 (43.7%) |
| Computers & Mathematics | 32 (84.2%) | 6 (15.8%) |
| Architecture & Engineering | 8 (100.0%) | 0 (0.0%) |
| Life, Physical & Social Science | 0 (0.0%) | 25 (100.0%) |
| Community & Social Service | 7 (10.4%) | 60 (89.5%) |
| Education, Arts & Media | 0 (0.0%) | 32 (100.0%) |
| Legal Services & Support | 0 (0.0%) | 0 (0.0%) |
| Education Instruction & Library | 7 (25.0%) | 21 (75.0%) |
| Arts, Media & Entertainment | 0 (0.0%) | 7 (100.0%) |
| Health Diagnosing & Treating | 8 (30.8%) | 18 (69.2%) |
| Health Technologists | 8 (100.0%) | 0 (0.0%) |
| Total (Category) | 158 (34.4%) | 302 (65.6%) |
| Total (Overall) | 558 (46.6%) | 640 (53.4%) |
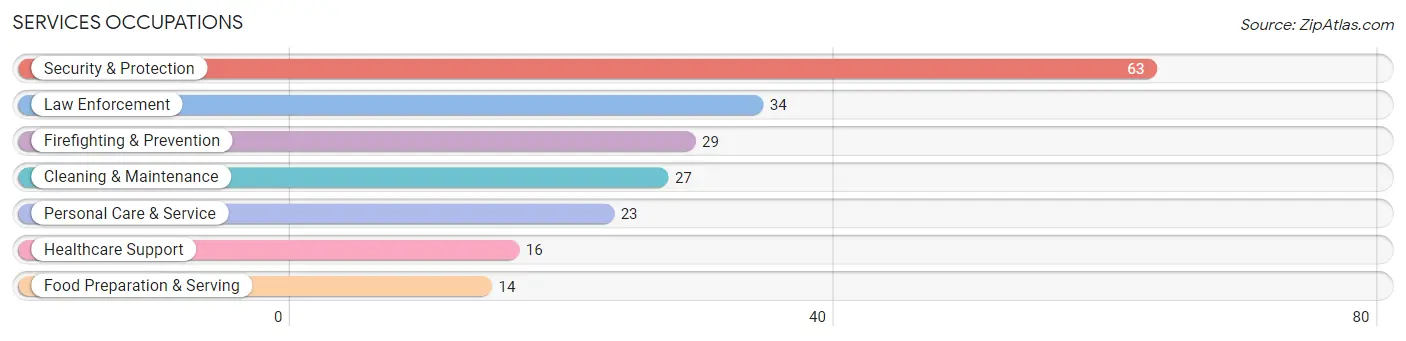
Services Occupations
The most common Services occupations in Fox Lake Hills are Security & Protection (63 | 5.3%), Law Enforcement (34 | 2.8%), Firefighting & Prevention (29 | 2.4%), Cleaning & Maintenance (27 | 2.2%), and Personal Care & Service (23 | 1.9%).
Services Occupations by Sex
Within the Services occupations in Fox Lake Hills, the most male-oriented occupations are Security & Protection (100.0%), Firefighting & Prevention (100.0%), and Law Enforcement (100.0%), while the most female-oriented occupations are Healthcare Support (100.0%), Food Preparation & Serving (100.0%), and Personal Care & Service (100.0%).
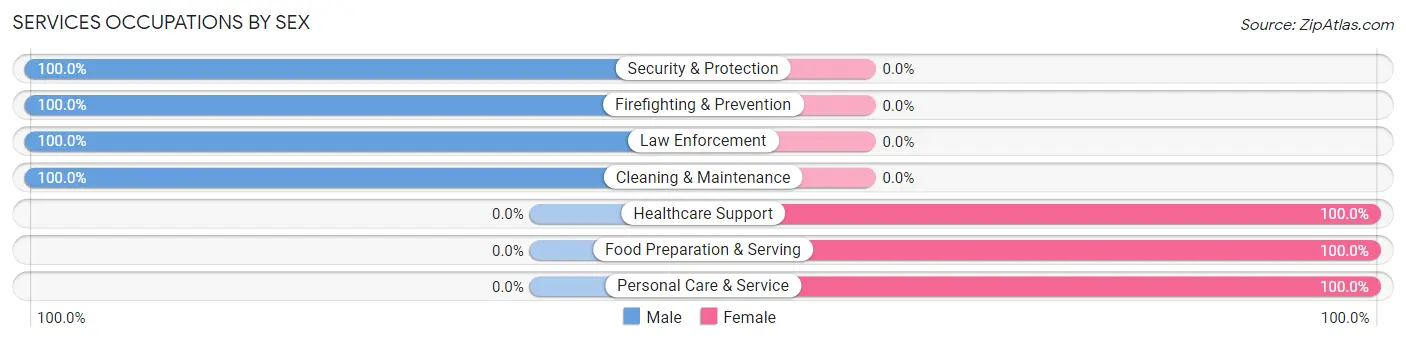
| Occupation | Male | Female |
| Healthcare Support | 0 (0.0%) | 16 (100.0%) |
| Security & Protection | 63 (100.0%) | 0 (0.0%) |
| Firefighting & Prevention | 29 (100.0%) | 0 (0.0%) |
| Law Enforcement | 34 (100.0%) | 0 (0.0%) |
| Food Preparation & Serving | 0 (0.0%) | 14 (100.0%) |
| Cleaning & Maintenance | 27 (100.0%) | 0 (0.0%) |
| Personal Care & Service | 0 (0.0%) | 23 (100.0%) |
| Total (Category) | 90 (62.9%) | 53 (37.1%) |
| Total (Overall) | 558 (46.6%) | 640 (53.4%) |
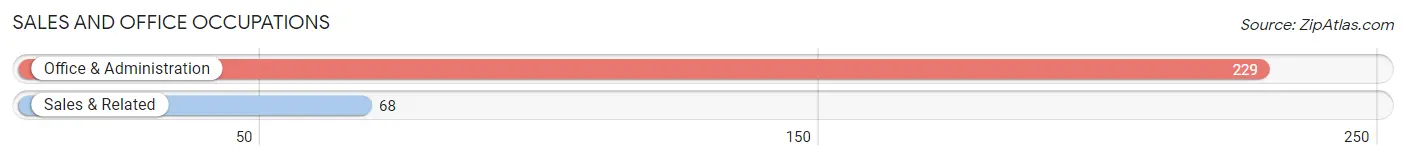
Sales and Office Occupations
The most common Sales and Office occupations in Fox Lake Hills are Office & Administration (229 | 19.1%), and Sales & Related (68 | 5.7%).
Sales and Office Occupations by Sex
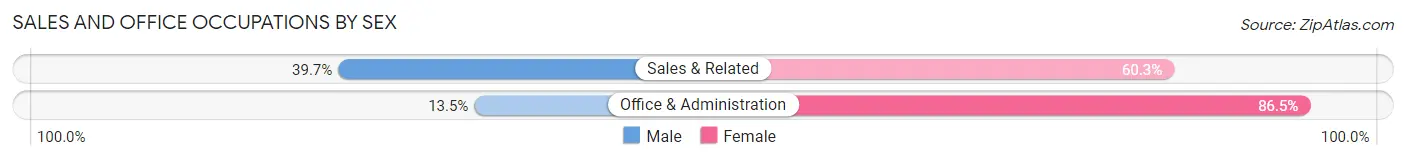
| Occupation | Male | Female |
| Sales & Related | 27 (39.7%) | 41 (60.3%) |
| Office & Administration | 31 (13.5%) | 198 (86.5%) |
| Total (Category) | 58 (19.5%) | 239 (80.5%) |
| Total (Overall) | 558 (46.6%) | 640 (53.4%) |
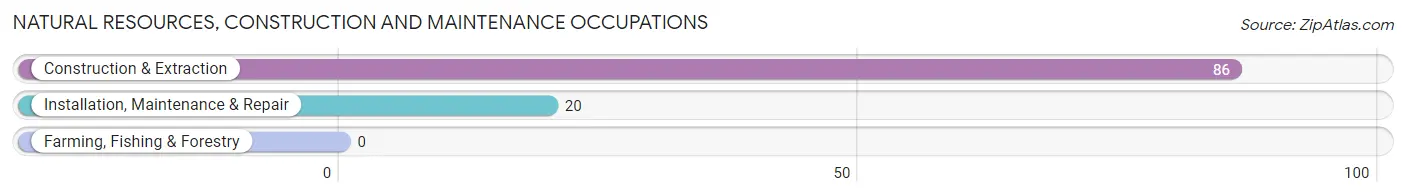
Natural Resources, Construction and Maintenance Occupations
The most common Natural Resources, Construction and Maintenance occupations in Fox Lake Hills are Construction & Extraction (86 | 7.2%), and Installation, Maintenance & Repair (20 | 1.7%).
Natural Resources, Construction and Maintenance Occupations by Sex
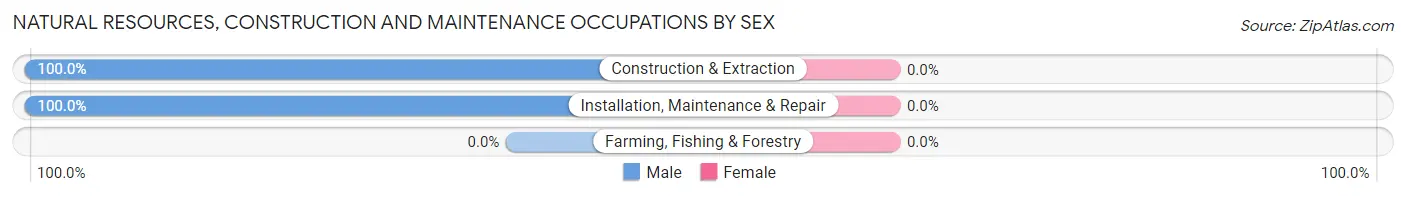
| Occupation | Male | Female |
| Farming, Fishing & Forestry | 0 (0.0%) | 0 (0.0%) |
| Construction & Extraction | 86 (100.0%) | 0 (0.0%) |
| Installation, Maintenance & Repair | 20 (100.0%) | 0 (0.0%) |
| Total (Category) | 106 (100.0%) | 0 (0.0%) |
| Total (Overall) | 558 (46.6%) | 640 (53.4%) |
Production, Transportation and Moving Occupations
The most common Production, Transportation and Moving occupations in Fox Lake Hills are Production (106 | 8.8%), Material Moving (56 | 4.7%), and Transportation (30 | 2.5%).
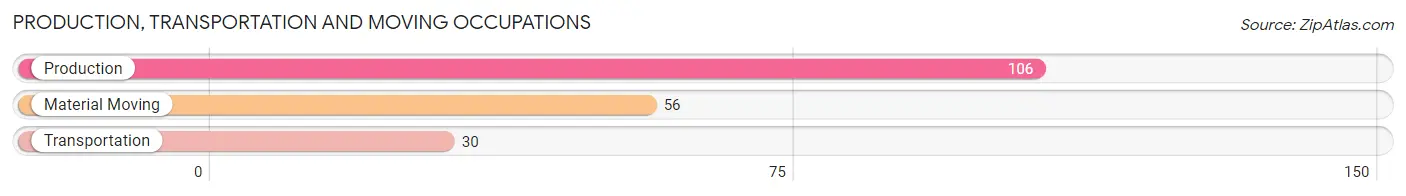
Production, Transportation and Moving Occupations by Sex
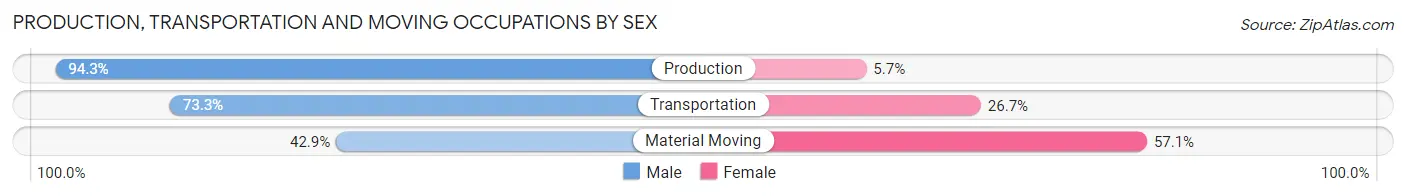
| Occupation | Male | Female |
| Production | 100 (94.3%) | 6 (5.7%) |
| Transportation | 22 (73.3%) | 8 (26.7%) |
| Material Moving | 24 (42.9%) | 32 (57.1%) |
| Total (Category) | 146 (76.0%) | 46 (24.0%) |
| Total (Overall) | 558 (46.6%) | 640 (53.4%) |
Employment Industries by Sex in Fox Lake Hills
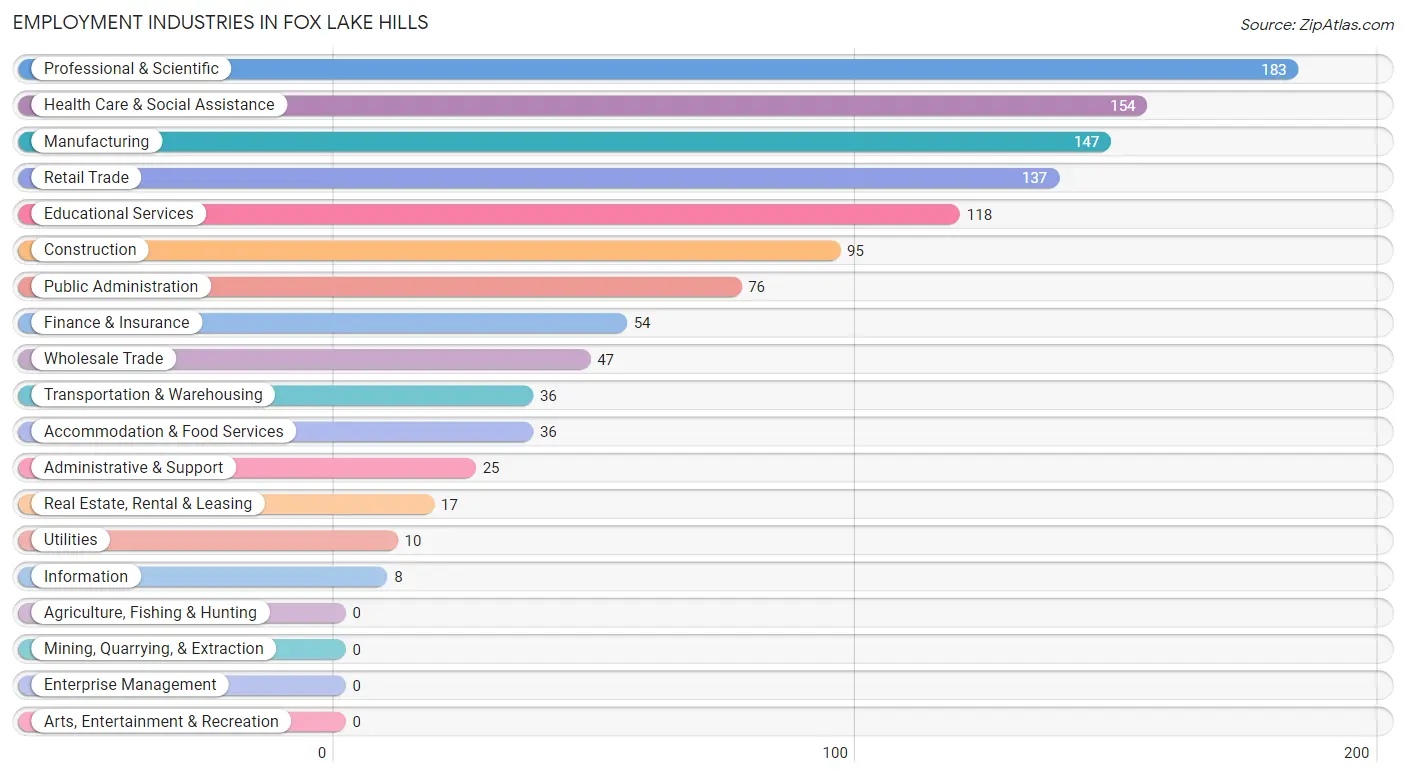
Employment Industries in Fox Lake Hills
The major employment industries in Fox Lake Hills include Professional & Scientific (183 | 15.3%), Health Care & Social Assistance (154 | 12.9%), Manufacturing (147 | 12.3%), Retail Trade (137 | 11.4%), and Educational Services (118 | 9.9%).
Employment Industries by Sex in Fox Lake Hills
The Fox Lake Hills industries that see more men than women are Transportation & Warehousing (100.0%), Utilities (100.0%), and Information (100.0%), whereas the industries that tend to have a higher number of women are Real Estate, Rental & Leasing (100.0%), Accommodation & Food Services (100.0%), and Health Care & Social Assistance (89.6%).
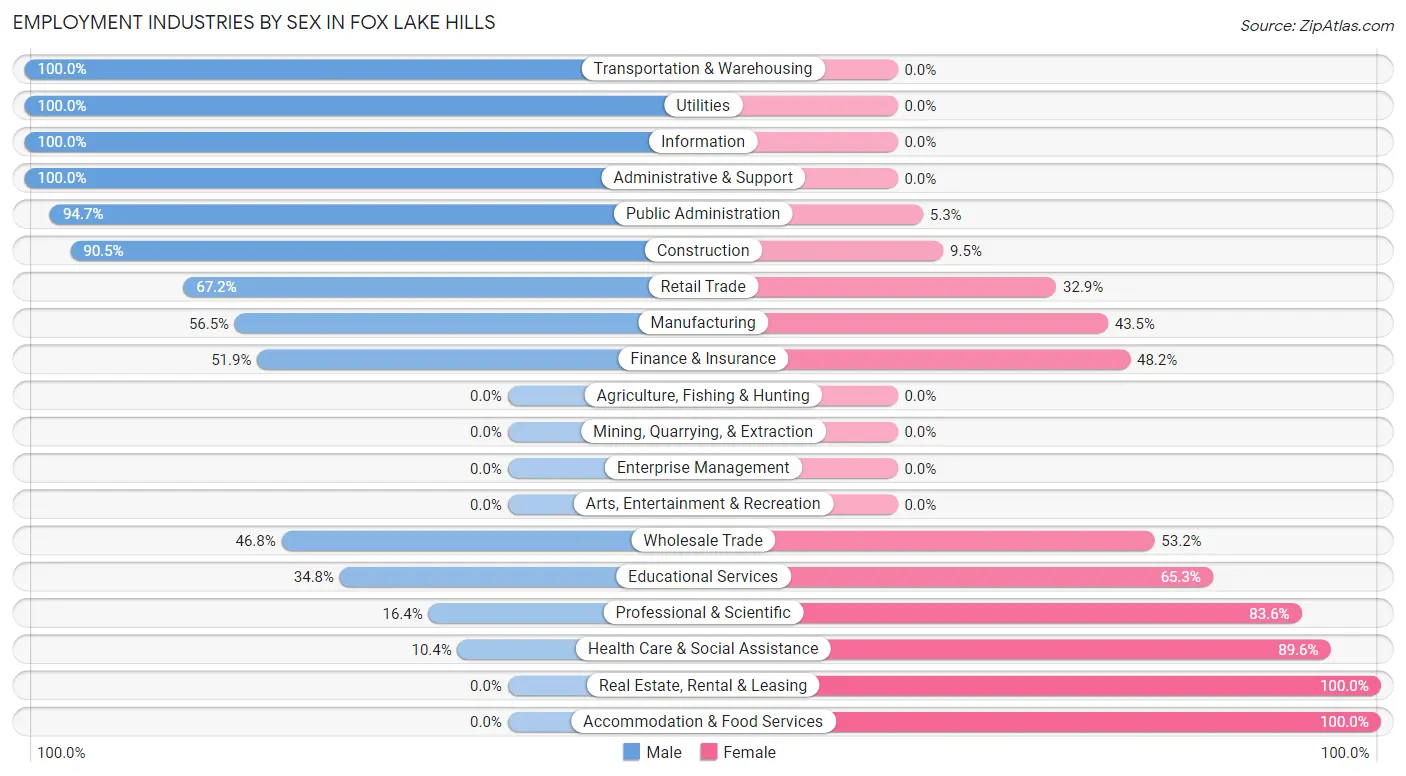
| Industry | Male | Female |
| Agriculture, Fishing & Hunting | 0 (0.0%) | 0 (0.0%) |
| Mining, Quarrying, & Extraction | 0 (0.0%) | 0 (0.0%) |
| Construction | 86 (90.5%) | 9 (9.5%) |
| Manufacturing | 83 (56.5%) | 64 (43.5%) |
| Wholesale Trade | 22 (46.8%) | 25 (53.2%) |
| Retail Trade | 92 (67.1%) | 45 (32.9%) |
| Transportation & Warehousing | 36 (100.0%) | 0 (0.0%) |
| Utilities | 10 (100.0%) | 0 (0.0%) |
| Information | 8 (100.0%) | 0 (0.0%) |
| Finance & Insurance | 28 (51.8%) | 26 (48.1%) |
| Real Estate, Rental & Leasing | 0 (0.0%) | 17 (100.0%) |
| Professional & Scientific | 30 (16.4%) | 153 (83.6%) |
| Enterprise Management | 0 (0.0%) | 0 (0.0%) |
| Administrative & Support | 25 (100.0%) | 0 (0.0%) |
| Educational Services | 41 (34.7%) | 77 (65.2%) |
| Health Care & Social Assistance | 16 (10.4%) | 138 (89.6%) |
| Arts, Entertainment & Recreation | 0 (0.0%) | 0 (0.0%) |
| Accommodation & Food Services | 0 (0.0%) | 36 (100.0%) |
| Public Administration | 72 (94.7%) | 4 (5.3%) |
| Total | 558 (46.6%) | 640 (53.4%) |
Education in Fox Lake Hills
School Enrollment in Fox Lake Hills
The most common levels of schooling among the 497 students in Fox Lake Hills are middle school (160 | 32.2%), elementary school (128 | 25.8%), and college / undergraduate (75 | 15.1%).
| School Level | # Students | % Students |
| Nursery / Preschool | 22 | 4.4% |
| Kindergarten | 39 | 7.9% |
| Elementary School | 128 | 25.8% |
| Middle School | 160 | 32.2% |
| High School | 73 | 14.7% |
| College / Undergraduate | 75 | 15.1% |
| Graduate / Professional | 0 | 0.0% |
| Total | 497 | 100.0% |
School Enrollment by Age by Funding Source in Fox Lake Hills
Out of a total of 497 students who are enrolled in schools in Fox Lake Hills, 70 (14.1%) attend a private institution, while the remaining 427 (85.9%) are enrolled in public schools. The age group of 20 to 24 year olds has the highest likelihood of being enrolled in private schools, with 23 (62.2% in the age bracket) enrolled. Conversely, the age group of 3 to 4 year olds has the lowest likelihood of being enrolled in a private school, with 29 (100.0% in the age bracket) attending a public institution.
| Age Bracket | Public School | Private School |
| 3 to 4 Year Olds | 29 (100.0%) | 0 (0.0%) |
| 5 to 9 Year Old | 139 (93.3%) | 10 (6.7%) |
| 10 to 14 Year Olds | 164 (83.7%) | 32 (16.3%) |
| 15 to 17 Year Olds | 48 (100.0%) | 0 (0.0%) |
| 18 to 19 Year Olds | 33 (86.8%) | 5 (13.2%) |
| 20 to 24 Year Olds | 14 (37.8%) | 23 (62.2%) |
| 25 to 34 Year Olds | 0 (0.0%) | 0 (0.0%) |
| 35 Years and over | 0 (0.0%) | 0 (0.0%) |
| Total | 427 (85.9%) | 70 (14.1%) |
Educational Attainment by Field of Study in Fox Lake Hills
Business (77 | 17.3%), psychology (54 | 12.2%), education (54 | 12.2%), liberal arts & history (52 | 11.7%), and science & technology (48 | 10.8%) are the most common fields of study among 444 individuals in Fox Lake Hills who have obtained a bachelor's degree or higher.
| Field of Study | # Graduates | % Graduates |
| Computers & Mathematics | 28 | 6.3% |
| Bio, Nature & Agricultural | 20 | 4.5% |
| Physical & Health Sciences | 12 | 2.7% |
| Psychology | 54 | 12.2% |
| Social Sciences | 0 | 0.0% |
| Engineering | 43 | 9.7% |
| Multidisciplinary Studies | 0 | 0.0% |
| Science & Technology | 48 | 10.8% |
| Business | 77 | 17.3% |
| Education | 54 | 12.2% |
| Literature & Languages | 9 | 2.0% |
| Liberal Arts & History | 52 | 11.7% |
| Visual & Performing Arts | 15 | 3.4% |
| Communications | 22 | 5.0% |
| Arts & Humanities | 10 | 2.2% |
| Total | 444 | 100.0% |
Transportation & Commute in Fox Lake Hills
Vehicle Availability by Sex in Fox Lake Hills
The most prevalent vehicle ownership categories in Fox Lake Hills are males with 2 vehicles (294, accounting for 52.7%) and females with 2 vehicles (283, making up 46.5%).
| Vehicles Available | Male | Female |
| No Vehicle | 0 (0.0%) | 0 (0.0%) |
| 1 Vehicle | 94 (16.9%) | 116 (18.3%) |
| 2 Vehicles | 294 (52.7%) | 283 (44.7%) |
| 3 Vehicles | 82 (14.7%) | 113 (17.8%) |
| 4 Vehicles | 60 (10.7%) | 98 (15.5%) |
| 5 or more Vehicles | 28 (5.0%) | 23 (3.6%) |
| Total | 558 (100.0%) | 633 (100.0%) |
Commute Time in Fox Lake Hills
The most frequently occuring commute durations in Fox Lake Hills are 45 to 59 minutes (196 commuters, 18.6%), 15 to 19 minutes (165 commuters, 15.7%), and 60 to 89 minutes (127 commuters, 12.1%).
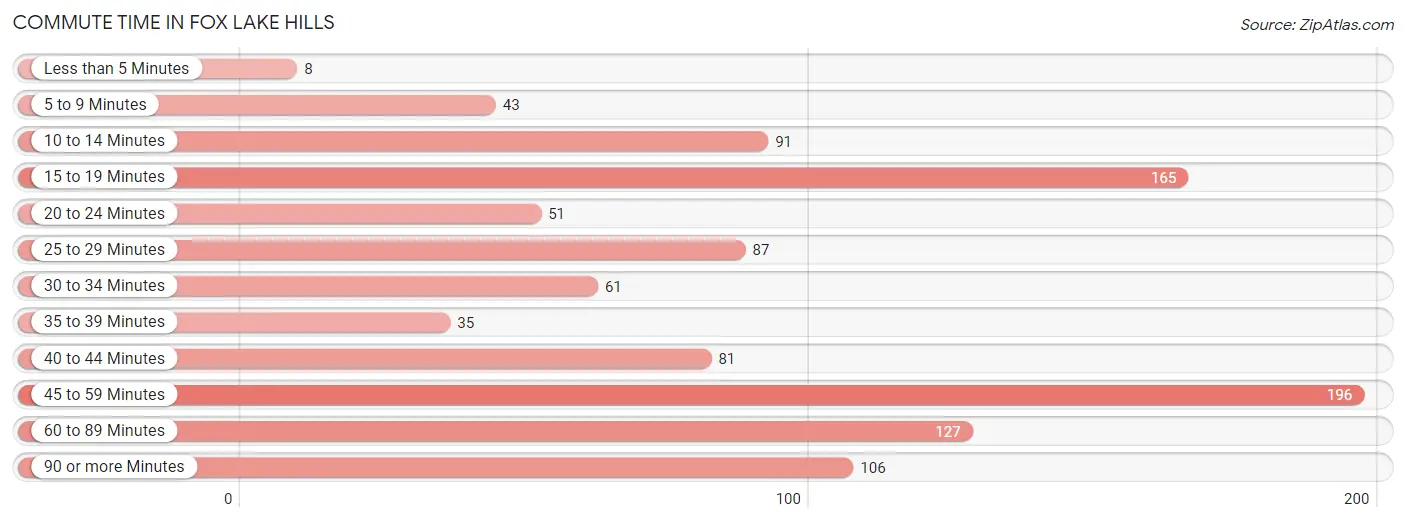
| Commute Time | # Commuters | % Commuters |
| Less than 5 Minutes | 8 | 0.8% |
| 5 to 9 Minutes | 43 | 4.1% |
| 10 to 14 Minutes | 91 | 8.7% |
| 15 to 19 Minutes | 165 | 15.7% |
| 20 to 24 Minutes | 51 | 4.9% |
| 25 to 29 Minutes | 87 | 8.3% |
| 30 to 34 Minutes | 61 | 5.8% |
| 35 to 39 Minutes | 35 | 3.3% |
| 40 to 44 Minutes | 81 | 7.7% |
| 45 to 59 Minutes | 196 | 18.6% |
| 60 to 89 Minutes | 127 | 12.1% |
| 90 or more Minutes | 106 | 10.1% |
Commute Time by Sex in Fox Lake Hills
The most common commute times in Fox Lake Hills are 15 to 19 minutes (72 commuters, 16.1%) for males and 45 to 59 minutes (125 commuters, 20.7%) for females.
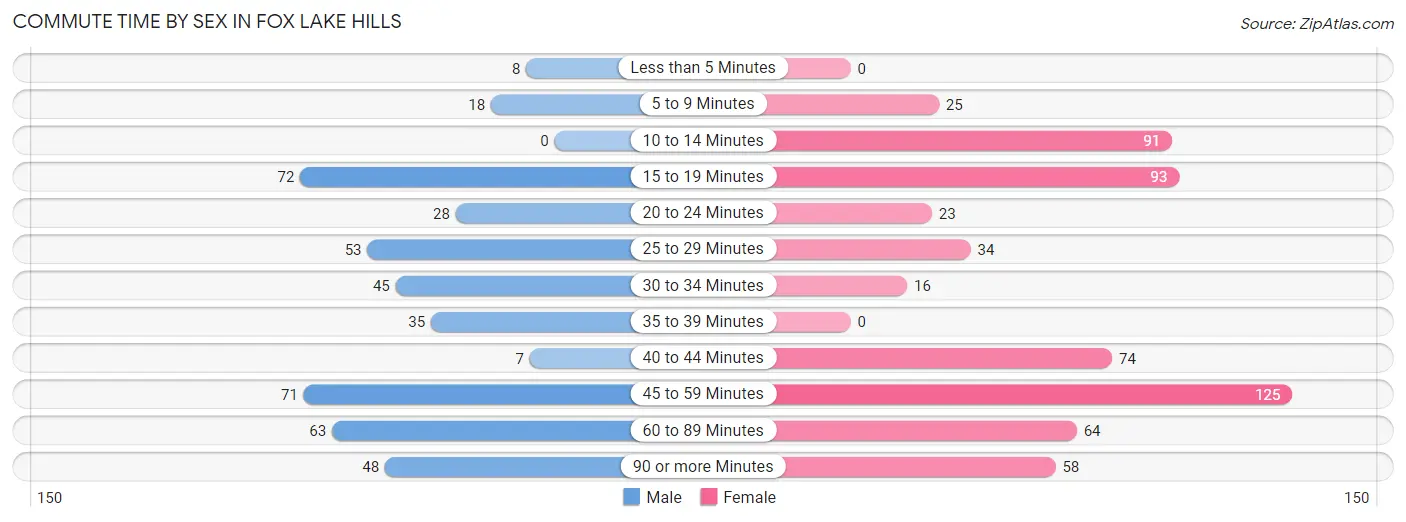
| Commute Time | Male | Female |
| Less than 5 Minutes | 8 (1.8%) | 0 (0.0%) |
| 5 to 9 Minutes | 18 (4.0%) | 25 (4.2%) |
| 10 to 14 Minutes | 0 (0.0%) | 91 (15.1%) |
| 15 to 19 Minutes | 72 (16.1%) | 93 (15.4%) |
| 20 to 24 Minutes | 28 (6.2%) | 23 (3.8%) |
| 25 to 29 Minutes | 53 (11.8%) | 34 (5.6%) |
| 30 to 34 Minutes | 45 (10.0%) | 16 (2.6%) |
| 35 to 39 Minutes | 35 (7.8%) | 0 (0.0%) |
| 40 to 44 Minutes | 7 (1.6%) | 74 (12.3%) |
| 45 to 59 Minutes | 71 (15.9%) | 125 (20.7%) |
| 60 to 89 Minutes | 63 (14.1%) | 64 (10.6%) |
| 90 or more Minutes | 48 (10.7%) | 58 (9.6%) |
Time of Departure to Work by Sex in Fox Lake Hills
The most frequent times of departure to work in Fox Lake Hills are 6:00 AM to 6:29 AM (141, 31.5%) for males and 7:30 AM to 7:59 AM (152, 25.2%) for females.
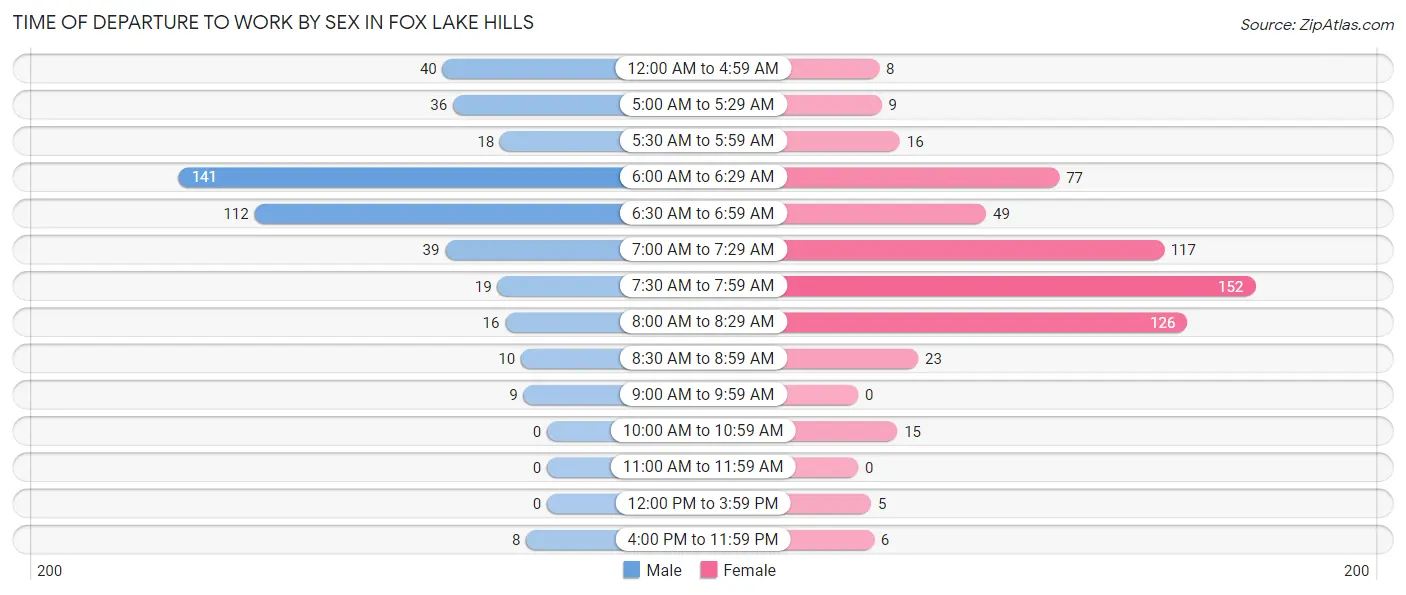
| Time of Departure | Male | Female |
| 12:00 AM to 4:59 AM | 40 (8.9%) | 8 (1.3%) |
| 5:00 AM to 5:29 AM | 36 (8.0%) | 9 (1.5%) |
| 5:30 AM to 5:59 AM | 18 (4.0%) | 16 (2.6%) |
| 6:00 AM to 6:29 AM | 141 (31.5%) | 77 (12.8%) |
| 6:30 AM to 6:59 AM | 112 (25.0%) | 49 (8.1%) |
| 7:00 AM to 7:29 AM | 39 (8.7%) | 117 (19.4%) |
| 7:30 AM to 7:59 AM | 19 (4.2%) | 152 (25.2%) |
| 8:00 AM to 8:29 AM | 16 (3.6%) | 126 (20.9%) |
| 8:30 AM to 8:59 AM | 10 (2.2%) | 23 (3.8%) |
| 9:00 AM to 9:59 AM | 9 (2.0%) | 0 (0.0%) |
| 10:00 AM to 10:59 AM | 0 (0.0%) | 15 (2.5%) |
| 11:00 AM to 11:59 AM | 0 (0.0%) | 0 (0.0%) |
| 12:00 PM to 3:59 PM | 0 (0.0%) | 5 (0.8%) |
| 4:00 PM to 11:59 PM | 8 (1.8%) | 6 (1.0%) |
| Total | 448 (100.0%) | 603 (100.0%) |
Housing Occupancy in Fox Lake Hills
Occupancy by Ownership in Fox Lake Hills
Of the total 915 dwellings in Fox Lake Hills, owner-occupied units account for 806 (88.1%), while renter-occupied units make up 109 (11.9%).
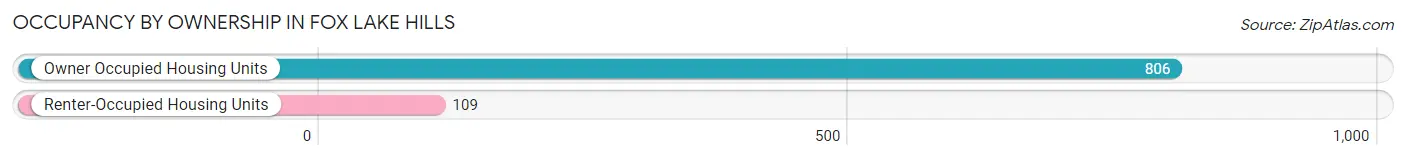
| Occupancy | # Housing Units | % Housing Units |
| Owner Occupied Housing Units | 806 | 88.1% |
| Renter-Occupied Housing Units | 109 | 11.9% |
| Total Occupied Housing Units | 915 | 100.0% |
Occupancy by Household Size in Fox Lake Hills
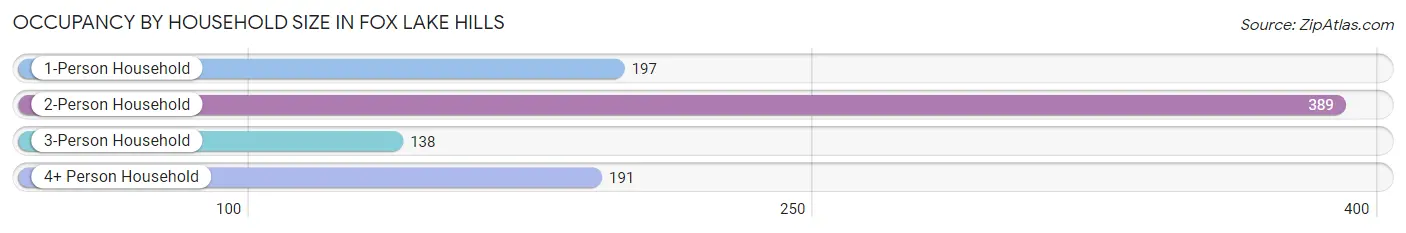
| Household Size | # Housing Units | % Housing Units |
| 1-Person Household | 197 | 21.5% |
| 2-Person Household | 389 | 42.5% |
| 3-Person Household | 138 | 15.1% |
| 4+ Person Household | 191 | 20.9% |
| Total Housing Units | 915 | 100.0% |
Occupancy by Ownership by Household Size in Fox Lake Hills
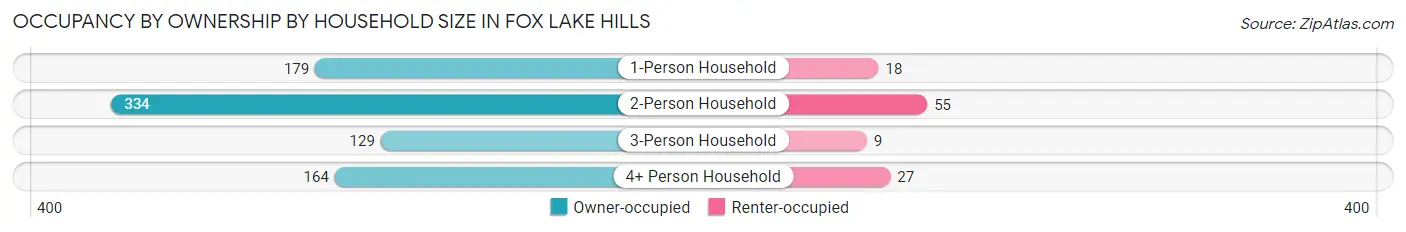
| Household Size | Owner-occupied | Renter-occupied |
| 1-Person Household | 179 (90.9%) | 18 (9.1%) |
| 2-Person Household | 334 (85.9%) | 55 (14.1%) |
| 3-Person Household | 129 (93.5%) | 9 (6.5%) |
| 4+ Person Household | 164 (85.9%) | 27 (14.1%) |
| Total Housing Units | 806 (88.1%) | 109 (11.9%) |
Occupancy by Educational Attainment in Fox Lake Hills
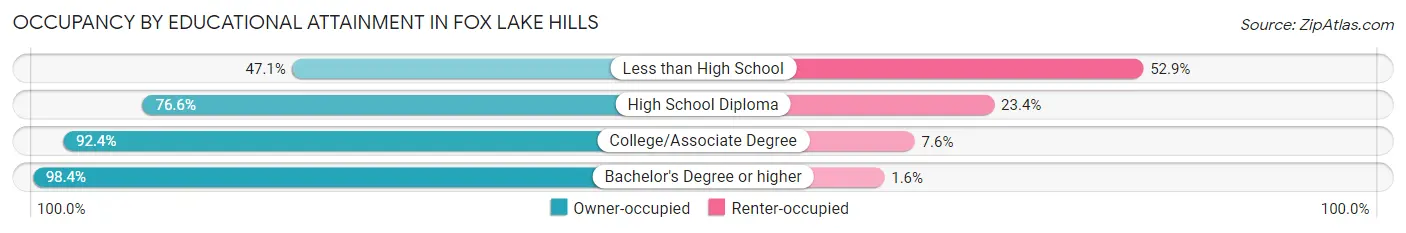
| Household Size | Owner-occupied | Renter-occupied |
| Less than High School | 8 (47.1%) | 9 (52.9%) |
| High School Diploma | 226 (76.6%) | 69 (23.4%) |
| College/Associate Degree | 327 (92.4%) | 27 (7.6%) |
| Bachelor's Degree or higher | 245 (98.4%) | 4 (1.6%) |
Occupancy by Age of Householder in Fox Lake Hills
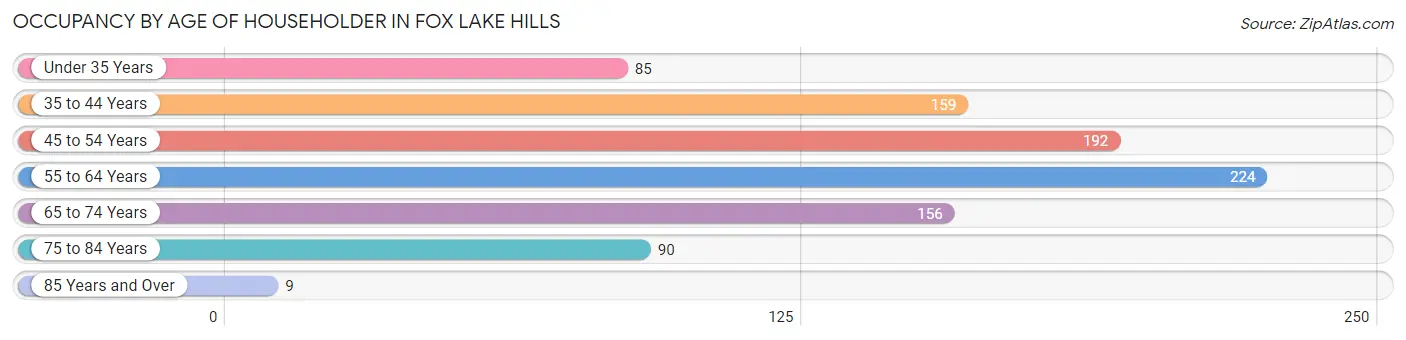
| Age Bracket | # Households | % Households |
| Under 35 Years | 85 | 9.3% |
| 35 to 44 Years | 159 | 17.4% |
| 45 to 54 Years | 192 | 21.0% |
| 55 to 64 Years | 224 | 24.5% |
| 65 to 74 Years | 156 | 17.1% |
| 75 to 84 Years | 90 | 9.8% |
| 85 Years and Over | 9 | 1.0% |
| Total | 915 | 100.0% |
Housing Finances in Fox Lake Hills
Median Income by Occupancy in Fox Lake Hills
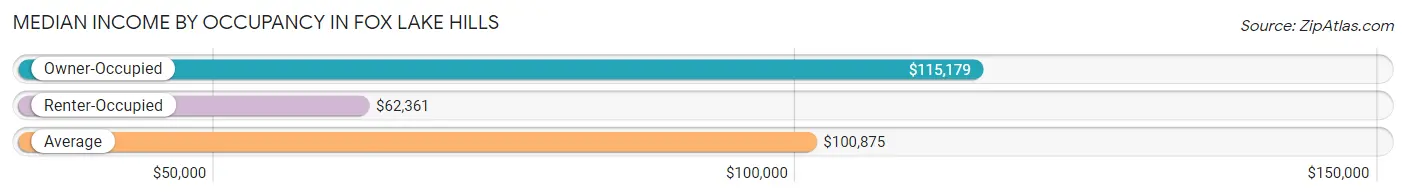
| Occupancy Type | # Households | Median Income |
| Owner-Occupied | 806 (88.1%) | $115,179 |
| Renter-Occupied | 109 (11.9%) | $62,361 |
| Average | 915 (100.0%) | $100,875 |
Occupancy by Householder Income Bracket in Fox Lake Hills
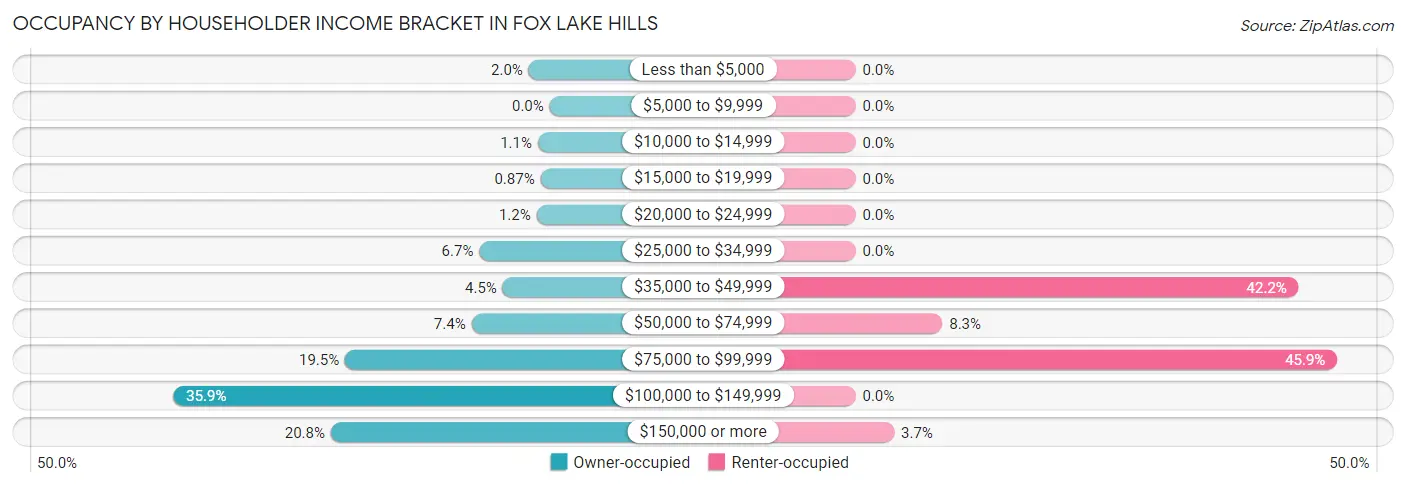
| Income Bracket | Owner-occupied | Renter-occupied |
| Less than $5,000 | 16 (2.0%) | 0 (0.0%) |
| $5,000 to $9,999 | 0 (0.0%) | 0 (0.0%) |
| $10,000 to $14,999 | 9 (1.1%) | 0 (0.0%) |
| $15,000 to $19,999 | 7 (0.9%) | 0 (0.0%) |
| $20,000 to $24,999 | 10 (1.2%) | 0 (0.0%) |
| $25,000 to $34,999 | 54 (6.7%) | 0 (0.0%) |
| $35,000 to $49,999 | 36 (4.5%) | 46 (42.2%) |
| $50,000 to $74,999 | 60 (7.4%) | 9 (8.3%) |
| $75,000 to $99,999 | 157 (19.5%) | 50 (45.9%) |
| $100,000 to $149,999 | 289 (35.9%) | 0 (0.0%) |
| $150,000 or more | 168 (20.8%) | 4 (3.7%) |
| Total | 806 (100.0%) | 109 (100.0%) |
Monthly Housing Cost Tiers in Fox Lake Hills
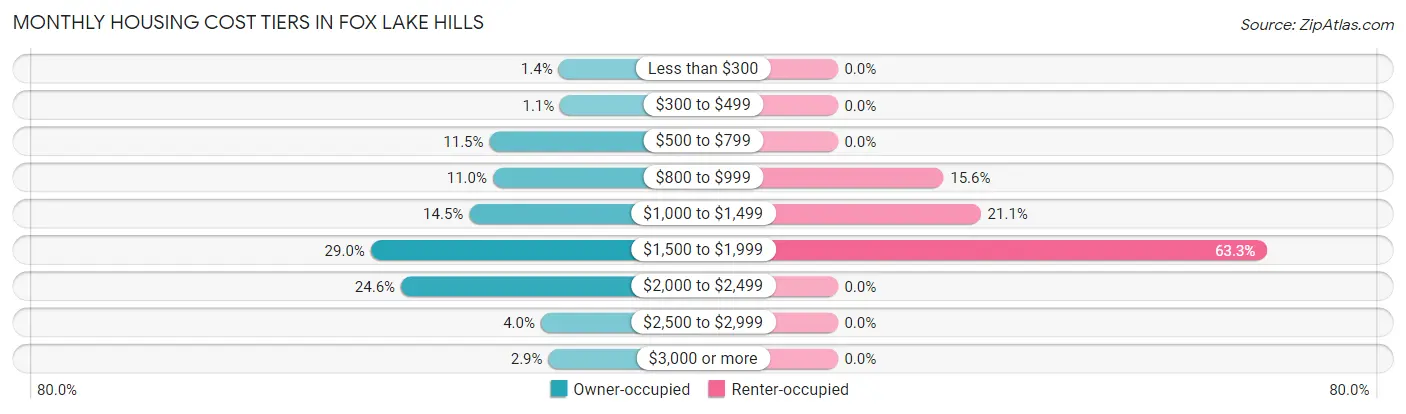
| Monthly Cost | Owner-occupied | Renter-occupied |
| Less than $300 | 11 (1.4%) | 0 (0.0%) |
| $300 to $499 | 9 (1.1%) | 0 (0.0%) |
| $500 to $799 | 93 (11.5%) | 0 (0.0%) |
| $800 to $999 | 89 (11.0%) | 17 (15.6%) |
| $1,000 to $1,499 | 117 (14.5%) | 23 (21.1%) |
| $1,500 to $1,999 | 234 (29.0%) | 69 (63.3%) |
| $2,000 to $2,499 | 198 (24.6%) | 0 (0.0%) |
| $2,500 to $2,999 | 32 (4.0%) | 0 (0.0%) |
| $3,000 or more | 23 (2.9%) | 0 (0.0%) |
| Total | 806 (100.0%) | 109 (100.0%) |
Physical Housing Characteristics in Fox Lake Hills
Housing Structures in Fox Lake Hills
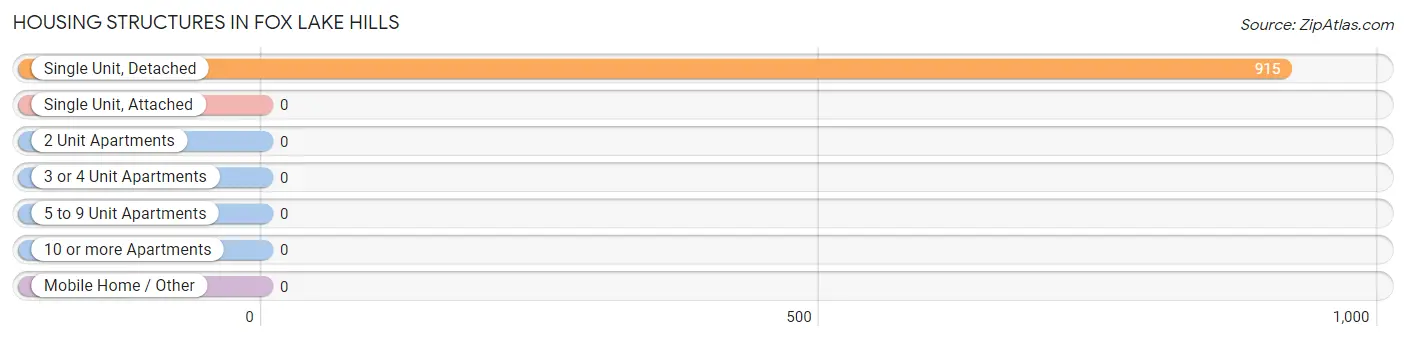
| Structure Type | # Housing Units | % Housing Units |
| Single Unit, Detached | 915 | 100.0% |
| Single Unit, Attached | 0 | 0.0% |
| 2 Unit Apartments | 0 | 0.0% |
| 3 or 4 Unit Apartments | 0 | 0.0% |
| 5 to 9 Unit Apartments | 0 | 0.0% |
| 10 or more Apartments | 0 | 0.0% |
| Mobile Home / Other | 0 | 0.0% |
| Total | 915 | 100.0% |
Housing Structures by Occupancy in Fox Lake Hills
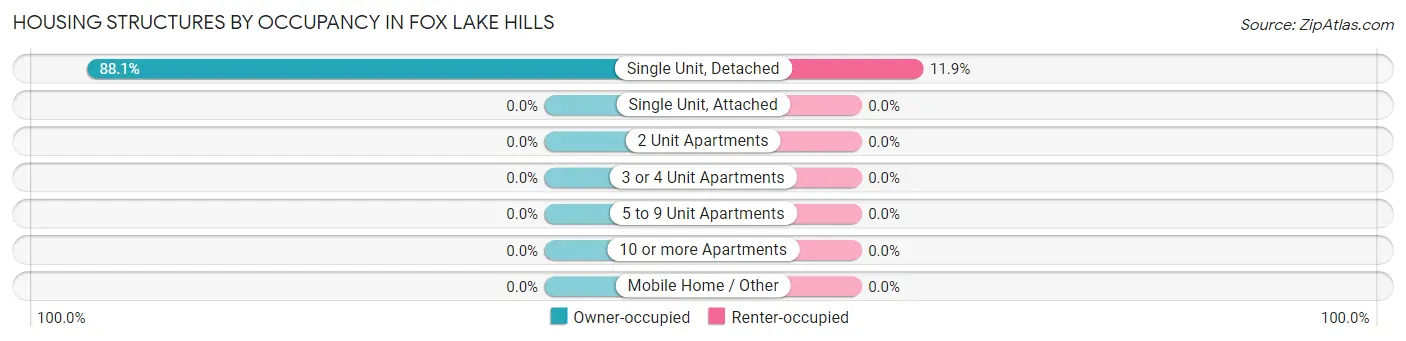
| Structure Type | Owner-occupied | Renter-occupied |
| Single Unit, Detached | 806 (88.1%) | 109 (11.9%) |
| Single Unit, Attached | 0 (0.0%) | 0 (0.0%) |
| 2 Unit Apartments | 0 (0.0%) | 0 (0.0%) |
| 3 or 4 Unit Apartments | 0 (0.0%) | 0 (0.0%) |
| 5 to 9 Unit Apartments | 0 (0.0%) | 0 (0.0%) |
| 10 or more Apartments | 0 (0.0%) | 0 (0.0%) |
| Mobile Home / Other | 0 (0.0%) | 0 (0.0%) |
| Total | 806 (88.1%) | 109 (11.9%) |
Housing Structures by Number of Rooms in Fox Lake Hills
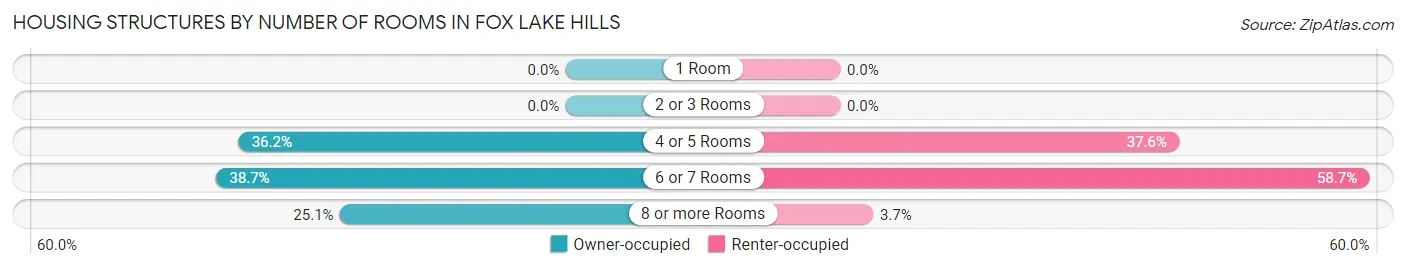
| Number of Rooms | Owner-occupied | Renter-occupied |
| 1 Room | 0 (0.0%) | 0 (0.0%) |
| 2 or 3 Rooms | 0 (0.0%) | 0 (0.0%) |
| 4 or 5 Rooms | 292 (36.2%) | 41 (37.6%) |
| 6 or 7 Rooms | 312 (38.7%) | 64 (58.7%) |
| 8 or more Rooms | 202 (25.1%) | 4 (3.7%) |
| Total | 806 (100.0%) | 109 (100.0%) |
Housing Structure by Heating Type in Fox Lake Hills
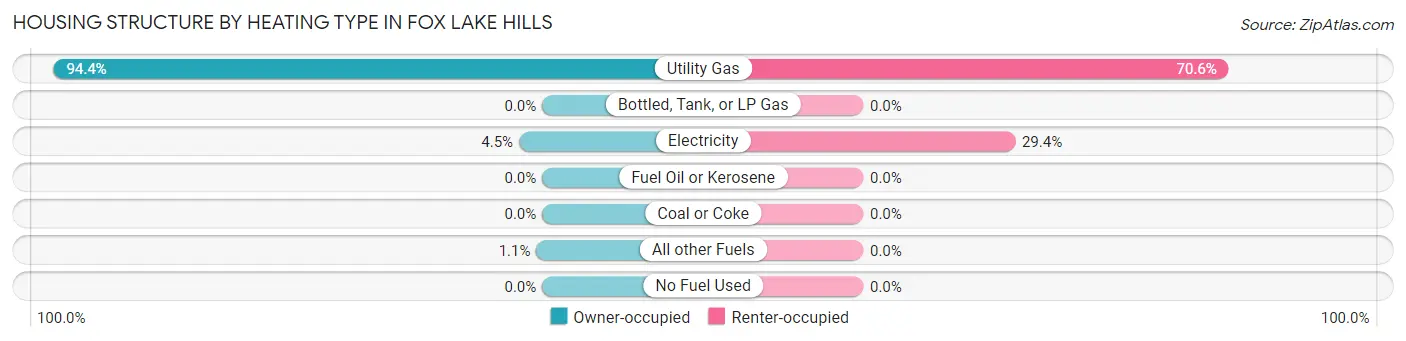
| Heating Type | Owner-occupied | Renter-occupied |
| Utility Gas | 761 (94.4%) | 77 (70.6%) |
| Bottled, Tank, or LP Gas | 0 (0.0%) | 0 (0.0%) |
| Electricity | 36 (4.5%) | 32 (29.4%) |
| Fuel Oil or Kerosene | 0 (0.0%) | 0 (0.0%) |
| Coal or Coke | 0 (0.0%) | 0 (0.0%) |
| All other Fuels | 9 (1.1%) | 0 (0.0%) |
| No Fuel Used | 0 (0.0%) | 0 (0.0%) |
| Total | 806 (100.0%) | 109 (100.0%) |
Household Vehicle Usage in Fox Lake Hills
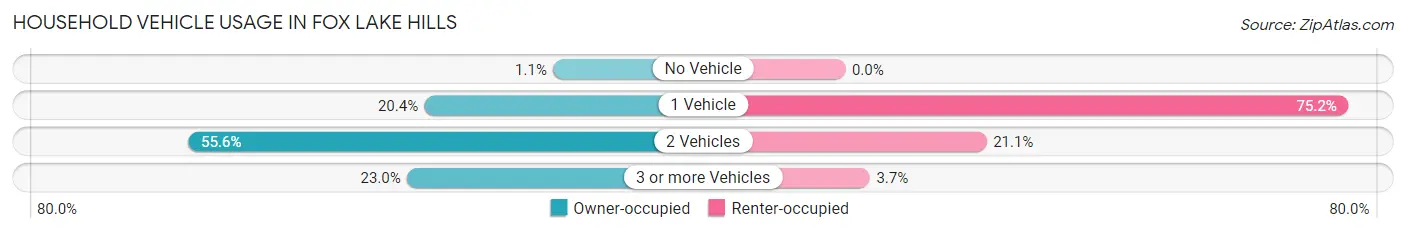
| Vehicles per Household | Owner-occupied | Renter-occupied |
| No Vehicle | 9 (1.1%) | 0 (0.0%) |
| 1 Vehicle | 164 (20.3%) | 82 (75.2%) |
| 2 Vehicles | 448 (55.6%) | 23 (21.1%) |
| 3 or more Vehicles | 185 (23.0%) | 4 (3.7%) |
| Total | 806 (100.0%) | 109 (100.0%) |
Real Estate & Mortgages in Fox Lake Hills
Real Estate and Mortgage Overview in Fox Lake Hills
| Characteristic | Without Mortgage | With Mortgage |
| Housing Units | 224 | 582 |
| Median Property Value | $244,900 | $205,900 |
| Median Household Income | $56,111 | $157 |
| Monthly Housing Costs | $896 | $23 |
| Real Estate Taxes | $5,943 | $0 |
Property Value by Mortgage Status in Fox Lake Hills
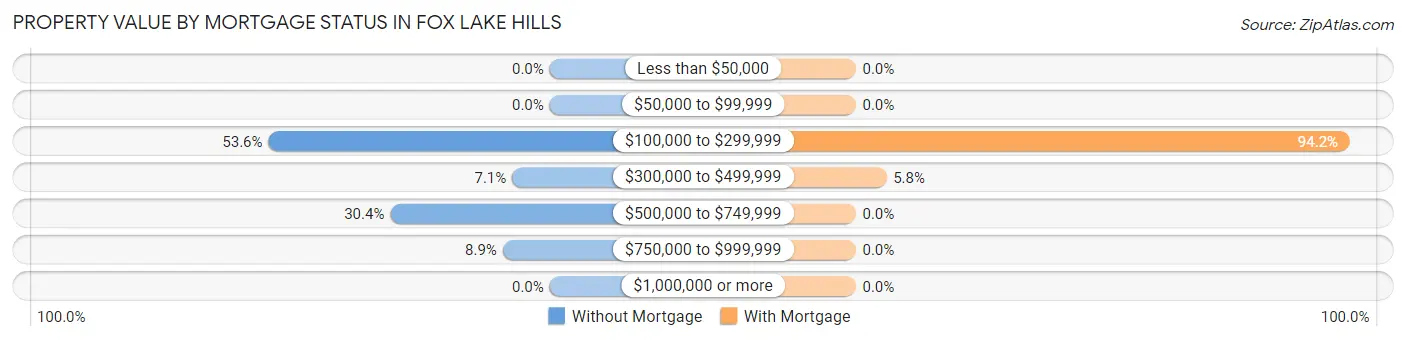
| Property Value | Without Mortgage | With Mortgage |
| Less than $50,000 | 0 (0.0%) | 0 (0.0%) |
| $50,000 to $99,999 | 0 (0.0%) | 0 (0.0%) |
| $100,000 to $299,999 | 120 (53.6%) | 548 (94.2%) |
| $300,000 to $499,999 | 16 (7.1%) | 34 (5.8%) |
| $500,000 to $749,999 | 68 (30.4%) | 0 (0.0%) |
| $750,000 to $999,999 | 20 (8.9%) | 0 (0.0%) |
| $1,000,000 or more | 0 (0.0%) | 0 (0.0%) |
| Total | 224 (100.0%) | 582 (100.0%) |
Household Income by Mortgage Status in Fox Lake Hills
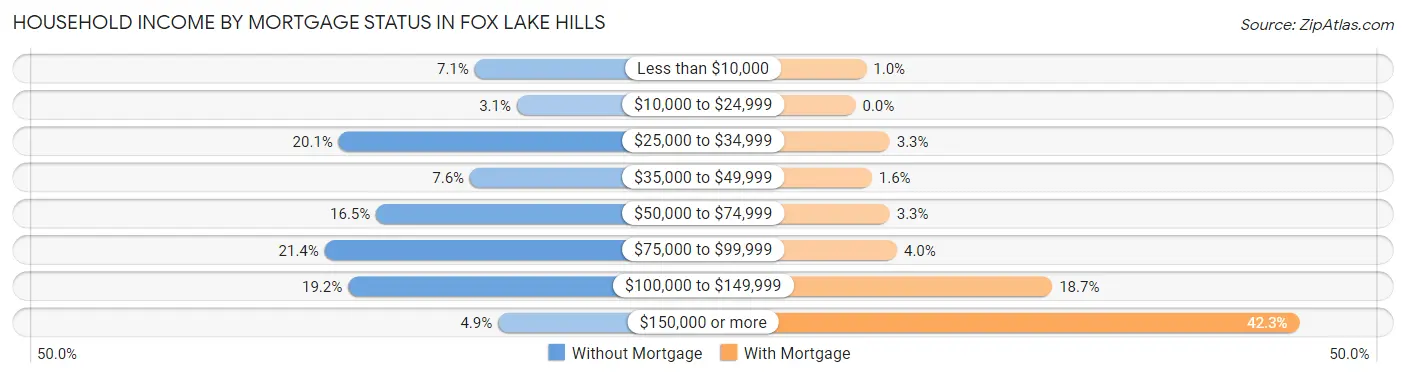
| Household Income | Without Mortgage | With Mortgage |
| Less than $10,000 | 16 (7.1%) | 6 (1.0%) |
| $10,000 to $24,999 | 7 (3.1%) | 0 (0.0%) |
| $25,000 to $34,999 | 45 (20.1%) | 19 (3.3%) |
| $35,000 to $49,999 | 17 (7.6%) | 9 (1.5%) |
| $50,000 to $74,999 | 37 (16.5%) | 19 (3.3%) |
| $75,000 to $99,999 | 48 (21.4%) | 23 (4.0%) |
| $100,000 to $149,999 | 43 (19.2%) | 109 (18.7%) |
| $150,000 or more | 11 (4.9%) | 246 (42.3%) |
| Total | 224 (100.0%) | 582 (100.0%) |
Property Value to Household Income Ratio in Fox Lake Hills
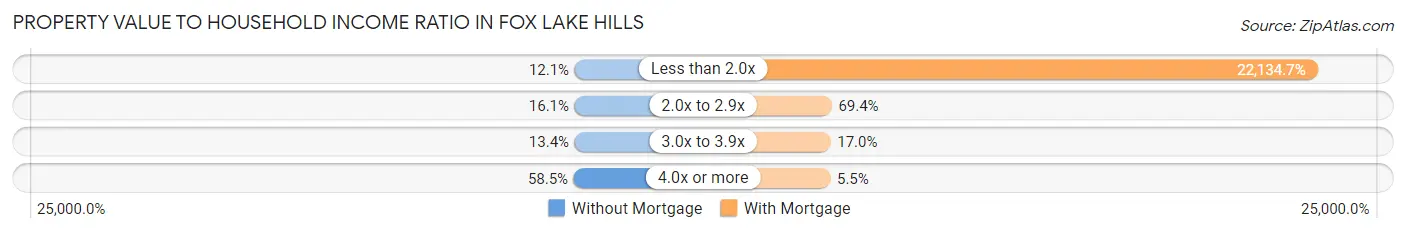
| Value-to-Income Ratio | Without Mortgage | With Mortgage |
| Less than 2.0x | 27 (12.0%) | 128,824 (22,134.7%) |
| 2.0x to 2.9x | 36 (16.1%) | 404 (69.4%) |
| 3.0x to 3.9x | 30 (13.4%) | 99 (17.0%) |
| 4.0x or more | 131 (58.5%) | 32 (5.5%) |
| Total | 224 (100.0%) | 582 (100.0%) |
Real Estate Taxes by Mortgage Status in Fox Lake Hills
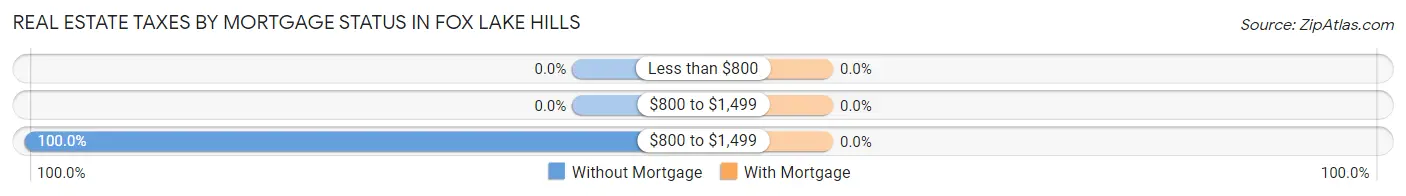
| Property Taxes | Without Mortgage | With Mortgage |
| Less than $800 | 0 (0.0%) | 0 (0.0%) |
| $800 to $1,499 | 0 (0.0%) | 0 (0.0%) |
| $800 to $1,499 | 224 (100.0%) | 0 (0.0%) |
| Total | 224 (100.0%) | 582 (100.0%) |
Health & Disability in Fox Lake Hills
Health Insurance Coverage by Age in Fox Lake Hills
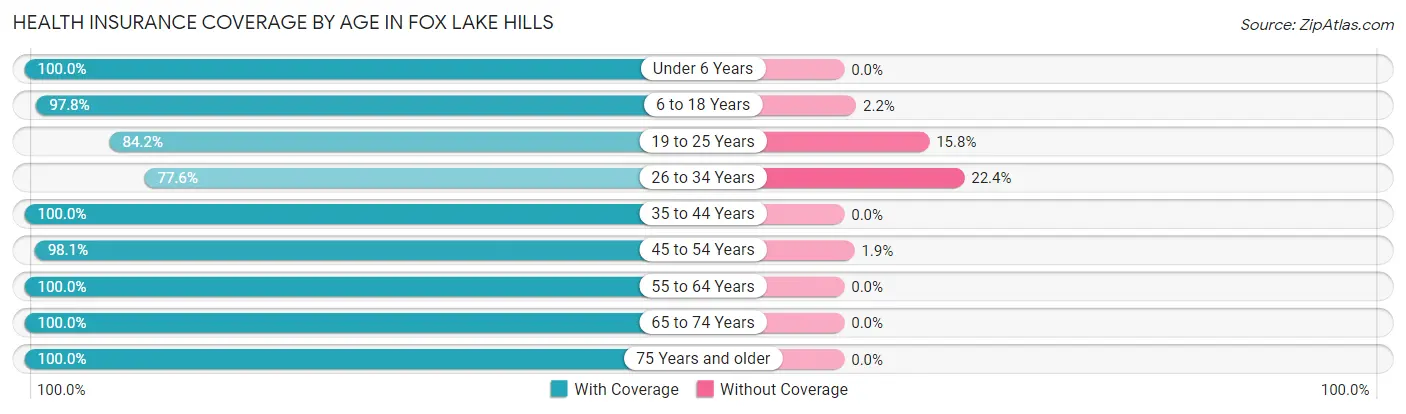
| Age Bracket | With Coverage | Without Coverage |
| Under 6 Years | 161 (100.0%) | 0 (0.0%) |
| 6 to 18 Years | 401 (97.8%) | 9 (2.2%) |
| 19 to 25 Years | 170 (84.2%) | 32 (15.8%) |
| 26 to 34 Years | 111 (77.6%) | 32 (22.4%) |
| 35 to 44 Years | 344 (100.0%) | 0 (0.0%) |
| 45 to 54 Years | 413 (98.1%) | 8 (1.9%) |
| 55 to 64 Years | 307 (100.0%) | 0 (0.0%) |
| 65 to 74 Years | 270 (100.0%) | 0 (0.0%) |
| 75 Years and older | 140 (100.0%) | 0 (0.0%) |
| Total | 2,317 (96.6%) | 81 (3.4%) |
Health Insurance Coverage by Citizenship Status in Fox Lake Hills
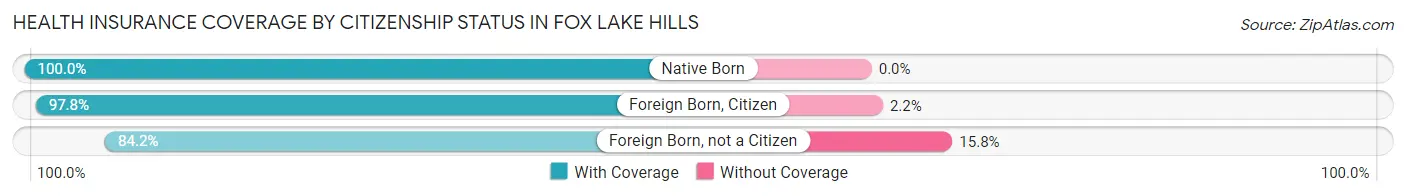
| Citizenship Status | With Coverage | Without Coverage |
| Native Born | 161 (100.0%) | 0 (0.0%) |
| Foreign Born, Citizen | 401 (97.8%) | 9 (2.2%) |
| Foreign Born, not a Citizen | 170 (84.2%) | 32 (15.8%) |
Health Insurance Coverage by Household Income in Fox Lake Hills
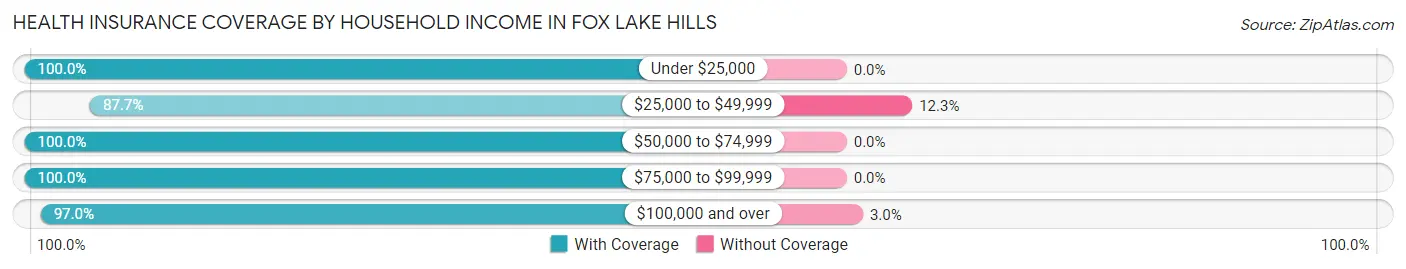
| Household Income | With Coverage | Without Coverage |
| Under $25,000 | 116 (100.0%) | 0 (0.0%) |
| $25,000 to $49,999 | 272 (87.7%) | 38 (12.3%) |
| $50,000 to $74,999 | 106 (100.0%) | 0 (0.0%) |
| $75,000 to $99,999 | 445 (100.0%) | 0 (0.0%) |
| $100,000 and over | 1,378 (97.0%) | 43 (3.0%) |
Public vs Private Health Insurance Coverage by Age in Fox Lake Hills
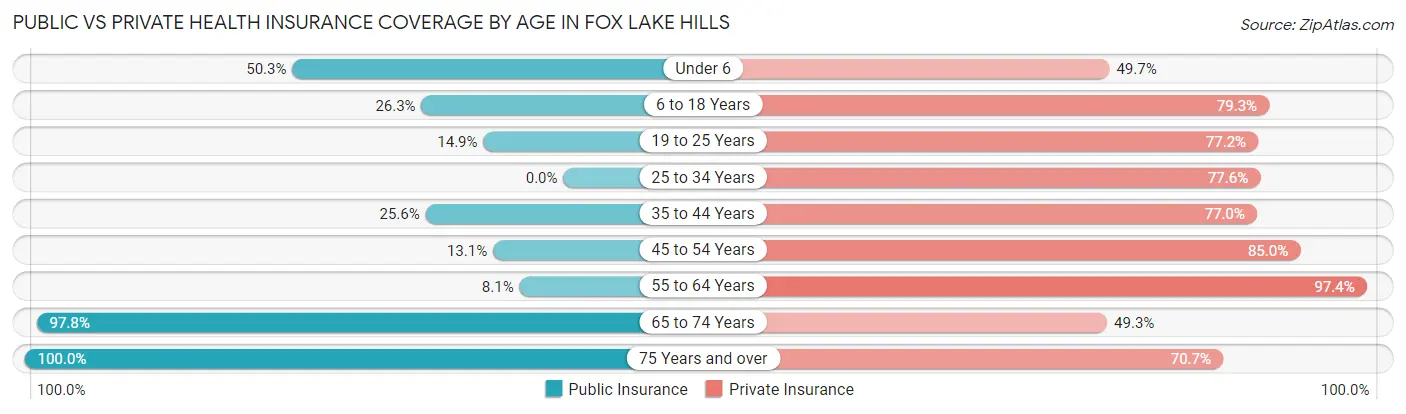
| Age Bracket | Public Insurance | Private Insurance |
| Under 6 | 81 (50.3%) | 80 (49.7%) |
| 6 to 18 Years | 108 (26.3%) | 325 (79.3%) |
| 19 to 25 Years | 30 (14.8%) | 156 (77.2%) |
| 25 to 34 Years | 0 (0.0%) | 111 (77.6%) |
| 35 to 44 Years | 88 (25.6%) | 265 (77.0%) |
| 45 to 54 Years | 55 (13.1%) | 358 (85.0%) |
| 55 to 64 Years | 25 (8.1%) | 299 (97.4%) |
| 65 to 74 Years | 264 (97.8%) | 133 (49.3%) |
| 75 Years and over | 140 (100.0%) | 99 (70.7%) |
| Total | 791 (33.0%) | 1,826 (76.1%) |
Disability Status by Sex by Age in Fox Lake Hills
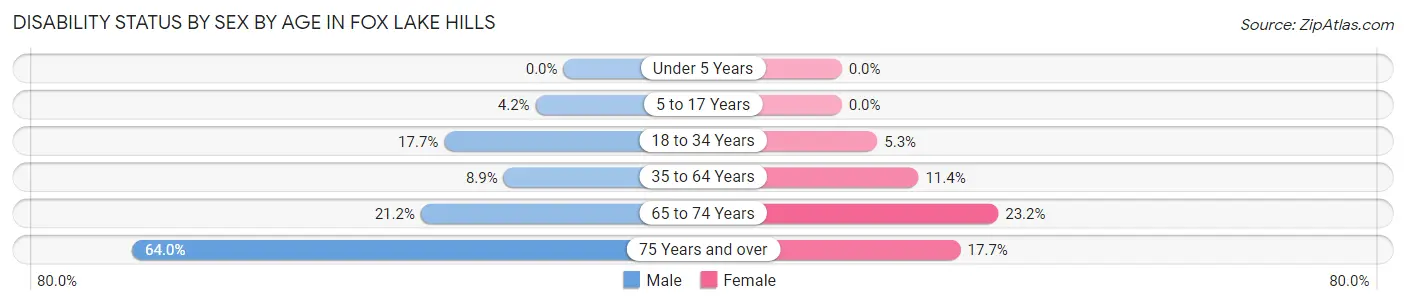
| Age Bracket | Male | Female |
| Under 5 Years | 0 (0.0%) | 0 (0.0%) |
| 5 to 17 Years | 8 (4.2%) | 0 (0.0%) |
| 18 to 34 Years | 20 (17.7%) | 14 (5.3%) |
| 35 to 64 Years | 50 (8.9%) | 58 (11.4%) |
| 65 to 74 Years | 18 (21.2%) | 43 (23.2%) |
| 75 Years and over | 57 (64.0%) | 9 (17.6%) |
Disability Class by Sex by Age in Fox Lake Hills
Disability Class: Hearing Difficulty
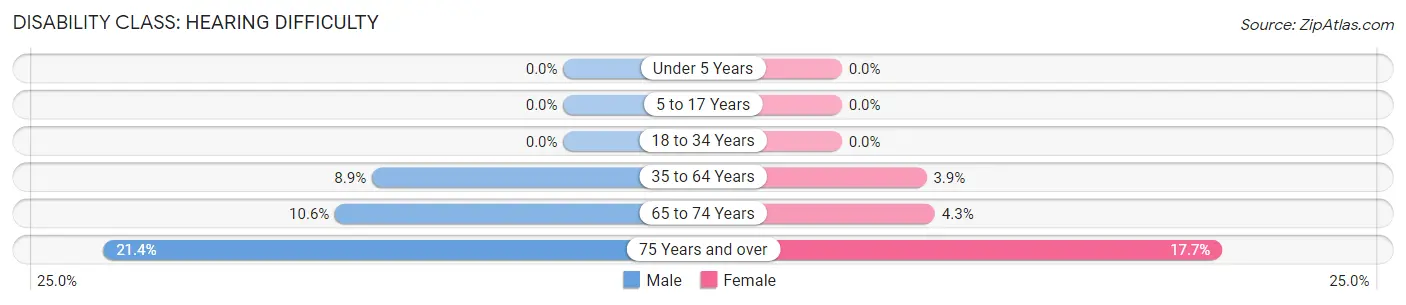
| Age Bracket | Male | Female |
| Under 5 Years | 0 (0.0%) | 0 (0.0%) |
| 5 to 17 Years | 0 (0.0%) | 0 (0.0%) |
| 18 to 34 Years | 0 (0.0%) | 0 (0.0%) |
| 35 to 64 Years | 50 (8.9%) | 20 (3.9%) |
| 65 to 74 Years | 9 (10.6%) | 8 (4.3%) |
| 75 Years and over | 19 (21.3%) | 9 (17.6%) |
Disability Class: Vision Difficulty
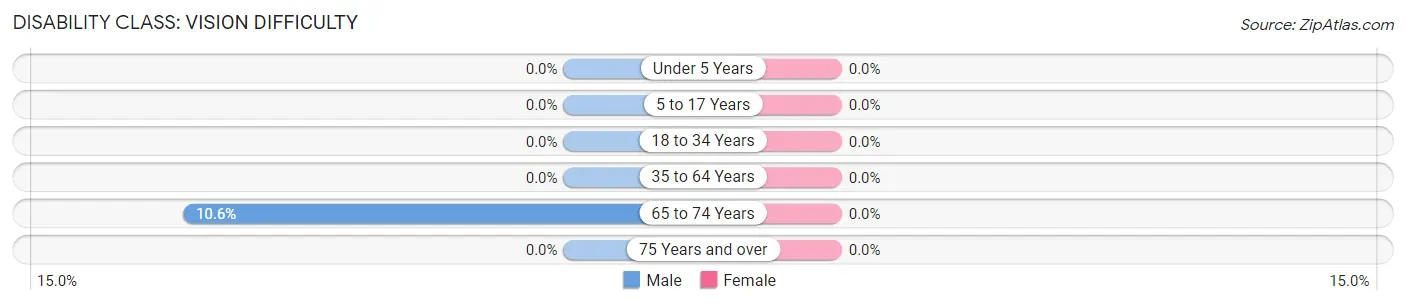
| Age Bracket | Male | Female |
| Under 5 Years | 0 (0.0%) | 0 (0.0%) |
| 5 to 17 Years | 0 (0.0%) | 0 (0.0%) |
| 18 to 34 Years | 0 (0.0%) | 0 (0.0%) |
| 35 to 64 Years | 0 (0.0%) | 0 (0.0%) |
| 65 to 74 Years | 9 (10.6%) | 0 (0.0%) |
| 75 Years and over | 0 (0.0%) | 0 (0.0%) |
Disability Class: Cognitive Difficulty
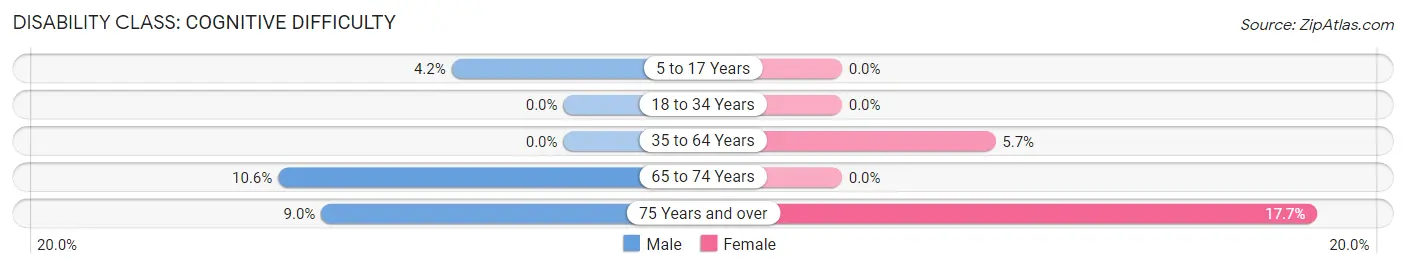
| Age Bracket | Male | Female |
| 5 to 17 Years | 8 (4.2%) | 0 (0.0%) |
| 18 to 34 Years | 0 (0.0%) | 0 (0.0%) |
| 35 to 64 Years | 0 (0.0%) | 29 (5.7%) |
| 65 to 74 Years | 9 (10.6%) | 0 (0.0%) |
| 75 Years and over | 8 (9.0%) | 9 (17.6%) |
Disability Class: Ambulatory Difficulty
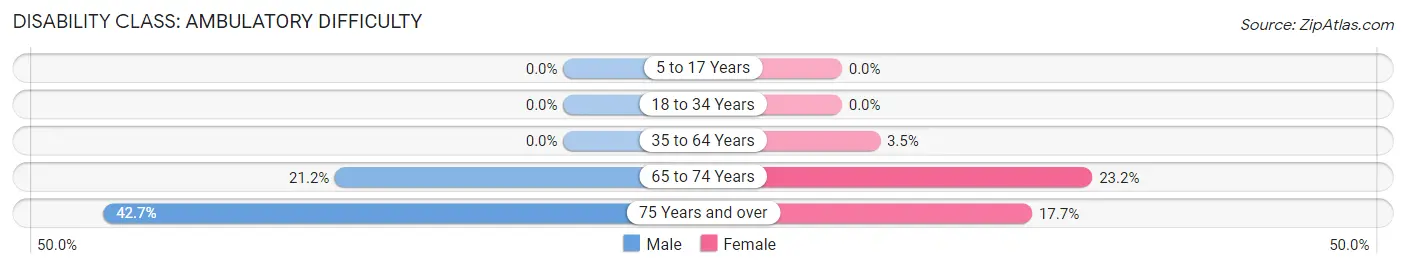
| Age Bracket | Male | Female |
| 5 to 17 Years | 0 (0.0%) | 0 (0.0%) |
| 18 to 34 Years | 0 (0.0%) | 0 (0.0%) |
| 35 to 64 Years | 0 (0.0%) | 18 (3.5%) |
| 65 to 74 Years | 18 (21.2%) | 43 (23.2%) |
| 75 Years and over | 38 (42.7%) | 9 (17.6%) |
Disability Class: Self-Care Difficulty
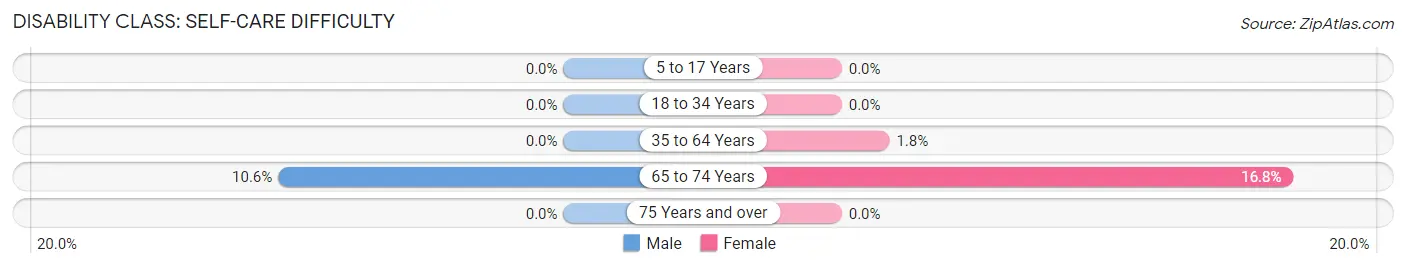
| Age Bracket | Male | Female |
| 5 to 17 Years | 0 (0.0%) | 0 (0.0%) |
| 18 to 34 Years | 0 (0.0%) | 0 (0.0%) |
| 35 to 64 Years | 0 (0.0%) | 9 (1.8%) |
| 65 to 74 Years | 9 (10.6%) | 31 (16.8%) |
| 75 Years and over | 0 (0.0%) | 0 (0.0%) |
Technology Access in Fox Lake Hills
Computing Device Access in Fox Lake Hills
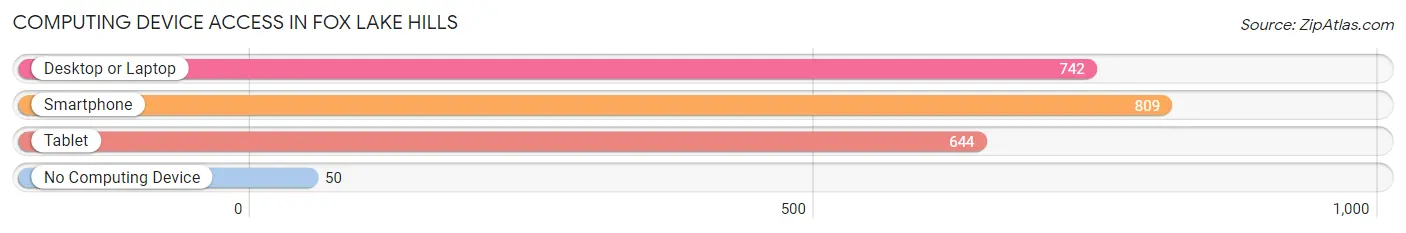
| Device Type | # Households | % Households |
| Desktop or Laptop | 742 | 81.1% |
| Smartphone | 809 | 88.4% |
| Tablet | 644 | 70.4% |
| No Computing Device | 50 | 5.5% |
| Total | 915 | 100.0% |
Internet Access in Fox Lake Hills
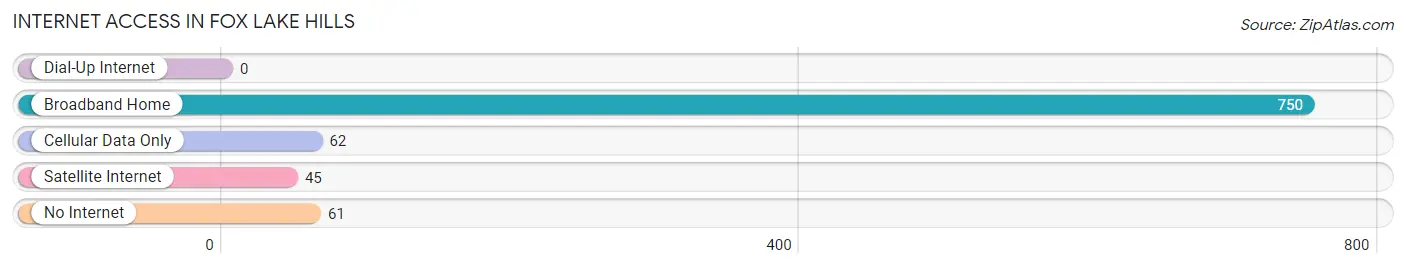
| Internet Type | # Households | % Households |
| Dial-Up Internet | 0 | 0.0% |
| Broadband Home | 750 | 82.0% |
| Cellular Data Only | 62 | 6.8% |
| Satellite Internet | 45 | 4.9% |
| No Internet | 61 | 6.7% |
| Total | 915 | 100.0% |
Fox Lake Hills Summary
Fox Lake Hills, IL is a small village located in Lake County, Illinois. It is situated on the western shore of Fox Lake, a natural lake that is part of the Chain O' Lakes system. The village is located approximately 45 miles northwest of Chicago and is part of the Chicago metropolitan area. As of the 2010 census, the population of Fox Lake Hills was 2,717.
History
The area that is now Fox Lake Hills was first settled in the early 1800s by settlers from New England. The first settlers were primarily farmers and fishermen who were attracted to the area by the abundance of natural resources. The village was officially incorporated in 1887 and was named after the nearby Fox Lake.
Geography
Fox Lake Hills is located at 42°20'25"N 88°10'45"W (42.340278, -88.179167). According to the United States Census Bureau, the village has a total area of 2.2 square miles, all of which is land. The village is located on the western shore of Fox Lake, which is part of the Chain O' Lakes system. The lake is a popular destination for fishing, boating, and other recreational activities.
Economy
The economy of Fox Lake Hills is largely based on tourism and recreation. The village is home to several marinas, boat rental companies, and other businesses that cater to visitors to the area. The village is also home to several small businesses, including restaurants, retail stores, and professional services.
Demographics
As of the 2010 census, there were 2,717 people, 1,093 households, and 745 families residing in the village. The population density was 1,223.2 people per square mile. The racial makeup of the village was 94.2% White, 0.7% African American, 0.2% Native American, 0.7% Asian, 0.1% Pacific Islander, 2.2% from other races, and 1.9% from two or more races. Hispanic or Latino of any race were 5.2% of the population.
The median income for a household in the village was $50,938, and the median income for a family was $60,938. Males had a median income of $45,000 versus $30,000 for females. The per capita income for the village was $25,938. About 4.2% of families and 5.7% of the population were below the poverty line, including 8.2% of those under age 18 and 4.2% of those age 65 or over.
Common Questions
What is Per Capita Income in Fox Lake Hills?
Per Capita income in Fox Lake Hills is $44,811.
What is the Median Family Income in Fox Lake Hills?
Median Family Income in Fox Lake Hills is $117,455.
What is the Median Household income in Fox Lake Hills?
Median Household Income in Fox Lake Hills is $100,875.
What is Income or Wage Gap in Fox Lake Hills?
Income or Wage Gap in Fox Lake Hills is 59.1%.
Women in Fox Lake Hills earn 40.9 cents for every dollar earned by a man.
What is Inequality or Gini Index in Fox Lake Hills?
Inequality or Gini Index in Fox Lake Hills is 0.34.
What is the Total Population of Fox Lake Hills?
Total Population of Fox Lake Hills is 2,398.
What is the Total Male Population of Fox Lake Hills?
Total Male Population of Fox Lake Hills is 1,160.
What is the Total Female Population of Fox Lake Hills?
Total Female Population of Fox Lake Hills is 1,238.
What is the Ratio of Males per 100 Females in Fox Lake Hills?
There are 93.70 Males per 100 Females in Fox Lake Hills.
What is the Ratio of Females per 100 Males in Fox Lake Hills?
There are 106.72 Females per 100 Males in Fox Lake Hills.
What is the Median Population Age in Fox Lake Hills?
Median Population Age in Fox Lake Hills is 42.6 Years.
What is the Average Family Size in Fox Lake Hills
Average Family Size in Fox Lake Hills is 3.1 People.
What is the Average Household Size in Fox Lake Hills
Average Household Size in Fox Lake Hills is 2.6 People.
How Large is the Labor Force in Fox Lake Hills?
There are 1,286 People in the Labor Forcein in Fox Lake Hills.
What is the Percentage of People in the Labor Force in Fox Lake Hills?
67.7% of People are in the Labor Force in Fox Lake Hills.
What is the Unemployment Rate in Fox Lake Hills?
Unemployment Rate in Fox Lake Hills is 6.8%.