Spaulding, IL Map & Demographics
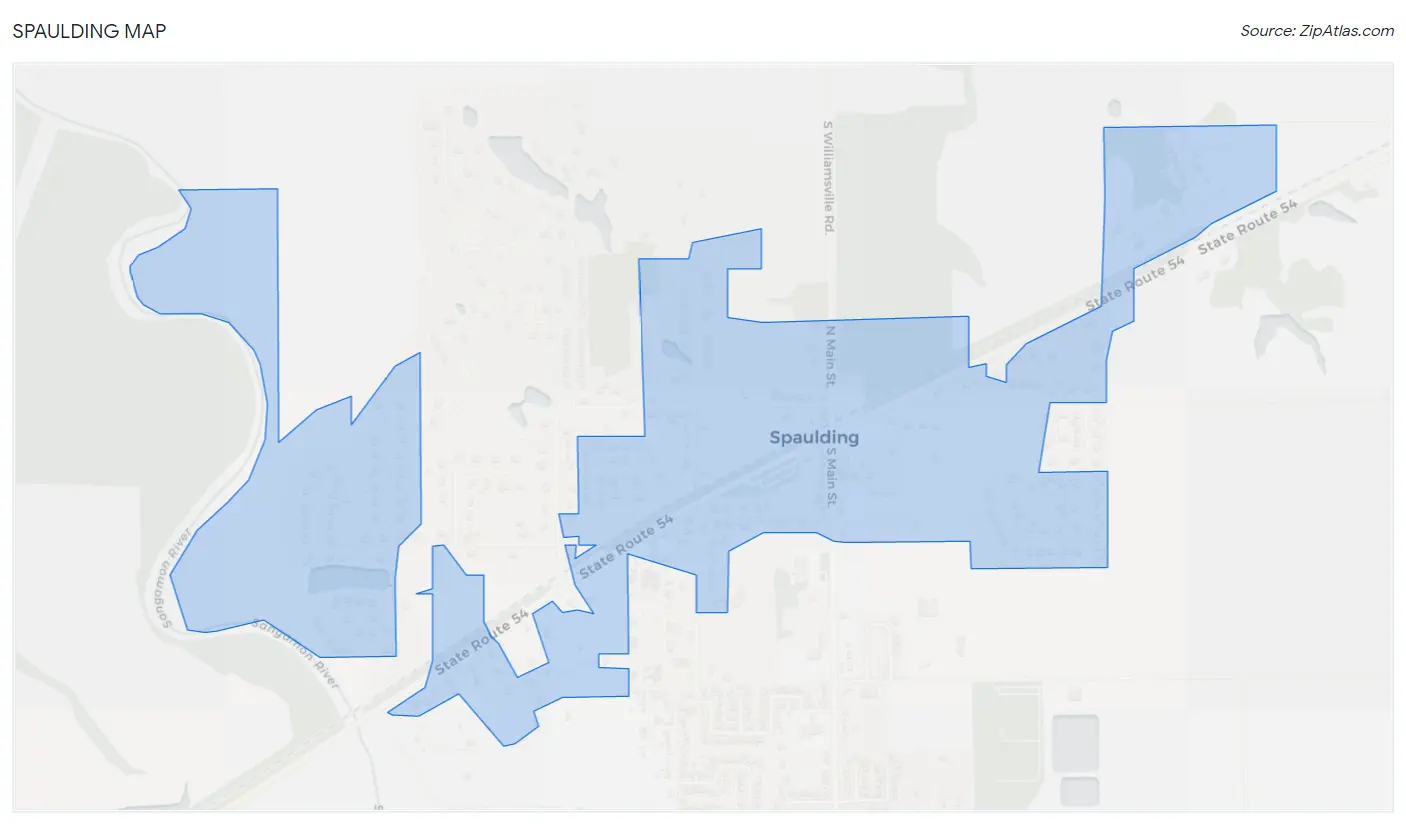
Spaulding Map
Spaulding Overview
$48,353
PER CAPITA INCOME
$119,250
AVG FAMILY INCOME
$110,139
AVG HOUSEHOLD INCOME
18.7%
WAGE / INCOME GAP [ % ]
81.3¢/ $1
WAGE / INCOME GAP [ $ ]
0.36
INEQUALITY / GINI INDEX
965
TOTAL POPULATION
475
MALE POPULATION
490
FEMALE POPULATION
96.94
MALES / 100 FEMALES
103.16
FEMALES / 100 MALES
49.4
MEDIAN AGE
2.8
AVG FAMILY SIZE
2.4
AVG HOUSEHOLD SIZE
556
LABOR FORCE [ PEOPLE ]
64.6%
PERCENT IN LABOR FORCE
4.3%
UNEMPLOYMENT RATE
Spaulding Area Codes
Income in Spaulding
Income Overview in Spaulding
Per Capita Income in Spaulding is $48,353, while median incomes of families and households are $119,250 and $110,139 respectively.
| Characteristic | Number | Measure |
| Per Capita Income | 965 | $48,353 |
| Median Family Income | 295 | $119,250 |
| Mean Family Income | 295 | $129,013 |
| Median Household Income | 397 | $110,139 |
| Mean Household Income | 397 | $115,868 |
| Income Deficit | 295 | $0 |
| Wage / Income Gap (%) | 965 | 18.66% |
| Wage / Income Gap ($) | 965 | 81.34¢ per $1 |
| Gini / Inequality Index | 965 | 0.36 |
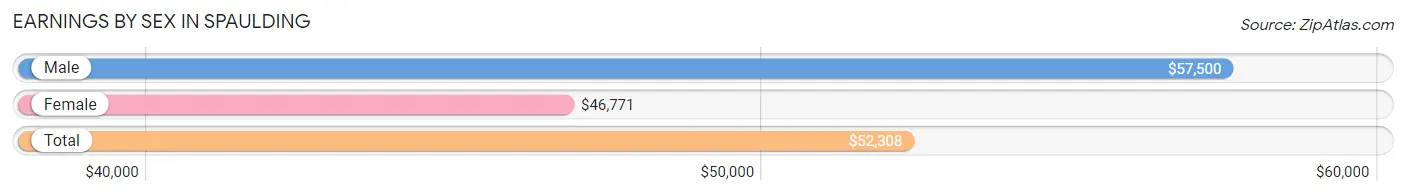
Earnings by Sex in Spaulding
Average Earnings in Spaulding are $52,308, $57,500 for men and $46,771 for women, a difference of 18.7%.
| Sex | Number | Average Earnings |
| Male | 290 (52.9%) | $57,500 |
| Female | 258 (47.1%) | $46,771 |
| Total | 548 (100.0%) | $52,308 |
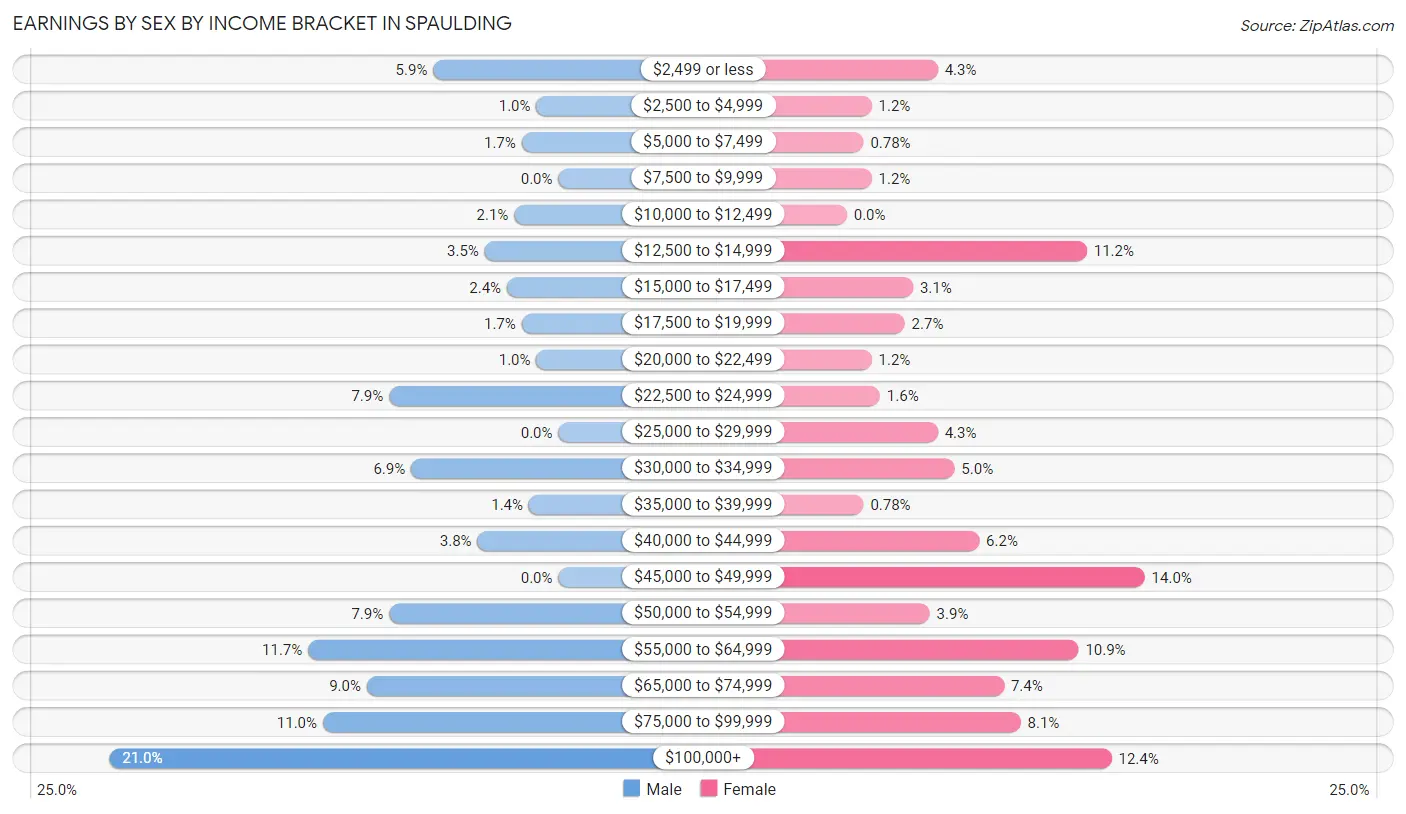
Earnings by Sex by Income Bracket in Spaulding
The most common earnings brackets in Spaulding are $100,000+ for men (61 | 21.0%) and $45,000 to $49,999 for women (36 | 14.0%).
| Income | Male | Female |
| $2,499 or less | 17 (5.9%) | 11 (4.3%) |
| $2,500 to $4,999 | 3 (1.0%) | 3 (1.2%) |
| $5,000 to $7,499 | 5 (1.7%) | 2 (0.8%) |
| $7,500 to $9,999 | 0 (0.0%) | 3 (1.2%) |
| $10,000 to $12,499 | 6 (2.1%) | 0 (0.0%) |
| $12,500 to $14,999 | 10 (3.5%) | 29 (11.2%) |
| $15,000 to $17,499 | 7 (2.4%) | 8 (3.1%) |
| $17,500 to $19,999 | 5 (1.7%) | 7 (2.7%) |
| $20,000 to $22,499 | 3 (1.0%) | 3 (1.2%) |
| $22,500 to $24,999 | 23 (7.9%) | 4 (1.5%) |
| $25,000 to $29,999 | 0 (0.0%) | 11 (4.3%) |
| $30,000 to $34,999 | 20 (6.9%) | 13 (5.0%) |
| $35,000 to $39,999 | 4 (1.4%) | 2 (0.8%) |
| $40,000 to $44,999 | 11 (3.8%) | 16 (6.2%) |
| $45,000 to $49,999 | 0 (0.0%) | 36 (14.0%) |
| $50,000 to $54,999 | 23 (7.9%) | 10 (3.9%) |
| $55,000 to $64,999 | 34 (11.7%) | 28 (10.8%) |
| $65,000 to $74,999 | 26 (9.0%) | 19 (7.4%) |
| $75,000 to $99,999 | 32 (11.0%) | 21 (8.1%) |
| $100,000+ | 61 (21.0%) | 32 (12.4%) |
| Total | 290 (100.0%) | 258 (100.0%) |
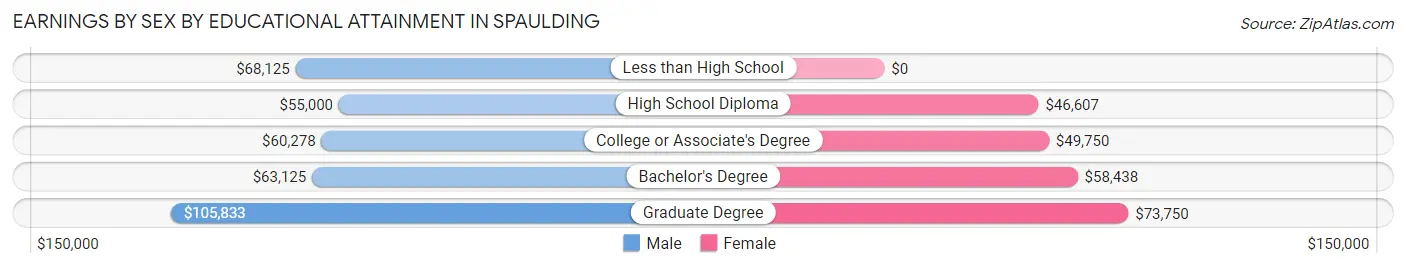
Earnings by Sex by Educational Attainment in Spaulding
Average earnings in Spaulding are $63,500 for men and $49,479 for women, a difference of 22.1%. Men with an educational attainment of graduate degree enjoy the highest average annual earnings of $105,833, while those with high school diploma education earn the least with $55,000. Women with an educational attainment of graduate degree earn the most with the average annual earnings of $73,750, while those with high school diploma education have the smallest earnings of $46,607.
| Educational Attainment | Male Income | Female Income |
| Less than High School | $68,125 | $0 |
| High School Diploma | $55,000 | $46,607 |
| College or Associate's Degree | $60,278 | $49,750 |
| Bachelor's Degree | $63,125 | $58,438 |
| Graduate Degree | $105,833 | $73,750 |
| Total | $63,500 | $49,479 |
Family Income in Spaulding
Family Income Brackets in Spaulding
According to the Spaulding family income data, there are 79 families falling into the $150,000 to $199,999 income range, which is the most common income bracket and makes up 26.8% of all families.
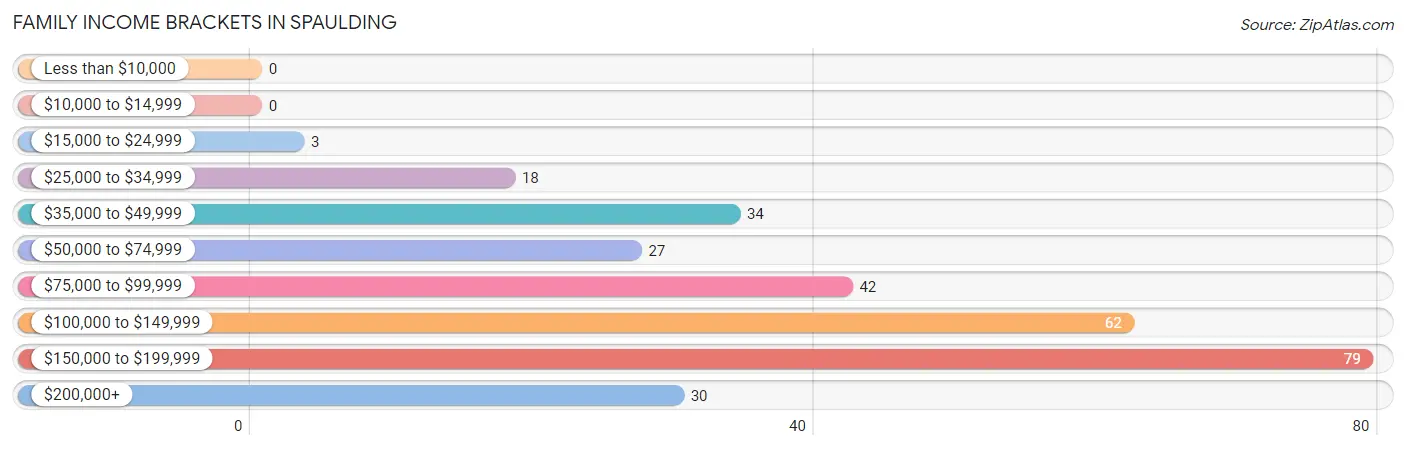
| Income Bracket | # Families | % Families |
| Less than $10,000 | 0 | 0.0% |
| $10,000 to $14,999 | 0 | 0.0% |
| $15,000 to $24,999 | 3 | 1.0% |
| $25,000 to $34,999 | 18 | 6.1% |
| $35,000 to $49,999 | 34 | 11.5% |
| $50,000 to $74,999 | 27 | 9.2% |
| $75,000 to $99,999 | 42 | 14.2% |
| $100,000 to $149,999 | 62 | 21.0% |
| $150,000 to $199,999 | 79 | 26.8% |
| $200,000+ | 30 | 10.2% |
Family Income by Famaliy Size in Spaulding
4-person families (33 | 11.2%) account for the highest median family income in Spaulding with $172,917 per family, while 2-person families (195 | 66.1%) have the highest median income of $61,562 per family member.
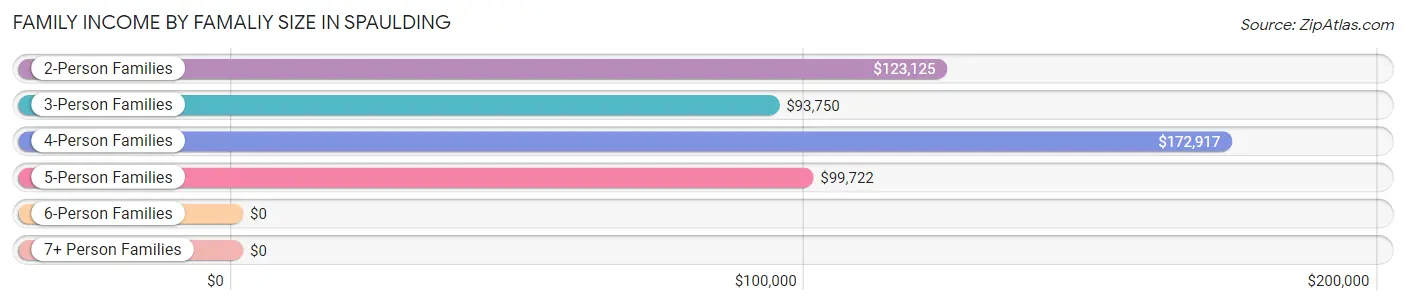
| Income Bracket | # Families | Median Income |
| 2-Person Families | 195 (66.1%) | $123,125 |
| 3-Person Families | 42 (14.2%) | $93,750 |
| 4-Person Families | 33 (11.2%) | $172,917 |
| 5-Person Families | 16 (5.4%) | $99,722 |
| 6-Person Families | 9 (3.0%) | $0 |
| 7+ Person Families | 0 (0.0%) | $0 |
| Total | 295 (100.0%) | $119,250 |
Family Income by Number of Earners in Spaulding
The median family income in Spaulding is $119,250, with families comprising 3+ earners (22) having the highest median family income of $175,000, while families with no earners (59) have the lowest median family income of $37,813, accounting for 7.5% and 20.0% of families, respectively.
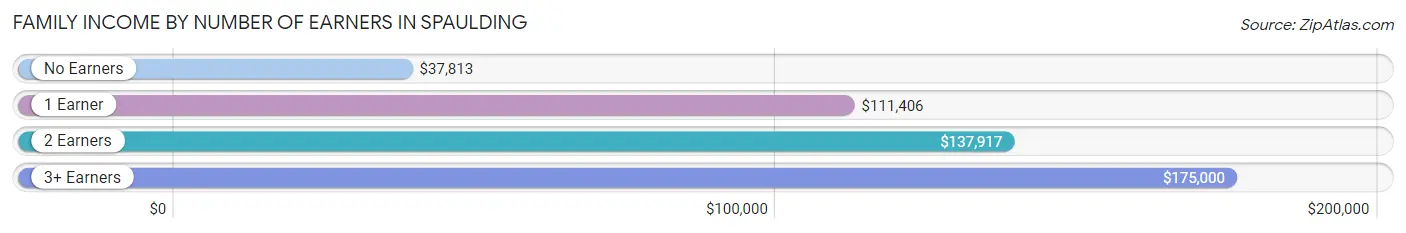
| Number of Earners | # Families | Median Income |
| No Earners | 59 (20.0%) | $37,813 |
| 1 Earner | 79 (26.8%) | $111,406 |
| 2 Earners | 135 (45.8%) | $137,917 |
| 3+ Earners | 22 (7.5%) | $175,000 |
| Total | 295 (100.0%) | $119,250 |
Household Income in Spaulding
Household Income Brackets in Spaulding
With 96 households falling in the category, the $100,000 to $149,999 income range is the most frequent in Spaulding, accounting for 24.2% of all households.
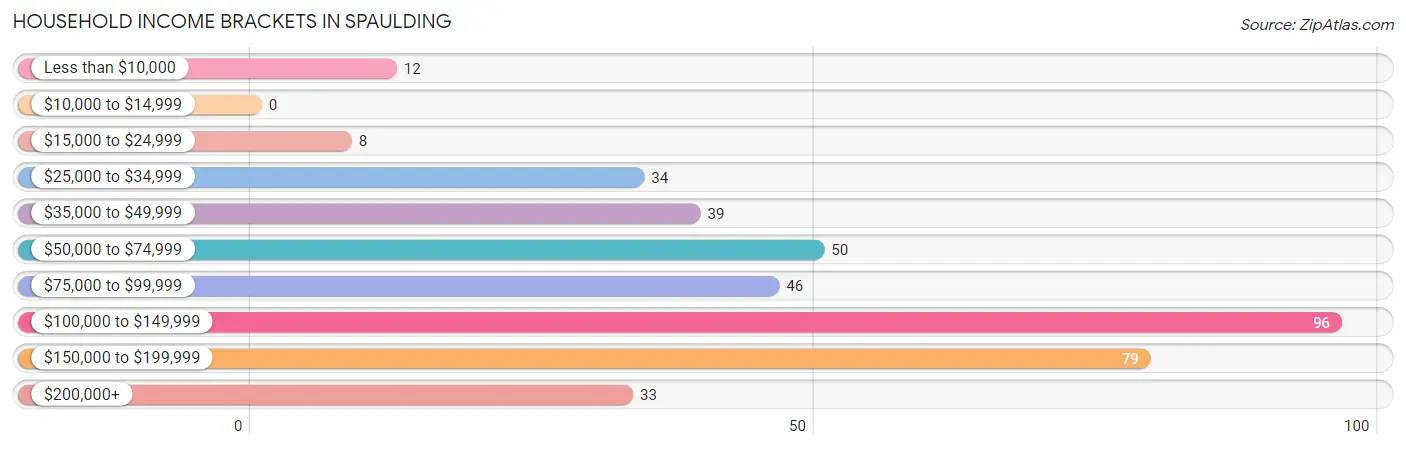
| Income Bracket | # Households | % Households |
| Less than $10,000 | 12 | 3.0% |
| $10,000 to $14,999 | 0 | 0.0% |
| $15,000 to $24,999 | 8 | 2.0% |
| $25,000 to $34,999 | 34 | 8.6% |
| $35,000 to $49,999 | 39 | 9.8% |
| $50,000 to $74,999 | 50 | 12.6% |
| $75,000 to $99,999 | 46 | 11.6% |
| $100,000 to $149,999 | 96 | 24.2% |
| $150,000 to $199,999 | 79 | 19.9% |
| $200,000+ | 33 | 8.3% |
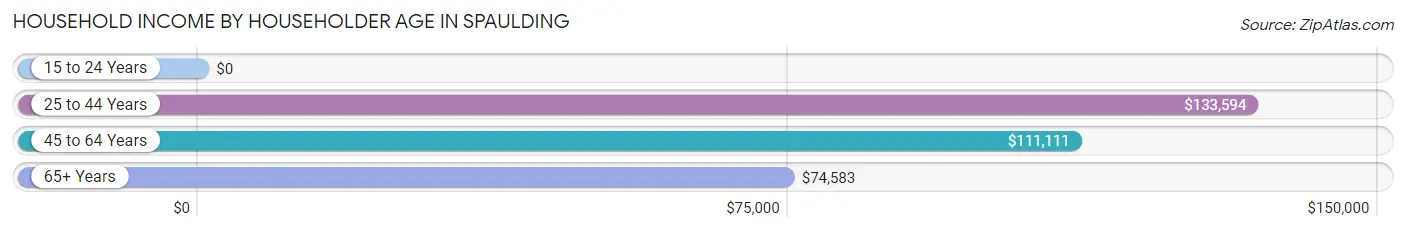
Household Income by Householder Age in Spaulding
The median household income in Spaulding is $110,139, with the highest median household income of $133,594 found in the 25 to 44 years age bracket for the primary householder. A total of 79 households (19.9%) fall into this category. Meanwhile, the 15 to 24 years age bracket for the primary householder has the lowest median household income of $0, with 13 households (3.3%) in this group.
| Income Bracket | # Households | Median Income |
| 15 to 24 Years | 13 (3.3%) | $0 |
| 25 to 44 Years | 79 (19.9%) | $133,594 |
| 45 to 64 Years | 204 (51.4%) | $111,111 |
| 65+ Years | 101 (25.4%) | $74,583 |
| Total | 397 (100.0%) | $110,139 |
Poverty in Spaulding
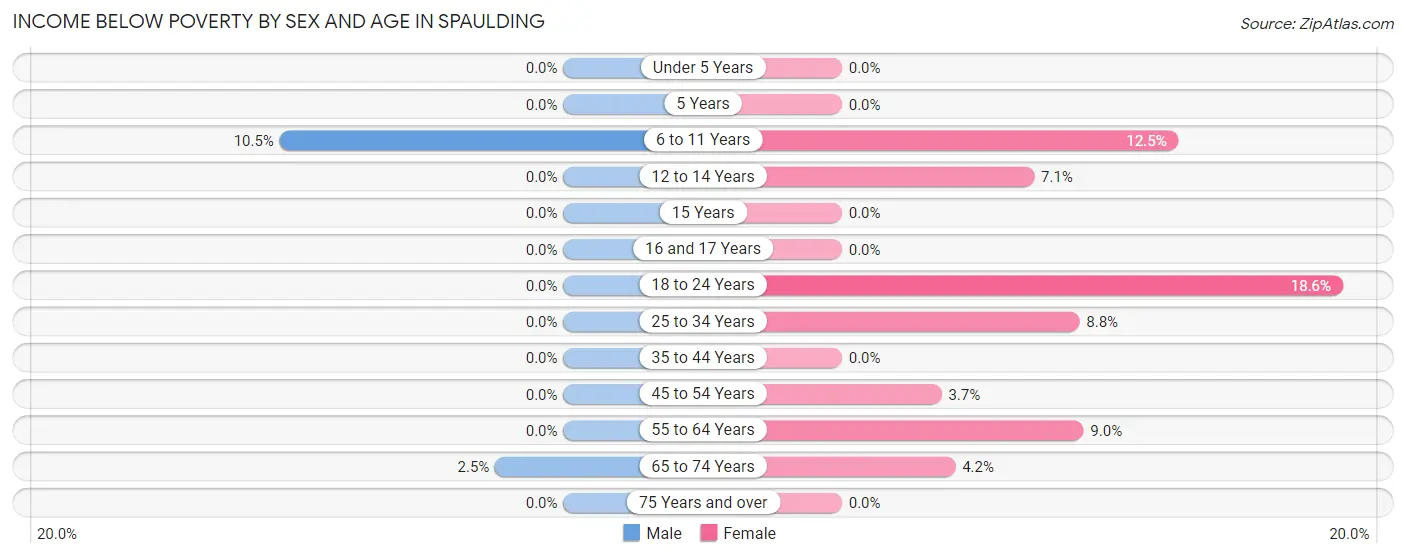
Income Below Poverty by Sex and Age in Spaulding
With 0.8% poverty level for males and 6.1% for females among the residents of Spaulding, 6 to 11 year old males and 18 to 24 year old females are the most vulnerable to poverty, with 2 males (10.5%) and 8 females (18.6%) in their respective age groups living below the poverty level.
| Age Bracket | Male | Female |
| Under 5 Years | 0 (0.0%) | 0 (0.0%) |
| 5 Years | 0 (0.0%) | 0 (0.0%) |
| 6 to 11 Years | 2 (10.5%) | 3 (12.5%) |
| 12 to 14 Years | 0 (0.0%) | 2 (7.1%) |
| 15 Years | 0 (0.0%) | 0 (0.0%) |
| 16 and 17 Years | 0 (0.0%) | 0 (0.0%) |
| 18 to 24 Years | 0 (0.0%) | 8 (18.6%) |
| 25 to 34 Years | 0 (0.0%) | 3 (8.8%) |
| 35 to 44 Years | 0 (0.0%) | 0 (0.0%) |
| 45 to 54 Years | 0 (0.0%) | 3 (3.7%) |
| 55 to 64 Years | 0 (0.0%) | 7 (9.0%) |
| 65 to 74 Years | 2 (2.5%) | 4 (4.2%) |
| 75 Years and over | 0 (0.0%) | 0 (0.0%) |
| Total | 4 (0.8%) | 30 (6.1%) |
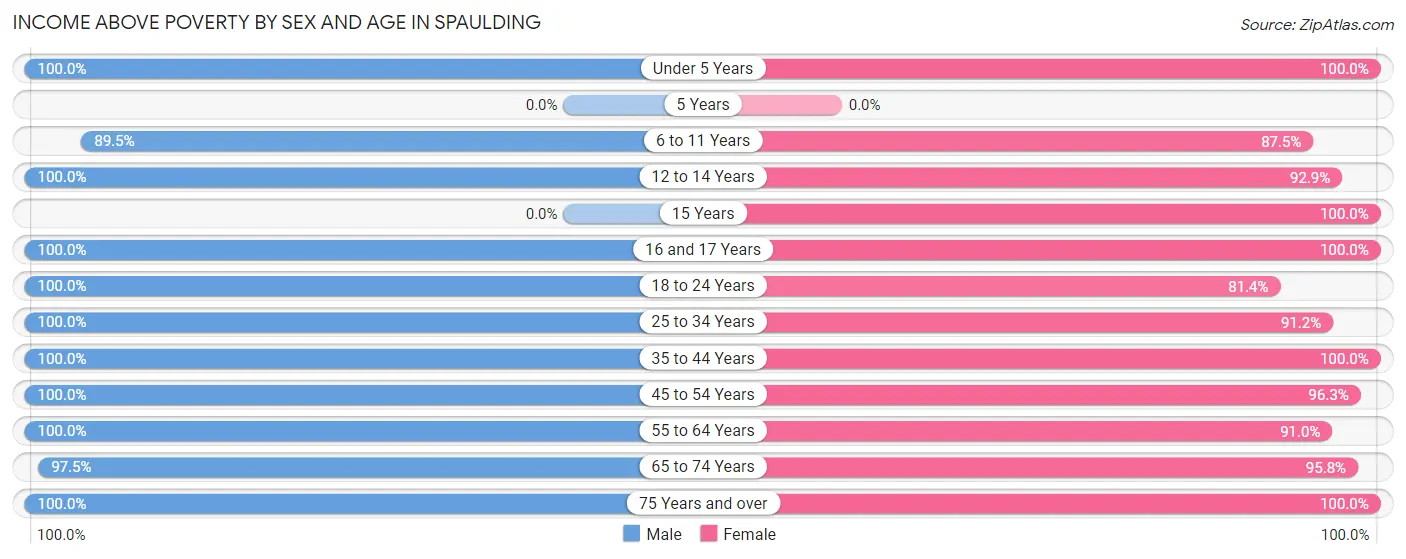
Income Above Poverty by Sex and Age in Spaulding
According to the poverty statistics in Spaulding, males aged under 5 years and females aged under 5 years are the age groups that are most secure financially, with 100.0% of males and 100.0% of females in these age groups living above the poverty line.
| Age Bracket | Male | Female |
| Under 5 Years | 10 (100.0%) | 6 (100.0%) |
| 5 Years | 0 (0.0%) | 0 (0.0%) |
| 6 to 11 Years | 17 (89.5%) | 21 (87.5%) |
| 12 to 14 Years | 4 (100.0%) | 26 (92.9%) |
| 15 Years | 0 (0.0%) | 13 (100.0%) |
| 16 and 17 Years | 24 (100.0%) | 19 (100.0%) |
| 18 to 24 Years | 52 (100.0%) | 35 (81.4%) |
| 25 to 34 Years | 46 (100.0%) | 31 (91.2%) |
| 35 to 44 Years | 40 (100.0%) | 53 (100.0%) |
| 45 to 54 Years | 58 (100.0%) | 78 (96.3%) |
| 55 to 64 Years | 117 (100.0%) | 71 (91.0%) |
| 65 to 74 Years | 77 (97.5%) | 91 (95.8%) |
| 75 Years and over | 26 (100.0%) | 16 (100.0%) |
| Total | 471 (99.2%) | 460 (93.9%) |
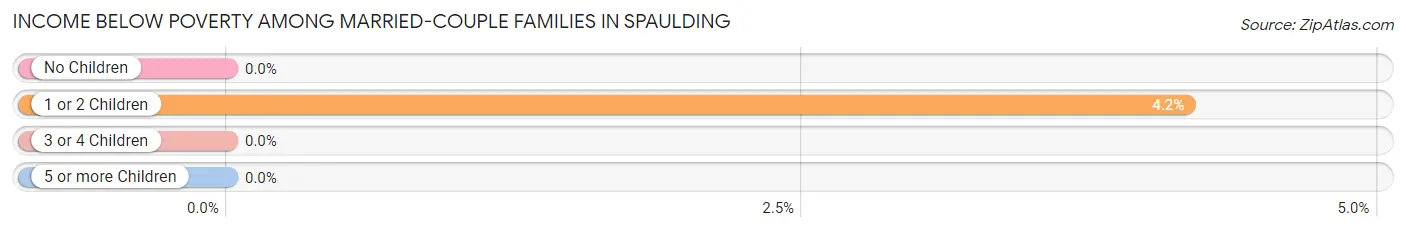
Income Below Poverty Among Married-Couple Families in Spaulding
The poverty statistics for married-couple families in Spaulding show that 0.8% or 2 of the total 252 families live below the poverty line. Families with 1 or 2 children have the highest poverty rate of 4.2%, comprising of 2 families. On the other hand, families with no children have the lowest poverty rate of 0.0%, which includes 0 families.
| Children | Above Poverty | Below Poverty |
| No Children | 198 (100.0%) | 0 (0.0%) |
| 1 or 2 Children | 46 (95.8%) | 2 (4.2%) |
| 3 or 4 Children | 6 (100.0%) | 0 (0.0%) |
| 5 or more Children | 0 (0.0%) | 0 (0.0%) |
| Total | 250 (99.2%) | 2 (0.8%) |
Income Below Poverty Among Single-Parent Households in Spaulding
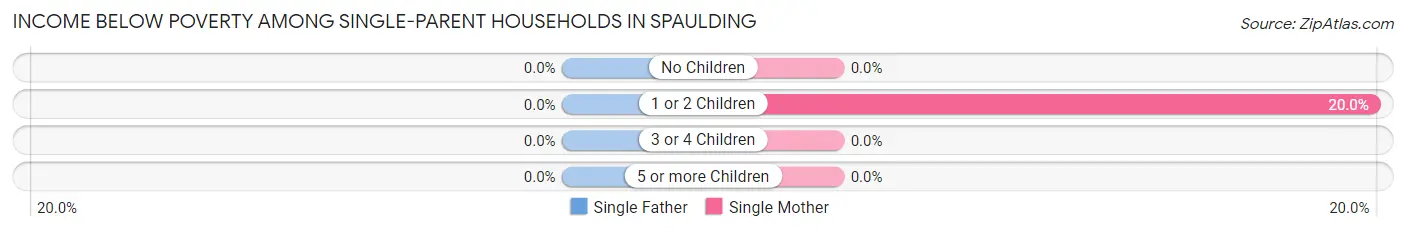
| Children | Single Father | Single Mother |
| No Children | 0 (0.0%) | 0 (0.0%) |
| 1 or 2 Children | 0 (0.0%) | 3 (20.0%) |
| 3 or 4 Children | 0 (0.0%) | 0 (0.0%) |
| 5 or more Children | 0 (0.0%) | 0 (0.0%) |
| Total | 0 (0.0%) | 3 (10.0%) |
Income Below Poverty Among Married-Couple vs Single-Parent Households in Spaulding
The poverty data for Spaulding shows that 2 of the married-couple family households (0.8%) and 3 of the single-parent households (7.0%) are living below the poverty level. Within the married-couple family households, those with 1 or 2 children have the highest poverty rate, with 2 households (4.2%) falling below the poverty line. Among the single-parent households, those with 1 or 2 children have the highest poverty rate, with 3 household (11.5%) living below poverty.
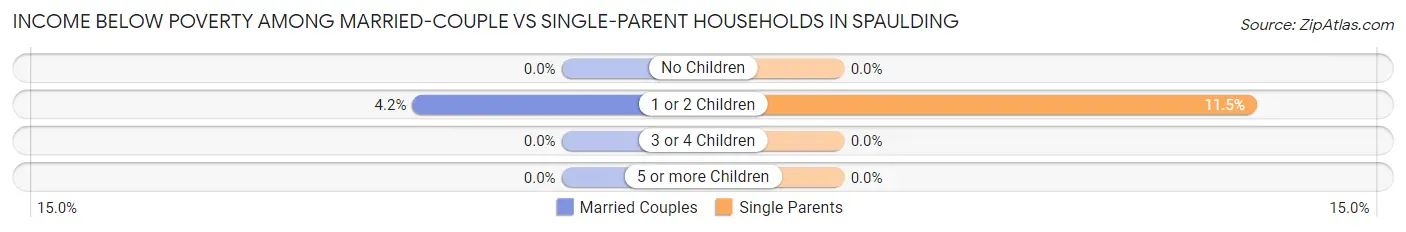
| Children | Married-Couple Families | Single-Parent Households |
| No Children | 0 (0.0%) | 0 (0.0%) |
| 1 or 2 Children | 2 (4.2%) | 3 (11.5%) |
| 3 or 4 Children | 0 (0.0%) | 0 (0.0%) |
| 5 or more Children | 0 (0.0%) | 0 (0.0%) |
| Total | 2 (0.8%) | 3 (7.0%) |
Race in Spaulding
The most populous races in Spaulding are White / Caucasian (918 | 95.1%), Two or more Races (26 | 2.7%), and Some other Race (12 | 1.2%).
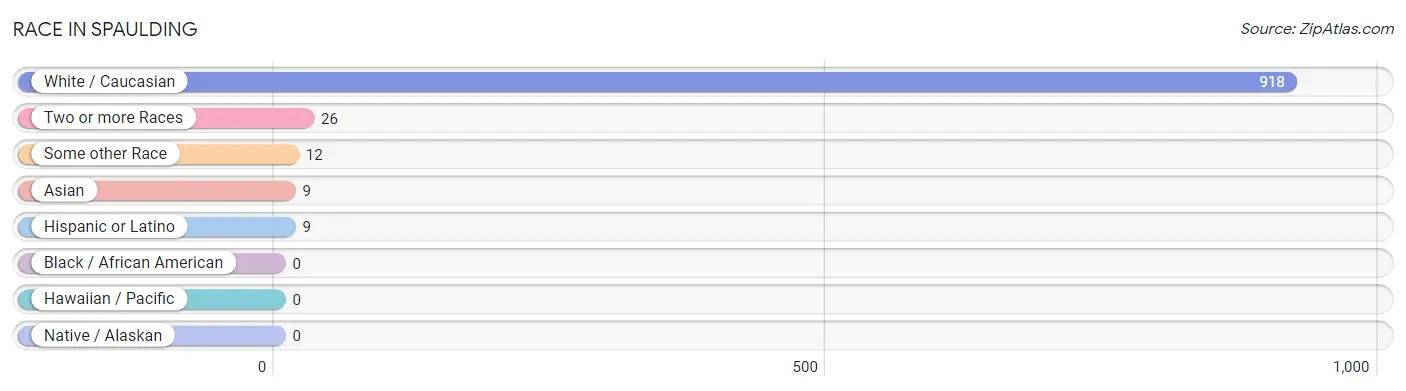
| Race | # Population | % Population |
| Asian | 9 | 0.9% |
| Black / African American | 0 | 0.0% |
| Hawaiian / Pacific | 0 | 0.0% |
| Hispanic or Latino | 9 | 0.9% |
| Native / Alaskan | 0 | 0.0% |
| White / Caucasian | 918 | 95.1% |
| Two or more Races | 26 | 2.7% |
| Some other Race | 12 | 1.2% |
| Total | 965 | 100.0% |
Ancestry in Spaulding
The most populous ancestries reported in Spaulding are German (204 | 21.1%), Irish (130 | 13.5%), English (95 | 9.8%), Italian (79 | 8.2%), and American (59 | 6.1%), together accounting for 58.8% of all Spaulding residents.
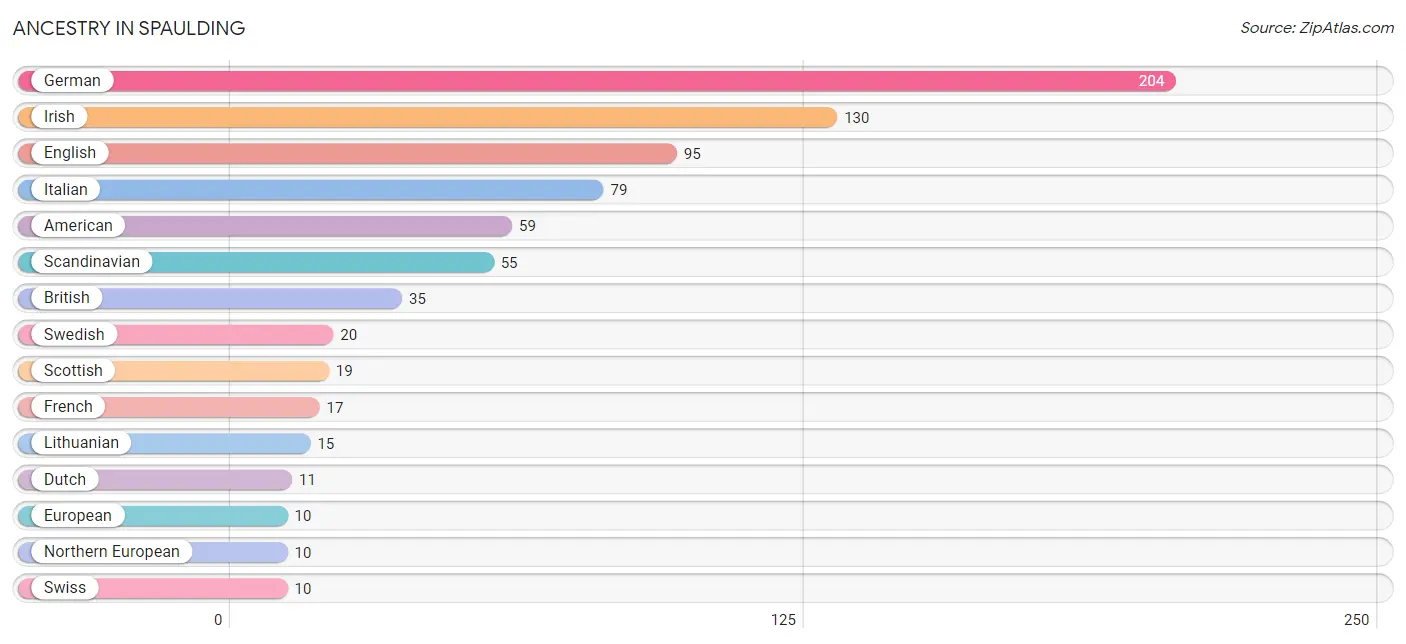
| Ancestry | # Population | % Population |
| American | 59 | 6.1% |
| Bhutanese | 3 | 0.3% |
| British | 35 | 3.6% |
| Dutch | 11 | 1.1% |
| Eastern European | 8 | 0.8% |
| English | 95 | 9.8% |
| European | 10 | 1.0% |
| Finnish | 5 | 0.5% |
| French | 17 | 1.8% |
| German | 204 | 21.1% |
| Indian (Asian) | 9 | 0.9% |
| Irish | 130 | 13.5% |
| Italian | 79 | 8.2% |
| Korean | 4 | 0.4% |
| Lithuanian | 15 | 1.5% |
| Northern European | 10 | 1.0% |
| Polish | 8 | 0.8% |
| Puerto Rican | 4 | 0.4% |
| Russian | 2 | 0.2% |
| Scandinavian | 55 | 5.7% |
| Scotch-Irish | 3 | 0.3% |
| Scottish | 19 | 2.0% |
| Slavic | 2 | 0.2% |
| Slovak | 2 | 0.2% |
| Spanish | 5 | 0.5% |
| Swedish | 20 | 2.1% |
| Swiss | 10 | 1.0% |
| Welsh | 3 | 0.3% |
| Yugoslavian | 3 | 0.3% | View All 29 Rows |
Immigrants in Spaulding
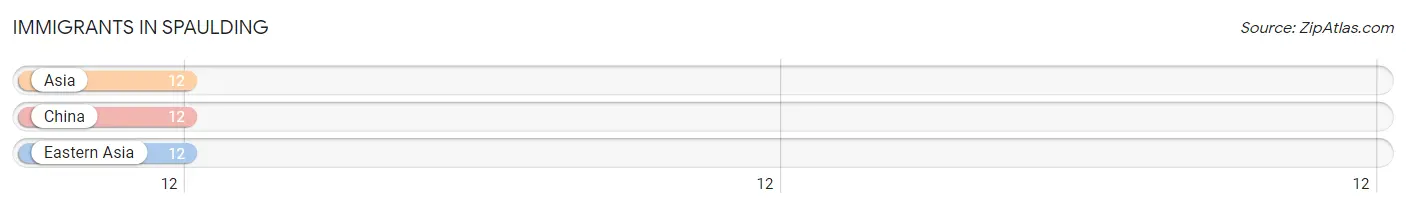
The most numerous immigrant groups reported in Spaulding came from Asia (12 | 1.2%), China (12 | 1.2%), and Eastern Asia (12 | 1.2%), together accounting for 3.7% of all Spaulding residents.
| Immigration Origin | # Population | % Population |
| Asia | 12 | 1.2% |
| China | 12 | 1.2% |
| Eastern Asia | 12 | 1.2% | View All 3 Rows |
Sex and Age in Spaulding
Sex and Age in Spaulding
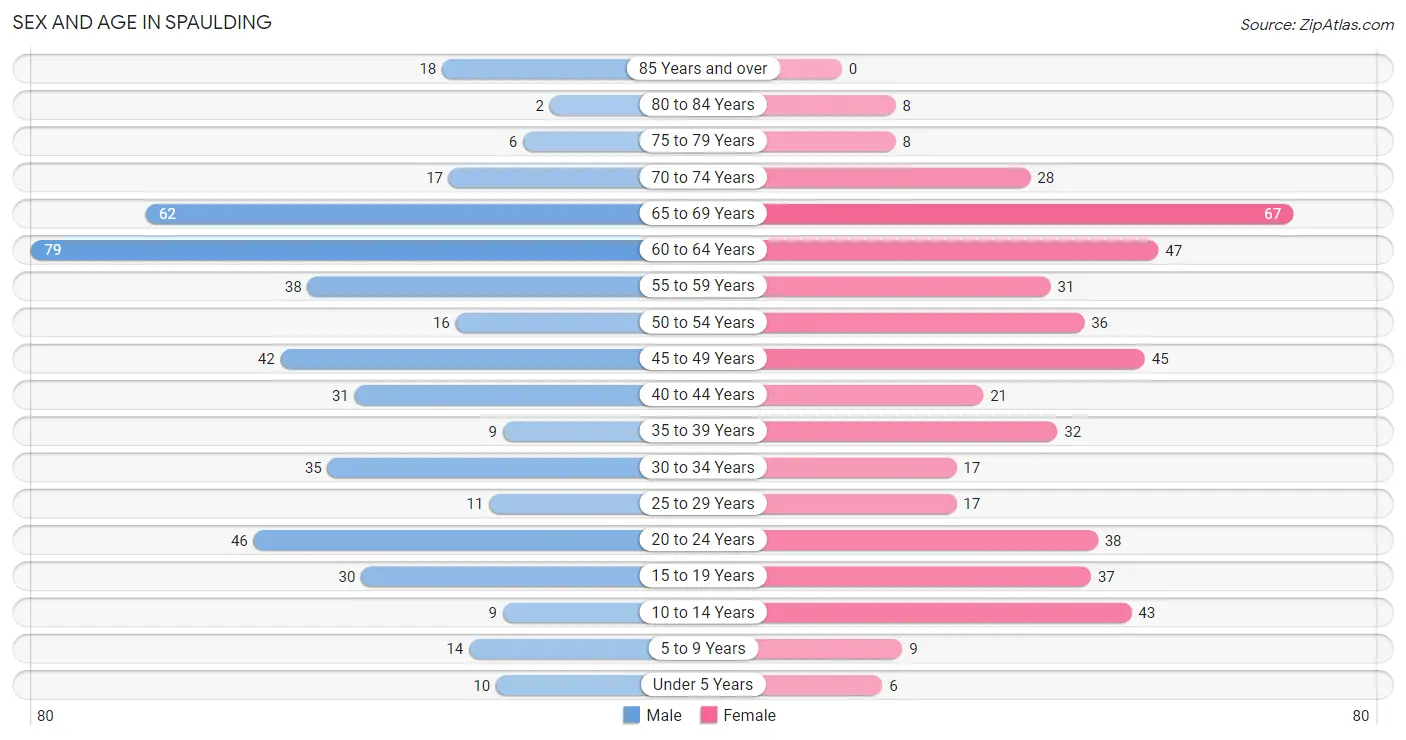
The most populous age groups in Spaulding are 60 to 64 Years (79 | 16.6%) for men and 65 to 69 Years (67 | 13.7%) for women.
| Age Bracket | Male | Female |
| Under 5 Years | 10 (2.1%) | 6 (1.2%) |
| 5 to 9 Years | 14 (2.9%) | 9 (1.8%) |
| 10 to 14 Years | 9 (1.9%) | 43 (8.8%) |
| 15 to 19 Years | 30 (6.3%) | 37 (7.5%) |
| 20 to 24 Years | 46 (9.7%) | 38 (7.8%) |
| 25 to 29 Years | 11 (2.3%) | 17 (3.5%) |
| 30 to 34 Years | 35 (7.4%) | 17 (3.5%) |
| 35 to 39 Years | 9 (1.9%) | 32 (6.5%) |
| 40 to 44 Years | 31 (6.5%) | 21 (4.3%) |
| 45 to 49 Years | 42 (8.8%) | 45 (9.2%) |
| 50 to 54 Years | 16 (3.4%) | 36 (7.3%) |
| 55 to 59 Years | 38 (8.0%) | 31 (6.3%) |
| 60 to 64 Years | 79 (16.6%) | 47 (9.6%) |
| 65 to 69 Years | 62 (13.1%) | 67 (13.7%) |
| 70 to 74 Years | 17 (3.6%) | 28 (5.7%) |
| 75 to 79 Years | 6 (1.3%) | 8 (1.6%) |
| 80 to 84 Years | 2 (0.4%) | 8 (1.6%) |
| 85 Years and over | 18 (3.8%) | 0 (0.0%) |
| Total | 475 (100.0%) | 490 (100.0%) |
Families and Households in Spaulding
Median Family Size in Spaulding
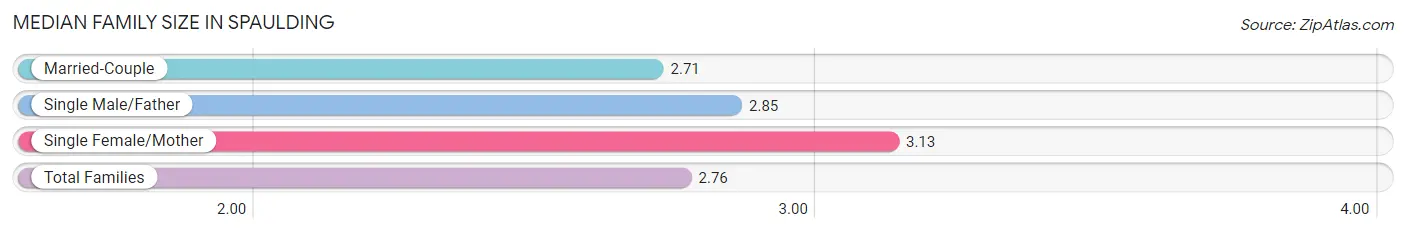
The median family size in Spaulding is 2.76 persons per family, with single female/mother families (30 | 10.2%) accounting for the largest median family size of 3.13 persons per family. On the other hand, married-couple families (252 | 85.4%) represent the smallest median family size with 2.71 persons per family.
| Family Type | # Families | Family Size |
| Married-Couple | 252 (85.4%) | 2.71 |
| Single Male/Father | 13 (4.4%) | 2.85 |
| Single Female/Mother | 30 (10.2%) | 3.13 |
| Total Families | 295 (100.0%) | 2.76 |
Median Household Size in Spaulding
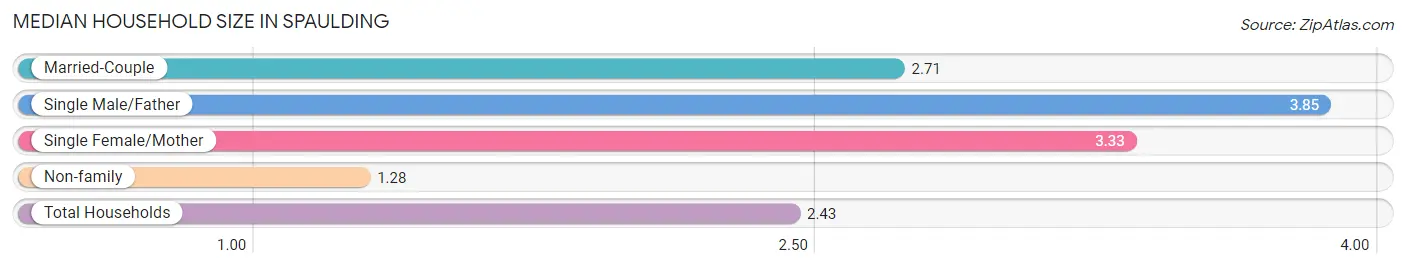
The median household size in Spaulding is 2.43 persons per household, with single male/father households (13 | 3.3%) accounting for the largest median household size of 3.85 persons per household. non-family households (102 | 25.7%) represent the smallest median household size with 1.28 persons per household.
| Household Type | # Households | Household Size |
| Married-Couple | 252 (63.5%) | 2.71 |
| Single Male/Father | 13 (3.3%) | 3.85 |
| Single Female/Mother | 30 (7.6%) | 3.33 |
| Non-family | 102 (25.7%) | 1.28 |
| Total Households | 397 (100.0%) | 2.43 |
Household Size by Marriage Status in Spaulding
Out of a total of 397 households in Spaulding, 295 (74.3%) are family households, while 102 (25.7%) are nonfamily households. The most numerous type of family households are 2-person households, comprising 192, and the most common type of nonfamily households are 1-person households, comprising 75.
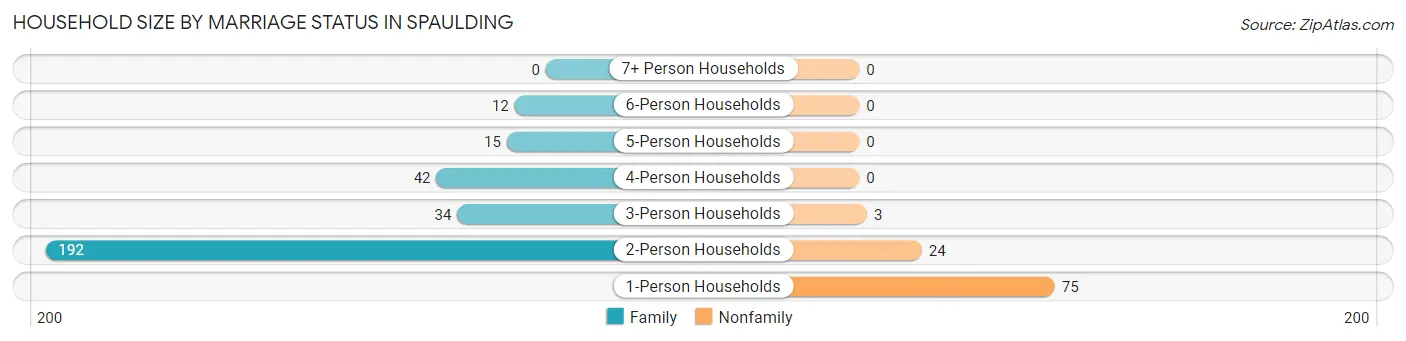
| Household Size | Family Households | Nonfamily Households |
| 1-Person Households | - | 75 (18.9%) |
| 2-Person Households | 192 (48.4%) | 24 (6.0%) |
| 3-Person Households | 34 (8.6%) | 3 (0.8%) |
| 4-Person Households | 42 (10.6%) | 0 (0.0%) |
| 5-Person Households | 15 (3.8%) | 0 (0.0%) |
| 6-Person Households | 12 (3.0%) | 0 (0.0%) |
| 7+ Person Households | 0 (0.0%) | 0 (0.0%) |
| Total | 295 (74.3%) | 102 (25.7%) |
Female Fertility in Spaulding
Fertility by Age in Spaulding
| Age Bracket | Women with Births | Births / 1,000 Women |
| 15 to 19 years | 0 (0.0%) | 0.0 |
| 20 to 34 years | 0 (0.0%) | 0.0 |
| 35 to 50 years | 0 (0.0%) | 0.0 |
| Total | 0 (0.0%) | 0.0 |
Fertility by Age by Marriage Status in Spaulding
| Age Bracket | Married | Unmarried |
| 15 to 19 years | 0 (0.0%) | 0 (0.0%) |
| 20 to 34 years | 0 (0.0%) | 0 (0.0%) |
| 35 to 50 years | 0 (0.0%) | 0 (0.0%) |
| Total | 0 (0.0%) | 0 (0.0%) |
Fertility by Education in Spaulding
| Educational Attainment | Women with Births | Births / 1,000 Women |
| Less than High School | 0 (0.0%) | 0.0 |
| High School Diploma | 0 (0.0%) | 0.0 |
| College or Associate's Degree | 0 (0.0%) | 0.0 |
| Bachelor's Degree | 0 (0.0%) | 0.0 |
| Graduate Degree | 0 (0.0%) | 0.0 |
| Total | 0 (0.0%) | 0.0 |
Fertility by Education by Marriage Status in Spaulding
| Educational Attainment | Married | Unmarried |
| Less than High School | 0 (0.0%) | 0 (0.0%) |
| High School Diploma | 0 (0.0%) | 0 (0.0%) |
| College or Associate's Degree | 0 (0.0%) | 0 (0.0%) |
| Bachelor's Degree | 0 (0.0%) | 0 (0.0%) |
| Graduate Degree | 0 (0.0%) | 0 (0.0%) |
| Total | 0 (0.0%) | 0 (0.0%) |
Employment Characteristics in Spaulding
Employment by Class of Employer in Spaulding
Among the 527 employed individuals in Spaulding, private company employees (284 | 53.9%), state government employees (119 | 22.6%), and not-for-profit organizations (46 | 8.7%) make up the most common classes of employment.
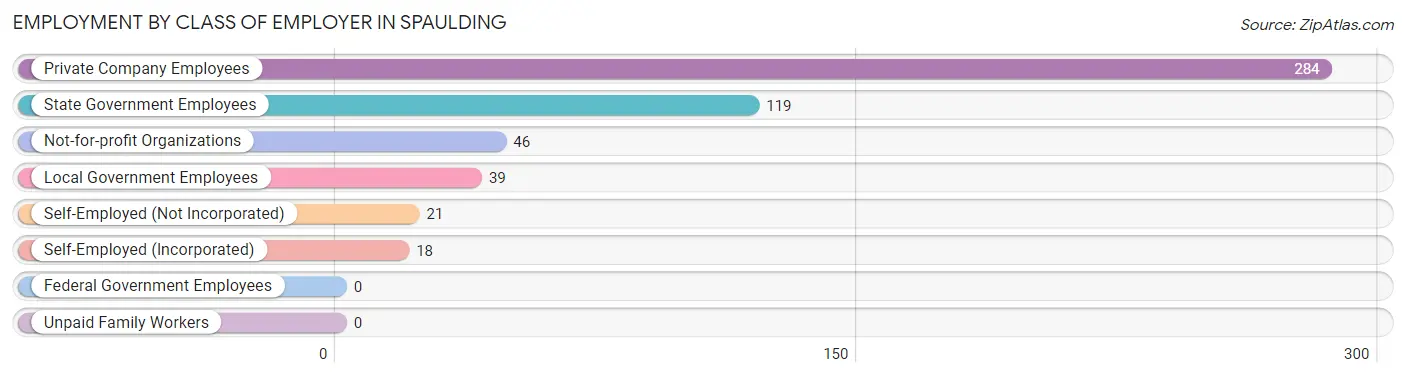
| Employer Class | # Employees | % Employees |
| Private Company Employees | 284 | 53.9% |
| Self-Employed (Incorporated) | 18 | 3.4% |
| Self-Employed (Not Incorporated) | 21 | 4.0% |
| Not-for-profit Organizations | 46 | 8.7% |
| Local Government Employees | 39 | 7.4% |
| State Government Employees | 119 | 22.6% |
| Federal Government Employees | 0 | 0.0% |
| Unpaid Family Workers | 0 | 0.0% |
| Total | 527 | 100.0% |
Employment Status by Age in Spaulding
According to the labor force statistics for Spaulding, out of the total population over 16 years of age (861), 64.6% or 556 individuals are in the labor force, with 4.3% or 24 of them unemployed. The age group with the highest labor force participation rate is 25 to 29 years, with 100.0% or 28 individuals in the labor force. Within the labor force, the 20 to 24 years age range has the highest percentage of unemployed individuals, with 19.7% or 14 of them being unemployed.
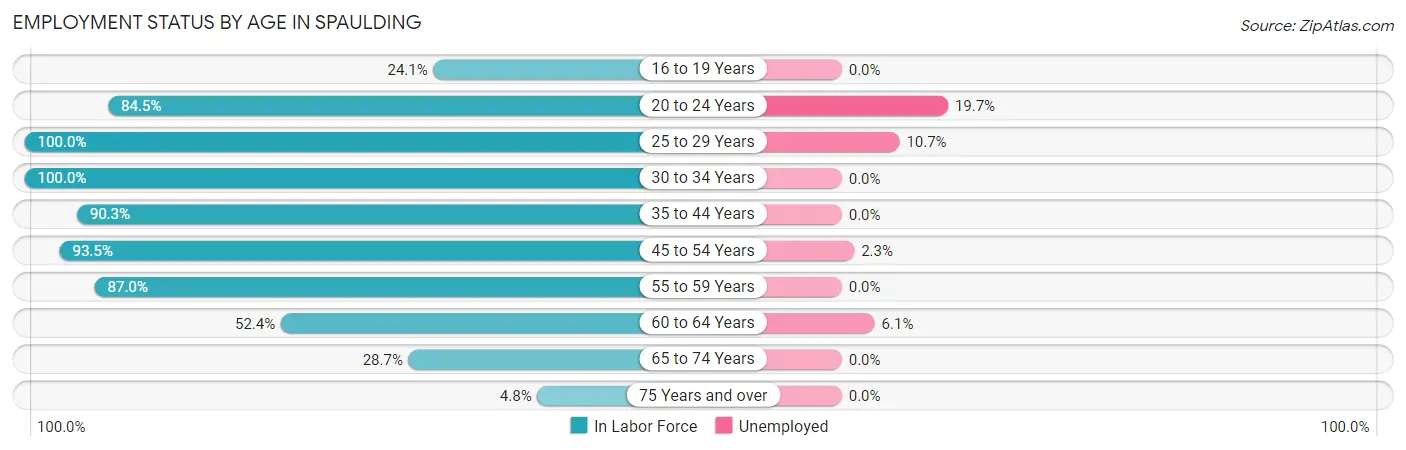
| Age Bracket | In Labor Force | Unemployed |
| 16 to 19 Years | 13 (24.1%) | 0 (0.0%) |
| 20 to 24 Years | 71 (84.5%) | 14 (19.7%) |
| 25 to 29 Years | 28 (100.0%) | 3 (10.7%) |
| 30 to 34 Years | 52 (100.0%) | 0 (0.0%) |
| 35 to 44 Years | 84 (90.3%) | 0 (0.0%) |
| 45 to 54 Years | 130 (93.5%) | 3 (2.3%) |
| 55 to 59 Years | 60 (87.0%) | 0 (0.0%) |
| 60 to 64 Years | 66 (52.4%) | 4 (6.1%) |
| 65 to 74 Years | 50 (28.7%) | 0 (0.0%) |
| 75 Years and over | 2 (4.8%) | 0 (0.0%) |
| Total | 556 (64.6%) | 24 (4.3%) |
Employment Status by Educational Attainment in Spaulding
According to labor force statistics for Spaulding, 82.8% of individuals (420) out of the total population between 25 and 64 years of age (507) are in the labor force, with 2.4% or 10 of them being unemployed. The group with the highest labor force participation rate are those with the educational attainment of bachelor's degree or higher, with 96.1% or 173 individuals in the labor force. Within the labor force, individuals with high school diploma education have the highest percentage of unemployment, with 3.8% or 4 of them being unemployed.
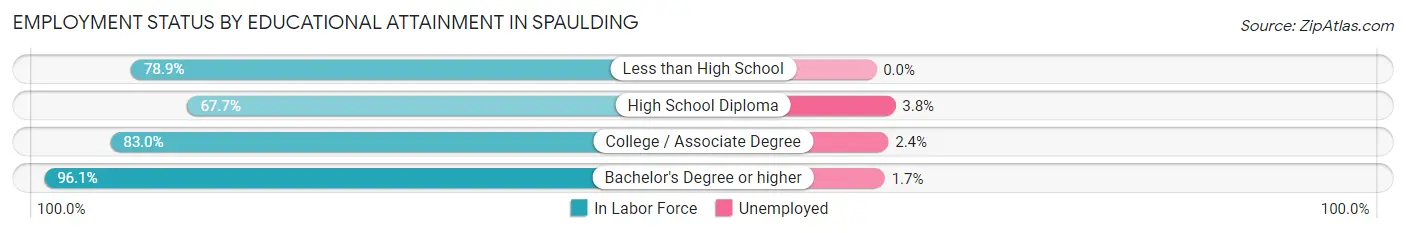
| Educational Attainment | In Labor Force | Unemployed |
| Less than High School | 15 (78.9%) | 0 (0.0%) |
| High School Diploma | 105 (67.7%) | 6 (3.8%) |
| College / Associate Degree | 127 (83.0%) | 4 (2.4%) |
| Bachelor's Degree or higher | 173 (96.1%) | 3 (1.7%) |
| Total | 420 (82.8%) | 12 (2.4%) |
Employment Occupations by Sex in Spaulding
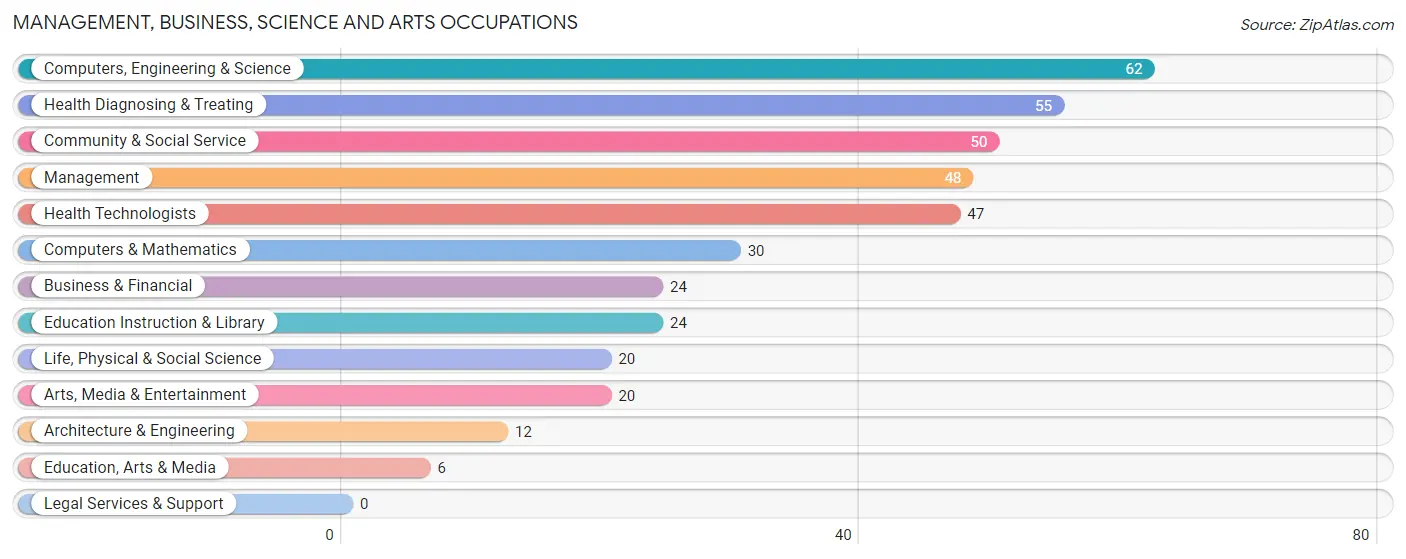
Management, Business, Science and Arts Occupations
The most common Management, Business, Science and Arts occupations in Spaulding are Computers, Engineering & Science (62 | 11.7%), Health Diagnosing & Treating (55 | 10.3%), Community & Social Service (50 | 9.4%), Management (48 | 9.0%), and Health Technologists (47 | 8.8%).
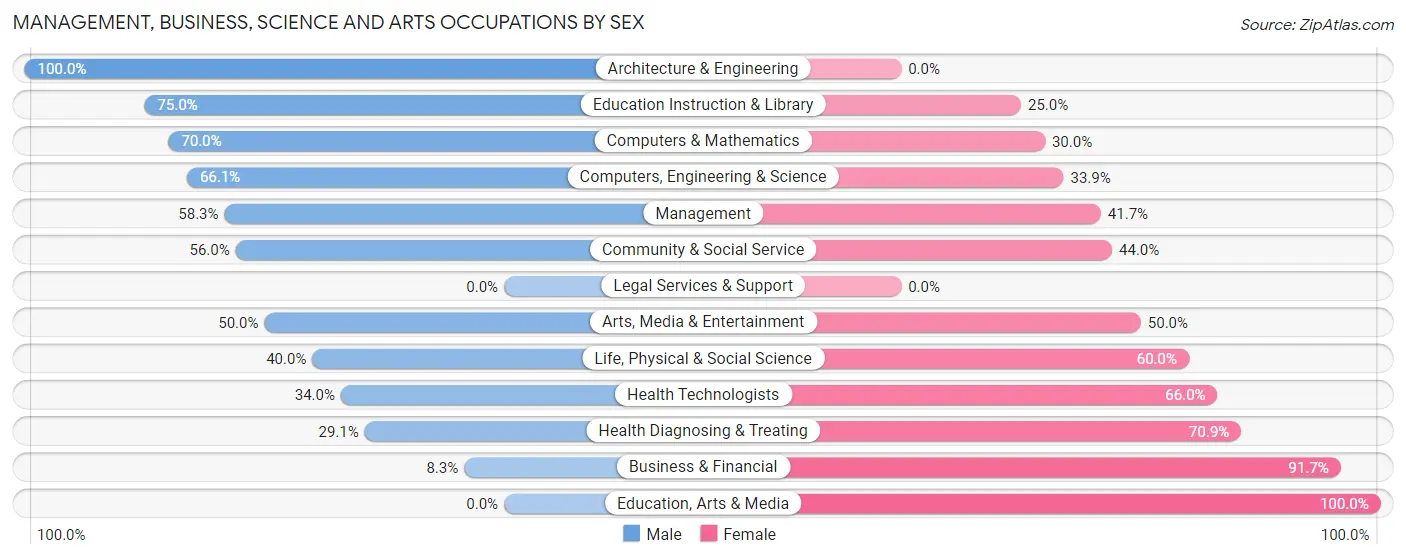
Management, Business, Science and Arts Occupations by Sex
Within the Management, Business, Science and Arts occupations in Spaulding, the most male-oriented occupations are Architecture & Engineering (100.0%), Education Instruction & Library (75.0%), and Computers & Mathematics (70.0%), while the most female-oriented occupations are Education, Arts & Media (100.0%), Business & Financial (91.7%), and Health Diagnosing & Treating (70.9%).
| Occupation | Male | Female |
| Management | 28 (58.3%) | 20 (41.7%) |
| Business & Financial | 2 (8.3%) | 22 (91.7%) |
| Computers, Engineering & Science | 41 (66.1%) | 21 (33.9%) |
| Computers & Mathematics | 21 (70.0%) | 9 (30.0%) |
| Architecture & Engineering | 12 (100.0%) | 0 (0.0%) |
| Life, Physical & Social Science | 8 (40.0%) | 12 (60.0%) |
| Community & Social Service | 28 (56.0%) | 22 (44.0%) |
| Education, Arts & Media | 0 (0.0%) | 6 (100.0%) |
| Legal Services & Support | 0 (0.0%) | 0 (0.0%) |
| Education Instruction & Library | 18 (75.0%) | 6 (25.0%) |
| Arts, Media & Entertainment | 10 (50.0%) | 10 (50.0%) |
| Health Diagnosing & Treating | 16 (29.1%) | 39 (70.9%) |
| Health Technologists | 16 (34.0%) | 31 (66.0%) |
| Total (Category) | 115 (48.1%) | 124 (51.9%) |
| Total (Overall) | 279 (52.4%) | 253 (47.6%) |
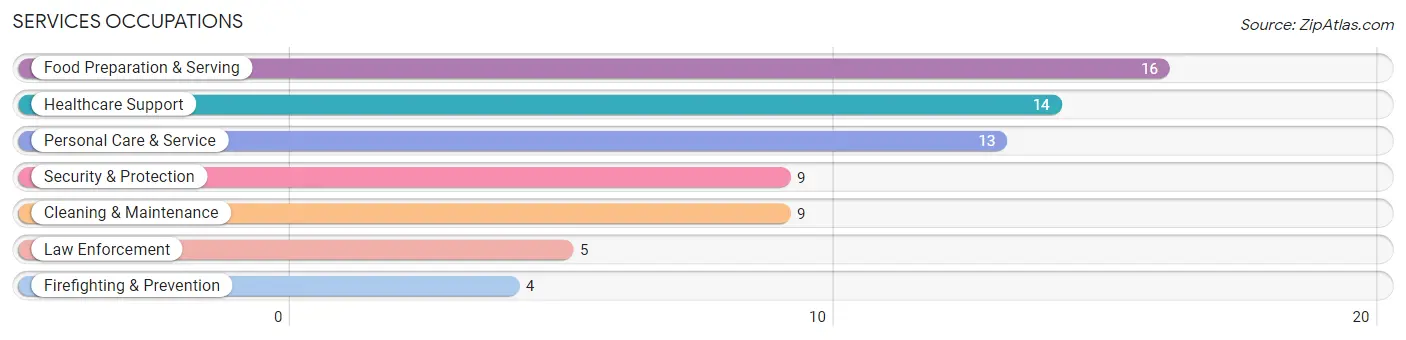
Services Occupations
The most common Services occupations in Spaulding are Food Preparation & Serving (16 | 3.0%), Healthcare Support (14 | 2.6%), Personal Care & Service (13 | 2.4%), Security & Protection (9 | 1.7%), and Cleaning & Maintenance (9 | 1.7%).
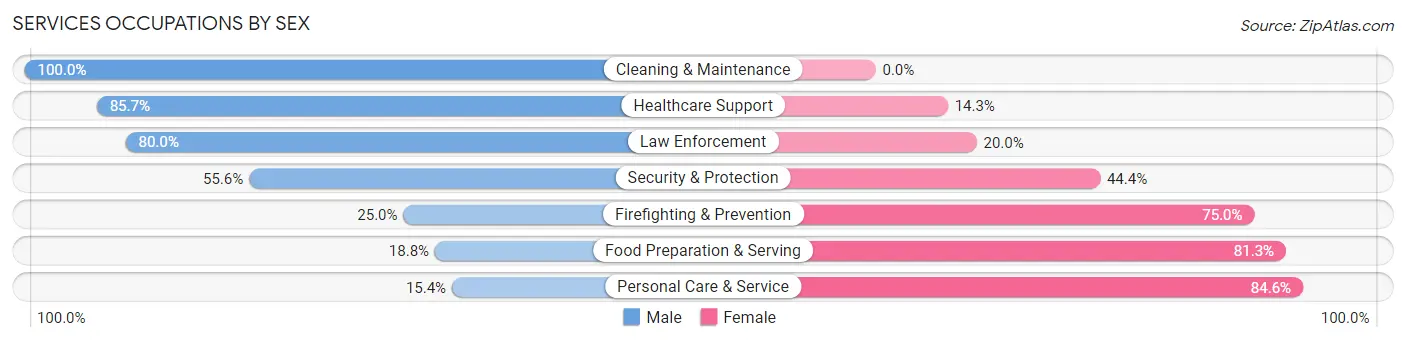
Services Occupations by Sex
Within the Services occupations in Spaulding, the most male-oriented occupations are Cleaning & Maintenance (100.0%), Healthcare Support (85.7%), and Law Enforcement (80.0%), while the most female-oriented occupations are Personal Care & Service (84.6%), Food Preparation & Serving (81.2%), and Firefighting & Prevention (75.0%).
| Occupation | Male | Female |
| Healthcare Support | 12 (85.7%) | 2 (14.3%) |
| Security & Protection | 5 (55.6%) | 4 (44.4%) |
| Firefighting & Prevention | 1 (25.0%) | 3 (75.0%) |
| Law Enforcement | 4 (80.0%) | 1 (20.0%) |
| Food Preparation & Serving | 3 (18.8%) | 13 (81.2%) |
| Cleaning & Maintenance | 9 (100.0%) | 0 (0.0%) |
| Personal Care & Service | 2 (15.4%) | 11 (84.6%) |
| Total (Category) | 31 (50.8%) | 30 (49.2%) |
| Total (Overall) | 279 (52.4%) | 253 (47.6%) |
Sales and Office Occupations
The most common Sales and Office occupations in Spaulding are Office & Administration (72 | 13.5%), and Sales & Related (68 | 12.8%).

Sales and Office Occupations by Sex

| Occupation | Male | Female |
| Sales & Related | 35 (51.5%) | 33 (48.5%) |
| Office & Administration | 6 (8.3%) | 66 (91.7%) |
| Total (Category) | 41 (29.3%) | 99 (70.7%) |
| Total (Overall) | 279 (52.4%) | 253 (47.6%) |
Natural Resources, Construction and Maintenance Occupations
The most common Natural Resources, Construction and Maintenance occupations in Spaulding are Installation, Maintenance & Repair (22 | 4.1%), and Construction & Extraction (20 | 3.8%).
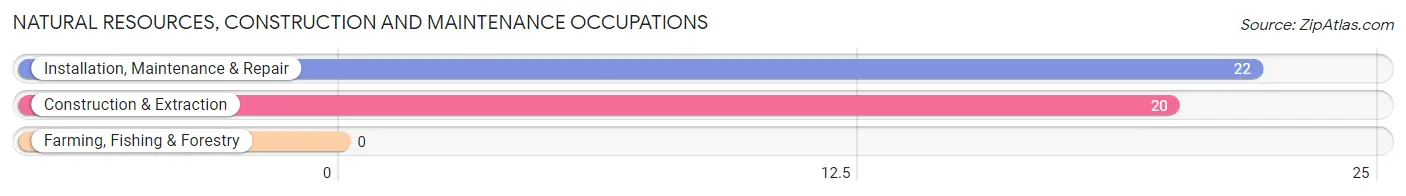
Natural Resources, Construction and Maintenance Occupations by Sex
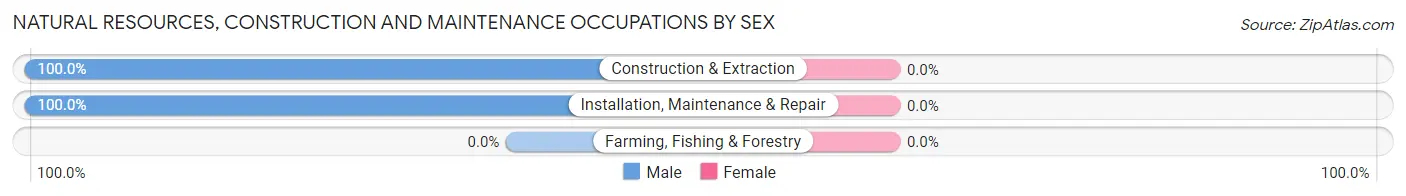
| Occupation | Male | Female |
| Farming, Fishing & Forestry | 0 (0.0%) | 0 (0.0%) |
| Construction & Extraction | 20 (100.0%) | 0 (0.0%) |
| Installation, Maintenance & Repair | 22 (100.0%) | 0 (0.0%) |
| Total (Category) | 42 (100.0%) | 0 (0.0%) |
| Total (Overall) | 279 (52.4%) | 253 (47.6%) |
Production, Transportation and Moving Occupations
The most common Production, Transportation and Moving occupations in Spaulding are Transportation (28 | 5.3%), Production (12 | 2.3%), and Material Moving (10 | 1.9%).
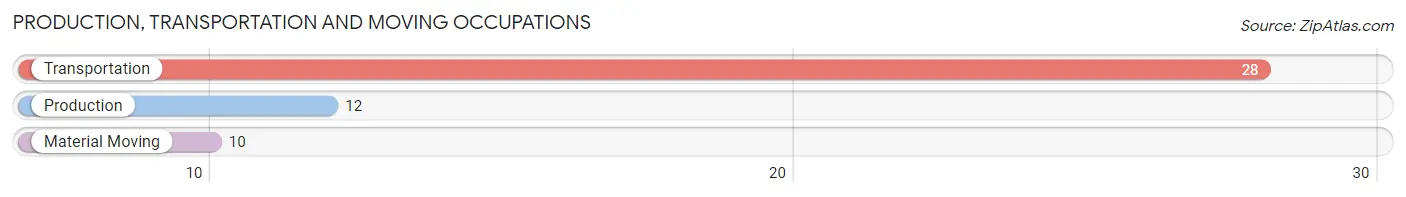
Production, Transportation and Moving Occupations by Sex
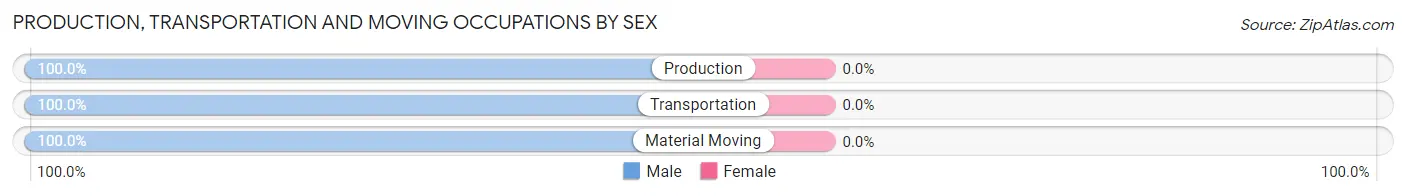
| Occupation | Male | Female |
| Production | 12 (100.0%) | 0 (0.0%) |
| Transportation | 28 (100.0%) | 0 (0.0%) |
| Material Moving | 10 (100.0%) | 0 (0.0%) |
| Total (Category) | 50 (100.0%) | 0 (0.0%) |
| Total (Overall) | 279 (52.4%) | 253 (47.6%) |
Employment Industries by Sex in Spaulding
Employment Industries in Spaulding
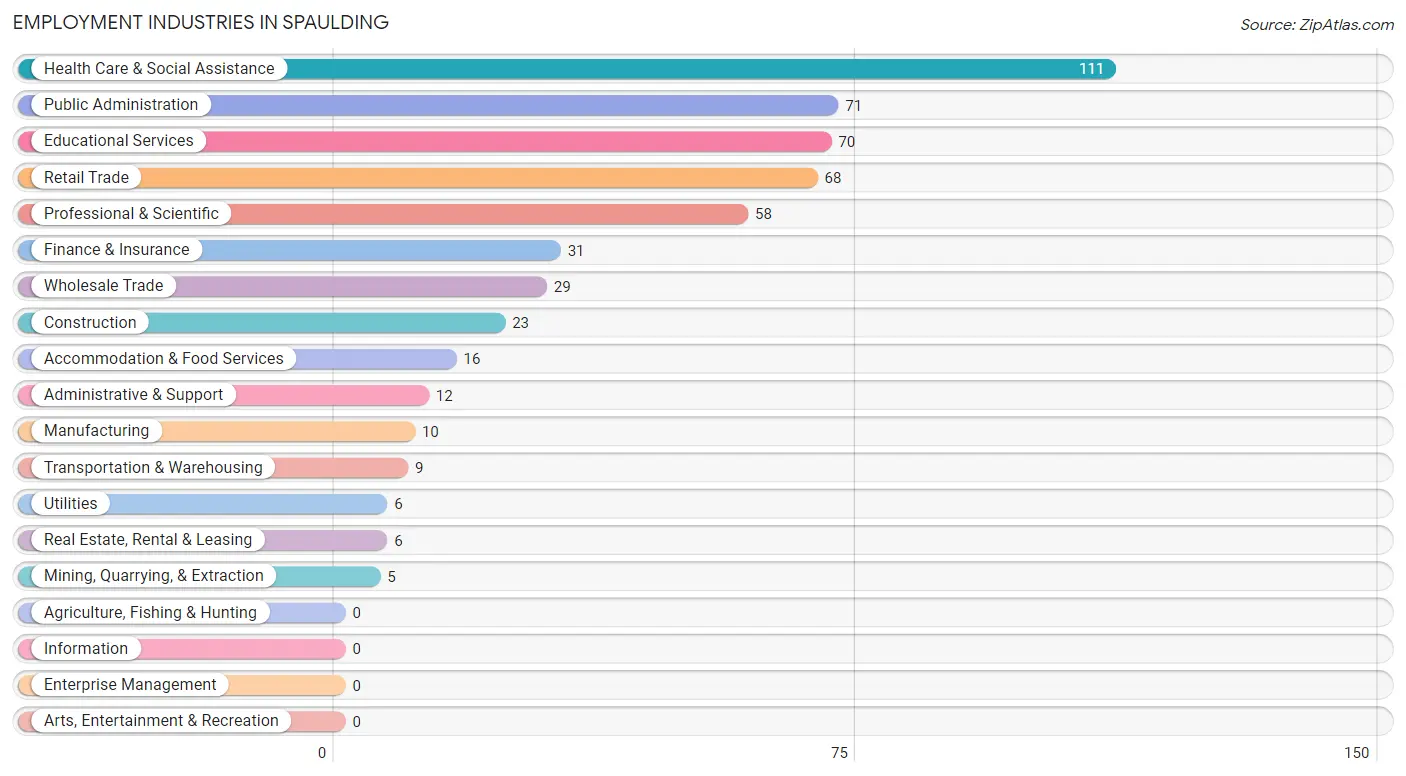
The major employment industries in Spaulding include Health Care & Social Assistance (111 | 20.9%), Public Administration (71 | 13.4%), Educational Services (70 | 13.2%), Retail Trade (68 | 12.8%), and Professional & Scientific (58 | 10.9%).
Employment Industries by Sex in Spaulding
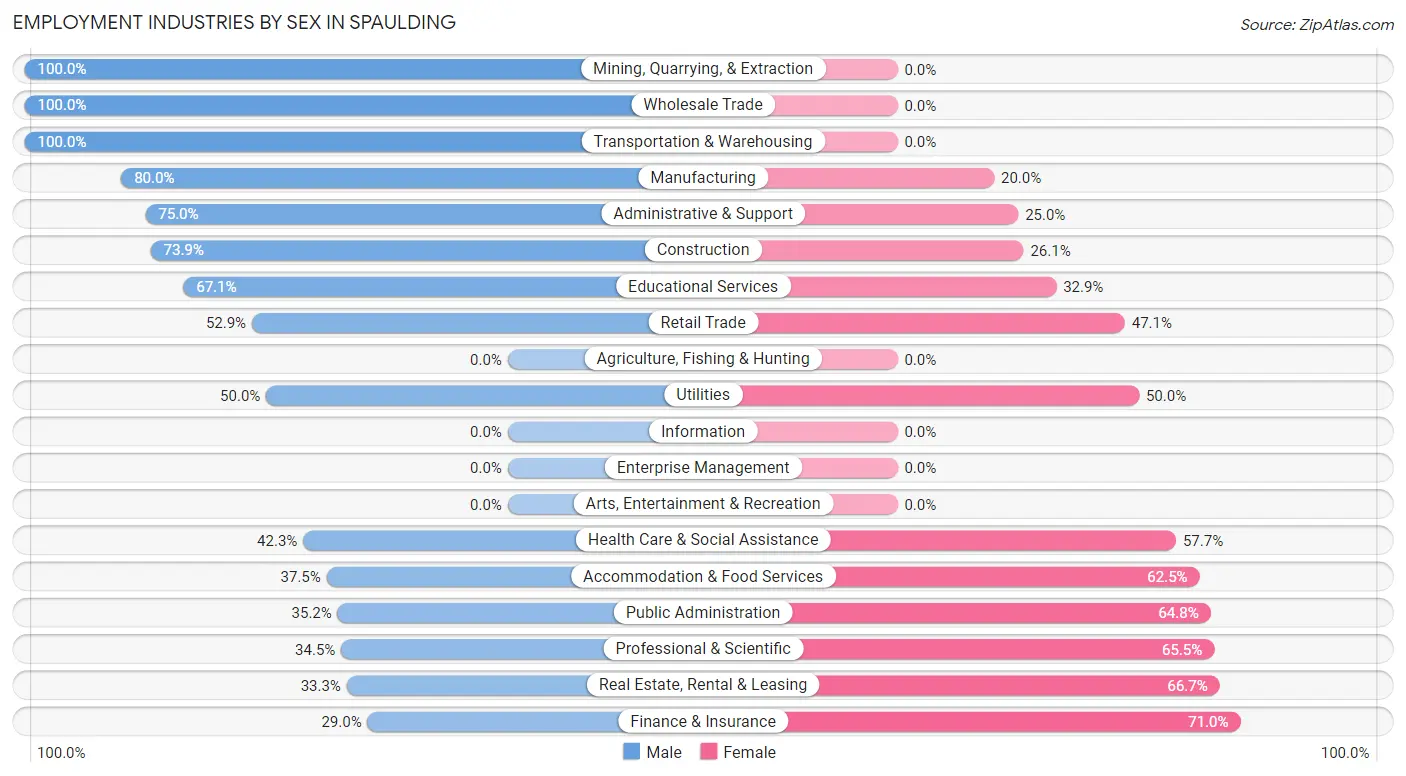
The Spaulding industries that see more men than women are Mining, Quarrying, & Extraction (100.0%), Wholesale Trade (100.0%), and Transportation & Warehousing (100.0%), whereas the industries that tend to have a higher number of women are Finance & Insurance (71.0%), Real Estate, Rental & Leasing (66.7%), and Professional & Scientific (65.5%).
| Industry | Male | Female |
| Agriculture, Fishing & Hunting | 0 (0.0%) | 0 (0.0%) |
| Mining, Quarrying, & Extraction | 5 (100.0%) | 0 (0.0%) |
| Construction | 17 (73.9%) | 6 (26.1%) |
| Manufacturing | 8 (80.0%) | 2 (20.0%) |
| Wholesale Trade | 29 (100.0%) | 0 (0.0%) |
| Retail Trade | 36 (52.9%) | 32 (47.1%) |
| Transportation & Warehousing | 9 (100.0%) | 0 (0.0%) |
| Utilities | 3 (50.0%) | 3 (50.0%) |
| Information | 0 (0.0%) | 0 (0.0%) |
| Finance & Insurance | 9 (29.0%) | 22 (71.0%) |
| Real Estate, Rental & Leasing | 2 (33.3%) | 4 (66.7%) |
| Professional & Scientific | 20 (34.5%) | 38 (65.5%) |
| Enterprise Management | 0 (0.0%) | 0 (0.0%) |
| Administrative & Support | 9 (75.0%) | 3 (25.0%) |
| Educational Services | 47 (67.1%) | 23 (32.9%) |
| Health Care & Social Assistance | 47 (42.3%) | 64 (57.7%) |
| Arts, Entertainment & Recreation | 0 (0.0%) | 0 (0.0%) |
| Accommodation & Food Services | 6 (37.5%) | 10 (62.5%) |
| Public Administration | 25 (35.2%) | 46 (64.8%) |
| Total | 279 (52.4%) | 253 (47.6%) |
Education in Spaulding
School Enrollment in Spaulding
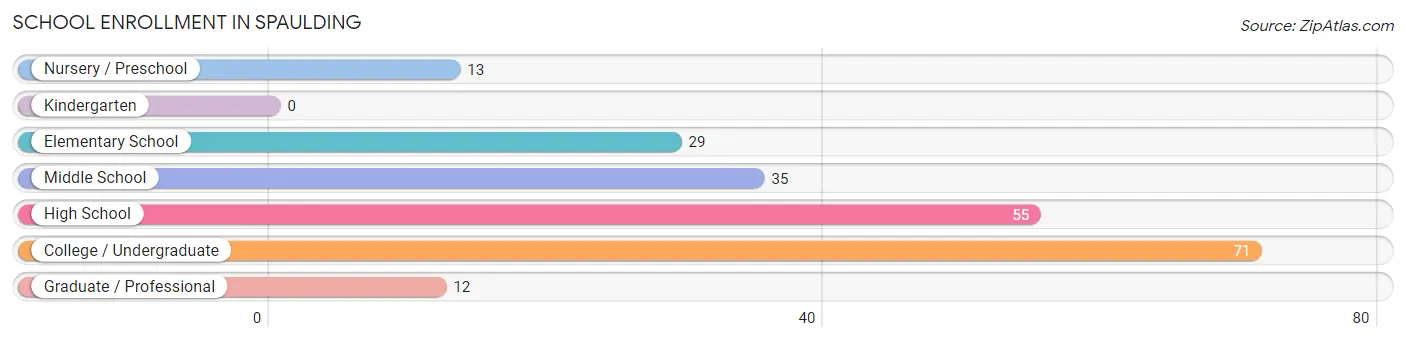
The most common levels of schooling among the 215 students in Spaulding are college / undergraduate (71 | 33.0%), high school (55 | 25.6%), and middle school (35 | 16.3%).
| School Level | # Students | % Students |
| Nursery / Preschool | 13 | 6.0% |
| Kindergarten | 0 | 0.0% |
| Elementary School | 29 | 13.5% |
| Middle School | 35 | 16.3% |
| High School | 55 | 25.6% |
| College / Undergraduate | 71 | 33.0% |
| Graduate / Professional | 12 | 5.6% |
| Total | 215 | 100.0% |
School Enrollment by Age by Funding Source in Spaulding
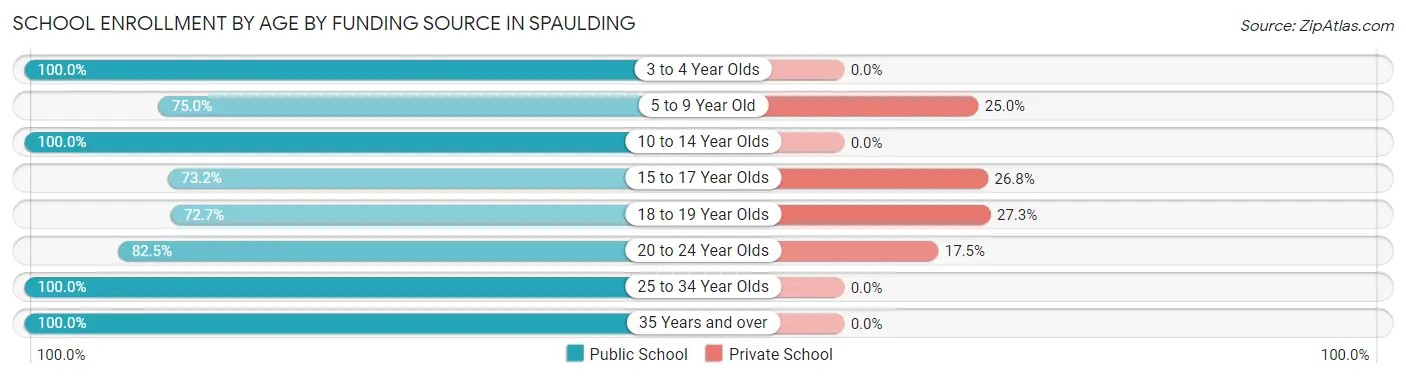
Out of a total of 215 students who are enrolled in schools in Spaulding, 33 (15.3%) attend a private institution, while the remaining 182 (84.7%) are enrolled in public schools. The age group of 18 to 19 year olds has the highest likelihood of being enrolled in private schools, with 3 (27.3% in the age bracket) enrolled. Conversely, the age group of 3 to 4 year olds has the lowest likelihood of being enrolled in a private school, with 13 (100.0% in the age bracket) attending a public institution.
| Age Bracket | Public School | Private School |
| 3 to 4 Year Olds | 13 (100.0%) | 0 (0.0%) |
| 5 to 9 Year Old | 15 (75.0%) | 5 (25.0%) |
| 10 to 14 Year Olds | 46 (100.0%) | 0 (0.0%) |
| 15 to 17 Year Olds | 41 (73.2%) | 15 (26.8%) |
| 18 to 19 Year Olds | 8 (72.7%) | 3 (27.3%) |
| 20 to 24 Year Olds | 47 (82.5%) | 10 (17.5%) |
| 25 to 34 Year Olds | 9 (100.0%) | 0 (0.0%) |
| 35 Years and over | 3 (100.0%) | 0 (0.0%) |
| Total | 182 (84.7%) | 33 (15.3%) |
Educational Attainment by Field of Study in Spaulding
Business (53 | 21.5%), science & technology (34 | 13.8%), social sciences (33 | 13.4%), bio, nature & agricultural (26 | 10.5%), and psychology (22 | 8.9%) are the most common fields of study among 247 individuals in Spaulding who have obtained a bachelor's degree or higher.
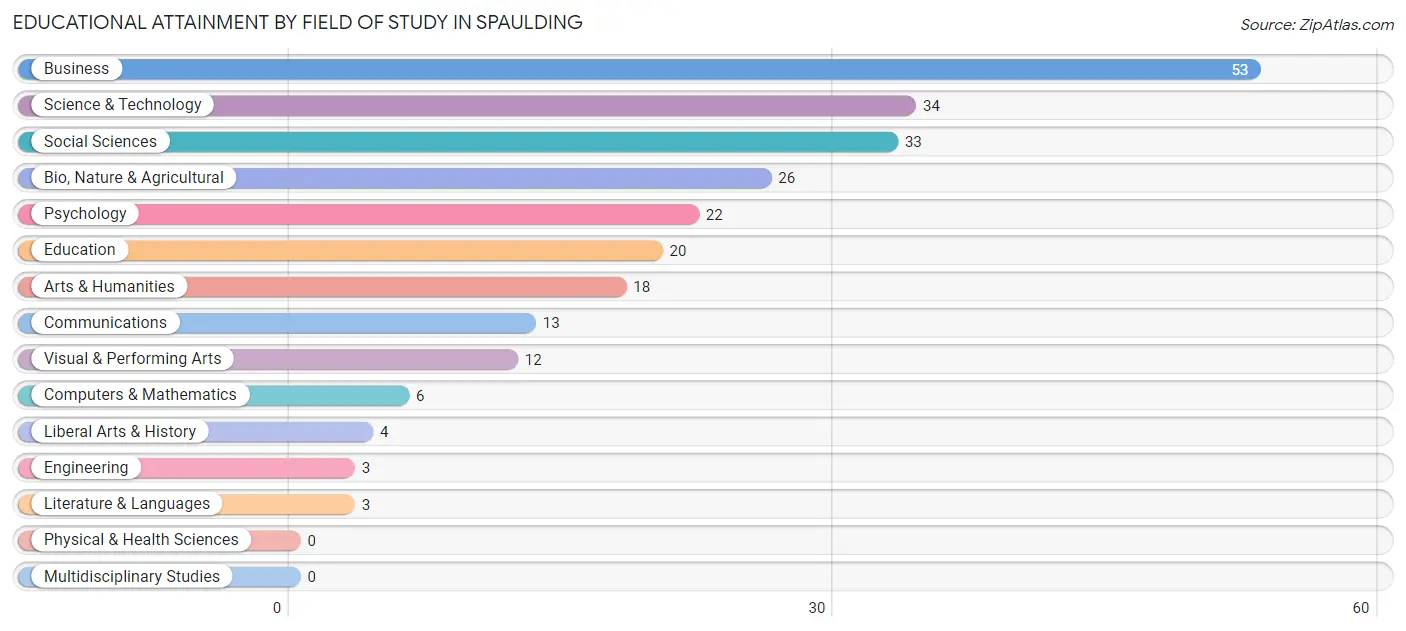
| Field of Study | # Graduates | % Graduates |
| Computers & Mathematics | 6 | 2.4% |
| Bio, Nature & Agricultural | 26 | 10.5% |
| Physical & Health Sciences | 0 | 0.0% |
| Psychology | 22 | 8.9% |
| Social Sciences | 33 | 13.4% |
| Engineering | 3 | 1.2% |
| Multidisciplinary Studies | 0 | 0.0% |
| Science & Technology | 34 | 13.8% |
| Business | 53 | 21.5% |
| Education | 20 | 8.1% |
| Literature & Languages | 3 | 1.2% |
| Liberal Arts & History | 4 | 1.6% |
| Visual & Performing Arts | 12 | 4.9% |
| Communications | 13 | 5.3% |
| Arts & Humanities | 18 | 7.3% |
| Total | 247 | 100.0% |
Transportation & Commute in Spaulding
Vehicle Availability by Sex in Spaulding
The most prevalent vehicle ownership categories in Spaulding are males with 3 vehicles (98, accounting for 35.1%) and females with 3 vehicles (90, making up 39.5%).
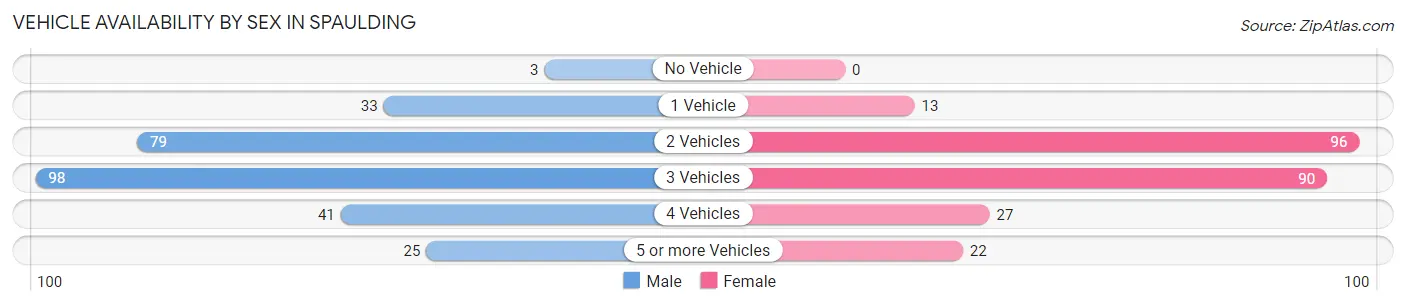
| Vehicles Available | Male | Female |
| No Vehicle | 3 (1.1%) | 0 (0.0%) |
| 1 Vehicle | 33 (11.8%) | 13 (5.2%) |
| 2 Vehicles | 79 (28.3%) | 96 (38.7%) |
| 3 Vehicles | 98 (35.1%) | 90 (36.3%) |
| 4 Vehicles | 41 (14.7%) | 27 (10.9%) |
| 5 or more Vehicles | 25 (9.0%) | 22 (8.9%) |
| Total | 279 (100.0%) | 248 (100.0%) |
Commute Time in Spaulding
The most frequently occuring commute durations in Spaulding are 20 to 24 minutes (199 commuters, 44.0%), 15 to 19 minutes (97 commuters, 21.5%), and 10 to 14 minutes (50 commuters, 11.1%).
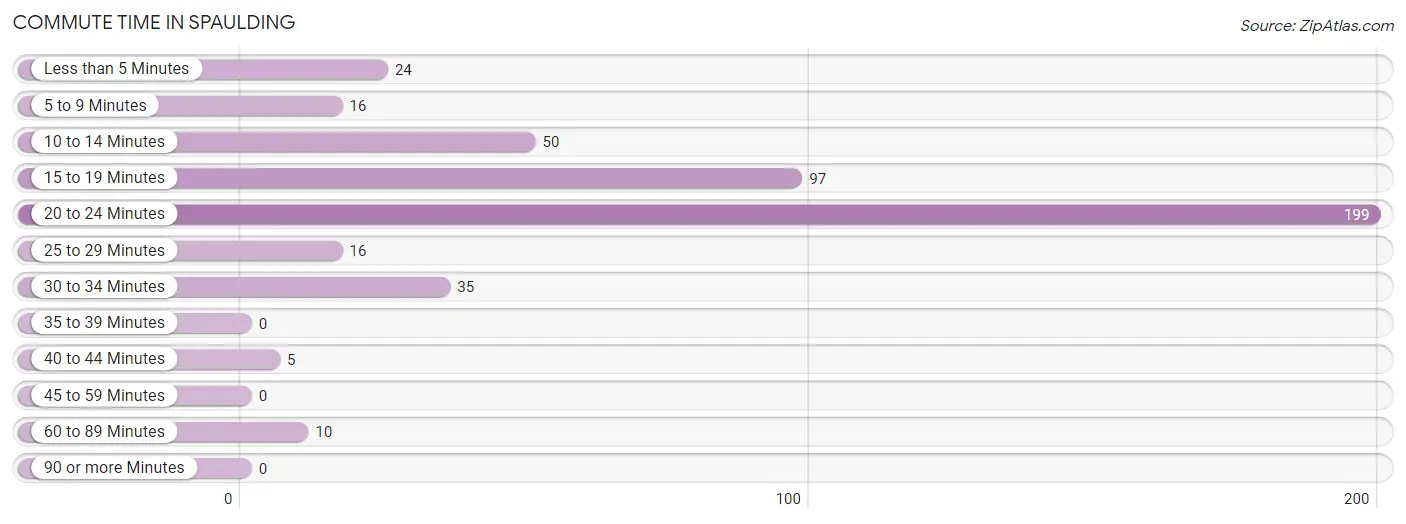
| Commute Time | # Commuters | % Commuters |
| Less than 5 Minutes | 24 | 5.3% |
| 5 to 9 Minutes | 16 | 3.5% |
| 10 to 14 Minutes | 50 | 11.1% |
| 15 to 19 Minutes | 97 | 21.5% |
| 20 to 24 Minutes | 199 | 44.0% |
| 25 to 29 Minutes | 16 | 3.5% |
| 30 to 34 Minutes | 35 | 7.7% |
| 35 to 39 Minutes | 0 | 0.0% |
| 40 to 44 Minutes | 5 | 1.1% |
| 45 to 59 Minutes | 0 | 0.0% |
| 60 to 89 Minutes | 10 | 2.2% |
| 90 or more Minutes | 0 | 0.0% |
Commute Time by Sex in Spaulding
The most common commute times in Spaulding are 20 to 24 minutes (112 commuters, 43.4%) for males and 20 to 24 minutes (87 commuters, 44.9%) for females.
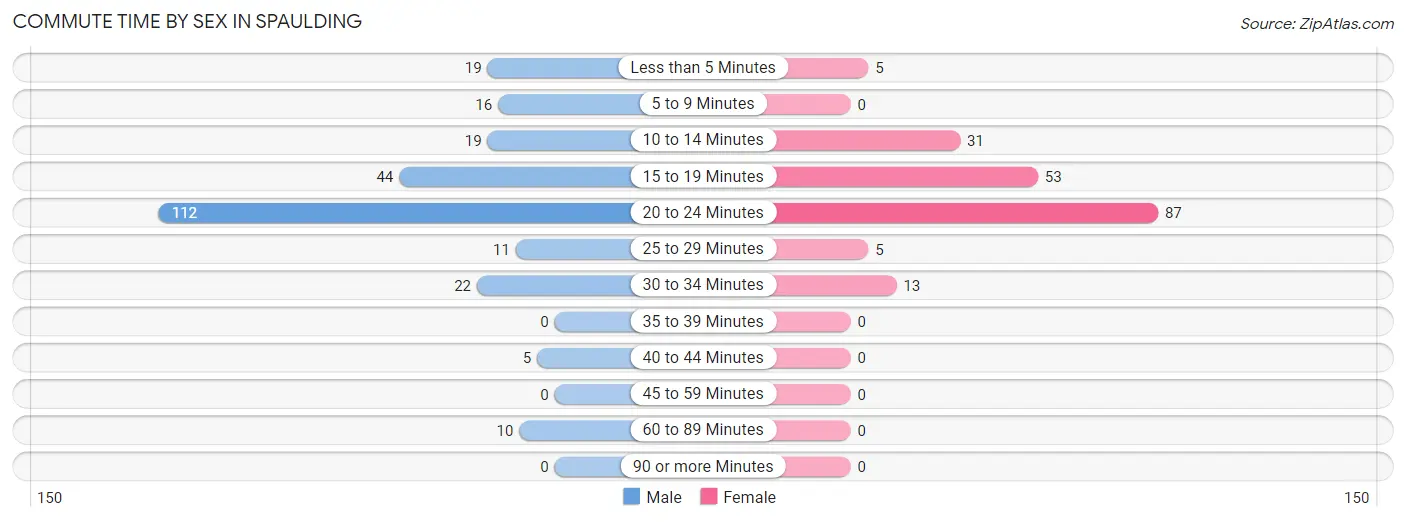
| Commute Time | Male | Female |
| Less than 5 Minutes | 19 (7.4%) | 5 (2.6%) |
| 5 to 9 Minutes | 16 (6.2%) | 0 (0.0%) |
| 10 to 14 Minutes | 19 (7.4%) | 31 (16.0%) |
| 15 to 19 Minutes | 44 (17.1%) | 53 (27.3%) |
| 20 to 24 Minutes | 112 (43.4%) | 87 (44.9%) |
| 25 to 29 Minutes | 11 (4.3%) | 5 (2.6%) |
| 30 to 34 Minutes | 22 (8.5%) | 13 (6.7%) |
| 35 to 39 Minutes | 0 (0.0%) | 0 (0.0%) |
| 40 to 44 Minutes | 5 (1.9%) | 0 (0.0%) |
| 45 to 59 Minutes | 0 (0.0%) | 0 (0.0%) |
| 60 to 89 Minutes | 10 (3.9%) | 0 (0.0%) |
| 90 or more Minutes | 0 (0.0%) | 0 (0.0%) |
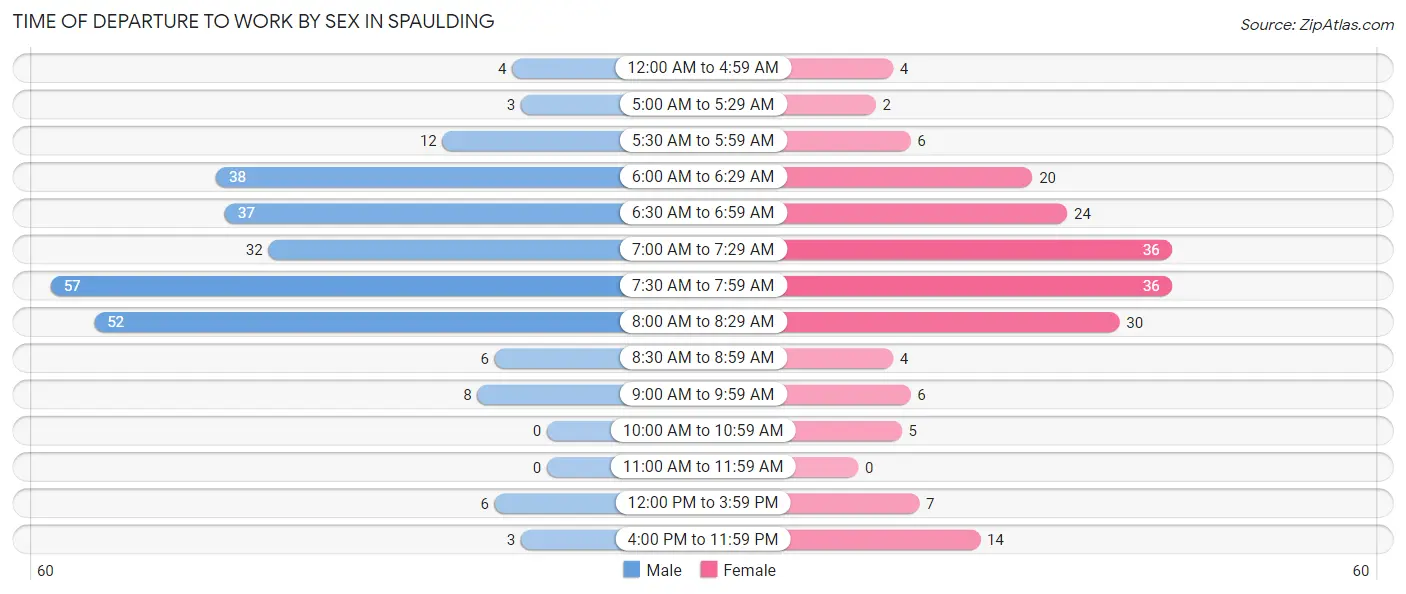
Time of Departure to Work by Sex in Spaulding
The most frequent times of departure to work in Spaulding are 7:30 AM to 7:59 AM (57, 22.1%) for males and 7:00 AM to 7:29 AM (36, 18.6%) for females.
| Time of Departure | Male | Female |
| 12:00 AM to 4:59 AM | 4 (1.5%) | 4 (2.1%) |
| 5:00 AM to 5:29 AM | 3 (1.2%) | 2 (1.0%) |
| 5:30 AM to 5:59 AM | 12 (4.6%) | 6 (3.1%) |
| 6:00 AM to 6:29 AM | 38 (14.7%) | 20 (10.3%) |
| 6:30 AM to 6:59 AM | 37 (14.3%) | 24 (12.4%) |
| 7:00 AM to 7:29 AM | 32 (12.4%) | 36 (18.6%) |
| 7:30 AM to 7:59 AM | 57 (22.1%) | 36 (18.6%) |
| 8:00 AM to 8:29 AM | 52 (20.2%) | 30 (15.5%) |
| 8:30 AM to 8:59 AM | 6 (2.3%) | 4 (2.1%) |
| 9:00 AM to 9:59 AM | 8 (3.1%) | 6 (3.1%) |
| 10:00 AM to 10:59 AM | 0 (0.0%) | 5 (2.6%) |
| 11:00 AM to 11:59 AM | 0 (0.0%) | 0 (0.0%) |
| 12:00 PM to 3:59 PM | 6 (2.3%) | 7 (3.6%) |
| 4:00 PM to 11:59 PM | 3 (1.2%) | 14 (7.2%) |
| Total | 258 (100.0%) | 194 (100.0%) |
Housing Occupancy in Spaulding
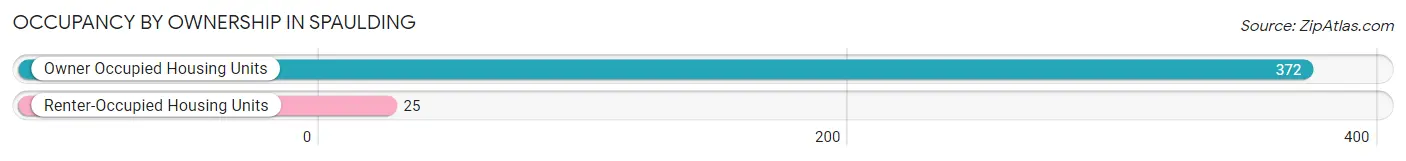
Occupancy by Ownership in Spaulding
Of the total 397 dwellings in Spaulding, owner-occupied units account for 372 (93.7%), while renter-occupied units make up 25 (6.3%).
| Occupancy | # Housing Units | % Housing Units |
| Owner Occupied Housing Units | 372 | 93.7% |
| Renter-Occupied Housing Units | 25 | 6.3% |
| Total Occupied Housing Units | 397 | 100.0% |
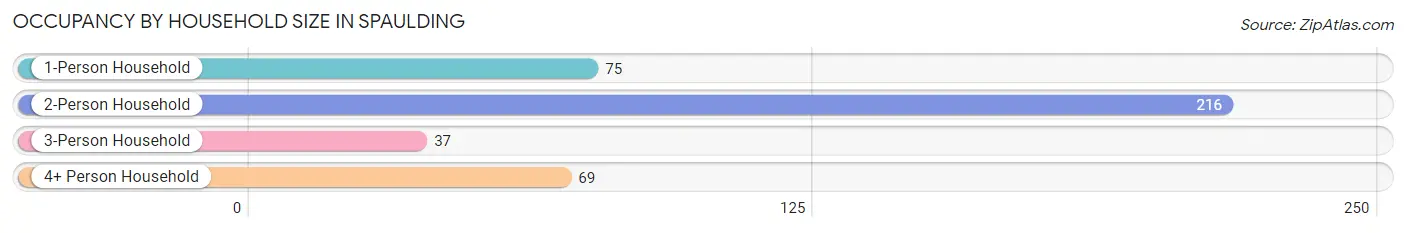
Occupancy by Household Size in Spaulding
| Household Size | # Housing Units | % Housing Units |
| 1-Person Household | 75 | 18.9% |
| 2-Person Household | 216 | 54.4% |
| 3-Person Household | 37 | 9.3% |
| 4+ Person Household | 69 | 17.4% |
| Total Housing Units | 397 | 100.0% |
Occupancy by Ownership by Household Size in Spaulding
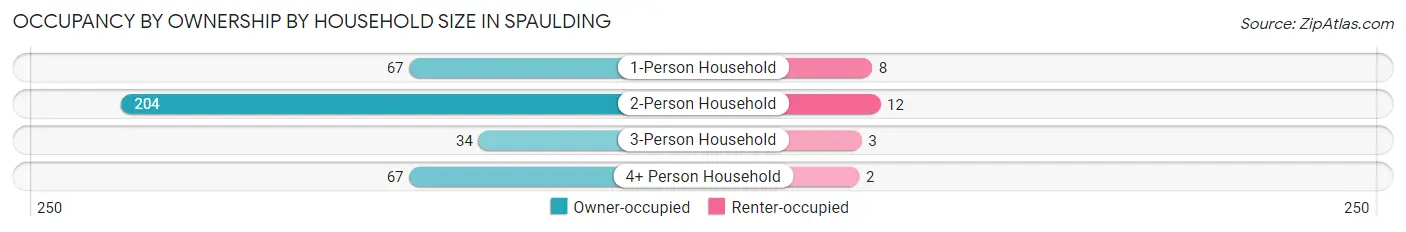
| Household Size | Owner-occupied | Renter-occupied |
| 1-Person Household | 67 (89.3%) | 8 (10.7%) |
| 2-Person Household | 204 (94.4%) | 12 (5.6%) |
| 3-Person Household | 34 (91.9%) | 3 (8.1%) |
| 4+ Person Household | 67 (97.1%) | 2 (2.9%) |
| Total Housing Units | 372 (93.7%) | 25 (6.3%) |
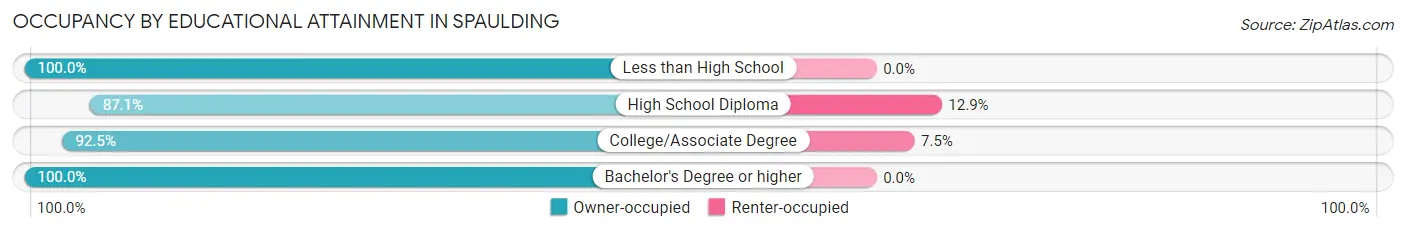
Occupancy by Educational Attainment in Spaulding
| Household Size | Owner-occupied | Renter-occupied |
| Less than High School | 6 (100.0%) | 0 (0.0%) |
| High School Diploma | 101 (87.1%) | 15 (12.9%) |
| College/Associate Degree | 123 (92.5%) | 10 (7.5%) |
| Bachelor's Degree or higher | 142 (100.0%) | 0 (0.0%) |
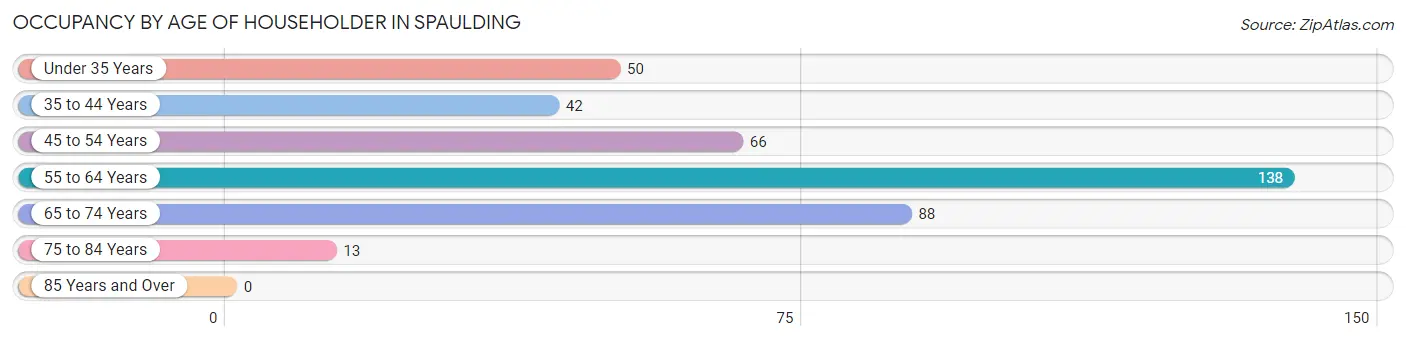
Occupancy by Age of Householder in Spaulding
| Age Bracket | # Households | % Households |
| Under 35 Years | 50 | 12.6% |
| 35 to 44 Years | 42 | 10.6% |
| 45 to 54 Years | 66 | 16.6% |
| 55 to 64 Years | 138 | 34.8% |
| 65 to 74 Years | 88 | 22.2% |
| 75 to 84 Years | 13 | 3.3% |
| 85 Years and Over | 0 | 0.0% |
| Total | 397 | 100.0% |
Housing Finances in Spaulding
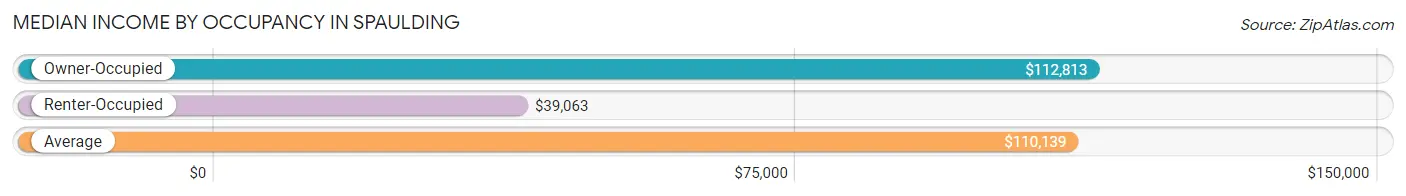
Median Income by Occupancy in Spaulding
| Occupancy Type | # Households | Median Income |
| Owner-Occupied | 372 (93.7%) | $112,813 |
| Renter-Occupied | 25 (6.3%) | $39,063 |
| Average | 397 (100.0%) | $110,139 |
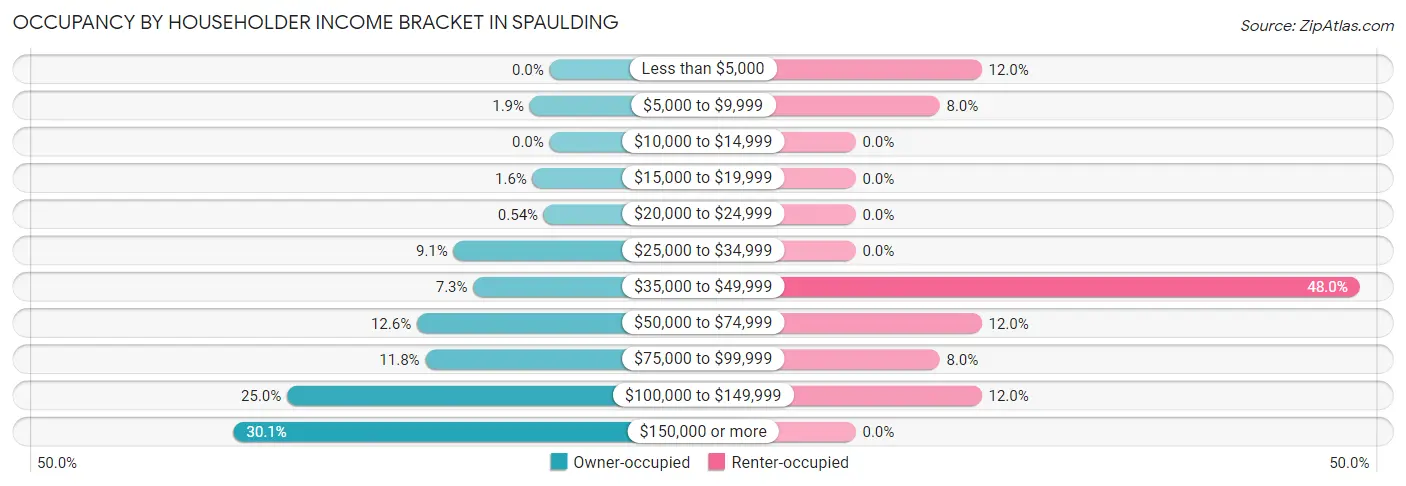
Occupancy by Householder Income Bracket in Spaulding
| Income Bracket | Owner-occupied | Renter-occupied |
| Less than $5,000 | 0 (0.0%) | 3 (12.0%) |
| $5,000 to $9,999 | 7 (1.9%) | 2 (8.0%) |
| $10,000 to $14,999 | 0 (0.0%) | 0 (0.0%) |
| $15,000 to $19,999 | 6 (1.6%) | 0 (0.0%) |
| $20,000 to $24,999 | 2 (0.5%) | 0 (0.0%) |
| $25,000 to $34,999 | 34 (9.1%) | 0 (0.0%) |
| $35,000 to $49,999 | 27 (7.3%) | 12 (48.0%) |
| $50,000 to $74,999 | 47 (12.6%) | 3 (12.0%) |
| $75,000 to $99,999 | 44 (11.8%) | 2 (8.0%) |
| $100,000 to $149,999 | 93 (25.0%) | 3 (12.0%) |
| $150,000 or more | 112 (30.1%) | 0 (0.0%) |
| Total | 372 (100.0%) | 25 (100.0%) |
Monthly Housing Cost Tiers in Spaulding
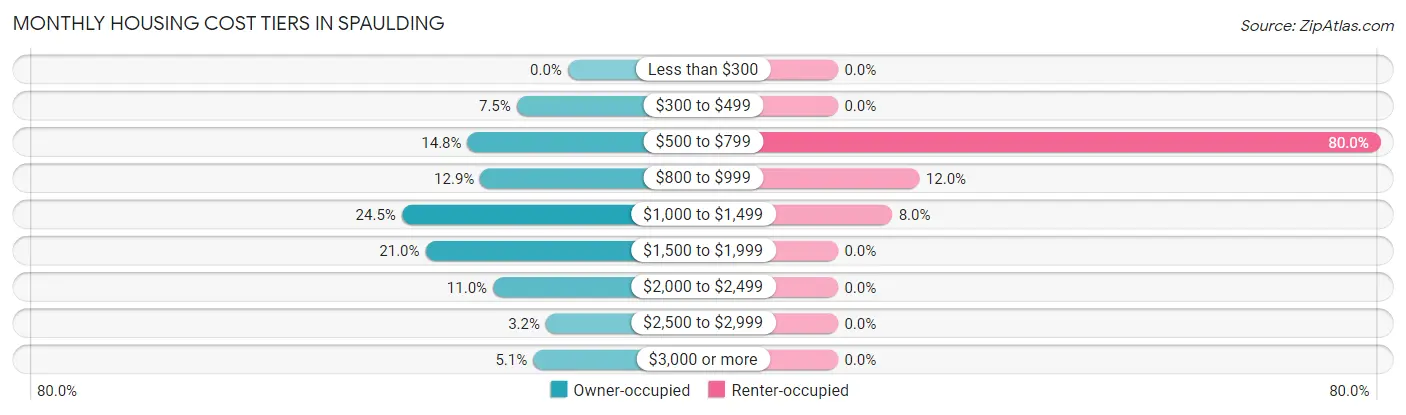
| Monthly Cost | Owner-occupied | Renter-occupied |
| Less than $300 | 0 (0.0%) | 0 (0.0%) |
| $300 to $499 | 28 (7.5%) | 0 (0.0%) |
| $500 to $799 | 55 (14.8%) | 20 (80.0%) |
| $800 to $999 | 48 (12.9%) | 3 (12.0%) |
| $1,000 to $1,499 | 91 (24.5%) | 2 (8.0%) |
| $1,500 to $1,999 | 78 (21.0%) | 0 (0.0%) |
| $2,000 to $2,499 | 41 (11.0%) | 0 (0.0%) |
| $2,500 to $2,999 | 12 (3.2%) | 0 (0.0%) |
| $3,000 or more | 19 (5.1%) | 0 (0.0%) |
| Total | 372 (100.0%) | 25 (100.0%) |
Physical Housing Characteristics in Spaulding
Housing Structures in Spaulding
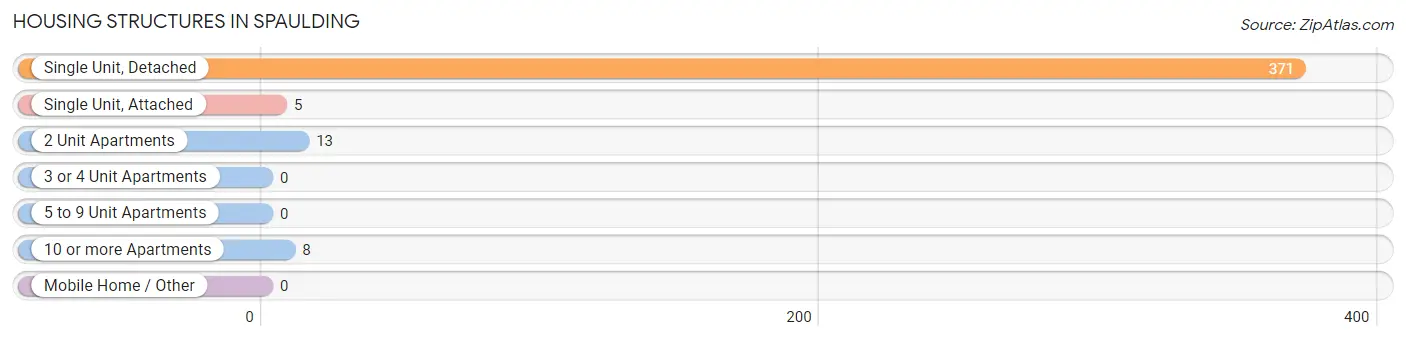
| Structure Type | # Housing Units | % Housing Units |
| Single Unit, Detached | 371 | 93.4% |
| Single Unit, Attached | 5 | 1.3% |
| 2 Unit Apartments | 13 | 3.3% |
| 3 or 4 Unit Apartments | 0 | 0.0% |
| 5 to 9 Unit Apartments | 0 | 0.0% |
| 10 or more Apartments | 8 | 2.0% |
| Mobile Home / Other | 0 | 0.0% |
| Total | 397 | 100.0% |
Housing Structures by Occupancy in Spaulding
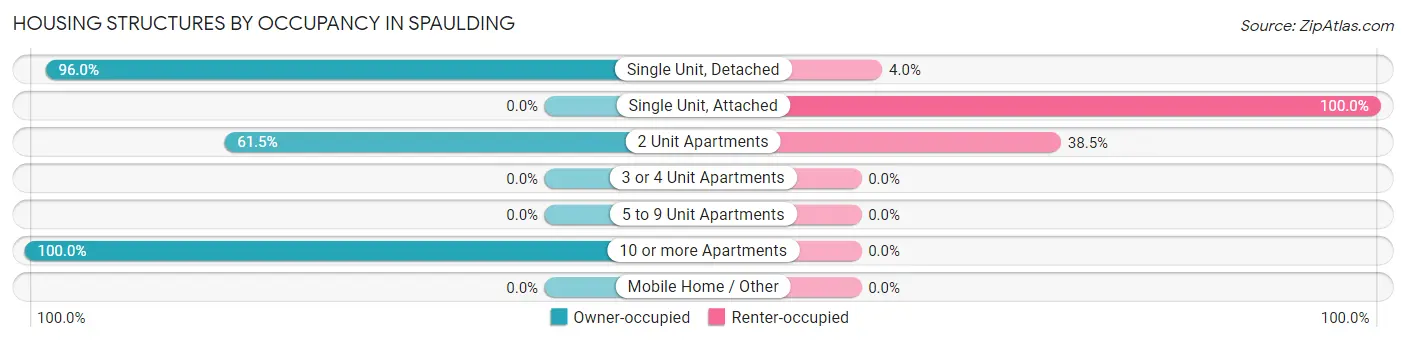
| Structure Type | Owner-occupied | Renter-occupied |
| Single Unit, Detached | 356 (96.0%) | 15 (4.0%) |
| Single Unit, Attached | 0 (0.0%) | 5 (100.0%) |
| 2 Unit Apartments | 8 (61.5%) | 5 (38.5%) |
| 3 or 4 Unit Apartments | 0 (0.0%) | 0 (0.0%) |
| 5 to 9 Unit Apartments | 0 (0.0%) | 0 (0.0%) |
| 10 or more Apartments | 8 (100.0%) | 0 (0.0%) |
| Mobile Home / Other | 0 (0.0%) | 0 (0.0%) |
| Total | 372 (93.7%) | 25 (6.3%) |
Housing Structures by Number of Rooms in Spaulding
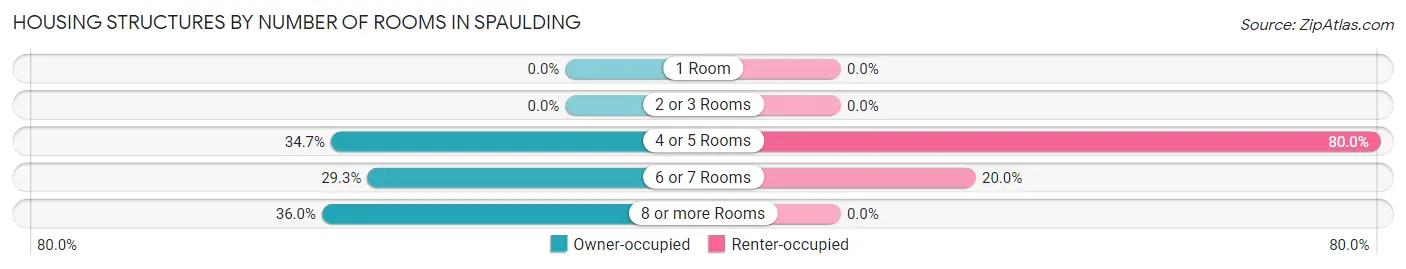
| Number of Rooms | Owner-occupied | Renter-occupied |
| 1 Room | 0 (0.0%) | 0 (0.0%) |
| 2 or 3 Rooms | 0 (0.0%) | 0 (0.0%) |
| 4 or 5 Rooms | 129 (34.7%) | 20 (80.0%) |
| 6 or 7 Rooms | 109 (29.3%) | 5 (20.0%) |
| 8 or more Rooms | 134 (36.0%) | 0 (0.0%) |
| Total | 372 (100.0%) | 25 (100.0%) |
Housing Structure by Heating Type in Spaulding
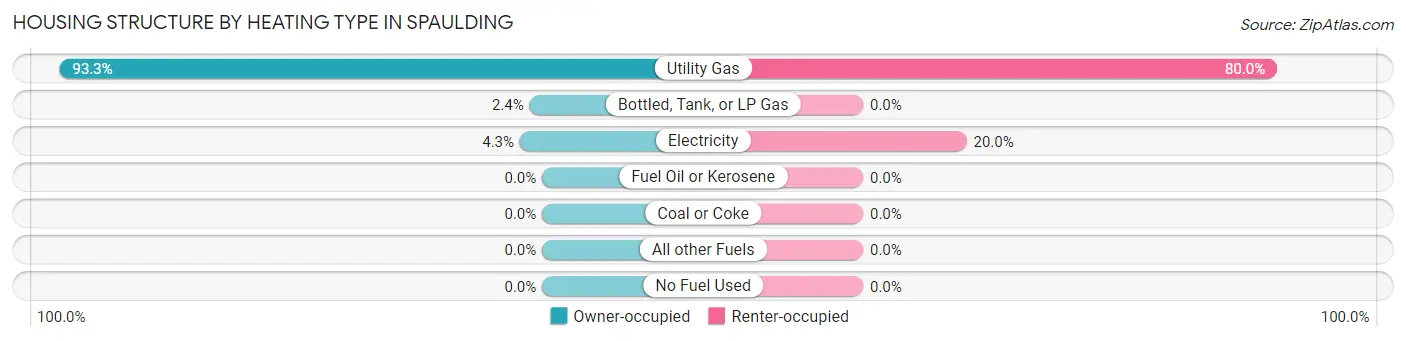
| Heating Type | Owner-occupied | Renter-occupied |
| Utility Gas | 347 (93.3%) | 20 (80.0%) |
| Bottled, Tank, or LP Gas | 9 (2.4%) | 0 (0.0%) |
| Electricity | 16 (4.3%) | 5 (20.0%) |
| Fuel Oil or Kerosene | 0 (0.0%) | 0 (0.0%) |
| Coal or Coke | 0 (0.0%) | 0 (0.0%) |
| All other Fuels | 0 (0.0%) | 0 (0.0%) |
| No Fuel Used | 0 (0.0%) | 0 (0.0%) |
| Total | 372 (100.0%) | 25 (100.0%) |
Household Vehicle Usage in Spaulding
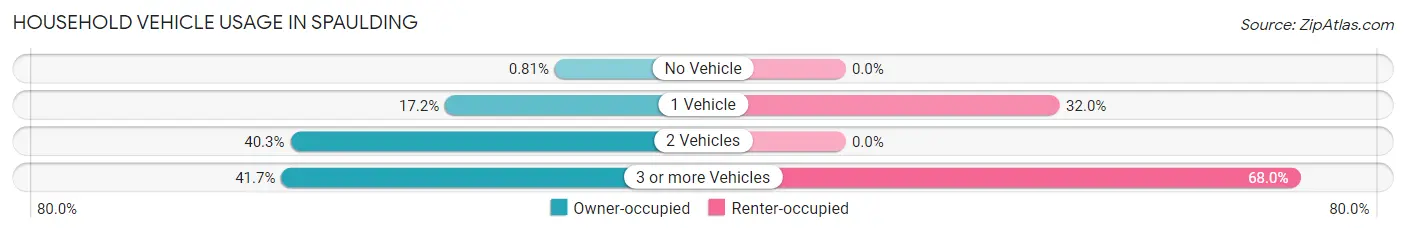
| Vehicles per Household | Owner-occupied | Renter-occupied |
| No Vehicle | 3 (0.8%) | 0 (0.0%) |
| 1 Vehicle | 64 (17.2%) | 8 (32.0%) |
| 2 Vehicles | 150 (40.3%) | 0 (0.0%) |
| 3 or more Vehicles | 155 (41.7%) | 17 (68.0%) |
| Total | 372 (100.0%) | 25 (100.0%) |
Real Estate & Mortgages in Spaulding
Real Estate and Mortgage Overview in Spaulding
| Characteristic | Without Mortgage | With Mortgage |
| Housing Units | 110 | 262 |
| Median Property Value | $208,600 | $211,700 |
| Median Household Income | $88,750 | $91 |
| Monthly Housing Costs | $658 | $19 |
| Real Estate Taxes | $3,333 | $5 |
Property Value by Mortgage Status in Spaulding
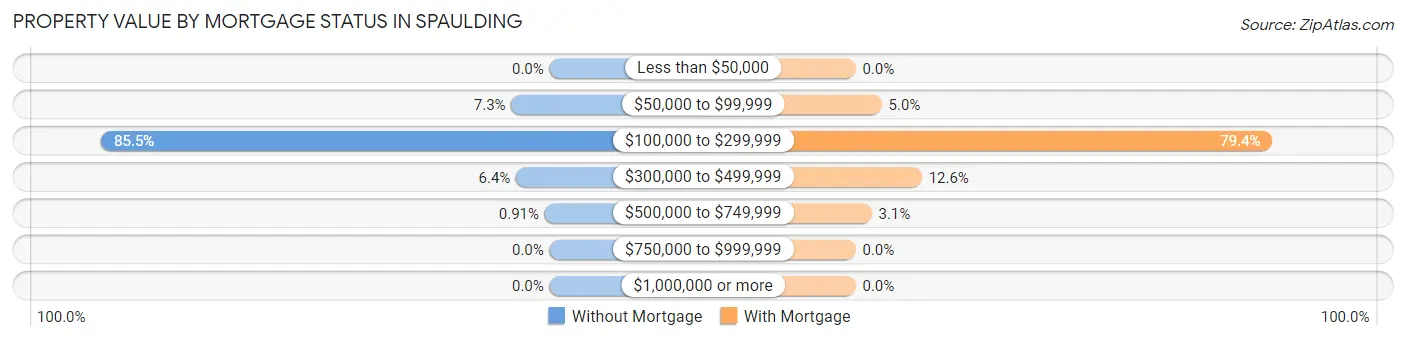
| Property Value | Without Mortgage | With Mortgage |
| Less than $50,000 | 0 (0.0%) | 0 (0.0%) |
| $50,000 to $99,999 | 8 (7.3%) | 13 (5.0%) |
| $100,000 to $299,999 | 94 (85.5%) | 208 (79.4%) |
| $300,000 to $499,999 | 7 (6.4%) | 33 (12.6%) |
| $500,000 to $749,999 | 1 (0.9%) | 8 (3.0%) |
| $750,000 to $999,999 | 0 (0.0%) | 0 (0.0%) |
| $1,000,000 or more | 0 (0.0%) | 0 (0.0%) |
| Total | 110 (100.0%) | 262 (100.0%) |
Household Income by Mortgage Status in Spaulding
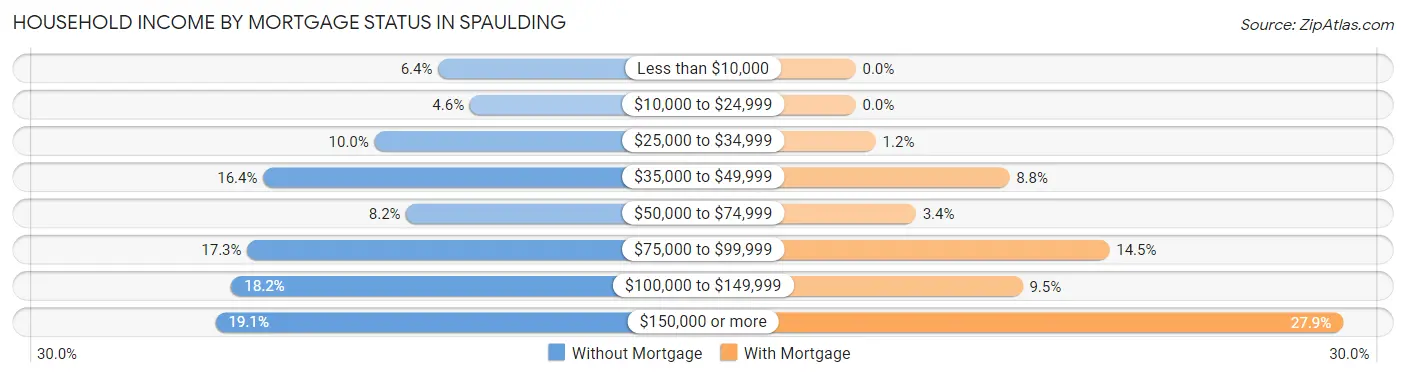
| Household Income | Without Mortgage | With Mortgage |
| Less than $10,000 | 7 (6.4%) | 0 (0.0%) |
| $10,000 to $24,999 | 5 (4.5%) | 0 (0.0%) |
| $25,000 to $34,999 | 11 (10.0%) | 3 (1.1%) |
| $35,000 to $49,999 | 18 (16.4%) | 23 (8.8%) |
| $50,000 to $74,999 | 9 (8.2%) | 9 (3.4%) |
| $75,000 to $99,999 | 19 (17.3%) | 38 (14.5%) |
| $100,000 to $149,999 | 20 (18.2%) | 25 (9.5%) |
| $150,000 or more | 21 (19.1%) | 73 (27.9%) |
| Total | 110 (100.0%) | 262 (100.0%) |
Property Value to Household Income Ratio in Spaulding
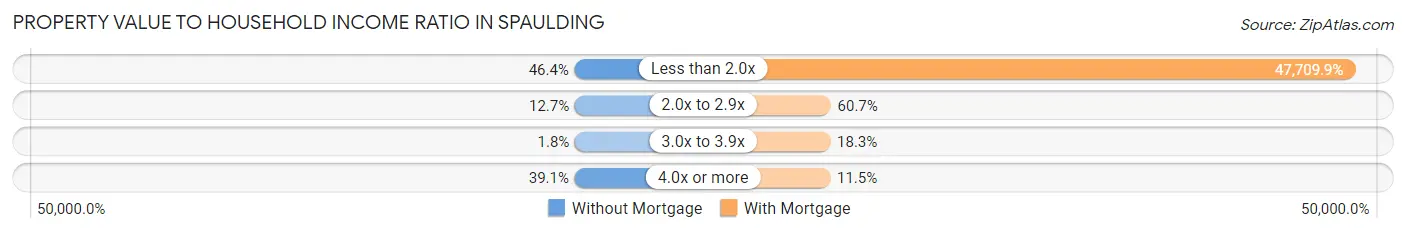
| Value-to-Income Ratio | Without Mortgage | With Mortgage |
| Less than 2.0x | 51 (46.4%) | 125,000 (47,709.9%) |
| 2.0x to 2.9x | 14 (12.7%) | 159 (60.7%) |
| 3.0x to 3.9x | 2 (1.8%) | 48 (18.3%) |
| 4.0x or more | 43 (39.1%) | 30 (11.5%) |
| Total | 110 (100.0%) | 262 (100.0%) |
Real Estate Taxes by Mortgage Status in Spaulding
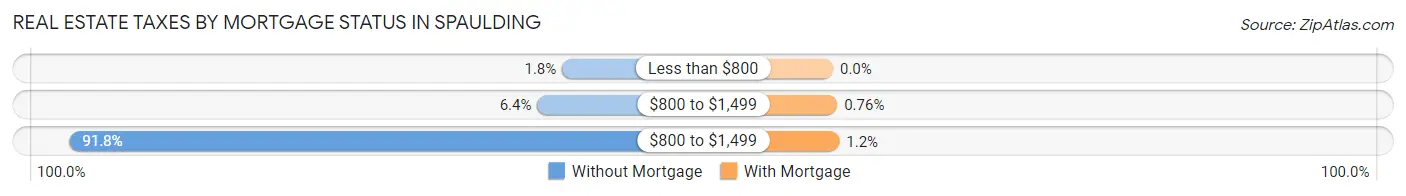
| Property Taxes | Without Mortgage | With Mortgage |
| Less than $800 | 2 (1.8%) | 0 (0.0%) |
| $800 to $1,499 | 7 (6.4%) | 2 (0.8%) |
| $800 to $1,499 | 101 (91.8%) | 3 (1.1%) |
| Total | 110 (100.0%) | 262 (100.0%) |
Health & Disability in Spaulding
Health Insurance Coverage by Age in Spaulding
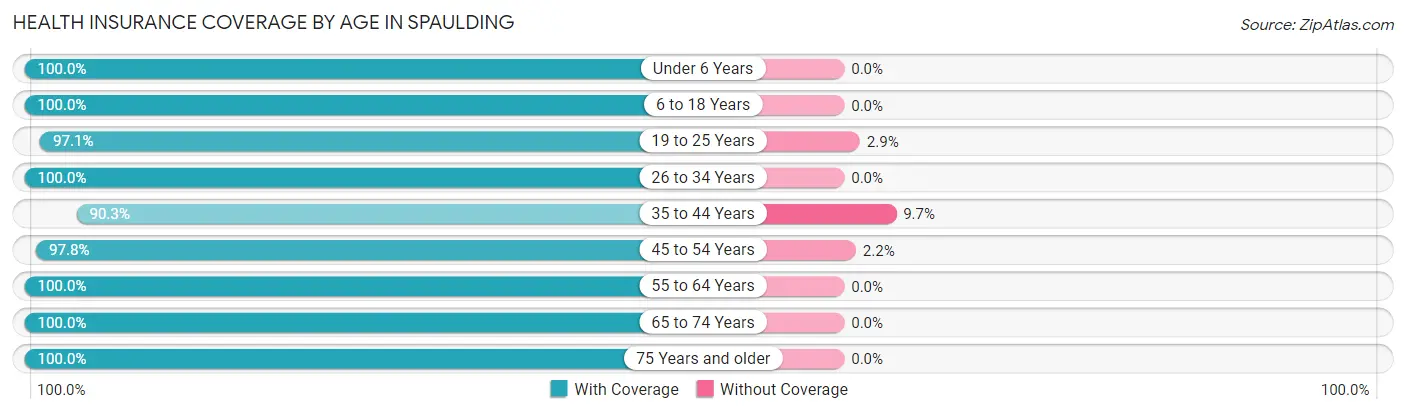
| Age Bracket | With Coverage | Without Coverage |
| Under 6 Years | 16 (100.0%) | 0 (0.0%) |
| 6 to 18 Years | 133 (100.0%) | 0 (0.0%) |
| 19 to 25 Years | 100 (97.1%) | 3 (2.9%) |
| 26 to 34 Years | 70 (100.0%) | 0 (0.0%) |
| 35 to 44 Years | 84 (90.3%) | 9 (9.7%) |
| 45 to 54 Years | 136 (97.8%) | 3 (2.2%) |
| 55 to 64 Years | 195 (100.0%) | 0 (0.0%) |
| 65 to 74 Years | 174 (100.0%) | 0 (0.0%) |
| 75 Years and older | 42 (100.0%) | 0 (0.0%) |
| Total | 950 (98.5%) | 15 (1.5%) |
Health Insurance Coverage by Citizenship Status in Spaulding
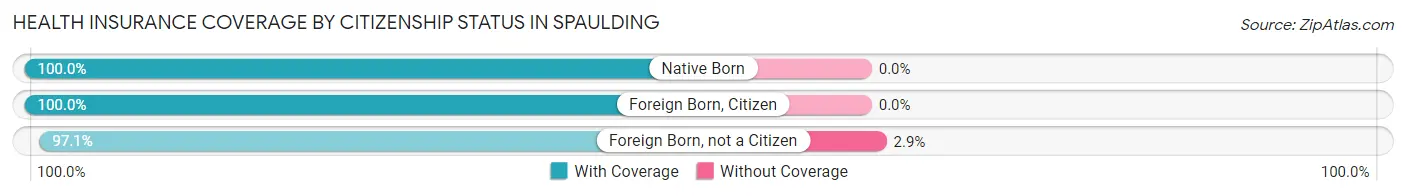
| Citizenship Status | With Coverage | Without Coverage |
| Native Born | 16 (100.0%) | 0 (0.0%) |
| Foreign Born, Citizen | 133 (100.0%) | 0 (0.0%) |
| Foreign Born, not a Citizen | 100 (97.1%) | 3 (2.9%) |
Health Insurance Coverage by Household Income in Spaulding
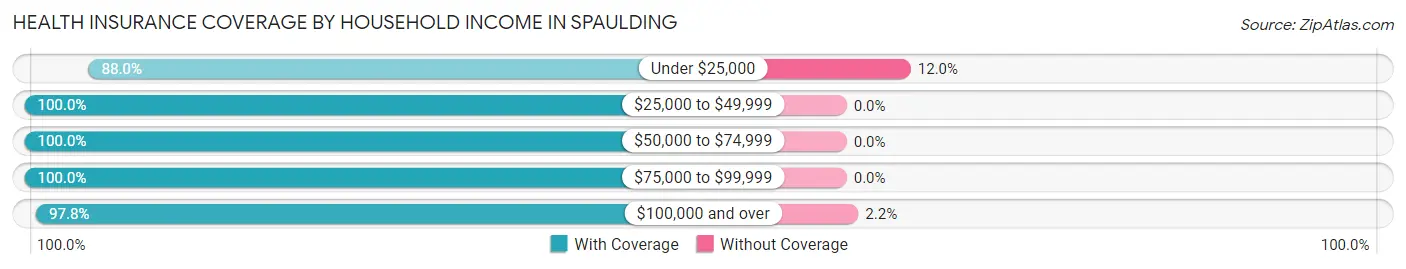
| Household Income | With Coverage | Without Coverage |
| Under $25,000 | 22 (88.0%) | 3 (12.0%) |
| $25,000 to $49,999 | 137 (100.0%) | 0 (0.0%) |
| $50,000 to $74,999 | 96 (100.0%) | 0 (0.0%) |
| $75,000 to $99,999 | 153 (100.0%) | 0 (0.0%) |
| $100,000 and over | 542 (97.8%) | 12 (2.2%) |
Public vs Private Health Insurance Coverage by Age in Spaulding
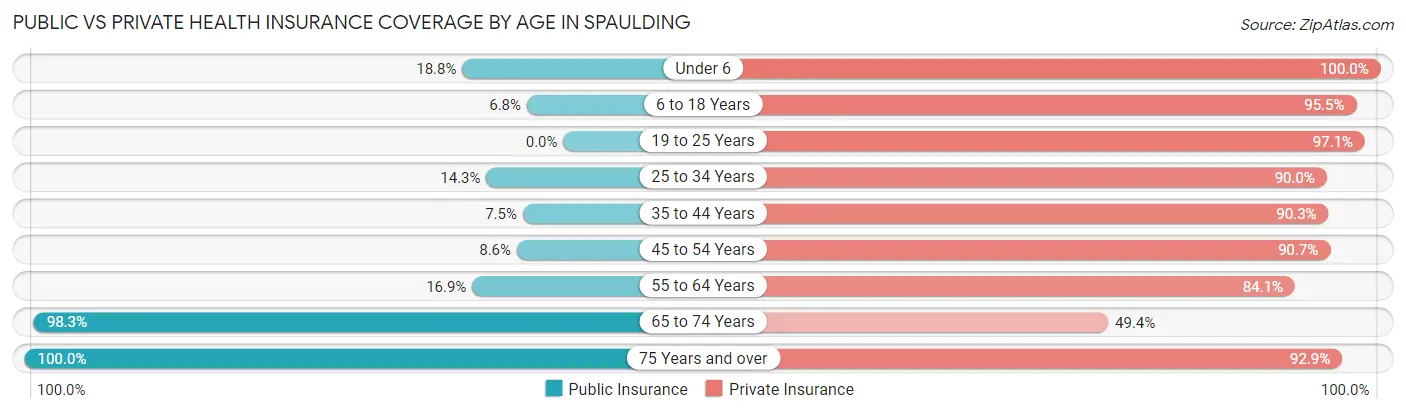
| Age Bracket | Public Insurance | Private Insurance |
| Under 6 | 3 (18.8%) | 16 (100.0%) |
| 6 to 18 Years | 9 (6.8%) | 127 (95.5%) |
| 19 to 25 Years | 0 (0.0%) | 100 (97.1%) |
| 25 to 34 Years | 10 (14.3%) | 63 (90.0%) |
| 35 to 44 Years | 7 (7.5%) | 84 (90.3%) |
| 45 to 54 Years | 12 (8.6%) | 126 (90.6%) |
| 55 to 64 Years | 33 (16.9%) | 164 (84.1%) |
| 65 to 74 Years | 171 (98.3%) | 86 (49.4%) |
| 75 Years and over | 42 (100.0%) | 39 (92.9%) |
| Total | 287 (29.7%) | 805 (83.4%) |
Disability Status by Sex by Age in Spaulding
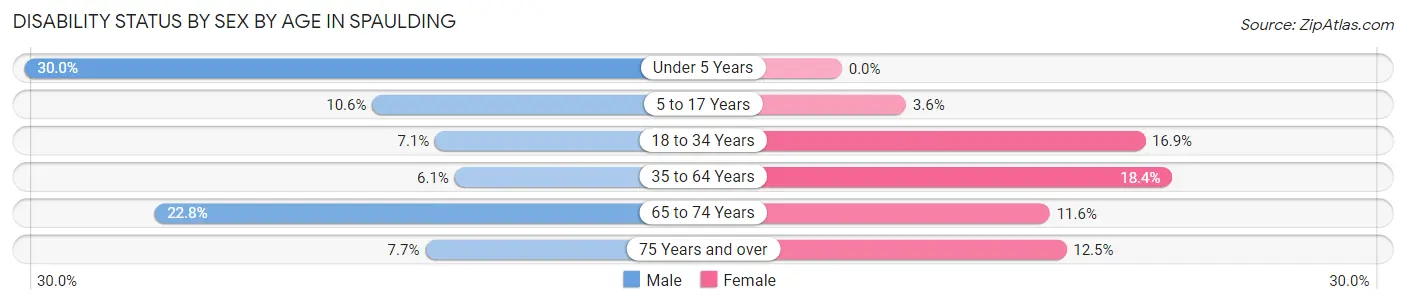
| Age Bracket | Male | Female |
| Under 5 Years | 3 (30.0%) | 0 (0.0%) |
| 5 to 17 Years | 5 (10.6%) | 3 (3.6%) |
| 18 to 34 Years | 7 (7.1%) | 13 (16.9%) |
| 35 to 64 Years | 13 (6.0%) | 39 (18.4%) |
| 65 to 74 Years | 18 (22.8%) | 11 (11.6%) |
| 75 Years and over | 2 (7.7%) | 2 (12.5%) |
Disability Class by Sex by Age in Spaulding
Disability Class: Hearing Difficulty
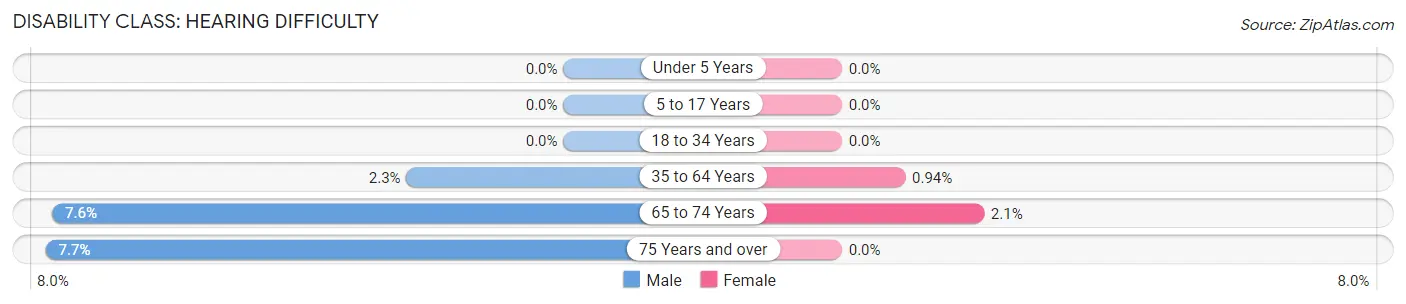
| Age Bracket | Male | Female |
| Under 5 Years | 0 (0.0%) | 0 (0.0%) |
| 5 to 17 Years | 0 (0.0%) | 0 (0.0%) |
| 18 to 34 Years | 0 (0.0%) | 0 (0.0%) |
| 35 to 64 Years | 5 (2.3%) | 2 (0.9%) |
| 65 to 74 Years | 6 (7.6%) | 2 (2.1%) |
| 75 Years and over | 2 (7.7%) | 0 (0.0%) |
Disability Class: Vision Difficulty
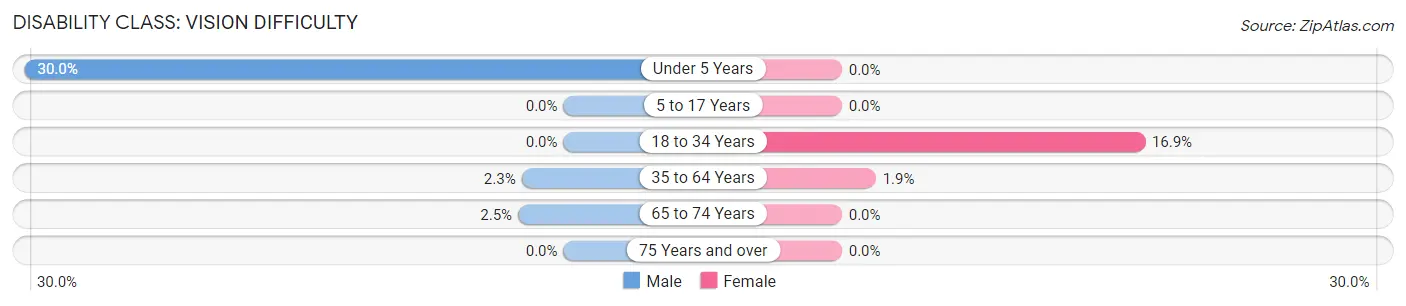
| Age Bracket | Male | Female |
| Under 5 Years | 3 (30.0%) | 0 (0.0%) |
| 5 to 17 Years | 0 (0.0%) | 0 (0.0%) |
| 18 to 34 Years | 0 (0.0%) | 13 (16.9%) |
| 35 to 64 Years | 5 (2.3%) | 4 (1.9%) |
| 65 to 74 Years | 2 (2.5%) | 0 (0.0%) |
| 75 Years and over | 0 (0.0%) | 0 (0.0%) |
Disability Class: Cognitive Difficulty
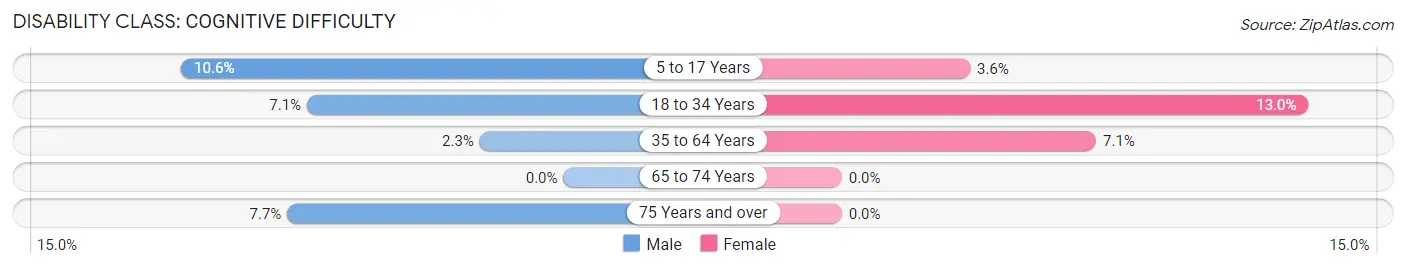
| Age Bracket | Male | Female |
| 5 to 17 Years | 5 (10.6%) | 3 (3.6%) |
| 18 to 34 Years | 7 (7.1%) | 10 (13.0%) |
| 35 to 64 Years | 5 (2.3%) | 15 (7.1%) |
| 65 to 74 Years | 0 (0.0%) | 0 (0.0%) |
| 75 Years and over | 2 (7.7%) | 0 (0.0%) |
Disability Class: Ambulatory Difficulty
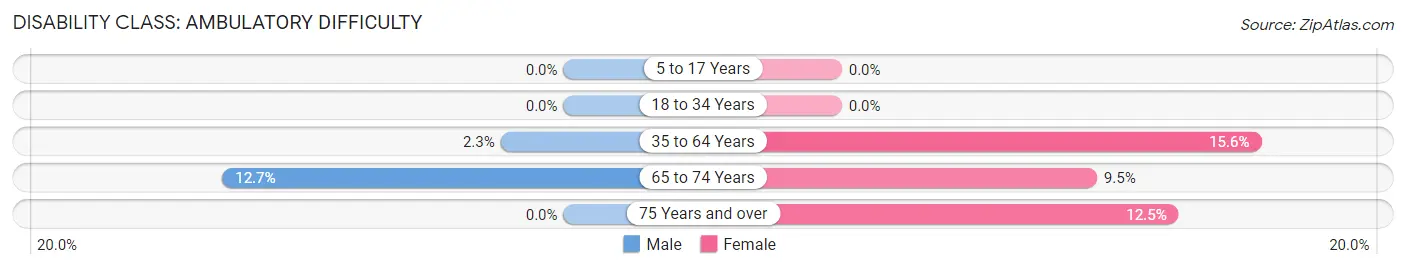
| Age Bracket | Male | Female |
| 5 to 17 Years | 0 (0.0%) | 0 (0.0%) |
| 18 to 34 Years | 0 (0.0%) | 0 (0.0%) |
| 35 to 64 Years | 5 (2.3%) | 33 (15.6%) |
| 65 to 74 Years | 10 (12.7%) | 9 (9.5%) |
| 75 Years and over | 0 (0.0%) | 2 (12.5%) |
Disability Class: Self-Care Difficulty
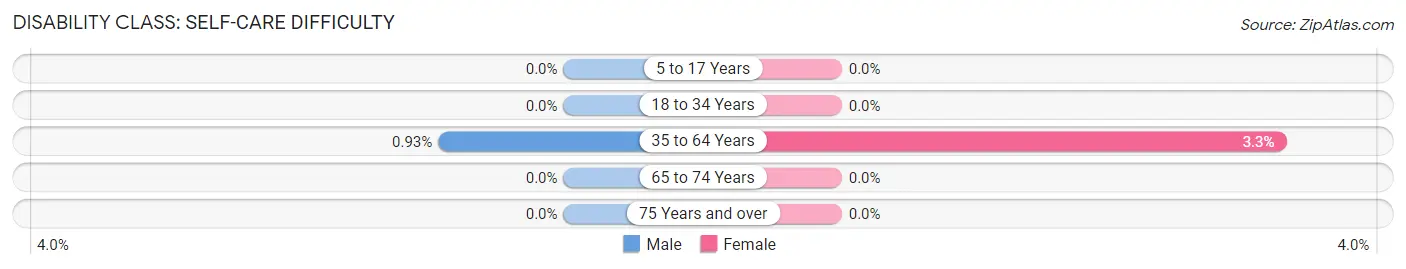
| Age Bracket | Male | Female |
| 5 to 17 Years | 0 (0.0%) | 0 (0.0%) |
| 18 to 34 Years | 0 (0.0%) | 0 (0.0%) |
| 35 to 64 Years | 2 (0.9%) | 7 (3.3%) |
| 65 to 74 Years | 0 (0.0%) | 0 (0.0%) |
| 75 Years and over | 0 (0.0%) | 0 (0.0%) |
Technology Access in Spaulding
Computing Device Access in Spaulding
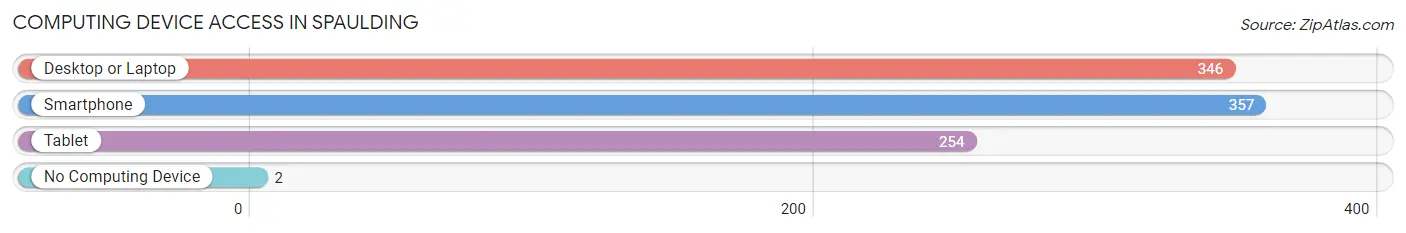
| Device Type | # Households | % Households |
| Desktop or Laptop | 346 | 87.2% |
| Smartphone | 357 | 89.9% |
| Tablet | 254 | 64.0% |
| No Computing Device | 2 | 0.5% |
| Total | 397 | 100.0% |
Internet Access in Spaulding
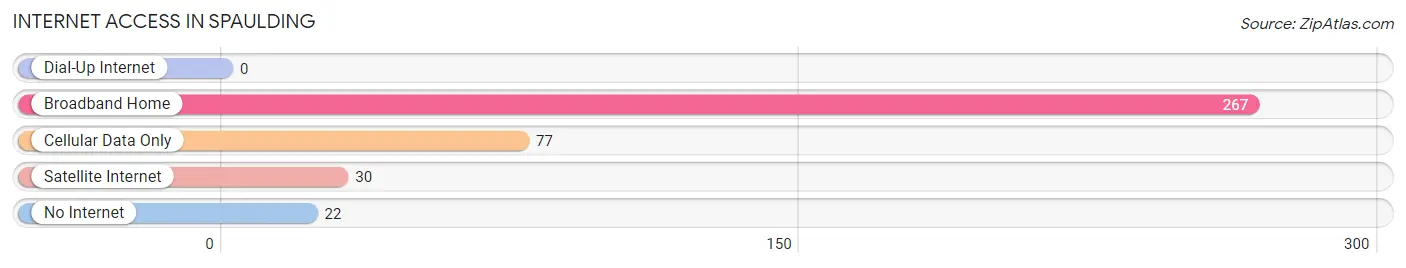
| Internet Type | # Households | % Households |
| Dial-Up Internet | 0 | 0.0% |
| Broadband Home | 267 | 67.2% |
| Cellular Data Only | 77 | 19.4% |
| Satellite Internet | 30 | 7.6% |
| No Internet | 22 | 5.5% |
| Total | 397 | 100.0% |
Spaulding Summary
Spaulding, Illinois is a small village located in the northern part of the state, in the county of Sangamon. It is situated on the banks of the Sangamon River, and is part of the Springfield Metropolitan Statistical Area. The village has a population of just over 500 people, and is home to a variety of businesses, including a grocery store, a gas station, a post office, and a few restaurants.
History
The area that is now Spaulding was first settled in the early 1800s by a group of settlers from Kentucky. The village was originally known as “Spaulding’s Settlement”, and was named after the first settler, William Spaulding. The village was officially incorporated in 1867, and the first post office was established in 1868.
Geography
Spaulding is located in the northern part of the state, in the county of Sangamon. It is situated on the banks of the Sangamon River, and is part of the Springfield Metropolitan Statistical Area. The village has a total area of 0.6 square miles, all of which is land. The village is located approximately 10 miles north of Springfield, and is bordered by the towns of Rochester, Sherman, and Williamsville.
Economy
The economy of Spaulding is largely based on agriculture and small businesses. The village is home to a variety of businesses, including a grocery store, a gas station, a post office, and a few restaurants. The village also has a few small manufacturing businesses, such as a furniture factory and a printing company.
Demographics
As of the 2010 census, the population of Spaulding was 514 people. The racial makeup of the village was 97.3% White, 0.6% African American, 0.2% Native American, 0.4% Asian, and 1.5% from other races. The median household income was $41,250, and the median family income was $50,625. The per capita income was $20,945.
Conclusion
Spaulding, Illinois is a small village located in the northern part of the state, in the county of Sangamon. It is situated on the banks of the Sangamon River, and is part of the Springfield Metropolitan Statistical Area. The village has a population of just over 500 people, and is home to a variety of businesses, including a grocery store, a gas station, a post office, and a few restaurants. The economy of Spaulding is largely based on agriculture and small businesses, and the village has a diverse population with a median household income of $41,250.
Common Questions
What is Per Capita Income in Spaulding?
Per Capita income in Spaulding is $48,353.
What is the Median Family Income in Spaulding?
Median Family Income in Spaulding is $119,250.
What is the Median Household income in Spaulding?
Median Household Income in Spaulding is $110,139.
What is Income or Wage Gap in Spaulding?
Income or Wage Gap in Spaulding is 18.7%.
Women in Spaulding earn 81.3 cents for every dollar earned by a man.
What is Inequality or Gini Index in Spaulding?
Inequality or Gini Index in Spaulding is 0.36.
What is the Total Population of Spaulding?
Total Population of Spaulding is 965.
What is the Total Male Population of Spaulding?
Total Male Population of Spaulding is 475.
What is the Total Female Population of Spaulding?
Total Female Population of Spaulding is 490.
What is the Ratio of Males per 100 Females in Spaulding?
There are 96.94 Males per 100 Females in Spaulding.
What is the Ratio of Females per 100 Males in Spaulding?
There are 103.16 Females per 100 Males in Spaulding.
What is the Median Population Age in Spaulding?
Median Population Age in Spaulding is 49.4 Years.
What is the Average Family Size in Spaulding
Average Family Size in Spaulding is 2.8 People.
What is the Average Household Size in Spaulding
Average Household Size in Spaulding is 2.4 People.
How Large is the Labor Force in Spaulding?
There are 556 People in the Labor Forcein in Spaulding.
What is the Percentage of People in the Labor Force in Spaulding?
64.6% of People are in the Labor Force in Spaulding.
What is the Unemployment Rate in Spaulding?
Unemployment Rate in Spaulding is 4.3%.