Zip Codes with the Highest Percentage of Population Employed in Life, Physical & Social Science in Peoria, IL
RELATED REPORTS & OPTIONS
Life, Physical & Social Science
Peoria
Compare Zip Codes
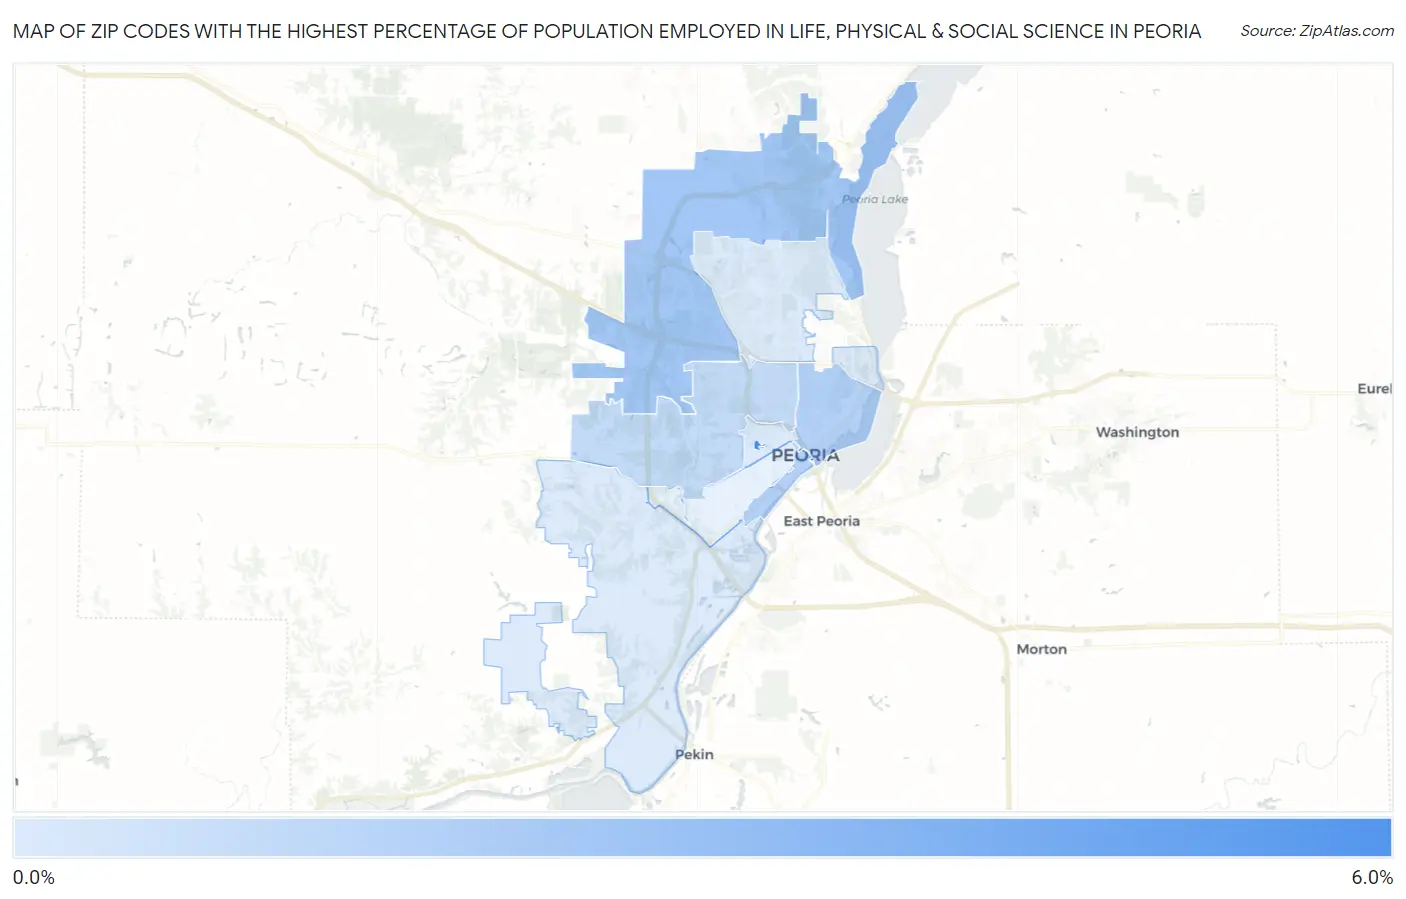
Map of Zip Codes with the Highest Percentage of Population Employed in Life, Physical & Social Science in Peoria
0.27%
5.3%
Zip Codes with the Highest Percentage of Population Employed in Life, Physical & Social Science in Peoria, IL
| Zip Code | % Employed | vs State | vs National | |
| 1. | 61625 | 5.3% | 0.98%(+4.32)#10 | 1.1%(+4.21)#687 |
| 2. | 61615 | 2.1% | 0.98%(+1.16)#93 | 1.1%(+1.05)#3,323 |
| 3. | 61602 | 1.6% | 0.98%(+0.667)#161 | 1.1%(+0.555)#4,964 |
| 4. | 61603 | 1.6% | 0.98%(+0.661)#166 | 1.1%(+0.548)#4,994 |
| 5. | 61604 | 1.1% | 0.98%(+0.098)#301 | 1.1%(-0.014)#8,415 |
| 6. | 61607 | 0.31% | 0.98%(-0.672)#711 | 1.1%(-0.784)#16,982 |
| 7. | 61614 | 0.30% | 0.98%(-0.677)#715 | 1.1%(-0.790)#17,047 |
| 8. | 61606 | 0.27% | 0.98%(-0.709)#735 | 1.1%(-0.821)#17,420 |
1
Common Questions
What are the Top 5 Zip Codes with the Highest Percentage of Population Employed in Life, Physical & Social Science in Peoria, IL?
Top 5 Zip Codes with the Highest Percentage of Population Employed in Life, Physical & Social Science in Peoria, IL are:
What zip code has the Highest Percentage of Population Employed in Life, Physical & Social Science in Peoria, IL?
61625 has the Highest Percentage of Population Employed in Life, Physical & Social Science in Peoria, IL with 5.3%.
What is the Percentage of Population Employed in Life, Physical & Social Science in Peoria, IL?
Percentage of Population Employed in Life, Physical & Social Science in Peoria is 1.2%.
What is the Percentage of Population Employed in Life, Physical & Social Science in Illinois?
Percentage of Population Employed in Life, Physical & Social Science in Illinois is 0.98%.
What is the Percentage of Population Employed in Life, Physical & Social Science in the United States?
Percentage of Population Employed in Life, Physical & Social Science in the United States is 1.1%.