Highwood, IL Map & Demographics
Highwood Map
Highwood Overview
$46,257
PER CAPITA INCOME
$109,202
AVG FAMILY INCOME
$105,282
AVG HOUSEHOLD INCOME
35.3%
WAGE / INCOME GAP [ % ]
64.7¢/ $1
WAGE / INCOME GAP [ $ ]
$5,835
FAMILY INCOME DEFICIT
0.46
INEQUALITY / GINI INDEX
5,227
TOTAL POPULATION
2,835
MALE POPULATION
2,392
FEMALE POPULATION
118.52
MALES / 100 FEMALES
84.37
FEMALES / 100 MALES
36.3
MEDIAN AGE
3.1
AVG FAMILY SIZE
2.7
AVG HOUSEHOLD SIZE
2,921
LABOR FORCE [ PEOPLE ]
70.9%
PERCENT IN LABOR FORCE
6.7%
UNEMPLOYMENT RATE
Highwood Zip Codes
Income in Highwood
Income Overview in Highwood
Per Capita Income in Highwood is $46,257, while median incomes of families and households are $109,202 and $105,282 respectively.
| Characteristic | Number | Measure |
| Per Capita Income | 5,227 | $46,257 |
| Median Family Income | 1,390 | $109,202 |
| Mean Family Income | 1,390 | $138,560 |
| Median Household Income | 1,904 | $105,282 |
| Mean Household Income | 1,904 | $125,764 |
| Income Deficit | 1,390 | $5,835 |
| Wage / Income Gap (%) | 5,227 | 35.26% |
| Wage / Income Gap ($) | 5,227 | 64.74¢ per $1 |
| Gini / Inequality Index | 5,227 | 0.46 |
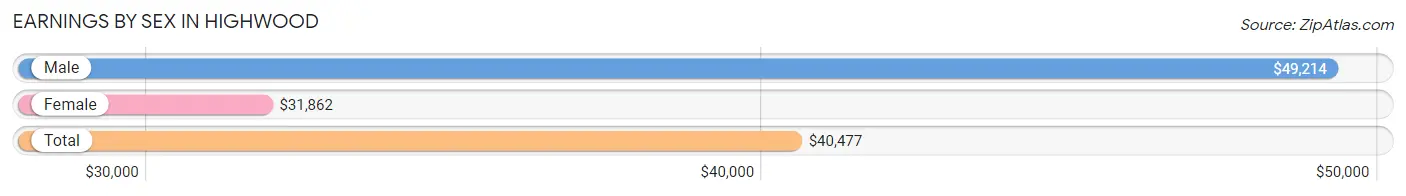
Earnings by Sex in Highwood
Average Earnings in Highwood are $40,477, $49,214 for men and $31,862 for women, a difference of 35.3%.
| Sex | Number | Average Earnings |
| Male | 1,654 (57.9%) | $49,214 |
| Female | 1,204 (42.1%) | $31,862 |
| Total | 2,858 (100.0%) | $40,477 |
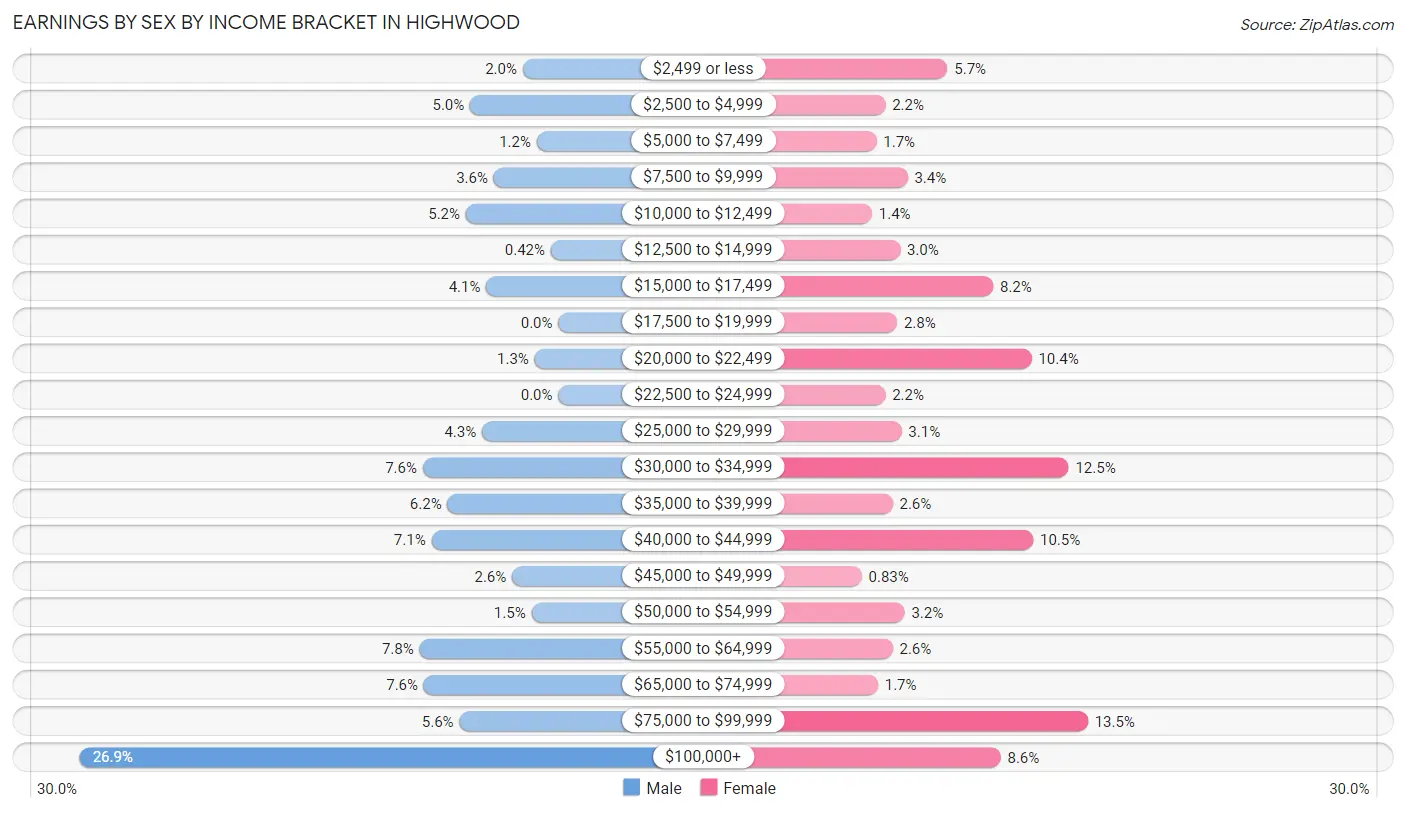
Earnings by Sex by Income Bracket in Highwood
The most common earnings brackets in Highwood are $100,000+ for men (445 | 26.9%) and $75,000 to $99,999 for women (163 | 13.5%).
| Income | Male | Female |
| $2,499 or less | 33 (2.0%) | 68 (5.7%) |
| $2,500 to $4,999 | 82 (5.0%) | 26 (2.2%) |
| $5,000 to $7,499 | 20 (1.2%) | 20 (1.7%) |
| $7,500 to $9,999 | 60 (3.6%) | 41 (3.4%) |
| $10,000 to $12,499 | 86 (5.2%) | 17 (1.4%) |
| $12,500 to $14,999 | 7 (0.4%) | 36 (3.0%) |
| $15,000 to $17,499 | 67 (4.1%) | 99 (8.2%) |
| $17,500 to $19,999 | 0 (0.0%) | 34 (2.8%) |
| $20,000 to $22,499 | 22 (1.3%) | 125 (10.4%) |
| $22,500 to $24,999 | 0 (0.0%) | 26 (2.2%) |
| $25,000 to $29,999 | 71 (4.3%) | 37 (3.1%) |
| $30,000 to $34,999 | 126 (7.6%) | 150 (12.5%) |
| $35,000 to $39,999 | 103 (6.2%) | 31 (2.6%) |
| $40,000 to $44,999 | 118 (7.1%) | 126 (10.5%) |
| $45,000 to $49,999 | 43 (2.6%) | 10 (0.8%) |
| $50,000 to $54,999 | 25 (1.5%) | 39 (3.2%) |
| $55,000 to $64,999 | 129 (7.8%) | 31 (2.6%) |
| $65,000 to $74,999 | 125 (7.6%) | 21 (1.7%) |
| $75,000 to $99,999 | 92 (5.6%) | 163 (13.5%) |
| $100,000+ | 445 (26.9%) | 104 (8.6%) |
| Total | 1,654 (100.0%) | 1,204 (100.0%) |
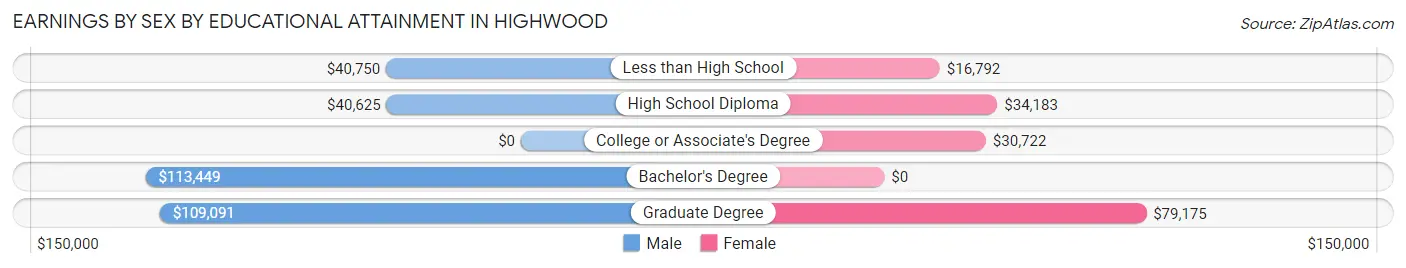
Earnings by Sex by Educational Attainment in Highwood
Average earnings in Highwood are $68,201 for men and $34,276 for women, a difference of 49.7%. Men with an educational attainment of bachelor's degree enjoy the highest average annual earnings of $113,449, while those with high school diploma education earn the least with $40,625. Women with an educational attainment of graduate degree earn the most with the average annual earnings of $79,175, while those with less than high school education have the smallest earnings of $16,792.
| Educational Attainment | Male Income | Female Income |
| Less than High School | $40,750 | $16,792 |
| High School Diploma | $40,625 | $34,183 |
| College or Associate's Degree | - | - |
| Bachelor's Degree | $113,449 | $0 |
| Graduate Degree | $109,091 | $79,175 |
| Total | $68,201 | $34,276 |
Family Income in Highwood
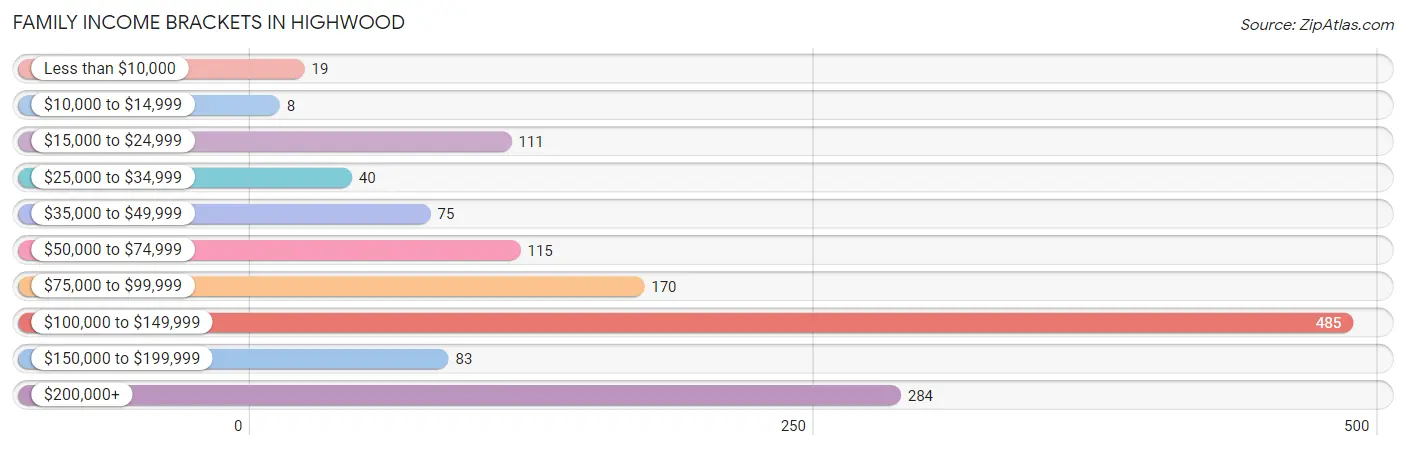
Family Income Brackets in Highwood
According to the Highwood family income data, there are 485 families falling into the $100,000 to $149,999 income range, which is the most common income bracket and makes up 34.9% of all families. Conversely, the $10,000 to $14,999 income bracket is the least frequent group with only 8 families (0.6%) belonging to this category.
| Income Bracket | # Families | % Families |
| Less than $10,000 | 19 | 1.4% |
| $10,000 to $14,999 | 8 | 0.6% |
| $15,000 to $24,999 | 111 | 8.0% |
| $25,000 to $34,999 | 40 | 2.9% |
| $35,000 to $49,999 | 75 | 5.4% |
| $50,000 to $74,999 | 115 | 8.3% |
| $75,000 to $99,999 | 170 | 12.2% |
| $100,000 to $149,999 | 485 | 34.9% |
| $150,000 to $199,999 | 83 | 6.0% |
| $200,000+ | 284 | 20.4% |
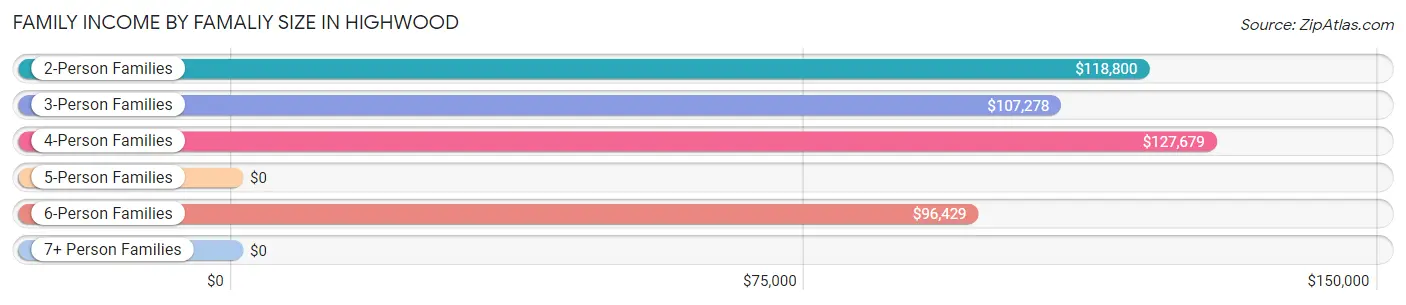
Family Income by Famaliy Size in Highwood
4-person families (283 | 20.4%) account for the highest median family income in Highwood with $127,679 per family, while 2-person families (648 | 46.6%) have the highest median income of $59,400 per family member.
| Income Bracket | # Families | Median Income |
| 2-Person Families | 648 (46.6%) | $118,800 |
| 3-Person Families | 289 (20.8%) | $107,278 |
| 4-Person Families | 283 (20.4%) | $127,679 |
| 5-Person Families | 34 (2.5%) | $0 |
| 6-Person Families | 136 (9.8%) | $96,429 |
| 7+ Person Families | 0 (0.0%) | $0 |
| Total | 1,390 (100.0%) | $109,202 |
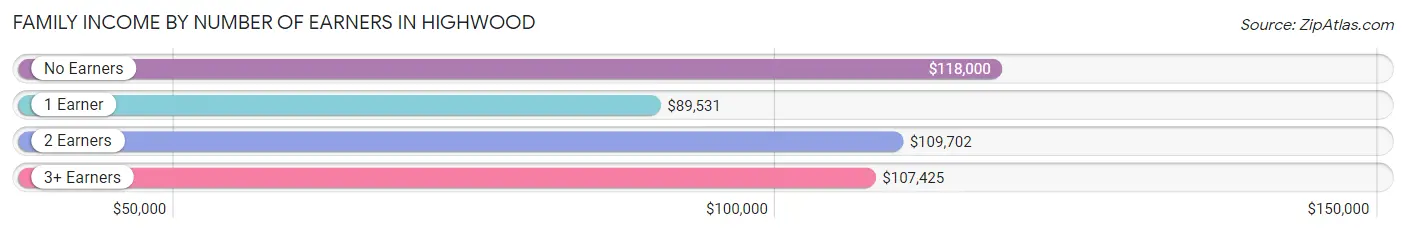
Family Income by Number of Earners in Highwood
The median family income in Highwood is $109,202, with families comprising no earners (140) having the highest median family income of $118,000, while families with 1 earner (543) have the lowest median family income of $89,531, accounting for 10.1% and 39.1% of families, respectively.
| Number of Earners | # Families | Median Income |
| No Earners | 140 (10.1%) | $118,000 |
| 1 Earner | 543 (39.1%) | $89,531 |
| 2 Earners | 530 (38.1%) | $109,702 |
| 3+ Earners | 177 (12.7%) | $107,425 |
| Total | 1,390 (100.0%) | $109,202 |
Household Income in Highwood
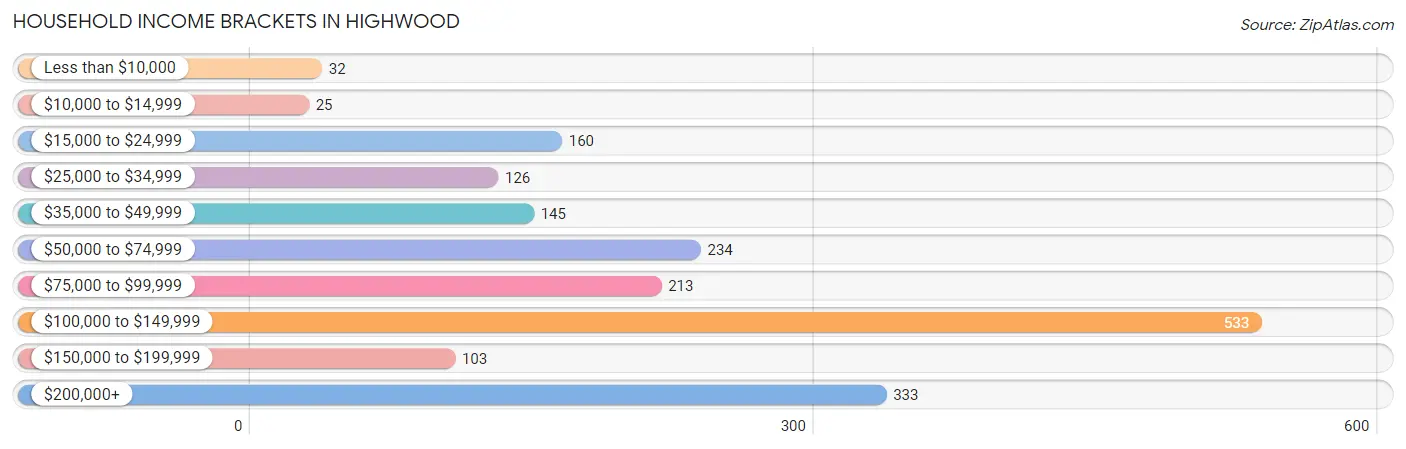
Household Income Brackets in Highwood
With 533 households falling in the category, the $100,000 to $149,999 income range is the most frequent in Highwood, accounting for 28.0% of all households. In contrast, only 25 households (1.3%) fall into the $10,000 to $14,999 income bracket, making it the least populous group.
| Income Bracket | # Households | % Households |
| Less than $10,000 | 32 | 1.7% |
| $10,000 to $14,999 | 25 | 1.3% |
| $15,000 to $24,999 | 160 | 8.4% |
| $25,000 to $34,999 | 126 | 6.6% |
| $35,000 to $49,999 | 145 | 7.6% |
| $50,000 to $74,999 | 234 | 12.3% |
| $75,000 to $99,999 | 213 | 11.2% |
| $100,000 to $149,999 | 533 | 28.0% |
| $150,000 to $199,999 | 103 | 5.4% |
| $200,000+ | 333 | 17.5% |
Household Income by Householder Age in Highwood
The median household income in Highwood is $105,282, with the highest median household income of $119,475 found in the 65+ years age bracket for the primary householder. A total of 441 households (23.2%) fall into this category. Meanwhile, the 15 to 24 years age bracket for the primary householder has the lowest median household income of $25,625, with 90 households (4.7%) in this group.
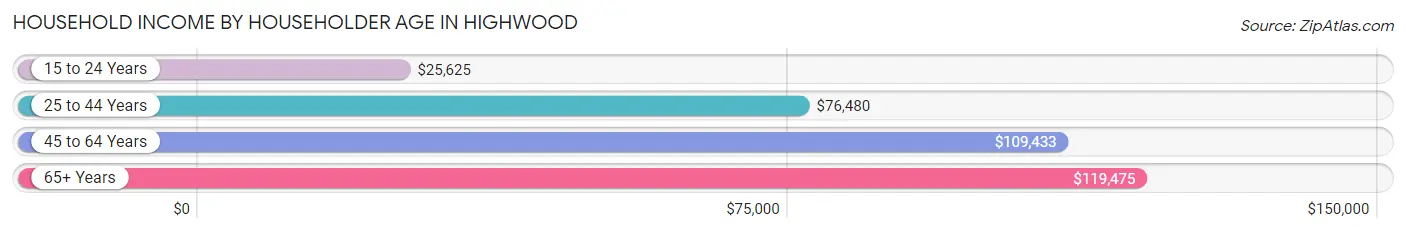
| Income Bracket | # Households | Median Income |
| 15 to 24 Years | 90 (4.7%) | $25,625 |
| 25 to 44 Years | 703 (36.9%) | $76,480 |
| 45 to 64 Years | 670 (35.2%) | $109,433 |
| 65+ Years | 441 (23.2%) | $119,475 |
| Total | 1,904 (100.0%) | $105,282 |
Poverty in Highwood
Income Below Poverty by Sex and Age in Highwood
With 15.0% poverty level for males and 14.2% for females among the residents of Highwood, 18 to 24 year old males and 5 year old females are the most vulnerable to poverty, with 180 males (49.7%) and 38 females (66.7%) in their respective age groups living below the poverty level.
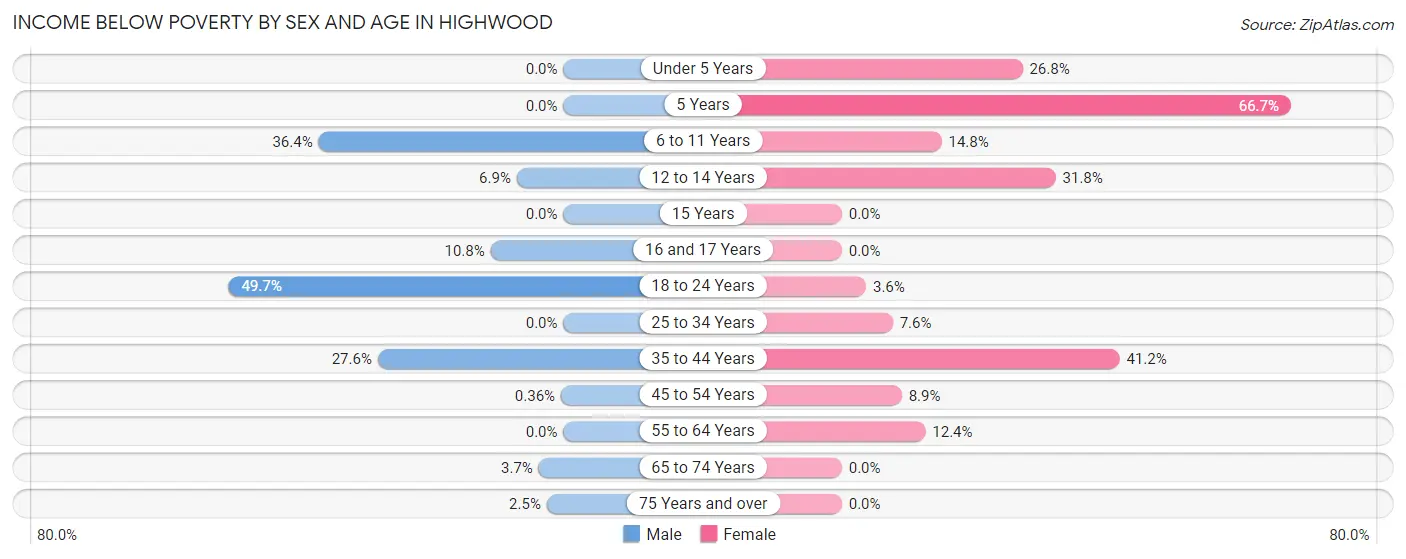
| Age Bracket | Male | Female |
| Under 5 Years | 0 (0.0%) | 33 (26.8%) |
| 5 Years | 0 (0.0%) | 38 (66.7%) |
| 6 to 11 Years | 96 (36.4%) | 20 (14.8%) |
| 12 to 14 Years | 9 (6.9%) | 20 (31.8%) |
| 15 Years | 0 (0.0%) | 0 (0.0%) |
| 16 and 17 Years | 20 (10.8%) | 0 (0.0%) |
| 18 to 24 Years | 180 (49.7%) | 8 (3.6%) |
| 25 to 34 Years | 0 (0.0%) | 30 (7.6%) |
| 35 to 44 Years | 105 (27.6%) | 120 (41.2%) |
| 45 to 54 Years | 1 (0.4%) | 25 (8.9%) |
| 55 to 64 Years | 0 (0.0%) | 36 (12.4%) |
| 65 to 74 Years | 9 (3.7%) | 0 (0.0%) |
| 75 Years and over | 2 (2.5%) | 0 (0.0%) |
| Total | 422 (15.0%) | 330 (14.2%) |
Income Above Poverty by Sex and Age in Highwood
According to the poverty statistics in Highwood, males aged under 5 years and females aged 15 years are the age groups that are most secure financially, with 100.0% of males and 100.0% of females in these age groups living above the poverty line.
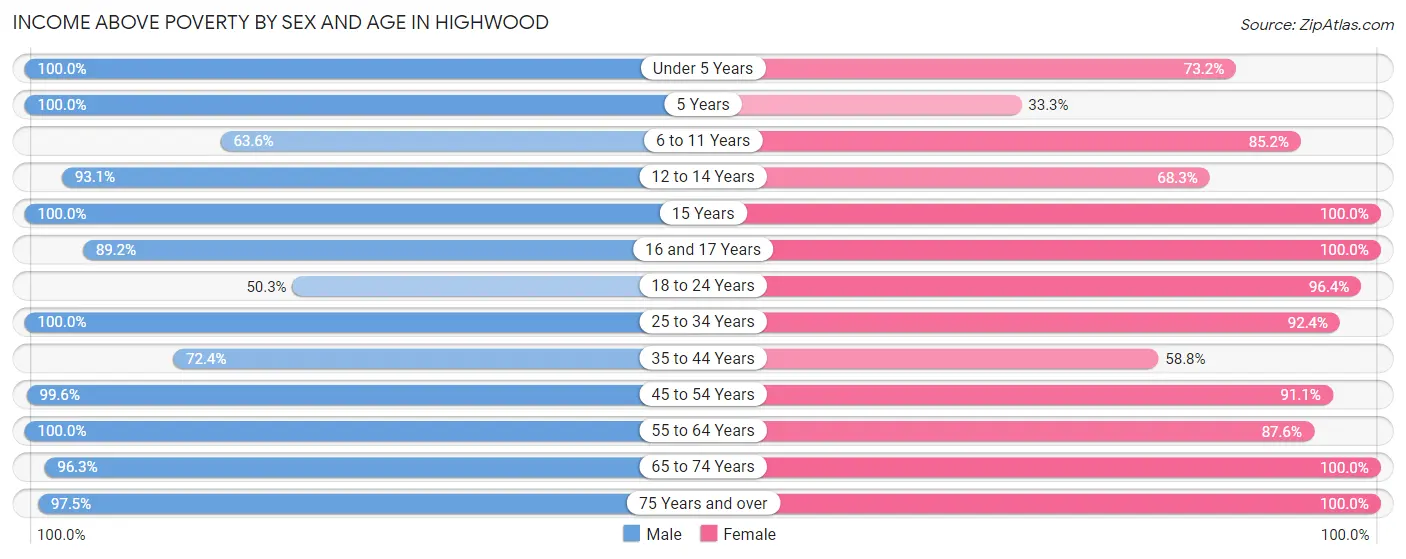
| Age Bracket | Male | Female |
| Under 5 Years | 175 (100.0%) | 90 (73.2%) |
| 5 Years | 75 (100.0%) | 19 (33.3%) |
| 6 to 11 Years | 168 (63.6%) | 115 (85.2%) |
| 12 to 14 Years | 121 (93.1%) | 43 (68.2%) |
| 15 Years | 77 (100.0%) | 7 (100.0%) |
| 16 and 17 Years | 165 (89.2%) | 11 (100.0%) |
| 18 to 24 Years | 182 (50.3%) | 214 (96.4%) |
| 25 to 34 Years | 236 (100.0%) | 367 (92.4%) |
| 35 to 44 Years | 276 (72.4%) | 171 (58.8%) |
| 45 to 54 Years | 277 (99.6%) | 256 (91.1%) |
| 55 to 64 Years | 327 (100.0%) | 254 (87.6%) |
| 65 to 74 Years | 237 (96.3%) | 311 (100.0%) |
| 75 Years and over | 79 (97.5%) | 135 (100.0%) |
| Total | 2,395 (85.0%) | 1,993 (85.8%) |
Income Below Poverty Among Married-Couple Families in Highwood
The poverty statistics for married-couple families in Highwood show that 9.9% or 105 of the total 1,065 families live below the poverty line. Families with 1 or 2 children have the highest poverty rate of 21.0%, comprising of 85 families. On the other hand, families with 3 or 4 children have the lowest poverty rate of 0.0%, which includes 0 families.
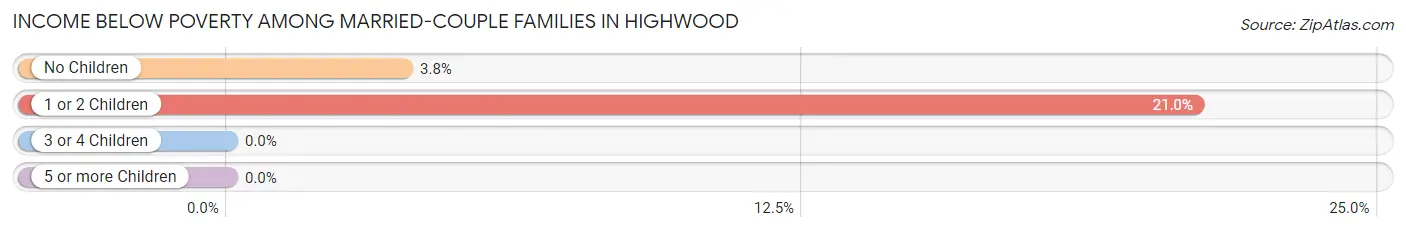
| Children | Above Poverty | Below Poverty |
| No Children | 505 (96.2%) | 20 (3.8%) |
| 1 or 2 Children | 319 (79.0%) | 85 (21.0%) |
| 3 or 4 Children | 136 (100.0%) | 0 (0.0%) |
| 5 or more Children | 0 (0.0%) | 0 (0.0%) |
| Total | 960 (90.1%) | 105 (9.9%) |
Income Below Poverty Among Single-Parent Households in Highwood
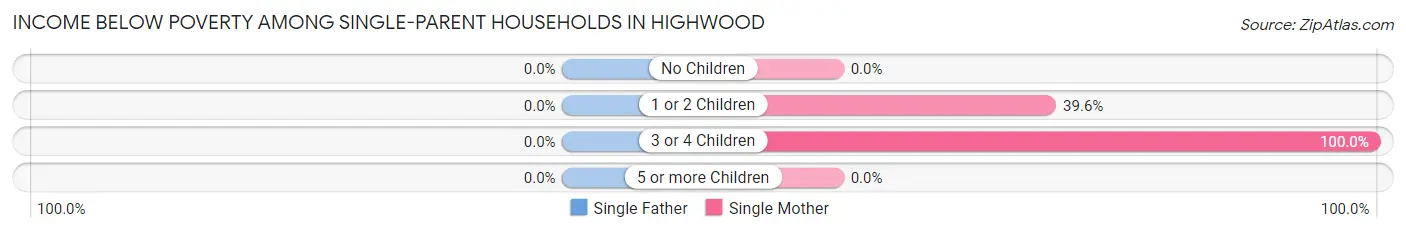
| Children | Single Father | Single Mother |
| No Children | 0 (0.0%) | 0 (0.0%) |
| 1 or 2 Children | 0 (0.0%) | 38 (39.6%) |
| 3 or 4 Children | 0 (0.0%) | 19 (100.0%) |
| 5 or more Children | 0 (0.0%) | 0 (0.0%) |
| Total | 0 (0.0%) | 57 (25.3%) |
Income Below Poverty Among Married-Couple vs Single-Parent Households in Highwood
The poverty data for Highwood shows that 105 of the married-couple family households (9.9%) and 57 of the single-parent households (17.5%) are living below the poverty level. Within the married-couple family households, those with 1 or 2 children have the highest poverty rate, with 85 households (21.0%) falling below the poverty line. Among the single-parent households, those with 3 or 4 children have the highest poverty rate, with 19 household (52.8%) living below poverty.
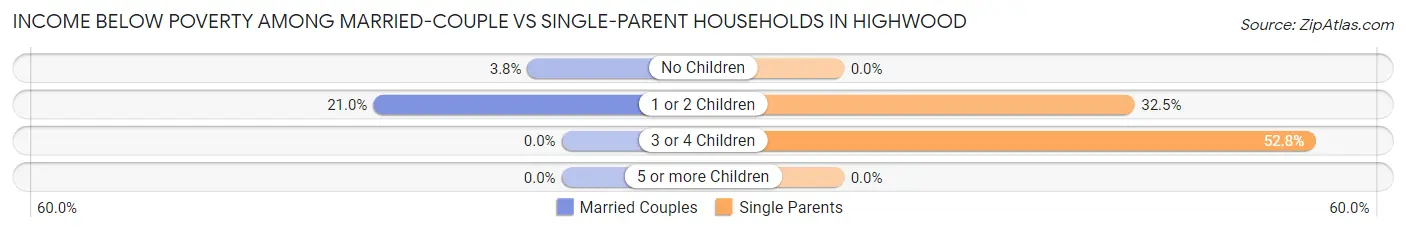
| Children | Married-Couple Families | Single-Parent Households |
| No Children | 20 (3.8%) | 0 (0.0%) |
| 1 or 2 Children | 85 (21.0%) | 38 (32.5%) |
| 3 or 4 Children | 0 (0.0%) | 19 (52.8%) |
| 5 or more Children | 0 (0.0%) | 0 (0.0%) |
| Total | 105 (9.9%) | 57 (17.5%) |
Race in Highwood
The most populous races in Highwood are White / Caucasian (3,388 | 64.8%), Hispanic or Latino (2,021 | 38.7%), and Some other Race (1,238 | 23.7%).
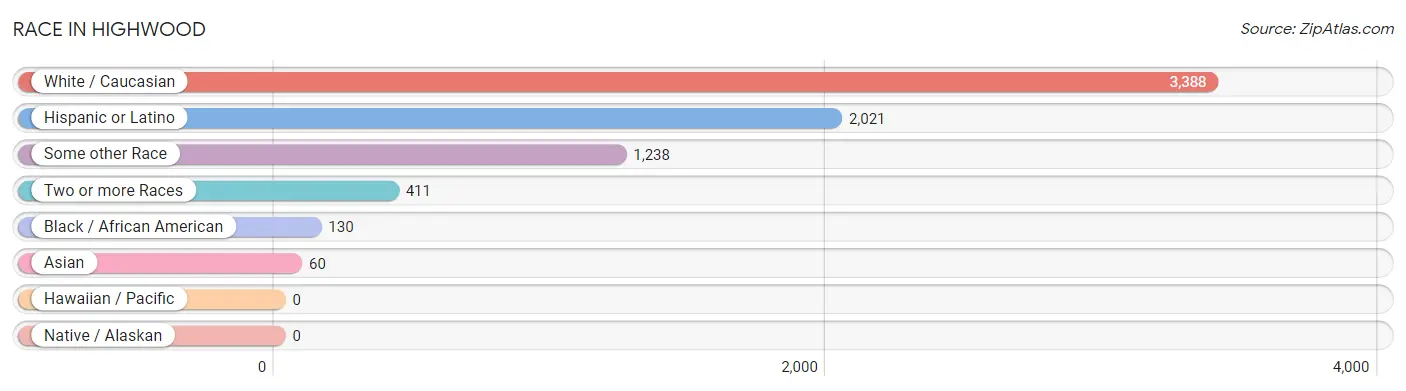
| Race | # Population | % Population |
| Asian | 60 | 1.1% |
| Black / African American | 130 | 2.5% |
| Hawaiian / Pacific | 0 | 0.0% |
| Hispanic or Latino | 2,021 | 38.7% |
| Native / Alaskan | 0 | 0.0% |
| White / Caucasian | 3,388 | 64.8% |
| Two or more Races | 411 | 7.9% |
| Some other Race | 1,238 | 23.7% |
| Total | 5,227 | 100.0% |
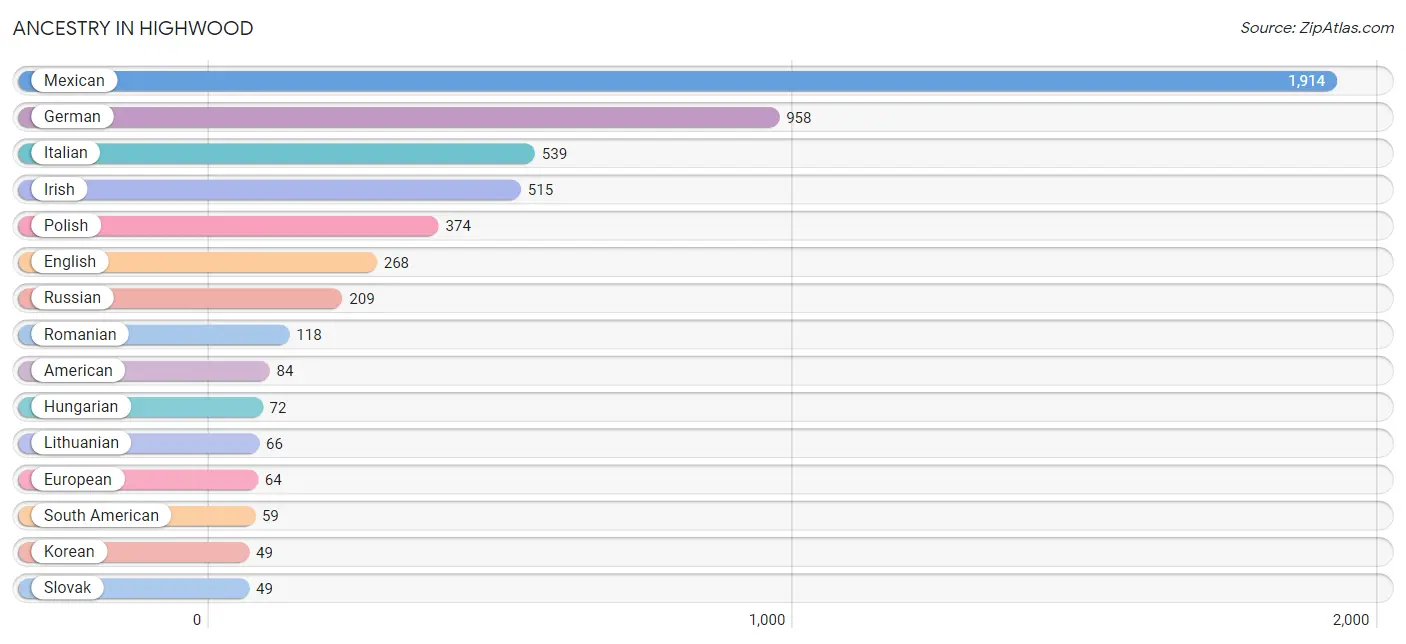
Ancestry in Highwood
The most populous ancestries reported in Highwood are Mexican (1,914 | 36.6%), German (958 | 18.3%), Italian (539 | 10.3%), Irish (515 | 9.9%), and Polish (374 | 7.2%), together accounting for 82.3% of all Highwood residents.
| Ancestry | # Population | % Population |
| American | 84 | 1.6% |
| Arab | 16 | 0.3% |
| Argentinean | 13 | 0.3% |
| Austrian | 19 | 0.4% |
| Bhutanese | 6 | 0.1% |
| British | 30 | 0.6% |
| Central American | 25 | 0.5% |
| Central American Indian | 13 | 0.3% |
| Colombian | 46 | 0.9% |
| Cuban | 1 | 0.0% |
| Danish | 14 | 0.3% |
| Dutch | 18 | 0.3% |
| Eastern European | 29 | 0.5% |
| English | 268 | 5.1% |
| European | 64 | 1.2% |
| French | 42 | 0.8% |
| German | 958 | 18.3% |
| Greek | 20 | 0.4% |
| Guatemalan | 25 | 0.5% |
| Hungarian | 72 | 1.4% |
| Indian (Asian) | 11 | 0.2% |
| Irish | 515 | 9.9% |
| Italian | 539 | 10.3% |
| Korean | 49 | 0.9% |
| Latvian | 6 | 0.1% |
| Lebanese | 16 | 0.3% |
| Lithuanian | 66 | 1.3% |
| Mexican | 1,914 | 36.6% |
| Norwegian | 42 | 0.8% |
| Polish | 374 | 7.2% |
| Puerto Rican | 13 | 0.3% |
| Romanian | 118 | 2.3% |
| Russian | 209 | 4.0% |
| Scotch-Irish | 16 | 0.3% |
| Scottish | 15 | 0.3% |
| Slovak | 49 | 0.9% |
| South American | 59 | 1.1% |
| Swedish | 44 | 0.8% |
| Swiss | 34 | 0.6% |
| Ukrainian | 7 | 0.1% |
| Yugoslavian | 9 | 0.2% | View All 41 Rows |
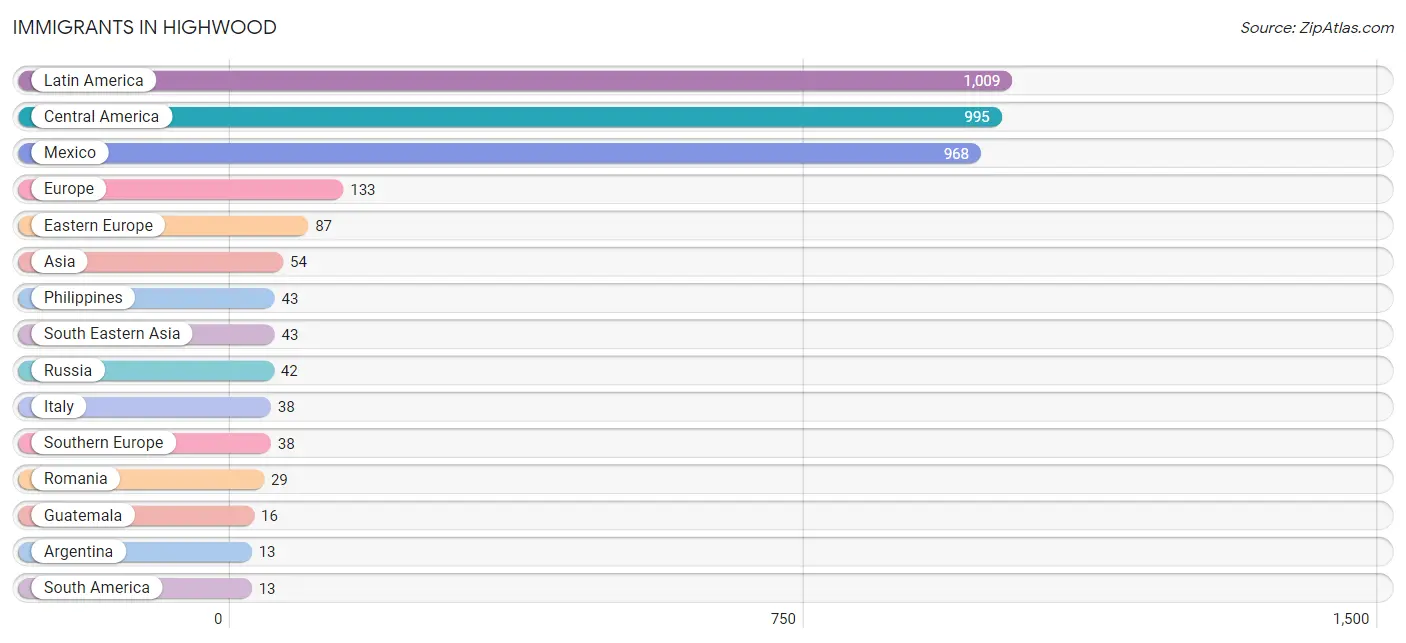
Immigrants in Highwood
The most numerous immigrant groups reported in Highwood came from Latin America (1,009 | 19.3%), Central America (995 | 19.0%), Mexico (968 | 18.5%), Europe (133 | 2.5%), and Eastern Europe (87 | 1.7%), together accounting for 61.1% of all Highwood residents.
| Immigration Origin | # Population | % Population |
| Argentina | 13 | 0.3% |
| Asia | 54 | 1.0% |
| Belarus | 7 | 0.1% |
| Belize | 11 | 0.2% |
| Caribbean | 1 | 0.0% |
| Central America | 995 | 19.0% |
| China | 11 | 0.2% |
| Cuba | 1 | 0.0% |
| Eastern Asia | 11 | 0.2% |
| Eastern Europe | 87 | 1.7% |
| Europe | 133 | 2.5% |
| Guatemala | 16 | 0.3% |
| Italy | 38 | 0.7% |
| Latin America | 1,009 | 19.3% |
| Mexico | 968 | 18.5% |
| Northern Europe | 8 | 0.2% |
| Philippines | 43 | 0.8% |
| Romania | 29 | 0.5% |
| Russia | 42 | 0.8% |
| South America | 13 | 0.3% |
| South Eastern Asia | 43 | 0.8% |
| Southern Europe | 38 | 0.7% | View All 22 Rows |
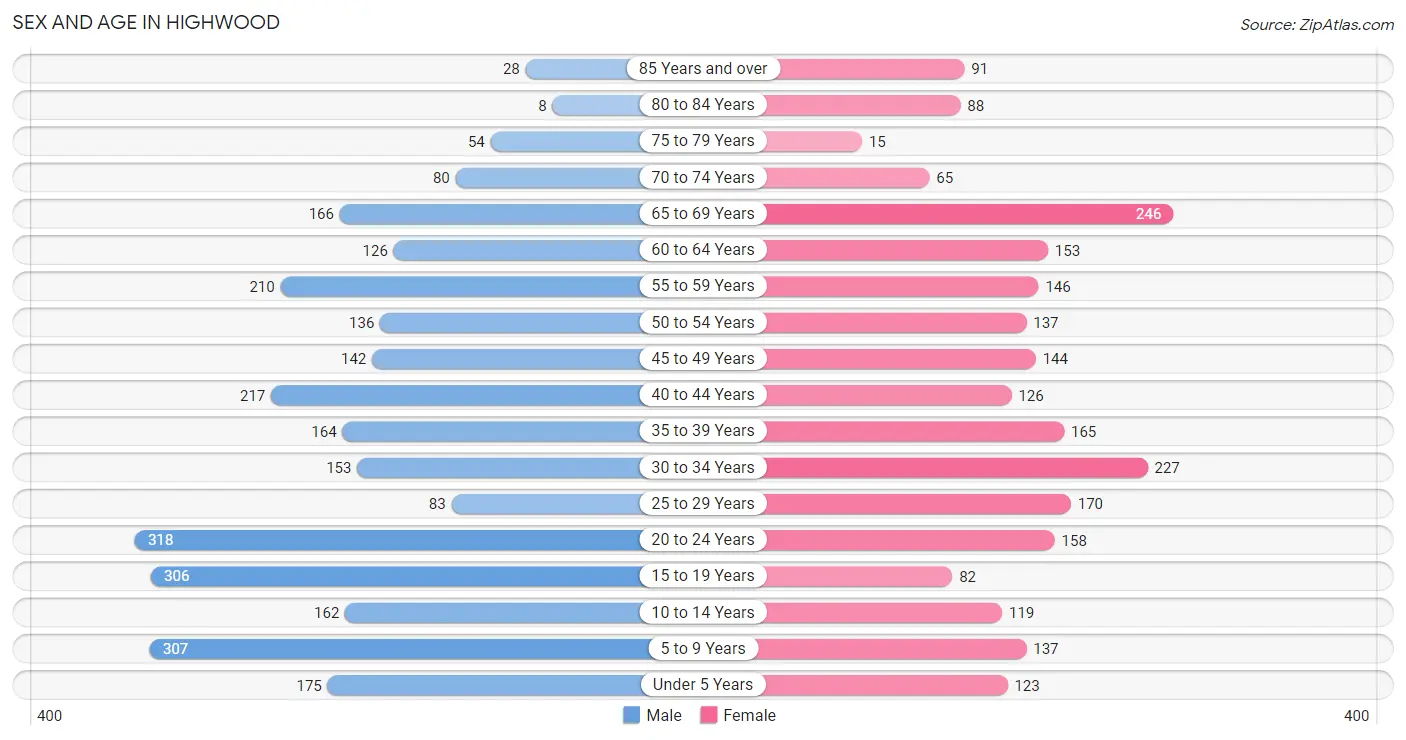
Sex and Age in Highwood
Sex and Age in Highwood
The most populous age groups in Highwood are 20 to 24 Years (318 | 11.2%) for men and 65 to 69 Years (246 | 10.3%) for women.
| Age Bracket | Male | Female |
| Under 5 Years | 175 (6.2%) | 123 (5.1%) |
| 5 to 9 Years | 307 (10.8%) | 137 (5.7%) |
| 10 to 14 Years | 162 (5.7%) | 119 (5.0%) |
| 15 to 19 Years | 306 (10.8%) | 82 (3.4%) |
| 20 to 24 Years | 318 (11.2%) | 158 (6.6%) |
| 25 to 29 Years | 83 (2.9%) | 170 (7.1%) |
| 30 to 34 Years | 153 (5.4%) | 227 (9.5%) |
| 35 to 39 Years | 164 (5.8%) | 165 (6.9%) |
| 40 to 44 Years | 217 (7.6%) | 126 (5.3%) |
| 45 to 49 Years | 142 (5.0%) | 144 (6.0%) |
| 50 to 54 Years | 136 (4.8%) | 137 (5.7%) |
| 55 to 59 Years | 210 (7.4%) | 146 (6.1%) |
| 60 to 64 Years | 126 (4.4%) | 153 (6.4%) |
| 65 to 69 Years | 166 (5.9%) | 246 (10.3%) |
| 70 to 74 Years | 80 (2.8%) | 65 (2.7%) |
| 75 to 79 Years | 54 (1.9%) | 15 (0.6%) |
| 80 to 84 Years | 8 (0.3%) | 88 (3.7%) |
| 85 Years and over | 28 (1.0%) | 91 (3.8%) |
| Total | 2,835 (100.0%) | 2,392 (100.0%) |
Families and Households in Highwood
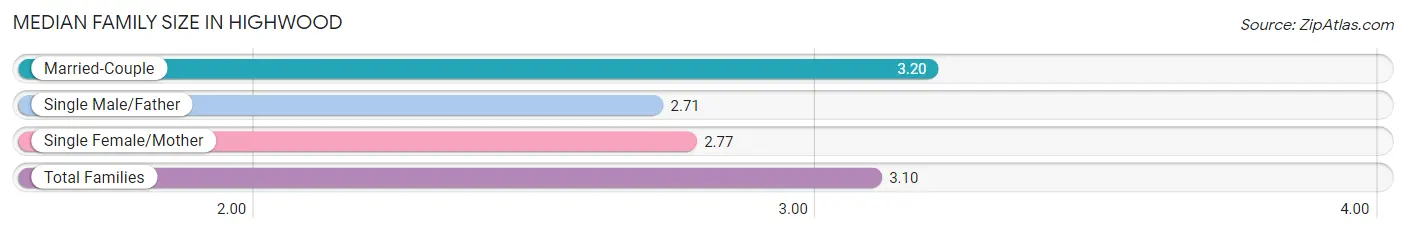
Median Family Size in Highwood
The median family size in Highwood is 3.10 persons per family, with married-couple families (1,065 | 76.6%) accounting for the largest median family size of 3.2 persons per family. On the other hand, single male/father families (100 | 7.2%) represent the smallest median family size with 2.71 persons per family.
| Family Type | # Families | Family Size |
| Married-Couple | 1,065 (76.6%) | 3.20 |
| Single Male/Father | 100 (7.2%) | 2.71 |
| Single Female/Mother | 225 (16.2%) | 2.77 |
| Total Families | 1,390 (100.0%) | 3.10 |
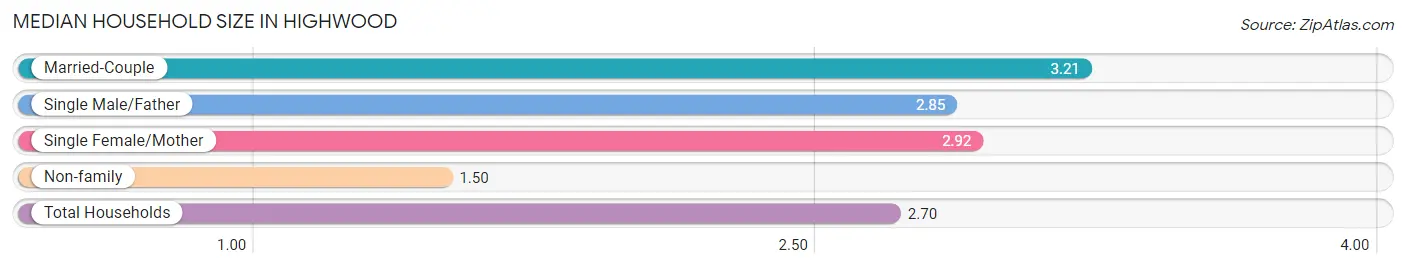
Median Household Size in Highwood
The median household size in Highwood is 2.70 persons per household, with married-couple households (1,065 | 55.9%) accounting for the largest median household size of 3.21 persons per household. non-family households (514 | 27.0%) represent the smallest median household size with 1.50 persons per household.
| Household Type | # Households | Household Size |
| Married-Couple | 1,065 (55.9%) | 3.21 |
| Single Male/Father | 100 (5.2%) | 2.85 |
| Single Female/Mother | 225 (11.8%) | 2.92 |
| Non-family | 514 (27.0%) | 1.50 |
| Total Households | 1,904 (100.0%) | 2.70 |
Household Size by Marriage Status in Highwood
Out of a total of 1,904 households in Highwood, 1,390 (73.0%) are family households, while 514 (27.0%) are nonfamily households. The most numerous type of family households are 2-person households, comprising 622, and the most common type of nonfamily households are 1-person households, comprising 341.
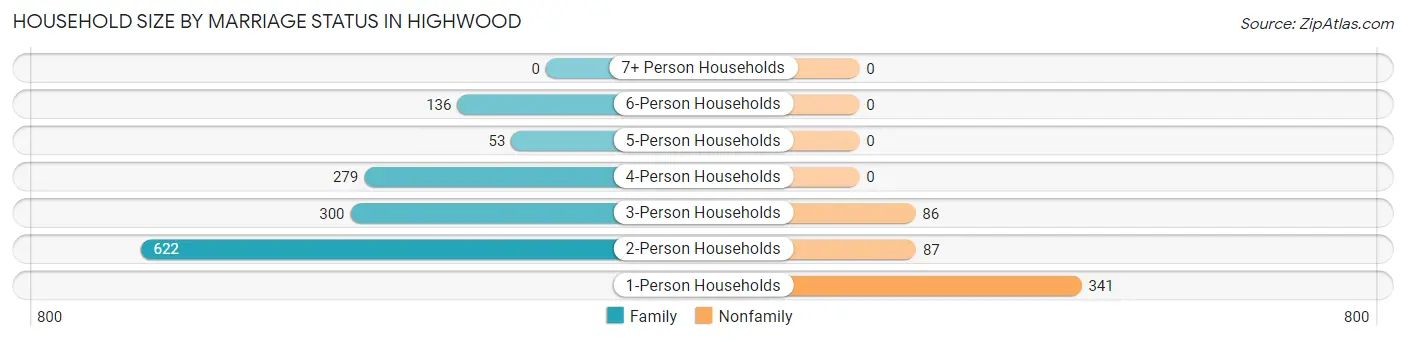
| Household Size | Family Households | Nonfamily Households |
| 1-Person Households | - | 341 (17.9%) |
| 2-Person Households | 622 (32.7%) | 87 (4.6%) |
| 3-Person Households | 300 (15.8%) | 86 (4.5%) |
| 4-Person Households | 279 (14.6%) | 0 (0.0%) |
| 5-Person Households | 53 (2.8%) | 0 (0.0%) |
| 6-Person Households | 136 (7.1%) | 0 (0.0%) |
| 7+ Person Households | 0 (0.0%) | 0 (0.0%) |
| Total | 1,390 (73.0%) | 514 (27.0%) |
Female Fertility in Highwood
Fertility by Age in Highwood
Average fertility rate in Highwood is 10.0 births per 1,000 women. Women in the age bracket of 20 to 34 years have the highest fertility rate with 20.0 births per 1,000 women. Women in the age bracket of 20 to 34 years acount for 100.0% of all women with births.
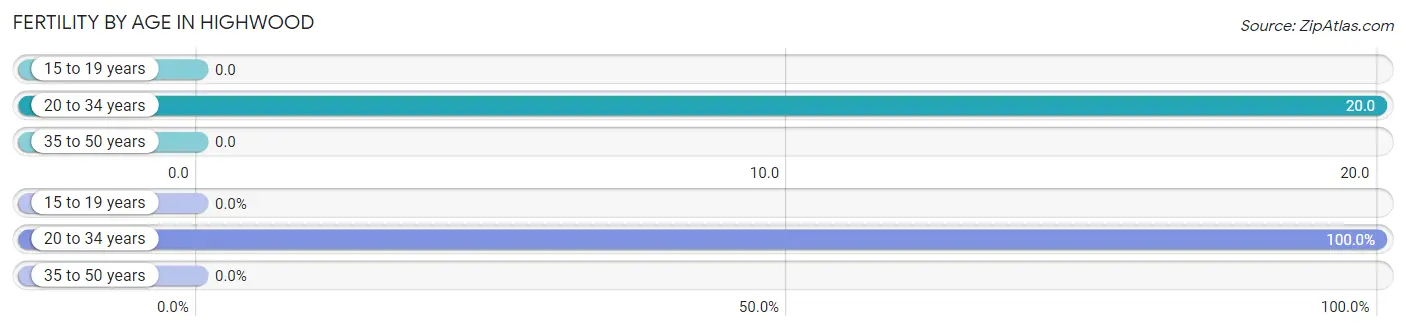
| Age Bracket | Women with Births | Births / 1,000 Women |
| 15 to 19 years | 0 (0.0%) | 0.0 |
| 20 to 34 years | 11 (100.0%) | 20.0 |
| 35 to 50 years | 0 (0.0%) | 0.0 |
| Total | 11 (100.0%) | 10.0 |
Fertility by Age by Marriage Status in Highwood
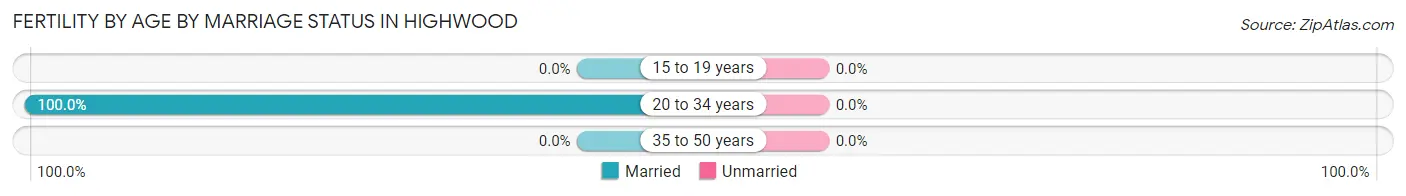
| Age Bracket | Married | Unmarried |
| 15 to 19 years | 0 (0.0%) | 0 (0.0%) |
| 20 to 34 years | 11 (100.0%) | 0 (0.0%) |
| 35 to 50 years | 0 (0.0%) | 0 (0.0%) |
| Total | 11 (100.0%) | 0 (0.0%) |
Fertility by Education in Highwood
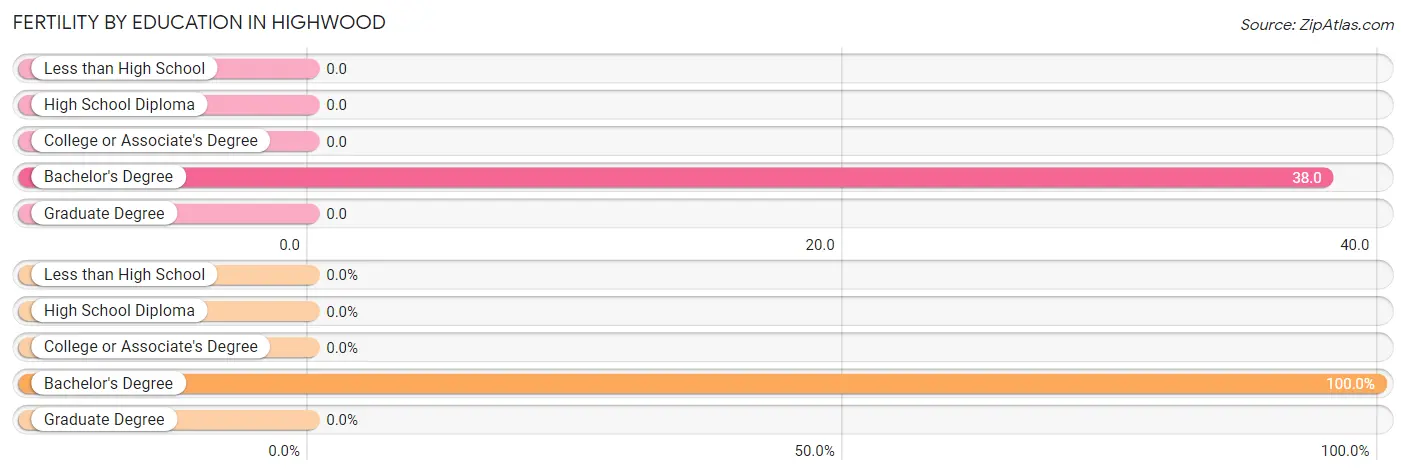
| Educational Attainment | Women with Births | Births / 1,000 Women |
| Less than High School | 0 (0.0%) | 0.0 |
| High School Diploma | 0 (0.0%) | 0.0 |
| College or Associate's Degree | 0 (0.0%) | 0.0 |
| Bachelor's Degree | 11 (100.0%) | 38.0 |
| Graduate Degree | 0 (0.0%) | 0.0 |
| Total | 11 (100.0%) | 10.0 |
Fertility by Education by Marriage Status in Highwood
| Educational Attainment | Married | Unmarried |
| Less than High School | 0 (0.0%) | 0 (0.0%) |
| High School Diploma | 0 (0.0%) | 0 (0.0%) |
| College or Associate's Degree | 0 (0.0%) | 0 (0.0%) |
| Bachelor's Degree | 11 (100.0%) | 0 (0.0%) |
| Graduate Degree | 0 (0.0%) | 0 (0.0%) |
| Total | 11 (100.0%) | 0 (0.0%) |
Employment Characteristics in Highwood
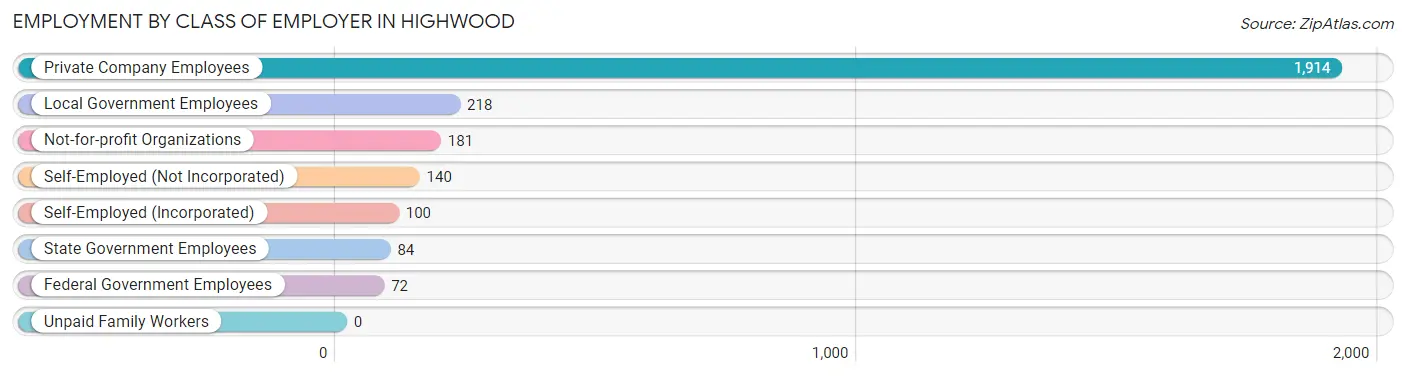
Employment by Class of Employer in Highwood
Among the 2,709 employed individuals in Highwood, private company employees (1,914 | 70.7%), local government employees (218 | 8.1%), and not-for-profit organizations (181 | 6.7%) make up the most common classes of employment.
| Employer Class | # Employees | % Employees |
| Private Company Employees | 1,914 | 70.7% |
| Self-Employed (Incorporated) | 100 | 3.7% |
| Self-Employed (Not Incorporated) | 140 | 5.2% |
| Not-for-profit Organizations | 181 | 6.7% |
| Local Government Employees | 218 | 8.1% |
| State Government Employees | 84 | 3.1% |
| Federal Government Employees | 72 | 2.7% |
| Unpaid Family Workers | 0 | 0.0% |
| Total | 2,709 | 100.0% |
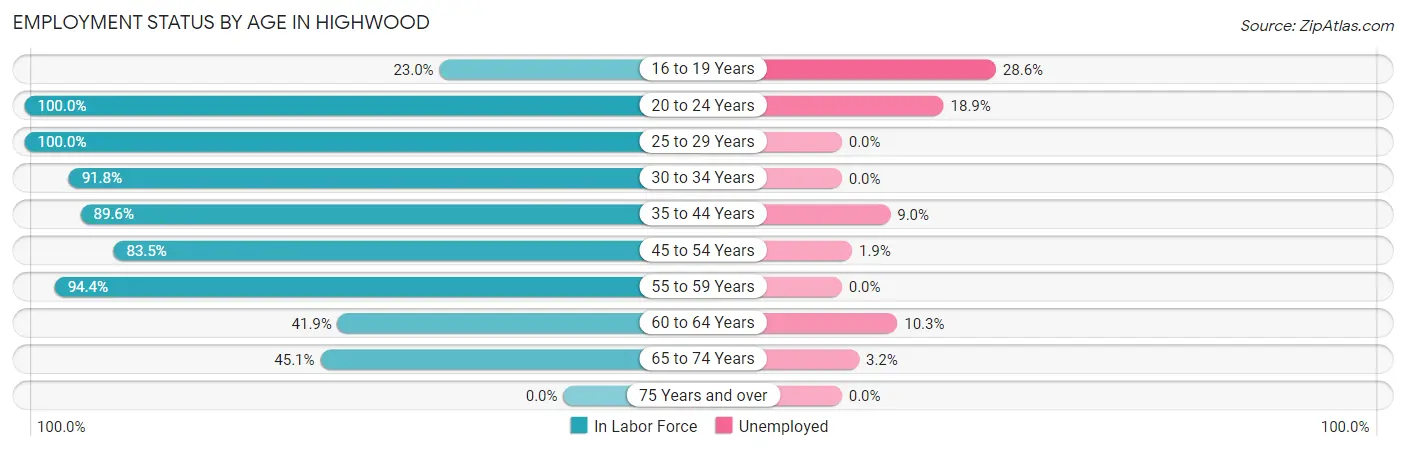
Employment Status by Age in Highwood
According to the labor force statistics for Highwood, out of the total population over 16 years of age (4,120), 70.9% or 2,921 individuals are in the labor force, with 6.7% or 196 of them unemployed. The age group with the highest labor force participation rate is 20 to 24 years, with 100.0% or 476 individuals in the labor force. Within the labor force, the 16 to 19 years age range has the highest percentage of unemployed individuals, with 28.6% or 20 of them being unemployed.
| Age Bracket | In Labor Force | Unemployed |
| 16 to 19 Years | 70 (23.0%) | 20 (28.6%) |
| 20 to 24 Years | 476 (100.0%) | 90 (18.9%) |
| 25 to 29 Years | 253 (100.0%) | 0 (0.0%) |
| 30 to 34 Years | 349 (91.8%) | 0 (0.0%) |
| 35 to 44 Years | 602 (89.6%) | 54 (9.0%) |
| 45 to 54 Years | 467 (83.5%) | 9 (1.9%) |
| 55 to 59 Years | 336 (94.4%) | 0 (0.0%) |
| 60 to 64 Years | 117 (41.9%) | 12 (10.3%) |
| 65 to 74 Years | 251 (45.1%) | 8 (3.2%) |
| 75 Years and over | 0 (0.0%) | 0 (0.0%) |
| Total | 2,921 (70.9%) | 196 (6.7%) |
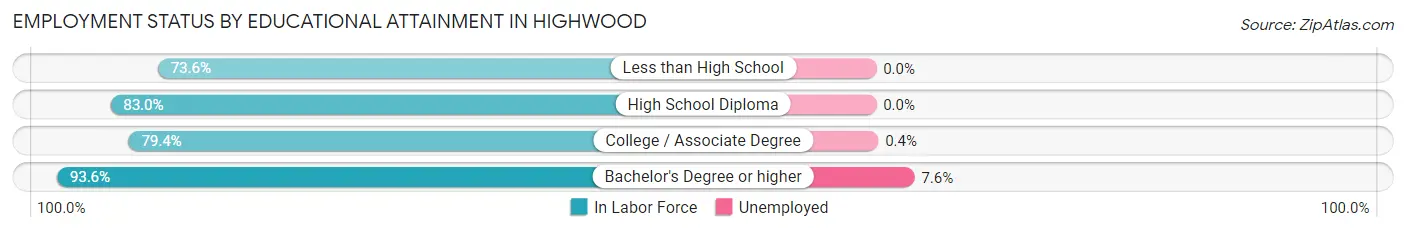
Employment Status by Educational Attainment in Highwood
According to labor force statistics for Highwood, 85.0% of individuals (2,124) out of the total population between 25 and 64 years of age (2,499) are in the labor force, with 3.6% or 76 of them being unemployed. The group with the highest labor force participation rate are those with the educational attainment of bachelor's degree or higher, with 93.6% or 987 individuals in the labor force. Within the labor force, individuals with bachelor's degree or higher education have the highest percentage of unemployment, with 7.6% or 75 of them being unemployed.
| Educational Attainment | In Labor Force | Unemployed |
| Less than High School | 374 (73.6%) | 0 (0.0%) |
| High School Diploma | 438 (83.0%) | 0 (0.0%) |
| College / Associate Degree | 324 (79.4%) | 2 (0.4%) |
| Bachelor's Degree or higher | 987 (93.6%) | 80 (7.6%) |
| Total | 2,124 (85.0%) | 90 (3.6%) |
Employment Occupations by Sex in Highwood
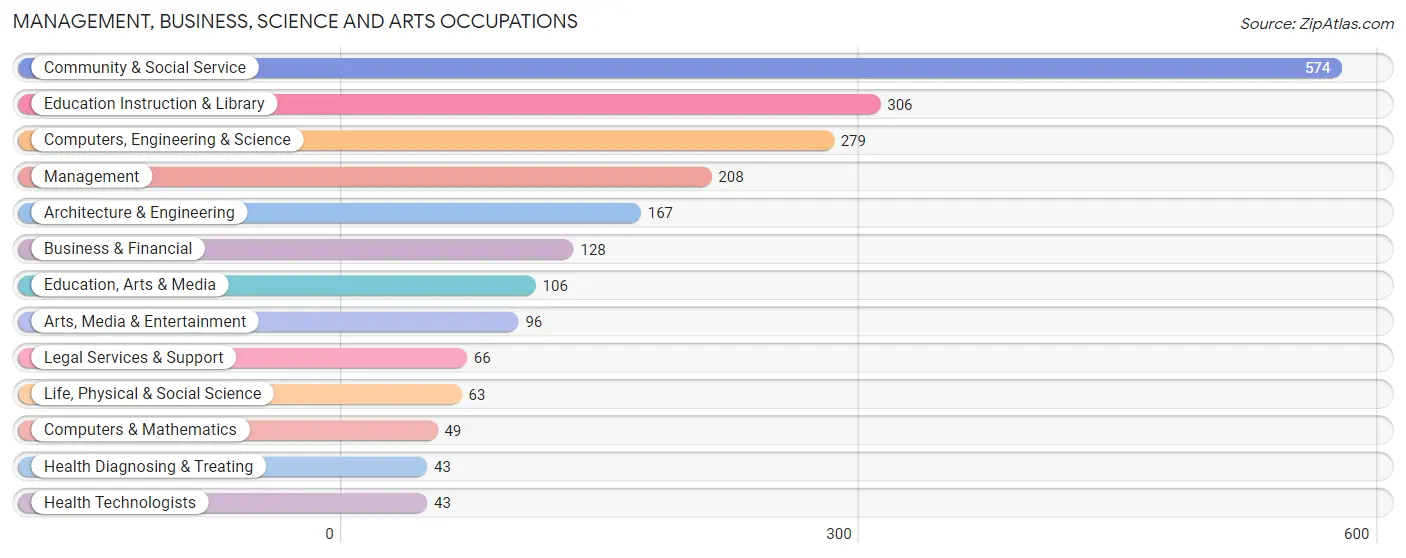
Management, Business, Science and Arts Occupations
The most common Management, Business, Science and Arts occupations in Highwood are Community & Social Service (574 | 21.5%), Education Instruction & Library (306 | 11.5%), Computers, Engineering & Science (279 | 10.5%), Management (208 | 7.8%), and Architecture & Engineering (167 | 6.3%).
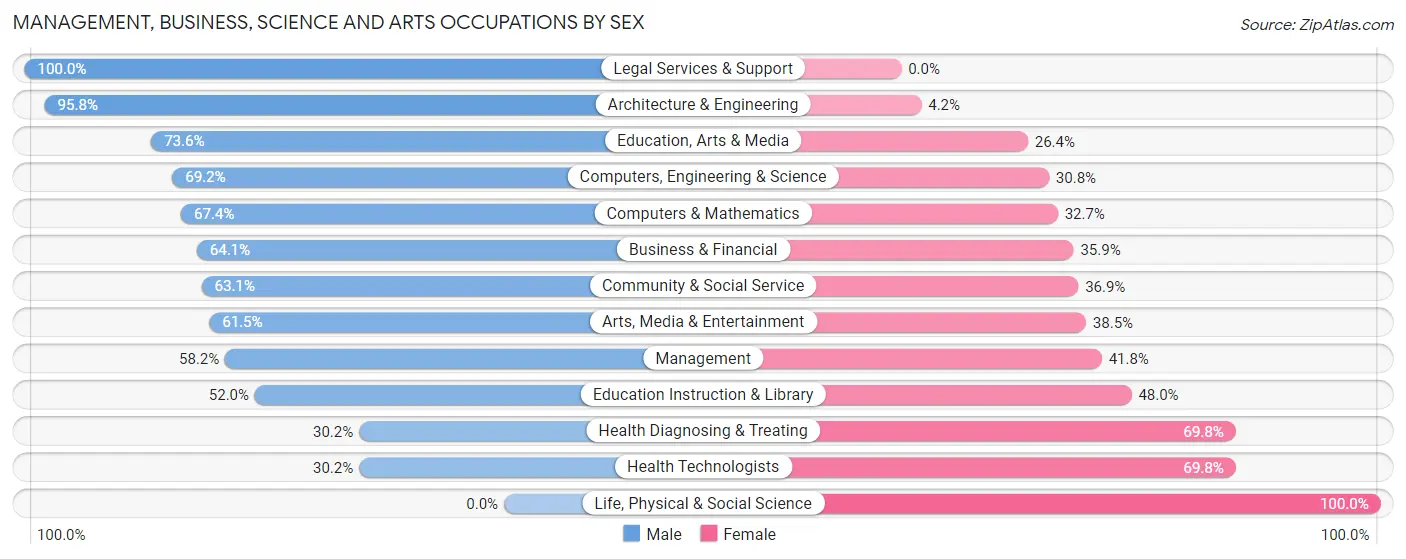
Management, Business, Science and Arts Occupations by Sex
Within the Management, Business, Science and Arts occupations in Highwood, the most male-oriented occupations are Legal Services & Support (100.0%), Architecture & Engineering (95.8%), and Education, Arts & Media (73.6%), while the most female-oriented occupations are Life, Physical & Social Science (100.0%), Health Diagnosing & Treating (69.8%), and Health Technologists (69.8%).
| Occupation | Male | Female |
| Management | 121 (58.2%) | 87 (41.8%) |
| Business & Financial | 82 (64.1%) | 46 (35.9%) |
| Computers, Engineering & Science | 193 (69.2%) | 86 (30.8%) |
| Computers & Mathematics | 33 (67.3%) | 16 (32.7%) |
| Architecture & Engineering | 160 (95.8%) | 7 (4.2%) |
| Life, Physical & Social Science | 0 (0.0%) | 63 (100.0%) |
| Community & Social Service | 362 (63.1%) | 212 (36.9%) |
| Education, Arts & Media | 78 (73.6%) | 28 (26.4%) |
| Legal Services & Support | 66 (100.0%) | 0 (0.0%) |
| Education Instruction & Library | 159 (52.0%) | 147 (48.0%) |
| Arts, Media & Entertainment | 59 (61.5%) | 37 (38.5%) |
| Health Diagnosing & Treating | 13 (30.2%) | 30 (69.8%) |
| Health Technologists | 13 (30.2%) | 30 (69.8%) |
| Total (Category) | 771 (62.6%) | 461 (37.4%) |
| Total (Overall) | 1,621 (60.8%) | 1,046 (39.2%) |
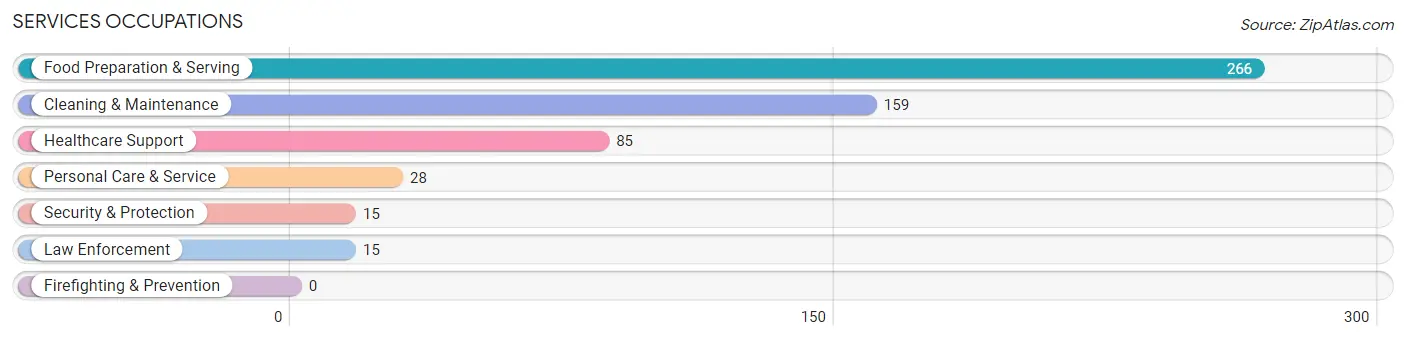
Services Occupations
The most common Services occupations in Highwood are Food Preparation & Serving (266 | 10.0%), Cleaning & Maintenance (159 | 6.0%), Healthcare Support (85 | 3.2%), Personal Care & Service (28 | 1.1%), and Security & Protection (15 | 0.6%).
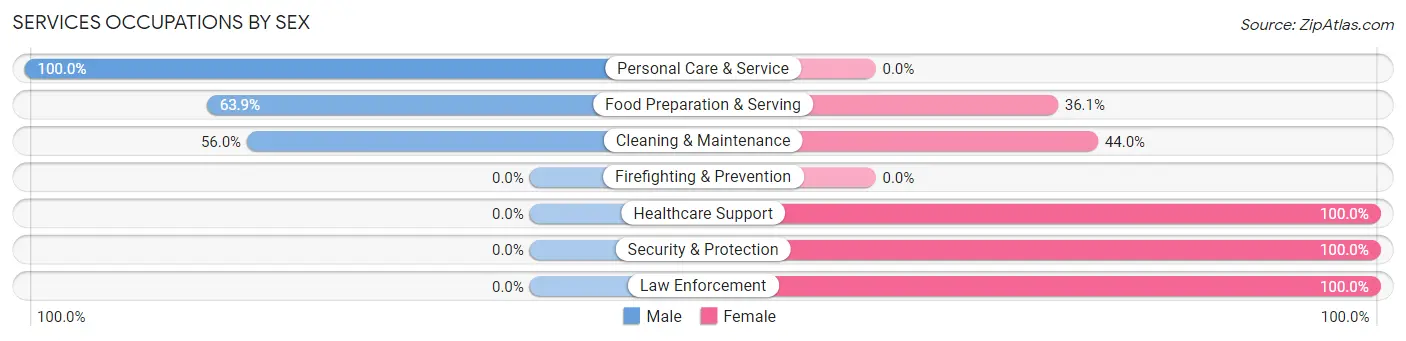
Services Occupations by Sex
Within the Services occupations in Highwood, the most male-oriented occupations are Personal Care & Service (100.0%), Food Preparation & Serving (63.9%), and Cleaning & Maintenance (56.0%), while the most female-oriented occupations are Healthcare Support (100.0%), Security & Protection (100.0%), and Law Enforcement (100.0%).
| Occupation | Male | Female |
| Healthcare Support | 0 (0.0%) | 85 (100.0%) |
| Security & Protection | 0 (0.0%) | 15 (100.0%) |
| Firefighting & Prevention | 0 (0.0%) | 0 (0.0%) |
| Law Enforcement | 0 (0.0%) | 15 (100.0%) |
| Food Preparation & Serving | 170 (63.9%) | 96 (36.1%) |
| Cleaning & Maintenance | 89 (56.0%) | 70 (44.0%) |
| Personal Care & Service | 28 (100.0%) | 0 (0.0%) |
| Total (Category) | 287 (51.9%) | 266 (48.1%) |
| Total (Overall) | 1,621 (60.8%) | 1,046 (39.2%) |
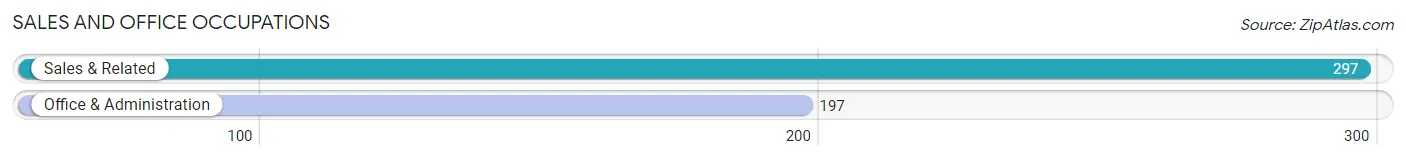
Sales and Office Occupations
The most common Sales and Office occupations in Highwood are Sales & Related (297 | 11.1%), and Office & Administration (197 | 7.4%).
Sales and Office Occupations by Sex
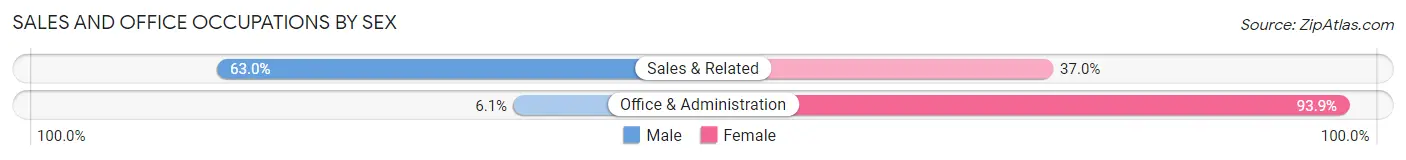
| Occupation | Male | Female |
| Sales & Related | 187 (63.0%) | 110 (37.0%) |
| Office & Administration | 12 (6.1%) | 185 (93.9%) |
| Total (Category) | 199 (40.3%) | 295 (59.7%) |
| Total (Overall) | 1,621 (60.8%) | 1,046 (39.2%) |
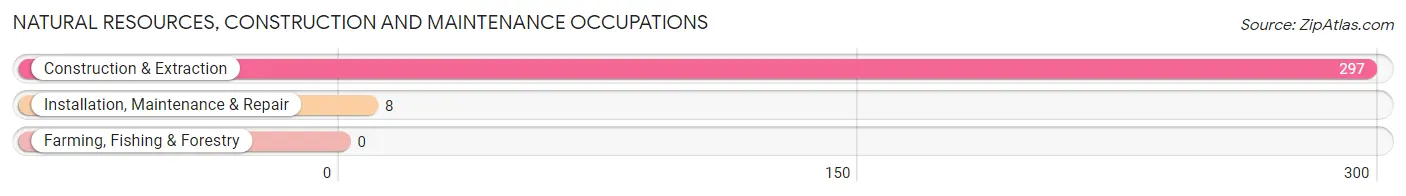
Natural Resources, Construction and Maintenance Occupations
The most common Natural Resources, Construction and Maintenance occupations in Highwood are Construction & Extraction (297 | 11.1%), and Installation, Maintenance & Repair (8 | 0.3%).
Natural Resources, Construction and Maintenance Occupations by Sex
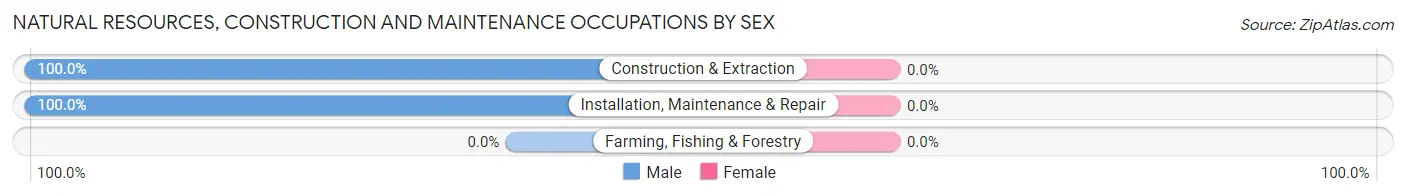
| Occupation | Male | Female |
| Farming, Fishing & Forestry | 0 (0.0%) | 0 (0.0%) |
| Construction & Extraction | 297 (100.0%) | 0 (0.0%) |
| Installation, Maintenance & Repair | 8 (100.0%) | 0 (0.0%) |
| Total (Category) | 305 (100.0%) | 0 (0.0%) |
| Total (Overall) | 1,621 (60.8%) | 1,046 (39.2%) |
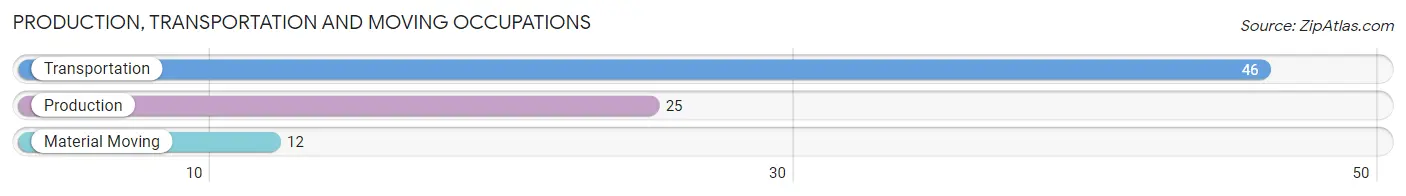
Production, Transportation and Moving Occupations
The most common Production, Transportation and Moving occupations in Highwood are Transportation (46 | 1.7%), Production (25 | 0.9%), and Material Moving (12 | 0.4%).
Production, Transportation and Moving Occupations by Sex
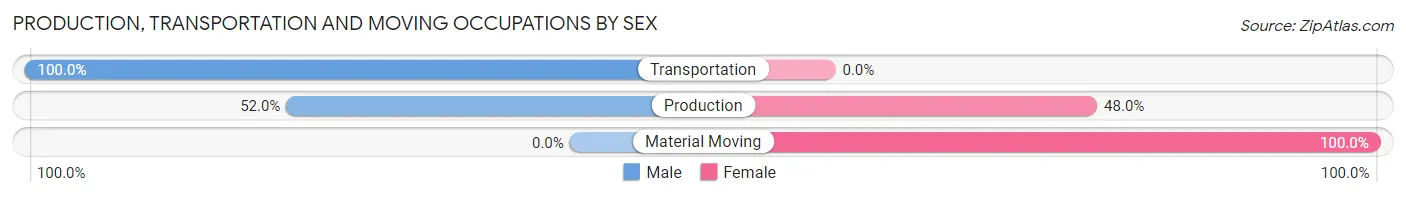
| Occupation | Male | Female |
| Production | 13 (52.0%) | 12 (48.0%) |
| Transportation | 46 (100.0%) | 0 (0.0%) |
| Material Moving | 0 (0.0%) | 12 (100.0%) |
| Total (Category) | 59 (71.1%) | 24 (28.9%) |
| Total (Overall) | 1,621 (60.8%) | 1,046 (39.2%) |
Employment Industries by Sex in Highwood
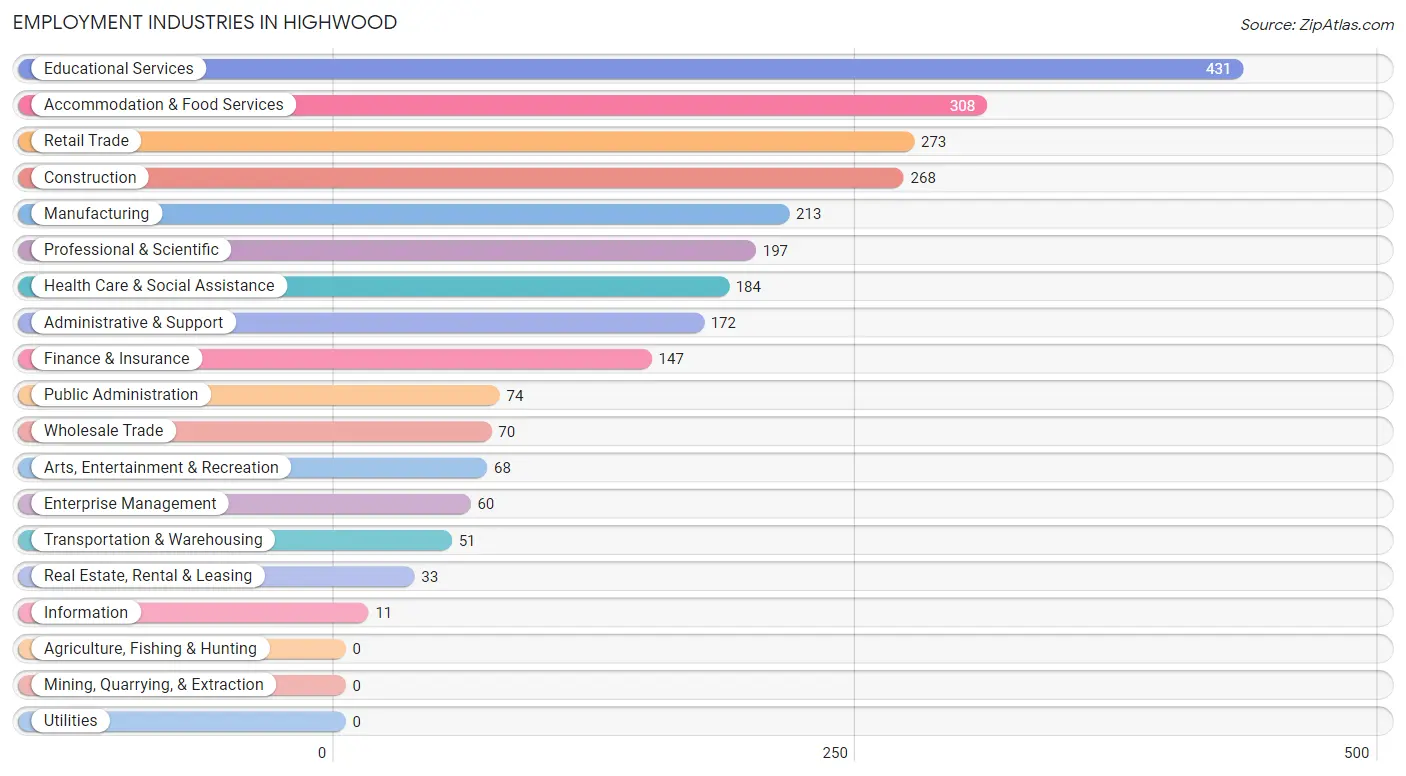
Employment Industries in Highwood
The major employment industries in Highwood include Educational Services (431 | 16.2%), Accommodation & Food Services (308 | 11.6%), Retail Trade (273 | 10.2%), Construction (268 | 10.1%), and Manufacturing (213 | 8.0%).
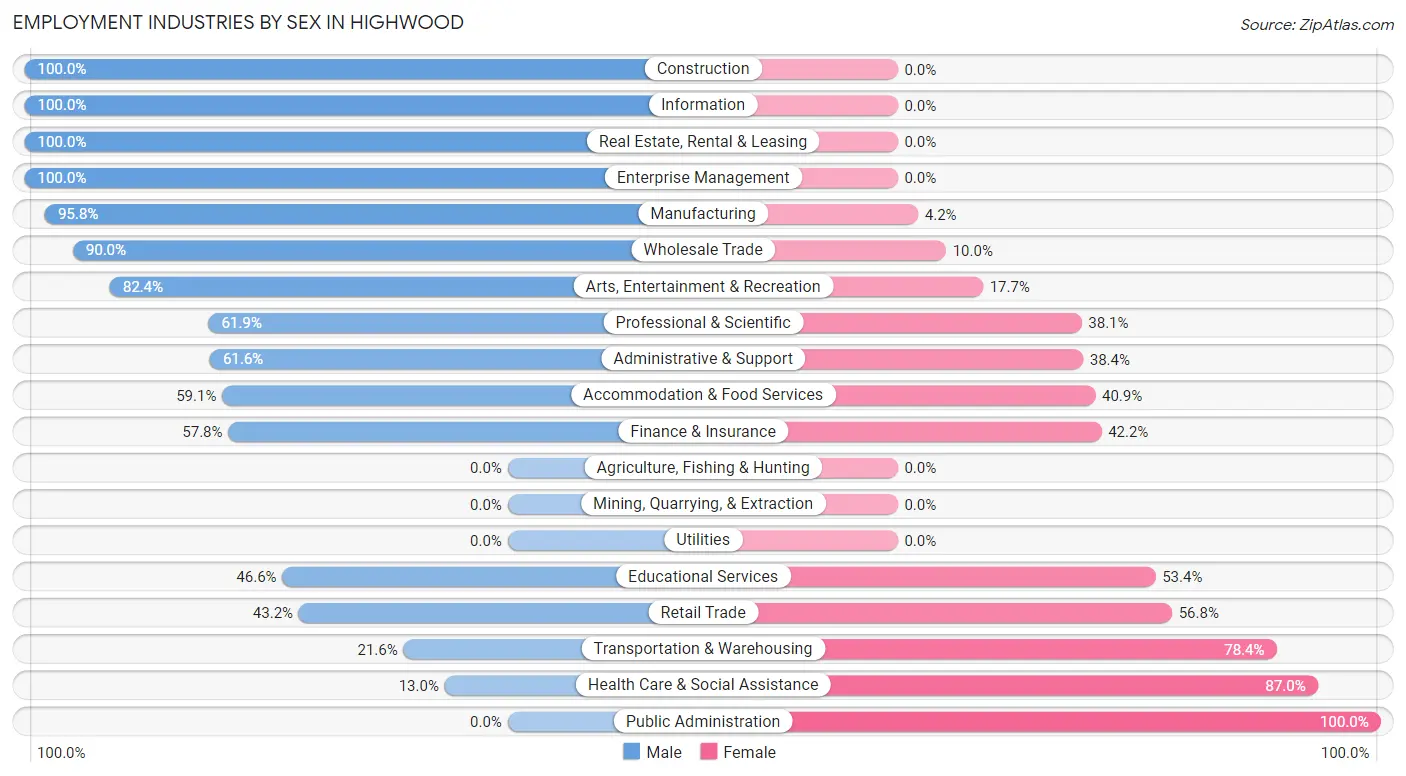
Employment Industries by Sex in Highwood
The Highwood industries that see more men than women are Construction (100.0%), Information (100.0%), and Real Estate, Rental & Leasing (100.0%), whereas the industries that tend to have a higher number of women are Public Administration (100.0%), Health Care & Social Assistance (87.0%), and Transportation & Warehousing (78.4%).
| Industry | Male | Female |
| Agriculture, Fishing & Hunting | 0 (0.0%) | 0 (0.0%) |
| Mining, Quarrying, & Extraction | 0 (0.0%) | 0 (0.0%) |
| Construction | 268 (100.0%) | 0 (0.0%) |
| Manufacturing | 204 (95.8%) | 9 (4.2%) |
| Wholesale Trade | 63 (90.0%) | 7 (10.0%) |
| Retail Trade | 118 (43.2%) | 155 (56.8%) |
| Transportation & Warehousing | 11 (21.6%) | 40 (78.4%) |
| Utilities | 0 (0.0%) | 0 (0.0%) |
| Information | 11 (100.0%) | 0 (0.0%) |
| Finance & Insurance | 85 (57.8%) | 62 (42.2%) |
| Real Estate, Rental & Leasing | 33 (100.0%) | 0 (0.0%) |
| Professional & Scientific | 122 (61.9%) | 75 (38.1%) |
| Enterprise Management | 60 (100.0%) | 0 (0.0%) |
| Administrative & Support | 106 (61.6%) | 66 (38.4%) |
| Educational Services | 201 (46.6%) | 230 (53.4%) |
| Health Care & Social Assistance | 24 (13.0%) | 160 (87.0%) |
| Arts, Entertainment & Recreation | 56 (82.4%) | 12 (17.6%) |
| Accommodation & Food Services | 182 (59.1%) | 126 (40.9%) |
| Public Administration | 0 (0.0%) | 74 (100.0%) |
| Total | 1,621 (60.8%) | 1,046 (39.2%) |
Education in Highwood
School Enrollment in Highwood
The most common levels of schooling among the 1,312 students in Highwood are elementary school (284 | 21.6%), college / undergraduate (273 | 20.8%), and high school (240 | 18.3%).
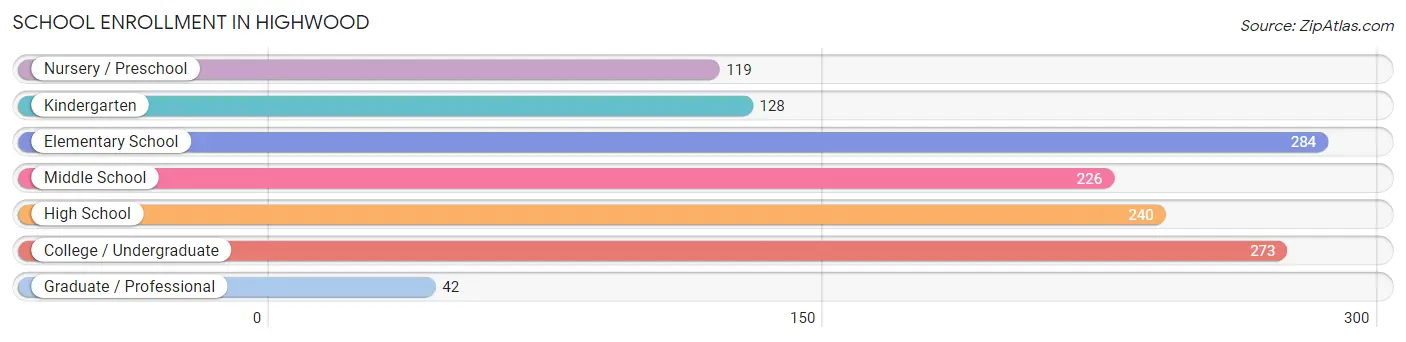
| School Level | # Students | % Students |
| Nursery / Preschool | 119 | 9.1% |
| Kindergarten | 128 | 9.8% |
| Elementary School | 284 | 21.6% |
| Middle School | 226 | 17.2% |
| High School | 240 | 18.3% |
| College / Undergraduate | 273 | 20.8% |
| Graduate / Professional | 42 | 3.2% |
| Total | 1,312 | 100.0% |
School Enrollment by Age by Funding Source in Highwood
Out of a total of 1,312 students who are enrolled in schools in Highwood, 213 (16.2%) attend a private institution, while the remaining 1,099 (83.8%) are enrolled in public schools. The age group of 25 to 34 year olds has the highest likelihood of being enrolled in private schools, with 45 (70.3% in the age bracket) enrolled. Conversely, the age group of 18 to 19 year olds has the lowest likelihood of being enrolled in a private school, with 78 (100.0% in the age bracket) attending a public institution.
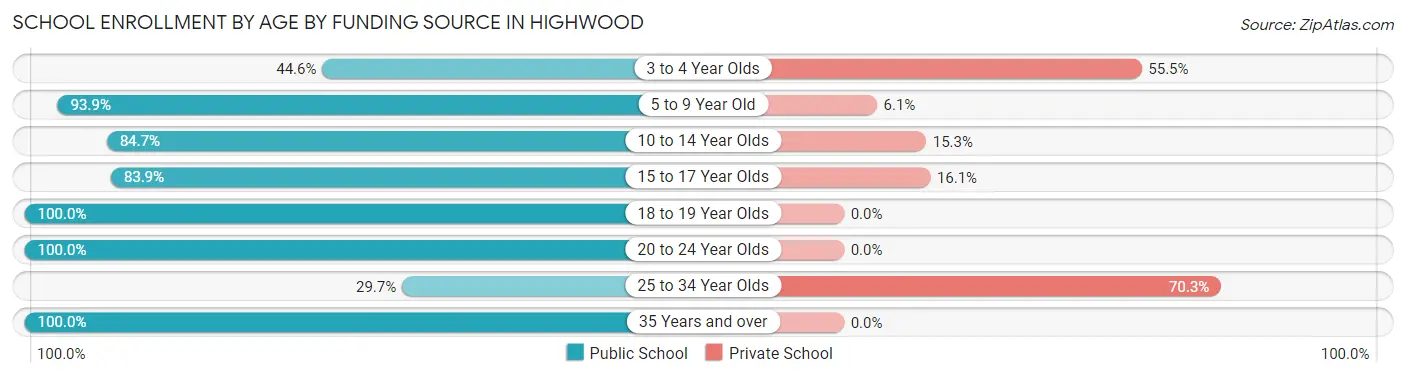
| Age Bracket | Public School | Private School |
| 3 to 4 Year Olds | 45 (44.6%) | 56 (55.4%) |
| 5 to 9 Year Old | 352 (93.9%) | 23 (6.1%) |
| 10 to 14 Year Olds | 238 (84.7%) | 43 (15.3%) |
| 15 to 17 Year Olds | 235 (83.9%) | 45 (16.1%) |
| 18 to 19 Year Olds | 78 (100.0%) | 0 (0.0%) |
| 20 to 24 Year Olds | 102 (100.0%) | 0 (0.0%) |
| 25 to 34 Year Olds | 19 (29.7%) | 45 (70.3%) |
| 35 Years and over | 31 (100.0%) | 0 (0.0%) |
| Total | 1,099 (83.8%) | 213 (16.2%) |
Educational Attainment by Field of Study in Highwood
Business (378 | 26.1%), science & technology (182 | 12.5%), education (155 | 10.7%), liberal arts & history (137 | 9.4%), and social sciences (117 | 8.1%) are the most common fields of study among 1,451 individuals in Highwood who have obtained a bachelor's degree or higher.
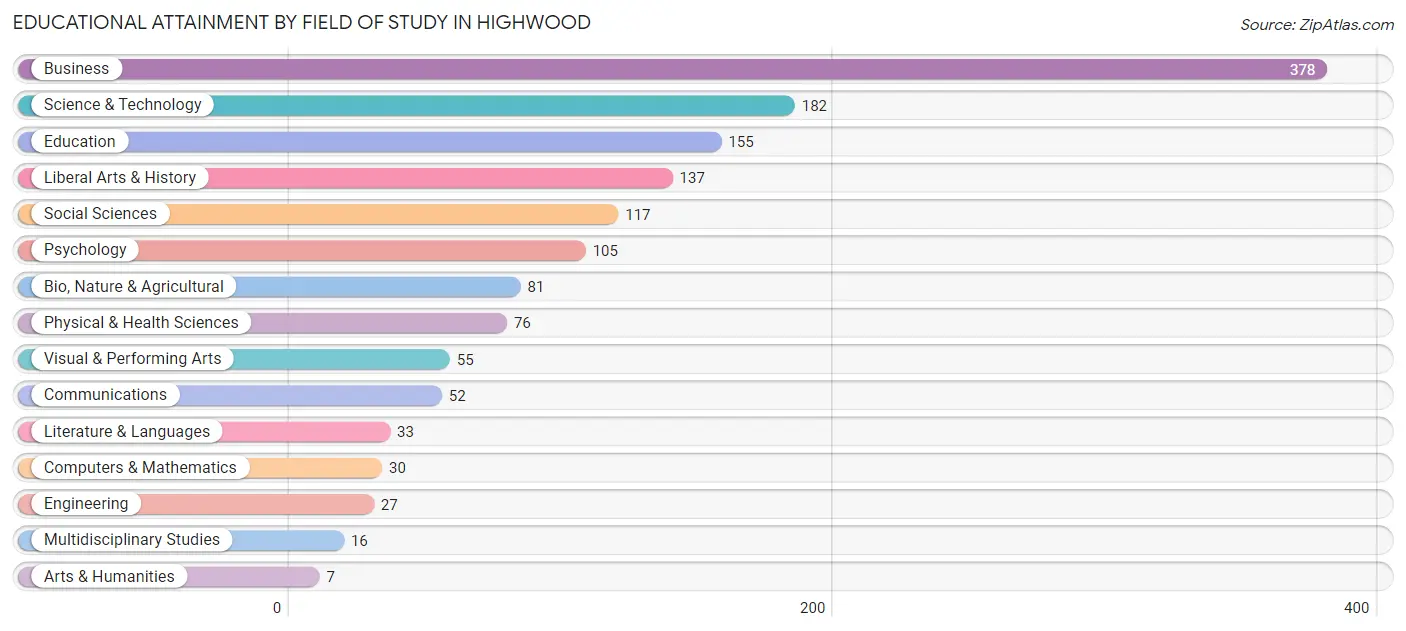
| Field of Study | # Graduates | % Graduates |
| Computers & Mathematics | 30 | 2.1% |
| Bio, Nature & Agricultural | 81 | 5.6% |
| Physical & Health Sciences | 76 | 5.2% |
| Psychology | 105 | 7.2% |
| Social Sciences | 117 | 8.1% |
| Engineering | 27 | 1.9% |
| Multidisciplinary Studies | 16 | 1.1% |
| Science & Technology | 182 | 12.5% |
| Business | 378 | 26.1% |
| Education | 155 | 10.7% |
| Literature & Languages | 33 | 2.3% |
| Liberal Arts & History | 137 | 9.4% |
| Visual & Performing Arts | 55 | 3.8% |
| Communications | 52 | 3.6% |
| Arts & Humanities | 7 | 0.5% |
| Total | 1,451 | 100.0% |
Transportation & Commute in Highwood
Vehicle Availability by Sex in Highwood
The most prevalent vehicle ownership categories in Highwood are males with 2 vehicles (921, accounting for 57.2%) and females with 2 vehicles (744, making up 83.8%).
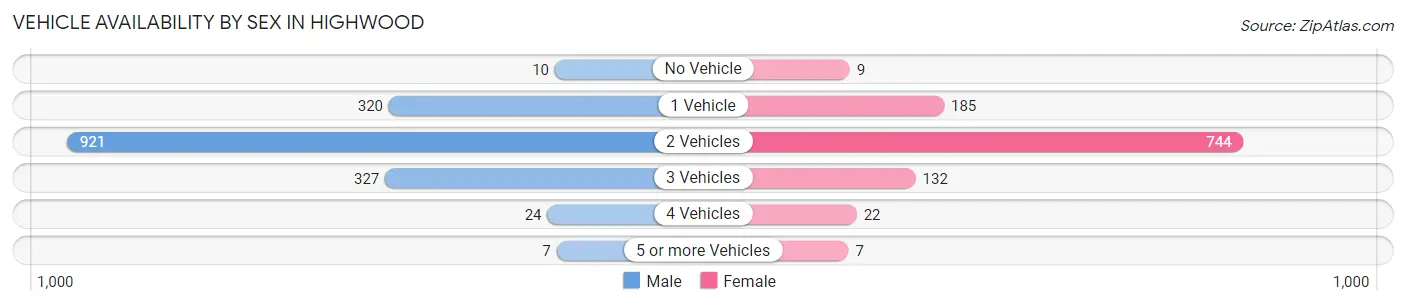
| Vehicles Available | Male | Female |
| No Vehicle | 10 (0.6%) | 9 (0.8%) |
| 1 Vehicle | 320 (19.9%) | 185 (16.8%) |
| 2 Vehicles | 921 (57.2%) | 744 (67.7%) |
| 3 Vehicles | 327 (20.3%) | 132 (12.0%) |
| 4 Vehicles | 24 (1.5%) | 22 (2.0%) |
| 5 or more Vehicles | 7 (0.4%) | 7 (0.6%) |
| Total | 1,609 (100.0%) | 1,099 (100.0%) |
Commute Time in Highwood
The most frequently occuring commute durations in Highwood are 15 to 19 minutes (605 commuters, 25.5%), 20 to 24 minutes (472 commuters, 19.9%), and 10 to 14 minutes (226 commuters, 9.5%).
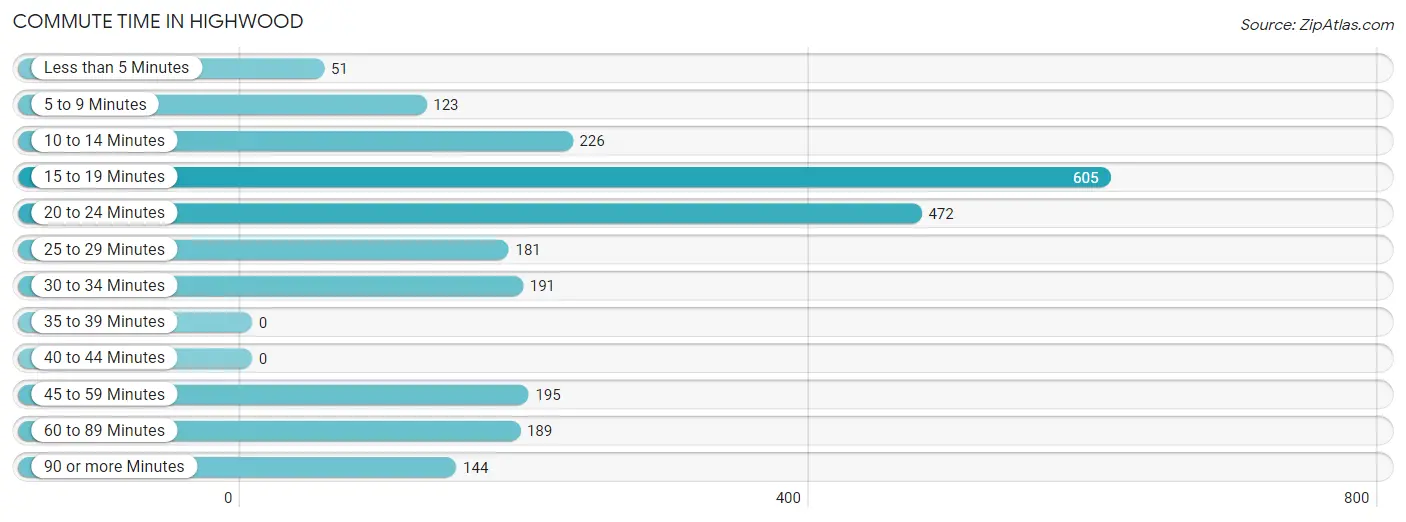
| Commute Time | # Commuters | % Commuters |
| Less than 5 Minutes | 51 | 2.1% |
| 5 to 9 Minutes | 123 | 5.2% |
| 10 to 14 Minutes | 226 | 9.5% |
| 15 to 19 Minutes | 605 | 25.5% |
| 20 to 24 Minutes | 472 | 19.9% |
| 25 to 29 Minutes | 181 | 7.6% |
| 30 to 34 Minutes | 191 | 8.0% |
| 35 to 39 Minutes | 0 | 0.0% |
| 40 to 44 Minutes | 0 | 0.0% |
| 45 to 59 Minutes | 195 | 8.2% |
| 60 to 89 Minutes | 189 | 8.0% |
| 90 or more Minutes | 144 | 6.1% |
Commute Time by Sex in Highwood
The most common commute times in Highwood are 20 to 24 minutes (259 commuters, 19.3%) for males and 15 to 19 minutes (347 commuters, 33.6%) for females.
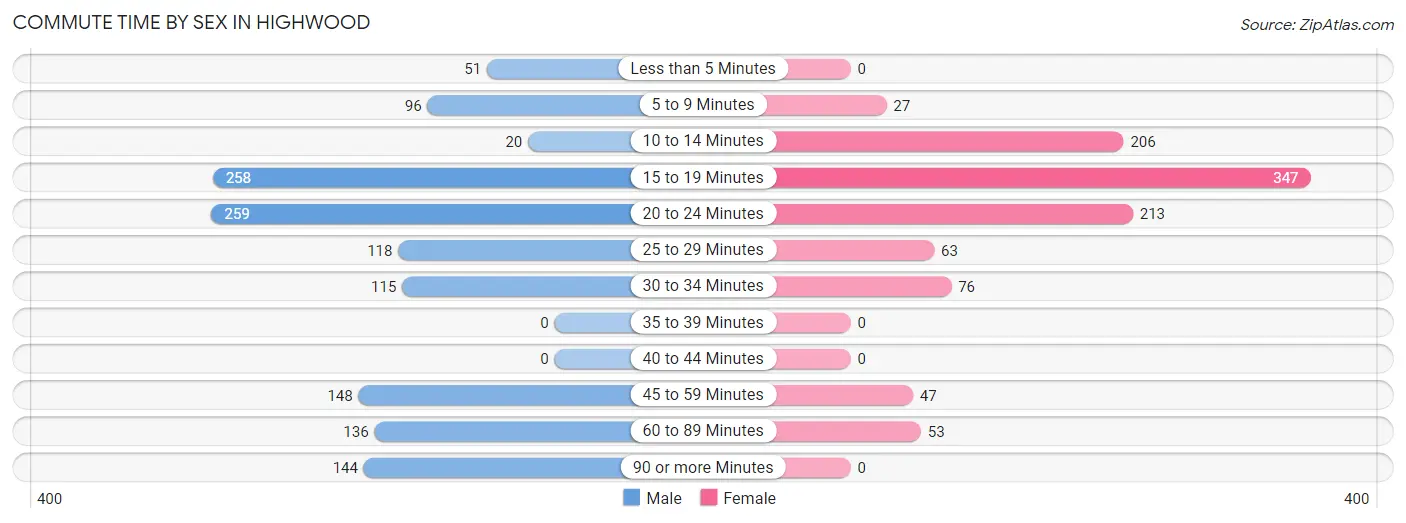
| Commute Time | Male | Female |
| Less than 5 Minutes | 51 (3.8%) | 0 (0.0%) |
| 5 to 9 Minutes | 96 (7.1%) | 27 (2.6%) |
| 10 to 14 Minutes | 20 (1.5%) | 206 (20.0%) |
| 15 to 19 Minutes | 258 (19.2%) | 347 (33.6%) |
| 20 to 24 Minutes | 259 (19.3%) | 213 (20.6%) |
| 25 to 29 Minutes | 118 (8.8%) | 63 (6.1%) |
| 30 to 34 Minutes | 115 (8.6%) | 76 (7.4%) |
| 35 to 39 Minutes | 0 (0.0%) | 0 (0.0%) |
| 40 to 44 Minutes | 0 (0.0%) | 0 (0.0%) |
| 45 to 59 Minutes | 148 (11.0%) | 47 (4.5%) |
| 60 to 89 Minutes | 136 (10.1%) | 53 (5.1%) |
| 90 or more Minutes | 144 (10.7%) | 0 (0.0%) |
Time of Departure to Work by Sex in Highwood
The most frequent times of departure to work in Highwood are 7:30 AM to 7:59 AM (214, 15.9%) for males and 7:00 AM to 7:29 AM (254, 24.6%) for females.
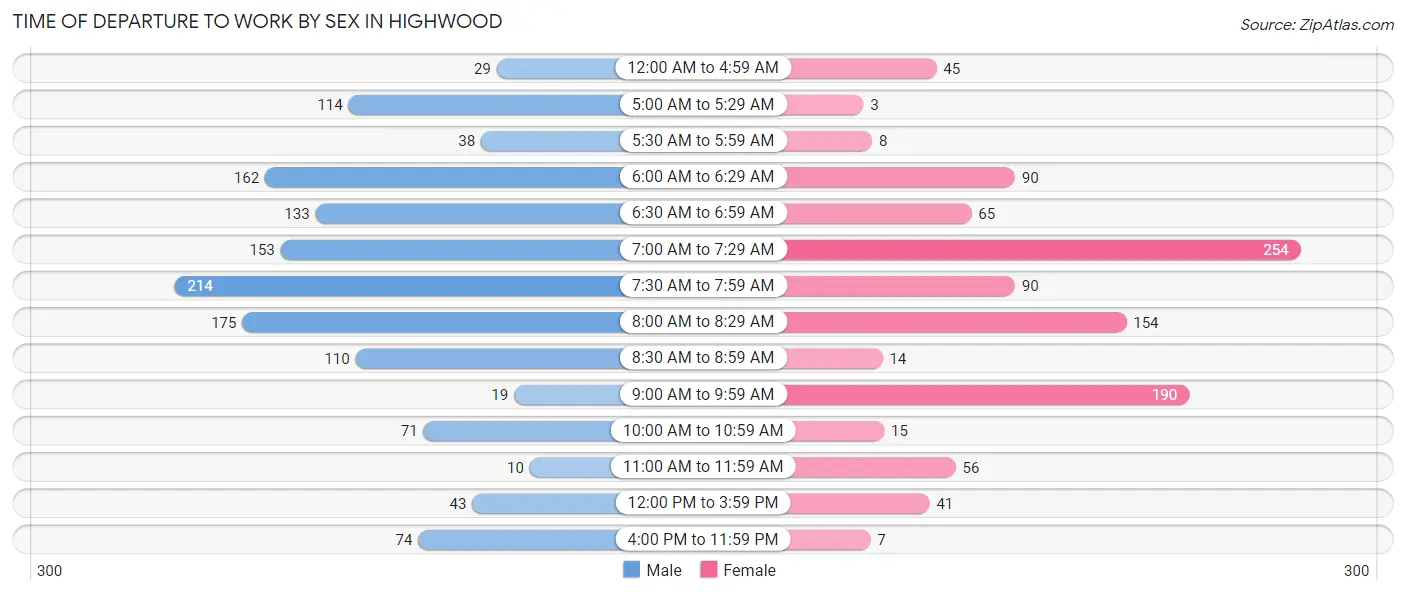
| Time of Departure | Male | Female |
| 12:00 AM to 4:59 AM | 29 (2.2%) | 45 (4.4%) |
| 5:00 AM to 5:29 AM | 114 (8.5%) | 3 (0.3%) |
| 5:30 AM to 5:59 AM | 38 (2.8%) | 8 (0.8%) |
| 6:00 AM to 6:29 AM | 162 (12.0%) | 90 (8.7%) |
| 6:30 AM to 6:59 AM | 133 (9.9%) | 65 (6.3%) |
| 7:00 AM to 7:29 AM | 153 (11.4%) | 254 (24.6%) |
| 7:30 AM to 7:59 AM | 214 (15.9%) | 90 (8.7%) |
| 8:00 AM to 8:29 AM | 175 (13.0%) | 154 (14.9%) |
| 8:30 AM to 8:59 AM | 110 (8.2%) | 14 (1.4%) |
| 9:00 AM to 9:59 AM | 19 (1.4%) | 190 (18.4%) |
| 10:00 AM to 10:59 AM | 71 (5.3%) | 15 (1.5%) |
| 11:00 AM to 11:59 AM | 10 (0.7%) | 56 (5.4%) |
| 12:00 PM to 3:59 PM | 43 (3.2%) | 41 (4.0%) |
| 4:00 PM to 11:59 PM | 74 (5.5%) | 7 (0.7%) |
| Total | 1,345 (100.0%) | 1,032 (100.0%) |
Housing Occupancy in Highwood
Occupancy by Ownership in Highwood
Of the total 1,904 dwellings in Highwood, owner-occupied units account for 958 (50.3%), while renter-occupied units make up 946 (49.7%).
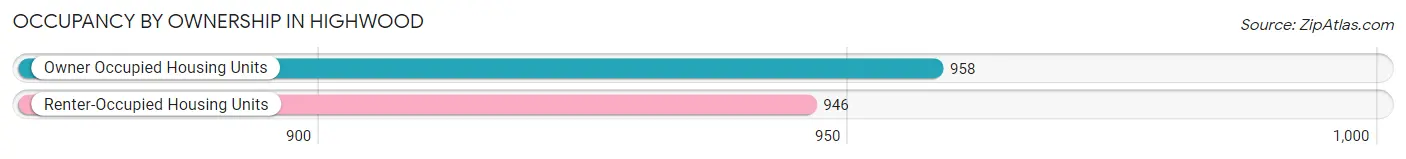
| Occupancy | # Housing Units | % Housing Units |
| Owner Occupied Housing Units | 958 | 50.3% |
| Renter-Occupied Housing Units | 946 | 49.7% |
| Total Occupied Housing Units | 1,904 | 100.0% |
Occupancy by Household Size in Highwood
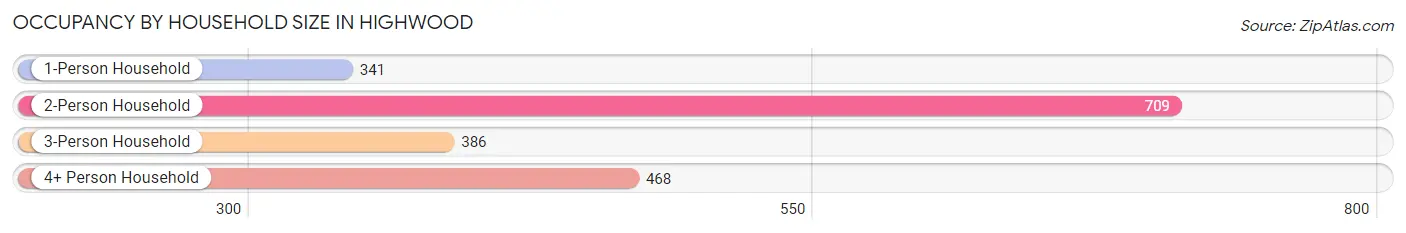
| Household Size | # Housing Units | % Housing Units |
| 1-Person Household | 341 | 17.9% |
| 2-Person Household | 709 | 37.2% |
| 3-Person Household | 386 | 20.3% |
| 4+ Person Household | 468 | 24.6% |
| Total Housing Units | 1,904 | 100.0% |
Occupancy by Ownership by Household Size in Highwood
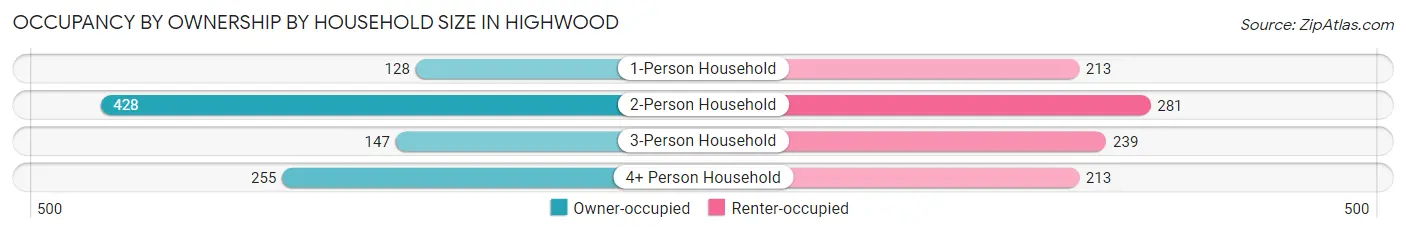
| Household Size | Owner-occupied | Renter-occupied |
| 1-Person Household | 128 (37.5%) | 213 (62.5%) |
| 2-Person Household | 428 (60.4%) | 281 (39.6%) |
| 3-Person Household | 147 (38.1%) | 239 (61.9%) |
| 4+ Person Household | 255 (54.5%) | 213 (45.5%) |
| Total Housing Units | 958 (50.3%) | 946 (49.7%) |
Occupancy by Educational Attainment in Highwood
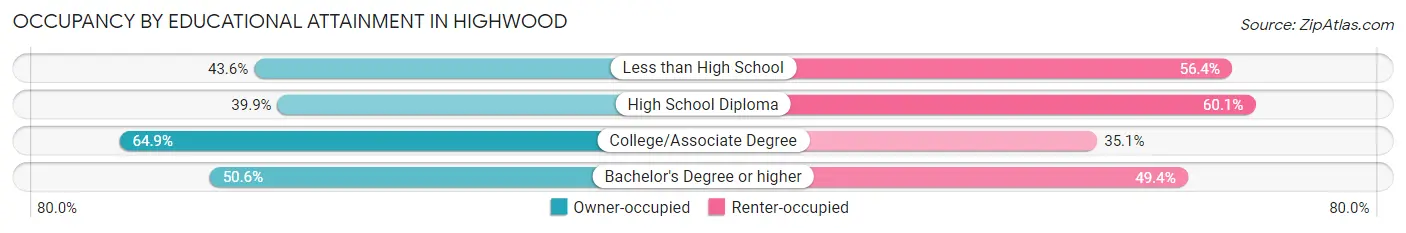
| Household Size | Owner-occupied | Renter-occupied |
| Less than High School | 109 (43.6%) | 141 (56.4%) |
| High School Diploma | 160 (39.9%) | 241 (60.1%) |
| College/Associate Degree | 248 (64.9%) | 134 (35.1%) |
| Bachelor's Degree or higher | 441 (50.6%) | 430 (49.4%) |
Occupancy by Age of Householder in Highwood
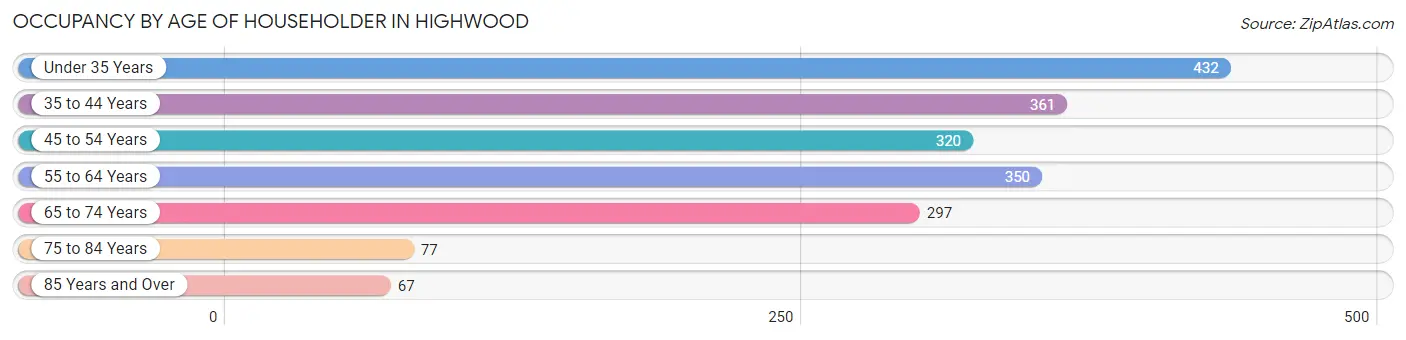
| Age Bracket | # Households | % Households |
| Under 35 Years | 432 | 22.7% |
| 35 to 44 Years | 361 | 19.0% |
| 45 to 54 Years | 320 | 16.8% |
| 55 to 64 Years | 350 | 18.4% |
| 65 to 74 Years | 297 | 15.6% |
| 75 to 84 Years | 77 | 4.0% |
| 85 Years and Over | 67 | 3.5% |
| Total | 1,904 | 100.0% |
Housing Finances in Highwood
Median Income by Occupancy in Highwood
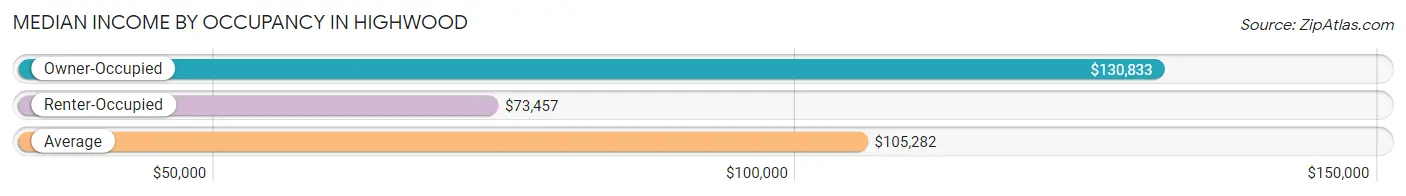
| Occupancy Type | # Households | Median Income |
| Owner-Occupied | 958 (50.3%) | $130,833 |
| Renter-Occupied | 946 (49.7%) | $73,457 |
| Average | 1,904 (100.0%) | $105,282 |
Occupancy by Householder Income Bracket in Highwood
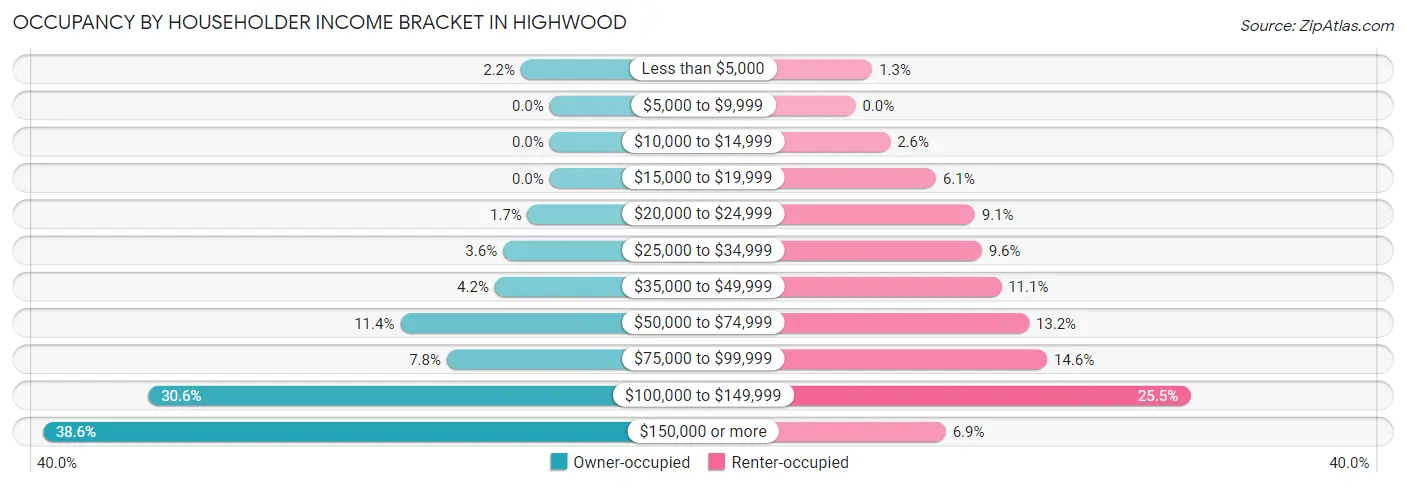
| Income Bracket | Owner-occupied | Renter-occupied |
| Less than $5,000 | 21 (2.2%) | 12 (1.3%) |
| $5,000 to $9,999 | 0 (0.0%) | 0 (0.0%) |
| $10,000 to $14,999 | 0 (0.0%) | 25 (2.6%) |
| $15,000 to $19,999 | 0 (0.0%) | 58 (6.1%) |
| $20,000 to $24,999 | 16 (1.7%) | 86 (9.1%) |
| $25,000 to $34,999 | 34 (3.5%) | 91 (9.6%) |
| $35,000 to $49,999 | 40 (4.2%) | 105 (11.1%) |
| $50,000 to $74,999 | 109 (11.4%) | 125 (13.2%) |
| $75,000 to $99,999 | 75 (7.8%) | 138 (14.6%) |
| $100,000 to $149,999 | 293 (30.6%) | 241 (25.5%) |
| $150,000 or more | 370 (38.6%) | 65 (6.9%) |
| Total | 958 (100.0%) | 946 (100.0%) |
Monthly Housing Cost Tiers in Highwood
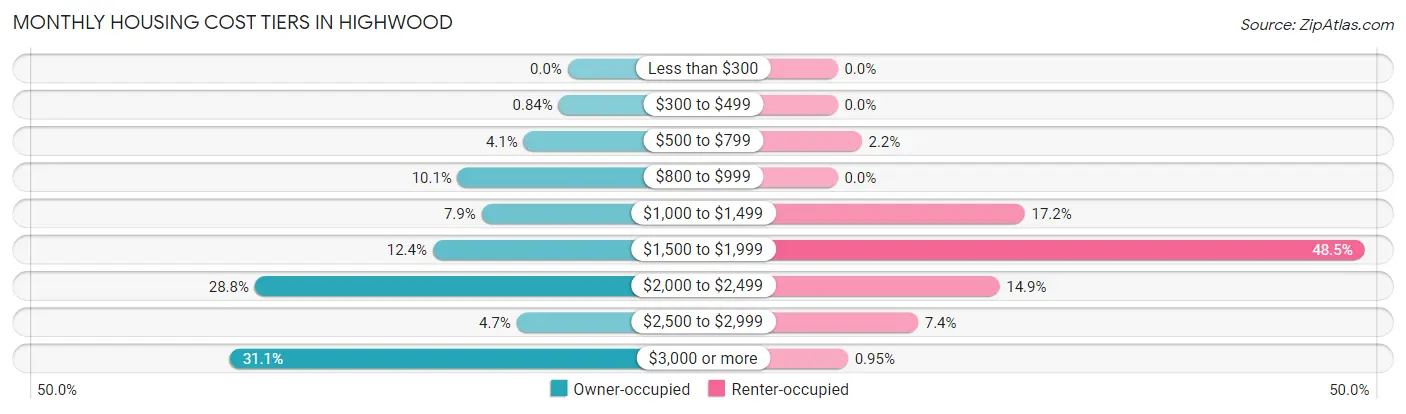
| Monthly Cost | Owner-occupied | Renter-occupied |
| Less than $300 | 0 (0.0%) | 0 (0.0%) |
| $300 to $499 | 8 (0.8%) | 0 (0.0%) |
| $500 to $799 | 39 (4.1%) | 21 (2.2%) |
| $800 to $999 | 97 (10.1%) | 0 (0.0%) |
| $1,000 to $1,499 | 76 (7.9%) | 163 (17.2%) |
| $1,500 to $1,999 | 119 (12.4%) | 459 (48.5%) |
| $2,000 to $2,499 | 276 (28.8%) | 141 (14.9%) |
| $2,500 to $2,999 | 45 (4.7%) | 70 (7.4%) |
| $3,000 or more | 298 (31.1%) | 9 (0.9%) |
| Total | 958 (100.0%) | 946 (100.0%) |
Physical Housing Characteristics in Highwood
Housing Structures in Highwood
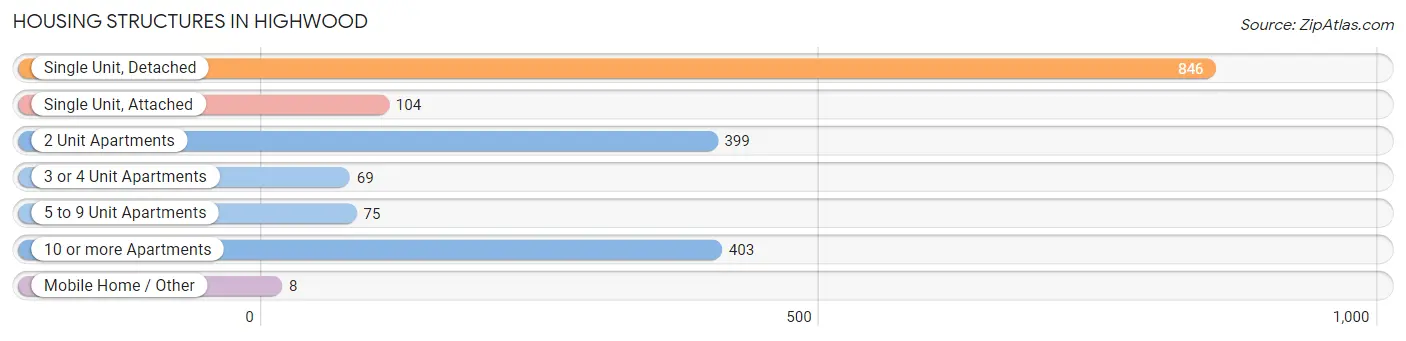
| Structure Type | # Housing Units | % Housing Units |
| Single Unit, Detached | 846 | 44.4% |
| Single Unit, Attached | 104 | 5.5% |
| 2 Unit Apartments | 399 | 21.0% |
| 3 or 4 Unit Apartments | 69 | 3.6% |
| 5 to 9 Unit Apartments | 75 | 3.9% |
| 10 or more Apartments | 403 | 21.2% |
| Mobile Home / Other | 8 | 0.4% |
| Total | 1,904 | 100.0% |
Housing Structures by Occupancy in Highwood
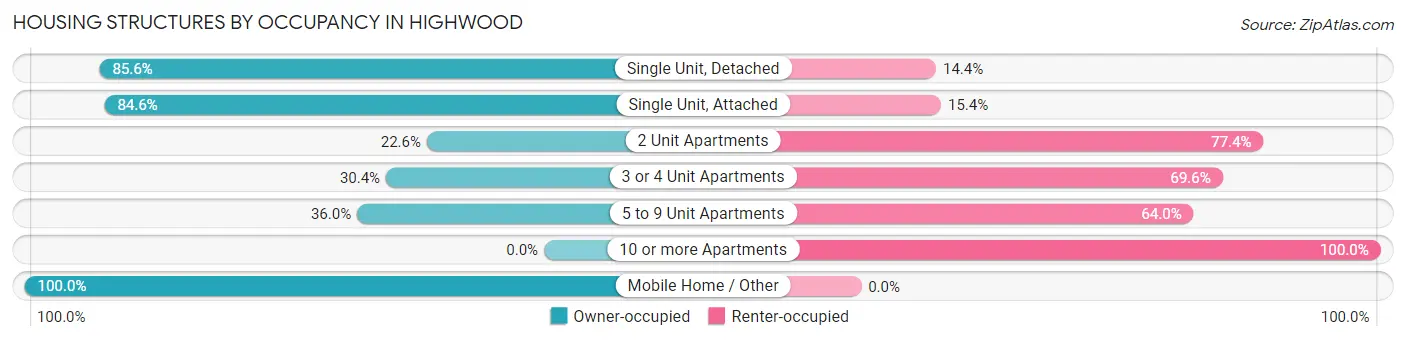
| Structure Type | Owner-occupied | Renter-occupied |
| Single Unit, Detached | 724 (85.6%) | 122 (14.4%) |
| Single Unit, Attached | 88 (84.6%) | 16 (15.4%) |
| 2 Unit Apartments | 90 (22.6%) | 309 (77.4%) |
| 3 or 4 Unit Apartments | 21 (30.4%) | 48 (69.6%) |
| 5 to 9 Unit Apartments | 27 (36.0%) | 48 (64.0%) |
| 10 or more Apartments | 0 (0.0%) | 403 (100.0%) |
| Mobile Home / Other | 8 (100.0%) | 0 (0.0%) |
| Total | 958 (50.3%) | 946 (49.7%) |
Housing Structures by Number of Rooms in Highwood
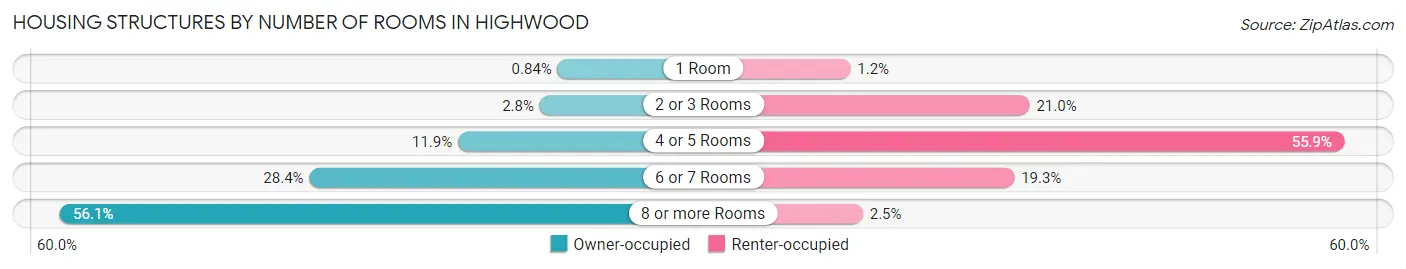
| Number of Rooms | Owner-occupied | Renter-occupied |
| 1 Room | 8 (0.8%) | 11 (1.2%) |
| 2 or 3 Rooms | 27 (2.8%) | 199 (21.0%) |
| 4 or 5 Rooms | 114 (11.9%) | 529 (55.9%) |
| 6 or 7 Rooms | 272 (28.4%) | 183 (19.3%) |
| 8 or more Rooms | 537 (56.0%) | 24 (2.5%) |
| Total | 958 (100.0%) | 946 (100.0%) |
Housing Structure by Heating Type in Highwood
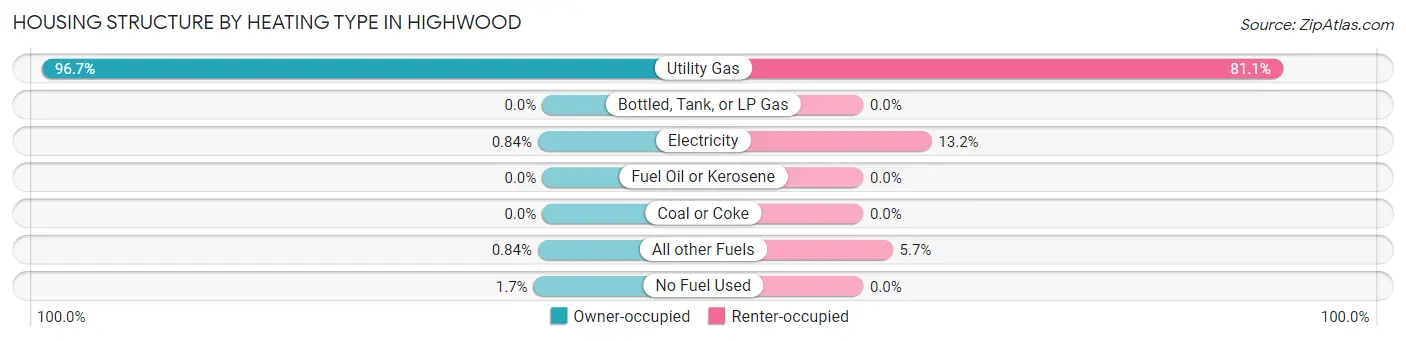
| Heating Type | Owner-occupied | Renter-occupied |
| Utility Gas | 926 (96.7%) | 767 (81.1%) |
| Bottled, Tank, or LP Gas | 0 (0.0%) | 0 (0.0%) |
| Electricity | 8 (0.8%) | 125 (13.2%) |
| Fuel Oil or Kerosene | 0 (0.0%) | 0 (0.0%) |
| Coal or Coke | 0 (0.0%) | 0 (0.0%) |
| All other Fuels | 8 (0.8%) | 54 (5.7%) |
| No Fuel Used | 16 (1.7%) | 0 (0.0%) |
| Total | 958 (100.0%) | 946 (100.0%) |
Household Vehicle Usage in Highwood
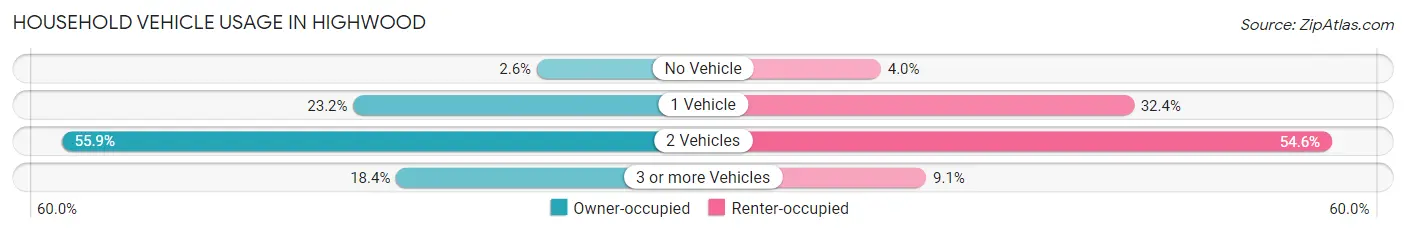
| Vehicles per Household | Owner-occupied | Renter-occupied |
| No Vehicle | 25 (2.6%) | 38 (4.0%) |
| 1 Vehicle | 222 (23.2%) | 306 (32.4%) |
| 2 Vehicles | 535 (55.8%) | 516 (54.5%) |
| 3 or more Vehicles | 176 (18.4%) | 86 (9.1%) |
| Total | 958 (100.0%) | 946 (100.0%) |
Real Estate & Mortgages in Highwood
Real Estate and Mortgage Overview in Highwood
| Characteristic | Without Mortgage | With Mortgage |
| Housing Units | 404 | 554 |
| Median Property Value | $575,200 | $460,300 |
| Median Household Income | $108,000 | $312 |
| Monthly Housing Costs | $1,390 | $290 |
| Real Estate Taxes | $10,001 | $0 |
Property Value by Mortgage Status in Highwood
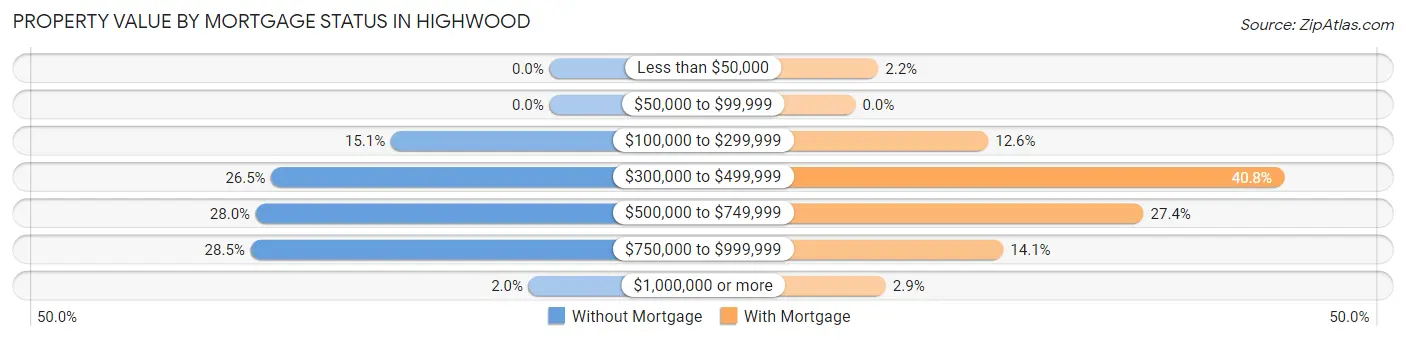
| Property Value | Without Mortgage | With Mortgage |
| Less than $50,000 | 0 (0.0%) | 12 (2.2%) |
| $50,000 to $99,999 | 0 (0.0%) | 0 (0.0%) |
| $100,000 to $299,999 | 61 (15.1%) | 70 (12.6%) |
| $300,000 to $499,999 | 107 (26.5%) | 226 (40.8%) |
| $500,000 to $749,999 | 113 (28.0%) | 152 (27.4%) |
| $750,000 to $999,999 | 115 (28.5%) | 78 (14.1%) |
| $1,000,000 or more | 8 (2.0%) | 16 (2.9%) |
| Total | 404 (100.0%) | 554 (100.0%) |
Household Income by Mortgage Status in Highwood
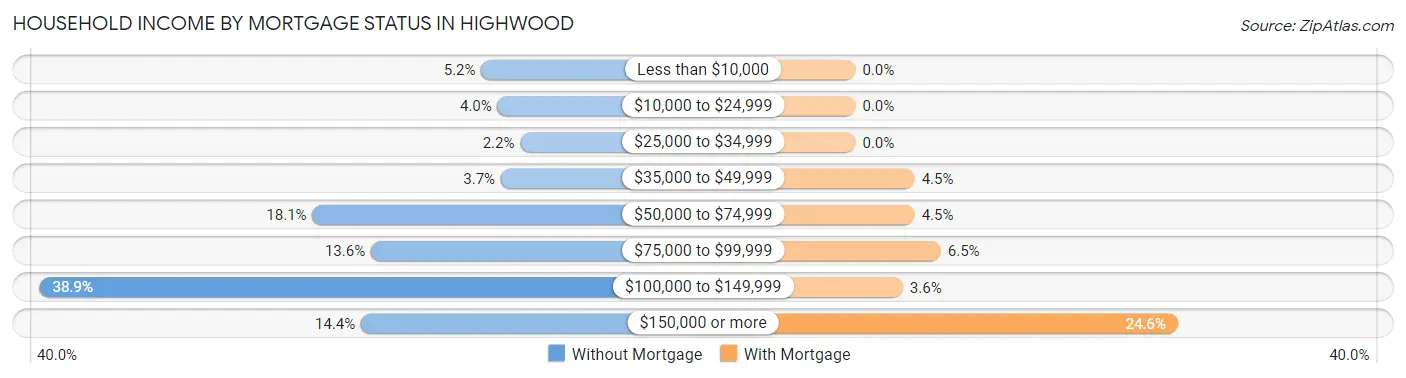
| Household Income | Without Mortgage | With Mortgage |
| Less than $10,000 | 21 (5.2%) | 0 (0.0%) |
| $10,000 to $24,999 | 16 (4.0%) | 0 (0.0%) |
| $25,000 to $34,999 | 9 (2.2%) | 0 (0.0%) |
| $35,000 to $49,999 | 15 (3.7%) | 25 (4.5%) |
| $50,000 to $74,999 | 73 (18.1%) | 25 (4.5%) |
| $75,000 to $99,999 | 55 (13.6%) | 36 (6.5%) |
| $100,000 to $149,999 | 157 (38.9%) | 20 (3.6%) |
| $150,000 or more | 58 (14.4%) | 136 (24.5%) |
| Total | 404 (100.0%) | 554 (100.0%) |
Property Value to Household Income Ratio in Highwood
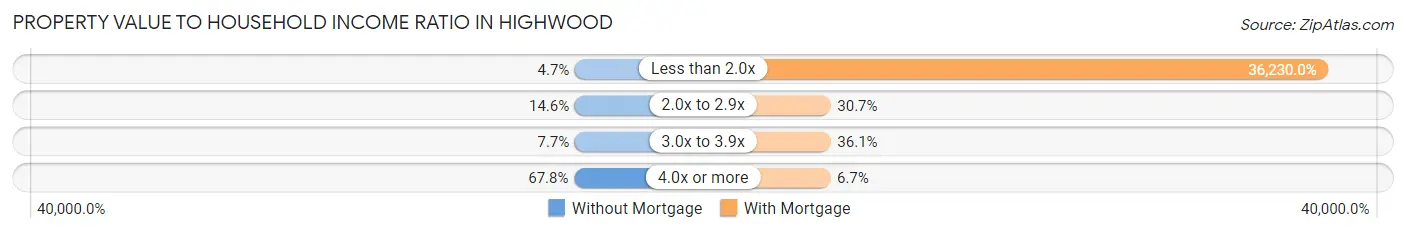
| Value-to-Income Ratio | Without Mortgage | With Mortgage |
| Less than 2.0x | 19 (4.7%) | 200,714 (36,230.0%) |
| 2.0x to 2.9x | 59 (14.6%) | 170 (30.7%) |
| 3.0x to 3.9x | 31 (7.7%) | 200 (36.1%) |
| 4.0x or more | 274 (67.8%) | 37 (6.7%) |
| Total | 404 (100.0%) | 554 (100.0%) |
Real Estate Taxes by Mortgage Status in Highwood
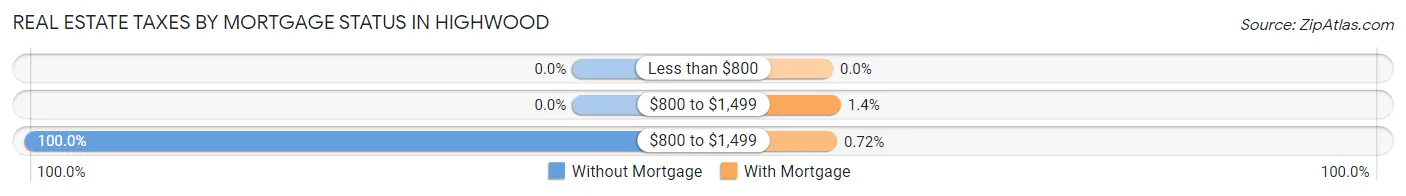
| Property Taxes | Without Mortgage | With Mortgage |
| Less than $800 | 0 (0.0%) | 0 (0.0%) |
| $800 to $1,499 | 0 (0.0%) | 8 (1.4%) |
| $800 to $1,499 | 404 (100.0%) | 4 (0.7%) |
| Total | 404 (100.0%) | 554 (100.0%) |
Health & Disability in Highwood
Health Insurance Coverage by Age in Highwood
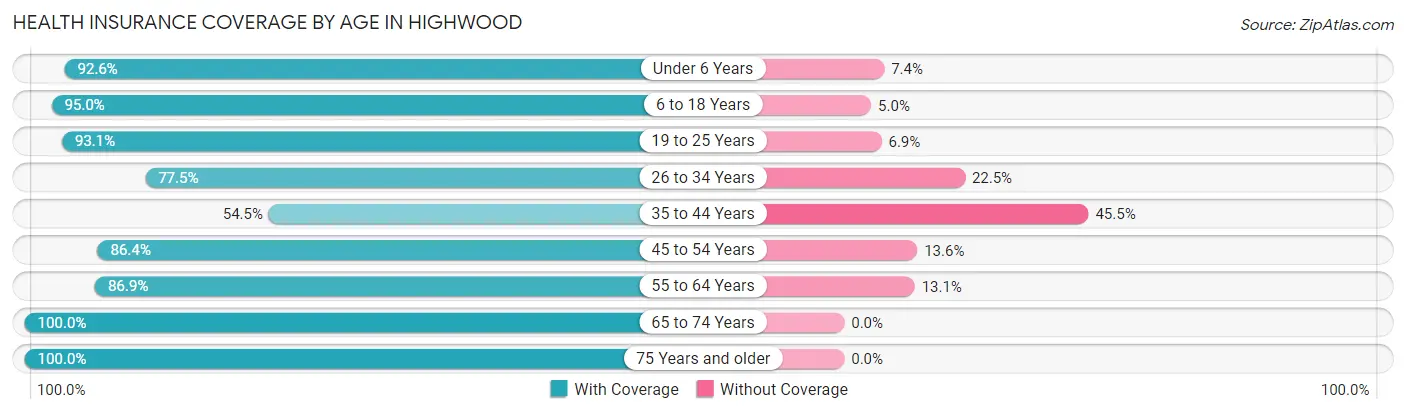
| Age Bracket | With Coverage | Without Coverage |
| Under 6 Years | 398 (92.6%) | 32 (7.4%) |
| 6 to 18 Years | 872 (95.0%) | 46 (5.0%) |
| 19 to 25 Years | 550 (93.1%) | 41 (6.9%) |
| 26 to 34 Years | 403 (77.5%) | 117 (22.5%) |
| 35 to 44 Years | 366 (54.5%) | 306 (45.5%) |
| 45 to 54 Years | 483 (86.4%) | 76 (13.6%) |
| 55 to 64 Years | 536 (86.9%) | 81 (13.1%) |
| 65 to 74 Years | 557 (100.0%) | 0 (0.0%) |
| 75 Years and older | 216 (100.0%) | 0 (0.0%) |
| Total | 4,381 (86.2%) | 699 (13.8%) |
Health Insurance Coverage by Citizenship Status in Highwood
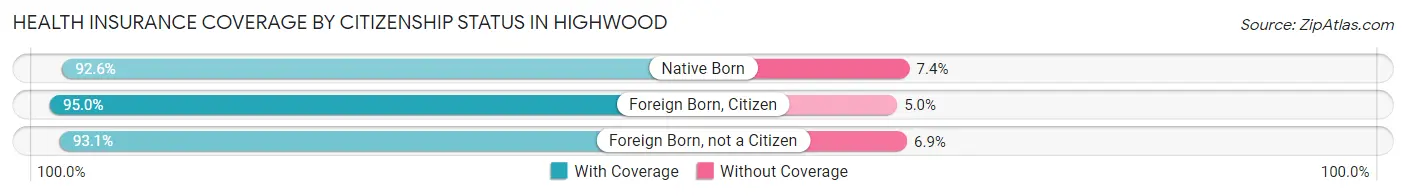
| Citizenship Status | With Coverage | Without Coverage |
| Native Born | 398 (92.6%) | 32 (7.4%) |
| Foreign Born, Citizen | 872 (95.0%) | 46 (5.0%) |
| Foreign Born, not a Citizen | 550 (93.1%) | 41 (6.9%) |
Health Insurance Coverage by Household Income in Highwood
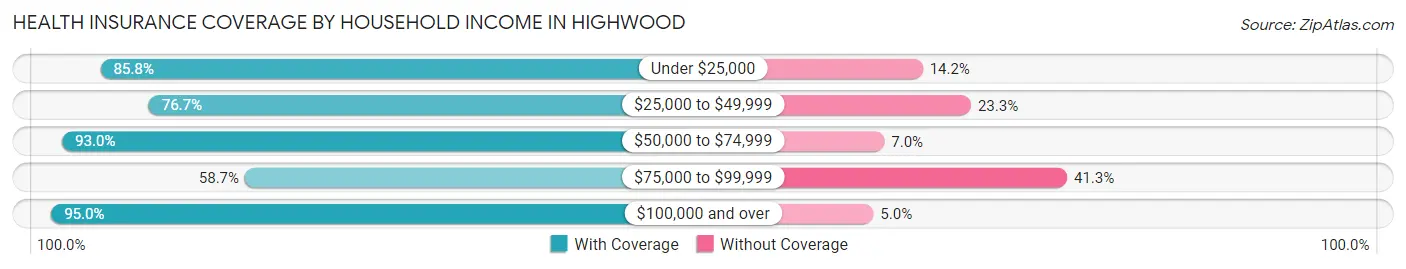
| Household Income | With Coverage | Without Coverage |
| Under $25,000 | 350 (85.8%) | 58 (14.2%) |
| $25,000 to $49,999 | 564 (76.7%) | 171 (23.3%) |
| $50,000 to $74,999 | 462 (93.0%) | 35 (7.0%) |
| $75,000 to $99,999 | 427 (58.7%) | 300 (41.3%) |
| $100,000 and over | 2,573 (95.0%) | 135 (5.0%) |
Public vs Private Health Insurance Coverage by Age in Highwood
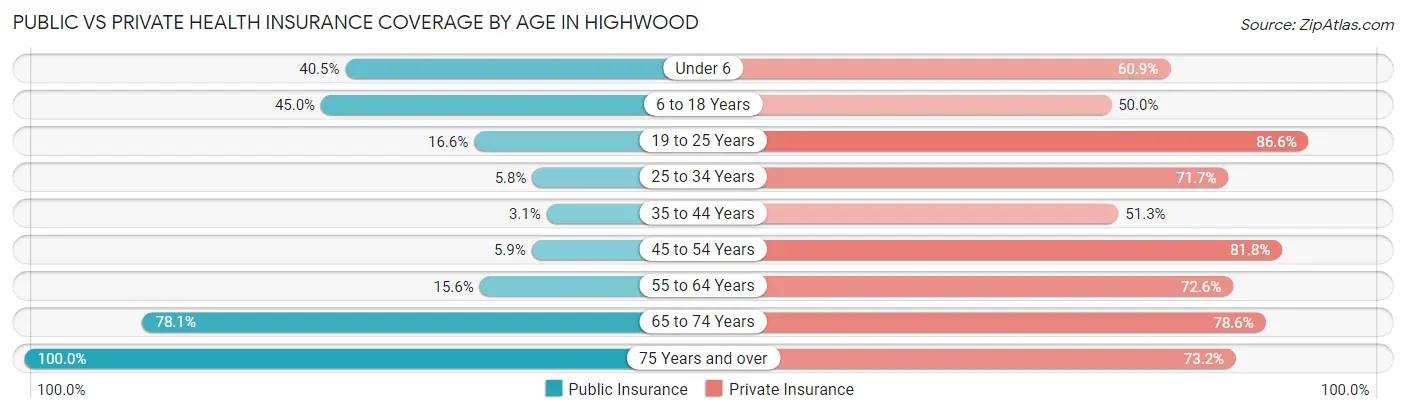
| Age Bracket | Public Insurance | Private Insurance |
| Under 6 | 174 (40.5%) | 262 (60.9%) |
| 6 to 18 Years | 413 (45.0%) | 459 (50.0%) |
| 19 to 25 Years | 98 (16.6%) | 512 (86.6%) |
| 25 to 34 Years | 30 (5.8%) | 373 (71.7%) |
| 35 to 44 Years | 21 (3.1%) | 345 (51.3%) |
| 45 to 54 Years | 33 (5.9%) | 457 (81.8%) |
| 55 to 64 Years | 96 (15.6%) | 448 (72.6%) |
| 65 to 74 Years | 435 (78.1%) | 438 (78.6%) |
| 75 Years and over | 216 (100.0%) | 158 (73.2%) |
| Total | 1,516 (29.8%) | 3,452 (67.9%) |
Disability Status by Sex by Age in Highwood
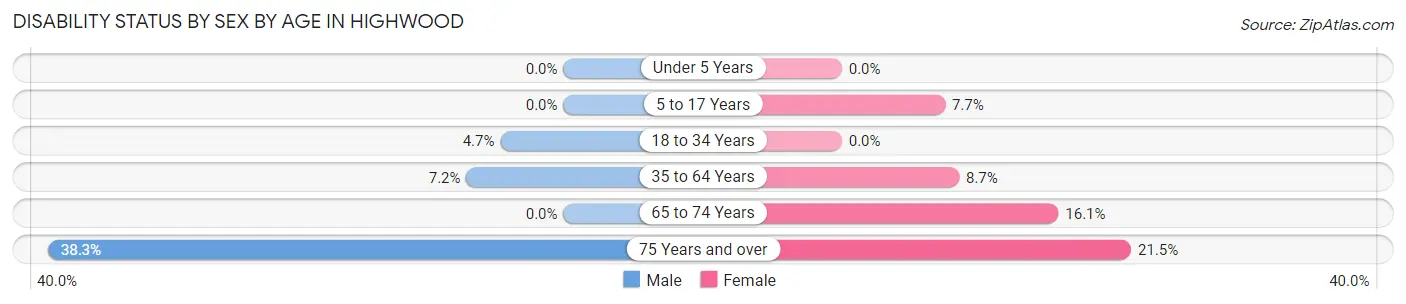
| Age Bracket | Male | Female |
| Under 5 Years | 0 (0.0%) | 0 (0.0%) |
| 5 to 17 Years | 0 (0.0%) | 21 (7.7%) |
| 18 to 34 Years | 28 (4.7%) | 0 (0.0%) |
| 35 to 64 Years | 71 (7.2%) | 75 (8.7%) |
| 65 to 74 Years | 0 (0.0%) | 50 (16.1%) |
| 75 Years and over | 31 (38.3%) | 29 (21.5%) |
Disability Class by Sex by Age in Highwood
Disability Class: Hearing Difficulty
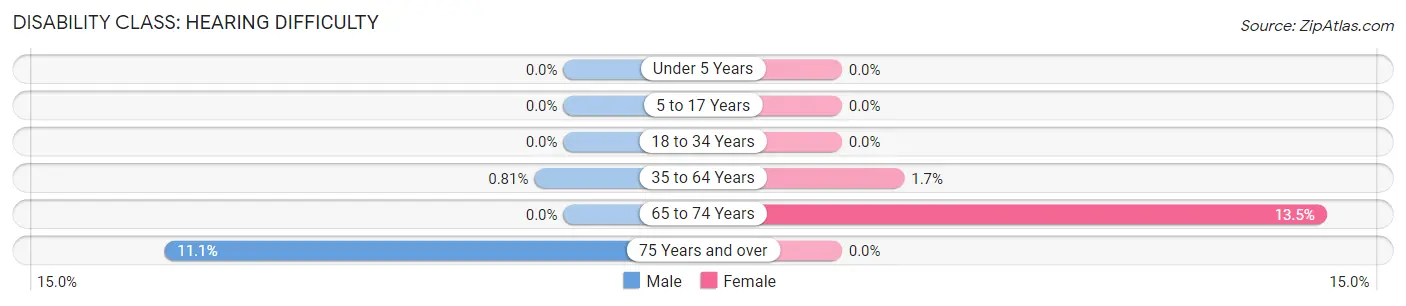
| Age Bracket | Male | Female |
| Under 5 Years | 0 (0.0%) | 0 (0.0%) |
| 5 to 17 Years | 0 (0.0%) | 0 (0.0%) |
| 18 to 34 Years | 0 (0.0%) | 0 (0.0%) |
| 35 to 64 Years | 8 (0.8%) | 15 (1.7%) |
| 65 to 74 Years | 0 (0.0%) | 42 (13.5%) |
| 75 Years and over | 9 (11.1%) | 0 (0.0%) |
Disability Class: Vision Difficulty

| Age Bracket | Male | Female |
| Under 5 Years | 0 (0.0%) | 0 (0.0%) |
| 5 to 17 Years | 0 (0.0%) | 0 (0.0%) |
| 18 to 34 Years | 0 (0.0%) | 0 (0.0%) |
| 35 to 64 Years | 7 (0.7%) | 0 (0.0%) |
| 65 to 74 Years | 0 (0.0%) | 8 (2.6%) |
| 75 Years and over | 0 (0.0%) | 14 (10.4%) |
Disability Class: Cognitive Difficulty
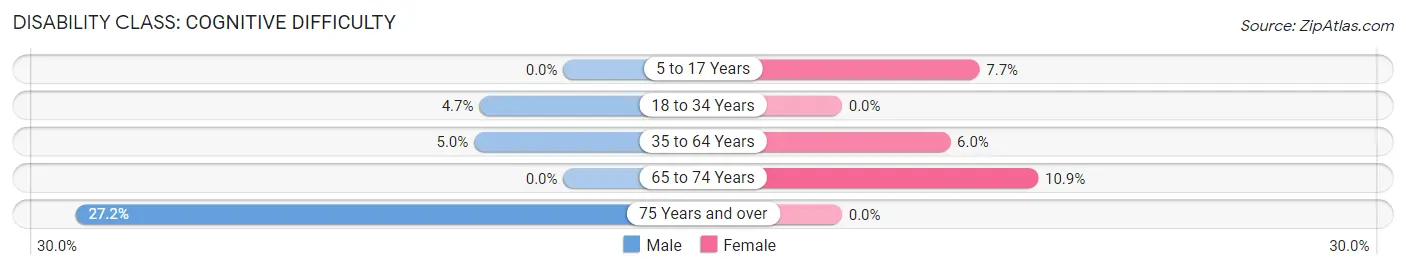
| Age Bracket | Male | Female |
| 5 to 17 Years | 0 (0.0%) | 21 (7.7%) |
| 18 to 34 Years | 28 (4.7%) | 0 (0.0%) |
| 35 to 64 Years | 49 (5.0%) | 52 (6.0%) |
| 65 to 74 Years | 0 (0.0%) | 34 (10.9%) |
| 75 Years and over | 22 (27.2%) | 0 (0.0%) |
Disability Class: Ambulatory Difficulty
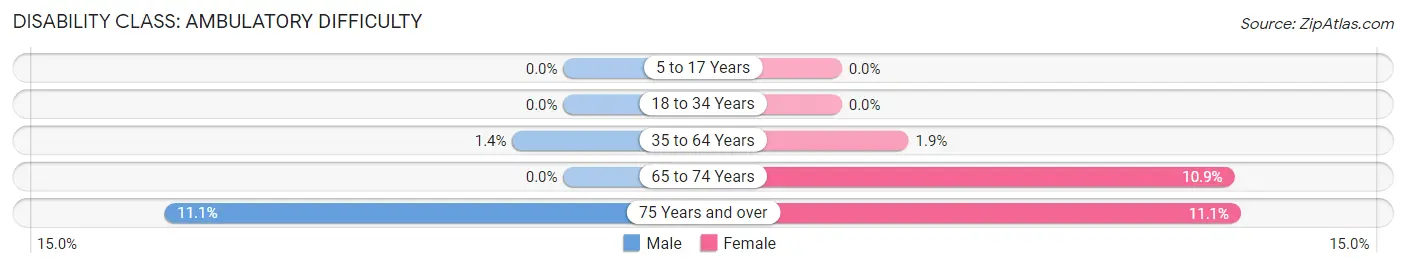
| Age Bracket | Male | Female |
| 5 to 17 Years | 0 (0.0%) | 0 (0.0%) |
| 18 to 34 Years | 0 (0.0%) | 0 (0.0%) |
| 35 to 64 Years | 14 (1.4%) | 16 (1.9%) |
| 65 to 74 Years | 0 (0.0%) | 34 (10.9%) |
| 75 Years and over | 9 (11.1%) | 15 (11.1%) |
Disability Class: Self-Care Difficulty
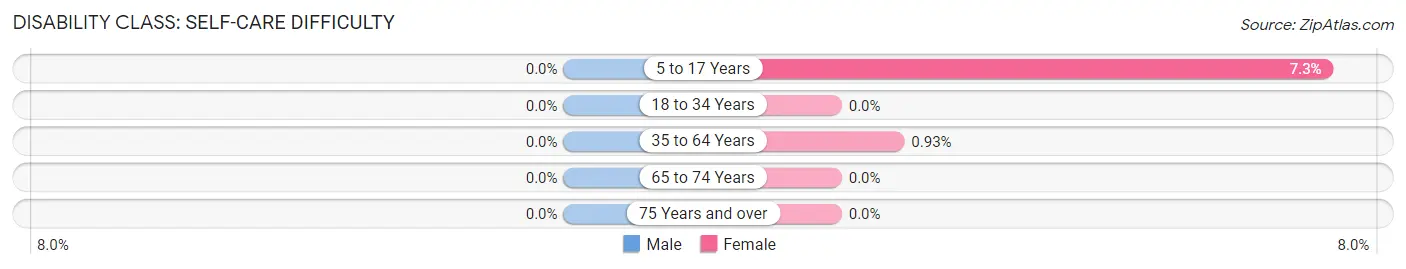
| Age Bracket | Male | Female |
| 5 to 17 Years | 0 (0.0%) | 20 (7.3%) |
| 18 to 34 Years | 0 (0.0%) | 0 (0.0%) |
| 35 to 64 Years | 0 (0.0%) | 8 (0.9%) |
| 65 to 74 Years | 0 (0.0%) | 0 (0.0%) |
| 75 Years and over | 0 (0.0%) | 0 (0.0%) |
Technology Access in Highwood
Computing Device Access in Highwood
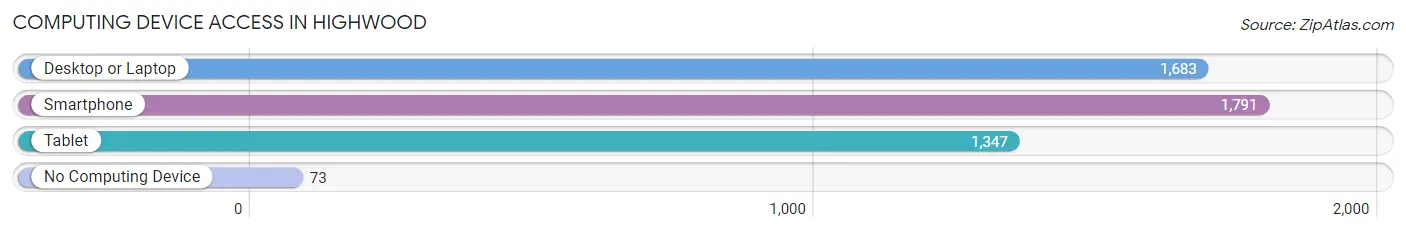
| Device Type | # Households | % Households |
| Desktop or Laptop | 1,683 | 88.4% |
| Smartphone | 1,791 | 94.1% |
| Tablet | 1,347 | 70.8% |
| No Computing Device | 73 | 3.8% |
| Total | 1,904 | 100.0% |
Internet Access in Highwood
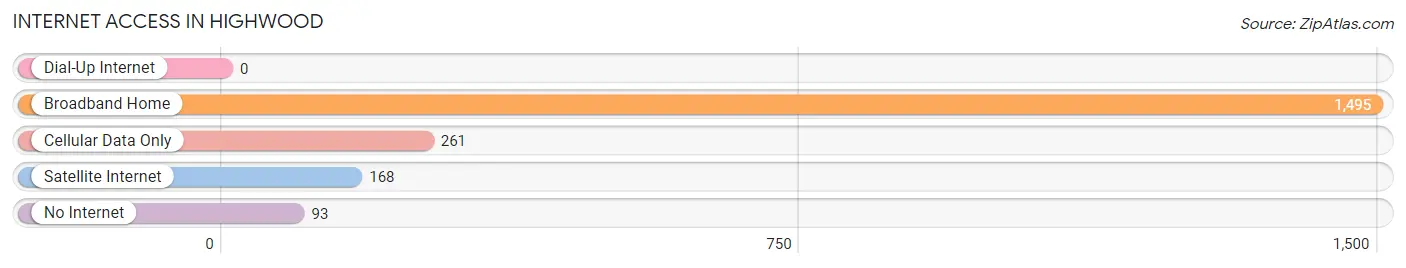
| Internet Type | # Households | % Households |
| Dial-Up Internet | 0 | 0.0% |
| Broadband Home | 1,495 | 78.5% |
| Cellular Data Only | 261 | 13.7% |
| Satellite Internet | 168 | 8.8% |
| No Internet | 93 | 4.9% |
| Total | 1,904 | 100.0% |
Highwood Summary
Highwood, Illinois is a small city located in Lake County, Illinois, United States. It is situated on the shore of Lake Michigan, just north of Chicago. The city has a population of 5,405 as of the 2010 census.
Highwood is a small city with a rich history. It was first settled in the late 1800s by German immigrants who were attracted to the area by its proximity to Lake Michigan. The city was incorporated in 1887 and was named after the high wooded hills that surrounded the area. The city was a popular summer resort destination for wealthy Chicagoans in the early 1900s. The city was also home to a number of factories, including the Highwood Manufacturing Company, which produced furniture and other wood products.
Highwood is located in Lake County, Illinois, and is situated on the shore of Lake Michigan. The city is bordered by the cities of Highland Park to the south, North Chicago to the east, and Lake Forest to the north. The city is located approximately 25 miles north of downtown Chicago.
Highwood has a humid continental climate, with hot summers and cold winters. The average temperature in the summer is around 75 degrees Fahrenheit, and the average temperature in the winter is around 25 degrees Fahrenheit. The city receives an average of 36 inches of precipitation per year.
Highwood has a diverse economy, with a variety of industries represented. The city is home to a number of small businesses, including restaurants, retail stores, and professional services. The city is also home to a number of manufacturing companies, including the Highwood Manufacturing Company, which produces furniture and other wood products. The city is also home to a number of technology companies, including a software development firm and a web design firm.
Highwood has a population of 5,405 as of the 2010 census. The population is fairly diverse, with a mix of races and ethnicities represented. The largest racial group is White, making up 73.3% of the population. The second largest racial group is Hispanic, making up 11.2% of the population. Other racial groups include African American (7.2%), Asian (3.7%), and Native American (0.3%).
Highwood is a small city with a rich history and a diverse economy. The city is home to a number of small businesses, manufacturing companies, and technology firms. The city has a diverse population, with a mix of races and ethnicities represented. The city is located on the shore of Lake Michigan, just north of Chicago, and has a humid continental climate, with hot summers and cold winters.
Common Questions
What is Per Capita Income in Highwood?
Per Capita income in Highwood is $46,257.
What is the Median Family Income in Highwood?
Median Family Income in Highwood is $109,202.
What is the Median Household income in Highwood?
Median Household Income in Highwood is $105,282.
What is Income or Wage Gap in Highwood?
Income or Wage Gap in Highwood is 35.3%.
Women in Highwood earn 64.7 cents for every dollar earned by a man.
What is Family Income Deficit in Highwood?
Family Income Deficit in Highwood is $5,835.
Families that are below poverty line in Highwood earn $5,835 less on average than the poverty threshold level.
What is Inequality or Gini Index in Highwood?
Inequality or Gini Index in Highwood is 0.46.
What is the Total Population of Highwood?
Total Population of Highwood is 5,227.
What is the Total Male Population of Highwood?
Total Male Population of Highwood is 2,835.
What is the Total Female Population of Highwood?
Total Female Population of Highwood is 2,392.
What is the Ratio of Males per 100 Females in Highwood?
There are 118.52 Males per 100 Females in Highwood.
What is the Ratio of Females per 100 Males in Highwood?
There are 84.37 Females per 100 Males in Highwood.
What is the Median Population Age in Highwood?
Median Population Age in Highwood is 36.3 Years.
What is the Average Family Size in Highwood
Average Family Size in Highwood is 3.1 People.
What is the Average Household Size in Highwood
Average Household Size in Highwood is 2.7 People.
How Large is the Labor Force in Highwood?
There are 2,921 People in the Labor Forcein in Highwood.
What is the Percentage of People in the Labor Force in Highwood?
70.9% of People are in the Labor Force in Highwood.
What is the Unemployment Rate in Highwood?
Unemployment Rate in Highwood is 6.7%.