Zip Codes with the Highest Percentage of Population Employed in Life, Physical & Social Science in Belleville, IL
RELATED REPORTS & OPTIONS
Life, Physical & Social Science
Belleville
Compare Zip Codes
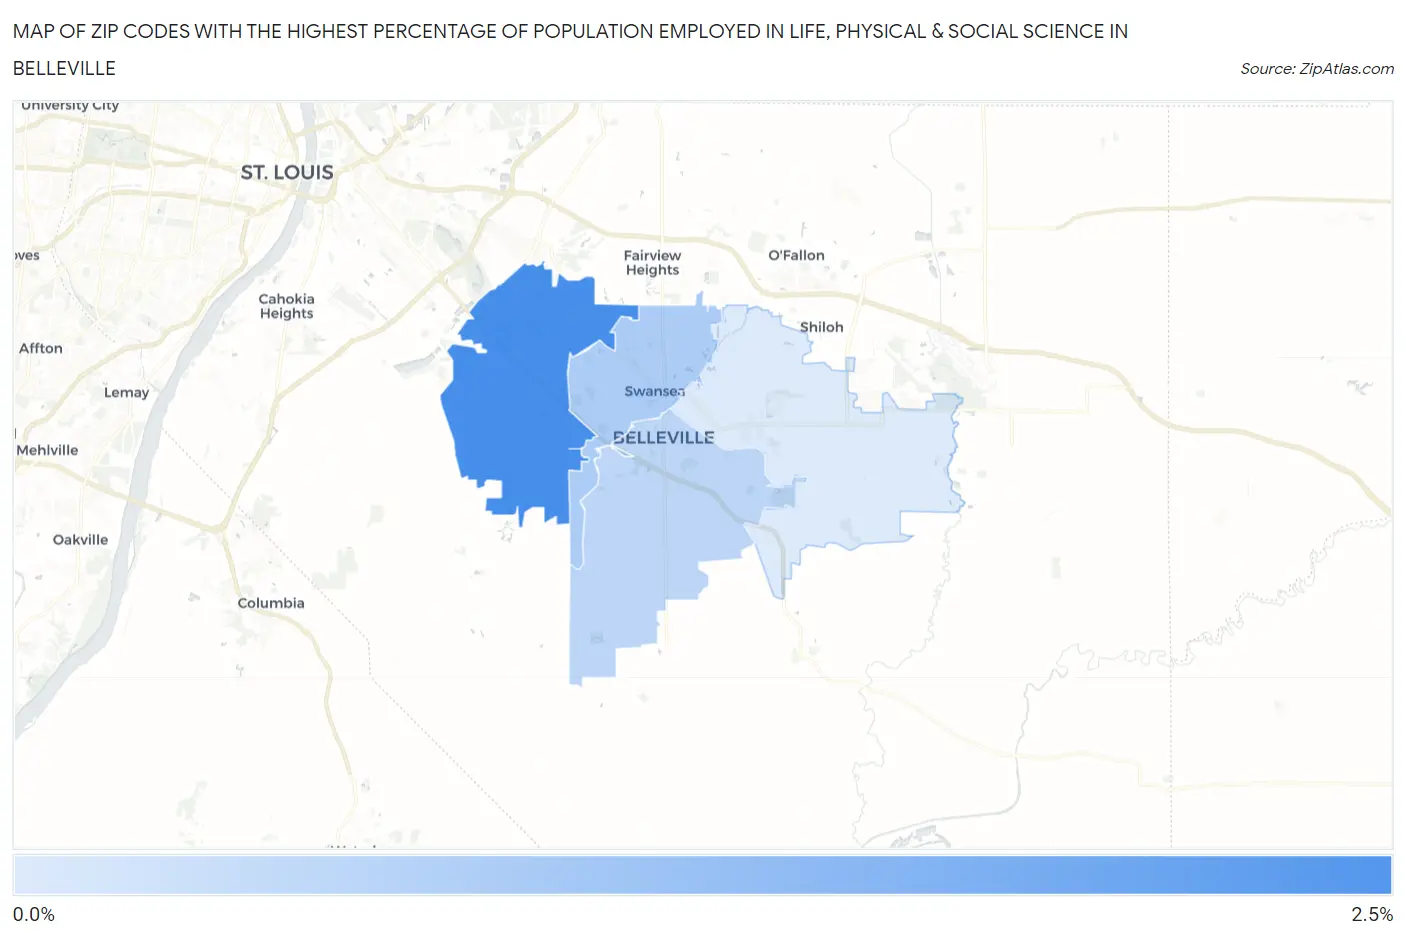
Map of Zip Codes with the Highest Percentage of Population Employed in Life, Physical & Social Science in Belleville
0.15%
2.4%
Zip Codes with the Highest Percentage of Population Employed in Life, Physical & Social Science in Belleville, IL
| Zip Code | % Employed | vs State | vs National | |
| 1. | 62223 | 2.4% | 0.98%(+1.39)#78 | 1.1%(+1.28)#2,810 |
| 2. | 62226 | 0.88% | 0.98%(-0.103)#391 | 1.1%(-0.215)#10,186 |
| 3. | 62220 | 0.64% | 0.98%(-0.337)#491 | 1.1%(-0.449)#12,751 |
| 4. | 62221 | 0.15% | 0.98%(-0.827)#774 | 1.1%(-0.940)#18,672 |
1
Common Questions
What are the Top 3 Zip Codes with the Highest Percentage of Population Employed in Life, Physical & Social Science in Belleville, IL?
Top 3 Zip Codes with the Highest Percentage of Population Employed in Life, Physical & Social Science in Belleville, IL are:
What zip code has the Highest Percentage of Population Employed in Life, Physical & Social Science in Belleville, IL?
62223 has the Highest Percentage of Population Employed in Life, Physical & Social Science in Belleville, IL with 2.4%.
What is the Percentage of Population Employed in Life, Physical & Social Science in Belleville, IL?
Percentage of Population Employed in Life, Physical & Social Science in Belleville is 0.82%.
What is the Percentage of Population Employed in Life, Physical & Social Science in Illinois?
Percentage of Population Employed in Life, Physical & Social Science in Illinois is 0.98%.
What is the Percentage of Population Employed in Life, Physical & Social Science in the United States?
Percentage of Population Employed in Life, Physical & Social Science in the United States is 1.1%.