Carbondale, IL Map & Demographics
Carbondale Map
Carbondale Overview
$24,038
PER CAPITA INCOME
$65,727
AVG FAMILY INCOME
$27,360
AVG HOUSEHOLD INCOME
10.7%
WAGE / INCOME GAP [ % ]
89.3¢/ $1
WAGE / INCOME GAP [ $ ]
$15,313
FAMILY INCOME DEFICIT
0.57
INEQUALITY / GINI INDEX
22,039
TOTAL POPULATION
11,396
MALE POPULATION
10,643
FEMALE POPULATION
107.08
MALES / 100 FEMALES
93.39
FEMALES / 100 MALES
24.8
MEDIAN AGE
2.9
AVG FAMILY SIZE
1.9
AVG HOUSEHOLD SIZE
11,073
LABOR FORCE [ PEOPLE ]
56.2%
PERCENT IN LABOR FORCE
9.6%
UNEMPLOYMENT RATE
Carbondale Area Codes
Income in Carbondale
Income Overview in Carbondale
Per Capita Income in Carbondale is $24,038, while median incomes of families and households are $65,727 and $27,360 respectively.
| Characteristic | Number | Measure |
| Per Capita Income | 22,039 | $24,038 |
| Median Family Income | 3,176 | $65,727 |
| Mean Family Income | 3,176 | $86,277 |
| Median Household Income | 9,974 | $27,360 |
| Mean Household Income | 9,974 | $51,990 |
| Income Deficit | 3,176 | $15,313 |
| Wage / Income Gap (%) | 22,039 | 10.65% |
| Wage / Income Gap ($) | 22,039 | 89.35¢ per $1 |
| Gini / Inequality Index | 22,039 | 0.57 |
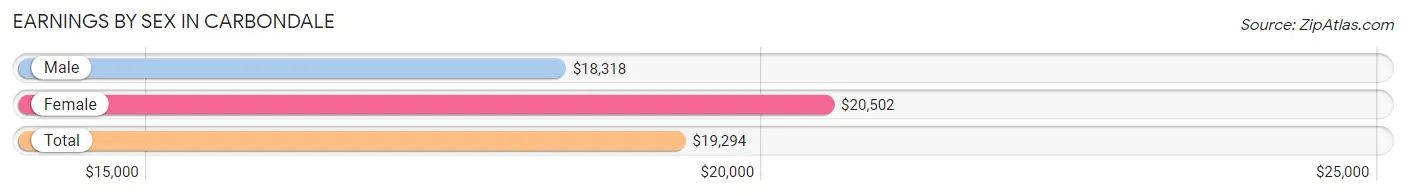
Earnings by Sex in Carbondale
Average Earnings in Carbondale are $19,294, $18,318 for men and $20,502 for women, a difference of 10.6%.
| Sex | Number | Average Earnings |
| Male | 6,040 (50.1%) | $18,318 |
| Female | 6,014 (49.9%) | $20,502 |
| Total | 12,054 (100.0%) | $19,294 |
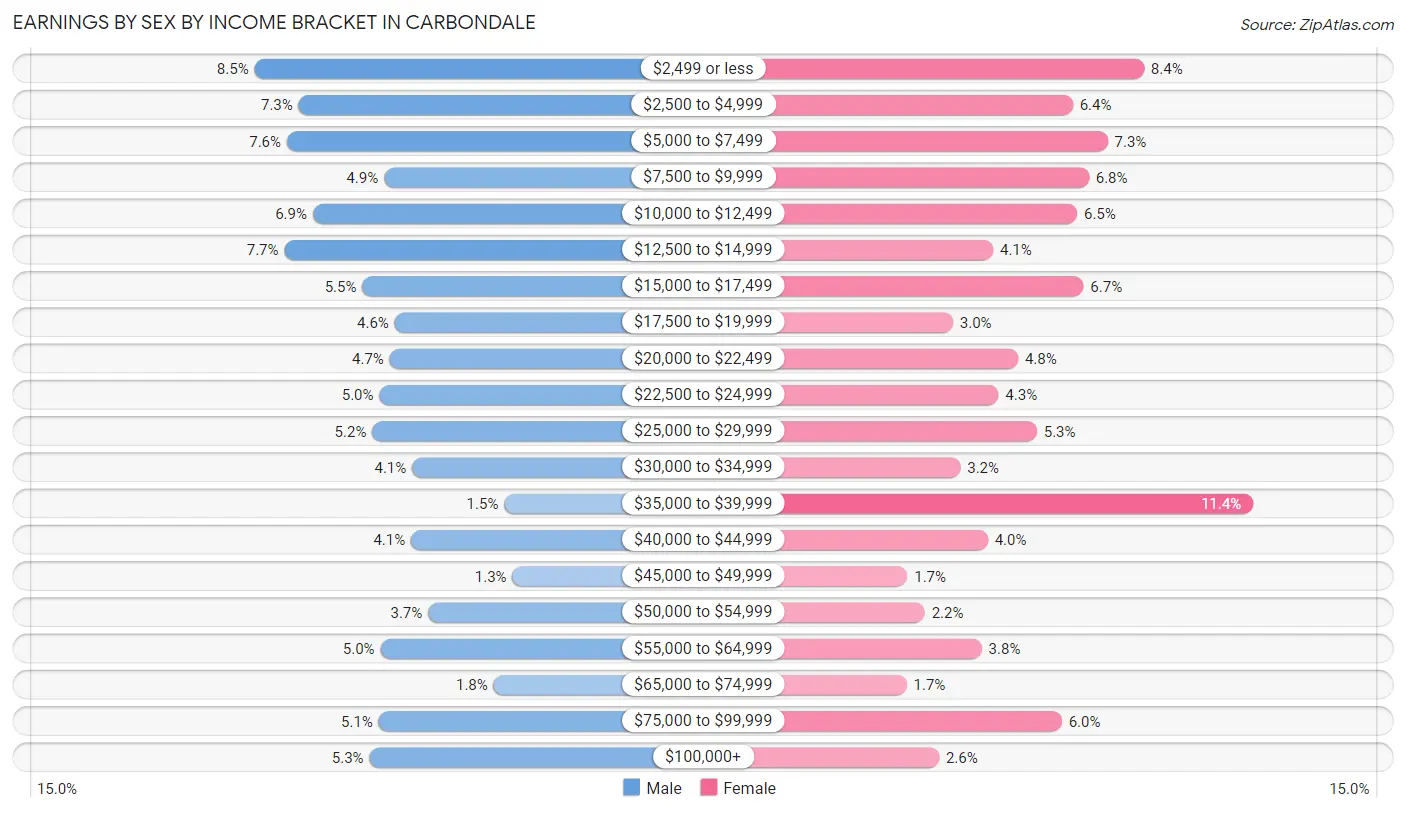
Earnings by Sex by Income Bracket in Carbondale
The most common earnings brackets in Carbondale are $2,499 or less for men (516 | 8.5%) and $35,000 to $39,999 for women (687 | 11.4%).
| Income | Male | Female |
| $2,499 or less | 516 (8.5%) | 502 (8.4%) |
| $2,500 to $4,999 | 441 (7.3%) | 382 (6.4%) |
| $5,000 to $7,499 | 461 (7.6%) | 441 (7.3%) |
| $7,500 to $9,999 | 296 (4.9%) | 409 (6.8%) |
| $10,000 to $12,499 | 417 (6.9%) | 389 (6.5%) |
| $12,500 to $14,999 | 465 (7.7%) | 247 (4.1%) |
| $15,000 to $17,499 | 333 (5.5%) | 400 (6.7%) |
| $17,500 to $19,999 | 278 (4.6%) | 179 (3.0%) |
| $20,000 to $22,499 | 286 (4.7%) | 289 (4.8%) |
| $22,500 to $24,999 | 304 (5.0%) | 256 (4.3%) |
| $25,000 to $29,999 | 316 (5.2%) | 321 (5.3%) |
| $30,000 to $34,999 | 248 (4.1%) | 192 (3.2%) |
| $35,000 to $39,999 | 92 (1.5%) | 687 (11.4%) |
| $40,000 to $44,999 | 250 (4.1%) | 238 (4.0%) |
| $45,000 to $49,999 | 78 (1.3%) | 102 (1.7%) |
| $50,000 to $54,999 | 221 (3.7%) | 132 (2.2%) |
| $55,000 to $64,999 | 302 (5.0%) | 228 (3.8%) |
| $65,000 to $74,999 | 110 (1.8%) | 101 (1.7%) |
| $75,000 to $99,999 | 305 (5.1%) | 363 (6.0%) |
| $100,000+ | 321 (5.3%) | 156 (2.6%) |
| Total | 6,040 (100.0%) | 6,014 (100.0%) |
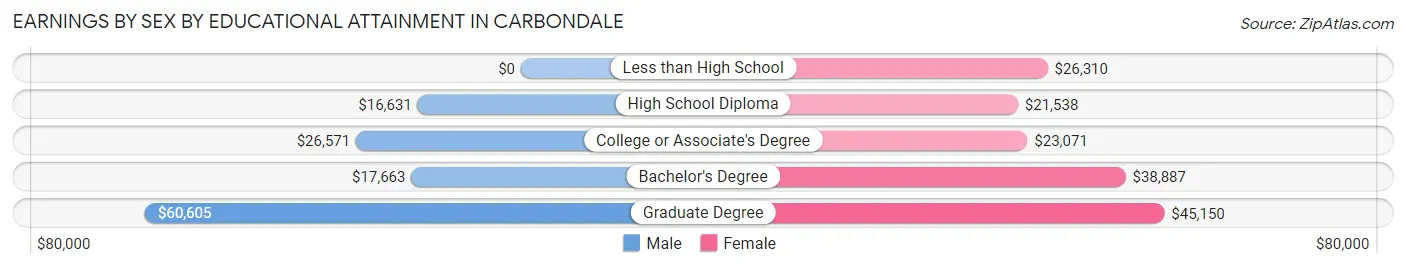
Earnings by Sex by Educational Attainment in Carbondale
Average earnings in Carbondale are $28,162 for men and $28,005 for women, a difference of 0.6%. Men with an educational attainment of graduate degree enjoy the highest average annual earnings of $60,605, while those with high school diploma education earn the least with $16,631. Women with an educational attainment of graduate degree earn the most with the average annual earnings of $45,150, while those with high school diploma education have the smallest earnings of $21,538.
| Educational Attainment | Male Income | Female Income |
| Less than High School | - | - |
| High School Diploma | $16,631 | $21,538 |
| College or Associate's Degree | $26,571 | $23,071 |
| Bachelor's Degree | $17,663 | $38,887 |
| Graduate Degree | $60,605 | $45,150 |
| Total | $28,162 | $28,005 |
Family Income in Carbondale
Family Income Brackets in Carbondale
According to the Carbondale family income data, there are 438 families falling into the $75,000 to $99,999 income range, which is the most common income bracket and makes up 13.8% of all families. Conversely, the $15,000 to $24,999 income bracket is the least frequent group with only 194 families (6.1%) belonging to this category.
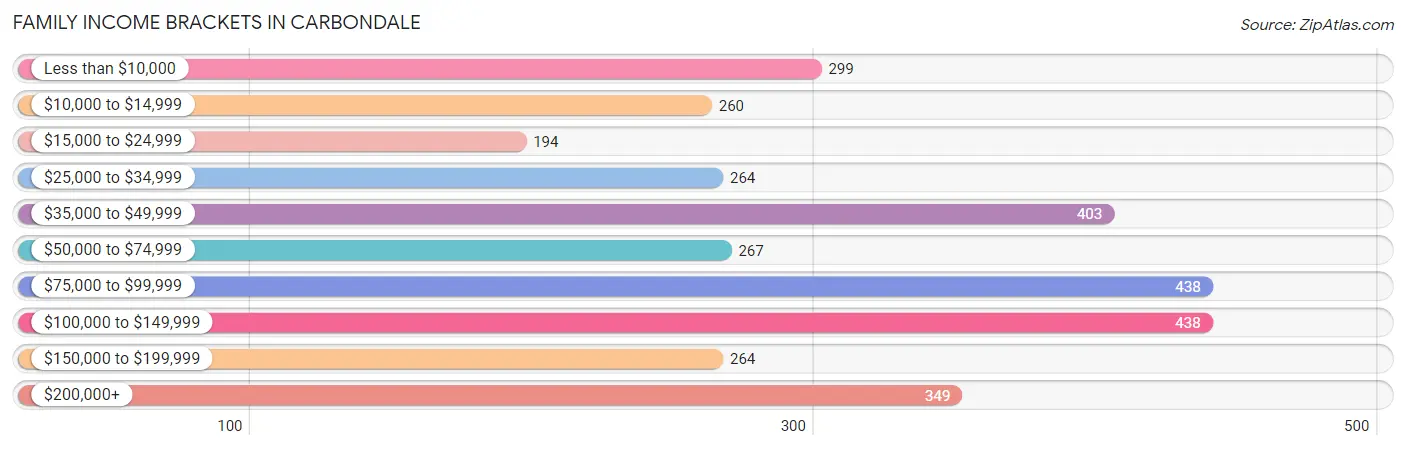
| Income Bracket | # Families | % Families |
| Less than $10,000 | 299 | 9.4% |
| $10,000 to $14,999 | 260 | 8.2% |
| $15,000 to $24,999 | 194 | 6.1% |
| $25,000 to $34,999 | 264 | 8.3% |
| $35,000 to $49,999 | 403 | 12.7% |
| $50,000 to $74,999 | 267 | 8.4% |
| $75,000 to $99,999 | 438 | 13.8% |
| $100,000 to $149,999 | 438 | 13.8% |
| $150,000 to $199,999 | 264 | 8.3% |
| $200,000+ | 349 | 11.0% |
Family Income by Famaliy Size in Carbondale
3-person families (877 | 27.6%) account for the highest median family income in Carbondale with $97,078 per family, while 3-person families (877 | 27.6%) have the highest median income of $32,359 per family member.
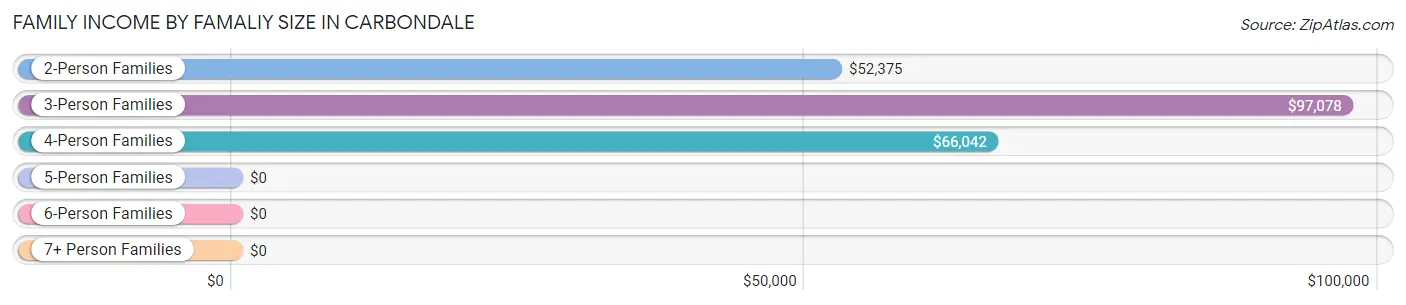
| Income Bracket | # Families | Median Income |
| 2-Person Families | 1,525 (48.0%) | $52,375 |
| 3-Person Families | 877 (27.6%) | $97,078 |
| 4-Person Families | 419 (13.2%) | $66,042 |
| 5-Person Families | 204 (6.4%) | $0 |
| 6-Person Families | 47 (1.5%) | $0 |
| 7+ Person Families | 104 (3.3%) | $0 |
| Total | 3,176 (100.0%) | $65,727 |
Family Income by Number of Earners in Carbondale
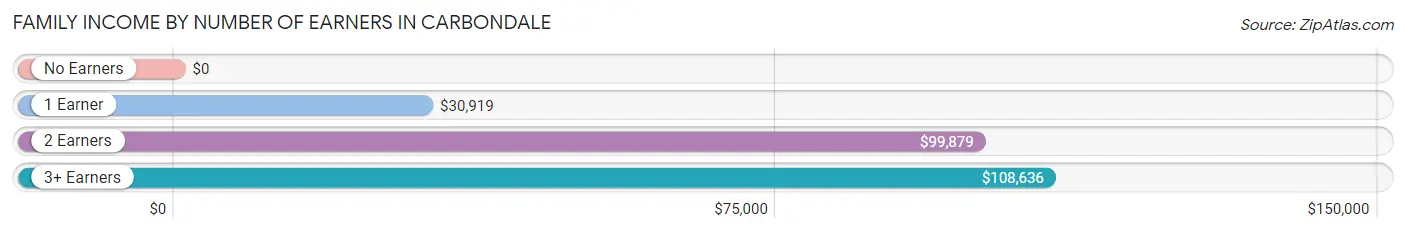
| Number of Earners | # Families | Median Income |
| No Earners | 647 (20.4%) | $0 |
| 1 Earner | 1,182 (37.2%) | $30,919 |
| 2 Earners | 959 (30.2%) | $99,879 |
| 3+ Earners | 388 (12.2%) | $108,636 |
| Total | 3,176 (100.0%) | $65,727 |
Household Income in Carbondale
Household Income Brackets in Carbondale
With 1,845 households falling in the category, the less than $10,000 income range is the most frequent in Carbondale, accounting for 18.5% of all households. In contrast, only 389 households (3.9%) fall into the $200,000+ income bracket, making it the least populous group.
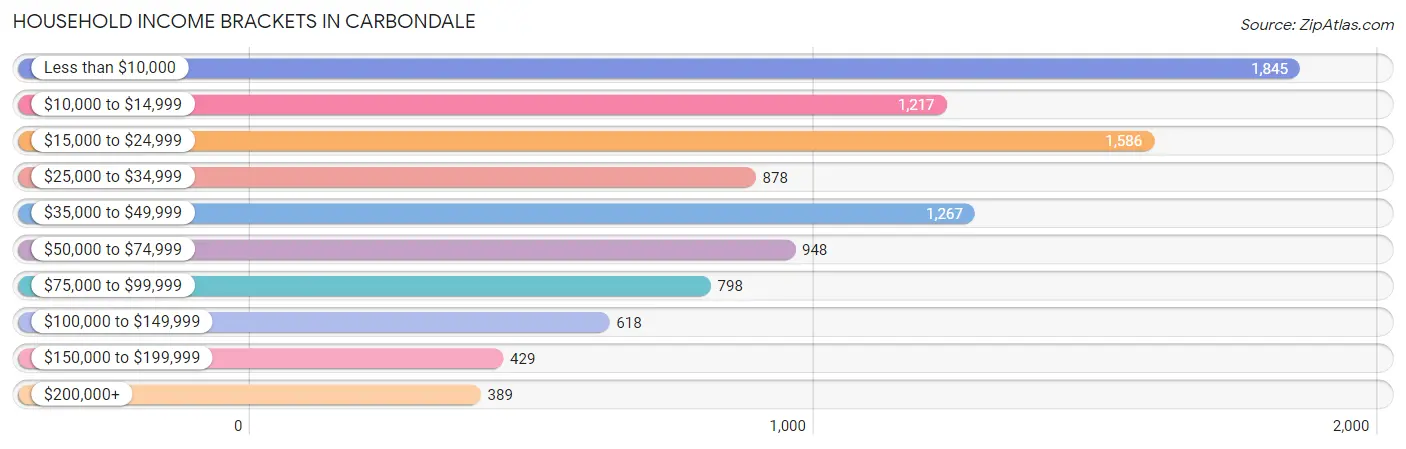
| Income Bracket | # Households | % Households |
| Less than $10,000 | 1,845 | 18.5% |
| $10,000 to $14,999 | 1,217 | 12.2% |
| $15,000 to $24,999 | 1,586 | 15.9% |
| $25,000 to $34,999 | 878 | 8.8% |
| $35,000 to $49,999 | 1,267 | 12.7% |
| $50,000 to $74,999 | 948 | 9.5% |
| $75,000 to $99,999 | 798 | 8.0% |
| $100,000 to $149,999 | 618 | 6.2% |
| $150,000 to $199,999 | 429 | 4.3% |
| $200,000+ | 389 | 3.9% |
Household Income by Householder Age in Carbondale
The median household income in Carbondale is $27,360, with the highest median household income of $75,750 found in the 65+ years age bracket for the primary householder. A total of 1,246 households (12.5%) fall into this category. Meanwhile, the 15 to 24 years age bracket for the primary householder has the lowest median household income of $17,840, with 3,267 households (32.8%) in this group.
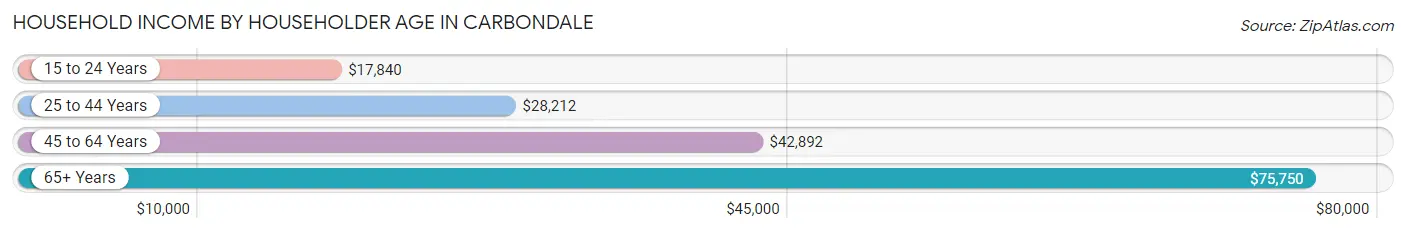
| Income Bracket | # Households | Median Income |
| 15 to 24 Years | 3,267 (32.8%) | $17,840 |
| 25 to 44 Years | 3,215 (32.2%) | $28,212 |
| 45 to 64 Years | 2,246 (22.5%) | $42,892 |
| 65+ Years | 1,246 (12.5%) | $75,750 |
| Total | 9,974 (100.0%) | $27,360 |
Poverty in Carbondale
Income Below Poverty by Sex and Age in Carbondale
With 37.5% poverty level for males and 38.2% for females among the residents of Carbondale, 5 year old males and under 5 year old females are the most vulnerable to poverty, with 97 males (88.2%) and 224 females (73.7%) in their respective age groups living below the poverty level.
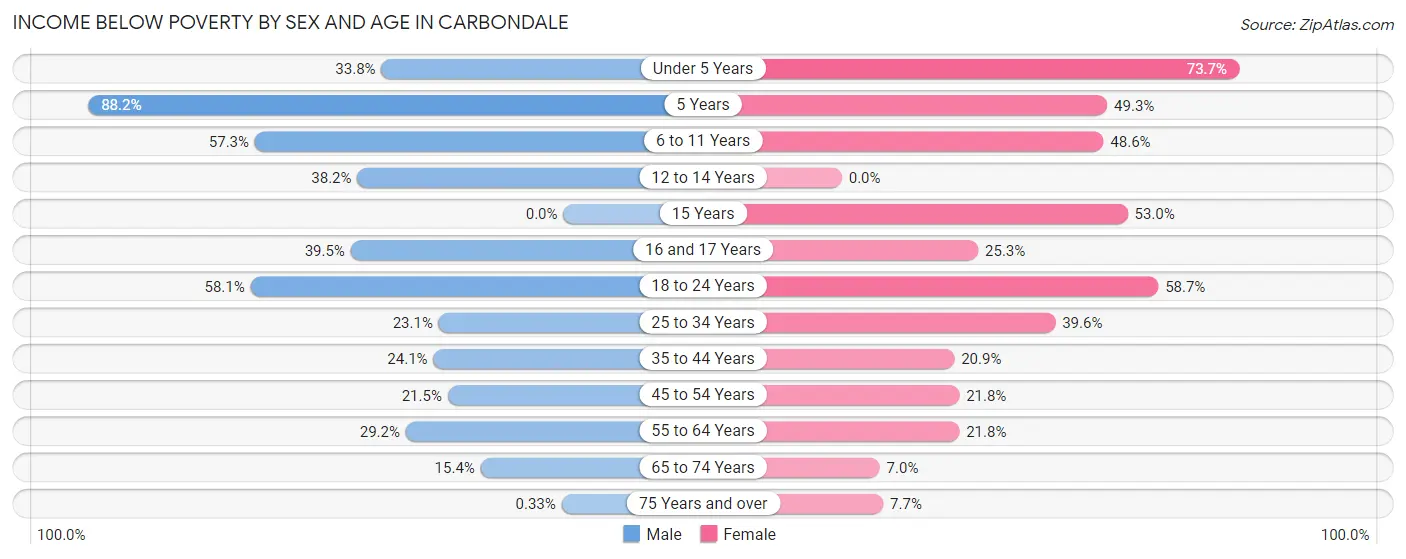
| Age Bracket | Male | Female |
| Under 5 Years | 102 (33.8%) | 224 (73.7%) |
| 5 Years | 97 (88.2%) | 67 (49.3%) |
| 6 to 11 Years | 272 (57.3%) | 236 (48.6%) |
| 12 to 14 Years | 112 (38.2%) | 0 (0.0%) |
| 15 Years | 0 (0.0%) | 61 (53.0%) |
| 16 and 17 Years | 90 (39.5%) | 21 (25.3%) |
| 18 to 24 Years | 1,815 (58.1%) | 1,746 (58.7%) |
| 25 to 34 Years | 431 (23.1%) | 584 (39.6%) |
| 35 to 44 Years | 206 (24.1%) | 202 (20.9%) |
| 45 to 54 Years | 144 (21.5%) | 173 (21.8%) |
| 55 to 64 Years | 238 (29.2%) | 203 (21.8%) |
| 65 to 74 Years | 70 (15.3%) | 44 (7.0%) |
| 75 Years and over | 1 (0.3%) | 38 (7.7%) |
| Total | 3,578 (37.5%) | 3,599 (38.2%) |
Income Above Poverty by Sex and Age in Carbondale
According to the poverty statistics in Carbondale, males aged 15 years and females aged 12 to 14 years are the age groups that are most secure financially, with 100.0% of males and 100.0% of females in these age groups living above the poverty line.
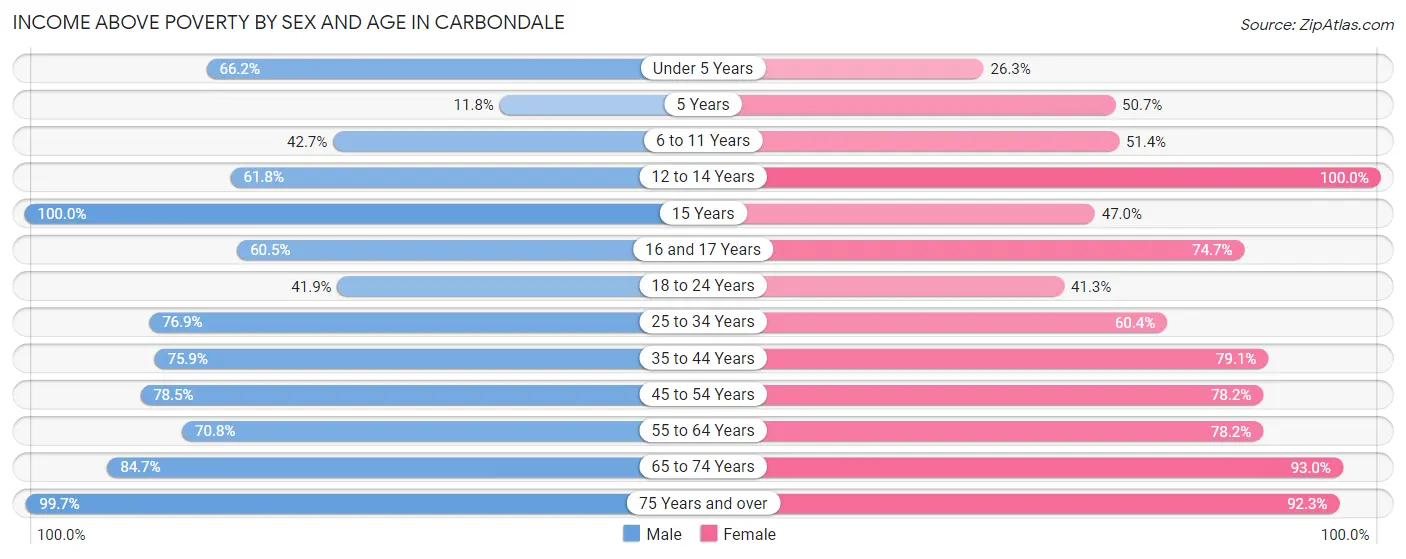
| Age Bracket | Male | Female |
| Under 5 Years | 200 (66.2%) | 80 (26.3%) |
| 5 Years | 13 (11.8%) | 69 (50.7%) |
| 6 to 11 Years | 203 (42.7%) | 250 (51.4%) |
| 12 to 14 Years | 181 (61.8%) | 31 (100.0%) |
| 15 Years | 46 (100.0%) | 54 (47.0%) |
| 16 and 17 Years | 138 (60.5%) | 62 (74.7%) |
| 18 to 24 Years | 1,311 (41.9%) | 1,227 (41.3%) |
| 25 to 34 Years | 1,432 (76.9%) | 890 (60.4%) |
| 35 to 44 Years | 648 (75.9%) | 766 (79.1%) |
| 45 to 54 Years | 527 (78.5%) | 621 (78.2%) |
| 55 to 64 Years | 576 (70.8%) | 728 (78.2%) |
| 65 to 74 Years | 386 (84.7%) | 582 (93.0%) |
| 75 Years and over | 302 (99.7%) | 457 (92.3%) |
| Total | 5,963 (62.5%) | 5,817 (61.8%) |
Income Below Poverty Among Married-Couple Families in Carbondale
The poverty statistics for married-couple families in Carbondale show that 10.7% or 190 of the total 1,776 families live below the poverty line. Families with 3 or 4 children have the highest poverty rate of 21.9%, comprising of 39 families. On the other hand, families with 5 or more children have the lowest poverty rate of 0.0%, which includes 0 families.
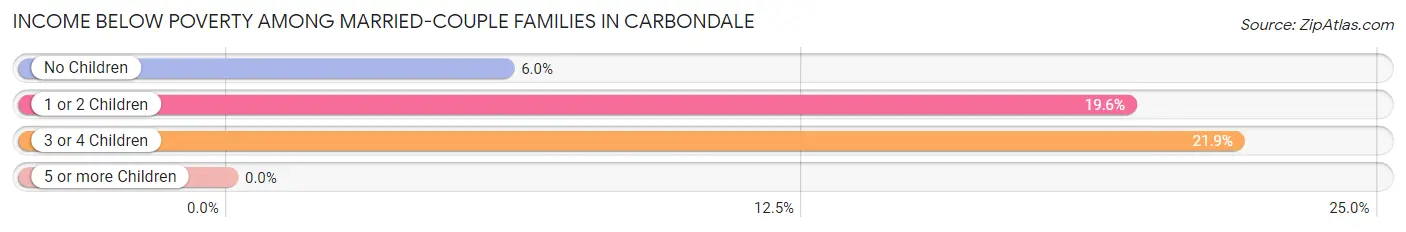
| Children | Above Poverty | Below Poverty |
| No Children | 1,110 (94.0%) | 71 (6.0%) |
| 1 or 2 Children | 329 (80.4%) | 80 (19.6%) |
| 3 or 4 Children | 139 (78.1%) | 39 (21.9%) |
| 5 or more Children | 8 (100.0%) | 0 (0.0%) |
| Total | 1,586 (89.3%) | 190 (10.7%) |
Income Below Poverty Among Single-Parent Households in Carbondale
According to the poverty data in Carbondale, 18.3% or 57 single-father households and 40.2% or 437 single-mother households are living below the poverty line. Among single-father households, those with 1 or 2 children have the highest poverty rate, with 28 households (31.1%) experiencing poverty. Likewise, among single-mother households, those with 3 or 4 children have the highest poverty rate, with 184 households (100.0%) falling below the poverty line.
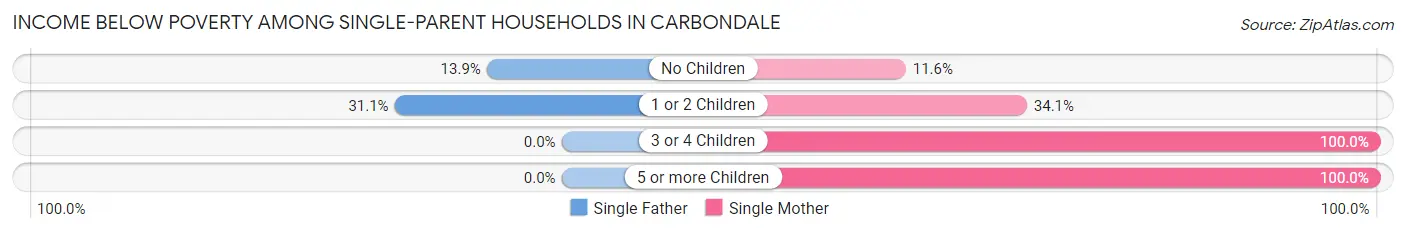
| Children | Single Father | Single Mother |
| No Children | 29 (13.9%) | 45 (11.6%) |
| 1 or 2 Children | 28 (31.1%) | 159 (34.1%) |
| 3 or 4 Children | 0 (0.0%) | 184 (100.0%) |
| 5 or more Children | 0 (0.0%) | 49 (100.0%) |
| Total | 57 (18.3%) | 437 (40.2%) |
Income Below Poverty Among Married-Couple vs Single-Parent Households in Carbondale
The poverty data for Carbondale shows that 190 of the married-couple family households (10.7%) and 494 of the single-parent households (35.3%) are living below the poverty level. Within the married-couple family households, those with 3 or 4 children have the highest poverty rate, with 39 households (21.9%) falling below the poverty line. Among the single-parent households, those with 5 or more children have the highest poverty rate, with 49 household (100.0%) living below poverty.
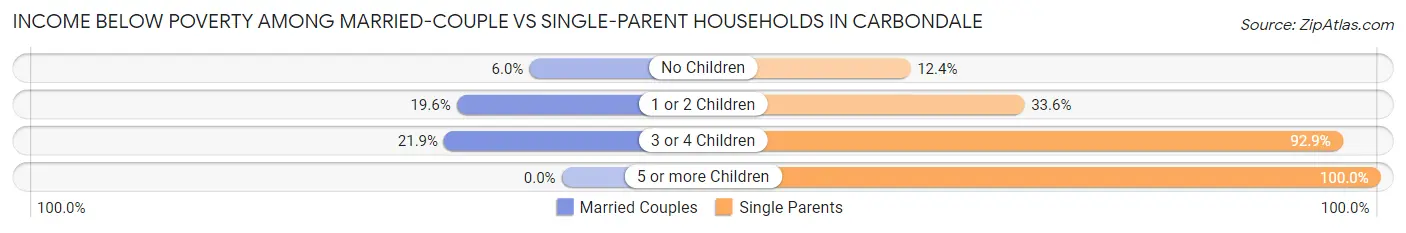
| Children | Married-Couple Families | Single-Parent Households |
| No Children | 71 (6.0%) | 74 (12.4%) |
| 1 or 2 Children | 80 (19.6%) | 187 (33.6%) |
| 3 or 4 Children | 39 (21.9%) | 184 (92.9%) |
| 5 or more Children | 0 (0.0%) | 49 (100.0%) |
| Total | 190 (10.7%) | 494 (35.3%) |
Race in Carbondale
The most populous races in Carbondale are White / Caucasian (12,866 | 58.4%), Black / African American (6,052 | 27.5%), and Asian (1,575 | 7.1%).
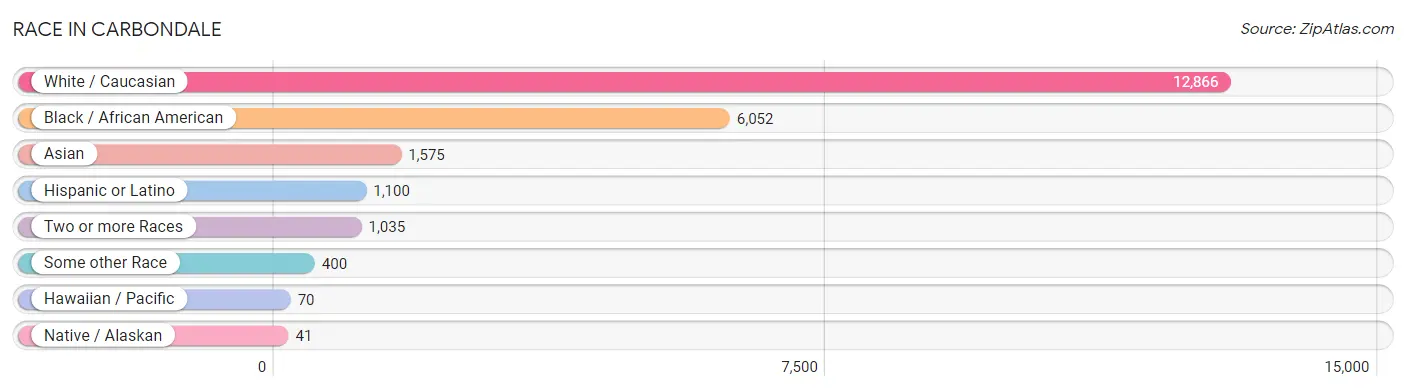
| Race | # Population | % Population |
| Asian | 1,575 | 7.1% |
| Black / African American | 6,052 | 27.5% |
| Hawaiian / Pacific | 70 | 0.3% |
| Hispanic or Latino | 1,100 | 5.0% |
| Native / Alaskan | 41 | 0.2% |
| White / Caucasian | 12,866 | 58.4% |
| Two or more Races | 1,035 | 4.7% |
| Some other Race | 400 | 1.8% |
| Total | 22,039 | 100.0% |
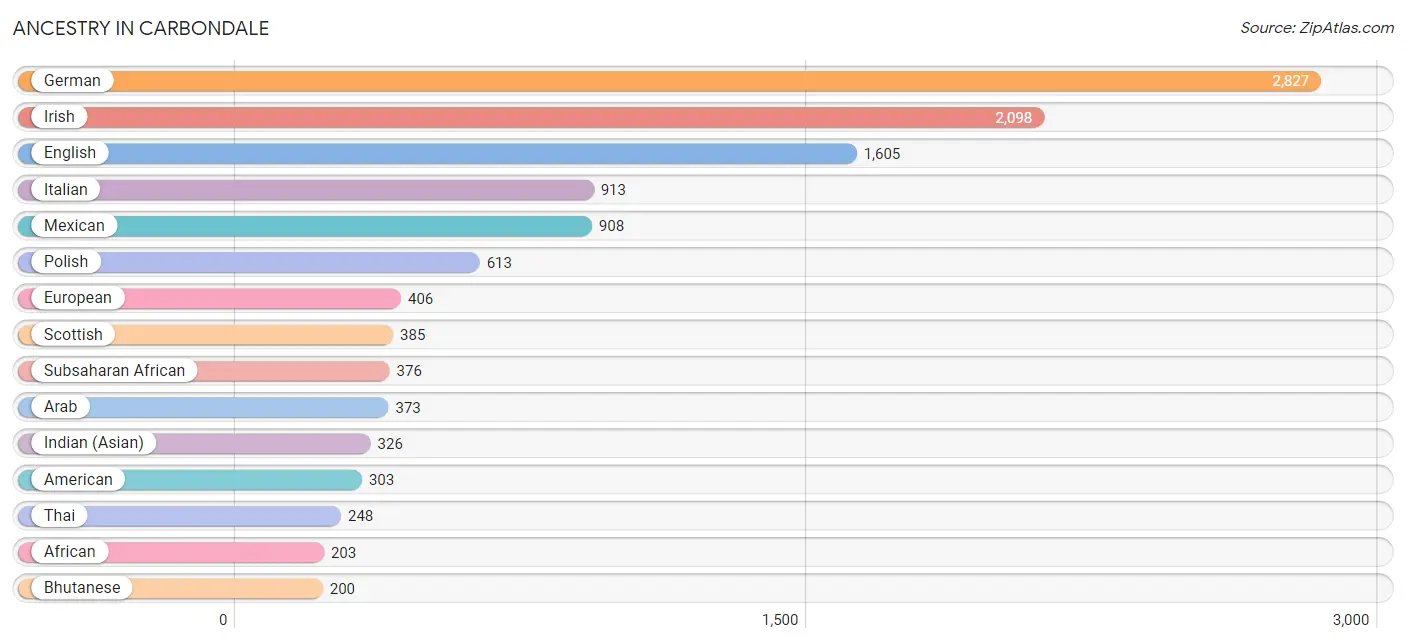
Ancestry in Carbondale
The most populous ancestries reported in Carbondale are German (2,827 | 12.8%), Irish (2,098 | 9.5%), English (1,605 | 7.3%), Italian (913 | 4.1%), and Mexican (908 | 4.1%), together accounting for 37.9% of all Carbondale residents.
| Ancestry | # Population | % Population |
| African | 203 | 0.9% |
| American | 303 | 1.4% |
| Arab | 373 | 1.7% |
| Argentinean | 18 | 0.1% |
| Austrian | 57 | 0.3% |
| Basque | 20 | 0.1% |
| Belgian | 13 | 0.1% |
| Bhutanese | 200 | 0.9% |
| Blackfeet | 17 | 0.1% |
| Brazilian | 33 | 0.2% |
| British | 102 | 0.5% |
| Burmese | 123 | 0.6% |
| Canadian | 39 | 0.2% |
| Central American | 3 | 0.0% |
| Cherokee | 79 | 0.4% |
| Choctaw | 4 | 0.0% |
| Creek | 21 | 0.1% |
| Croatian | 23 | 0.1% |
| Czech | 140 | 0.6% |
| Czechoslovakian | 3 | 0.0% |
| Danish | 4 | 0.0% |
| Dominican | 21 | 0.1% |
| Dutch | 145 | 0.7% |
| Eastern European | 73 | 0.3% |
| Ecuadorian | 22 | 0.1% |
| Egyptian | 4 | 0.0% |
| English | 1,605 | 7.3% |
| European | 406 | 1.8% |
| French | 157 | 0.7% |
| French Canadian | 69 | 0.3% |
| German | 2,827 | 12.8% |
| Ghanaian | 24 | 0.1% |
| Haitian | 16 | 0.1% |
| Hungarian | 62 | 0.3% |
| Indian (Asian) | 326 | 1.5% |
| Iranian | 92 | 0.4% |
| Iraqi | 26 | 0.1% |
| Irish | 2,098 | 9.5% |
| Italian | 913 | 4.1% |
| Korean | 161 | 0.7% |
| Laotian | 5 | 0.0% |
| Lithuanian | 87 | 0.4% |
| Luxembourger | 15 | 0.1% |
| Mexican | 908 | 4.1% |
| Mexican American Indian | 10 | 0.1% |
| Mongolian | 4 | 0.0% |
| Moroccan | 15 | 0.1% |
| Native Hawaiian | 84 | 0.4% |
| Navajo | 47 | 0.2% |
| Nigerian | 148 | 0.7% |
| Northern European | 52 | 0.2% |
| Norwegian | 174 | 0.8% |
| Peruvian | 7 | 0.0% |
| Polish | 613 | 2.8% |
| Portuguese | 92 | 0.4% |
| Puerto Rican | 53 | 0.2% |
| Romanian | 60 | 0.3% |
| Russian | 112 | 0.5% |
| Salvadoran | 3 | 0.0% |
| Scandinavian | 69 | 0.3% |
| Scotch-Irish | 136 | 0.6% |
| Scottish | 385 | 1.8% |
| Serbian | 22 | 0.1% |
| Slavic | 11 | 0.1% |
| Slovak | 18 | 0.1% |
| South American | 55 | 0.3% |
| Spaniard | 5 | 0.0% |
| Sri Lankan | 143 | 0.6% |
| Subsaharan African | 376 | 1.7% |
| Swedish | 83 | 0.4% |
| Swiss | 37 | 0.2% |
| Syrian | 56 | 0.3% |
| Taiwanese | 24 | 0.1% |
| Thai | 248 | 1.1% |
| Tlingit-Haida | 8 | 0.0% |
| Turkish | 43 | 0.2% |
| Ukrainian | 34 | 0.2% |
| Venezuelan | 8 | 0.0% |
| Vietnamese | 148 | 0.7% |
| Welsh | 87 | 0.4% |
| West Indian | 13 | 0.1% |
| Yaqui | 10 | 0.1% | View All 82 Rows |
Immigrants in Carbondale
The most numerous immigrant groups reported in Carbondale came from Asia (1,686 | 7.6%), South Central Asia (672 | 3.0%), Eastern Asia (403 | 1.8%), Western Asia (402 | 1.8%), and Nepal (304 | 1.4%), together accounting for 15.7% of all Carbondale residents.
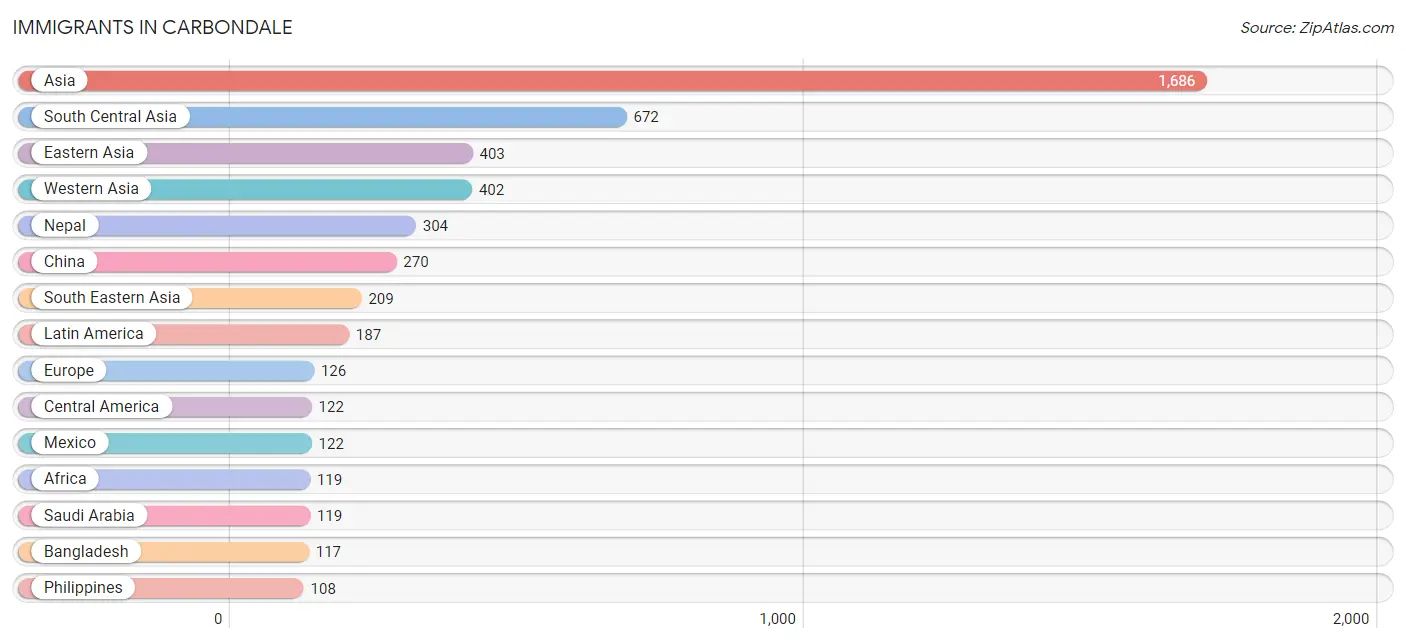
| Immigration Origin | # Population | % Population |
| Africa | 119 | 0.5% |
| Argentina | 18 | 0.1% |
| Asia | 1,686 | 7.6% |
| Austria | 6 | 0.0% |
| Bangladesh | 117 | 0.5% |
| Brazil | 24 | 0.1% |
| Canada | 56 | 0.3% |
| Caribbean | 8 | 0.0% |
| Central America | 122 | 0.5% |
| China | 270 | 1.2% |
| Croatia | 1 | 0.0% |
| Eastern Africa | 2 | 0.0% |
| Eastern Asia | 403 | 1.8% |
| Eastern Europe | 92 | 0.4% |
| Egypt | 4 | 0.0% |
| Europe | 126 | 0.6% |
| Ghana | 1 | 0.0% |
| Hong Kong | 9 | 0.0% |
| India | 47 | 0.2% |
| Indonesia | 5 | 0.0% |
| Iran | 88 | 0.4% |
| Iraq | 91 | 0.4% |
| Ireland | 17 | 0.1% |
| Italy | 11 | 0.1% |
| Jamaica | 8 | 0.0% |
| Japan | 38 | 0.2% |
| Korea | 95 | 0.4% |
| Latin America | 187 | 0.9% |
| Lithuania | 18 | 0.1% |
| Malaysia | 4 | 0.0% |
| Mexico | 122 | 0.5% |
| Middle Africa | 1 | 0.0% |
| Morocco | 15 | 0.1% |
| Nepal | 304 | 1.4% |
| Nigeria | 12 | 0.1% |
| Northern Africa | 19 | 0.1% |
| Northern Europe | 17 | 0.1% |
| Pakistan | 20 | 0.1% |
| Peru | 7 | 0.0% |
| Philippines | 108 | 0.5% |
| Poland | 5 | 0.0% |
| Romania | 47 | 0.2% |
| Russia | 8 | 0.0% |
| Saudi Arabia | 119 | 0.5% |
| South America | 57 | 0.3% |
| South Central Asia | 672 | 3.0% |
| South Eastern Asia | 209 | 0.9% |
| Southern Europe | 11 | 0.1% |
| Sri Lanka | 96 | 0.4% |
| Syria | 39 | 0.2% |
| Taiwan | 23 | 0.1% |
| Turkey | 41 | 0.2% |
| Uganda | 1 | 0.0% |
| Ukraine | 13 | 0.1% |
| Venezuela | 8 | 0.0% |
| Vietnam | 68 | 0.3% |
| Western Africa | 13 | 0.1% |
| Western Asia | 402 | 1.8% |
| Western Europe | 6 | 0.0% |
| Yemen | 85 | 0.4% | View All 60 Rows |
Sex and Age in Carbondale
Sex and Age in Carbondale
The most populous age groups in Carbondale are 20 to 24 Years (3,386 | 29.7%) for men and 20 to 24 Years (2,960 | 27.8%) for women.
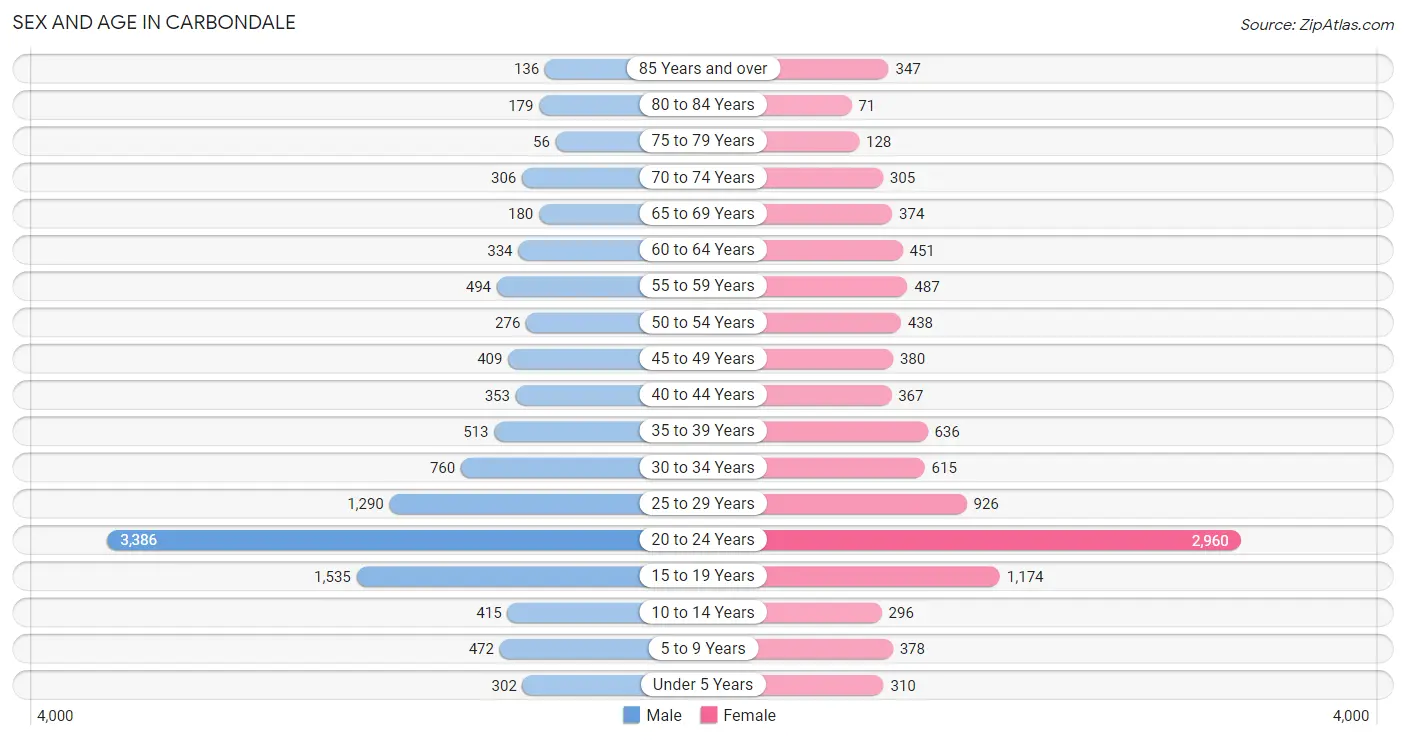
| Age Bracket | Male | Female |
| Under 5 Years | 302 (2.6%) | 310 (2.9%) |
| 5 to 9 Years | 472 (4.1%) | 378 (3.5%) |
| 10 to 14 Years | 415 (3.6%) | 296 (2.8%) |
| 15 to 19 Years | 1,535 (13.5%) | 1,174 (11.0%) |
| 20 to 24 Years | 3,386 (29.7%) | 2,960 (27.8%) |
| 25 to 29 Years | 1,290 (11.3%) | 926 (8.7%) |
| 30 to 34 Years | 760 (6.7%) | 615 (5.8%) |
| 35 to 39 Years | 513 (4.5%) | 636 (6.0%) |
| 40 to 44 Years | 353 (3.1%) | 367 (3.5%) |
| 45 to 49 Years | 409 (3.6%) | 380 (3.6%) |
| 50 to 54 Years | 276 (2.4%) | 438 (4.1%) |
| 55 to 59 Years | 494 (4.3%) | 487 (4.6%) |
| 60 to 64 Years | 334 (2.9%) | 451 (4.2%) |
| 65 to 69 Years | 180 (1.6%) | 374 (3.5%) |
| 70 to 74 Years | 306 (2.7%) | 305 (2.9%) |
| 75 to 79 Years | 56 (0.5%) | 128 (1.2%) |
| 80 to 84 Years | 179 (1.6%) | 71 (0.7%) |
| 85 Years and over | 136 (1.2%) | 347 (3.3%) |
| Total | 11,396 (100.0%) | 10,643 (100.0%) |
Families and Households in Carbondale
Median Family Size in Carbondale
The median family size in Carbondale is 2.89 persons per family, with single female/mother families (1,088 | 34.3%) accounting for the largest median family size of 2.93 persons per family. On the other hand, single male/father families (312 | 9.8%) represent the smallest median family size with 2.62 persons per family.
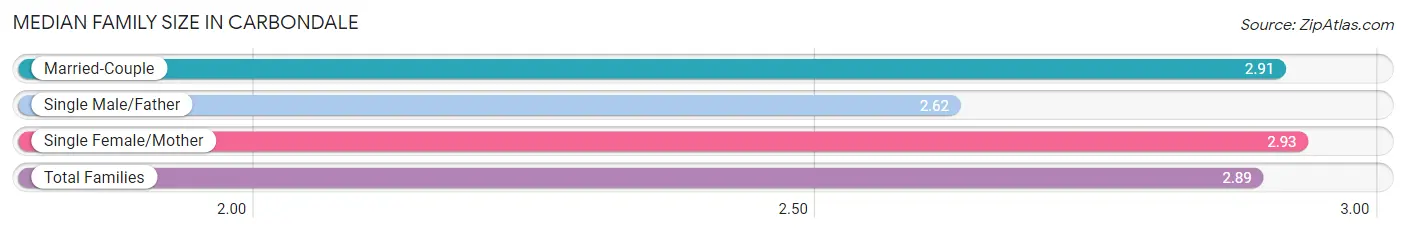
| Family Type | # Families | Family Size |
| Married-Couple | 1,776 (55.9%) | 2.91 |
| Single Male/Father | 312 (9.8%) | 2.62 |
| Single Female/Mother | 1,088 (34.3%) | 2.93 |
| Total Families | 3,176 (100.0%) | 2.89 |
Median Household Size in Carbondale
The median household size in Carbondale is 1.89 persons per household, with single female/mother households (1,088 | 10.9%) accounting for the largest median household size of 3.05 persons per household. non-family households (6,798 | 68.2%) represent the smallest median household size with 1.40 persons per household.
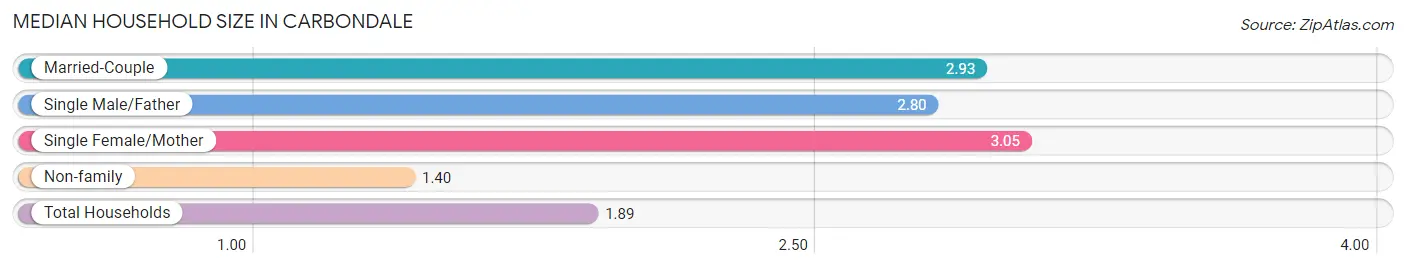
| Household Type | # Households | Household Size |
| Married-Couple | 1,776 (17.8%) | 2.93 |
| Single Male/Father | 312 (3.1%) | 2.80 |
| Single Female/Mother | 1,088 (10.9%) | 3.05 |
| Non-family | 6,798 (68.2%) | 1.40 |
| Total Households | 9,974 (100.0%) | 1.89 |
Household Size by Marriage Status in Carbondale
Out of a total of 9,974 households in Carbondale, 3,176 (31.8%) are family households, while 6,798 (68.2%) are nonfamily households. The most numerous type of family households are 2-person households, comprising 1,434, and the most common type of nonfamily households are 1-person households, comprising 5,114.
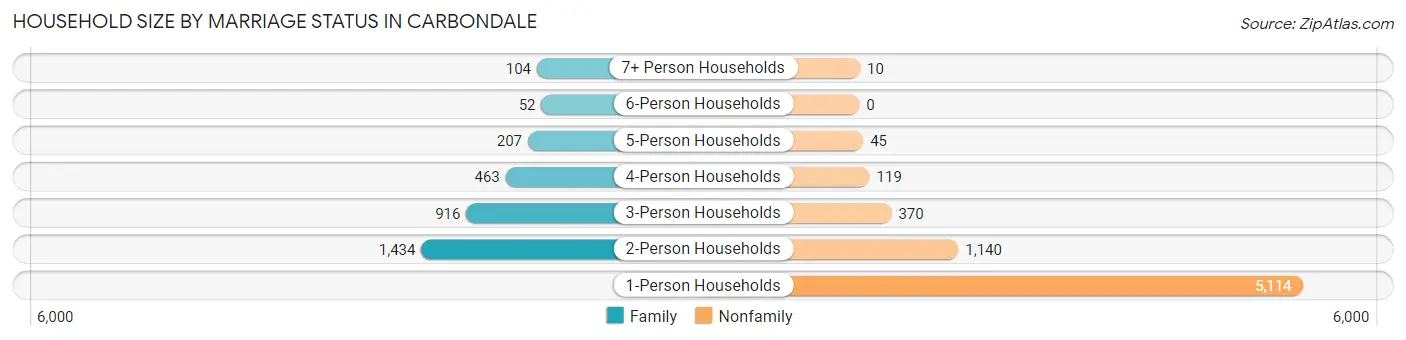
| Household Size | Family Households | Nonfamily Households |
| 1-Person Households | - | 5,114 (51.3%) |
| 2-Person Households | 1,434 (14.4%) | 1,140 (11.4%) |
| 3-Person Households | 916 (9.2%) | 370 (3.7%) |
| 4-Person Households | 463 (4.6%) | 119 (1.2%) |
| 5-Person Households | 207 (2.1%) | 45 (0.4%) |
| 6-Person Households | 52 (0.5%) | 0 (0.0%) |
| 7+ Person Households | 104 (1.0%) | 10 (0.1%) |
| Total | 3,176 (31.8%) | 6,798 (68.2%) |
Female Fertility in Carbondale
Fertility by Age in Carbondale
Average fertility rate in Carbondale is 19.0 births per 1,000 women. Women in the age bracket of 35 to 50 years have the highest fertility rate with 23.0 births per 1,000 women. Women in the age bracket of 20 to 34 years acount for 75.9% of all women with births.
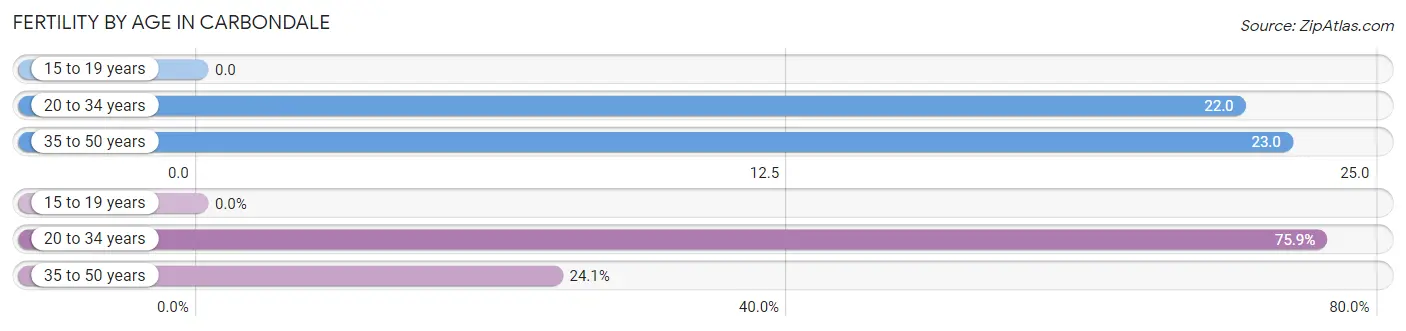
| Age Bracket | Women with Births | Births / 1,000 Women |
| 15 to 19 years | 0 (0.0%) | 0.0 |
| 20 to 34 years | 101 (75.9%) | 22.0 |
| 35 to 50 years | 32 (24.1%) | 23.0 |
| Total | 133 (100.0%) | 19.0 |
Fertility by Age by Marriage Status in Carbondale
82.7% of women with births (133) in Carbondale are married. The highest percentage of unmarried women with births falls into 20 to 34 years age bracket with 22.8% of them unmarried at the time of birth, while the lowest percentage of unmarried women with births belong to 35 to 50 years age bracket with 0.0% of them unmarried.
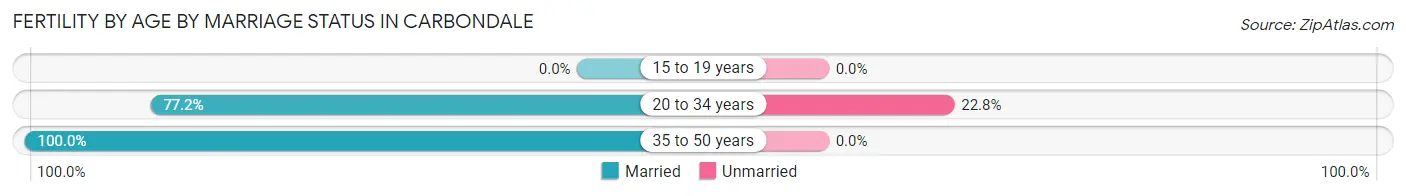
| Age Bracket | Married | Unmarried |
| 15 to 19 years | 0 (0.0%) | 0 (0.0%) |
| 20 to 34 years | 78 (77.2%) | 23 (22.8%) |
| 35 to 50 years | 32 (100.0%) | 0 (0.0%) |
| Total | 110 (82.7%) | 23 (17.3%) |
Fertility by Education in Carbondale
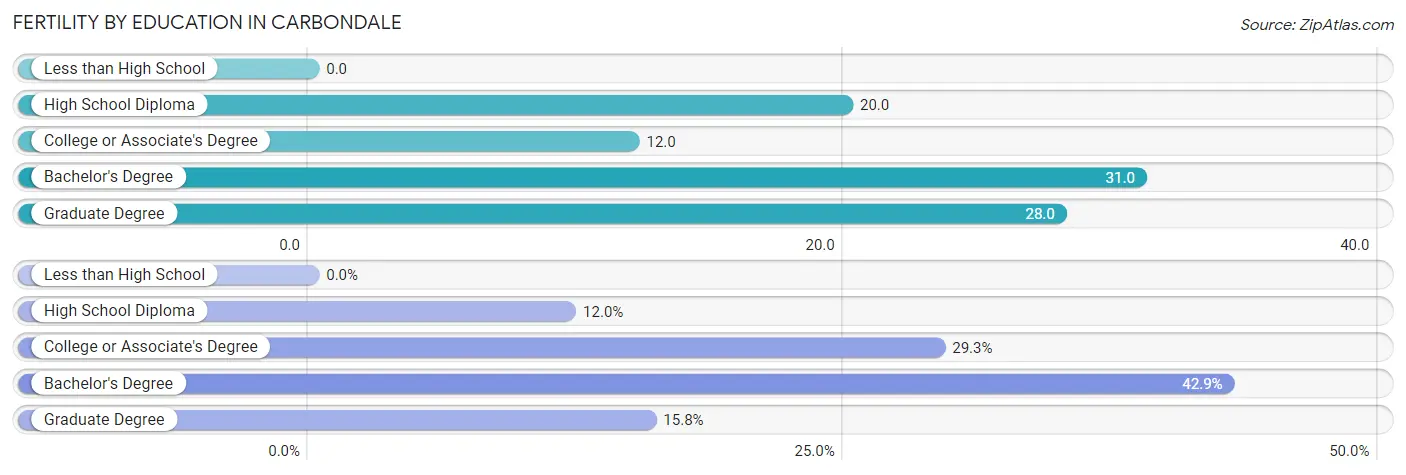
| Educational Attainment | Women with Births | Births / 1,000 Women |
| Less than High School | 0 (0.0%) | 0.0 |
| High School Diploma | 16 (12.0%) | 20.0 |
| College or Associate's Degree | 39 (29.3%) | 12.0 |
| Bachelor's Degree | 57 (42.9%) | 31.0 |
| Graduate Degree | 21 (15.8%) | 28.0 |
| Total | 133 (100.0%) | 19.0 |
Fertility by Education by Marriage Status in Carbondale
17.3% of women with births in Carbondale are unmarried. Women with the educational attainment of college or associate's degree are most likely to be married with 100.0% of them married at childbirth, while women with the educational attainment of high school diploma are least likely to be married with 100.0% of them unmarried at childbirth.
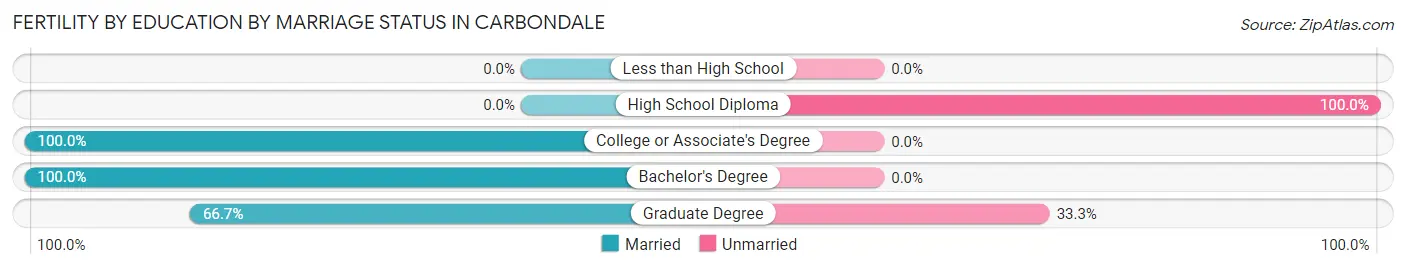
| Educational Attainment | Married | Unmarried |
| Less than High School | 0 (0.0%) | 0 (0.0%) |
| High School Diploma | 0 (0.0%) | 16 (100.0%) |
| College or Associate's Degree | 39 (100.0%) | 0 (0.0%) |
| Bachelor's Degree | 57 (100.0%) | 0 (0.0%) |
| Graduate Degree | 14 (66.7%) | 7 (33.3%) |
| Total | 110 (82.7%) | 23 (17.3%) |
Employment Characteristics in Carbondale
Employment by Class of Employer in Carbondale
Among the 9,288 employed individuals in Carbondale, private company employees (5,216 | 56.2%), state government employees (1,795 | 19.3%), and not-for-profit organizations (1,219 | 13.1%) make up the most common classes of employment.
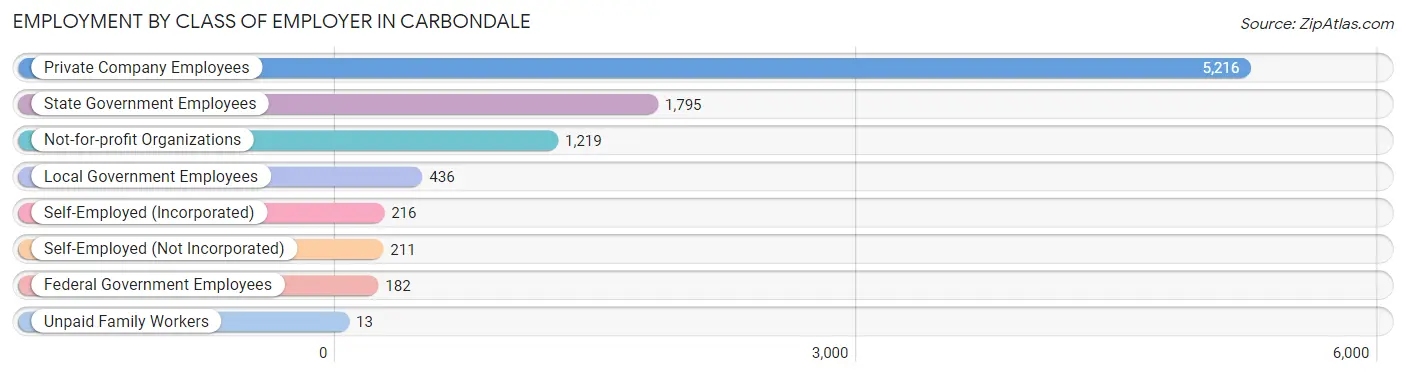
| Employer Class | # Employees | % Employees |
| Private Company Employees | 5,216 | 56.2% |
| Self-Employed (Incorporated) | 216 | 2.3% |
| Self-Employed (Not Incorporated) | 211 | 2.3% |
| Not-for-profit Organizations | 1,219 | 13.1% |
| Local Government Employees | 436 | 4.7% |
| State Government Employees | 1,795 | 19.3% |
| Federal Government Employees | 182 | 2.0% |
| Unpaid Family Workers | 13 | 0.1% |
| Total | 9,288 | 100.0% |
Employment Status by Age in Carbondale
According to the labor force statistics for Carbondale, out of the total population over 16 years of age (19,703), 56.2% or 11,073 individuals are in the labor force, with 9.6% or 1,063 of them unemployed. The age group with the highest labor force participation rate is 30 to 34 years, with 82.1% or 1,129 individuals in the labor force. Within the labor force, the 16 to 19 years age range has the highest percentage of unemployed individuals, with 26.0% or 109 of them being unemployed.
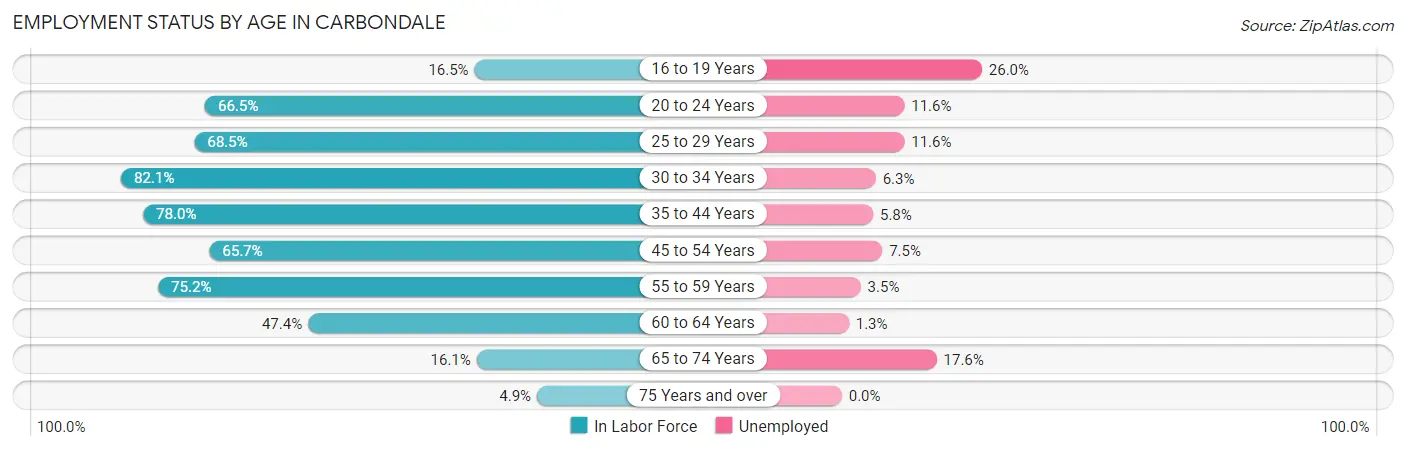
| Age Bracket | In Labor Force | Unemployed |
| 16 to 19 Years | 420 (16.5%) | 109 (26.0%) |
| 20 to 24 Years | 4,220 (66.5%) | 490 (11.6%) |
| 25 to 29 Years | 1,518 (68.5%) | 176 (11.6%) |
| 30 to 34 Years | 1,129 (82.1%) | 71 (6.3%) |
| 35 to 44 Years | 1,458 (78.0%) | 85 (5.8%) |
| 45 to 54 Years | 987 (65.7%) | 74 (7.5%) |
| 55 to 59 Years | 738 (75.2%) | 26 (3.5%) |
| 60 to 64 Years | 372 (47.4%) | 5 (1.3%) |
| 65 to 74 Years | 188 (16.1%) | 33 (17.6%) |
| 75 Years and over | 45 (4.9%) | 0 (0.0%) |
| Total | 11,073 (56.2%) | 1,063 (9.6%) |
Employment Status by Educational Attainment in Carbondale
According to labor force statistics for Carbondale, 71.1% of individuals (6,206) out of the total population between 25 and 64 years of age (8,729) are in the labor force, with 7.0% or 434 of them being unemployed. The group with the highest labor force participation rate are those with the educational attainment of bachelor's degree or higher, with 78.2% or 3,137 individuals in the labor force. Within the labor force, individuals with college / associate degree education have the highest percentage of unemployment, with 12.9% or 255 of them being unemployed.
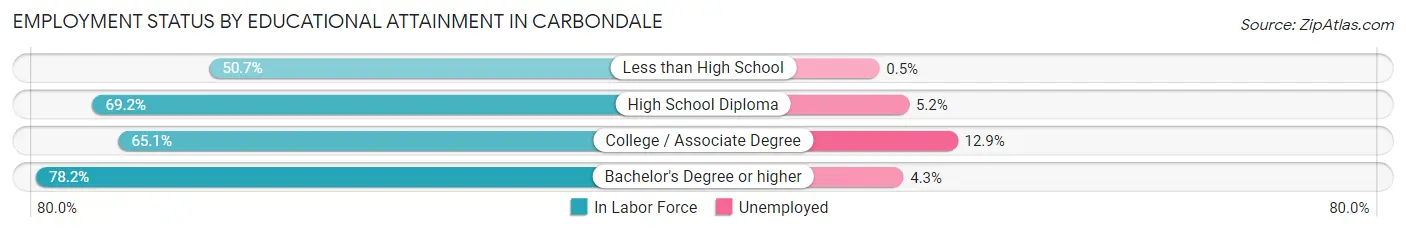
| Educational Attainment | In Labor Force | Unemployed |
| Less than High School | 204 (50.7%) | 2 (0.5%) |
| High School Diploma | 889 (69.2%) | 67 (5.2%) |
| College / Associate Degree | 1,974 (65.1%) | 391 (12.9%) |
| Bachelor's Degree or higher | 3,137 (78.2%) | 172 (4.3%) |
| Total | 6,206 (71.1%) | 611 (7.0%) |
Employment Occupations by Sex in Carbondale
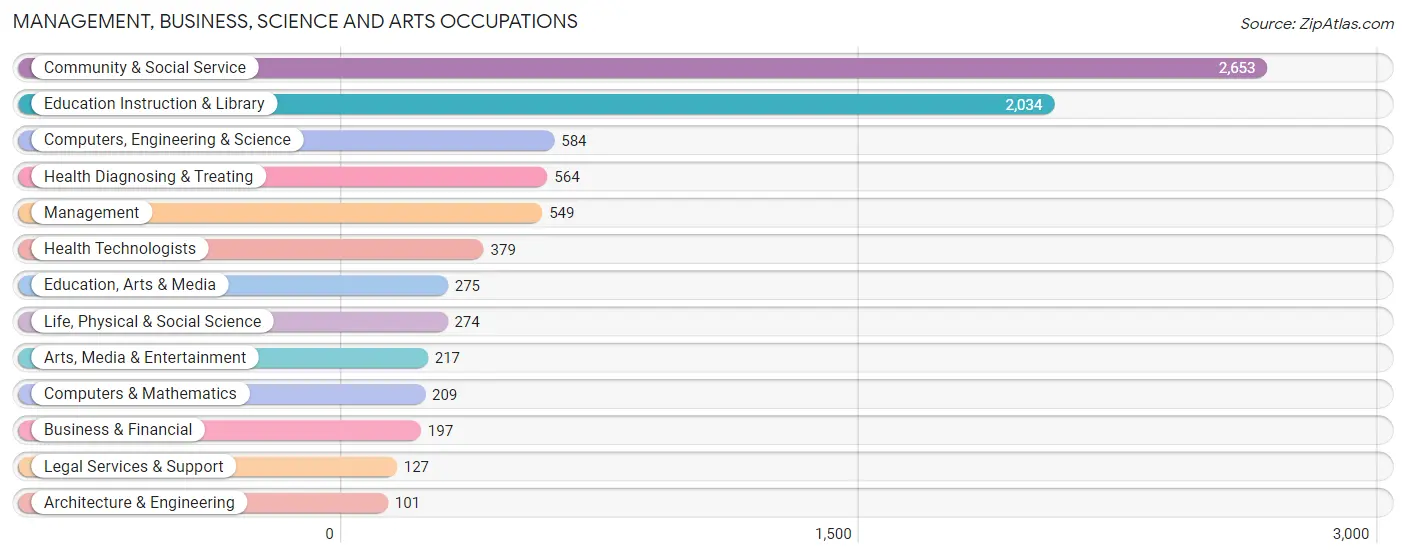
Management, Business, Science and Arts Occupations
The most common Management, Business, Science and Arts occupations in Carbondale are Community & Social Service (2,653 | 26.6%), Education Instruction & Library (2,034 | 20.4%), Computers, Engineering & Science (584 | 5.9%), Health Diagnosing & Treating (564 | 5.7%), and Management (549 | 5.5%).
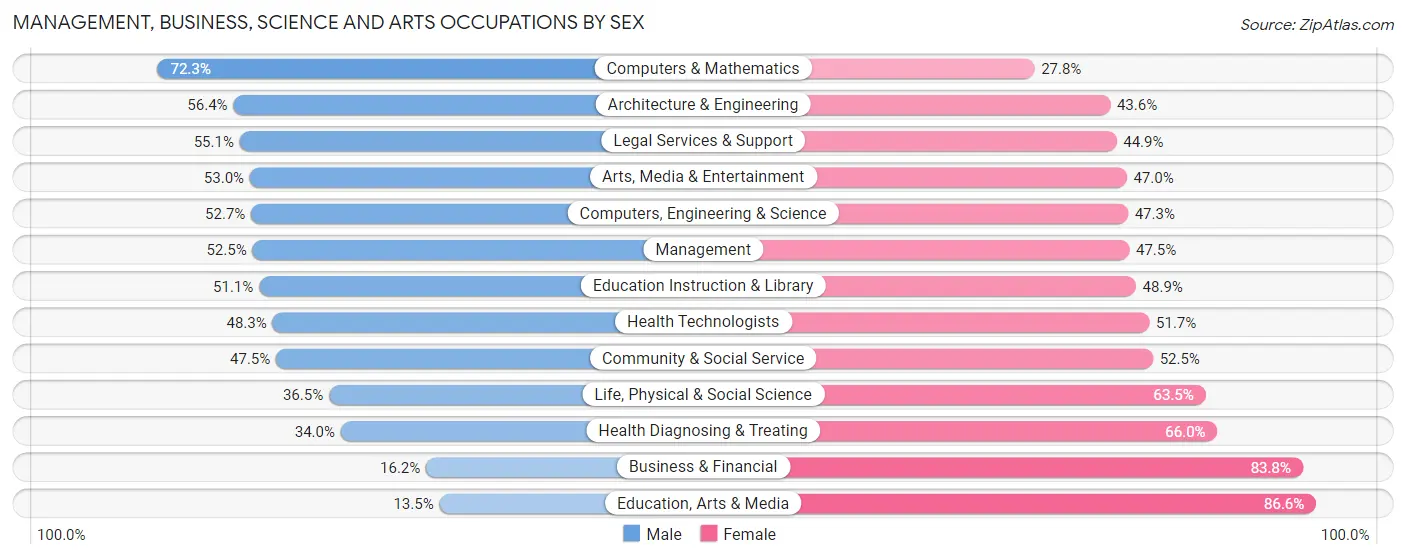
Management, Business, Science and Arts Occupations by Sex
Within the Management, Business, Science and Arts occupations in Carbondale, the most male-oriented occupations are Computers & Mathematics (72.3%), Architecture & Engineering (56.4%), and Legal Services & Support (55.1%), while the most female-oriented occupations are Education, Arts & Media (86.6%), Business & Financial (83.8%), and Health Diagnosing & Treating (66.0%).
| Occupation | Male | Female |
| Management | 288 (52.5%) | 261 (47.5%) |
| Business & Financial | 32 (16.2%) | 165 (83.8%) |
| Computers, Engineering & Science | 308 (52.7%) | 276 (47.3%) |
| Computers & Mathematics | 151 (72.3%) | 58 (27.8%) |
| Architecture & Engineering | 57 (56.4%) | 44 (43.6%) |
| Life, Physical & Social Science | 100 (36.5%) | 174 (63.5%) |
| Community & Social Service | 1,261 (47.5%) | 1,392 (52.5%) |
| Education, Arts & Media | 37 (13.5%) | 238 (86.6%) |
| Legal Services & Support | 70 (55.1%) | 57 (44.9%) |
| Education Instruction & Library | 1,039 (51.1%) | 995 (48.9%) |
| Arts, Media & Entertainment | 115 (53.0%) | 102 (47.0%) |
| Health Diagnosing & Treating | 192 (34.0%) | 372 (66.0%) |
| Health Technologists | 183 (48.3%) | 196 (51.7%) |
| Total (Category) | 2,081 (45.8%) | 2,466 (54.2%) |
| Total (Overall) | 4,993 (50.0%) | 4,986 (50.0%) |
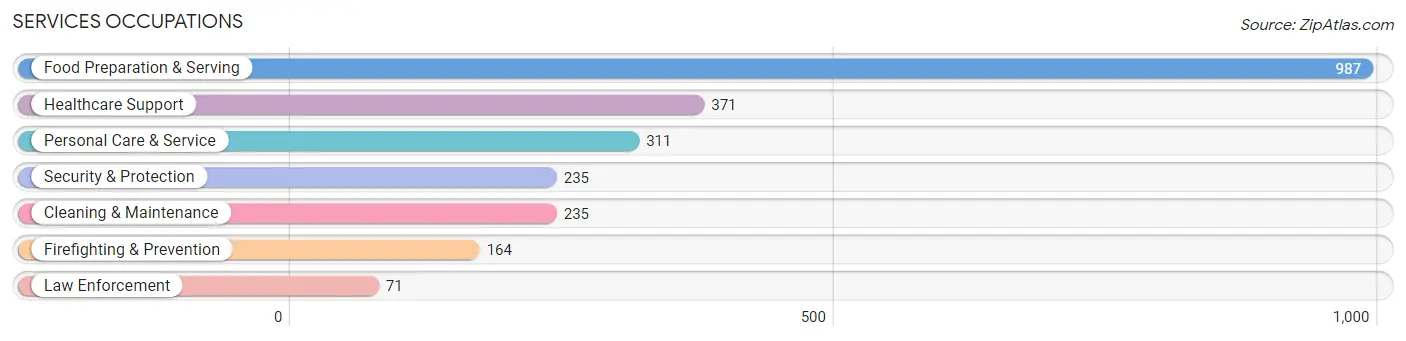
Services Occupations
The most common Services occupations in Carbondale are Food Preparation & Serving (987 | 9.9%), Healthcare Support (371 | 3.7%), Personal Care & Service (311 | 3.1%), Security & Protection (235 | 2.4%), and Cleaning & Maintenance (235 | 2.4%).
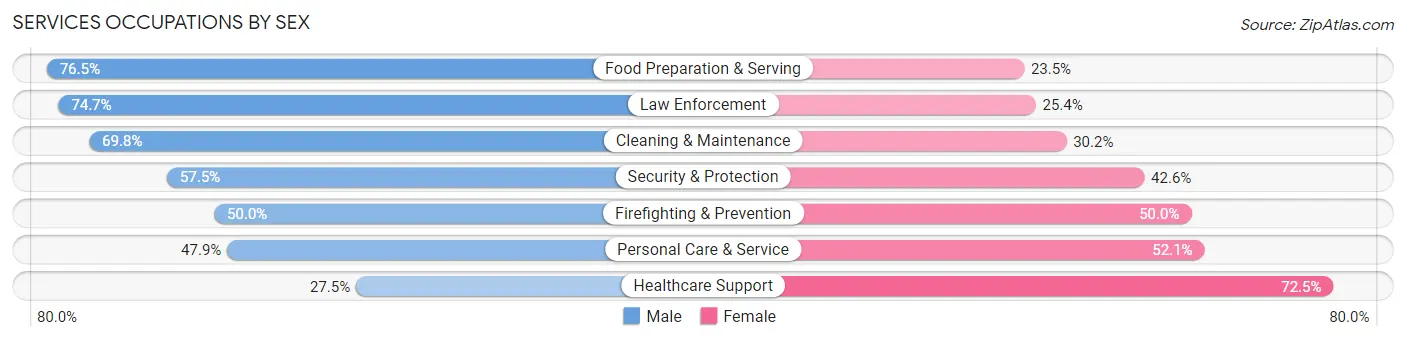
Services Occupations by Sex
Within the Services occupations in Carbondale, the most male-oriented occupations are Food Preparation & Serving (76.5%), Law Enforcement (74.7%), and Cleaning & Maintenance (69.8%), while the most female-oriented occupations are Healthcare Support (72.5%), Personal Care & Service (52.1%), and Firefighting & Prevention (50.0%).
| Occupation | Male | Female |
| Healthcare Support | 102 (27.5%) | 269 (72.5%) |
| Security & Protection | 135 (57.5%) | 100 (42.5%) |
| Firefighting & Prevention | 82 (50.0%) | 82 (50.0%) |
| Law Enforcement | 53 (74.7%) | 18 (25.4%) |
| Food Preparation & Serving | 755 (76.5%) | 232 (23.5%) |
| Cleaning & Maintenance | 164 (69.8%) | 71 (30.2%) |
| Personal Care & Service | 149 (47.9%) | 162 (52.1%) |
| Total (Category) | 1,305 (61.0%) | 834 (39.0%) |
| Total (Overall) | 4,993 (50.0%) | 4,986 (50.0%) |
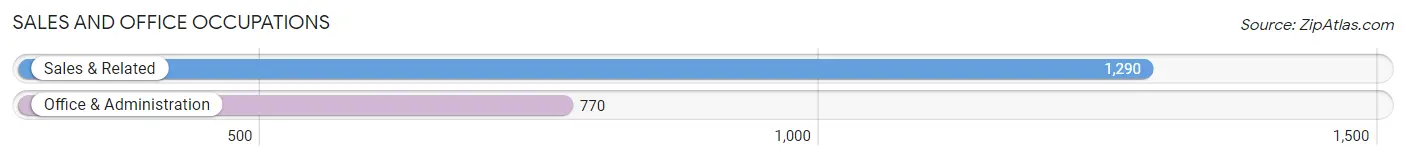
Sales and Office Occupations
The most common Sales and Office occupations in Carbondale are Sales & Related (1,290 | 12.9%), and Office & Administration (770 | 7.7%).
Sales and Office Occupations by Sex
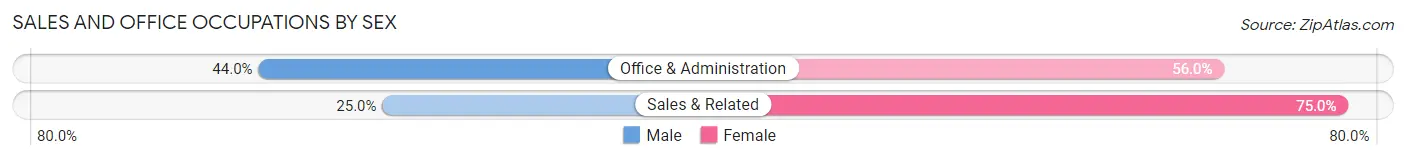
| Occupation | Male | Female |
| Sales & Related | 322 (25.0%) | 968 (75.0%) |
| Office & Administration | 339 (44.0%) | 431 (56.0%) |
| Total (Category) | 661 (32.1%) | 1,399 (67.9%) |
| Total (Overall) | 4,993 (50.0%) | 4,986 (50.0%) |
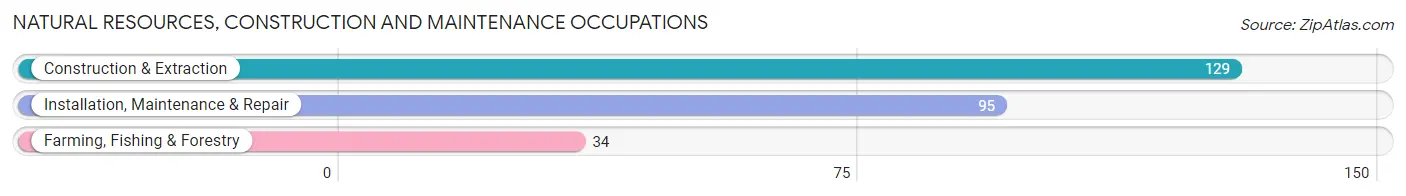
Natural Resources, Construction and Maintenance Occupations
The most common Natural Resources, Construction and Maintenance occupations in Carbondale are Construction & Extraction (129 | 1.3%), Installation, Maintenance & Repair (95 | 0.9%), and Farming, Fishing & Forestry (34 | 0.3%).
Natural Resources, Construction and Maintenance Occupations by Sex
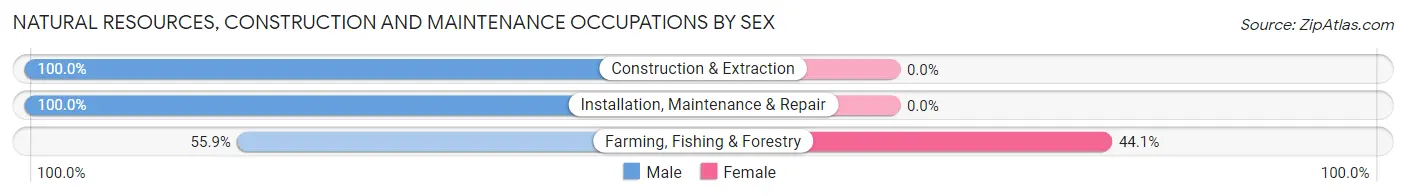
| Occupation | Male | Female |
| Farming, Fishing & Forestry | 19 (55.9%) | 15 (44.1%) |
| Construction & Extraction | 129 (100.0%) | 0 (0.0%) |
| Installation, Maintenance & Repair | 95 (100.0%) | 0 (0.0%) |
| Total (Category) | 243 (94.2%) | 15 (5.8%) |
| Total (Overall) | 4,993 (50.0%) | 4,986 (50.0%) |
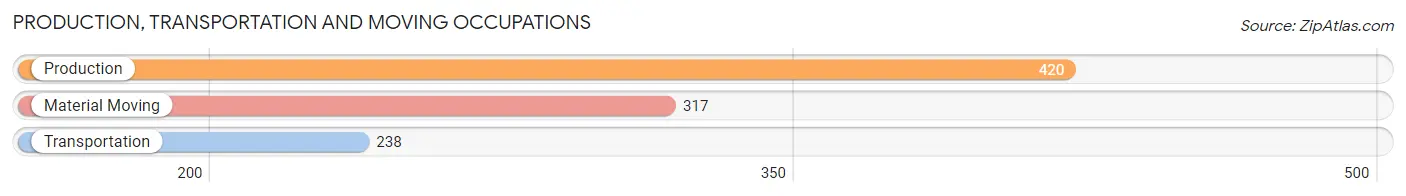
Production, Transportation and Moving Occupations
The most common Production, Transportation and Moving occupations in Carbondale are Production (420 | 4.2%), Material Moving (317 | 3.2%), and Transportation (238 | 2.4%).
Production, Transportation and Moving Occupations by Sex
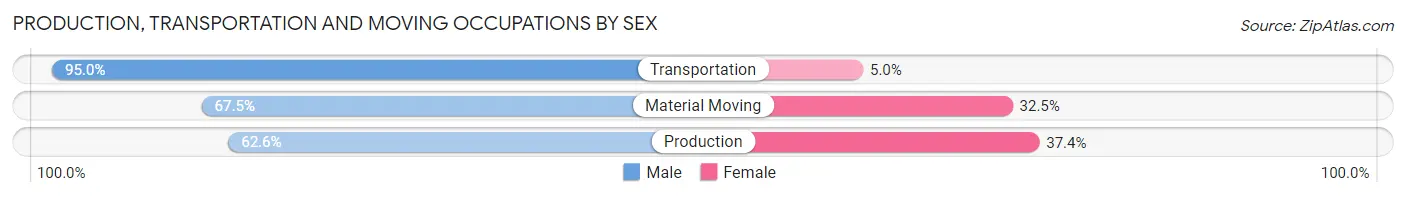
| Occupation | Male | Female |
| Production | 263 (62.6%) | 157 (37.4%) |
| Transportation | 226 (95.0%) | 12 (5.0%) |
| Material Moving | 214 (67.5%) | 103 (32.5%) |
| Total (Category) | 703 (72.1%) | 272 (27.9%) |
| Total (Overall) | 4,993 (50.0%) | 4,986 (50.0%) |
Employment Industries by Sex in Carbondale
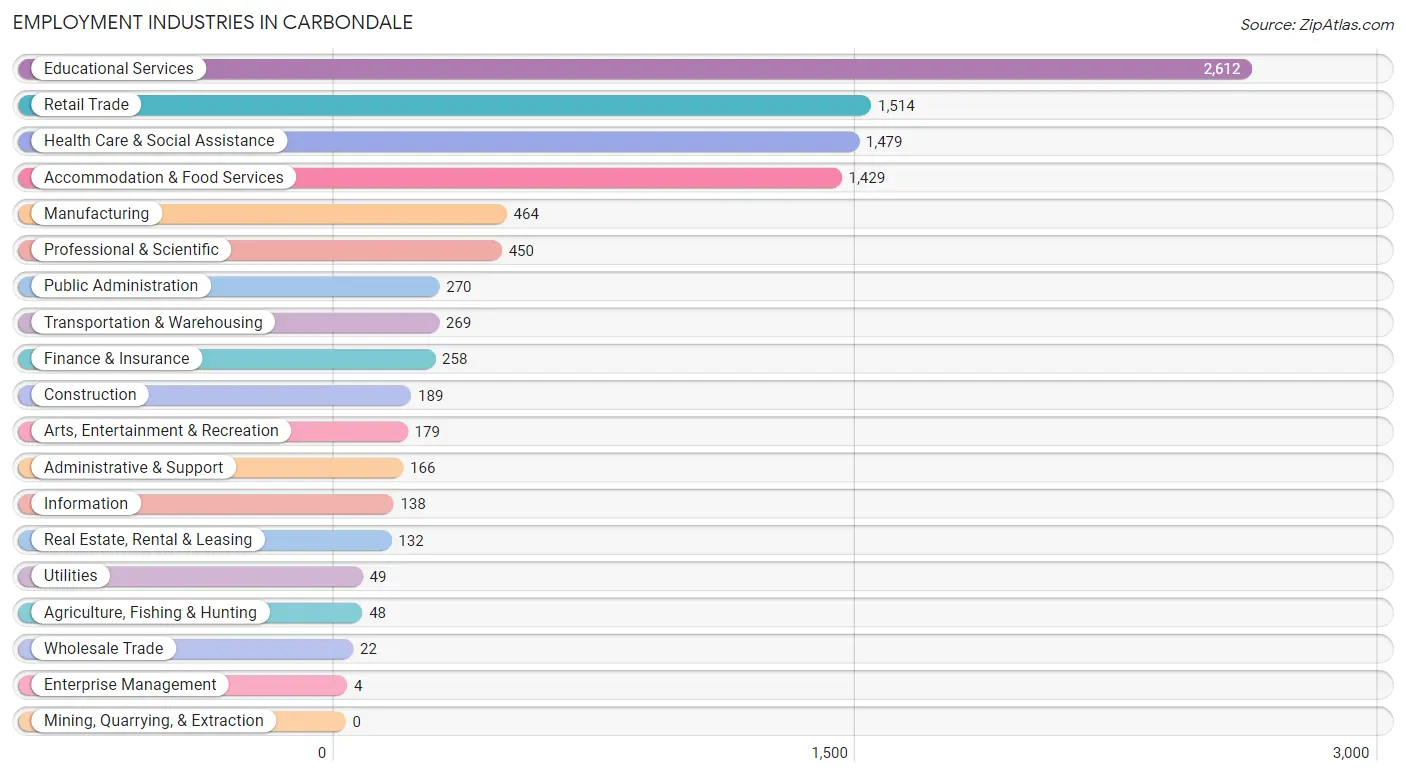
Employment Industries in Carbondale
The major employment industries in Carbondale include Educational Services (2,612 | 26.2%), Retail Trade (1,514 | 15.2%), Health Care & Social Assistance (1,479 | 14.8%), Accommodation & Food Services (1,429 | 14.3%), and Manufacturing (464 | 4.6%).
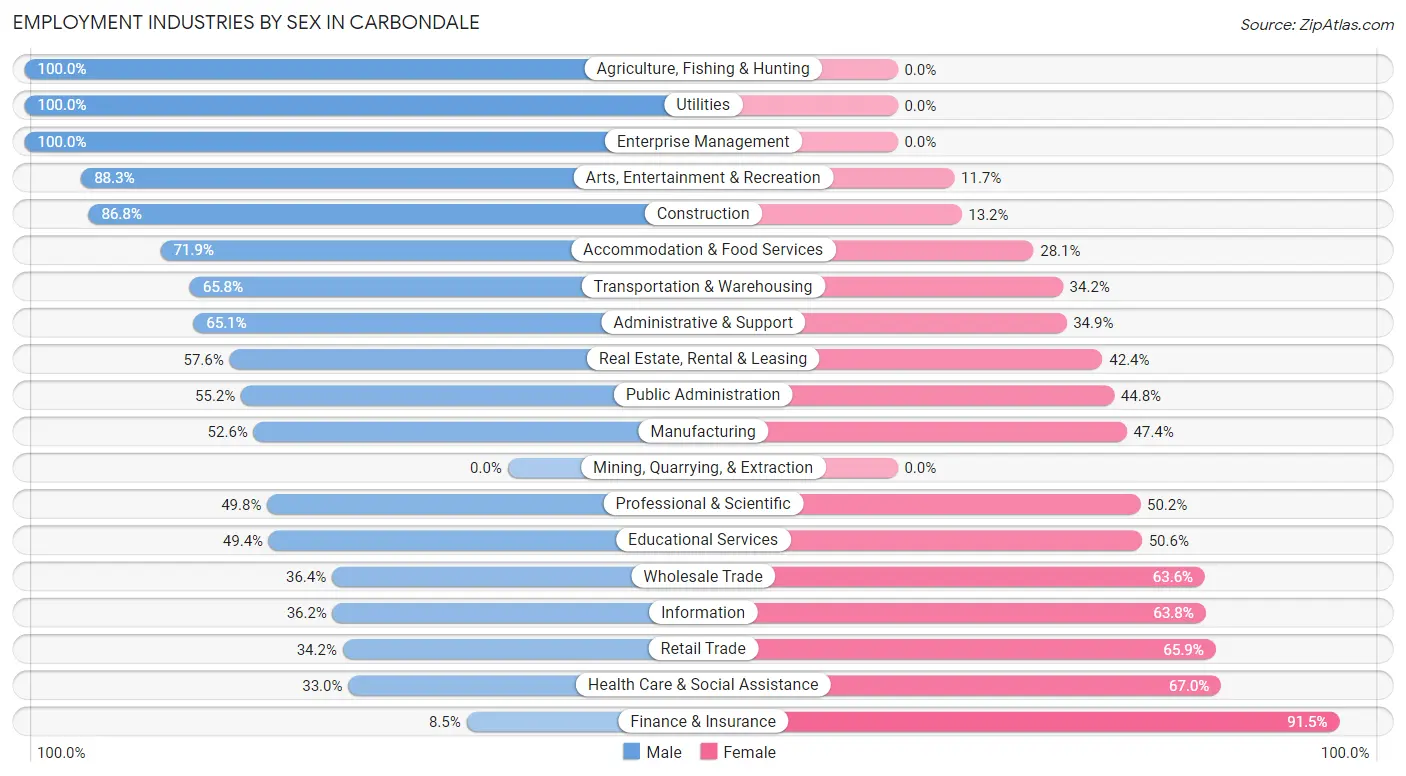
Employment Industries by Sex in Carbondale
The Carbondale industries that see more men than women are Agriculture, Fishing & Hunting (100.0%), Utilities (100.0%), and Enterprise Management (100.0%), whereas the industries that tend to have a higher number of women are Finance & Insurance (91.5%), Health Care & Social Assistance (67.0%), and Retail Trade (65.8%).
| Industry | Male | Female |
| Agriculture, Fishing & Hunting | 48 (100.0%) | 0 (0.0%) |
| Mining, Quarrying, & Extraction | 0 (0.0%) | 0 (0.0%) |
| Construction | 164 (86.8%) | 25 (13.2%) |
| Manufacturing | 244 (52.6%) | 220 (47.4%) |
| Wholesale Trade | 8 (36.4%) | 14 (63.6%) |
| Retail Trade | 517 (34.2%) | 997 (65.8%) |
| Transportation & Warehousing | 177 (65.8%) | 92 (34.2%) |
| Utilities | 49 (100.0%) | 0 (0.0%) |
| Information | 50 (36.2%) | 88 (63.8%) |
| Finance & Insurance | 22 (8.5%) | 236 (91.5%) |
| Real Estate, Rental & Leasing | 76 (57.6%) | 56 (42.4%) |
| Professional & Scientific | 224 (49.8%) | 226 (50.2%) |
| Enterprise Management | 4 (100.0%) | 0 (0.0%) |
| Administrative & Support | 108 (65.1%) | 58 (34.9%) |
| Educational Services | 1,291 (49.4%) | 1,321 (50.6%) |
| Health Care & Social Assistance | 488 (33.0%) | 991 (67.0%) |
| Arts, Entertainment & Recreation | 158 (88.3%) | 21 (11.7%) |
| Accommodation & Food Services | 1,027 (71.9%) | 402 (28.1%) |
| Public Administration | 149 (55.2%) | 121 (44.8%) |
| Total | 4,993 (50.0%) | 4,986 (50.0%) |
Education in Carbondale
School Enrollment in Carbondale
The most common levels of schooling among the 10,688 students in Carbondale are college / undergraduate (6,151 | 57.6%), graduate / professional (2,424 | 22.7%), and high school (715 | 6.7%).
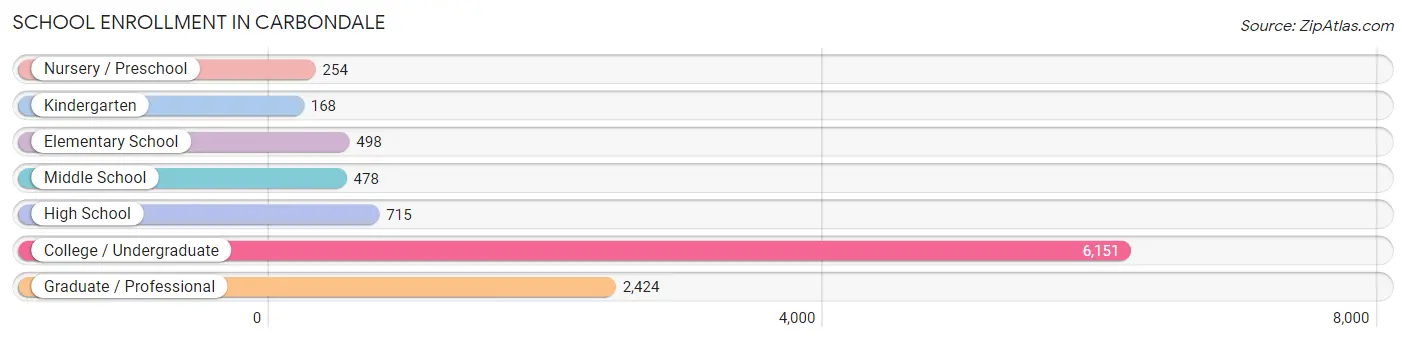
| School Level | # Students | % Students |
| Nursery / Preschool | 254 | 2.4% |
| Kindergarten | 168 | 1.6% |
| Elementary School | 498 | 4.7% |
| Middle School | 478 | 4.5% |
| High School | 715 | 6.7% |
| College / Undergraduate | 6,151 | 57.6% |
| Graduate / Professional | 2,424 | 22.7% |
| Total | 10,688 | 100.0% |
School Enrollment by Age by Funding Source in Carbondale
Out of a total of 10,688 students who are enrolled in schools in Carbondale, 545 (5.1%) attend a private institution, while the remaining 10,143 (94.9%) are enrolled in public schools. The age group of 10 to 14 year olds has the highest likelihood of being enrolled in private schools, with 92 (14.9% in the age bracket) enrolled. Conversely, the age group of 18 to 19 year olds has the lowest likelihood of being enrolled in a private school, with 2,071 (99.0% in the age bracket) attending a public institution.
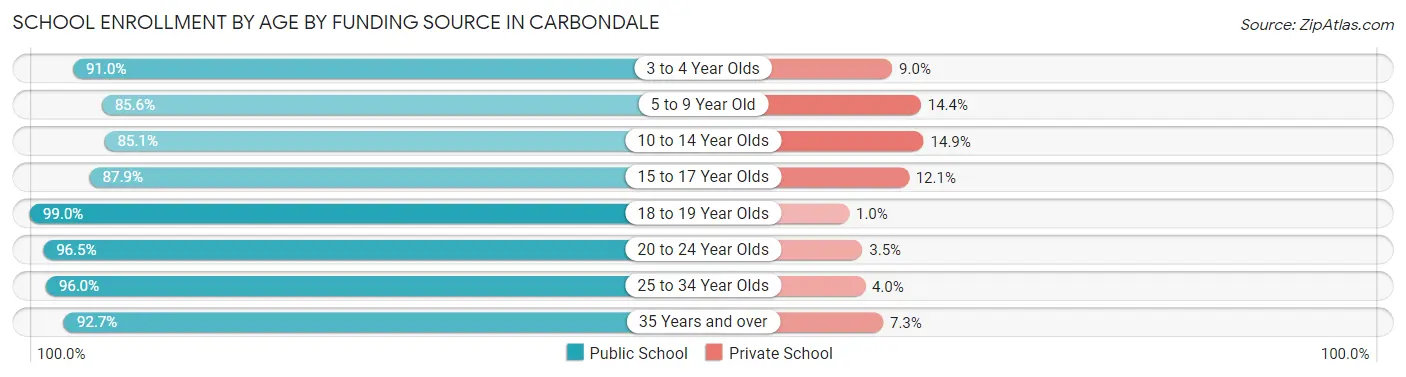
| Age Bracket | Public School | Private School |
| 3 to 4 Year Olds | 131 (91.0%) | 13 (9.0%) |
| 5 to 9 Year Old | 584 (85.6%) | 98 (14.4%) |
| 10 to 14 Year Olds | 526 (85.1%) | 92 (14.9%) |
| 15 to 17 Year Olds | 435 (87.9%) | 60 (12.1%) |
| 18 to 19 Year Olds | 2,071 (99.0%) | 21 (1.0%) |
| 20 to 24 Year Olds | 4,460 (96.5%) | 161 (3.5%) |
| 25 to 34 Year Olds | 1,523 (96.0%) | 63 (4.0%) |
| 35 Years and over | 417 (92.7%) | 33 (7.3%) |
| Total | 10,143 (94.9%) | 545 (5.1%) |
Educational Attainment by Field of Study in Carbondale
Education (624 | 10.9%), engineering (545 | 9.5%), bio, nature & agricultural (530 | 9.2%), science & technology (518 | 9.0%), and arts & humanities (504 | 8.8%) are the most common fields of study among 5,734 individuals in Carbondale who have obtained a bachelor's degree or higher.
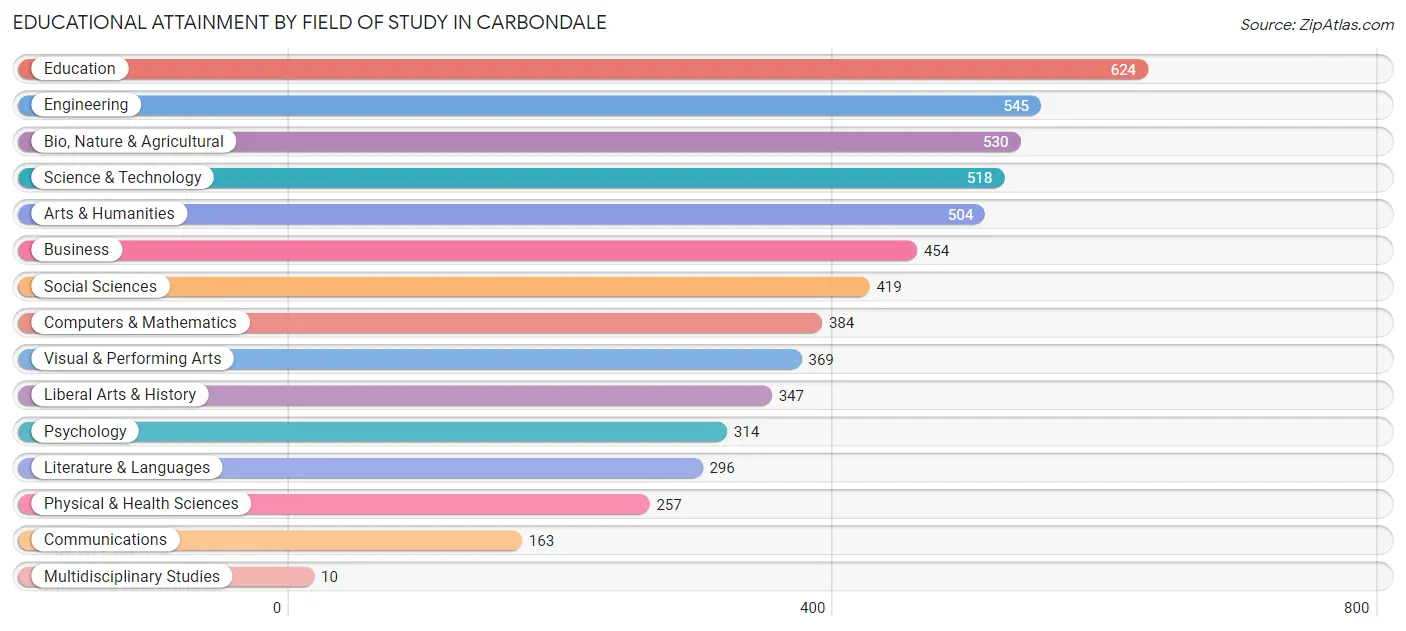
| Field of Study | # Graduates | % Graduates |
| Computers & Mathematics | 384 | 6.7% |
| Bio, Nature & Agricultural | 530 | 9.2% |
| Physical & Health Sciences | 257 | 4.5% |
| Psychology | 314 | 5.5% |
| Social Sciences | 419 | 7.3% |
| Engineering | 545 | 9.5% |
| Multidisciplinary Studies | 10 | 0.2% |
| Science & Technology | 518 | 9.0% |
| Business | 454 | 7.9% |
| Education | 624 | 10.9% |
| Literature & Languages | 296 | 5.2% |
| Liberal Arts & History | 347 | 6.0% |
| Visual & Performing Arts | 369 | 6.4% |
| Communications | 163 | 2.8% |
| Arts & Humanities | 504 | 8.8% |
| Total | 5,734 | 100.0% |
Transportation & Commute in Carbondale
Vehicle Availability by Sex in Carbondale
The most prevalent vehicle ownership categories in Carbondale are males with 1 vehicle (1,722, accounting for 35.6%) and females with 1 vehicle (1,703, making up 39.2%).
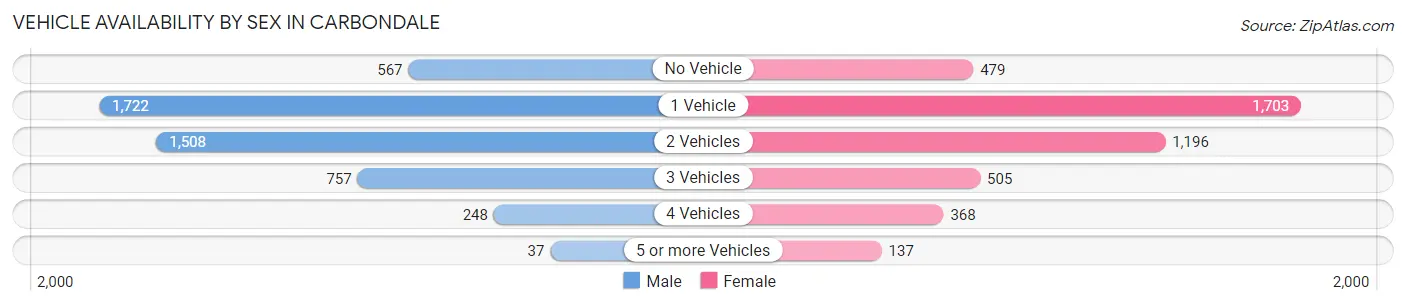
| Vehicles Available | Male | Female |
| No Vehicle | 567 (11.7%) | 479 (10.9%) |
| 1 Vehicle | 1,722 (35.6%) | 1,703 (38.8%) |
| 2 Vehicles | 1,508 (31.2%) | 1,196 (27.3%) |
| 3 Vehicles | 757 (15.6%) | 505 (11.5%) |
| 4 Vehicles | 248 (5.1%) | 368 (8.4%) |
| 5 or more Vehicles | 37 (0.8%) | 137 (3.1%) |
| Total | 4,839 (100.0%) | 4,388 (100.0%) |
Commute Time in Carbondale
The most frequently occuring commute durations in Carbondale are 5 to 9 minutes (2,434 commuters, 28.3%), 10 to 14 minutes (1,780 commuters, 20.7%), and 20 to 24 minutes (1,125 commuters, 13.1%).
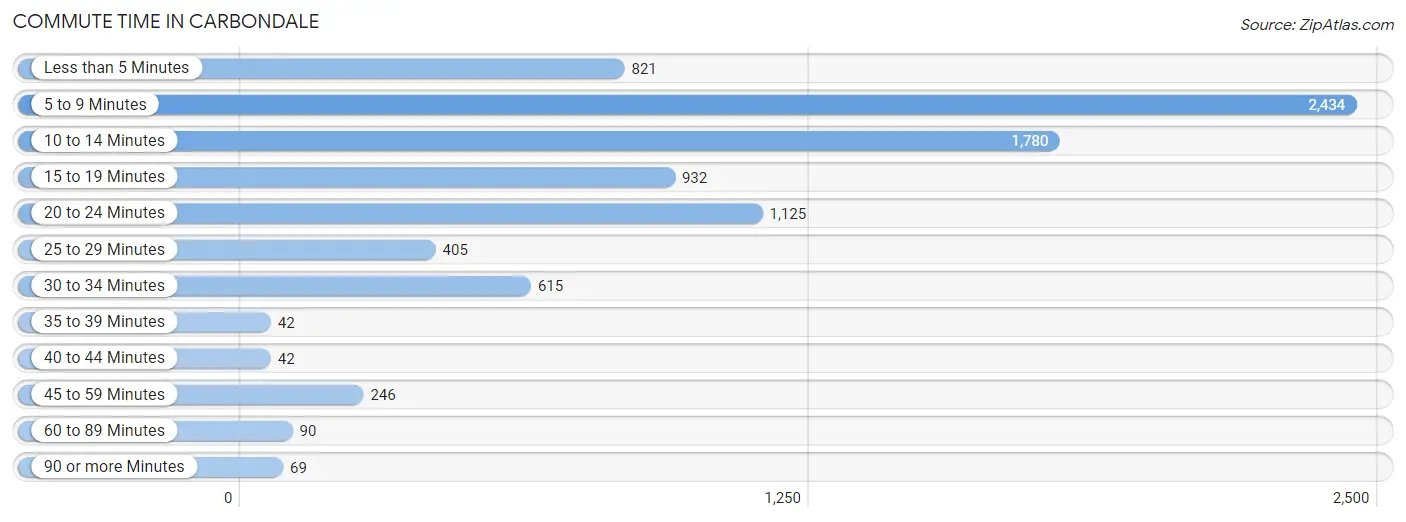
| Commute Time | # Commuters | % Commuters |
| Less than 5 Minutes | 821 | 9.6% |
| 5 to 9 Minutes | 2,434 | 28.3% |
| 10 to 14 Minutes | 1,780 | 20.7% |
| 15 to 19 Minutes | 932 | 10.8% |
| 20 to 24 Minutes | 1,125 | 13.1% |
| 25 to 29 Minutes | 405 | 4.7% |
| 30 to 34 Minutes | 615 | 7.1% |
| 35 to 39 Minutes | 42 | 0.5% |
| 40 to 44 Minutes | 42 | 0.5% |
| 45 to 59 Minutes | 246 | 2.9% |
| 60 to 89 Minutes | 90 | 1.1% |
| 90 or more Minutes | 69 | 0.8% |
Commute Time by Sex in Carbondale
The most common commute times in Carbondale are 5 to 9 minutes (1,297 commuters, 28.1%) for males and 5 to 9 minutes (1,137 commuters, 28.5%) for females.
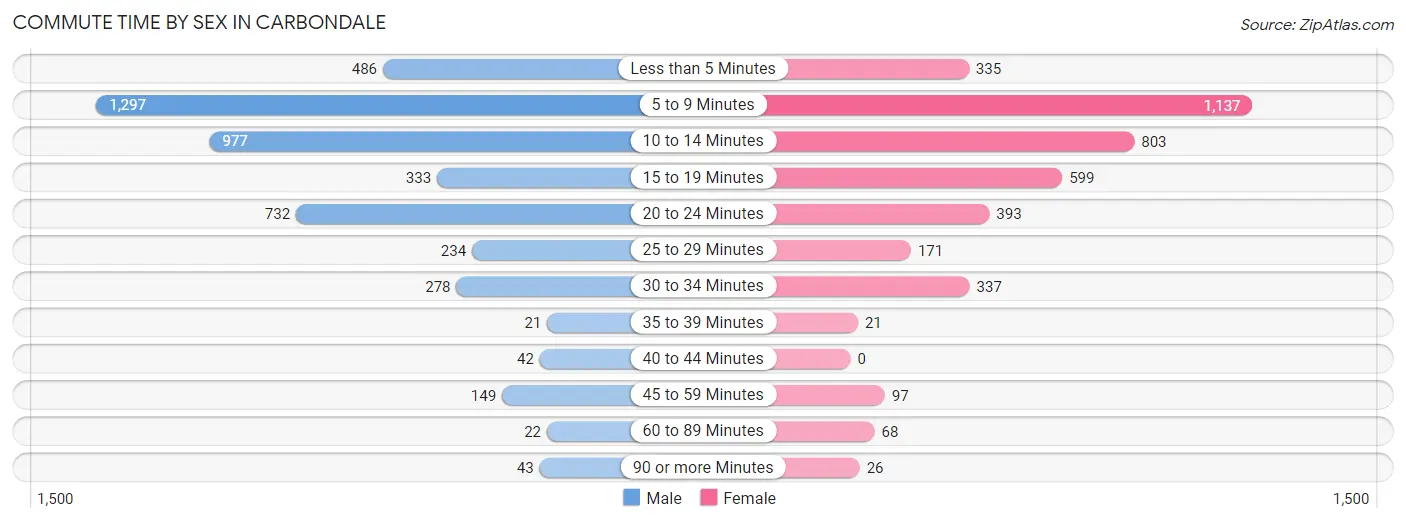
| Commute Time | Male | Female |
| Less than 5 Minutes | 486 (10.5%) | 335 (8.4%) |
| 5 to 9 Minutes | 1,297 (28.1%) | 1,137 (28.5%) |
| 10 to 14 Minutes | 977 (21.2%) | 803 (20.1%) |
| 15 to 19 Minutes | 333 (7.2%) | 599 (15.0%) |
| 20 to 24 Minutes | 732 (15.9%) | 393 (9.9%) |
| 25 to 29 Minutes | 234 (5.1%) | 171 (4.3%) |
| 30 to 34 Minutes | 278 (6.0%) | 337 (8.5%) |
| 35 to 39 Minutes | 21 (0.5%) | 21 (0.5%) |
| 40 to 44 Minutes | 42 (0.9%) | 0 (0.0%) |
| 45 to 59 Minutes | 149 (3.2%) | 97 (2.4%) |
| 60 to 89 Minutes | 22 (0.5%) | 68 (1.7%) |
| 90 or more Minutes | 43 (0.9%) | 26 (0.6%) |
Time of Departure to Work by Sex in Carbondale
The most frequent times of departure to work in Carbondale are 8:00 AM to 8:29 AM (744, 16.1%) for males and 7:30 AM to 7:59 AM (709, 17.8%) for females.
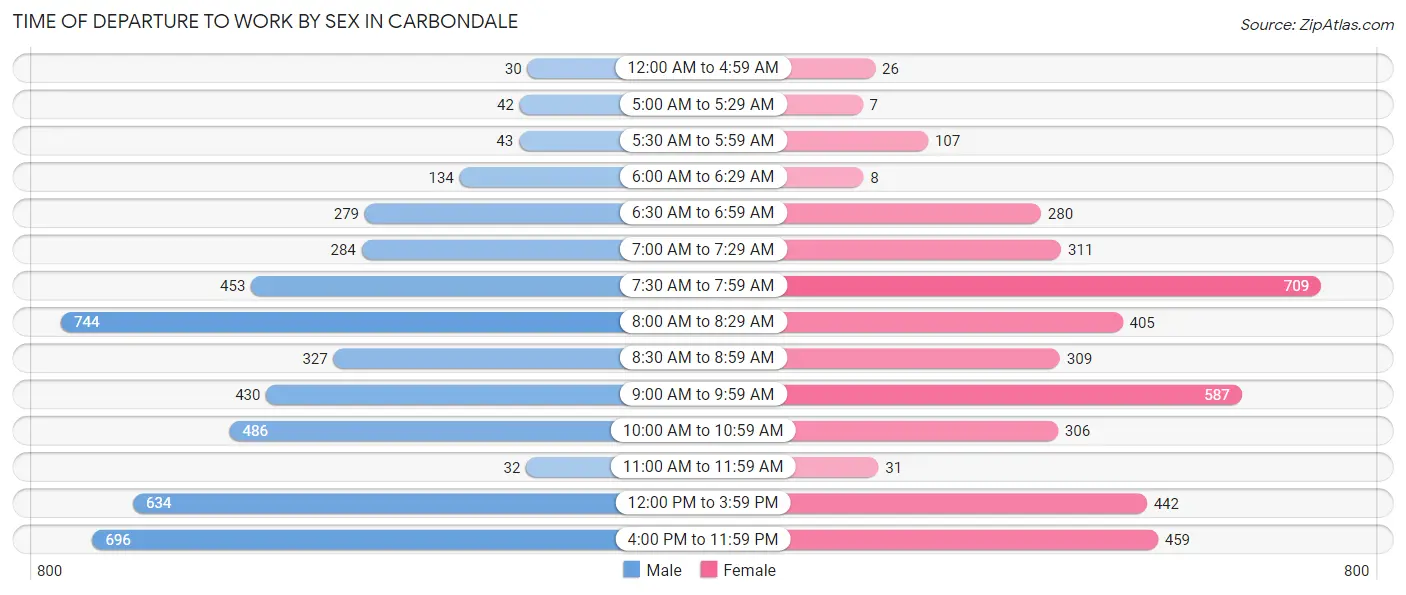
| Time of Departure | Male | Female |
| 12:00 AM to 4:59 AM | 30 (0.6%) | 26 (0.6%) |
| 5:00 AM to 5:29 AM | 42 (0.9%) | 7 (0.2%) |
| 5:30 AM to 5:59 AM | 43 (0.9%) | 107 (2.7%) |
| 6:00 AM to 6:29 AM | 134 (2.9%) | 8 (0.2%) |
| 6:30 AM to 6:59 AM | 279 (6.0%) | 280 (7.0%) |
| 7:00 AM to 7:29 AM | 284 (6.2%) | 311 (7.8%) |
| 7:30 AM to 7:59 AM | 453 (9.8%) | 709 (17.8%) |
| 8:00 AM to 8:29 AM | 744 (16.1%) | 405 (10.2%) |
| 8:30 AM to 8:59 AM | 327 (7.1%) | 309 (7.7%) |
| 9:00 AM to 9:59 AM | 430 (9.3%) | 587 (14.7%) |
| 10:00 AM to 10:59 AM | 486 (10.5%) | 306 (7.7%) |
| 11:00 AM to 11:59 AM | 32 (0.7%) | 31 (0.8%) |
| 12:00 PM to 3:59 PM | 634 (13.7%) | 442 (11.1%) |
| 4:00 PM to 11:59 PM | 696 (15.1%) | 459 (11.5%) |
| Total | 4,614 (100.0%) | 3,987 (100.0%) |
Housing Occupancy in Carbondale
Occupancy by Ownership in Carbondale
Of the total 9,974 dwellings in Carbondale, owner-occupied units account for 2,559 (25.7%), while renter-occupied units make up 7,415 (74.3%).
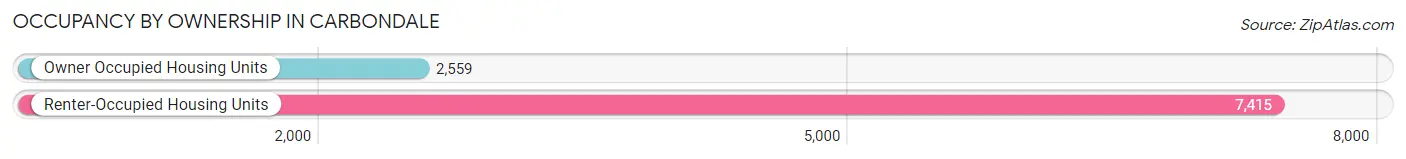
| Occupancy | # Housing Units | % Housing Units |
| Owner Occupied Housing Units | 2,559 | 25.7% |
| Renter-Occupied Housing Units | 7,415 | 74.3% |
| Total Occupied Housing Units | 9,974 | 100.0% |
Occupancy by Household Size in Carbondale
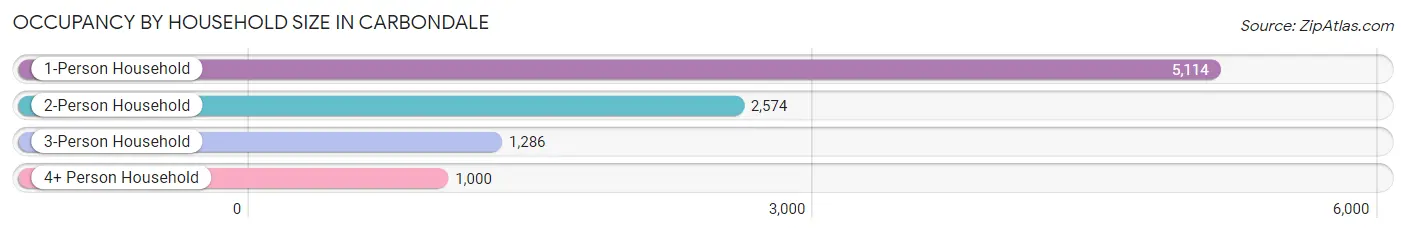
| Household Size | # Housing Units | % Housing Units |
| 1-Person Household | 5,114 | 51.3% |
| 2-Person Household | 2,574 | 25.8% |
| 3-Person Household | 1,286 | 12.9% |
| 4+ Person Household | 1,000 | 10.0% |
| Total Housing Units | 9,974 | 100.0% |
Occupancy by Ownership by Household Size in Carbondale
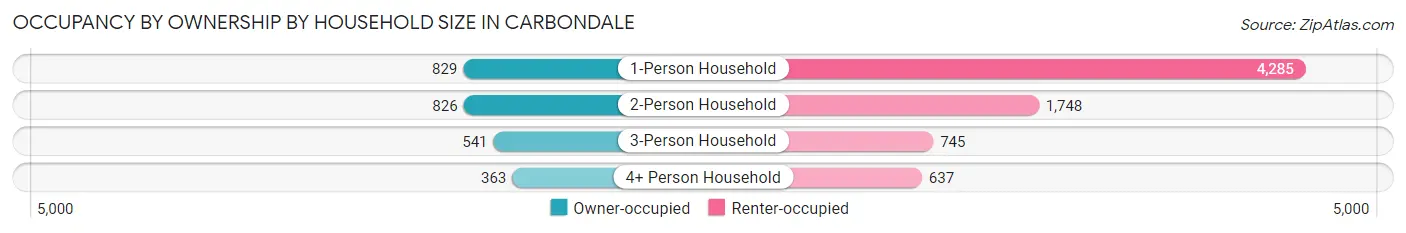
| Household Size | Owner-occupied | Renter-occupied |
| 1-Person Household | 829 (16.2%) | 4,285 (83.8%) |
| 2-Person Household | 826 (32.1%) | 1,748 (67.9%) |
| 3-Person Household | 541 (42.1%) | 745 (57.9%) |
| 4+ Person Household | 363 (36.3%) | 637 (63.7%) |
| Total Housing Units | 2,559 (25.7%) | 7,415 (74.3%) |
Occupancy by Educational Attainment in Carbondale
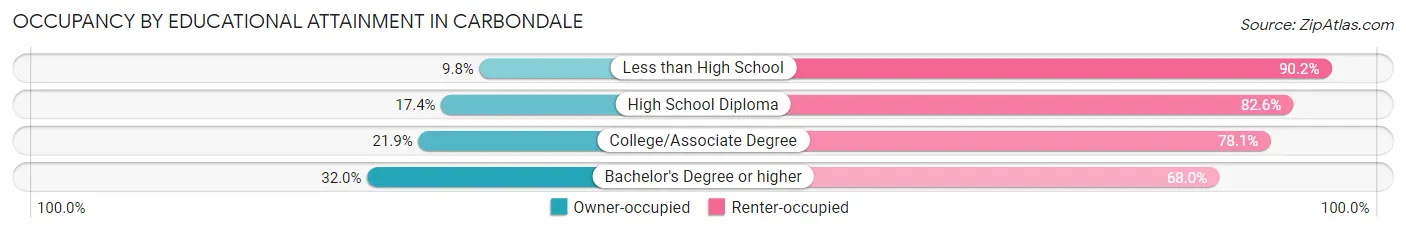
| Household Size | Owner-occupied | Renter-occupied |
| Less than High School | 40 (9.8%) | 369 (90.2%) |
| High School Diploma | 218 (17.4%) | 1,038 (82.6%) |
| College/Associate Degree | 779 (21.9%) | 2,779 (78.1%) |
| Bachelor's Degree or higher | 1,522 (32.0%) | 3,229 (68.0%) |
Occupancy by Age of Householder in Carbondale
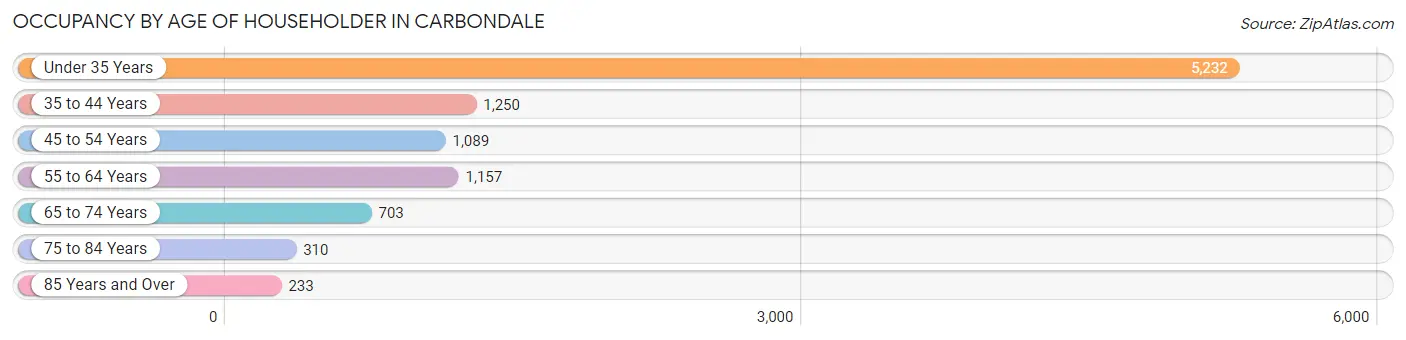
| Age Bracket | # Households | % Households |
| Under 35 Years | 5,232 | 52.5% |
| 35 to 44 Years | 1,250 | 12.5% |
| 45 to 54 Years | 1,089 | 10.9% |
| 55 to 64 Years | 1,157 | 11.6% |
| 65 to 74 Years | 703 | 7.0% |
| 75 to 84 Years | 310 | 3.1% |
| 85 Years and Over | 233 | 2.3% |
| Total | 9,974 | 100.0% |
Housing Finances in Carbondale
Median Income by Occupancy in Carbondale
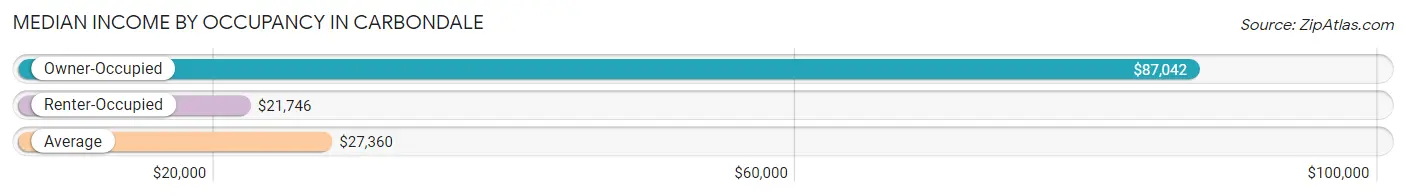
| Occupancy Type | # Households | Median Income |
| Owner-Occupied | 2,559 (25.7%) | $87,042 |
| Renter-Occupied | 7,415 (74.3%) | $21,746 |
| Average | 9,974 (100.0%) | $27,360 |
Occupancy by Householder Income Bracket in Carbondale
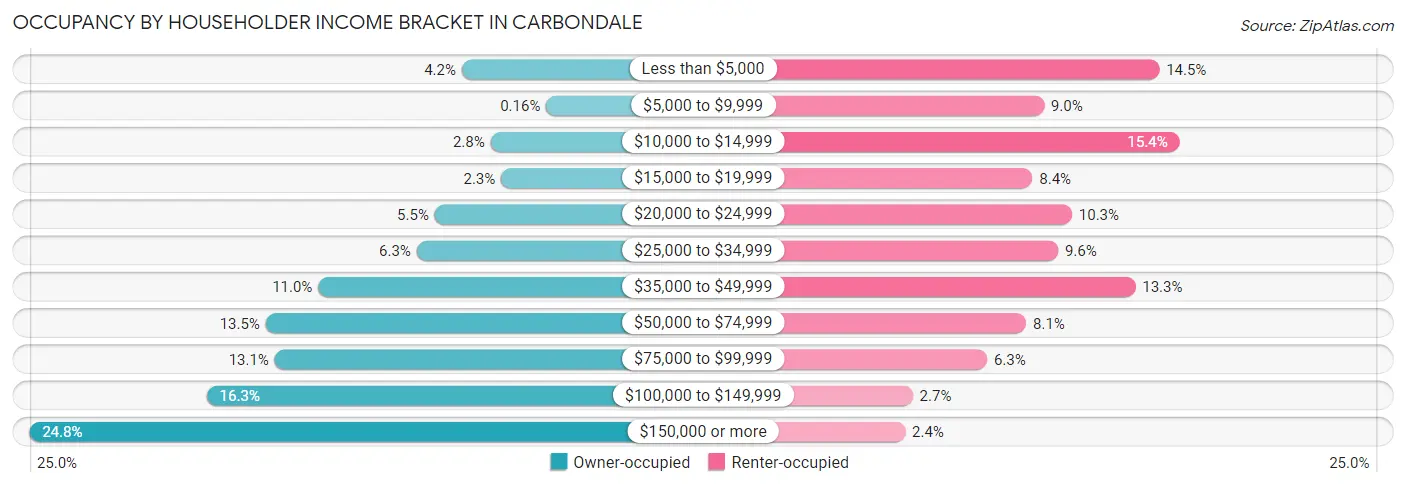
| Income Bracket | Owner-occupied | Renter-occupied |
| Less than $5,000 | 107 (4.2%) | 1,072 (14.5%) |
| $5,000 to $9,999 | 4 (0.2%) | 665 (9.0%) |
| $10,000 to $14,999 | 72 (2.8%) | 1,144 (15.4%) |
| $15,000 to $19,999 | 59 (2.3%) | 624 (8.4%) |
| $20,000 to $24,999 | 140 (5.5%) | 764 (10.3%) |
| $25,000 to $34,999 | 162 (6.3%) | 715 (9.6%) |
| $35,000 to $49,999 | 282 (11.0%) | 988 (13.3%) |
| $50,000 to $74,999 | 346 (13.5%) | 602 (8.1%) |
| $75,000 to $99,999 | 335 (13.1%) | 464 (6.3%) |
| $100,000 to $149,999 | 418 (16.3%) | 202 (2.7%) |
| $150,000 or more | 634 (24.8%) | 175 (2.4%) |
| Total | 2,559 (100.0%) | 7,415 (100.0%) |
Monthly Housing Cost Tiers in Carbondale
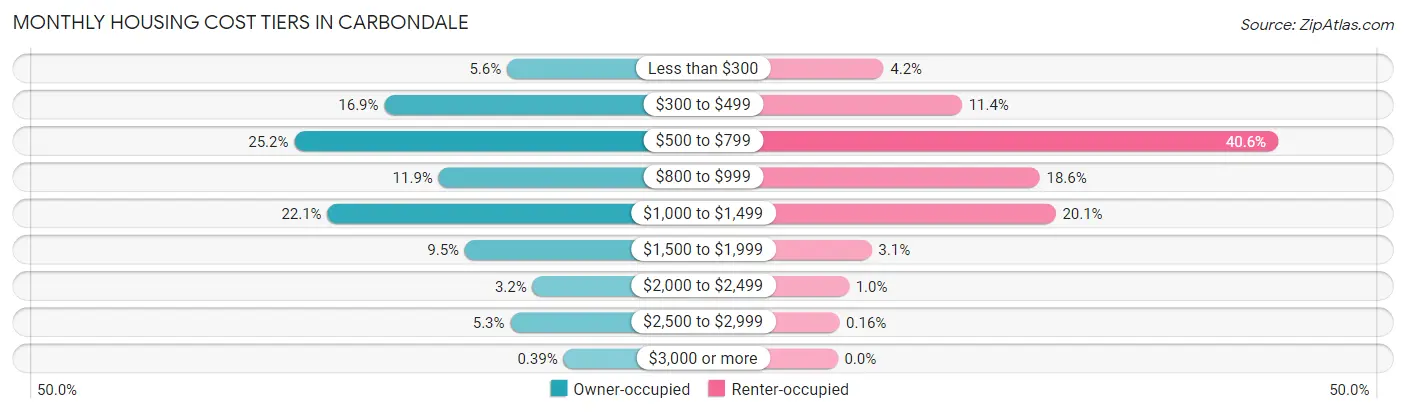
| Monthly Cost | Owner-occupied | Renter-occupied |
| Less than $300 | 143 (5.6%) | 314 (4.2%) |
| $300 to $499 | 432 (16.9%) | 848 (11.4%) |
| $500 to $799 | 644 (25.2%) | 3,007 (40.6%) |
| $800 to $999 | 304 (11.9%) | 1,380 (18.6%) |
| $1,000 to $1,499 | 566 (22.1%) | 1,488 (20.1%) |
| $1,500 to $1,999 | 242 (9.5%) | 232 (3.1%) |
| $2,000 to $2,499 | 83 (3.2%) | 77 (1.0%) |
| $2,500 to $2,999 | 135 (5.3%) | 12 (0.2%) |
| $3,000 or more | 10 (0.4%) | 0 (0.0%) |
| Total | 2,559 (100.0%) | 7,415 (100.0%) |
Physical Housing Characteristics in Carbondale
Housing Structures in Carbondale
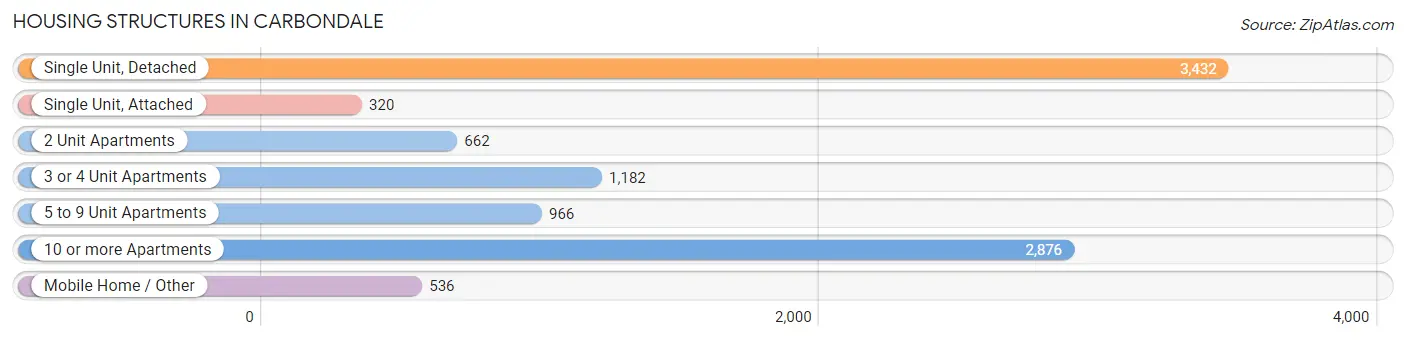
| Structure Type | # Housing Units | % Housing Units |
| Single Unit, Detached | 3,432 | 34.4% |
| Single Unit, Attached | 320 | 3.2% |
| 2 Unit Apartments | 662 | 6.6% |
| 3 or 4 Unit Apartments | 1,182 | 11.8% |
| 5 to 9 Unit Apartments | 966 | 9.7% |
| 10 or more Apartments | 2,876 | 28.8% |
| Mobile Home / Other | 536 | 5.4% |
| Total | 9,974 | 100.0% |
Housing Structures by Occupancy in Carbondale
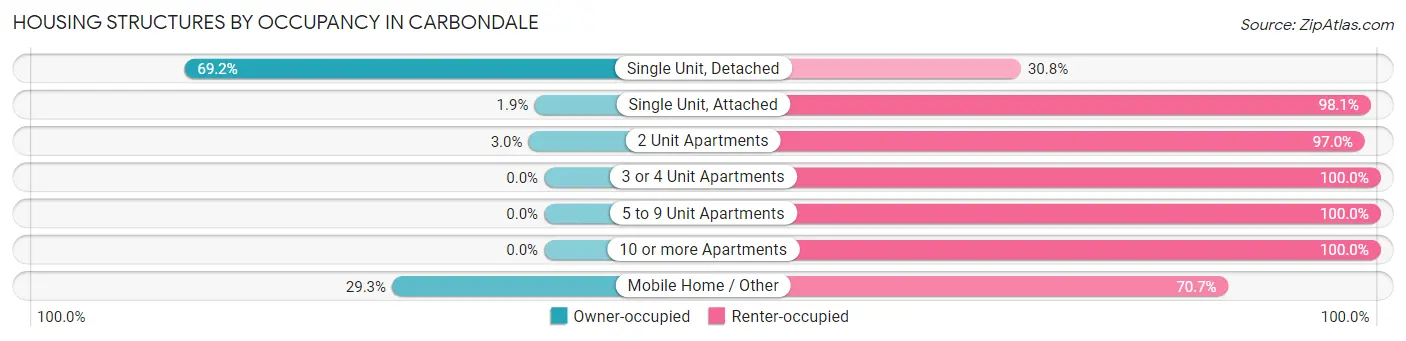
| Structure Type | Owner-occupied | Renter-occupied |
| Single Unit, Detached | 2,376 (69.2%) | 1,056 (30.8%) |
| Single Unit, Attached | 6 (1.9%) | 314 (98.1%) |
| 2 Unit Apartments | 20 (3.0%) | 642 (97.0%) |
| 3 or 4 Unit Apartments | 0 (0.0%) | 1,182 (100.0%) |
| 5 to 9 Unit Apartments | 0 (0.0%) | 966 (100.0%) |
| 10 or more Apartments | 0 (0.0%) | 2,876 (100.0%) |
| Mobile Home / Other | 157 (29.3%) | 379 (70.7%) |
| Total | 2,559 (25.7%) | 7,415 (74.3%) |
Housing Structures by Number of Rooms in Carbondale
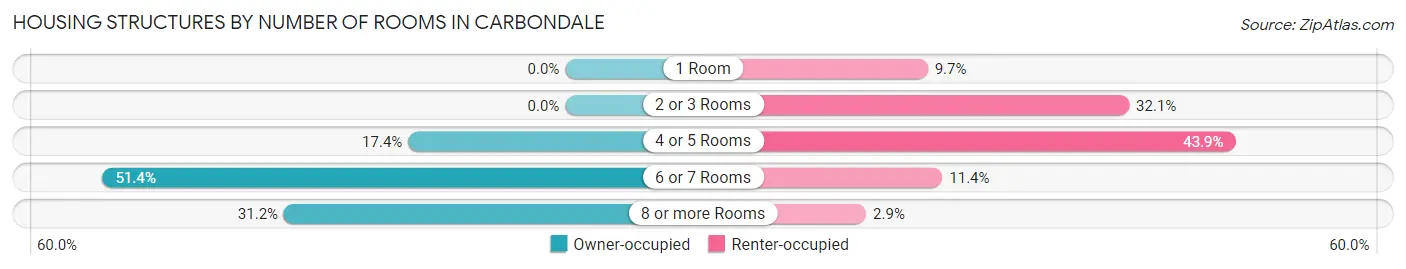
| Number of Rooms | Owner-occupied | Renter-occupied |
| 1 Room | 0 (0.0%) | 722 (9.7%) |
| 2 or 3 Rooms | 0 (0.0%) | 2,380 (32.1%) |
| 4 or 5 Rooms | 446 (17.4%) | 3,254 (43.9%) |
| 6 or 7 Rooms | 1,314 (51.3%) | 843 (11.4%) |
| 8 or more Rooms | 799 (31.2%) | 216 (2.9%) |
| Total | 2,559 (100.0%) | 7,415 (100.0%) |
Housing Structure by Heating Type in Carbondale
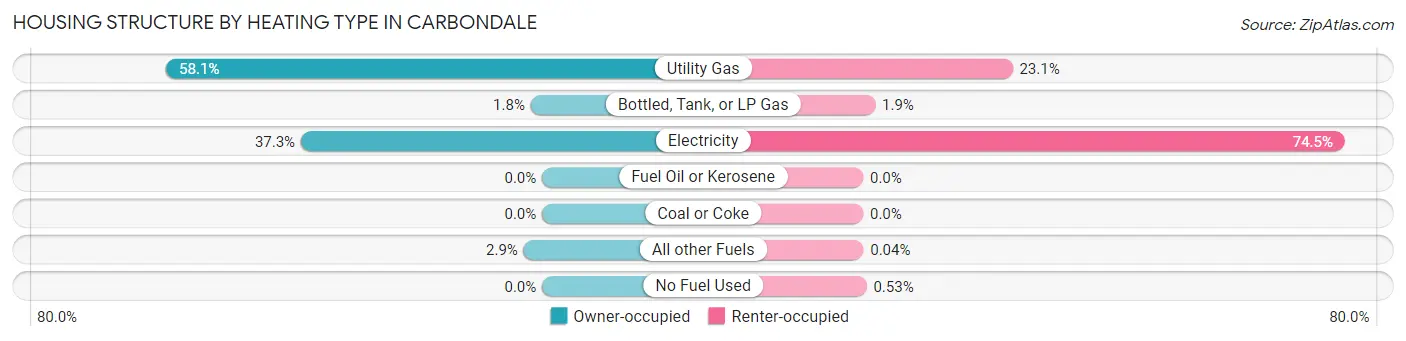
| Heating Type | Owner-occupied | Renter-occupied |
| Utility Gas | 1,487 (58.1%) | 1,713 (23.1%) |
| Bottled, Tank, or LP Gas | 45 (1.8%) | 138 (1.9%) |
| Electricity | 954 (37.3%) | 5,522 (74.5%) |
| Fuel Oil or Kerosene | 0 (0.0%) | 0 (0.0%) |
| Coal or Coke | 0 (0.0%) | 0 (0.0%) |
| All other Fuels | 73 (2.9%) | 3 (0.0%) |
| No Fuel Used | 0 (0.0%) | 39 (0.5%) |
| Total | 2,559 (100.0%) | 7,415 (100.0%) |
Household Vehicle Usage in Carbondale
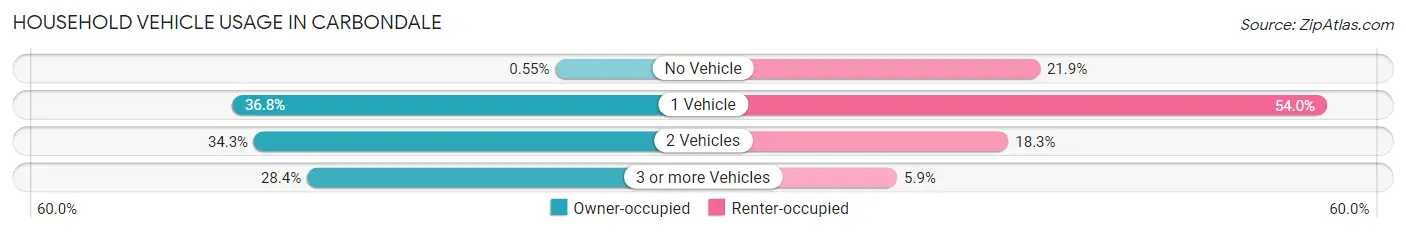
| Vehicles per Household | Owner-occupied | Renter-occupied |
| No Vehicle | 14 (0.5%) | 1,620 (21.8%) |
| 1 Vehicle | 941 (36.8%) | 4,003 (54.0%) |
| 2 Vehicles | 878 (34.3%) | 1,358 (18.3%) |
| 3 or more Vehicles | 726 (28.4%) | 434 (5.9%) |
| Total | 2,559 (100.0%) | 7,415 (100.0%) |
Real Estate & Mortgages in Carbondale
Real Estate and Mortgage Overview in Carbondale
| Characteristic | Without Mortgage | With Mortgage |
| Housing Units | 1,426 | 1,133 |
| Median Property Value | $109,500 | $135,800 |
| Median Household Income | $71,667 | $304 |
| Monthly Housing Costs | $585 | $10 |
| Real Estate Taxes | $2,448 | $24 |
Property Value by Mortgage Status in Carbondale
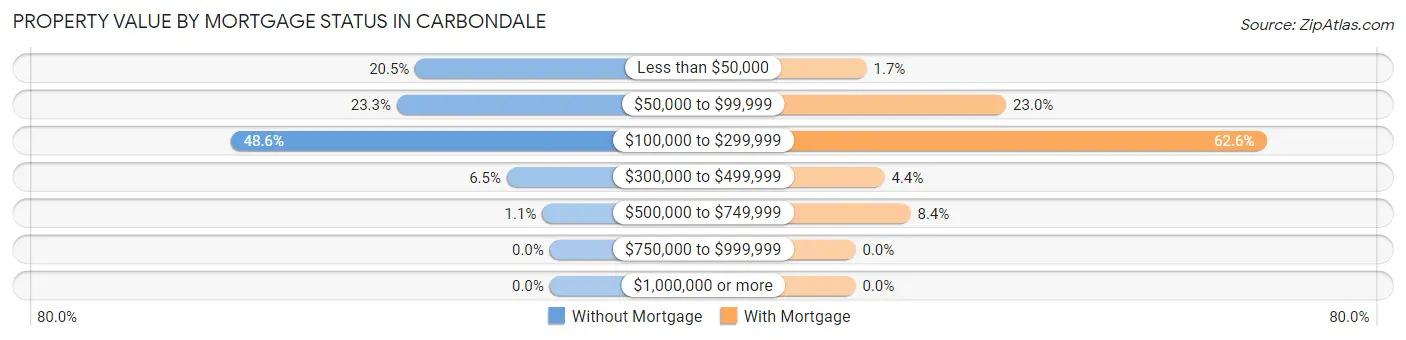
| Property Value | Without Mortgage | With Mortgage |
| Less than $50,000 | 292 (20.5%) | 19 (1.7%) |
| $50,000 to $99,999 | 332 (23.3%) | 260 (23.0%) |
| $100,000 to $299,999 | 693 (48.6%) | 709 (62.6%) |
| $300,000 to $499,999 | 93 (6.5%) | 50 (4.4%) |
| $500,000 to $749,999 | 16 (1.1%) | 95 (8.4%) |
| $750,000 to $999,999 | 0 (0.0%) | 0 (0.0%) |
| $1,000,000 or more | 0 (0.0%) | 0 (0.0%) |
| Total | 1,426 (100.0%) | 1,133 (100.0%) |
Household Income by Mortgage Status in Carbondale
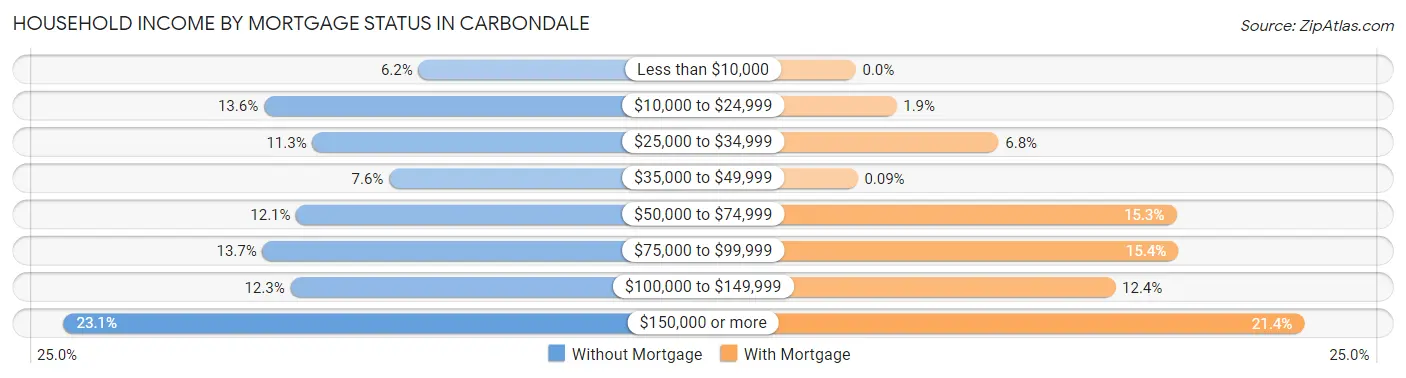
| Household Income | Without Mortgage | With Mortgage |
| Less than $10,000 | 89 (6.2%) | 0 (0.0%) |
| $10,000 to $24,999 | 194 (13.6%) | 22 (1.9%) |
| $25,000 to $34,999 | 161 (11.3%) | 77 (6.8%) |
| $35,000 to $49,999 | 109 (7.6%) | 1 (0.1%) |
| $50,000 to $74,999 | 172 (12.1%) | 173 (15.3%) |
| $75,000 to $99,999 | 195 (13.7%) | 174 (15.4%) |
| $100,000 to $149,999 | 176 (12.3%) | 140 (12.4%) |
| $150,000 or more | 330 (23.1%) | 242 (21.4%) |
| Total | 1,426 (100.0%) | 1,133 (100.0%) |
Property Value to Household Income Ratio in Carbondale
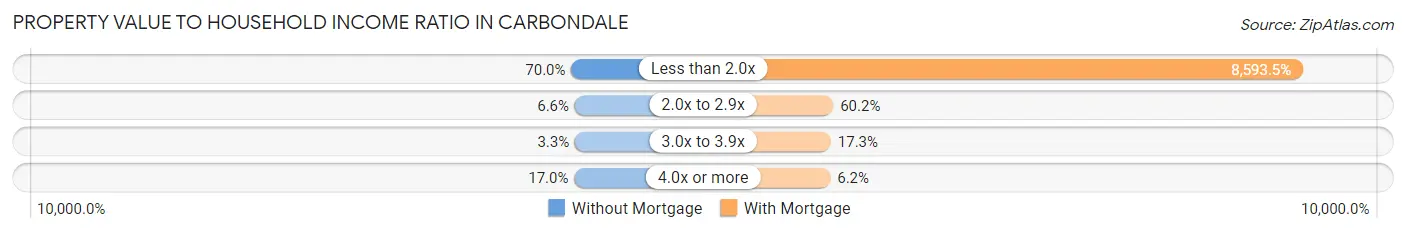
| Value-to-Income Ratio | Without Mortgage | With Mortgage |
| Less than 2.0x | 998 (70.0%) | 97,364 (8,593.5%) |
| 2.0x to 2.9x | 94 (6.6%) | 682 (60.2%) |
| 3.0x to 3.9x | 47 (3.3%) | 196 (17.3%) |
| 4.0x or more | 243 (17.0%) | 70 (6.2%) |
| Total | 1,426 (100.0%) | 1,133 (100.0%) |
Real Estate Taxes by Mortgage Status in Carbondale
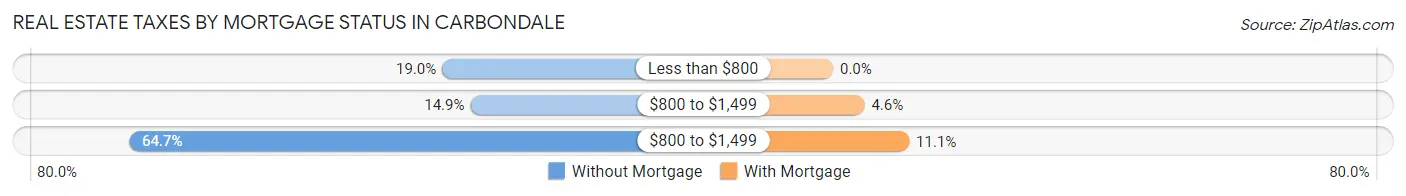
| Property Taxes | Without Mortgage | With Mortgage |
| Less than $800 | 271 (19.0%) | 0 (0.0%) |
| $800 to $1,499 | 212 (14.9%) | 52 (4.6%) |
| $800 to $1,499 | 923 (64.7%) | 126 (11.1%) |
| Total | 1,426 (100.0%) | 1,133 (100.0%) |
Health & Disability in Carbondale
Health Insurance Coverage by Age in Carbondale
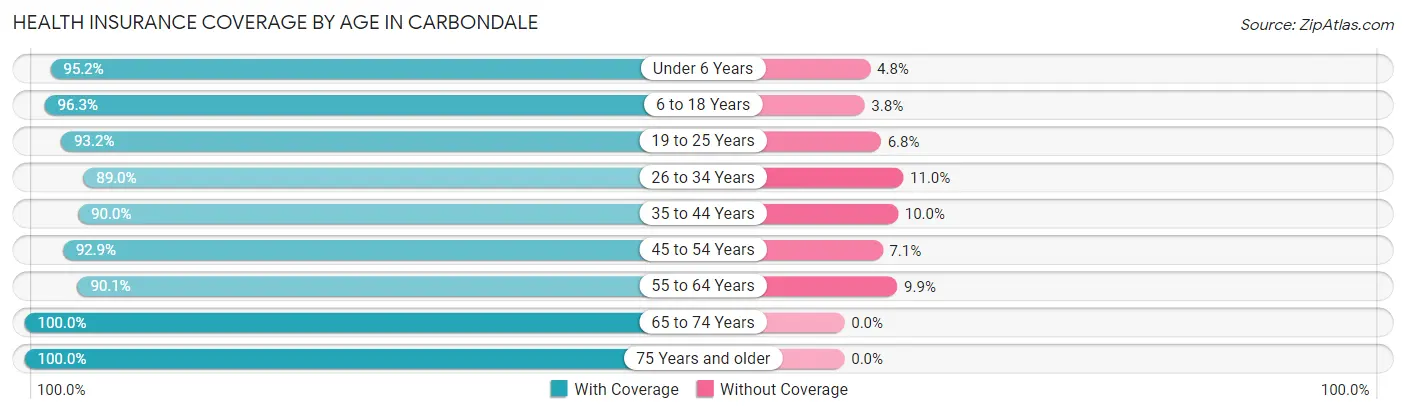
| Age Bracket | With Coverage | Without Coverage |
| Under 6 Years | 811 (95.2%) | 41 (4.8%) |
| 6 to 18 Years | 2,773 (96.3%) | 108 (3.7%) |
| 19 to 25 Years | 7,657 (93.2%) | 558 (6.8%) |
| 26 to 34 Years | 2,491 (89.0%) | 307 (11.0%) |
| 35 to 44 Years | 1,677 (90.0%) | 186 (10.0%) |
| 45 to 54 Years | 1,384 (92.9%) | 106 (7.1%) |
| 55 to 64 Years | 1,573 (90.1%) | 172 (9.9%) |
| 65 to 74 Years | 1,082 (100.0%) | 0 (0.0%) |
| 75 Years and older | 798 (100.0%) | 0 (0.0%) |
| Total | 20,246 (93.2%) | 1,478 (6.8%) |
Health Insurance Coverage by Citizenship Status in Carbondale
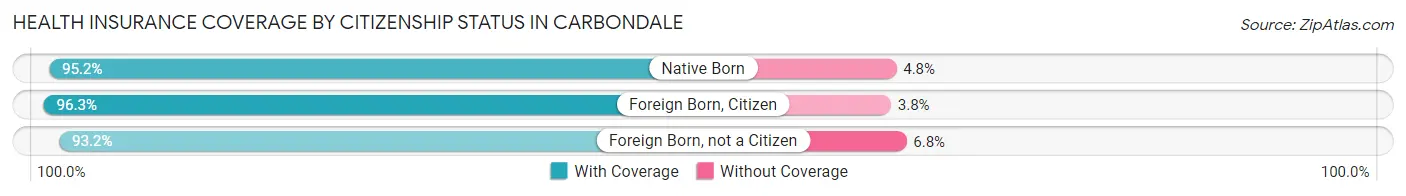
| Citizenship Status | With Coverage | Without Coverage |
| Native Born | 811 (95.2%) | 41 (4.8%) |
| Foreign Born, Citizen | 2,773 (96.3%) | 108 (3.7%) |
| Foreign Born, not a Citizen | 7,657 (93.2%) | 558 (6.8%) |
Health Insurance Coverage by Household Income in Carbondale
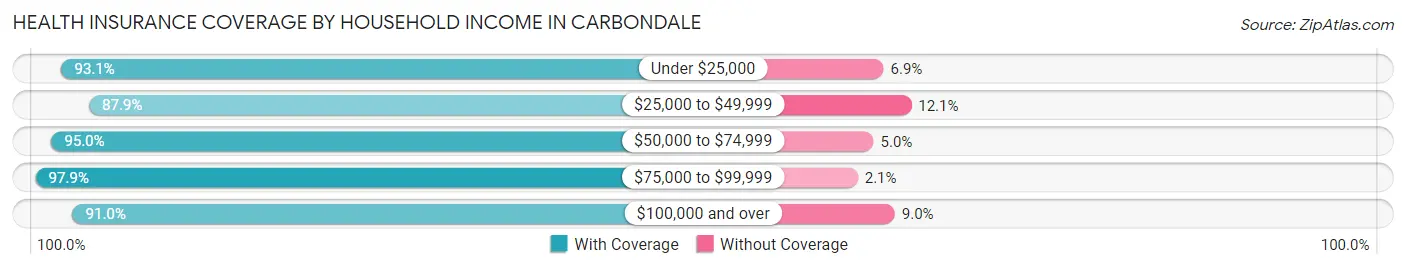
| Household Income | With Coverage | Without Coverage |
| Under $25,000 | 6,784 (93.1%) | 503 (6.9%) |
| $25,000 to $49,999 | 3,615 (87.9%) | 497 (12.1%) |
| $50,000 to $74,999 | 1,683 (95.0%) | 89 (5.0%) |
| $75,000 to $99,999 | 1,805 (97.9%) | 38 (2.1%) |
| $100,000 and over | 3,497 (91.0%) | 346 (9.0%) |
Public vs Private Health Insurance Coverage by Age in Carbondale
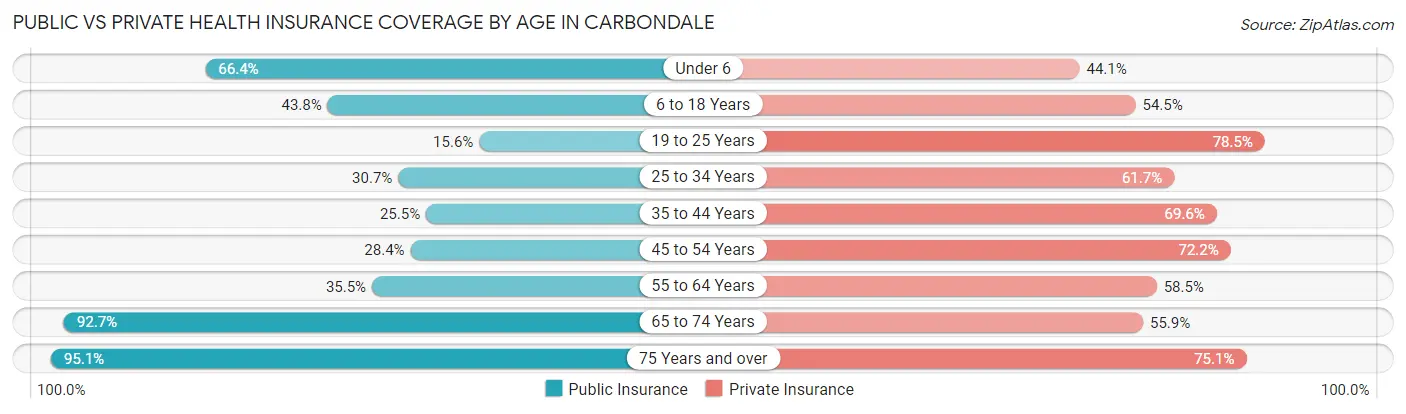
| Age Bracket | Public Insurance | Private Insurance |
| Under 6 | 566 (66.4%) | 376 (44.1%) |
| 6 to 18 Years | 1,261 (43.8%) | 1,571 (54.5%) |
| 19 to 25 Years | 1,284 (15.6%) | 6,449 (78.5%) |
| 25 to 34 Years | 858 (30.7%) | 1,725 (61.7%) |
| 35 to 44 Years | 475 (25.5%) | 1,296 (69.6%) |
| 45 to 54 Years | 423 (28.4%) | 1,075 (72.2%) |
| 55 to 64 Years | 620 (35.5%) | 1,020 (58.5%) |
| 65 to 74 Years | 1,003 (92.7%) | 605 (55.9%) |
| 75 Years and over | 759 (95.1%) | 599 (75.1%) |
| Total | 7,249 (33.4%) | 14,716 (67.7%) |
Disability Status by Sex by Age in Carbondale
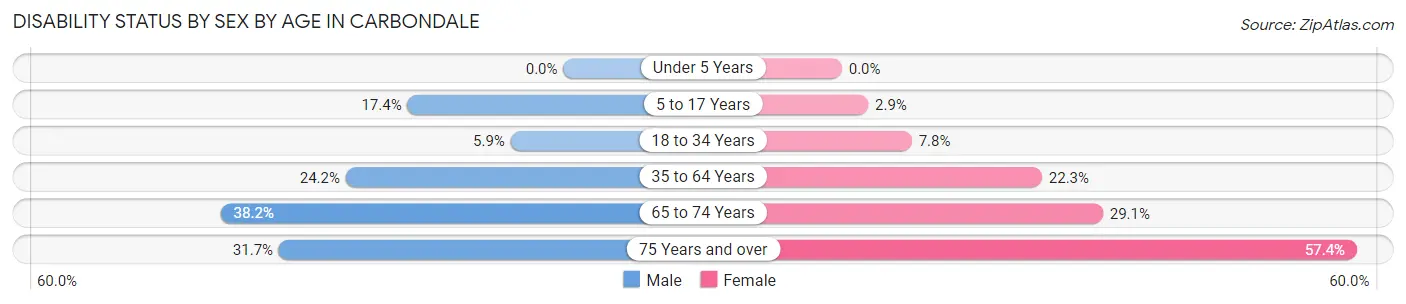
| Age Bracket | Male | Female |
| Under 5 Years | 0 (0.0%) | 0 (0.0%) |
| 5 to 17 Years | 200 (17.4%) | 26 (2.9%) |
| 18 to 34 Years | 390 (5.9%) | 425 (7.8%) |
| 35 to 64 Years | 573 (24.2%) | 609 (22.3%) |
| 65 to 74 Years | 174 (38.2%) | 182 (29.1%) |
| 75 Years and over | 96 (31.7%) | 284 (57.4%) |
Disability Class by Sex by Age in Carbondale
Disability Class: Hearing Difficulty
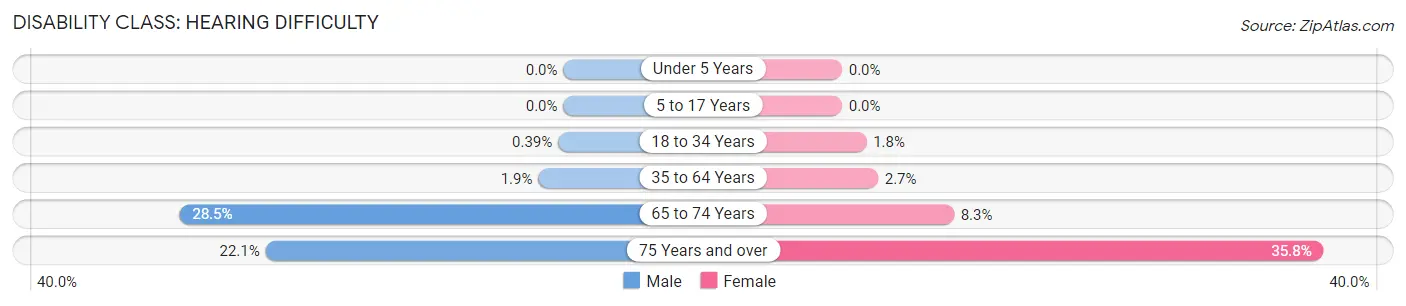
| Age Bracket | Male | Female |
| Under 5 Years | 0 (0.0%) | 0 (0.0%) |
| 5 to 17 Years | 0 (0.0%) | 0 (0.0%) |
| 18 to 34 Years | 26 (0.4%) | 99 (1.8%) |
| 35 to 64 Years | 44 (1.9%) | 73 (2.7%) |
| 65 to 74 Years | 130 (28.5%) | 52 (8.3%) |
| 75 Years and over | 67 (22.1%) | 177 (35.8%) |
Disability Class: Vision Difficulty
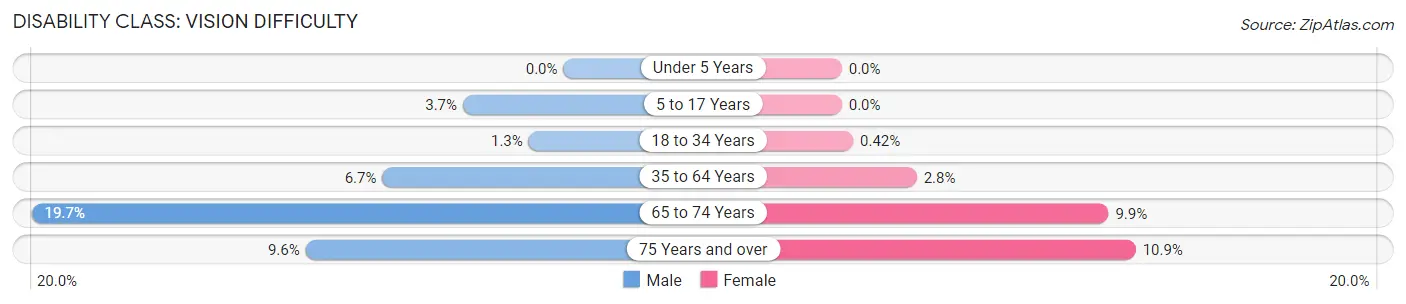
| Age Bracket | Male | Female |
| Under 5 Years | 0 (0.0%) | 0 (0.0%) |
| 5 to 17 Years | 43 (3.7%) | 0 (0.0%) |
| 18 to 34 Years | 86 (1.3%) | 23 (0.4%) |
| 35 to 64 Years | 159 (6.7%) | 76 (2.8%) |
| 65 to 74 Years | 90 (19.7%) | 62 (9.9%) |
| 75 Years and over | 29 (9.6%) | 54 (10.9%) |
Disability Class: Cognitive Difficulty
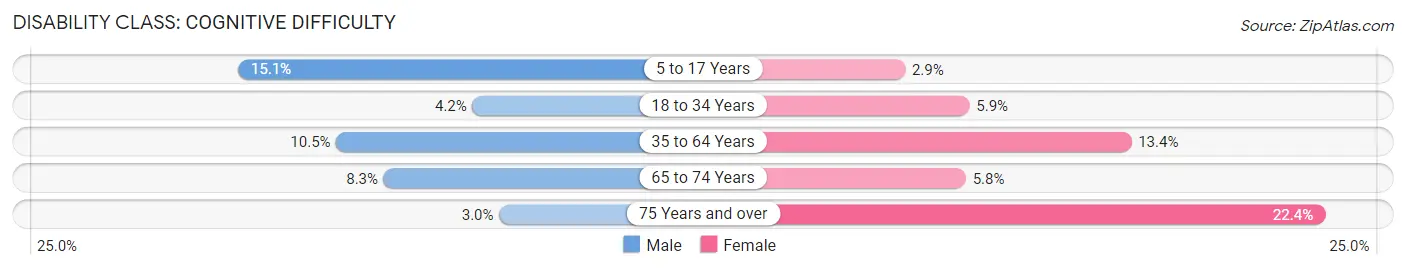
| Age Bracket | Male | Female |
| 5 to 17 Years | 174 (15.1%) | 26 (2.9%) |
| 18 to 34 Years | 280 (4.2%) | 323 (5.9%) |
| 35 to 64 Years | 249 (10.5%) | 367 (13.4%) |
| 65 to 74 Years | 38 (8.3%) | 36 (5.8%) |
| 75 Years and over | 9 (3.0%) | 111 (22.4%) |
Disability Class: Ambulatory Difficulty
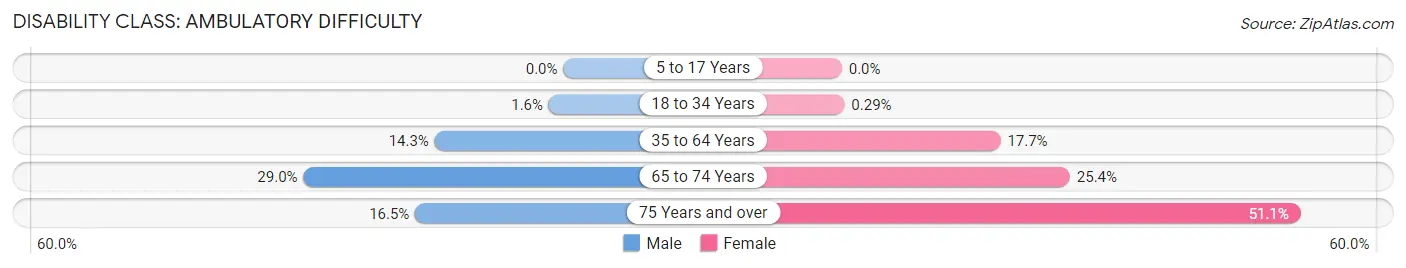
| Age Bracket | Male | Female |
| 5 to 17 Years | 0 (0.0%) | 0 (0.0%) |
| 18 to 34 Years | 107 (1.6%) | 16 (0.3%) |
| 35 to 64 Years | 339 (14.3%) | 483 (17.7%) |
| 65 to 74 Years | 132 (28.9%) | 159 (25.4%) |
| 75 Years and over | 50 (16.5%) | 253 (51.1%) |
Disability Class: Self-Care Difficulty
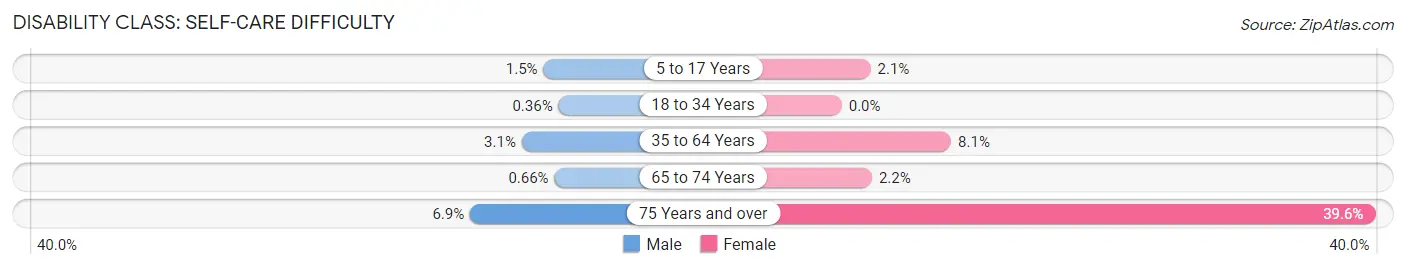
| Age Bracket | Male | Female |
| 5 to 17 Years | 17 (1.5%) | 19 (2.1%) |
| 18 to 34 Years | 24 (0.4%) | 0 (0.0%) |
| 35 to 64 Years | 73 (3.1%) | 222 (8.1%) |
| 65 to 74 Years | 3 (0.7%) | 14 (2.2%) |
| 75 Years and over | 21 (6.9%) | 196 (39.6%) |
Technology Access in Carbondale
Computing Device Access in Carbondale
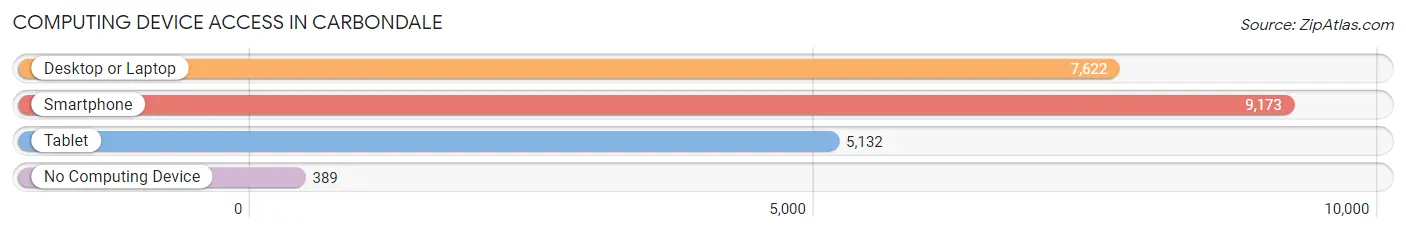
| Device Type | # Households | % Households |
| Desktop or Laptop | 7,622 | 76.4% |
| Smartphone | 9,173 | 92.0% |
| Tablet | 5,132 | 51.4% |
| No Computing Device | 389 | 3.9% |
| Total | 9,974 | 100.0% |
Internet Access in Carbondale
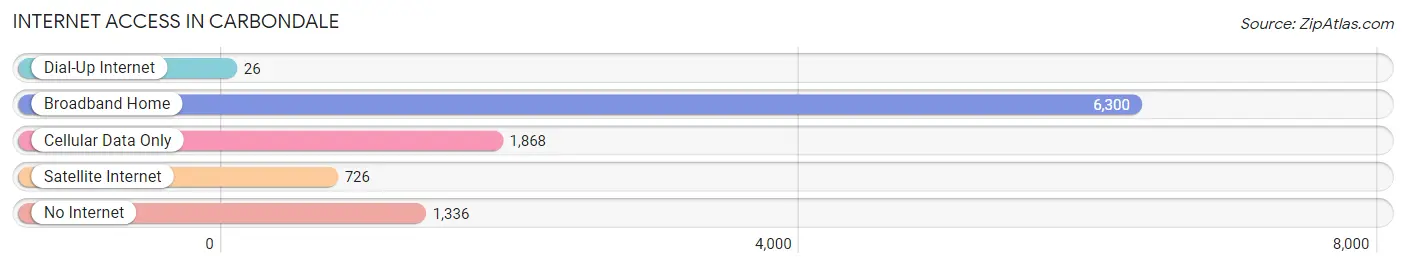
| Internet Type | # Households | % Households |
| Dial-Up Internet | 26 | 0.3% |
| Broadband Home | 6,300 | 63.2% |
| Cellular Data Only | 1,868 | 18.7% |
| Satellite Internet | 726 | 7.3% |
| No Internet | 1,336 | 13.4% |
| Total | 9,974 | 100.0% |
Carbondale Summary
Carbondale, Illinois is a city located in Jackson County, in the southern part of the state. It is the county seat and the largest city in the county. The city is situated in the Shawnee National Forest and is home to Southern Illinois University. The city has a population of 25,902 as of the 2020 census.
History
Carbondale was founded in 1852 by Daniel Harmon Brush, a settler from Ohio. He named the city after the coal deposits found in the area. The city was incorporated in 1855 and was the first city in Jackson County.
In the late 19th century, Carbondale was a major coal mining center. The city was also a major railroad hub, with the Illinois Central Railroad running through the city. The city was also home to a number of manufacturing plants, including a glass factory and a brickyard.
In the early 20th century, Carbondale was a major agricultural center. The city was home to a number of large farms, and the area was known for its production of corn, wheat, and other crops.
In the 1950s, Carbondale began to experience a period of growth and development. The city was home to a number of new businesses, including a shopping mall and a number of new restaurants. The city was also home to a number of new industries, including a paper mill and a steel mill.
In the late 20th century, Carbondale experienced a period of decline. The city's economy was hit hard by the decline of the coal industry and the closure of the steel mill. The city's population also declined, as many people moved away in search of better job opportunities.
Geography
Carbondale is located in the southern part of Illinois, in Jackson County. The city is situated in the Shawnee National Forest and is surrounded by rolling hills and forests. The city is located at the intersection of Interstate 57 and U.S. Route 51.
The city has a total area of 11.3 square miles, of which 11.2 square miles is land and 0.1 square miles is water. The city is located at an elevation of 590 feet above sea level.
Economy
Carbondale's economy is largely based on education and healthcare. The city is home to Southern Illinois University, which is the largest employer in the city. The university employs over 5,000 people and has an annual economic impact of over $1 billion.
The city is also home to a number of healthcare facilities, including Memorial Hospital of Carbondale and the Carbondale Clinic. The city is also home to a number of manufacturing companies, including a paper mill and a steel mill.
Demographics
As of the 2020 census, Carbondale had a population of 25,902. The city has a median age of 24.7 years, with 22.3% of the population under the age of 18 and 14.2% over the age of 65. The city is majority white, with 66.2% of the population identifying as white. The city is also home to a large Hispanic population, with 18.3% of the population identifying as Hispanic or Latino.
The median household income in Carbondale is $37,945, and the median home value is $117,400. The city has a poverty rate of 22.3%, with 25.2% of children under the age of 18 living in poverty.
Common Questions
What is Per Capita Income in Carbondale?
Per Capita income in Carbondale is $24,038.
What is the Median Family Income in Carbondale?
Median Family Income in Carbondale is $65,727.
What is the Median Household income in Carbondale?
Median Household Income in Carbondale is $27,360.
What is Income or Wage Gap in Carbondale?
Income or Wage Gap in Carbondale is 10.7%.
Women in Carbondale earn 89.3 cents for every dollar earned by a man.
What is Family Income Deficit in Carbondale?
Family Income Deficit in Carbondale is $15,313.
Families that are below poverty line in Carbondale earn $15,313 less on average than the poverty threshold level.
What is Inequality or Gini Index in Carbondale?
Inequality or Gini Index in Carbondale is 0.57.
What is the Total Population of Carbondale?
Total Population of Carbondale is 22,039.
What is the Total Male Population of Carbondale?
Total Male Population of Carbondale is 11,396.
What is the Total Female Population of Carbondale?
Total Female Population of Carbondale is 10,643.
What is the Ratio of Males per 100 Females in Carbondale?
There are 107.08 Males per 100 Females in Carbondale.
What is the Ratio of Females per 100 Males in Carbondale?
There are 93.39 Females per 100 Males in Carbondale.
What is the Median Population Age in Carbondale?
Median Population Age in Carbondale is 24.8 Years.
What is the Average Family Size in Carbondale
Average Family Size in Carbondale is 2.9 People.
What is the Average Household Size in Carbondale
Average Household Size in Carbondale is 1.9 People.
How Large is the Labor Force in Carbondale?
There are 11,073 People in the Labor Forcein in Carbondale.
What is the Percentage of People in the Labor Force in Carbondale?
56.2% of People are in the Labor Force in Carbondale.
What is the Unemployment Rate in Carbondale?
Unemployment Rate in Carbondale is 9.6%.