Zip Codes with the Highest Percentage of Population Employed in Life, Physical & Social Science in Rockford, IL
RELATED REPORTS & OPTIONS
Life, Physical & Social Science
Rockford
Compare Zip Codes
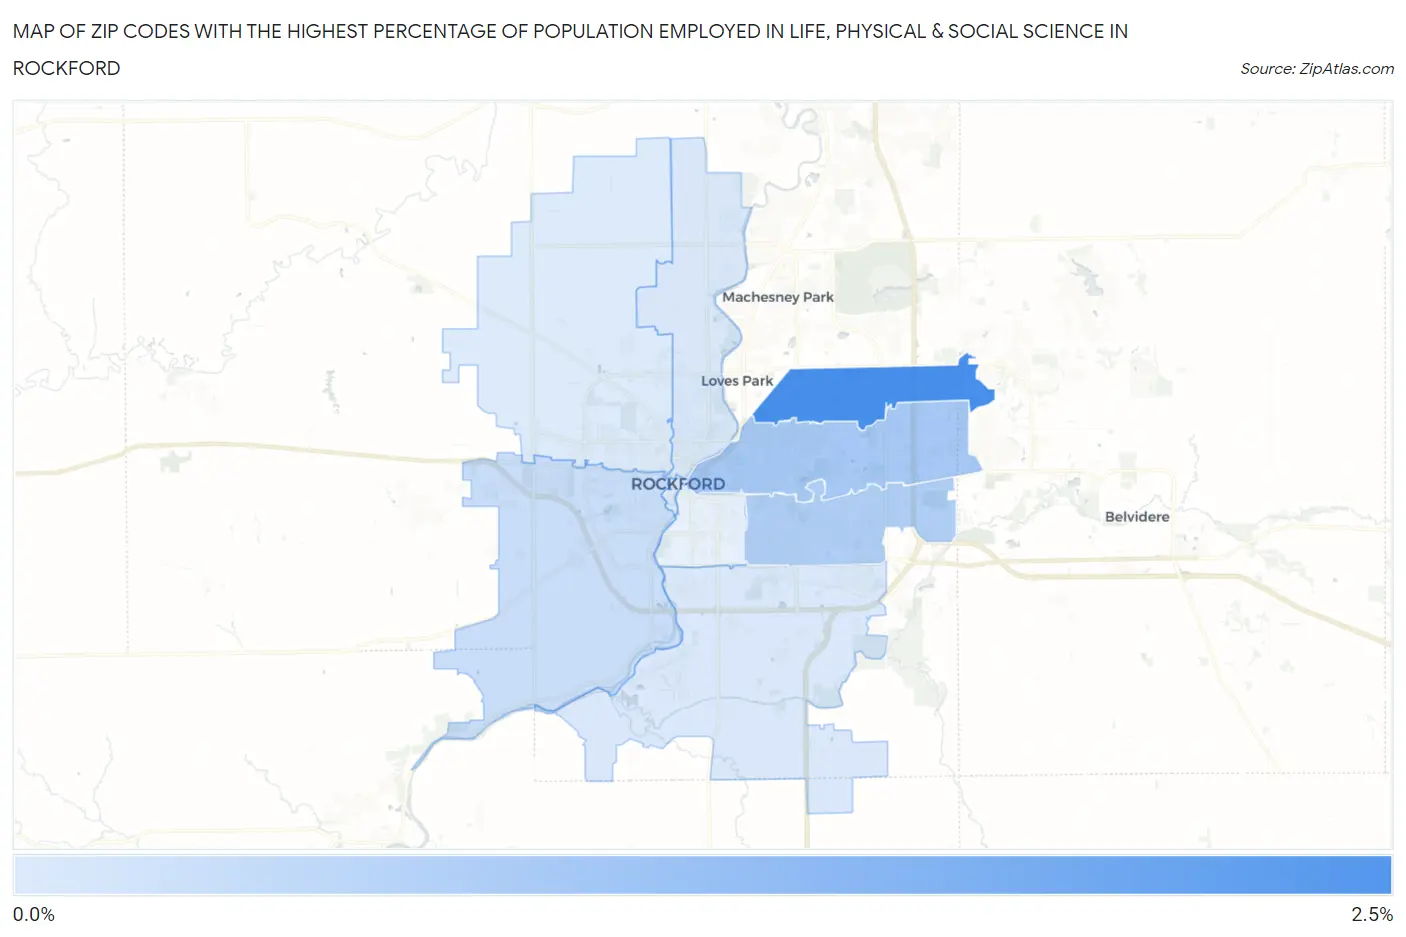
Map of Zip Codes with the Highest Percentage of Population Employed in Life, Physical & Social Science in Rockford
0.11%
2.3%
Zip Codes with the Highest Percentage of Population Employed in Life, Physical & Social Science in Rockford, IL
| Zip Code | % Employed | vs State | vs National | |
| 1. | 61114 | 2.3% | 0.98%(+1.31)#83 | 1.1%(+1.20)#2,982 |
| 2. | 61107 | 0.90% | 0.98%(-0.082)#381 | 1.1%(-0.194)#10,004 |
| 3. | 61108 | 0.78% | 0.98%(-0.199)#425 | 1.1%(-0.311)#11,183 |
| 4. | 61102 | 0.41% | 0.98%(-0.569)#629 | 1.1%(-0.681)#15,618 |
| 5. | 61103 | 0.19% | 0.98%(-0.785)#763 | 1.1%(-0.898)#18,269 |
| 6. | 61109 | 0.15% | 0.98%(-0.828)#776 | 1.1%(-0.940)#18,682 |
| 7. | 61101 | 0.11% | 0.98%(-0.866)#786 | 1.1%(-0.978)#18,990 |
1
Common Questions
What are the Top 5 Zip Codes with the Highest Percentage of Population Employed in Life, Physical & Social Science in Rockford, IL?
Top 5 Zip Codes with the Highest Percentage of Population Employed in Life, Physical & Social Science in Rockford, IL are:
What zip code has the Highest Percentage of Population Employed in Life, Physical & Social Science in Rockford, IL?
61114 has the Highest Percentage of Population Employed in Life, Physical & Social Science in Rockford, IL with 2.3%.
What is the Percentage of Population Employed in Life, Physical & Social Science in Rockford, IL?
Percentage of Population Employed in Life, Physical & Social Science in Rockford is 0.63%.
What is the Percentage of Population Employed in Life, Physical & Social Science in Illinois?
Percentage of Population Employed in Life, Physical & Social Science in Illinois is 0.98%.
What is the Percentage of Population Employed in Life, Physical & Social Science in the United States?
Percentage of Population Employed in Life, Physical & Social Science in the United States is 1.1%.