East Brooklyn, IL Map & Demographics
East Brooklyn Map
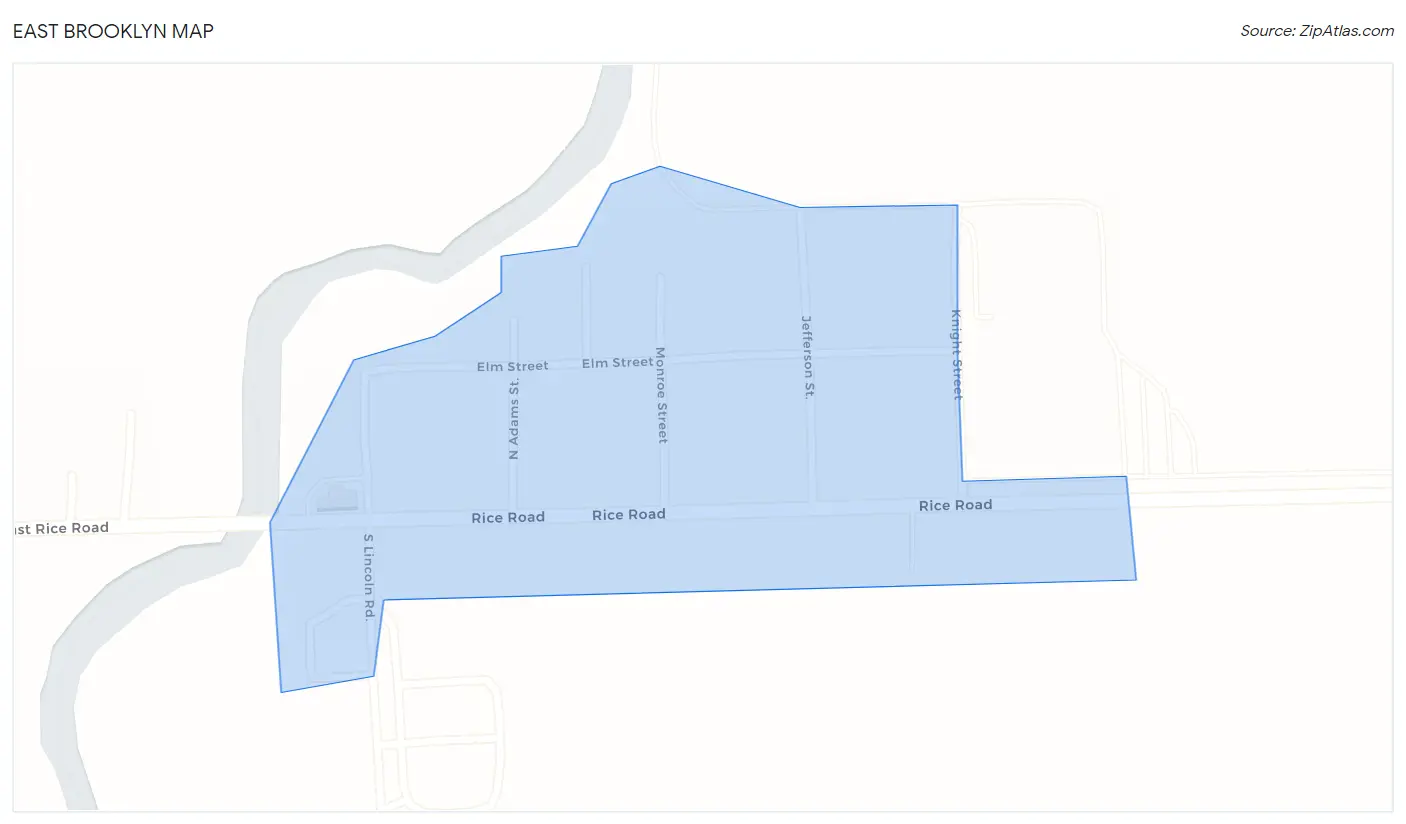
East Brooklyn Overview
$47,624
PER CAPITA INCOME
$89,375
AVG FAMILY INCOME
$84,375
AVG HOUSEHOLD INCOME
0.38
INEQUALITY / GINI INDEX
55
TOTAL POPULATION
24
MALE POPULATION
31
FEMALE POPULATION
77.42
MALES / 100 FEMALES
129.17
FEMALES / 100 MALES
61.3
MEDIAN AGE
2.0
AVG FAMILY SIZE
1.7
AVG HOUSEHOLD SIZE
28
LABOR FORCE [ PEOPLE ]
51.9%
PERCENT IN LABOR FORCE
10.7%
UNEMPLOYMENT RATE
Income in East Brooklyn
Income Overview in East Brooklyn
Per Capita Income in East Brooklyn is $47,624, while median incomes of families and households are $89,375 and $84,375 respectively.
| Characteristic | Number | Measure |
| Per Capita Income | 55 | $47,624 |
| Median Family Income | 17 | $89,375 |
| Mean Family Income | 17 | $90,024 |
| Median Household Income | 33 | $84,375 |
| Mean Household Income | 33 | $77,870 |
| Income Deficit | 17 | $0 |
| Wage / Income Gap (%) | 55 | 0.00% |
| Wage / Income Gap ($) | 55 | 100.00¢ per $1 |
| Gini / Inequality Index | 55 | 0.38 |
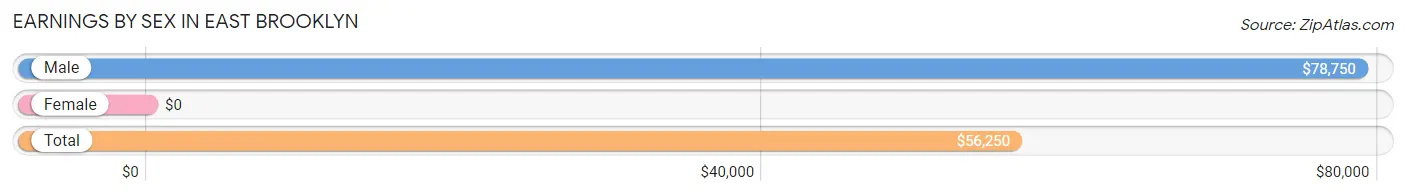
Earnings by Sex in East Brooklyn
| Sex | Number | Average Earnings |
| Male | 12 (42.9%) | $78,750 |
| Female | 16 (57.1%) | $0 |
| Total | 28 (100.0%) | $56,250 |
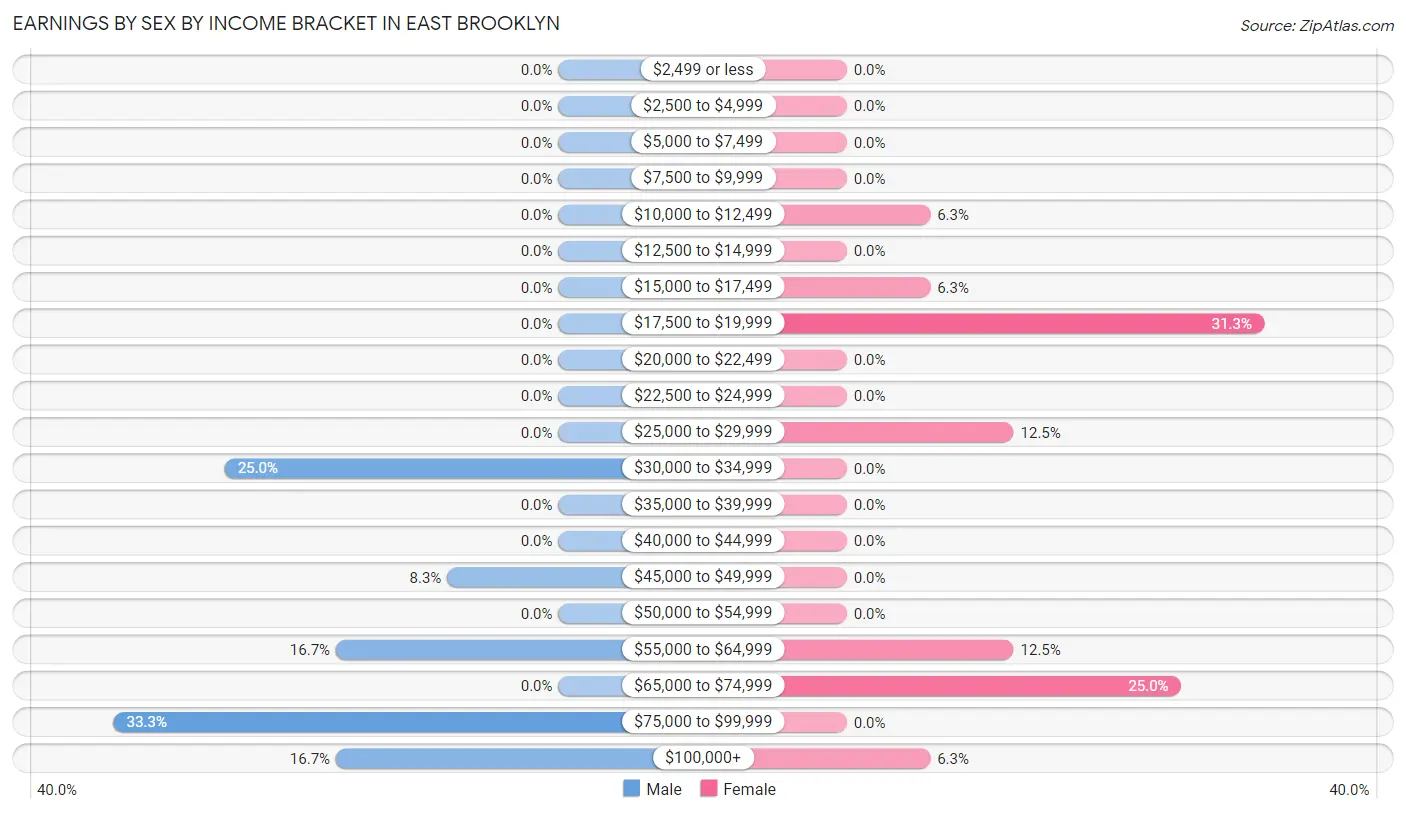
Earnings by Sex by Income Bracket in East Brooklyn
The most common earnings brackets in East Brooklyn are $75,000 to $99,999 for men (4 | 33.3%) and $17,500 to $19,999 for women (5 | 31.2%).
| Income | Male | Female |
| $2,499 or less | 0 (0.0%) | 0 (0.0%) |
| $2,500 to $4,999 | 0 (0.0%) | 0 (0.0%) |
| $5,000 to $7,499 | 0 (0.0%) | 0 (0.0%) |
| $7,500 to $9,999 | 0 (0.0%) | 0 (0.0%) |
| $10,000 to $12,499 | 0 (0.0%) | 1 (6.2%) |
| $12,500 to $14,999 | 0 (0.0%) | 0 (0.0%) |
| $15,000 to $17,499 | 0 (0.0%) | 1 (6.2%) |
| $17,500 to $19,999 | 0 (0.0%) | 5 (31.2%) |
| $20,000 to $22,499 | 0 (0.0%) | 0 (0.0%) |
| $22,500 to $24,999 | 0 (0.0%) | 0 (0.0%) |
| $25,000 to $29,999 | 0 (0.0%) | 2 (12.5%) |
| $30,000 to $34,999 | 3 (25.0%) | 0 (0.0%) |
| $35,000 to $39,999 | 0 (0.0%) | 0 (0.0%) |
| $40,000 to $44,999 | 0 (0.0%) | 0 (0.0%) |
| $45,000 to $49,999 | 1 (8.3%) | 0 (0.0%) |
| $50,000 to $54,999 | 0 (0.0%) | 0 (0.0%) |
| $55,000 to $64,999 | 2 (16.7%) | 2 (12.5%) |
| $65,000 to $74,999 | 0 (0.0%) | 4 (25.0%) |
| $75,000 to $99,999 | 4 (33.3%) | 0 (0.0%) |
| $100,000+ | 2 (16.7%) | 1 (6.2%) |
| Total | 12 (100.0%) | 16 (100.0%) |
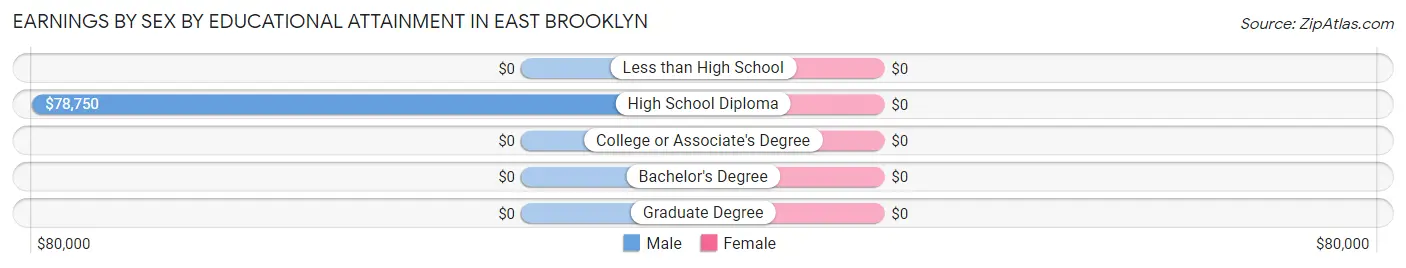
Earnings by Sex by Educational Attainment in East Brooklyn
| Educational Attainment | Male Income | Female Income |
| Less than High School | - | - |
| High School Diploma | $78,750 | $0 |
| College or Associate's Degree | - | - |
| Bachelor's Degree | - | - |
| Graduate Degree | - | - |
| Total | $92,813 | $0 |
Family Income in East Brooklyn
Family Income Brackets in East Brooklyn
According to the East Brooklyn family income data, there are 5 families falling into the $100,000 to $149,999 income range, which is the most common income bracket and makes up 29.4% of all families.
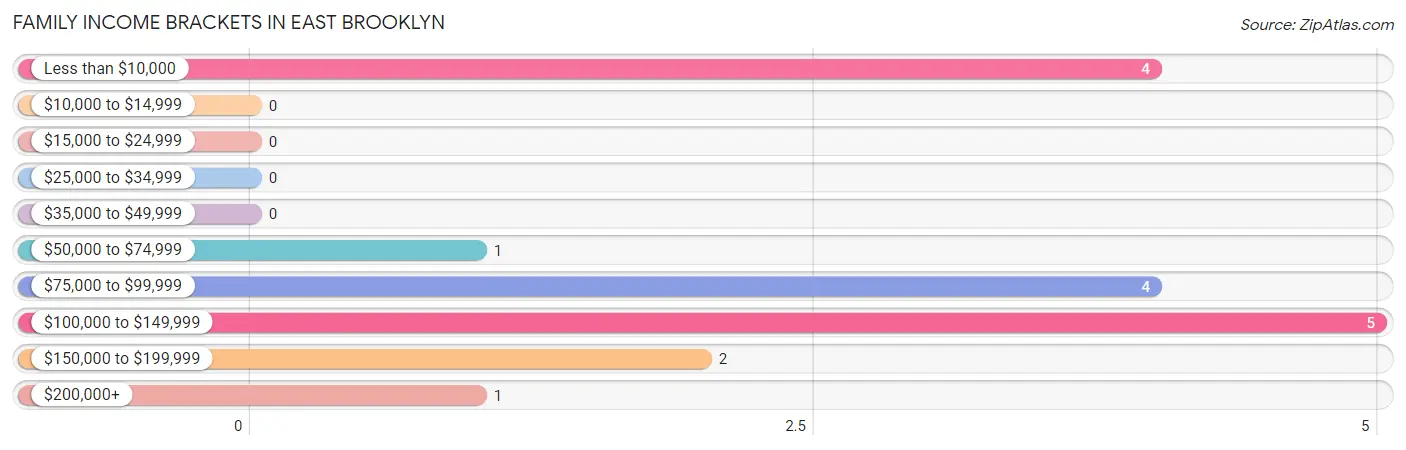
| Income Bracket | # Families | % Families |
| Less than $10,000 | 4 | 23.5% |
| $10,000 to $14,999 | 0 | 0.0% |
| $15,000 to $24,999 | 0 | 0.0% |
| $25,000 to $34,999 | 0 | 0.0% |
| $35,000 to $49,999 | 0 | 0.0% |
| $50,000 to $74,999 | 1 | 5.9% |
| $75,000 to $99,999 | 4 | 23.5% |
| $100,000 to $149,999 | 5 | 29.4% |
| $150,000 to $199,999 | 2 | 11.8% |
| $200,000+ | 1 | 5.9% |
Family Income by Famaliy Size in East Brooklyn
2-person families (14 | 82.4%) account for the highest median family income in East Brooklyn with $86,250 per family, while 2-person families (14 | 82.4%) have the highest median income of $43,125 per family member.
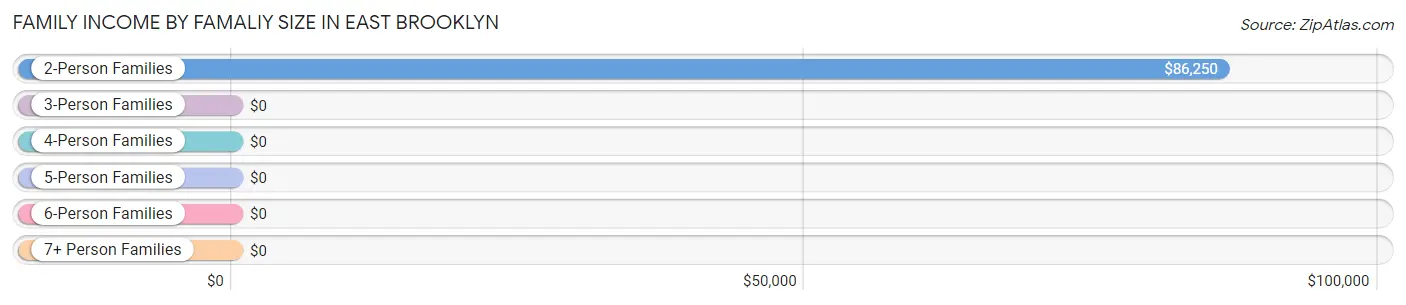
| Income Bracket | # Families | Median Income |
| 2-Person Families | 14 (82.4%) | $86,250 |
| 3-Person Families | 3 (17.6%) | $0 |
| 4-Person Families | 0 (0.0%) | $0 |
| 5-Person Families | 0 (0.0%) | $0 |
| 6-Person Families | 0 (0.0%) | $0 |
| 7+ Person Families | 0 (0.0%) | $0 |
| Total | 17 (100.0%) | $89,375 |
Family Income by Number of Earners in East Brooklyn
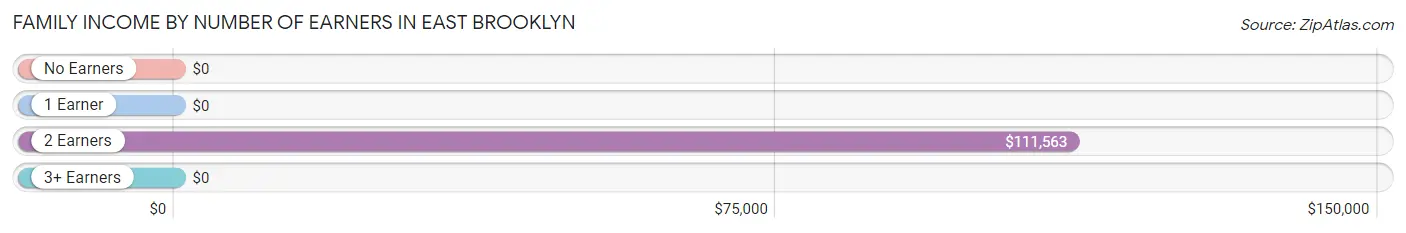
| Number of Earners | # Families | Median Income |
| No Earners | 7 (41.2%) | $0 |
| 1 Earner | 1 (5.9%) | $0 |
| 2 Earners | 9 (52.9%) | $111,563 |
| 3+ Earners | 0 (0.0%) | $0 |
| Total | 17 (100.0%) | $89,375 |
Household Income in East Brooklyn
Household Income Brackets in East Brooklyn
With 11 households falling in the category, the $100,000 to $149,999 income range is the most frequent in East Brooklyn, accounting for 33.3% of all households.
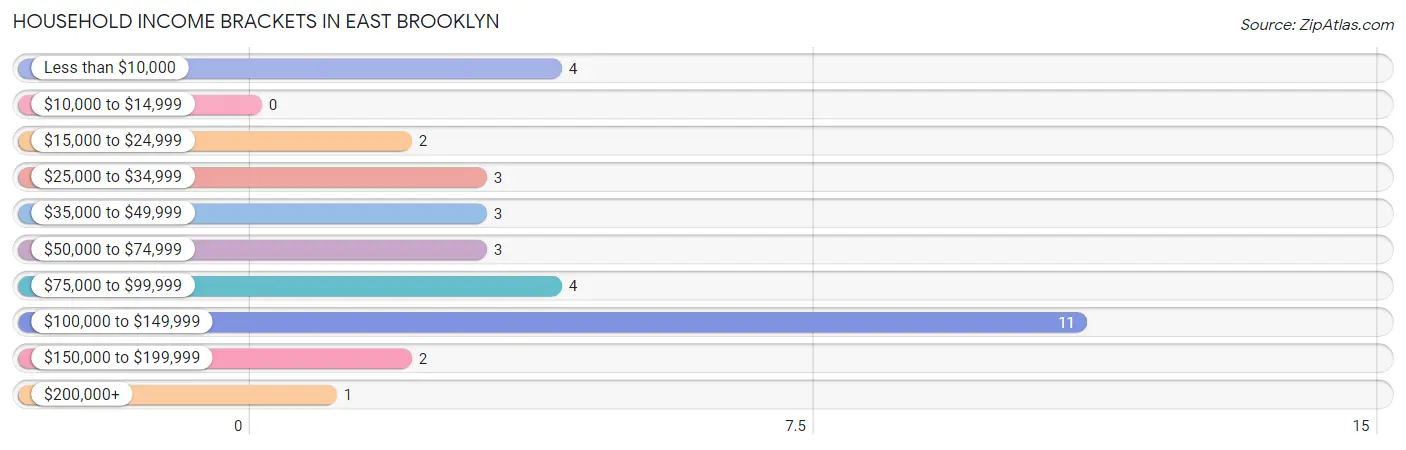
| Income Bracket | # Households | % Households |
| Less than $10,000 | 4 | 12.1% |
| $10,000 to $14,999 | 0 | 0.0% |
| $15,000 to $24,999 | 2 | 6.1% |
| $25,000 to $34,999 | 3 | 9.1% |
| $35,000 to $49,999 | 3 | 9.1% |
| $50,000 to $74,999 | 3 | 9.1% |
| $75,000 to $99,999 | 4 | 12.1% |
| $100,000 to $149,999 | 11 | 33.3% |
| $150,000 to $199,999 | 2 | 6.1% |
| $200,000+ | 1 | 3.0% |
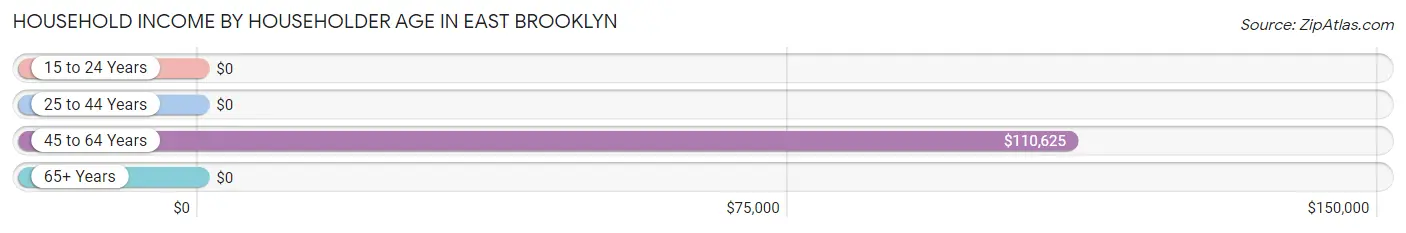
Household Income by Householder Age in East Brooklyn
The median household income in East Brooklyn is $84,375, with the highest median household income of $110,625 found in the 45 to 64 years age bracket for the primary householder. A total of 14 households (42.4%) fall into this category. Meanwhile, the 15 to 24 years age bracket for the primary householder has the lowest median household income of $0, with 1 households (3.0%) in this group.
| Income Bracket | # Households | Median Income |
| 15 to 24 Years | 1 (3.0%) | $0 |
| 25 to 44 Years | 3 (9.1%) | $0 |
| 45 to 64 Years | 14 (42.4%) | $110,625 |
| 65+ Years | 15 (45.5%) | $0 |
| Total | 33 (100.0%) | $84,375 |
Poverty in East Brooklyn
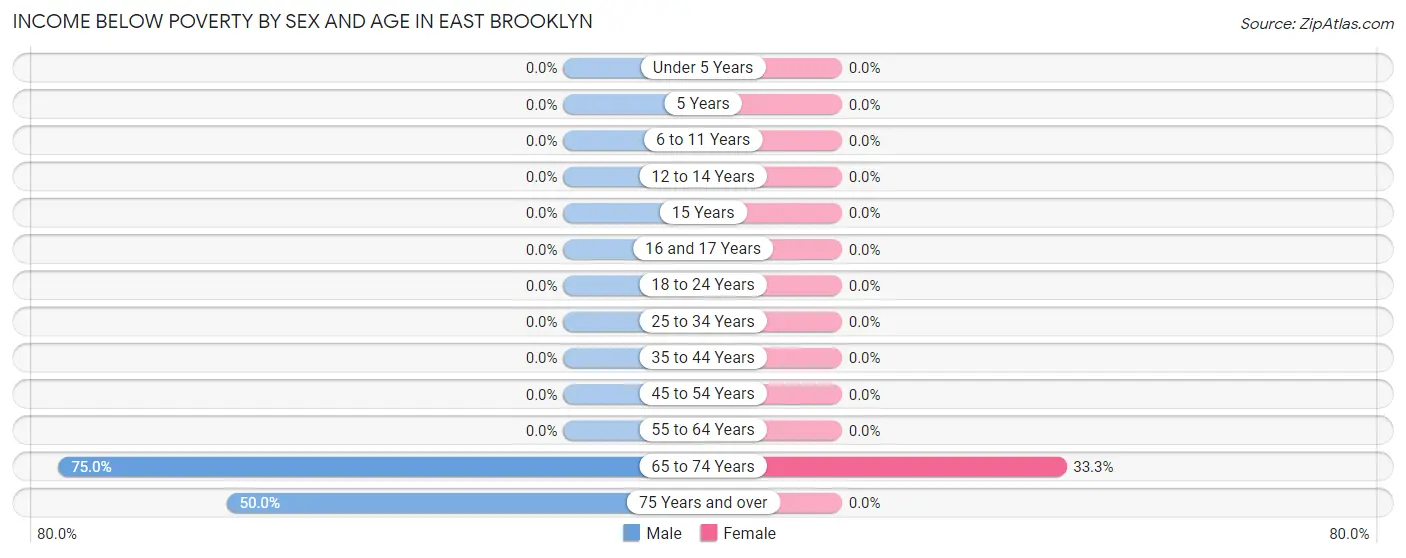
Income Below Poverty by Sex and Age in East Brooklyn
With 16.7% poverty level for males and 9.7% for females among the residents of East Brooklyn, 65 to 74 year old males and 65 to 74 year old females are the most vulnerable to poverty, with 3 males (75.0%) and 3 females (33.3%) in their respective age groups living below the poverty level.
| Age Bracket | Male | Female |
| Under 5 Years | 0 (0.0%) | 0 (0.0%) |
| 5 Years | 0 (0.0%) | 0 (0.0%) |
| 6 to 11 Years | 0 (0.0%) | 0 (0.0%) |
| 12 to 14 Years | 0 (0.0%) | 0 (0.0%) |
| 15 Years | 0 (0.0%) | 0 (0.0%) |
| 16 and 17 Years | 0 (0.0%) | 0 (0.0%) |
| 18 to 24 Years | 0 (0.0%) | 0 (0.0%) |
| 25 to 34 Years | 0 (0.0%) | 0 (0.0%) |
| 35 to 44 Years | 0 (0.0%) | 0 (0.0%) |
| 45 to 54 Years | 0 (0.0%) | 0 (0.0%) |
| 55 to 64 Years | 0 (0.0%) | 0 (0.0%) |
| 65 to 74 Years | 3 (75.0%) | 3 (33.3%) |
| 75 Years and over | 1 (50.0%) | 0 (0.0%) |
| Total | 4 (16.7%) | 3 (9.7%) |
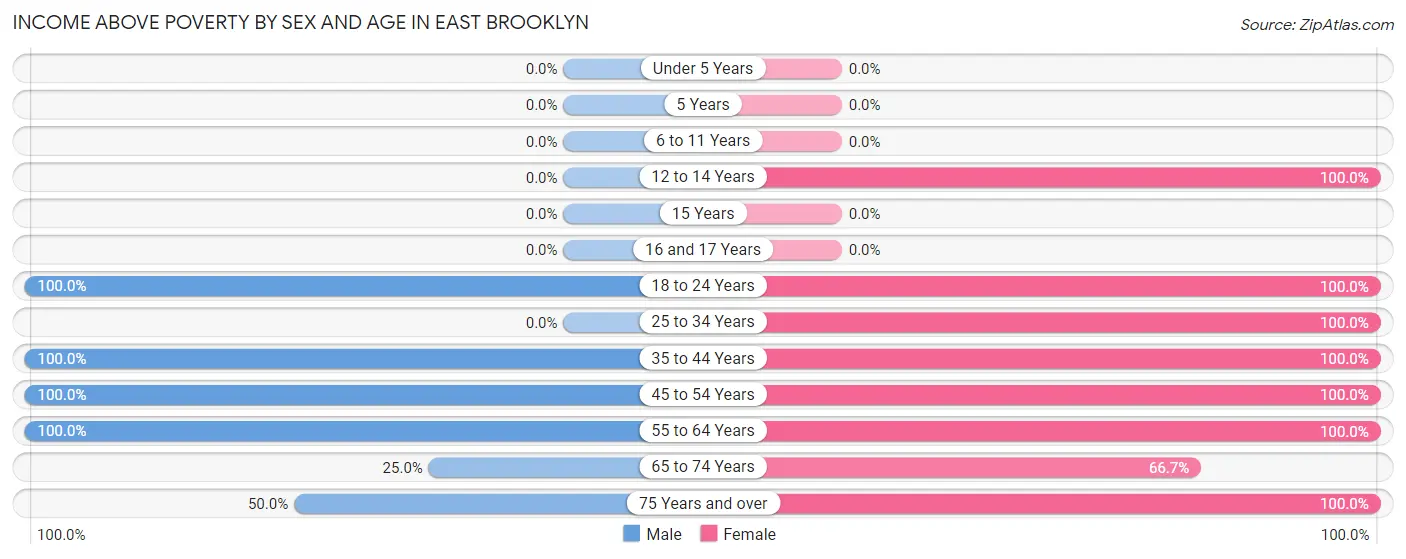
Income Above Poverty by Sex and Age in East Brooklyn
According to the poverty statistics in East Brooklyn, males aged 18 to 24 years and females aged 12 to 14 years are the age groups that are most secure financially, with 100.0% of males and 100.0% of females in these age groups living above the poverty line.
| Age Bracket | Male | Female |
| Under 5 Years | 0 (0.0%) | 0 (0.0%) |
| 5 Years | 0 (0.0%) | 0 (0.0%) |
| 6 to 11 Years | 0 (0.0%) | 0 (0.0%) |
| 12 to 14 Years | 0 (0.0%) | 1 (100.0%) |
| 15 Years | 0 (0.0%) | 0 (0.0%) |
| 16 and 17 Years | 0 (0.0%) | 0 (0.0%) |
| 18 to 24 Years | 1 (100.0%) | 2 (100.0%) |
| 25 to 34 Years | 0 (0.0%) | 1 (100.0%) |
| 35 to 44 Years | 3 (100.0%) | 4 (100.0%) |
| 45 to 54 Years | 7 (100.0%) | 5 (100.0%) |
| 55 to 64 Years | 7 (100.0%) | 3 (100.0%) |
| 65 to 74 Years | 1 (25.0%) | 6 (66.7%) |
| 75 Years and over | 1 (50.0%) | 6 (100.0%) |
| Total | 20 (83.3%) | 28 (90.3%) |
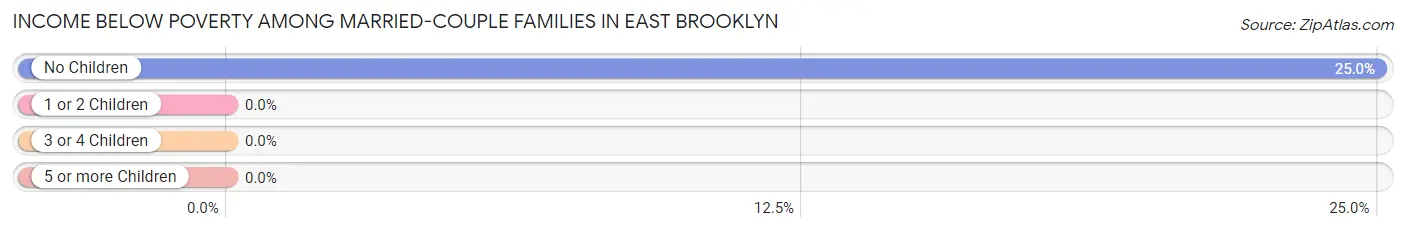
Income Below Poverty Among Married-Couple Families in East Brooklyn
The poverty statistics for married-couple families in East Brooklyn show that 23.5% or 4 of the total 17 families live below the poverty line. Families with no children have the highest poverty rate of 25.0%, comprising of 4 families. On the other hand, families with 1 or 2 children have the lowest poverty rate of 0.0%, which includes 0 families.
| Children | Above Poverty | Below Poverty |
| No Children | 12 (75.0%) | 4 (25.0%) |
| 1 or 2 Children | 1 (100.0%) | 0 (0.0%) |
| 3 or 4 Children | 0 (0.0%) | 0 (0.0%) |
| 5 or more Children | 0 (0.0%) | 0 (0.0%) |
| Total | 13 (76.5%) | 4 (23.5%) |
Income Below Poverty Among Single-Parent Households in East Brooklyn
| Children | Single Father | Single Mother |
| No Children | 0 (0.0%) | 0 (0.0%) |
| 1 or 2 Children | 0 (0.0%) | 0 (0.0%) |
| 3 or 4 Children | 0 (0.0%) | 0 (0.0%) |
| 5 or more Children | 0 (0.0%) | 0 (0.0%) |
| Total | 0 (0.0%) | 0 (0.0%) |
Income Below Poverty Among Married-Couple vs Single-Parent Households in East Brooklyn
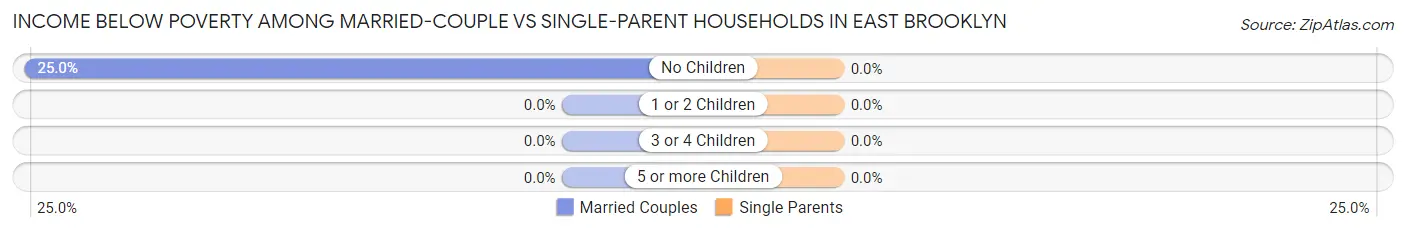
| Children | Married-Couple Families | Single-Parent Households |
| No Children | 4 (25.0%) | 0 (0.0%) |
| 1 or 2 Children | 0 (0.0%) | 0 (0.0%) |
| 3 or 4 Children | 0 (0.0%) | 0 (0.0%) |
| 5 or more Children | 0 (0.0%) | 0 (0.0%) |
| Total | 4 (23.5%) | 0 (0.0%) |
Race in East Brooklyn
The most populous races in East Brooklyn are White / Caucasian (53 | 96.4%), and Two or more Races (2 | 3.6%).
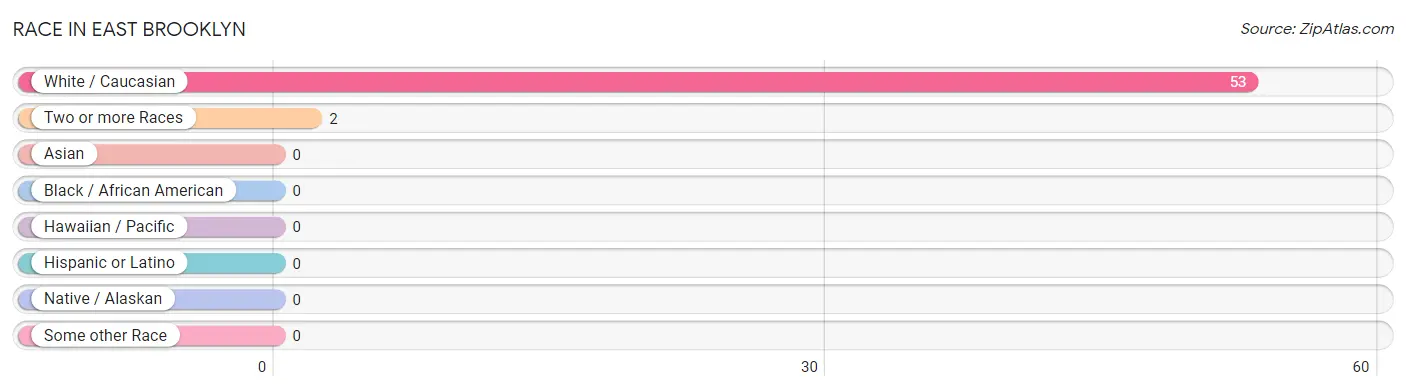
| Race | # Population | % Population |
| Asian | 0 | 0.0% |
| Black / African American | 0 | 0.0% |
| Hawaiian / Pacific | 0 | 0.0% |
| Hispanic or Latino | 0 | 0.0% |
| Native / Alaskan | 0 | 0.0% |
| White / Caucasian | 53 | 96.4% |
| Two or more Races | 2 | 3.6% |
| Some other Race | 0 | 0.0% |
| Total | 55 | 100.0% |
Ancestry in East Brooklyn
The most populous ancestries reported in East Brooklyn are Italian (14 | 25.5%), English (13 | 23.6%), German (9 | 16.4%), Czech (6 | 10.9%), and Danish (2 | 3.6%), together accounting for 80.0% of all East Brooklyn residents.
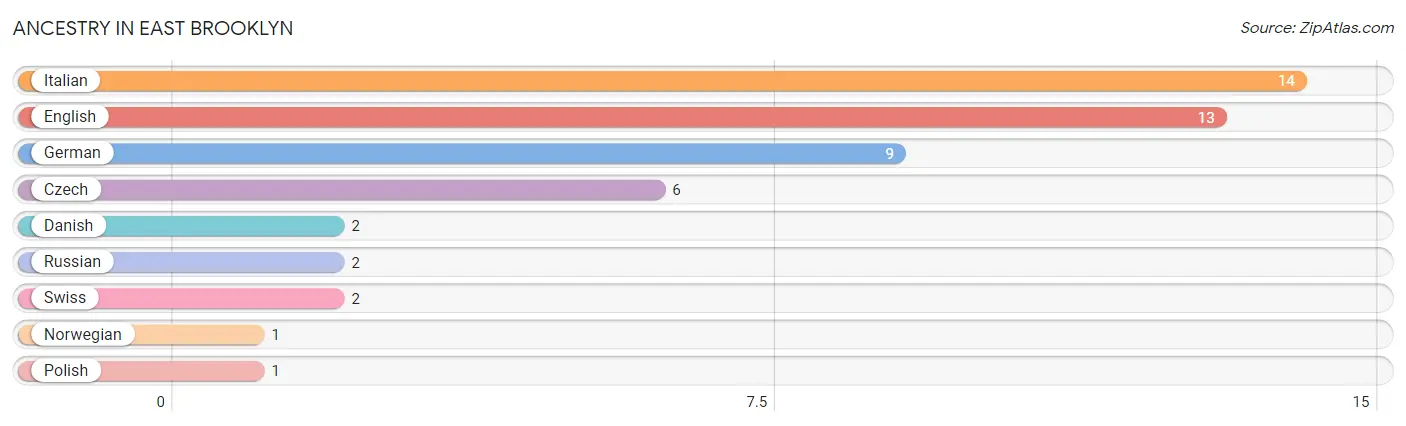
| Ancestry | # Population | % Population |
| Czech | 6 | 10.9% |
| Danish | 2 | 3.6% |
| English | 13 | 23.6% |
| German | 9 | 16.4% |
| Italian | 14 | 25.5% |
| Norwegian | 1 | 1.8% |
| Polish | 1 | 1.8% |
| Russian | 2 | 3.6% |
| Swiss | 2 | 3.6% | View All 9 Rows |
Immigrants in East Brooklyn

| Immigration Origin | # Population | % Population | View All 0 Rows |
Sex and Age in East Brooklyn
Sex and Age in East Brooklyn
The most populous age groups in East Brooklyn are 45 to 49 Years (7 | 29.2%) for men and 70 to 74 Years (6 | 19.4%) for women.
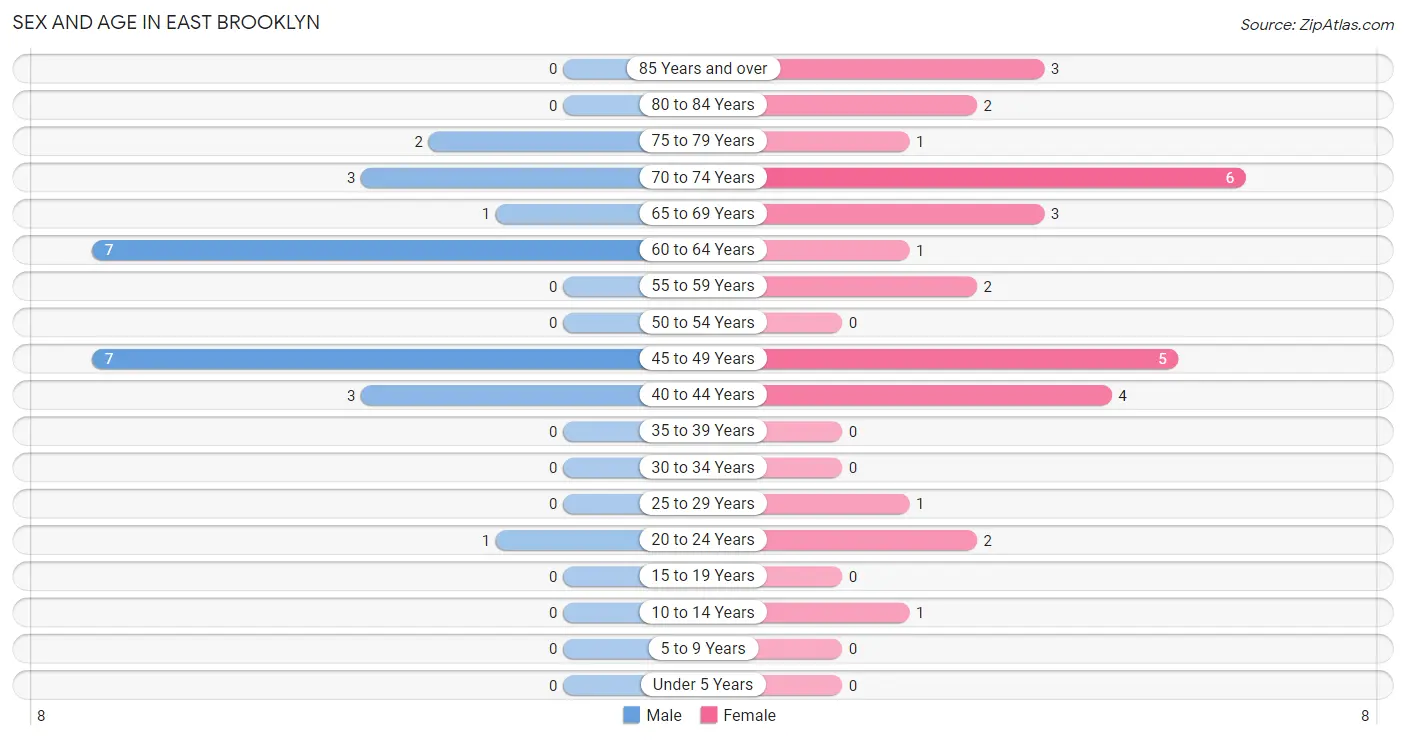
| Age Bracket | Male | Female |
| Under 5 Years | 0 (0.0%) | 0 (0.0%) |
| 5 to 9 Years | 0 (0.0%) | 0 (0.0%) |
| 10 to 14 Years | 0 (0.0%) | 1 (3.2%) |
| 15 to 19 Years | 0 (0.0%) | 0 (0.0%) |
| 20 to 24 Years | 1 (4.2%) | 2 (6.5%) |
| 25 to 29 Years | 0 (0.0%) | 1 (3.2%) |
| 30 to 34 Years | 0 (0.0%) | 0 (0.0%) |
| 35 to 39 Years | 0 (0.0%) | 0 (0.0%) |
| 40 to 44 Years | 3 (12.5%) | 4 (12.9%) |
| 45 to 49 Years | 7 (29.2%) | 5 (16.1%) |
| 50 to 54 Years | 0 (0.0%) | 0 (0.0%) |
| 55 to 59 Years | 0 (0.0%) | 2 (6.5%) |
| 60 to 64 Years | 7 (29.2%) | 1 (3.2%) |
| 65 to 69 Years | 1 (4.2%) | 3 (9.7%) |
| 70 to 74 Years | 3 (12.5%) | 6 (19.4%) |
| 75 to 79 Years | 2 (8.3%) | 1 (3.2%) |
| 80 to 84 Years | 0 (0.0%) | 2 (6.5%) |
| 85 Years and over | 0 (0.0%) | 3 (9.7%) |
| Total | 24 (100.0%) | 31 (100.0%) |
Families and Households in East Brooklyn
Median Family Size in East Brooklyn
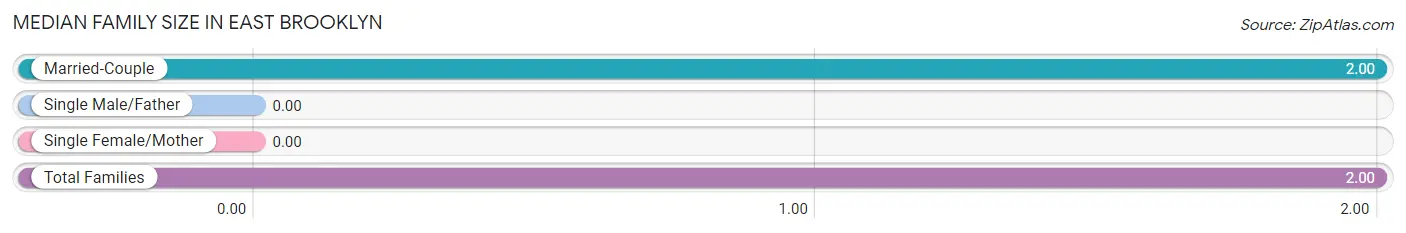
| Family Type | # Families | Family Size |
| Married-Couple | 17 (100.0%) | 2.00 |
| Single Male/Father | 0 (0.0%) | - |
| Single Female/Mother | 0 (0.0%) | - |
| Total Families | 17 (100.0%) | 2.00 |
Median Household Size in East Brooklyn
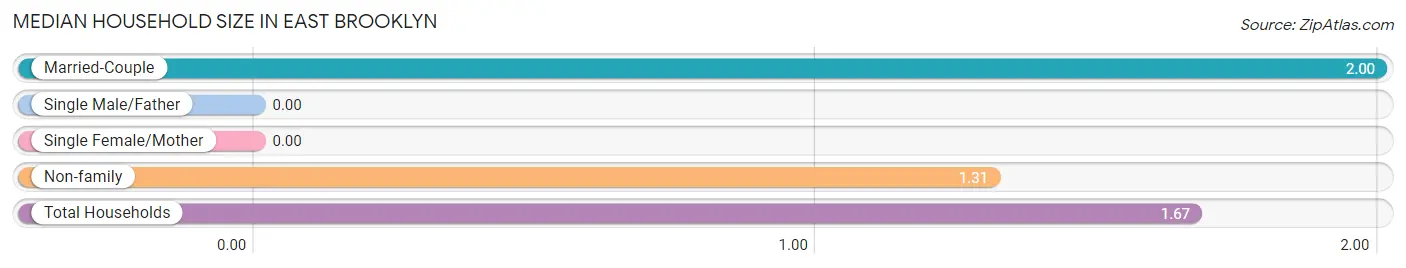
| Household Type | # Households | Household Size |
| Married-Couple | 17 (51.5%) | 2.00 |
| Single Male/Father | 0 (0.0%) | - |
| Single Female/Mother | 0 (0.0%) | - |
| Non-family | 16 (48.5%) | 1.31 |
| Total Households | 33 (100.0%) | 1.67 |
Household Size by Marriage Status in East Brooklyn
Out of a total of 33 households in East Brooklyn, 17 (51.5%) are family households, while 16 (48.5%) are nonfamily households. The most numerous type of family households are 2-person households, comprising 14, and the most common type of nonfamily households are 1-person households, comprising 12.
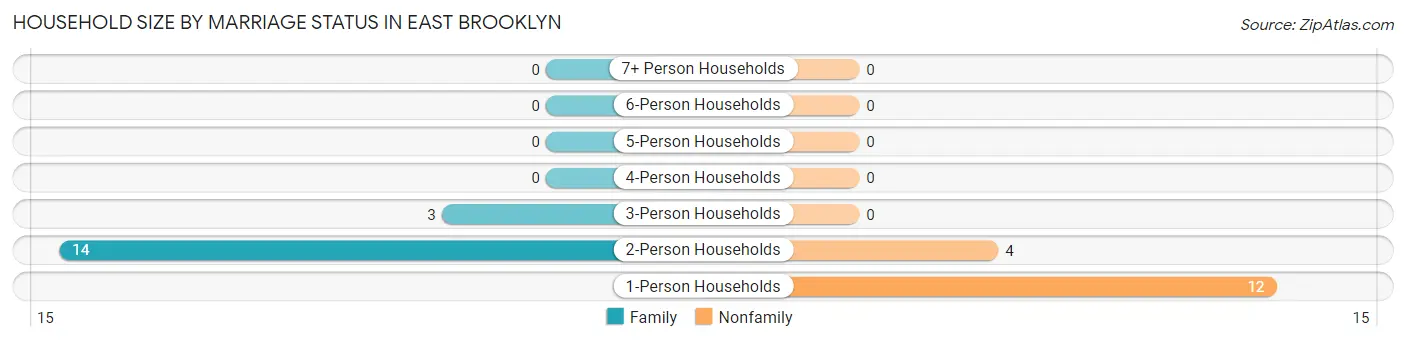
| Household Size | Family Households | Nonfamily Households |
| 1-Person Households | - | 12 (36.4%) |
| 2-Person Households | 14 (42.4%) | 4 (12.1%) |
| 3-Person Households | 3 (9.1%) | 0 (0.0%) |
| 4-Person Households | 0 (0.0%) | 0 (0.0%) |
| 5-Person Households | 0 (0.0%) | 0 (0.0%) |
| 6-Person Households | 0 (0.0%) | 0 (0.0%) |
| 7+ Person Households | 0 (0.0%) | 0 (0.0%) |
| Total | 17 (51.5%) | 16 (48.5%) |
Female Fertility in East Brooklyn
Fertility by Age in East Brooklyn
| Age Bracket | Women with Births | Births / 1,000 Women |
| 15 to 19 years | 0 (0.0%) | 0.0 |
| 20 to 34 years | 0 (0.0%) | 0.0 |
| 35 to 50 years | 0 (0.0%) | 0.0 |
| Total | 0 (0.0%) | 0.0 |
Fertility by Age by Marriage Status in East Brooklyn
| Age Bracket | Married | Unmarried |
| 15 to 19 years | 0 (0.0%) | 0 (0.0%) |
| 20 to 34 years | 0 (0.0%) | 0 (0.0%) |
| 35 to 50 years | 0 (0.0%) | 0 (0.0%) |
| Total | 0 (0.0%) | 0 (0.0%) |
Fertility by Education in East Brooklyn
| Educational Attainment | Women with Births | Births / 1,000 Women |
| Less than High School | 0 (0.0%) | 0.0 |
| High School Diploma | 0 (0.0%) | 0.0 |
| College or Associate's Degree | 0 (0.0%) | 0.0 |
| Bachelor's Degree | 0 (0.0%) | 0.0 |
| Graduate Degree | 0 (0.0%) | 0.0 |
| Total | 0 (0.0%) | 0.0 |
Fertility by Education by Marriage Status in East Brooklyn
| Educational Attainment | Married | Unmarried |
| Less than High School | 0 (0.0%) | 0 (0.0%) |
| High School Diploma | 0 (0.0%) | 0 (0.0%) |
| College or Associate's Degree | 0 (0.0%) | 0 (0.0%) |
| Bachelor's Degree | 0 (0.0%) | 0 (0.0%) |
| Graduate Degree | 0 (0.0%) | 0 (0.0%) |
| Total | 0 (0.0%) | 0 (0.0%) |
Employment Characteristics in East Brooklyn
Employment by Class of Employer in East Brooklyn
Among the 25 employed individuals in East Brooklyn, private company employees (23 | 92.0%), and not-for-profit organizations (2 | 8.0%) make up the most common classes of employment.
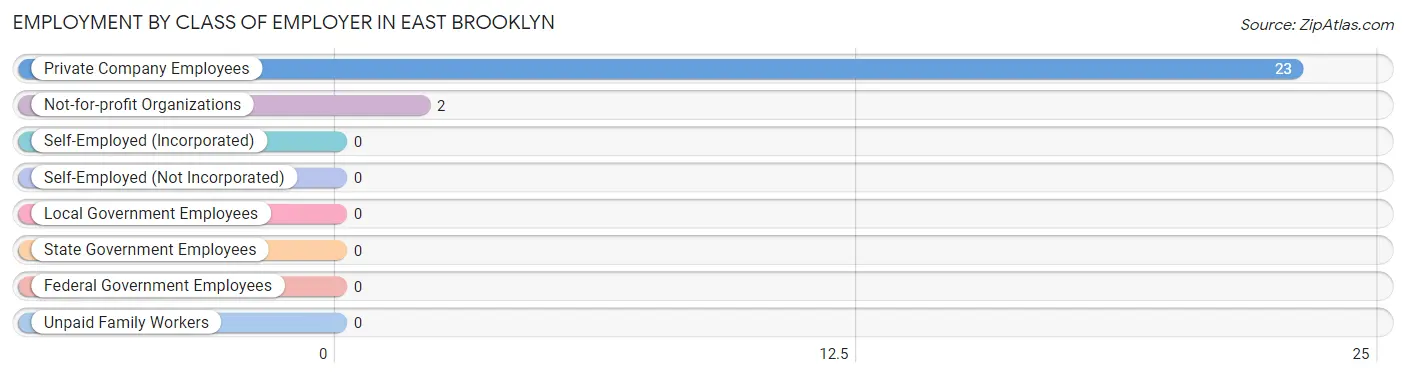
| Employer Class | # Employees | % Employees |
| Private Company Employees | 23 | 92.0% |
| Self-Employed (Incorporated) | 0 | 0.0% |
| Self-Employed (Not Incorporated) | 0 | 0.0% |
| Not-for-profit Organizations | 2 | 8.0% |
| Local Government Employees | 0 | 0.0% |
| State Government Employees | 0 | 0.0% |
| Federal Government Employees | 0 | 0.0% |
| Unpaid Family Workers | 0 | 0.0% |
| Total | 25 | 100.0% |
Employment Status by Age in East Brooklyn
According to the labor force statistics for East Brooklyn, out of the total population over 16 years of age (54), 51.9% or 28 individuals are in the labor force, with 10.7% or 3 of them unemployed. The age group with the highest labor force participation rate is 20 to 24 years, with 100.0% or 3 individuals in the labor force. Within the labor force, the 65 to 74 years age range has the highest percentage of unemployed individuals, with 66.7% or 2 of them being unemployed.
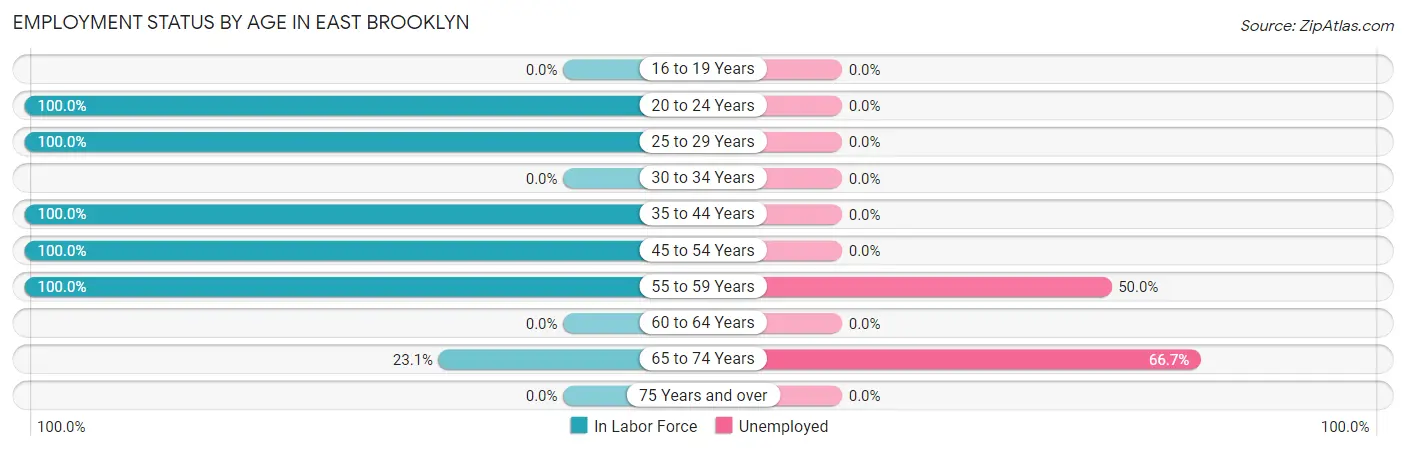
| Age Bracket | In Labor Force | Unemployed |
| 16 to 19 Years | 0 (0.0%) | 0 (0.0%) |
| 20 to 24 Years | 3 (100.0%) | 0 (0.0%) |
| 25 to 29 Years | 1 (100.0%) | 0 (0.0%) |
| 30 to 34 Years | 0 (0.0%) | 0 (0.0%) |
| 35 to 44 Years | 7 (100.0%) | 0 (0.0%) |
| 45 to 54 Years | 12 (100.0%) | 0 (0.0%) |
| 55 to 59 Years | 2 (100.0%) | 1 (50.0%) |
| 60 to 64 Years | 0 (0.0%) | 0 (0.0%) |
| 65 to 74 Years | 3 (23.1%) | 2 (66.7%) |
| 75 Years and over | 0 (0.0%) | 0 (0.0%) |
| Total | 28 (51.9%) | 3 (10.7%) |
Employment Status by Educational Attainment in East Brooklyn
According to labor force statistics for East Brooklyn, 73.3% of individuals (22) out of the total population between 25 and 64 years of age (30) are in the labor force, with 4.5% or 1 of them being unemployed. The group with the highest labor force participation rate are those with the educational attainment of college / associate degree, with 90.9% or 10 individuals in the labor force. Within the labor force, individuals with high school diploma education have the highest percentage of unemployment, with 10.0% or 1 of them being unemployed.
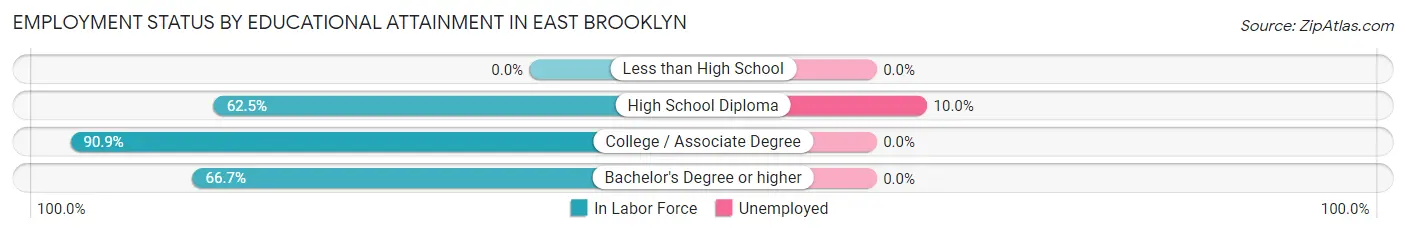
| Educational Attainment | In Labor Force | Unemployed |
| Less than High School | 0 (0.0%) | 0 (0.0%) |
| High School Diploma | 10 (62.5%) | 2 (10.0%) |
| College / Associate Degree | 10 (90.9%) | 0 (0.0%) |
| Bachelor's Degree or higher | 2 (66.7%) | 0 (0.0%) |
| Total | 22 (73.3%) | 1 (4.5%) |
Employment Occupations by Sex in East Brooklyn
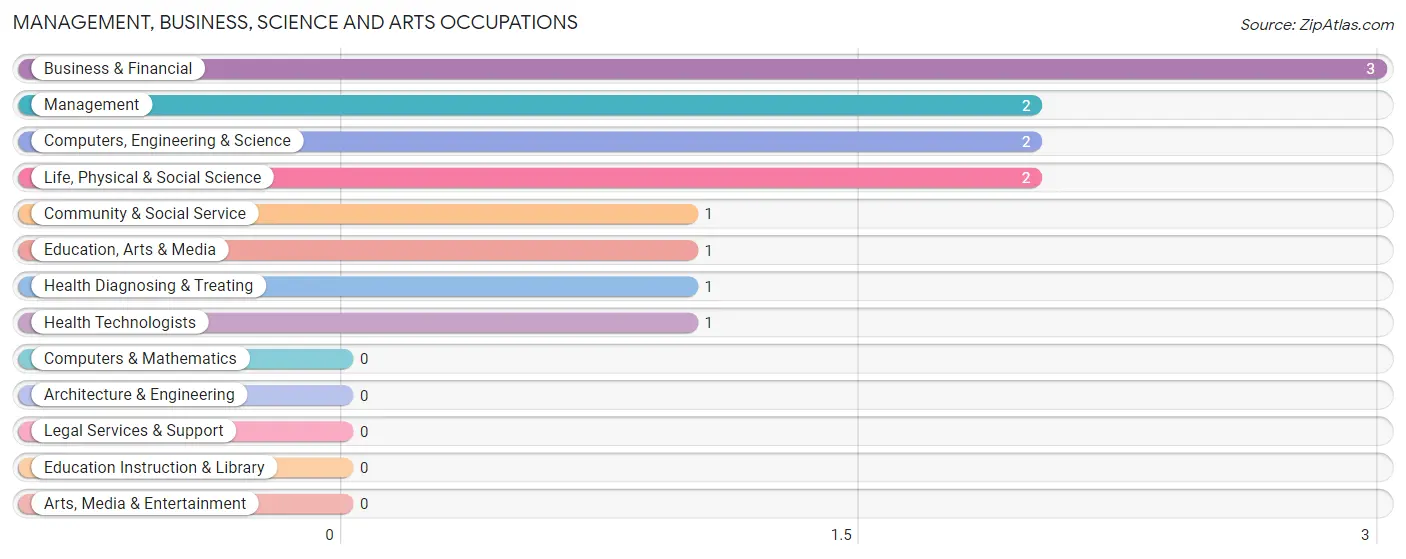
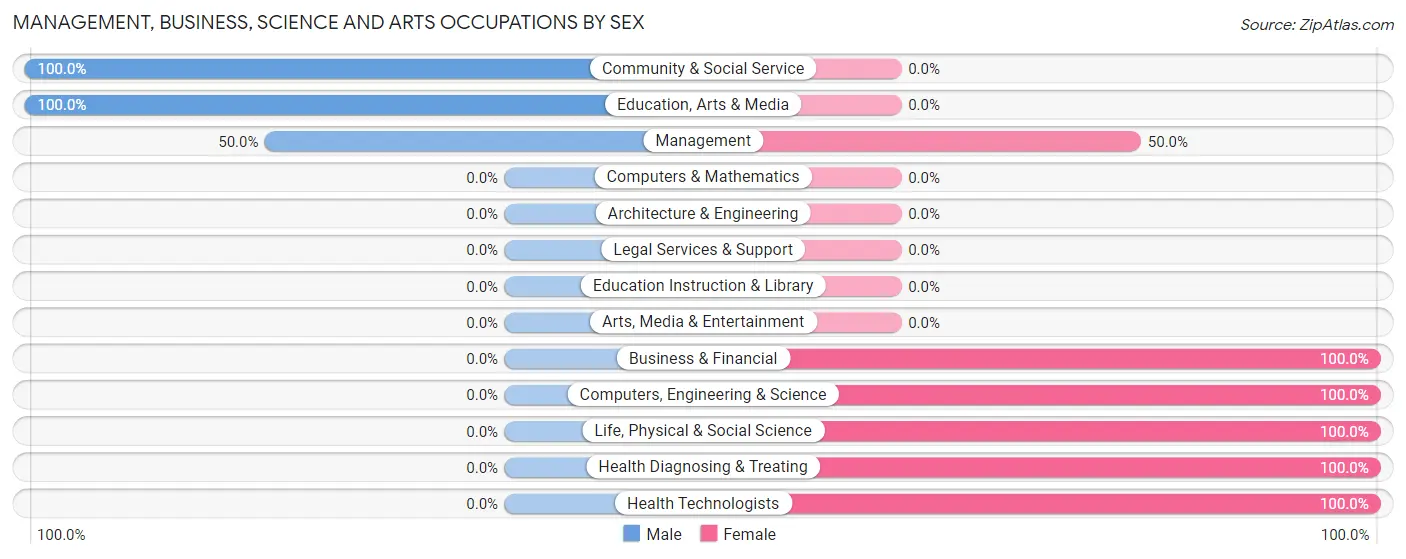
Management, Business, Science and Arts Occupations
The most common Management, Business, Science and Arts occupations in East Brooklyn are Business & Financial (3 | 12.0%), Management (2 | 8.0%), Computers, Engineering & Science (2 | 8.0%), Life, Physical & Social Science (2 | 8.0%), and Community & Social Service (1 | 4.0%).
Management, Business, Science and Arts Occupations by Sex
Within the Management, Business, Science and Arts occupations in East Brooklyn, the most male-oriented occupations are Community & Social Service (100.0%), Education, Arts & Media (100.0%), and Management (50.0%), while the most female-oriented occupations are Business & Financial (100.0%), Computers, Engineering & Science (100.0%), and Life, Physical & Social Science (100.0%).
| Occupation | Male | Female |
| Management | 1 (50.0%) | 1 (50.0%) |
| Business & Financial | 0 (0.0%) | 3 (100.0%) |
| Computers, Engineering & Science | 0 (0.0%) | 2 (100.0%) |
| Computers & Mathematics | 0 (0.0%) | 0 (0.0%) |
| Architecture & Engineering | 0 (0.0%) | 0 (0.0%) |
| Life, Physical & Social Science | 0 (0.0%) | 2 (100.0%) |
| Community & Social Service | 1 (100.0%) | 0 (0.0%) |
| Education, Arts & Media | 1 (100.0%) | 0 (0.0%) |
| Legal Services & Support | 0 (0.0%) | 0 (0.0%) |
| Education Instruction & Library | 0 (0.0%) | 0 (0.0%) |
| Arts, Media & Entertainment | 0 (0.0%) | 0 (0.0%) |
| Health Diagnosing & Treating | 0 (0.0%) | 1 (100.0%) |
| Health Technologists | 0 (0.0%) | 1 (100.0%) |
| Total (Category) | 2 (22.2%) | 7 (77.8%) |
| Total (Overall) | 12 (48.0%) | 13 (52.0%) |
Services Occupations
Services Occupations by Sex
| Occupation | Male | Female |
| Healthcare Support | 0 (0.0%) | 0 (0.0%) |
| Security & Protection | 0 (0.0%) | 0 (0.0%) |
| Firefighting & Prevention | 0 (0.0%) | 0 (0.0%) |
| Law Enforcement | 0 (0.0%) | 0 (0.0%) |
| Food Preparation & Serving | 0 (0.0%) | 0 (0.0%) |
| Cleaning & Maintenance | 0 (0.0%) | 0 (0.0%) |
| Personal Care & Service | 0 (0.0%) | 0 (0.0%) |
| Total (Category) | 0 (0.0%) | 0 (0.0%) |
| Total (Overall) | 12 (48.0%) | 13 (52.0%) |
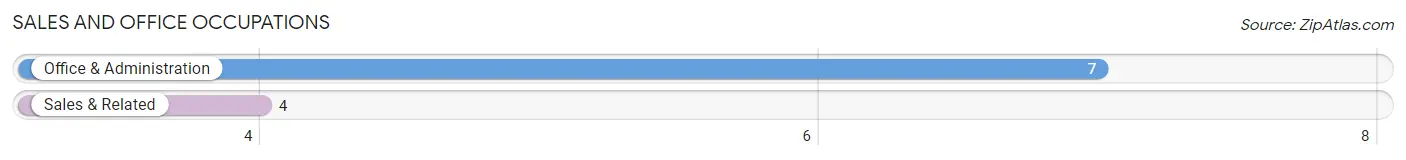
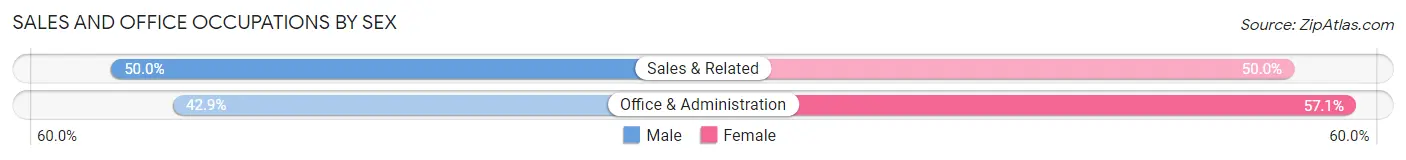
Sales and Office Occupations
The most common Sales and Office occupations in East Brooklyn are Office & Administration (7 | 28.0%), and Sales & Related (4 | 16.0%).
Sales and Office Occupations by Sex
| Occupation | Male | Female |
| Sales & Related | 2 (50.0%) | 2 (50.0%) |
| Office & Administration | 3 (42.9%) | 4 (57.1%) |
| Total (Category) | 5 (45.5%) | 6 (54.5%) |
| Total (Overall) | 12 (48.0%) | 13 (52.0%) |
Natural Resources, Construction and Maintenance Occupations
The most common Natural Resources, Construction and Maintenance occupations in East Brooklyn are , and Construction & Extraction (1 | 4.0%).
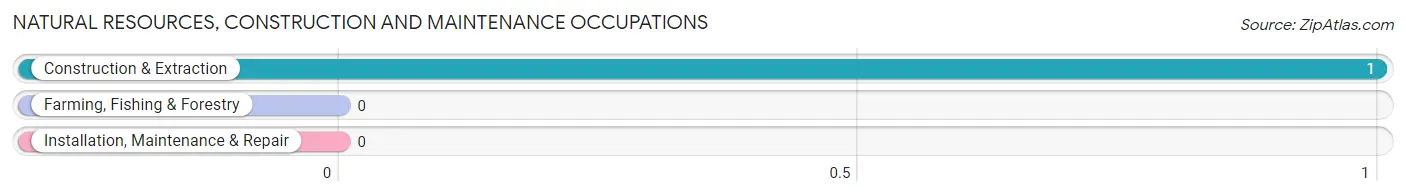
Natural Resources, Construction and Maintenance Occupations by Sex
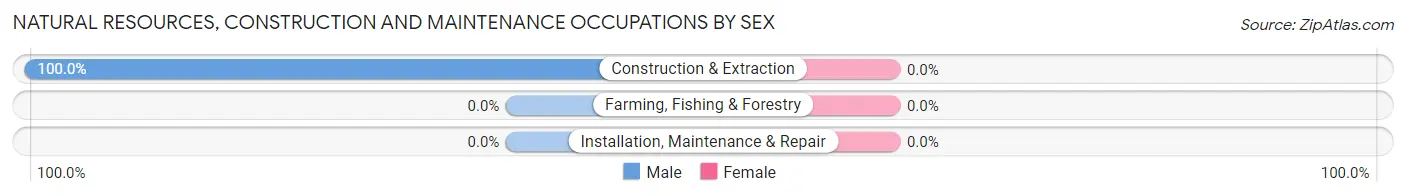
| Occupation | Male | Female |
| Farming, Fishing & Forestry | 0 (0.0%) | 0 (0.0%) |
| Construction & Extraction | 1 (100.0%) | 0 (0.0%) |
| Installation, Maintenance & Repair | 0 (0.0%) | 0 (0.0%) |
| Total (Category) | 1 (100.0%) | 0 (0.0%) |
| Total (Overall) | 12 (48.0%) | 13 (52.0%) |
Production, Transportation and Moving Occupations
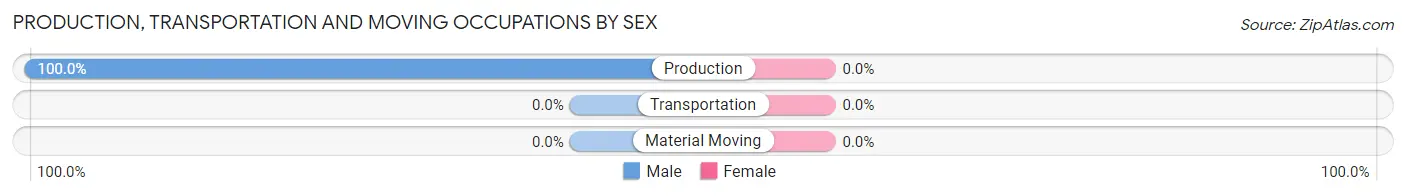
The most common Production, Transportation and Moving occupations in East Brooklyn are , and Production (4 | 16.0%).
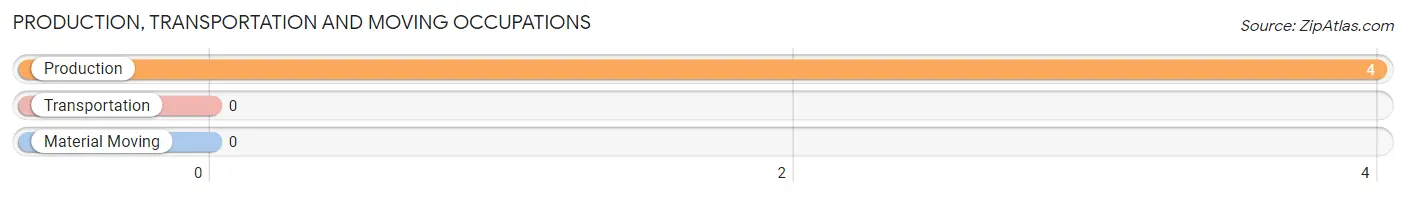
Production, Transportation and Moving Occupations by Sex
| Occupation | Male | Female |
| Production | 4 (100.0%) | 0 (0.0%) |
| Transportation | 0 (0.0%) | 0 (0.0%) |
| Material Moving | 0 (0.0%) | 0 (0.0%) |
| Total (Category) | 4 (100.0%) | 0 (0.0%) |
| Total (Overall) | 12 (48.0%) | 13 (52.0%) |
Employment Industries by Sex in East Brooklyn
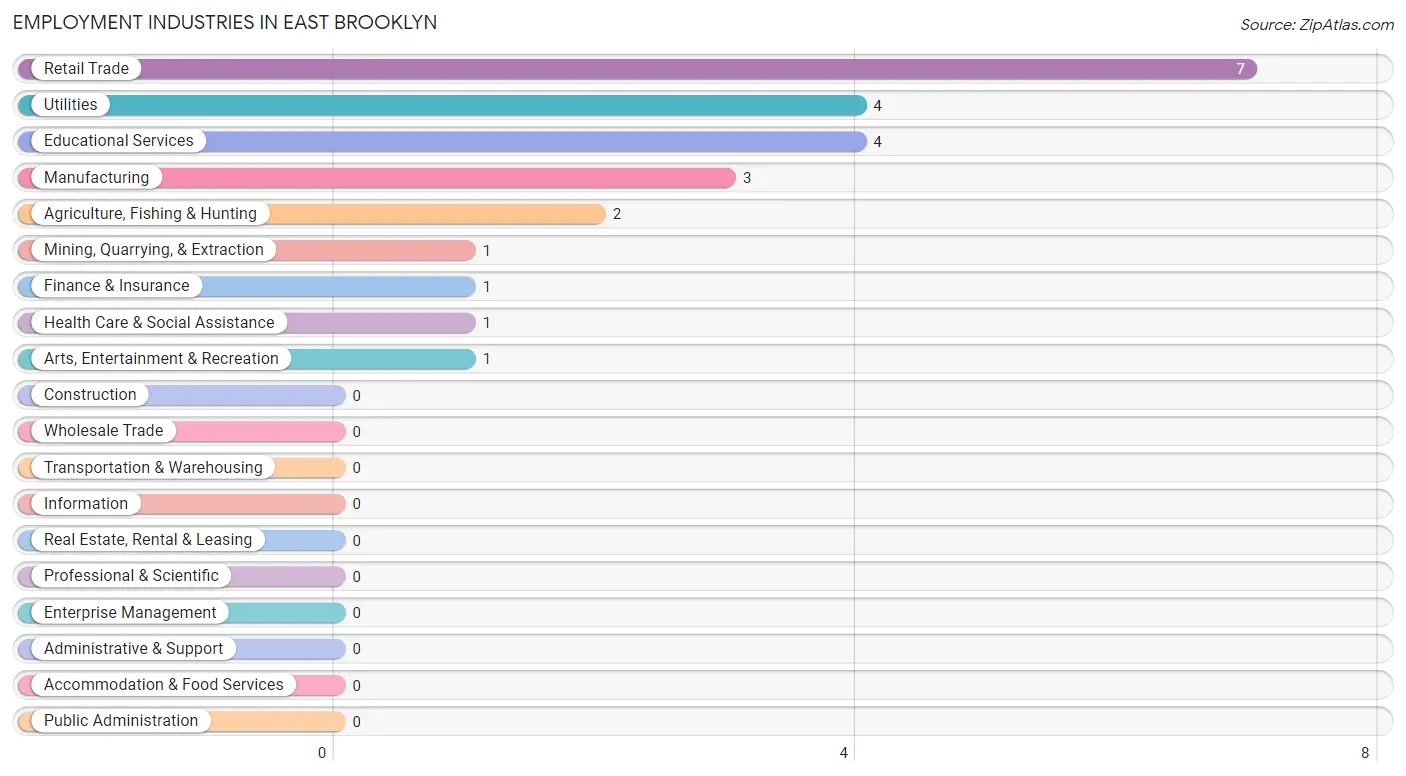
Employment Industries in East Brooklyn
The major employment industries in East Brooklyn include Retail Trade (7 | 28.0%), Utilities (4 | 16.0%), Educational Services (4 | 16.0%), Manufacturing (3 | 12.0%), and Agriculture, Fishing & Hunting (2 | 8.0%).
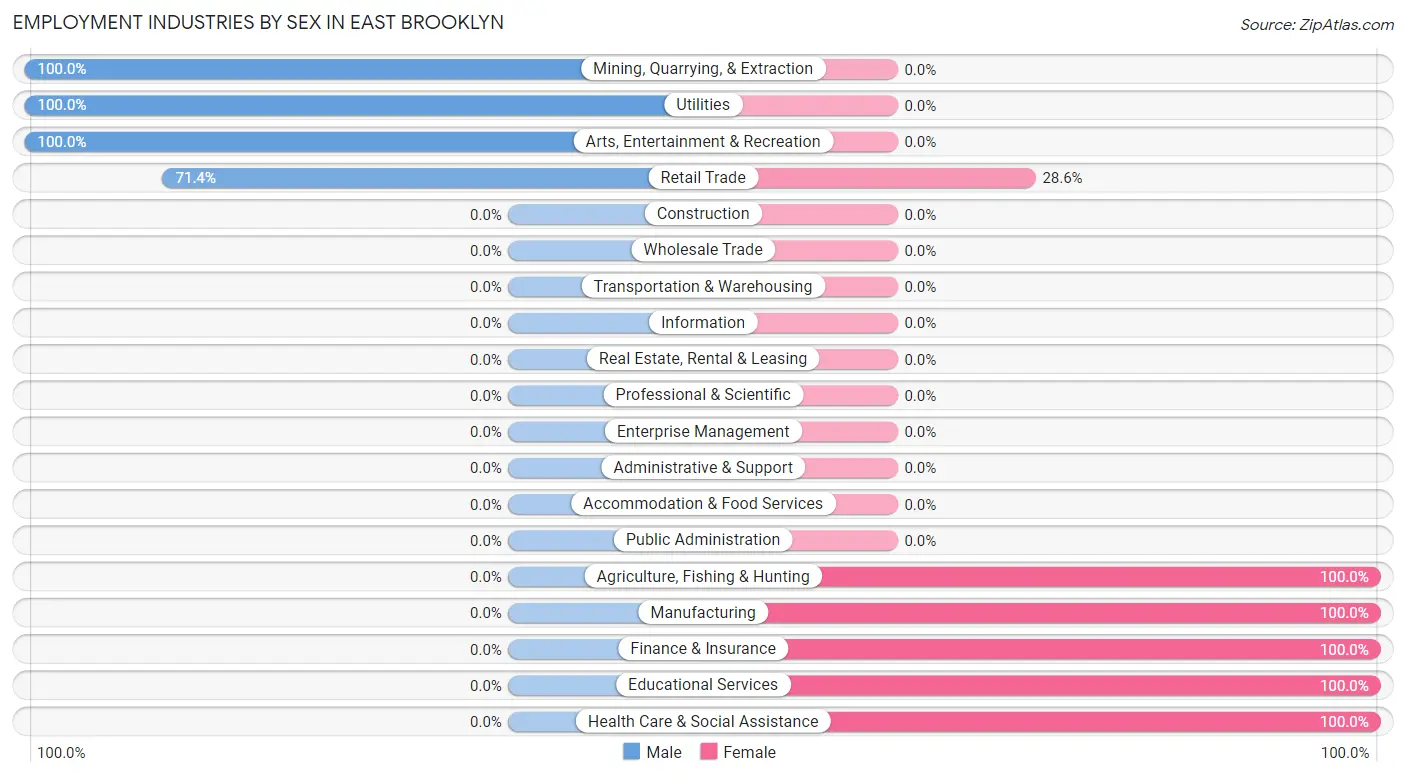
Employment Industries by Sex in East Brooklyn
The East Brooklyn industries that see more men than women are Mining, Quarrying, & Extraction (100.0%), Utilities (100.0%), and Arts, Entertainment & Recreation (100.0%), whereas the industries that tend to have a higher number of women are Agriculture, Fishing & Hunting (100.0%), Manufacturing (100.0%), and Finance & Insurance (100.0%).
| Industry | Male | Female |
| Agriculture, Fishing & Hunting | 0 (0.0%) | 2 (100.0%) |
| Mining, Quarrying, & Extraction | 1 (100.0%) | 0 (0.0%) |
| Construction | 0 (0.0%) | 0 (0.0%) |
| Manufacturing | 0 (0.0%) | 3 (100.0%) |
| Wholesale Trade | 0 (0.0%) | 0 (0.0%) |
| Retail Trade | 5 (71.4%) | 2 (28.6%) |
| Transportation & Warehousing | 0 (0.0%) | 0 (0.0%) |
| Utilities | 4 (100.0%) | 0 (0.0%) |
| Information | 0 (0.0%) | 0 (0.0%) |
| Finance & Insurance | 0 (0.0%) | 1 (100.0%) |
| Real Estate, Rental & Leasing | 0 (0.0%) | 0 (0.0%) |
| Professional & Scientific | 0 (0.0%) | 0 (0.0%) |
| Enterprise Management | 0 (0.0%) | 0 (0.0%) |
| Administrative & Support | 0 (0.0%) | 0 (0.0%) |
| Educational Services | 0 (0.0%) | 4 (100.0%) |
| Health Care & Social Assistance | 0 (0.0%) | 1 (100.0%) |
| Arts, Entertainment & Recreation | 1 (100.0%) | 0 (0.0%) |
| Accommodation & Food Services | 0 (0.0%) | 0 (0.0%) |
| Public Administration | 0 (0.0%) | 0 (0.0%) |
| Total | 12 (48.0%) | 13 (52.0%) |
Education in East Brooklyn
School Enrollment in East Brooklyn
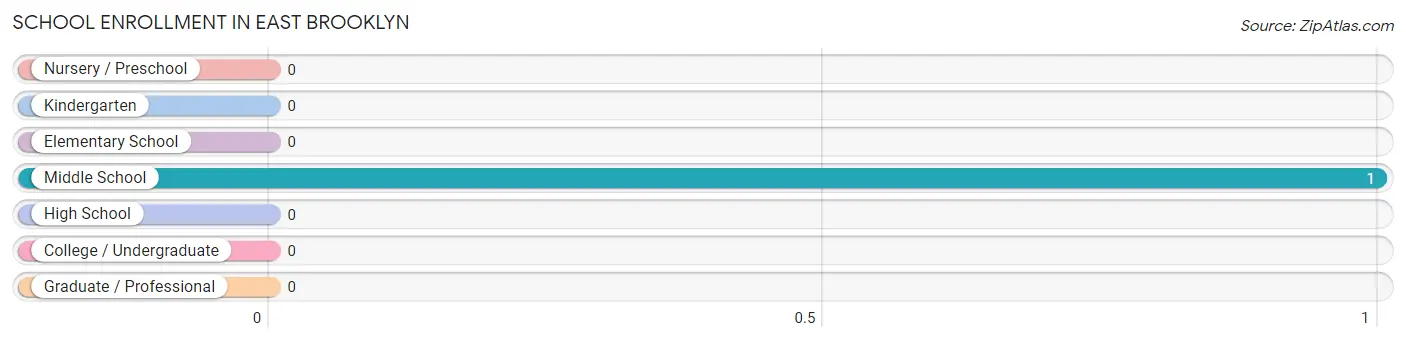
| School Level | # Students | % Students |
| Nursery / Preschool | 0 | 0.0% |
| Kindergarten | 0 | 0.0% |
| Elementary School | 0 | 0.0% |
| Middle School | 1 | 100.0% |
| High School | 0 | 0.0% |
| College / Undergraduate | 0 | 0.0% |
| Graduate / Professional | 0 | 0.0% |
| Total | 1 | 100.0% |
School Enrollment by Age by Funding Source in East Brooklyn
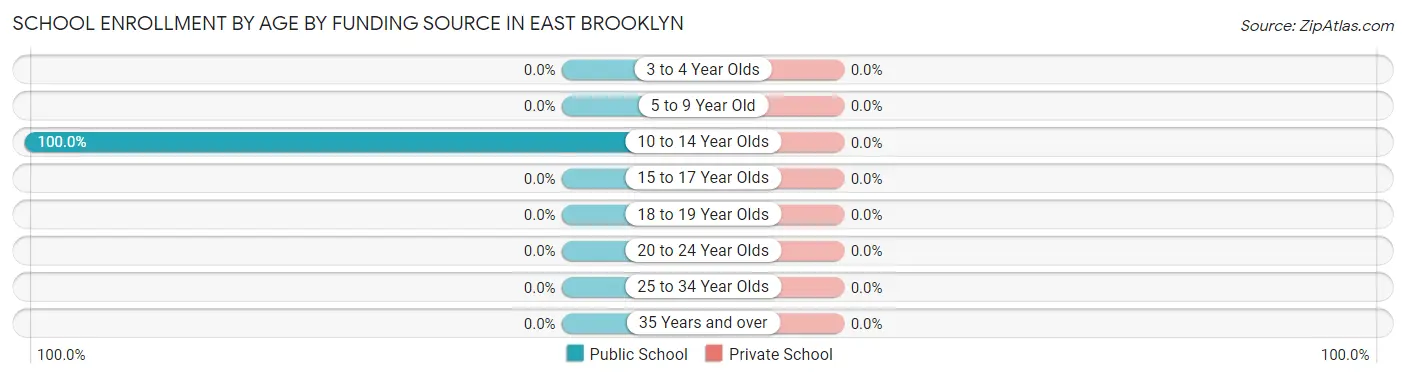
| Age Bracket | Public School | Private School |
| 3 to 4 Year Olds | 0 (0.0%) | 0 (0.0%) |
| 5 to 9 Year Old | 0 (0.0%) | 0 (0.0%) |
| 10 to 14 Year Olds | 1 (100.0%) | 0 (0.0%) |
| 15 to 17 Year Olds | 0 (0.0%) | 0 (0.0%) |
| 18 to 19 Year Olds | 0 (0.0%) | 0 (0.0%) |
| 20 to 24 Year Olds | 0 (0.0%) | 0 (0.0%) |
| 25 to 34 Year Olds | 0 (0.0%) | 0 (0.0%) |
| 35 Years and over | 0 (0.0%) | 0 (0.0%) |
| Total | 1 (100.0%) | 0 (0.0%) |
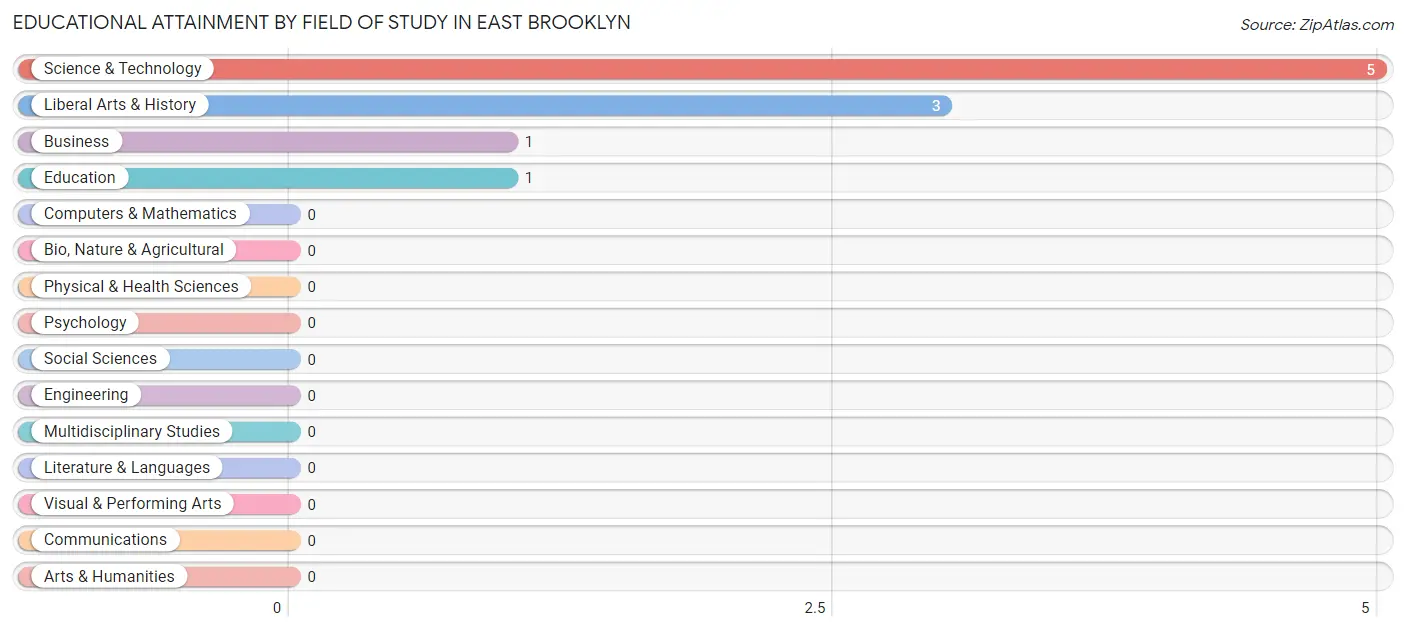
Educational Attainment by Field of Study in East Brooklyn
Science & technology (5 | 50.0%), liberal arts & history (3 | 30.0%), business (1 | 10.0%), and education (1 | 10.0%) are the most common fields of study among 10 individuals in East Brooklyn who have obtained a bachelor's degree or higher.
| Field of Study | # Graduates | % Graduates |
| Computers & Mathematics | 0 | 0.0% |
| Bio, Nature & Agricultural | 0 | 0.0% |
| Physical & Health Sciences | 0 | 0.0% |
| Psychology | 0 | 0.0% |
| Social Sciences | 0 | 0.0% |
| Engineering | 0 | 0.0% |
| Multidisciplinary Studies | 0 | 0.0% |
| Science & Technology | 5 | 50.0% |
| Business | 1 | 10.0% |
| Education | 1 | 10.0% |
| Literature & Languages | 0 | 0.0% |
| Liberal Arts & History | 3 | 30.0% |
| Visual & Performing Arts | 0 | 0.0% |
| Communications | 0 | 0.0% |
| Arts & Humanities | 0 | 0.0% |
| Total | 10 | 100.0% |
Transportation & Commute in East Brooklyn
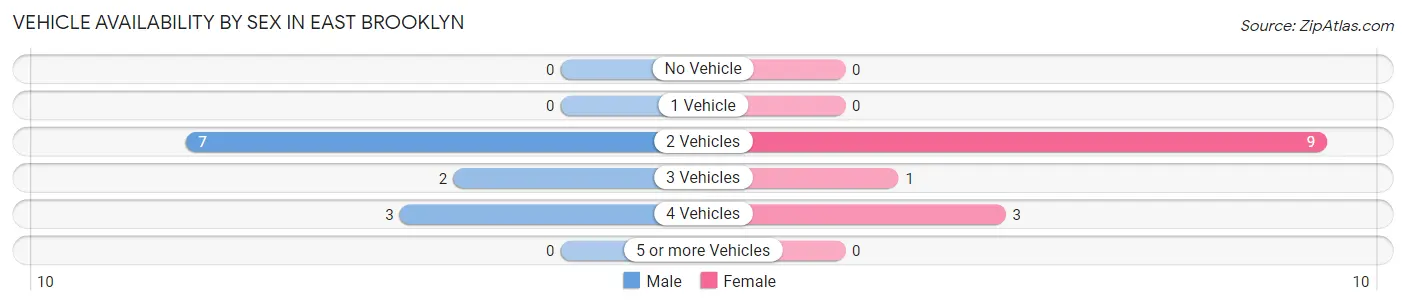
Vehicle Availability by Sex in East Brooklyn
The most prevalent vehicle ownership categories in East Brooklyn are males with 2 vehicles (7, accounting for 58.3%) and females with 2 vehicles (9, making up 53.8%).
| Vehicles Available | Male | Female |
| No Vehicle | 0 (0.0%) | 0 (0.0%) |
| 1 Vehicle | 0 (0.0%) | 0 (0.0%) |
| 2 Vehicles | 7 (58.3%) | 9 (69.2%) |
| 3 Vehicles | 2 (16.7%) | 1 (7.7%) |
| 4 Vehicles | 3 (25.0%) | 3 (23.1%) |
| 5 or more Vehicles | 0 (0.0%) | 0 (0.0%) |
| Total | 12 (100.0%) | 13 (100.0%) |
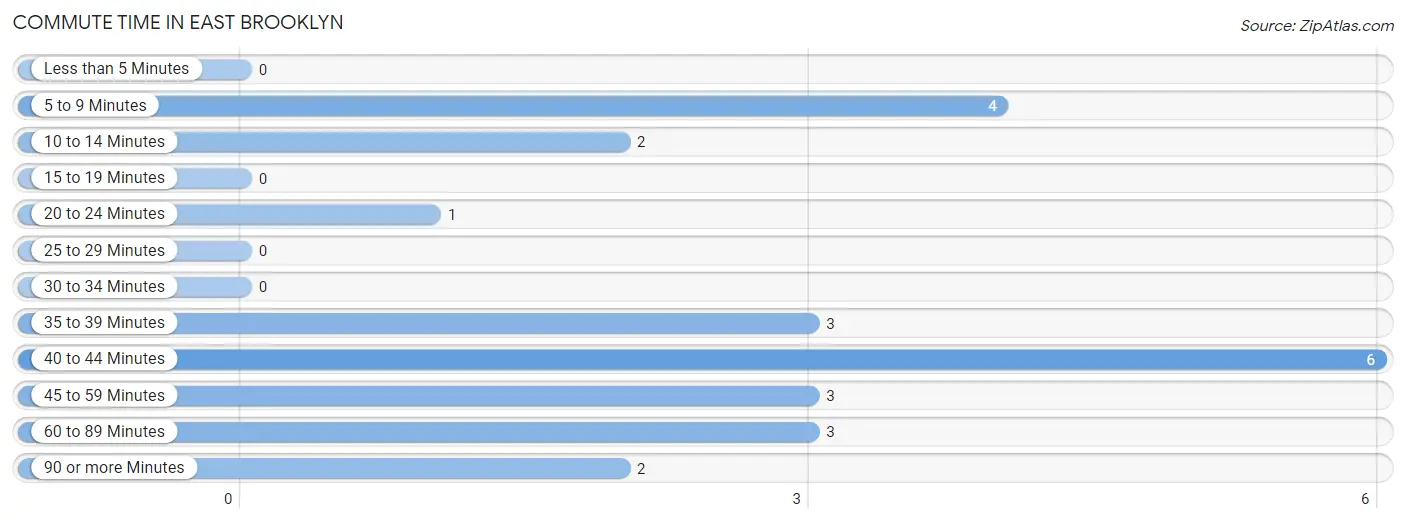
Commute Time in East Brooklyn
The most frequently occuring commute durations in East Brooklyn are 40 to 44 minutes (6 commuters, 25.0%), 5 to 9 minutes (4 commuters, 16.7%), and 35 to 39 minutes (3 commuters, 12.5%).
| Commute Time | # Commuters | % Commuters |
| Less than 5 Minutes | 0 | 0.0% |
| 5 to 9 Minutes | 4 | 16.7% |
| 10 to 14 Minutes | 2 | 8.3% |
| 15 to 19 Minutes | 0 | 0.0% |
| 20 to 24 Minutes | 1 | 4.2% |
| 25 to 29 Minutes | 0 | 0.0% |
| 30 to 34 Minutes | 0 | 0.0% |
| 35 to 39 Minutes | 3 | 12.5% |
| 40 to 44 Minutes | 6 | 25.0% |
| 45 to 59 Minutes | 3 | 12.5% |
| 60 to 89 Minutes | 3 | 12.5% |
| 90 or more Minutes | 2 | 8.3% |
Commute Time by Sex in East Brooklyn
The most common commute times in East Brooklyn are 40 to 44 minutes (5 commuters, 41.7%) for males and 5 to 9 minutes (4 commuters, 33.3%) for females.
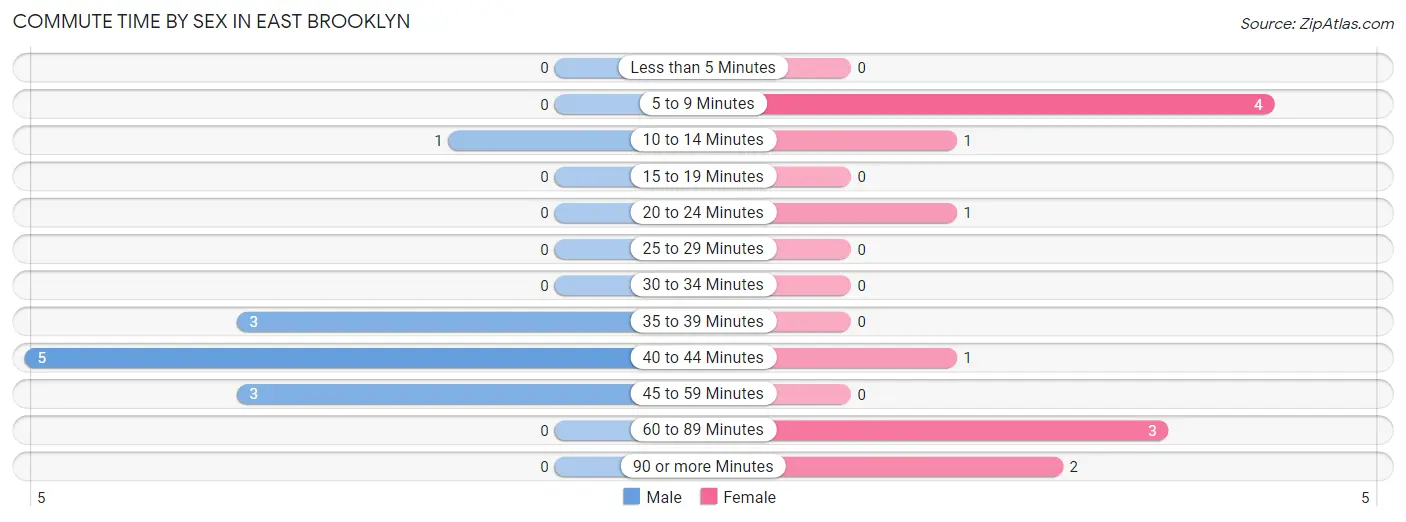
| Commute Time | Male | Female |
| Less than 5 Minutes | 0 (0.0%) | 0 (0.0%) |
| 5 to 9 Minutes | 0 (0.0%) | 4 (33.3%) |
| 10 to 14 Minutes | 1 (8.3%) | 1 (8.3%) |
| 15 to 19 Minutes | 0 (0.0%) | 0 (0.0%) |
| 20 to 24 Minutes | 0 (0.0%) | 1 (8.3%) |
| 25 to 29 Minutes | 0 (0.0%) | 0 (0.0%) |
| 30 to 34 Minutes | 0 (0.0%) | 0 (0.0%) |
| 35 to 39 Minutes | 3 (25.0%) | 0 (0.0%) |
| 40 to 44 Minutes | 5 (41.7%) | 1 (8.3%) |
| 45 to 59 Minutes | 3 (25.0%) | 0 (0.0%) |
| 60 to 89 Minutes | 0 (0.0%) | 3 (25.0%) |
| 90 or more Minutes | 0 (0.0%) | 2 (16.7%) |
Time of Departure to Work by Sex in East Brooklyn
The most frequent times of departure to work in East Brooklyn are 5:00 AM to 5:29 AM (4, 33.3%) for males and 6:00 AM to 6:29 AM (6, 50.0%) for females.
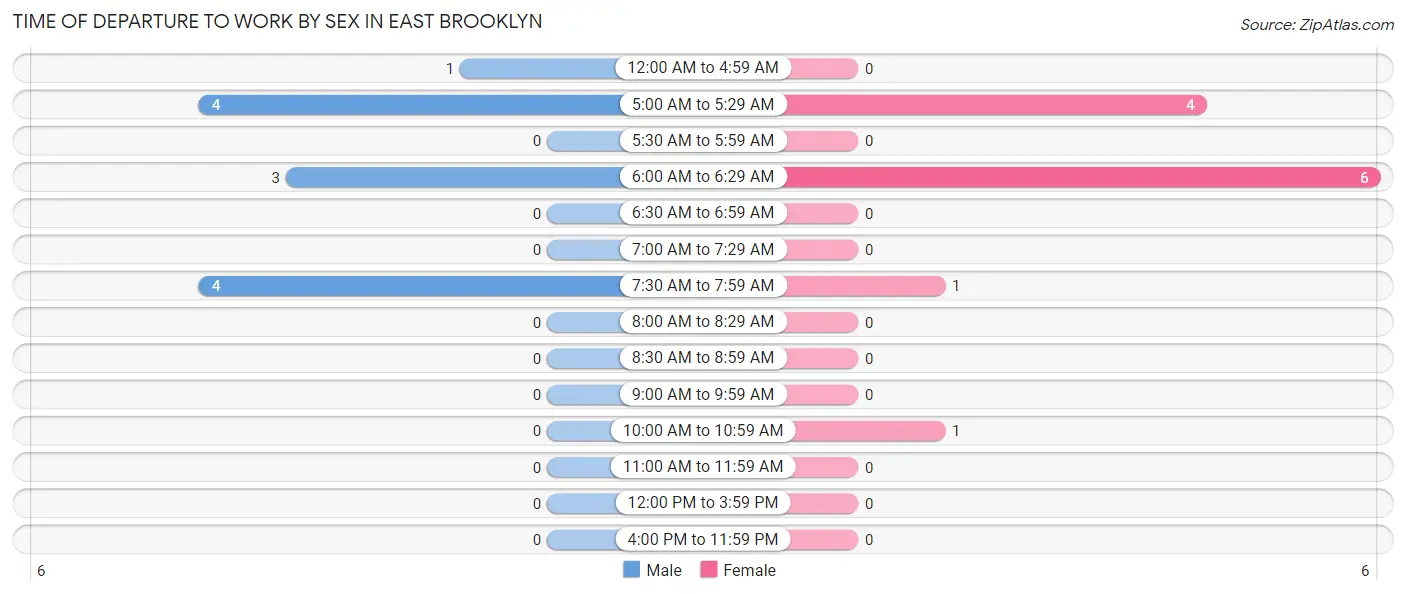
| Time of Departure | Male | Female |
| 12:00 AM to 4:59 AM | 1 (8.3%) | 0 (0.0%) |
| 5:00 AM to 5:29 AM | 4 (33.3%) | 4 (33.3%) |
| 5:30 AM to 5:59 AM | 0 (0.0%) | 0 (0.0%) |
| 6:00 AM to 6:29 AM | 3 (25.0%) | 6 (50.0%) |
| 6:30 AM to 6:59 AM | 0 (0.0%) | 0 (0.0%) |
| 7:00 AM to 7:29 AM | 0 (0.0%) | 0 (0.0%) |
| 7:30 AM to 7:59 AM | 4 (33.3%) | 1 (8.3%) |
| 8:00 AM to 8:29 AM | 0 (0.0%) | 0 (0.0%) |
| 8:30 AM to 8:59 AM | 0 (0.0%) | 0 (0.0%) |
| 9:00 AM to 9:59 AM | 0 (0.0%) | 0 (0.0%) |
| 10:00 AM to 10:59 AM | 0 (0.0%) | 1 (8.3%) |
| 11:00 AM to 11:59 AM | 0 (0.0%) | 0 (0.0%) |
| 12:00 PM to 3:59 PM | 0 (0.0%) | 0 (0.0%) |
| 4:00 PM to 11:59 PM | 0 (0.0%) | 0 (0.0%) |
| Total | 12 (100.0%) | 12 (100.0%) |
Housing Occupancy in East Brooklyn
Occupancy by Ownership in East Brooklyn
Of the total 33 dwellings in East Brooklyn, owner-occupied units account for 30 (90.9%), while renter-occupied units make up 3 (9.1%).
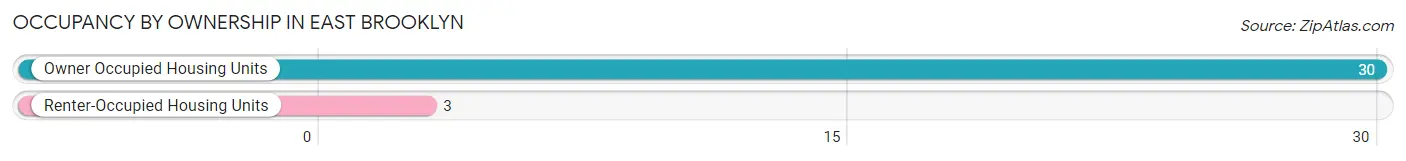
| Occupancy | # Housing Units | % Housing Units |
| Owner Occupied Housing Units | 30 | 90.9% |
| Renter-Occupied Housing Units | 3 | 9.1% |
| Total Occupied Housing Units | 33 | 100.0% |
Occupancy by Household Size in East Brooklyn
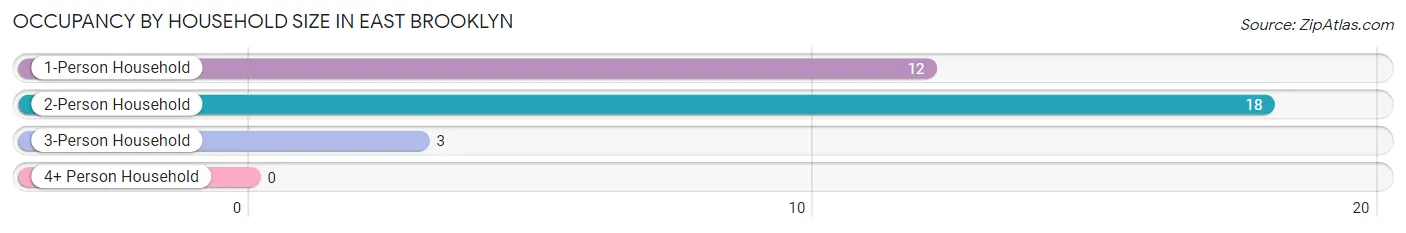
| Household Size | # Housing Units | % Housing Units |
| 1-Person Household | 12 | 36.4% |
| 2-Person Household | 18 | 54.5% |
| 3-Person Household | 3 | 9.1% |
| 4+ Person Household | 0 | 0.0% |
| Total Housing Units | 33 | 100.0% |
Occupancy by Ownership by Household Size in East Brooklyn
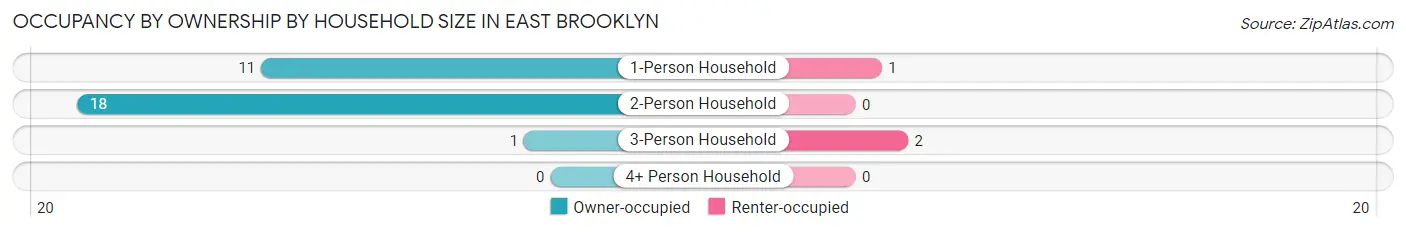
| Household Size | Owner-occupied | Renter-occupied |
| 1-Person Household | 11 (91.7%) | 1 (8.3%) |
| 2-Person Household | 18 (100.0%) | 0 (0.0%) |
| 3-Person Household | 1 (33.3%) | 2 (66.7%) |
| 4+ Person Household | 0 (0.0%) | 0 (0.0%) |
| Total Housing Units | 30 (90.9%) | 3 (9.1%) |
Occupancy by Educational Attainment in East Brooklyn
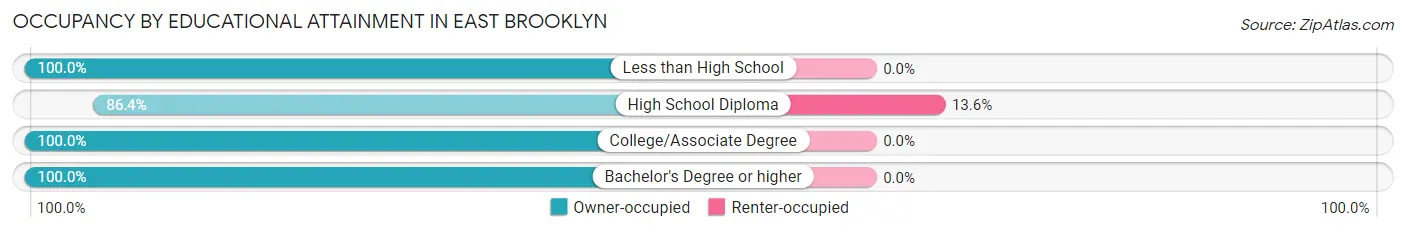
| Household Size | Owner-occupied | Renter-occupied |
| Less than High School | 2 (100.0%) | 0 (0.0%) |
| High School Diploma | 19 (86.4%) | 3 (13.6%) |
| College/Associate Degree | 2 (100.0%) | 0 (0.0%) |
| Bachelor's Degree or higher | 7 (100.0%) | 0 (0.0%) |
Occupancy by Age of Householder in East Brooklyn
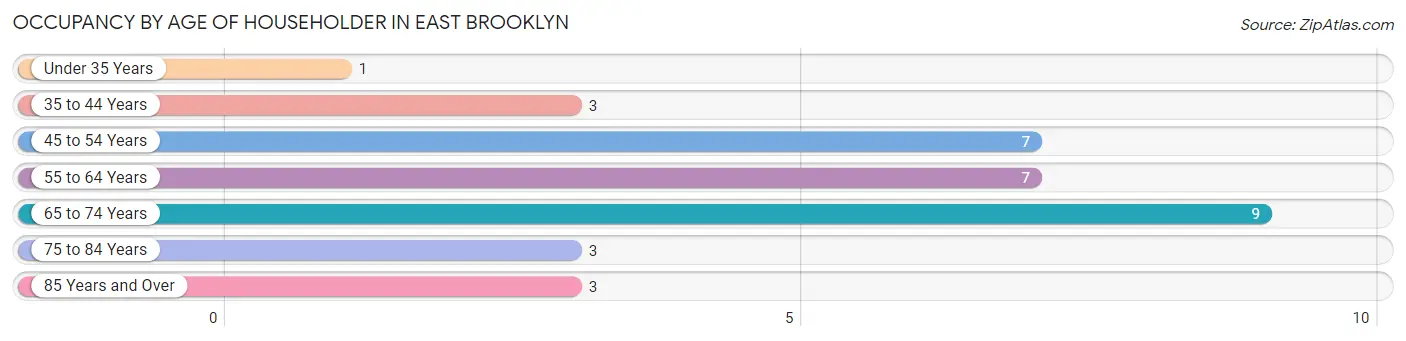
| Age Bracket | # Households | % Households |
| Under 35 Years | 1 | 3.0% |
| 35 to 44 Years | 3 | 9.1% |
| 45 to 54 Years | 7 | 21.2% |
| 55 to 64 Years | 7 | 21.2% |
| 65 to 74 Years | 9 | 27.3% |
| 75 to 84 Years | 3 | 9.1% |
| 85 Years and Over | 3 | 9.1% |
| Total | 33 | 100.0% |
Housing Finances in East Brooklyn
Median Income by Occupancy in East Brooklyn
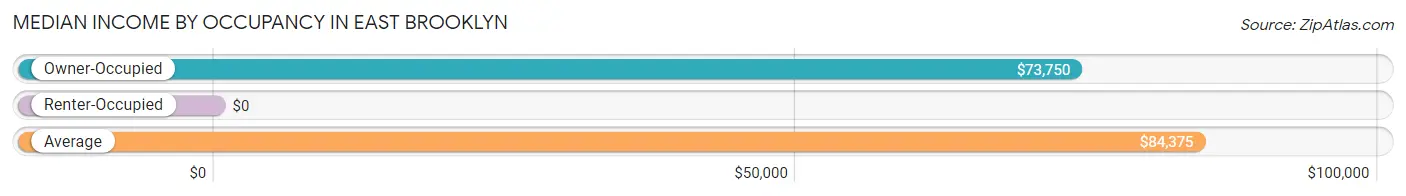
| Occupancy Type | # Households | Median Income |
| Owner-Occupied | 30 (90.9%) | $73,750 |
| Renter-Occupied | 3 (9.1%) | $0 |
| Average | 33 (100.0%) | $84,375 |
Occupancy by Householder Income Bracket in East Brooklyn
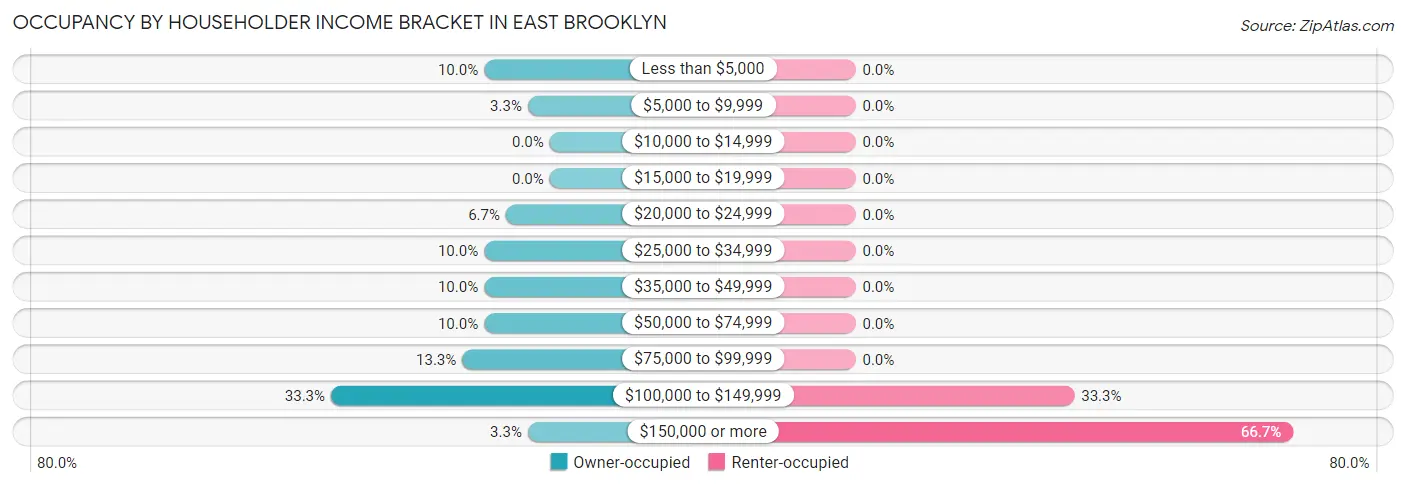
| Income Bracket | Owner-occupied | Renter-occupied |
| Less than $5,000 | 3 (10.0%) | 0 (0.0%) |
| $5,000 to $9,999 | 1 (3.3%) | 0 (0.0%) |
| $10,000 to $14,999 | 0 (0.0%) | 0 (0.0%) |
| $15,000 to $19,999 | 0 (0.0%) | 0 (0.0%) |
| $20,000 to $24,999 | 2 (6.7%) | 0 (0.0%) |
| $25,000 to $34,999 | 3 (10.0%) | 0 (0.0%) |
| $35,000 to $49,999 | 3 (10.0%) | 0 (0.0%) |
| $50,000 to $74,999 | 3 (10.0%) | 0 (0.0%) |
| $75,000 to $99,999 | 4 (13.3%) | 0 (0.0%) |
| $100,000 to $149,999 | 10 (33.3%) | 1 (33.3%) |
| $150,000 or more | 1 (3.3%) | 2 (66.7%) |
| Total | 30 (100.0%) | 3 (100.0%) |
Monthly Housing Cost Tiers in East Brooklyn
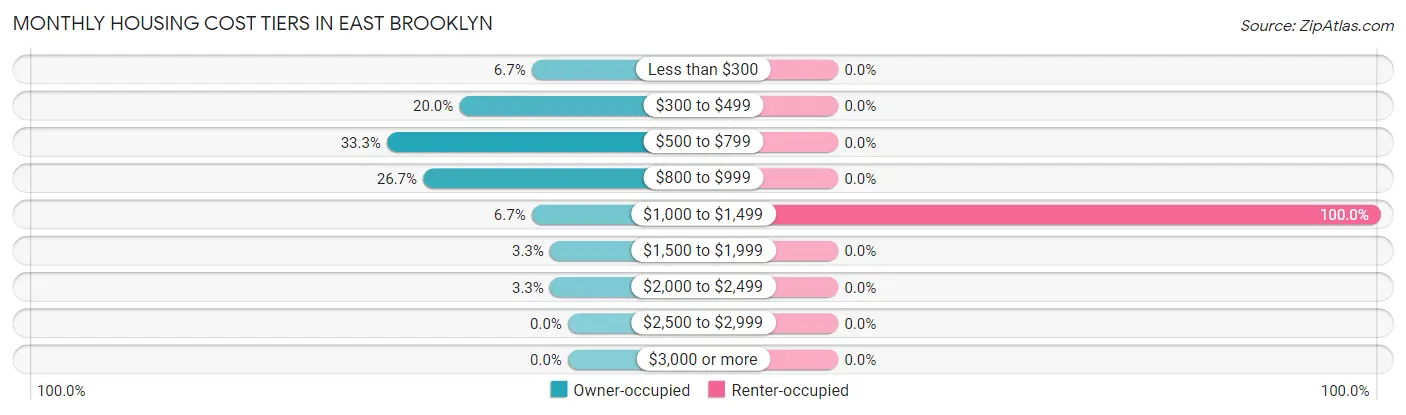
| Monthly Cost | Owner-occupied | Renter-occupied |
| Less than $300 | 2 (6.7%) | 0 (0.0%) |
| $300 to $499 | 6 (20.0%) | 0 (0.0%) |
| $500 to $799 | 10 (33.3%) | 0 (0.0%) |
| $800 to $999 | 8 (26.7%) | 0 (0.0%) |
| $1,000 to $1,499 | 2 (6.7%) | 3 (100.0%) |
| $1,500 to $1,999 | 1 (3.3%) | 0 (0.0%) |
| $2,000 to $2,499 | 1 (3.3%) | 0 (0.0%) |
| $2,500 to $2,999 | 0 (0.0%) | 0 (0.0%) |
| $3,000 or more | 0 (0.0%) | 0 (0.0%) |
| Total | 30 (100.0%) | 3 (100.0%) |
Physical Housing Characteristics in East Brooklyn
Housing Structures in East Brooklyn
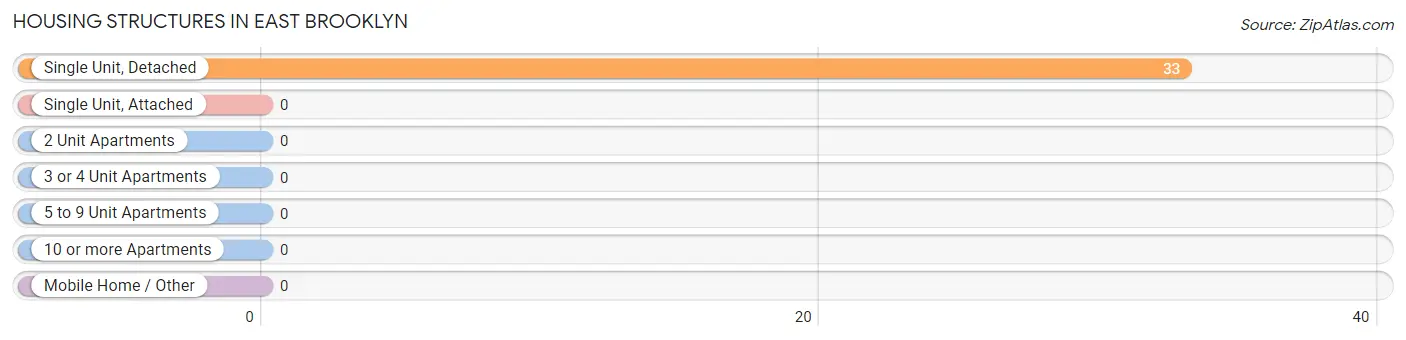
| Structure Type | # Housing Units | % Housing Units |
| Single Unit, Detached | 33 | 100.0% |
| Single Unit, Attached | 0 | 0.0% |
| 2 Unit Apartments | 0 | 0.0% |
| 3 or 4 Unit Apartments | 0 | 0.0% |
| 5 to 9 Unit Apartments | 0 | 0.0% |
| 10 or more Apartments | 0 | 0.0% |
| Mobile Home / Other | 0 | 0.0% |
| Total | 33 | 100.0% |
Housing Structures by Occupancy in East Brooklyn
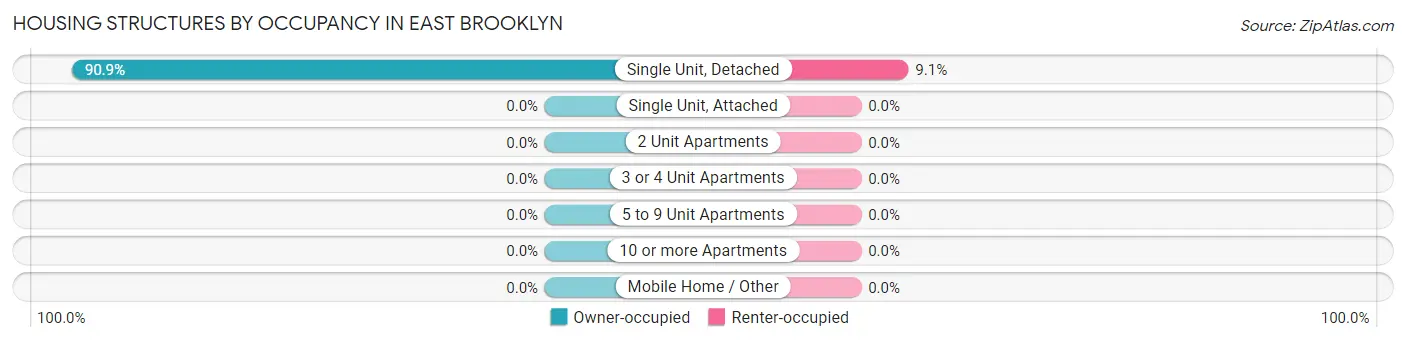
| Structure Type | Owner-occupied | Renter-occupied |
| Single Unit, Detached | 30 (90.9%) | 3 (9.1%) |
| Single Unit, Attached | 0 (0.0%) | 0 (0.0%) |
| 2 Unit Apartments | 0 (0.0%) | 0 (0.0%) |
| 3 or 4 Unit Apartments | 0 (0.0%) | 0 (0.0%) |
| 5 to 9 Unit Apartments | 0 (0.0%) | 0 (0.0%) |
| 10 or more Apartments | 0 (0.0%) | 0 (0.0%) |
| Mobile Home / Other | 0 (0.0%) | 0 (0.0%) |
| Total | 30 (90.9%) | 3 (9.1%) |
Housing Structures by Number of Rooms in East Brooklyn
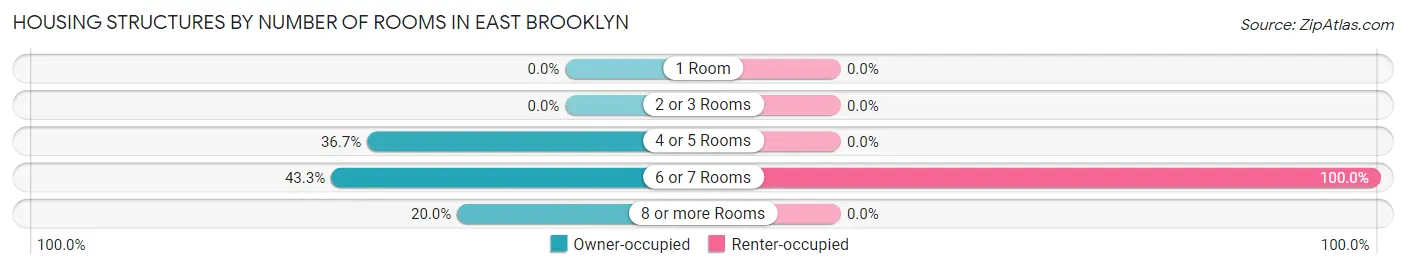
| Number of Rooms | Owner-occupied | Renter-occupied |
| 1 Room | 0 (0.0%) | 0 (0.0%) |
| 2 or 3 Rooms | 0 (0.0%) | 0 (0.0%) |
| 4 or 5 Rooms | 11 (36.7%) | 0 (0.0%) |
| 6 or 7 Rooms | 13 (43.3%) | 3 (100.0%) |
| 8 or more Rooms | 6 (20.0%) | 0 (0.0%) |
| Total | 30 (100.0%) | 3 (100.0%) |
Housing Structure by Heating Type in East Brooklyn
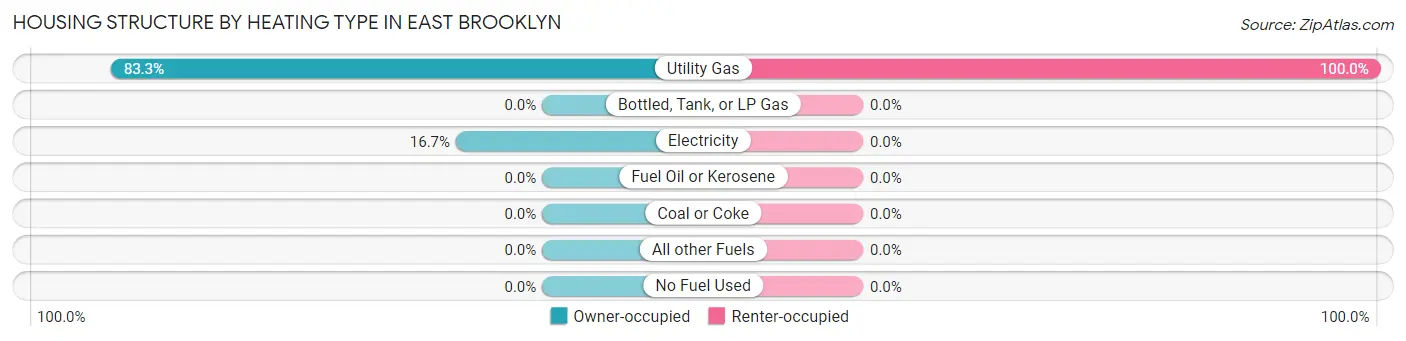
| Heating Type | Owner-occupied | Renter-occupied |
| Utility Gas | 25 (83.3%) | 3 (100.0%) |
| Bottled, Tank, or LP Gas | 0 (0.0%) | 0 (0.0%) |
| Electricity | 5 (16.7%) | 0 (0.0%) |
| Fuel Oil or Kerosene | 0 (0.0%) | 0 (0.0%) |
| Coal or Coke | 0 (0.0%) | 0 (0.0%) |
| All other Fuels | 0 (0.0%) | 0 (0.0%) |
| No Fuel Used | 0 (0.0%) | 0 (0.0%) |
| Total | 30 (100.0%) | 3 (100.0%) |
Household Vehicle Usage in East Brooklyn
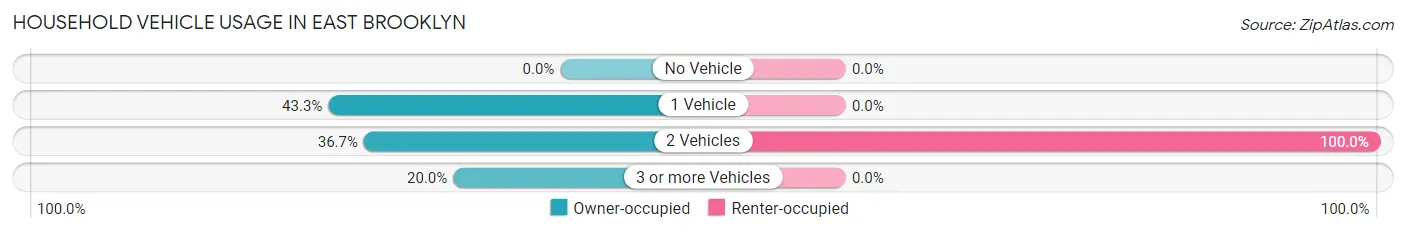
| Vehicles per Household | Owner-occupied | Renter-occupied |
| No Vehicle | 0 (0.0%) | 0 (0.0%) |
| 1 Vehicle | 13 (43.3%) | 0 (0.0%) |
| 2 Vehicles | 11 (36.7%) | 3 (100.0%) |
| 3 or more Vehicles | 6 (20.0%) | 0 (0.0%) |
| Total | 30 (100.0%) | 3 (100.0%) |
Real Estate & Mortgages in East Brooklyn
Real Estate and Mortgage Overview in East Brooklyn
| Characteristic | Without Mortgage | With Mortgage |
| Housing Units | 19 | 11 |
| Median Property Value | $208,300 | $137,500 |
| Median Household Income | $42,083 | $1 |
| Monthly Housing Costs | $638 | $0 |
| Real Estate Taxes | - | - |
Property Value by Mortgage Status in East Brooklyn
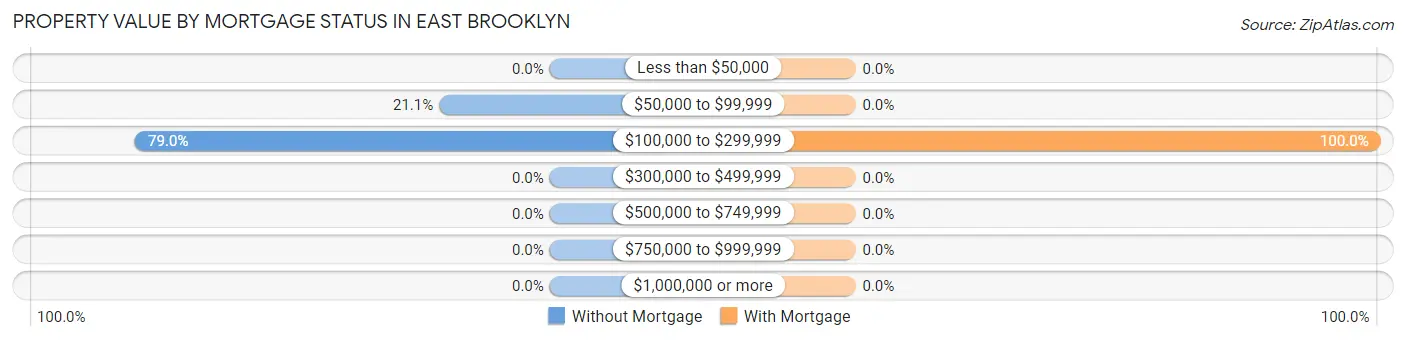
| Property Value | Without Mortgage | With Mortgage |
| Less than $50,000 | 0 (0.0%) | 0 (0.0%) |
| $50,000 to $99,999 | 4 (21.0%) | 0 (0.0%) |
| $100,000 to $299,999 | 15 (78.9%) | 11 (100.0%) |
| $300,000 to $499,999 | 0 (0.0%) | 0 (0.0%) |
| $500,000 to $749,999 | 0 (0.0%) | 0 (0.0%) |
| $750,000 to $999,999 | 0 (0.0%) | 0 (0.0%) |
| $1,000,000 or more | 0 (0.0%) | 0 (0.0%) |
| Total | 19 (100.0%) | 11 (100.0%) |
Household Income by Mortgage Status in East Brooklyn
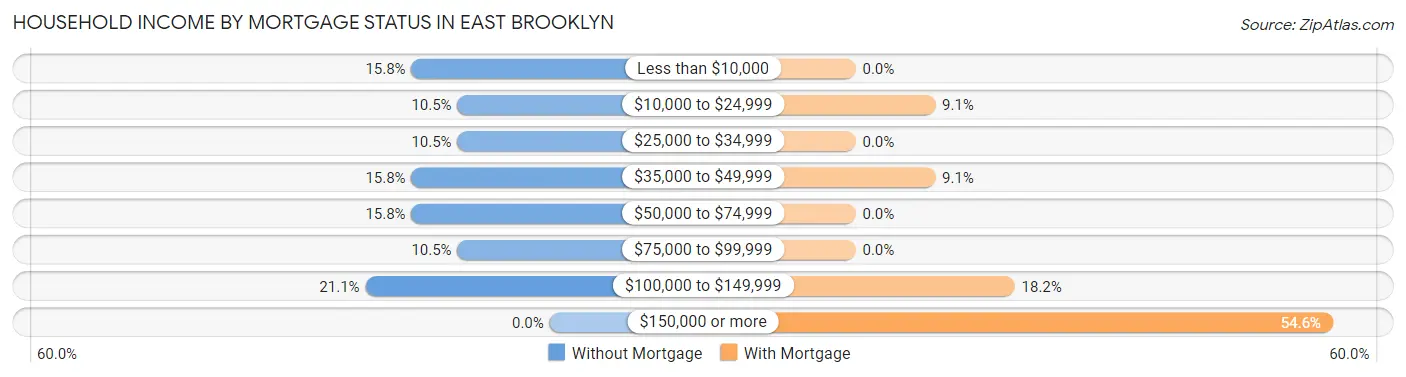
| Household Income | Without Mortgage | With Mortgage |
| Less than $10,000 | 3 (15.8%) | 0 (0.0%) |
| $10,000 to $24,999 | 2 (10.5%) | 1 (9.1%) |
| $25,000 to $34,999 | 2 (10.5%) | 0 (0.0%) |
| $35,000 to $49,999 | 3 (15.8%) | 1 (9.1%) |
| $50,000 to $74,999 | 3 (15.8%) | 0 (0.0%) |
| $75,000 to $99,999 | 2 (10.5%) | 0 (0.0%) |
| $100,000 to $149,999 | 4 (21.0%) | 2 (18.2%) |
| $150,000 or more | 0 (0.0%) | 6 (54.5%) |
| Total | 19 (100.0%) | 11 (100.0%) |
Property Value to Household Income Ratio in East Brooklyn
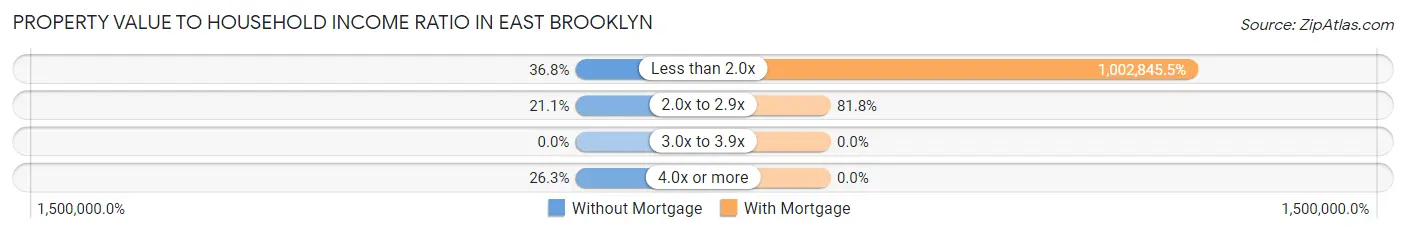
| Value-to-Income Ratio | Without Mortgage | With Mortgage |
| Less than 2.0x | 7 (36.8%) | 110,313 (1,002,845.4%) |
| 2.0x to 2.9x | 4 (21.0%) | 9 (81.8%) |
| 3.0x to 3.9x | 0 (0.0%) | 0 (0.0%) |
| 4.0x or more | 5 (26.3%) | 0 (0.0%) |
| Total | 19 (100.0%) | 11 (100.0%) |
Real Estate Taxes by Mortgage Status in East Brooklyn
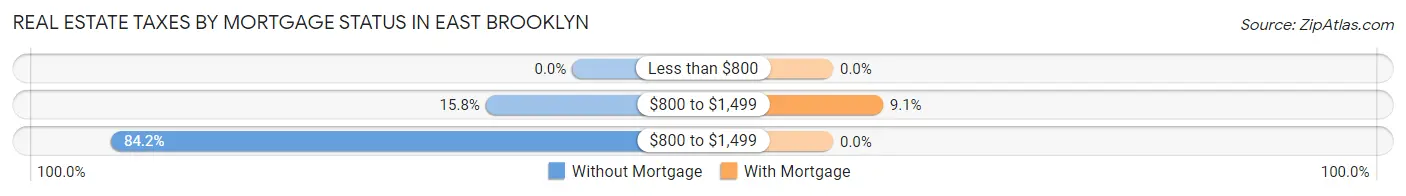
| Property Taxes | Without Mortgage | With Mortgage |
| Less than $800 | 0 (0.0%) | 0 (0.0%) |
| $800 to $1,499 | 3 (15.8%) | 1 (9.1%) |
| $800 to $1,499 | 16 (84.2%) | 0 (0.0%) |
| Total | 19 (100.0%) | 11 (100.0%) |
Health & Disability in East Brooklyn
Health Insurance Coverage by Age in East Brooklyn
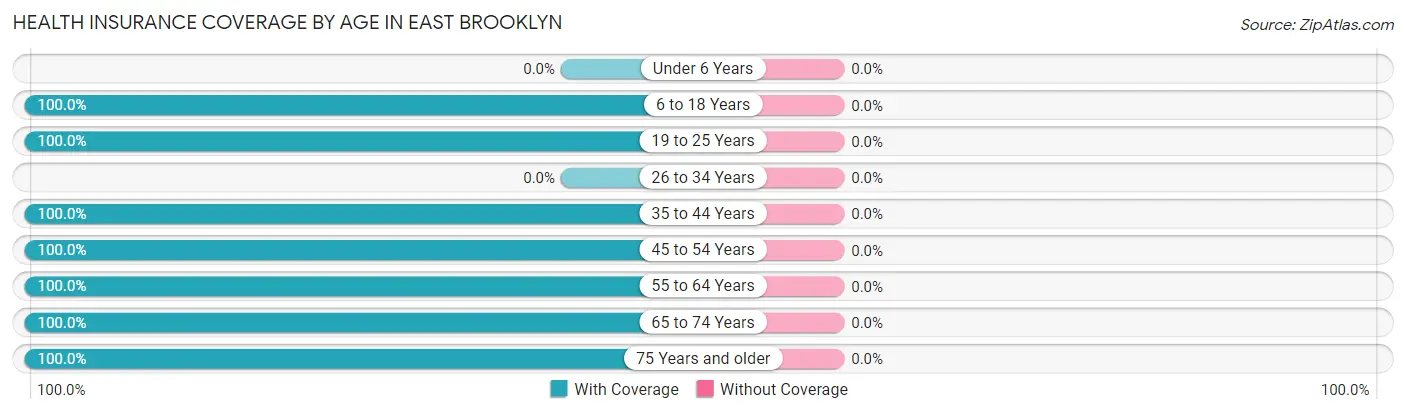
| Age Bracket | With Coverage | Without Coverage |
| Under 6 Years | 0 (0.0%) | 0 (0.0%) |
| 6 to 18 Years | 1 (100.0%) | 0 (0.0%) |
| 19 to 25 Years | 4 (100.0%) | 0 (0.0%) |
| 26 to 34 Years | 0 (0.0%) | 0 (0.0%) |
| 35 to 44 Years | 7 (100.0%) | 0 (0.0%) |
| 45 to 54 Years | 12 (100.0%) | 0 (0.0%) |
| 55 to 64 Years | 10 (100.0%) | 0 (0.0%) |
| 65 to 74 Years | 13 (100.0%) | 0 (0.0%) |
| 75 Years and older | 8 (100.0%) | 0 (0.0%) |
| Total | 55 (100.0%) | 0 (0.0%) |
Health Insurance Coverage by Citizenship Status in East Brooklyn
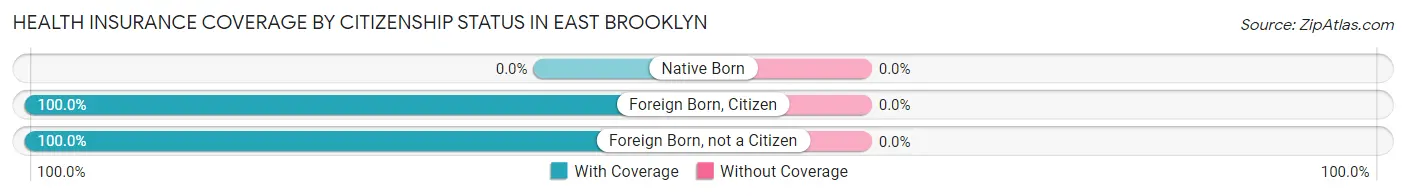
| Citizenship Status | With Coverage | Without Coverage |
| Native Born | 0 (0.0%) | 0 (0.0%) |
| Foreign Born, Citizen | 1 (100.0%) | 0 (0.0%) |
| Foreign Born, not a Citizen | 4 (100.0%) | 0 (0.0%) |
Health Insurance Coverage by Household Income in East Brooklyn
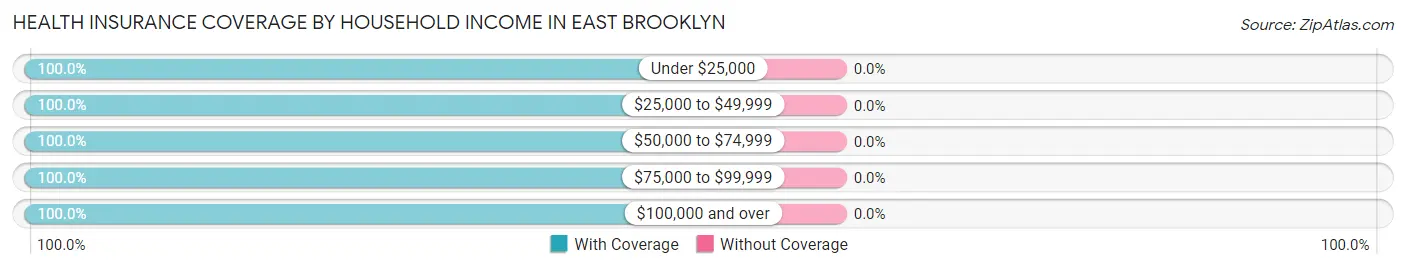
| Household Income | With Coverage | Without Coverage |
| Under $25,000 | 9 (100.0%) | 0 (0.0%) |
| $25,000 to $49,999 | 6 (100.0%) | 0 (0.0%) |
| $50,000 to $74,999 | 5 (100.0%) | 0 (0.0%) |
| $75,000 to $99,999 | 6 (100.0%) | 0 (0.0%) |
| $100,000 and over | 29 (100.0%) | 0 (0.0%) |
Public vs Private Health Insurance Coverage by Age in East Brooklyn
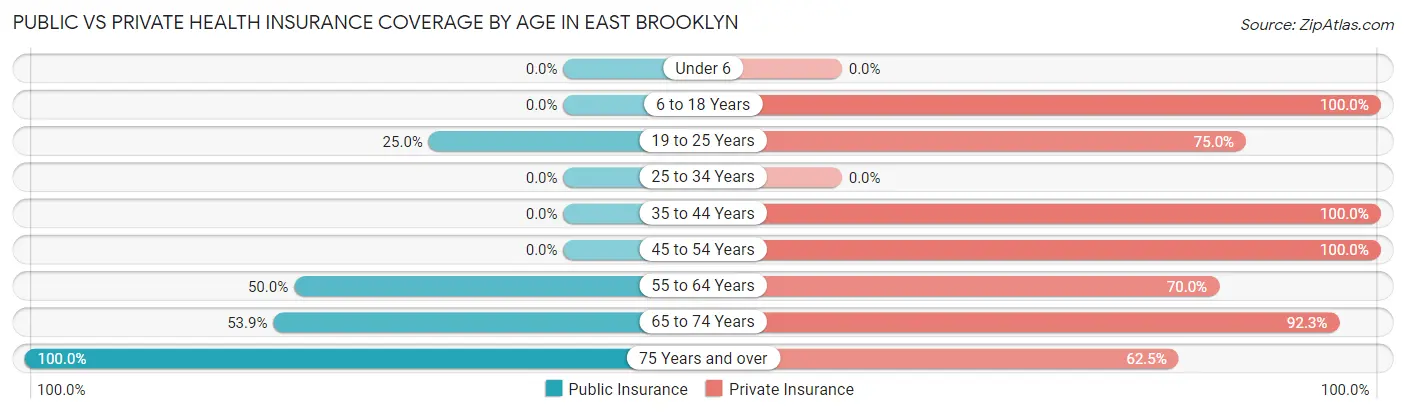
| Age Bracket | Public Insurance | Private Insurance |
| Under 6 | 0 (0.0%) | 0 (0.0%) |
| 6 to 18 Years | 0 (0.0%) | 1 (100.0%) |
| 19 to 25 Years | 1 (25.0%) | 3 (75.0%) |
| 25 to 34 Years | 0 (0.0%) | 0 (0.0%) |
| 35 to 44 Years | 0 (0.0%) | 7 (100.0%) |
| 45 to 54 Years | 0 (0.0%) | 12 (100.0%) |
| 55 to 64 Years | 5 (50.0%) | 7 (70.0%) |
| 65 to 74 Years | 7 (53.8%) | 12 (92.3%) |
| 75 Years and over | 8 (100.0%) | 5 (62.5%) |
| Total | 21 (38.2%) | 47 (85.5%) |
Disability Status by Sex by Age in East Brooklyn
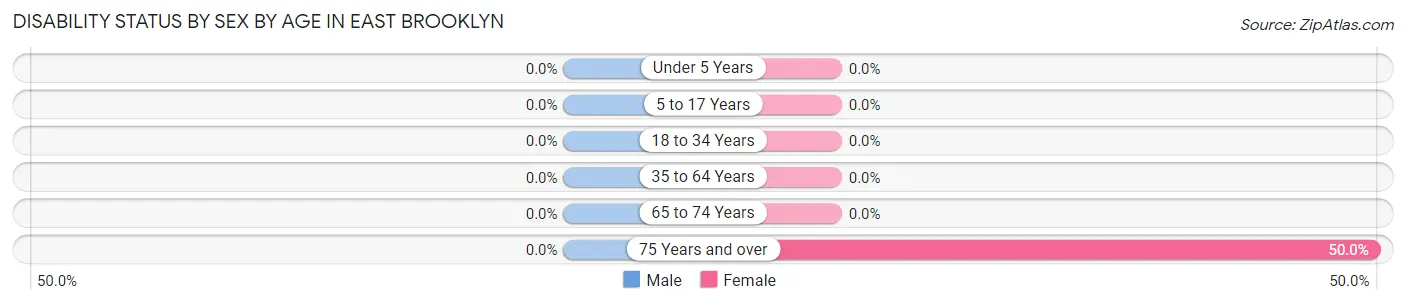
| Age Bracket | Male | Female |
| Under 5 Years | 0 (0.0%) | 0 (0.0%) |
| 5 to 17 Years | 0 (0.0%) | 0 (0.0%) |
| 18 to 34 Years | 0 (0.0%) | 0 (0.0%) |
| 35 to 64 Years | 0 (0.0%) | 0 (0.0%) |
| 65 to 74 Years | 0 (0.0%) | 0 (0.0%) |
| 75 Years and over | 0 (0.0%) | 3 (50.0%) |
Disability Class by Sex by Age in East Brooklyn
Disability Class: Hearing Difficulty
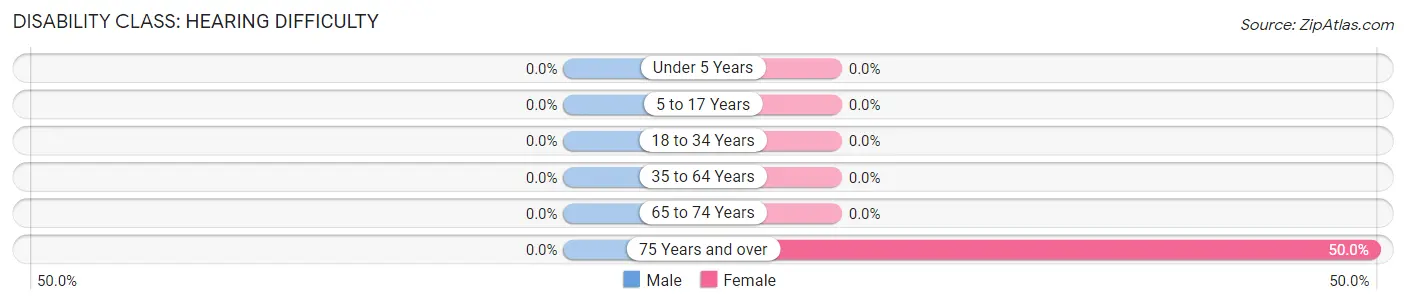
| Age Bracket | Male | Female |
| Under 5 Years | 0 (0.0%) | 0 (0.0%) |
| 5 to 17 Years | 0 (0.0%) | 0 (0.0%) |
| 18 to 34 Years | 0 (0.0%) | 0 (0.0%) |
| 35 to 64 Years | 0 (0.0%) | 0 (0.0%) |
| 65 to 74 Years | 0 (0.0%) | 0 (0.0%) |
| 75 Years and over | 0 (0.0%) | 3 (50.0%) |
Disability Class: Vision Difficulty
| Age Bracket | Male | Female |
| Under 5 Years | 0 (0.0%) | 0 (0.0%) |
| 5 to 17 Years | 0 (0.0%) | 0 (0.0%) |
| 18 to 34 Years | 0 (0.0%) | 0 (0.0%) |
| 35 to 64 Years | 0 (0.0%) | 0 (0.0%) |
| 65 to 74 Years | 0 (0.0%) | 0 (0.0%) |
| 75 Years and over | 0 (0.0%) | 0 (0.0%) |
Disability Class: Cognitive Difficulty
| Age Bracket | Male | Female |
| 5 to 17 Years | 0 (0.0%) | 0 (0.0%) |
| 18 to 34 Years | 0 (0.0%) | 0 (0.0%) |
| 35 to 64 Years | 0 (0.0%) | 0 (0.0%) |
| 65 to 74 Years | 0 (0.0%) | 0 (0.0%) |
| 75 Years and over | 0 (0.0%) | 0 (0.0%) |
Disability Class: Ambulatory Difficulty
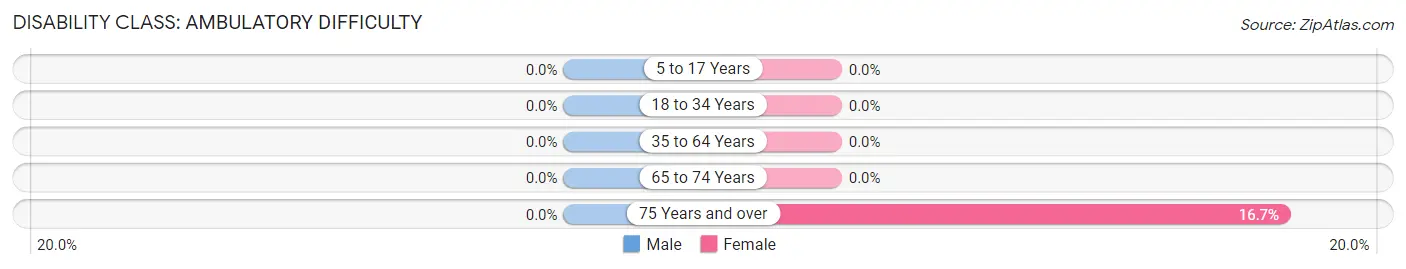
| Age Bracket | Male | Female |
| 5 to 17 Years | 0 (0.0%) | 0 (0.0%) |
| 18 to 34 Years | 0 (0.0%) | 0 (0.0%) |
| 35 to 64 Years | 0 (0.0%) | 0 (0.0%) |
| 65 to 74 Years | 0 (0.0%) | 0 (0.0%) |
| 75 Years and over | 0 (0.0%) | 1 (16.7%) |
Disability Class: Self-Care Difficulty
| Age Bracket | Male | Female |
| 5 to 17 Years | 0 (0.0%) | 0 (0.0%) |
| 18 to 34 Years | 0 (0.0%) | 0 (0.0%) |
| 35 to 64 Years | 0 (0.0%) | 0 (0.0%) |
| 65 to 74 Years | 0 (0.0%) | 0 (0.0%) |
| 75 Years and over | 0 (0.0%) | 0 (0.0%) |
Technology Access in East Brooklyn
Computing Device Access in East Brooklyn
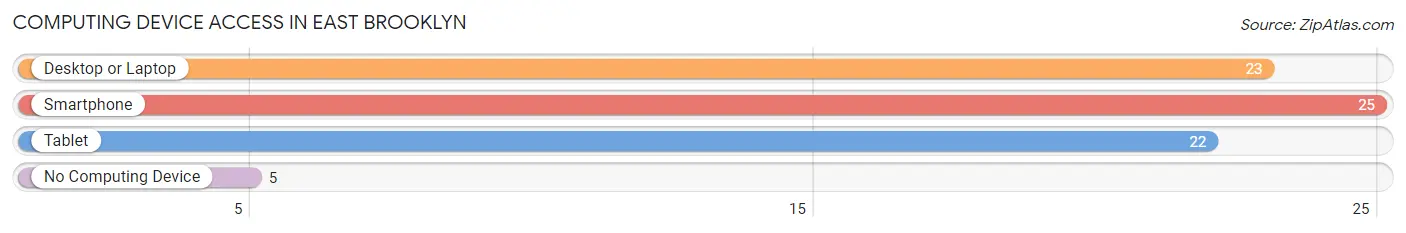
| Device Type | # Households | % Households |
| Desktop or Laptop | 23 | 69.7% |
| Smartphone | 25 | 75.8% |
| Tablet | 22 | 66.7% |
| No Computing Device | 5 | 15.1% |
| Total | 33 | 100.0% |
Internet Access in East Brooklyn
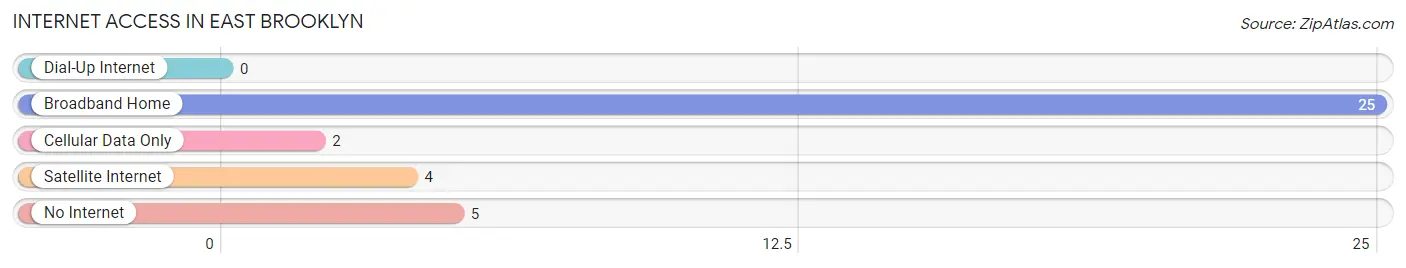
| Internet Type | # Households | % Households |
| Dial-Up Internet | 0 | 0.0% |
| Broadband Home | 25 | 75.8% |
| Cellular Data Only | 2 | 6.1% |
| Satellite Internet | 4 | 12.1% |
| No Internet | 5 | 15.1% |
| Total | 33 | 100.0% |
East Brooklyn Summary
East Brooklyn, Illinois is a small village located in the northeastern corner of the state, in the county of Cook. It is situated on the banks of the Des Plaines River, and is bordered by the towns of Park Ridge, Niles, and Morton Grove. The village has a population of approximately 1,500 people, and is part of the Chicago metropolitan area.
History
East Brooklyn was first settled in the early 1800s by a group of German immigrants. The village was originally known as “New Berlin”, and was incorporated in 1872. The village was renamed East Brooklyn in 1891, in honor of the Brooklyn neighborhood in New York City.
In the late 19th century, East Brooklyn was a thriving agricultural community, with many farms and orchards. The village was also home to a number of small businesses, including a brickyard, a sawmill, and a blacksmith shop.
In the early 20th century, East Brooklyn began to experience a period of growth and development. The village was connected to the Chicago and North Western Railway in 1906, and the population began to increase. The village was also home to a number of small factories, including a canning factory, a furniture factory, and a paper mill.
Geography
East Brooklyn is located in the northeastern corner of the state of Illinois, in Cook County. The village is situated on the banks of the Des Plaines River, and is bordered by the towns of Park Ridge, Niles, and Morton Grove. The village covers an area of approximately 1.2 square miles, and has a population of approximately 1,500 people.
The village is located in a region of rolling hills and wooded areas, and is home to a number of parks and recreational areas. The village is also home to a number of historic sites, including the East Brooklyn Historic District, which is listed on the National Register of Historic Places.
Economy
East Brooklyn is a primarily residential community, and the majority of the village’s residents are employed in the service sector. The village is home to a number of small businesses, including restaurants, retail stores, and professional services. The village is also home to a number of manufacturing companies, including a furniture factory, a paper mill, and a canning factory.
Demographics
As of the 2010 census, the population of East Brooklyn was 1,500 people. The racial makeup of the village was 94.7% White, 1.3% African American, 0.7% Asian, 0.3% Native American, and 2.7% from other races. The median household income was $50,000, and the median family income was $60,000.
Conclusion
East Brooklyn, Illinois is a small village located in the northeastern corner of the state, in the county of Cook. It is situated on the banks of the Des Plaines River, and is bordered by the towns of Park Ridge, Niles, and Morton Grove. The village has a population of approximately 1,500 people, and is part of the Chicago metropolitan area. The village is primarily residential, and the majority of the village’s residents are employed in the service sector. The village is also home to a number of small businesses, including restaurants, retail stores, and professional services. The village is also home to a number of historic sites, including the East Brooklyn Historic District, which is listed on the National Register of Historic Places.
Common Questions
What is Per Capita Income in East Brooklyn?
Per Capita income in East Brooklyn is $47,624.
What is the Median Family Income in East Brooklyn?
Median Family Income in East Brooklyn is $89,375.
What is the Median Household income in East Brooklyn?
Median Household Income in East Brooklyn is $84,375.
What is Inequality or Gini Index in East Brooklyn?
Inequality or Gini Index in East Brooklyn is 0.38.
What is the Total Population of East Brooklyn?
Total Population of East Brooklyn is 55.
What is the Total Male Population of East Brooklyn?
Total Male Population of East Brooklyn is 24.
What is the Total Female Population of East Brooklyn?
Total Female Population of East Brooklyn is 31.
What is the Ratio of Males per 100 Females in East Brooklyn?
There are 77.42 Males per 100 Females in East Brooklyn.
What is the Ratio of Females per 100 Males in East Brooklyn?
There are 129.17 Females per 100 Males in East Brooklyn.
What is the Median Population Age in East Brooklyn?
Median Population Age in East Brooklyn is 61.3 Years.
What is the Average Family Size in East Brooklyn
Average Family Size in East Brooklyn is 2.0 People.
What is the Average Household Size in East Brooklyn
Average Household Size in East Brooklyn is 1.7 People.
How Large is the Labor Force in East Brooklyn?
There are 28 People in the Labor Forcein in East Brooklyn.
What is the Percentage of People in the Labor Force in East Brooklyn?
51.9% of People are in the Labor Force in East Brooklyn.
What is the Unemployment Rate in East Brooklyn?
Unemployment Rate in East Brooklyn is 10.7%.