Heritage Lake, IL Map & Demographics
Heritage Lake Map
Heritage Lake Overview
$44,553
PER CAPITA INCOME
$126,538
AVG FAMILY INCOME
$123,169
AVG HOUSEHOLD INCOME
31.3%
WAGE / INCOME GAP [ % ]
68.7¢/ $1
WAGE / INCOME GAP [ $ ]
0.23
INEQUALITY / GINI INDEX
1,595
TOTAL POPULATION
838
MALE POPULATION
757
FEMALE POPULATION
110.70
MALES / 100 FEMALES
90.33
FEMALES / 100 MALES
37.8
MEDIAN AGE
3.0
AVG FAMILY SIZE
2.9
AVG HOUSEHOLD SIZE
805
LABOR FORCE [ PEOPLE ]
67.8%
PERCENT IN LABOR FORCE
Income in Heritage Lake
Income Overview in Heritage Lake
Per Capita Income in Heritage Lake is $44,553, while median incomes of families and households are $126,538 and $123,169 respectively.
| Characteristic | Number | Measure |
| Per Capita Income | 1,595 | $44,553 |
| Median Family Income | 478 | $126,538 |
| Mean Family Income | 478 | $126,192 |
| Median Household Income | 557 | $123,169 |
| Mean Household Income | 557 | $125,967 |
| Income Deficit | 478 | $0 |
| Wage / Income Gap (%) | 1,595 | 31.34% |
| Wage / Income Gap ($) | 1,595 | 68.66¢ per $1 |
| Gini / Inequality Index | 1,595 | 0.23 |
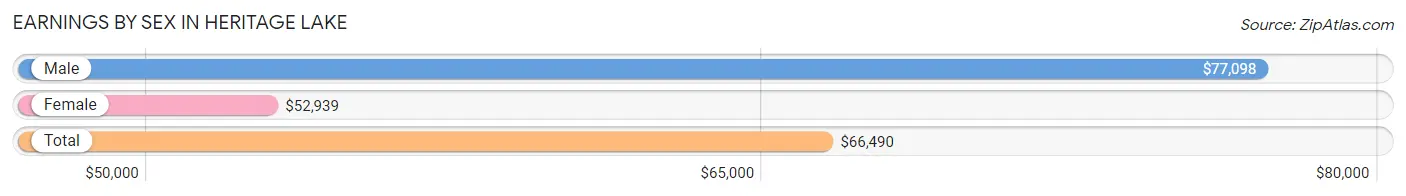
Earnings by Sex in Heritage Lake
Average Earnings in Heritage Lake are $66,490, $77,098 for men and $52,939 for women, a difference of 31.3%.
| Sex | Number | Average Earnings |
| Male | 471 (57.8%) | $77,098 |
| Female | 344 (42.2%) | $52,939 |
| Total | 815 (100.0%) | $66,490 |
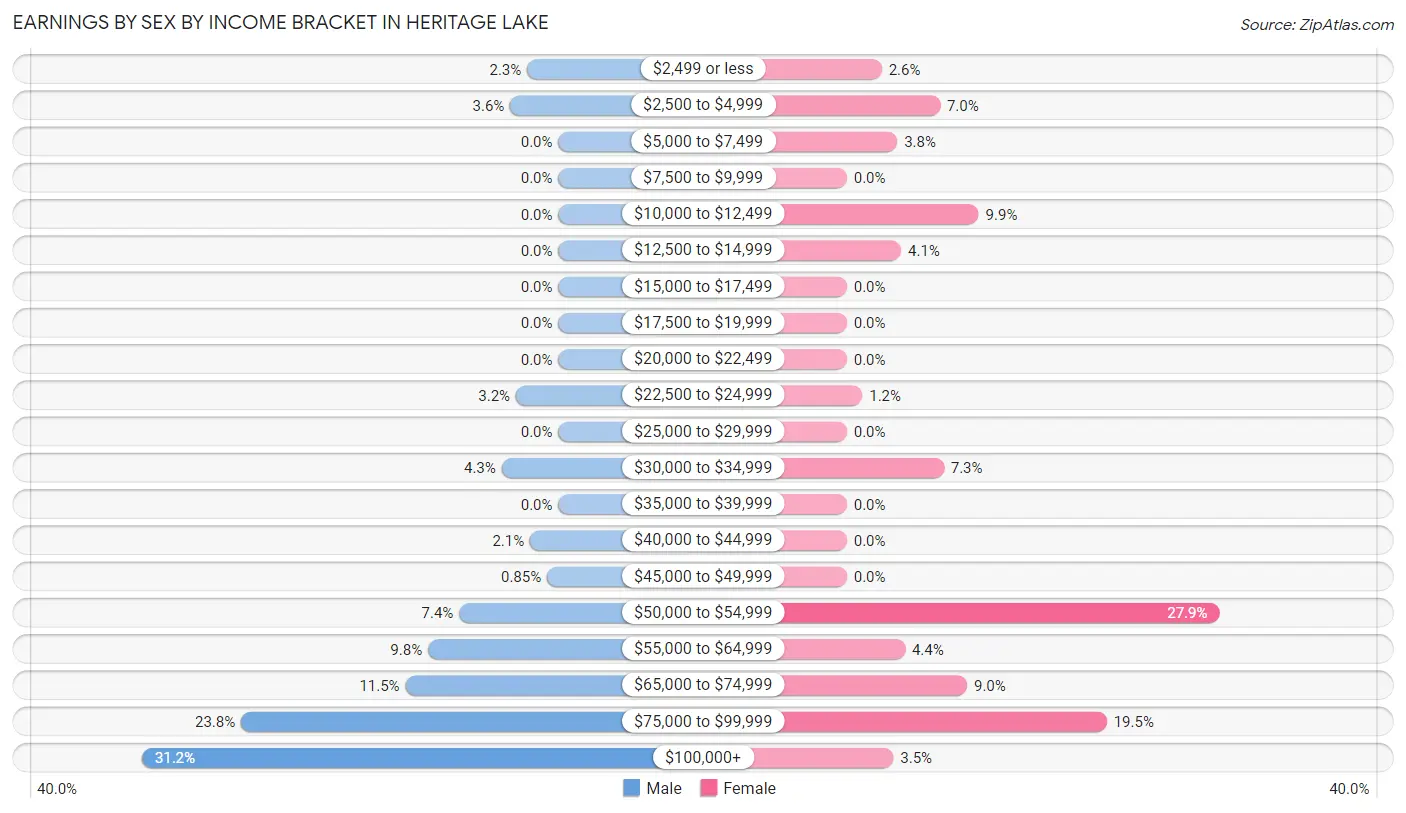
Earnings by Sex by Income Bracket in Heritage Lake
The most common earnings brackets in Heritage Lake are $100,000+ for men (147 | 31.2%) and $50,000 to $54,999 for women (96 | 27.9%).
| Income | Male | Female |
| $2,499 or less | 11 (2.3%) | 9 (2.6%) |
| $2,500 to $4,999 | 17 (3.6%) | 24 (7.0%) |
| $5,000 to $7,499 | 0 (0.0%) | 13 (3.8%) |
| $7,500 to $9,999 | 0 (0.0%) | 0 (0.0%) |
| $10,000 to $12,499 | 0 (0.0%) | 34 (9.9%) |
| $12,500 to $14,999 | 0 (0.0%) | 14 (4.1%) |
| $15,000 to $17,499 | 0 (0.0%) | 0 (0.0%) |
| $17,500 to $19,999 | 0 (0.0%) | 0 (0.0%) |
| $20,000 to $22,499 | 0 (0.0%) | 0 (0.0%) |
| $22,500 to $24,999 | 15 (3.2%) | 4 (1.2%) |
| $25,000 to $29,999 | 0 (0.0%) | 0 (0.0%) |
| $30,000 to $34,999 | 20 (4.3%) | 25 (7.3%) |
| $35,000 to $39,999 | 0 (0.0%) | 0 (0.0%) |
| $40,000 to $44,999 | 10 (2.1%) | 0 (0.0%) |
| $45,000 to $49,999 | 4 (0.9%) | 0 (0.0%) |
| $50,000 to $54,999 | 35 (7.4%) | 96 (27.9%) |
| $55,000 to $64,999 | 46 (9.8%) | 15 (4.4%) |
| $65,000 to $74,999 | 54 (11.5%) | 31 (9.0%) |
| $75,000 to $99,999 | 112 (23.8%) | 67 (19.5%) |
| $100,000+ | 147 (31.2%) | 12 (3.5%) |
| Total | 471 (100.0%) | 344 (100.0%) |
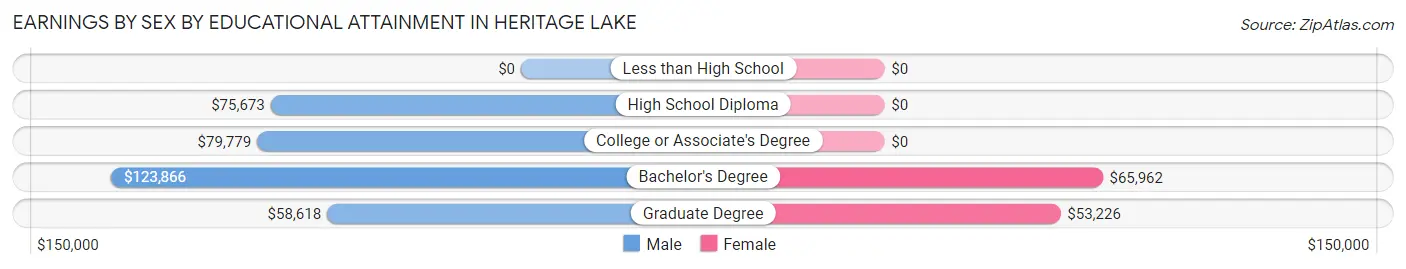
Earnings by Sex by Educational Attainment in Heritage Lake
Average earnings in Heritage Lake are $80,455 for men and $53,969 for women, a difference of 32.9%. Men with an educational attainment of bachelor's degree enjoy the highest average annual earnings of $123,866, while those with graduate degree education earn the least with $58,618. Women with an educational attainment of bachelor's degree earn the most with the average annual earnings of $65,962, while those with graduate degree education have the smallest earnings of $53,226.
| Educational Attainment | Male Income | Female Income |
| Less than High School | - | - |
| High School Diploma | $75,673 | $0 |
| College or Associate's Degree | $79,779 | $0 |
| Bachelor's Degree | $123,866 | $65,962 |
| Graduate Degree | $58,618 | $53,226 |
| Total | $80,455 | $53,969 |
Family Income in Heritage Lake
Family Income Brackets in Heritage Lake
According to the Heritage Lake family income data, there are 179 families falling into the $100,000 to $149,999 income range, which is the most common income bracket and makes up 37.4% of all families.
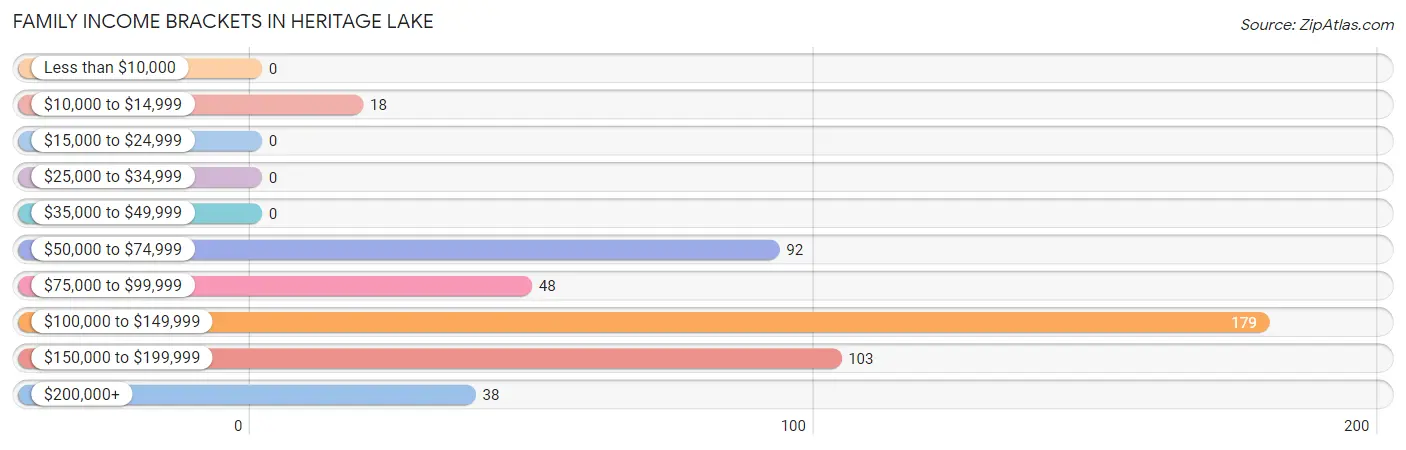
| Income Bracket | # Families | % Families |
| Less than $10,000 | 0 | 0.0% |
| $10,000 to $14,999 | 18 | 3.8% |
| $15,000 to $24,999 | 0 | 0.0% |
| $25,000 to $34,999 | 0 | 0.0% |
| $35,000 to $49,999 | 0 | 0.0% |
| $50,000 to $74,999 | 92 | 19.2% |
| $75,000 to $99,999 | 48 | 10.0% |
| $100,000 to $149,999 | 179 | 37.4% |
| $150,000 to $199,999 | 103 | 21.5% |
| $200,000+ | 38 | 7.9% |
Family Income by Famaliy Size in Heritage Lake
4-person families (94 | 19.7%) account for the highest median family income in Heritage Lake with $155,769 per family, while 2-person families (217 | 45.4%) have the highest median income of $54,032 per family member.
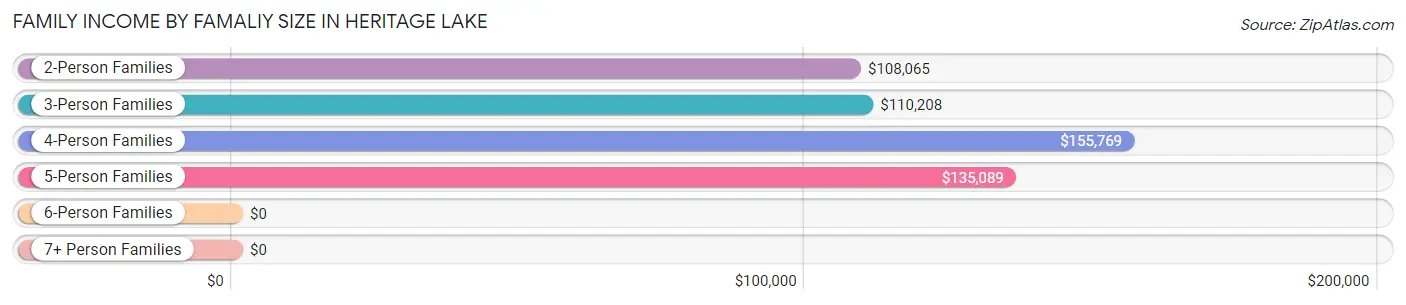
| Income Bracket | # Families | Median Income |
| 2-Person Families | 217 (45.4%) | $108,065 |
| 3-Person Families | 113 (23.6%) | $110,208 |
| 4-Person Families | 94 (19.7%) | $155,769 |
| 5-Person Families | 54 (11.3%) | $135,089 |
| 6-Person Families | 0 (0.0%) | $0 |
| 7+ Person Families | 0 (0.0%) | $0 |
| Total | 478 (100.0%) | $126,538 |
Family Income by Number of Earners in Heritage Lake
The median family income in Heritage Lake is $126,538, with families comprising 3+ earners (50) having the highest median family income of $158,790, while families with no earners (88) have the lowest median family income of $60,921, accounting for 10.5% and 18.4% of families, respectively.
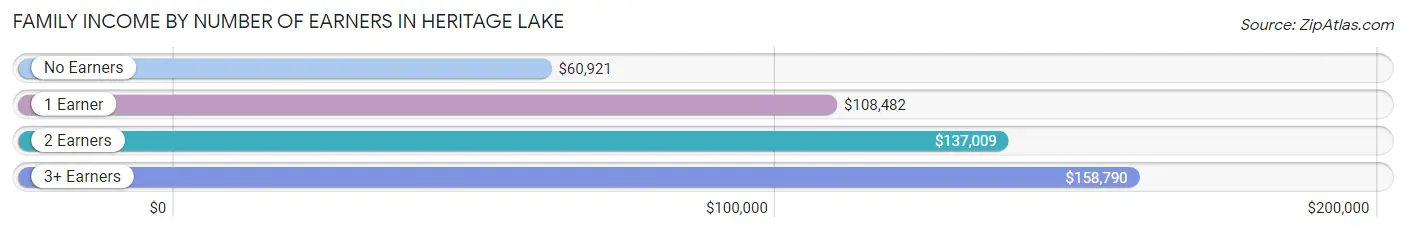
| Number of Earners | # Families | Median Income |
| No Earners | 88 (18.4%) | $60,921 |
| 1 Earner | 163 (34.1%) | $108,482 |
| 2 Earners | 177 (37.0%) | $137,009 |
| 3+ Earners | 50 (10.5%) | $158,790 |
| Total | 478 (100.0%) | $126,538 |
Household Income in Heritage Lake
Household Income Brackets in Heritage Lake
With 252 households falling in the category, the $100,000 to $149,999 income range is the most frequent in Heritage Lake, accounting for 45.2% of all households.
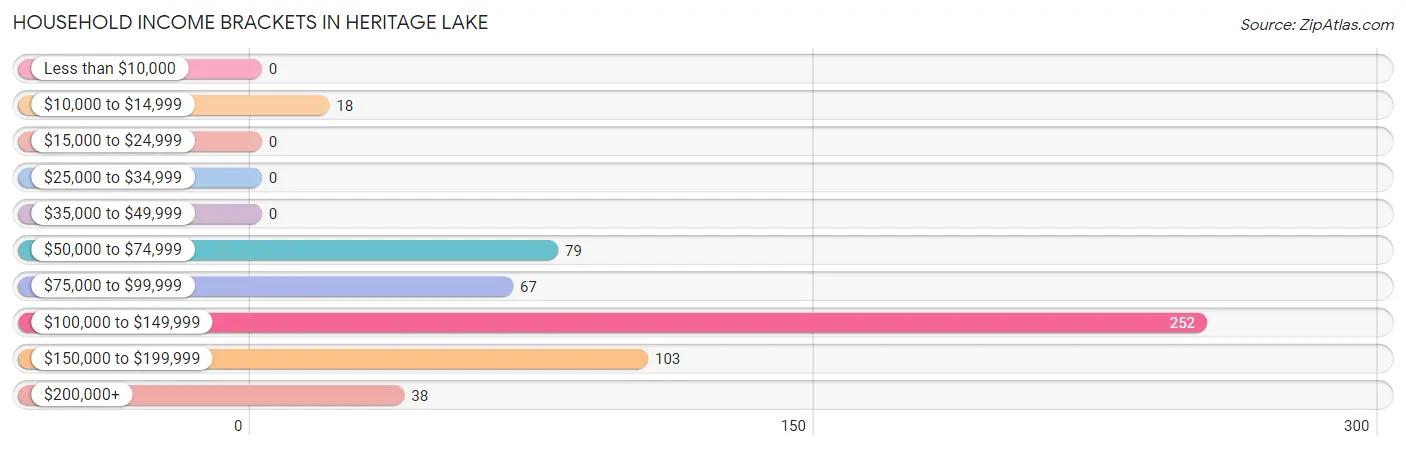
| Income Bracket | # Households | % Households |
| Less than $10,000 | 0 | 0.0% |
| $10,000 to $14,999 | 18 | 3.2% |
| $15,000 to $24,999 | 0 | 0.0% |
| $25,000 to $34,999 | 0 | 0.0% |
| $35,000 to $49,999 | 0 | 0.0% |
| $50,000 to $74,999 | 79 | 14.2% |
| $75,000 to $99,999 | 67 | 12.0% |
| $100,000 to $149,999 | 252 | 45.2% |
| $150,000 to $199,999 | 103 | 18.5% |
| $200,000+ | 38 | 6.8% |
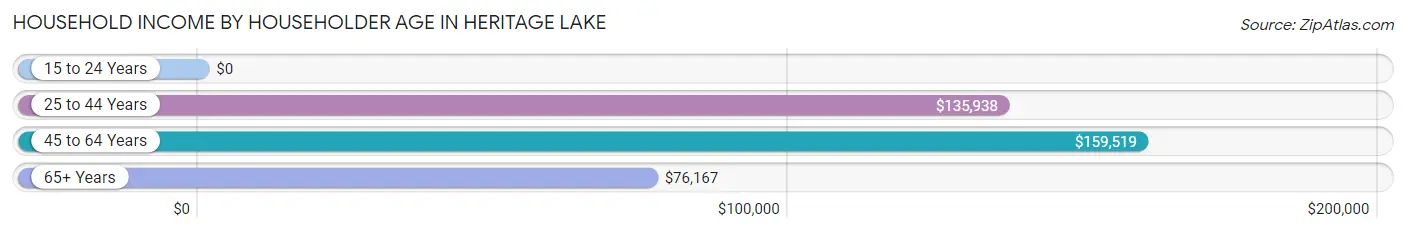
Household Income by Householder Age in Heritage Lake
The median household income in Heritage Lake is $123,169, with the highest median household income of $159,519 found in the 45 to 64 years age bracket for the primary householder. A total of 143 households (25.7%) fall into this category. Meanwhile, the 15 to 24 years age bracket for the primary householder has the lowest median household income of $0, with 19 households (3.4%) in this group.
| Income Bracket | # Households | Median Income |
| 15 to 24 Years | 19 (3.4%) | $0 |
| 25 to 44 Years | 231 (41.5%) | $135,938 |
| 45 to 64 Years | 143 (25.7%) | $159,519 |
| 65+ Years | 164 (29.4%) | $76,167 |
| Total | 557 (100.0%) | $123,169 |
Poverty in Heritage Lake
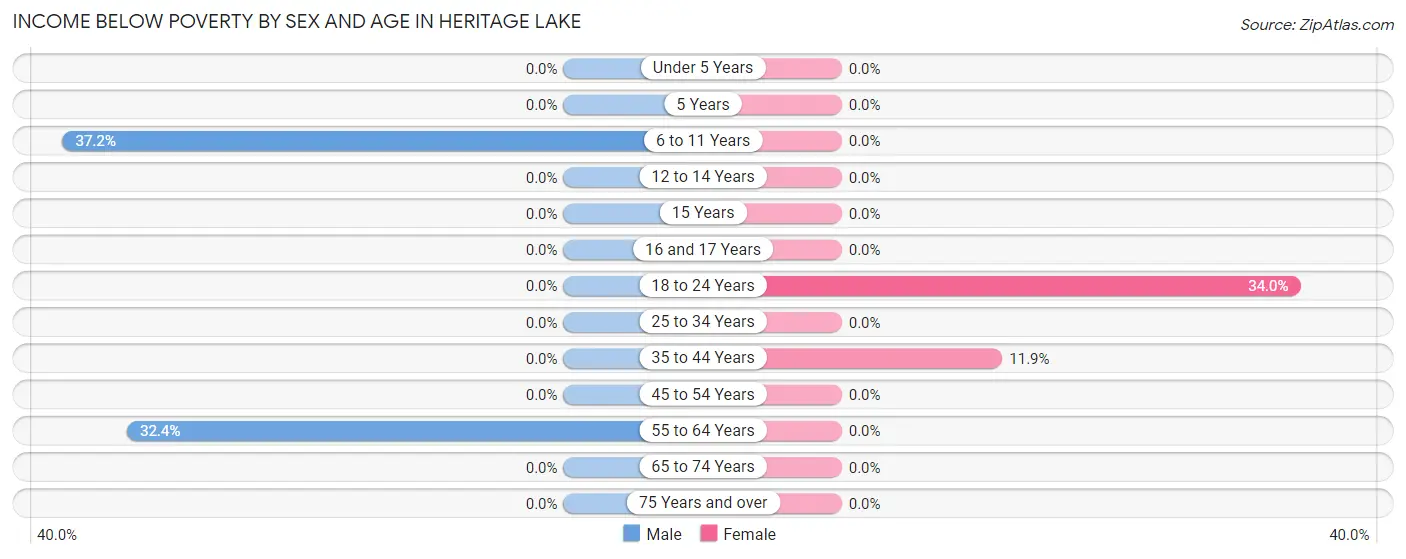
Income Below Poverty by Sex and Age in Heritage Lake
With 6.2% poverty level for males and 4.5% for females among the residents of Heritage Lake, 6 to 11 year old males and 18 to 24 year old females are the most vulnerable to poverty, with 29 males (37.2%) and 16 females (34.0%) in their respective age groups living below the poverty level.
| Age Bracket | Male | Female |
| Under 5 Years | 0 (0.0%) | 0 (0.0%) |
| 5 Years | 0 (0.0%) | 0 (0.0%) |
| 6 to 11 Years | 29 (37.2%) | 0 (0.0%) |
| 12 to 14 Years | 0 (0.0%) | 0 (0.0%) |
| 15 Years | 0 (0.0%) | 0 (0.0%) |
| 16 and 17 Years | 0 (0.0%) | 0 (0.0%) |
| 18 to 24 Years | 0 (0.0%) | 16 (34.0%) |
| 25 to 34 Years | 0 (0.0%) | 0 (0.0%) |
| 35 to 44 Years | 0 (0.0%) | 18 (11.9%) |
| 45 to 54 Years | 0 (0.0%) | 0 (0.0%) |
| 55 to 64 Years | 23 (32.4%) | 0 (0.0%) |
| 65 to 74 Years | 0 (0.0%) | 0 (0.0%) |
| 75 Years and over | 0 (0.0%) | 0 (0.0%) |
| Total | 52 (6.2%) | 34 (4.5%) |
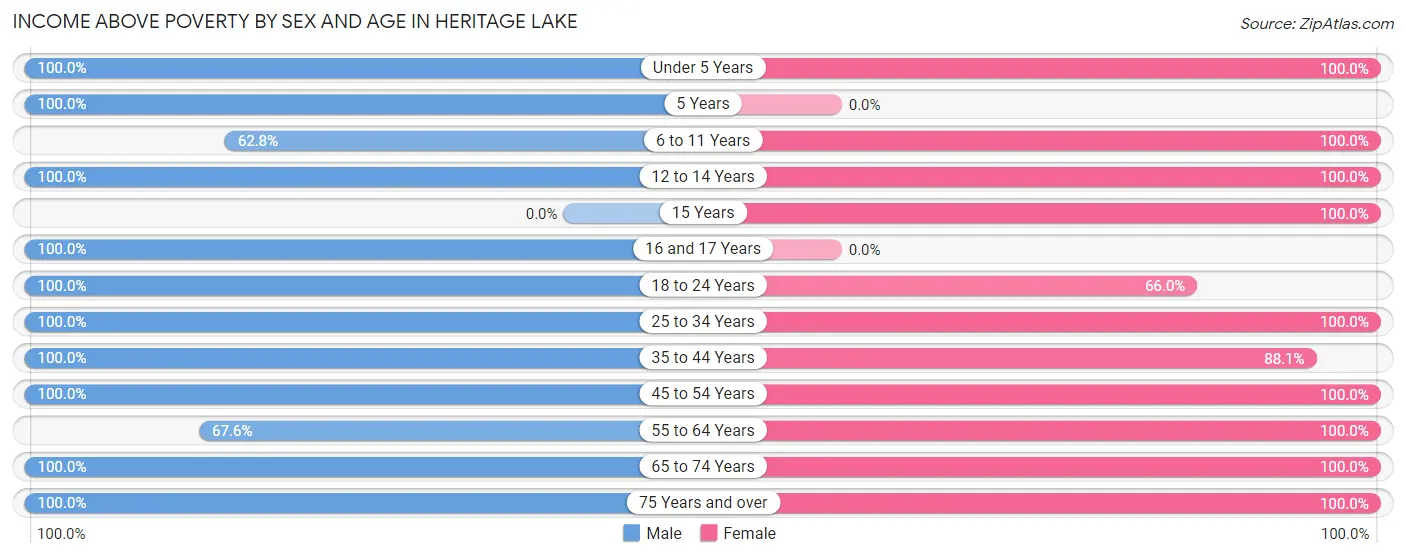
Income Above Poverty by Sex and Age in Heritage Lake
According to the poverty statistics in Heritage Lake, males aged under 5 years and females aged under 5 years are the age groups that are most secure financially, with 100.0% of males and 100.0% of females in these age groups living above the poverty line.
| Age Bracket | Male | Female |
| Under 5 Years | 22 (100.0%) | 60 (100.0%) |
| 5 Years | 16 (100.0%) | 0 (0.0%) |
| 6 to 11 Years | 49 (62.8%) | 78 (100.0%) |
| 12 to 14 Years | 83 (100.0%) | 56 (100.0%) |
| 15 Years | 0 (0.0%) | 14 (100.0%) |
| 16 and 17 Years | 14 (100.0%) | 0 (0.0%) |
| 18 to 24 Years | 47 (100.0%) | 31 (66.0%) |
| 25 to 34 Years | 85 (100.0%) | 87 (100.0%) |
| 35 to 44 Years | 164 (100.0%) | 133 (88.1%) |
| 45 to 54 Years | 112 (100.0%) | 38 (100.0%) |
| 55 to 64 Years | 48 (67.6%) | 103 (100.0%) |
| 65 to 74 Years | 72 (100.0%) | 86 (100.0%) |
| 75 Years and over | 74 (100.0%) | 37 (100.0%) |
| Total | 786 (93.8%) | 723 (95.5%) |
Income Below Poverty Among Married-Couple Families in Heritage Lake
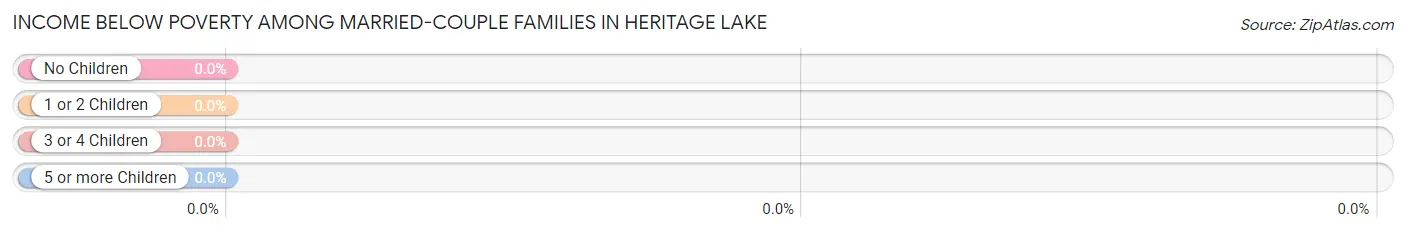
| Children | Above Poverty | Below Poverty |
| No Children | 245 (100.0%) | 0 (0.0%) |
| 1 or 2 Children | 124 (100.0%) | 0 (0.0%) |
| 3 or 4 Children | 41 (100.0%) | 0 (0.0%) |
| 5 or more Children | 0 (0.0%) | 0 (0.0%) |
| Total | 410 (100.0%) | 0 (0.0%) |
Income Below Poverty Among Single-Parent Households in Heritage Lake
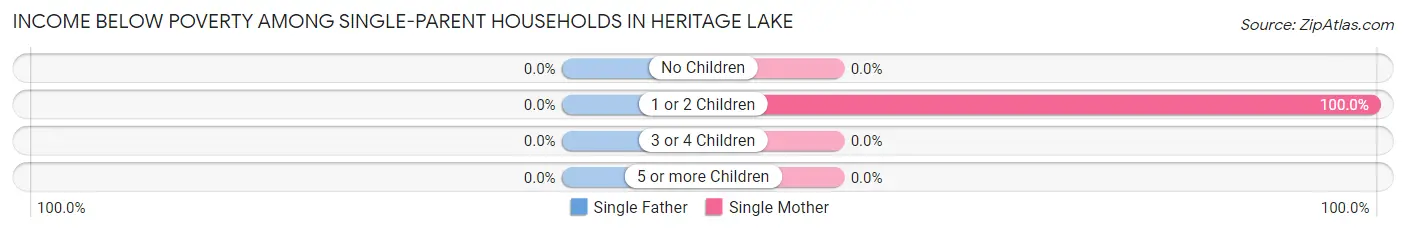
| Children | Single Father | Single Mother |
| No Children | 0 (0.0%) | 0 (0.0%) |
| 1 or 2 Children | 0 (0.0%) | 18 (100.0%) |
| 3 or 4 Children | 0 (0.0%) | 0 (0.0%) |
| 5 or more Children | 0 (0.0%) | 0 (0.0%) |
| Total | 0 (0.0%) | 18 (36.0%) |
Income Below Poverty Among Married-Couple vs Single-Parent Households in Heritage Lake
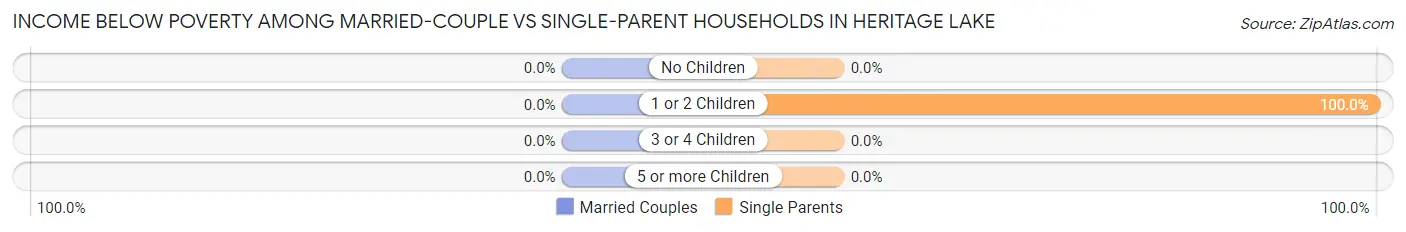
| Children | Married-Couple Families | Single-Parent Households |
| No Children | 0 (0.0%) | 0 (0.0%) |
| 1 or 2 Children | 0 (0.0%) | 18 (100.0%) |
| 3 or 4 Children | 0 (0.0%) | 0 (0.0%) |
| 5 or more Children | 0 (0.0%) | 0 (0.0%) |
| Total | 0 (0.0%) | 18 (26.5%) |
Race in Heritage Lake
The most populous races in Heritage Lake are White / Caucasian (1,566 | 98.2%), Two or more Races (29 | 1.8%), and Hispanic or Latino (22 | 1.4%).
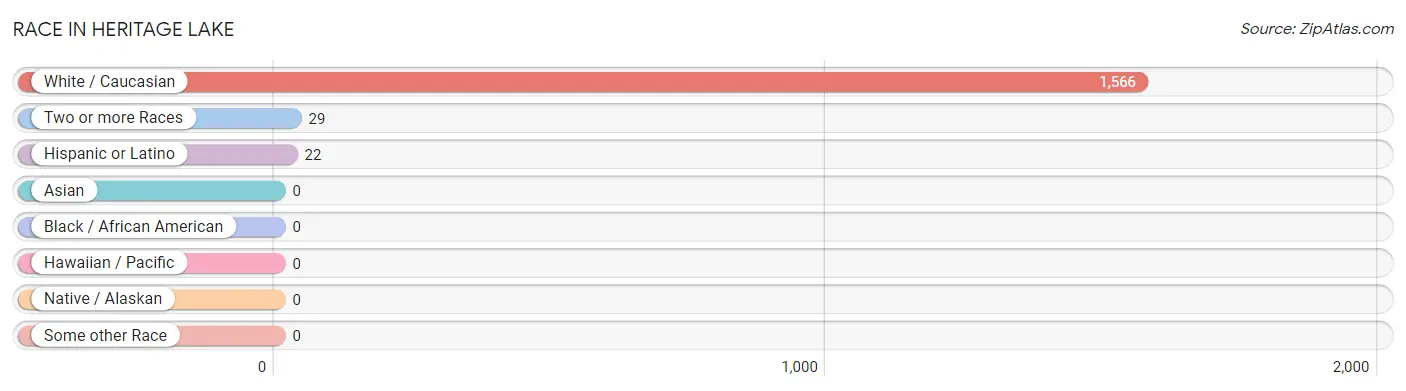
| Race | # Population | % Population |
| Asian | 0 | 0.0% |
| Black / African American | 0 | 0.0% |
| Hawaiian / Pacific | 0 | 0.0% |
| Hispanic or Latino | 22 | 1.4% |
| Native / Alaskan | 0 | 0.0% |
| White / Caucasian | 1,566 | 98.2% |
| Two or more Races | 29 | 1.8% |
| Some other Race | 0 | 0.0% |
| Total | 1,595 | 100.0% |
Ancestry in Heritage Lake
The most populous ancestries reported in Heritage Lake are German (456 | 28.6%), English (242 | 15.2%), Scottish (119 | 7.5%), American (101 | 6.3%), and Irish (97 | 6.1%), together accounting for 63.6% of all Heritage Lake residents.
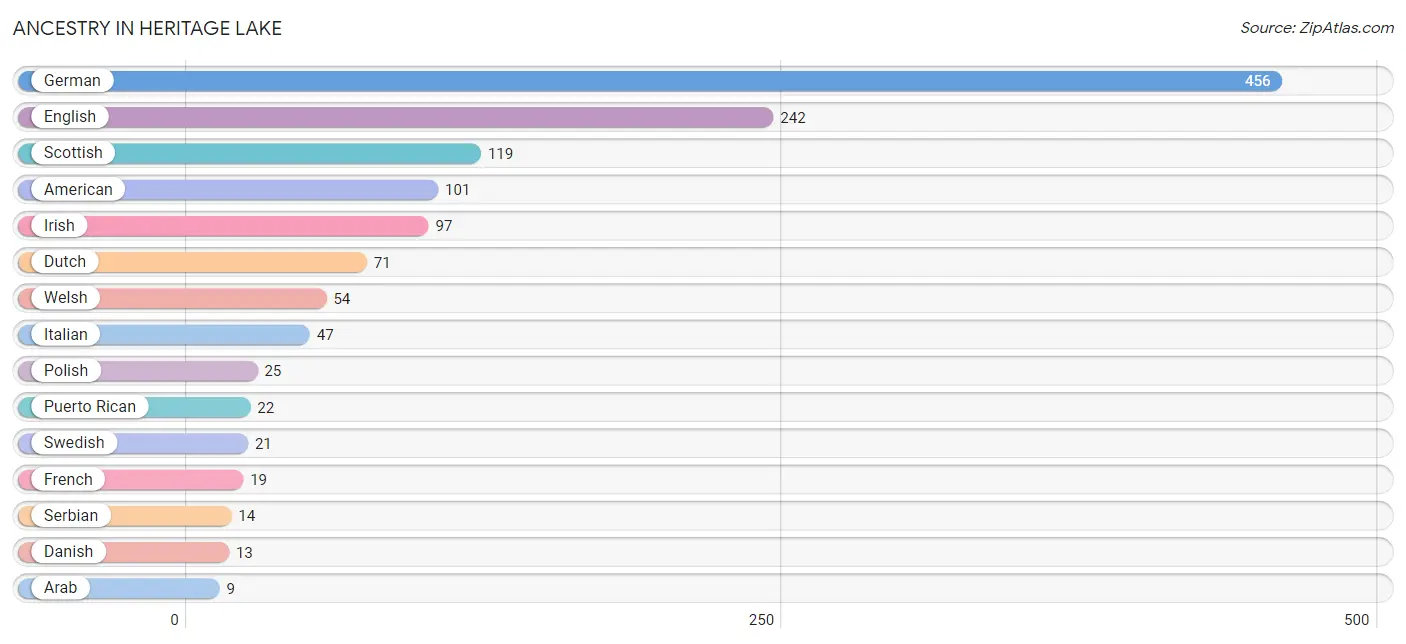
| Ancestry | # Population | % Population |
| American | 101 | 6.3% |
| Arab | 9 | 0.6% |
| Danish | 13 | 0.8% |
| Dutch | 71 | 4.4% |
| English | 242 | 15.2% |
| French | 19 | 1.2% |
| German | 456 | 28.6% |
| Irish | 97 | 6.1% |
| Italian | 47 | 2.9% |
| Lebanese | 9 | 0.6% |
| Polish | 25 | 1.6% |
| Puerto Rican | 22 | 1.4% |
| Scottish | 119 | 7.5% |
| Serbian | 14 | 0.9% |
| Swedish | 21 | 1.3% |
| Welsh | 54 | 3.4% | View All 16 Rows |
Immigrants in Heritage Lake

| Immigration Origin | # Population | % Population | View All 0 Rows |
Sex and Age in Heritage Lake
Sex and Age in Heritage Lake
The most populous age groups in Heritage Lake are 10 to 14 Years (98 | 11.7%) for men and 40 to 44 Years (103 | 13.6%) for women.
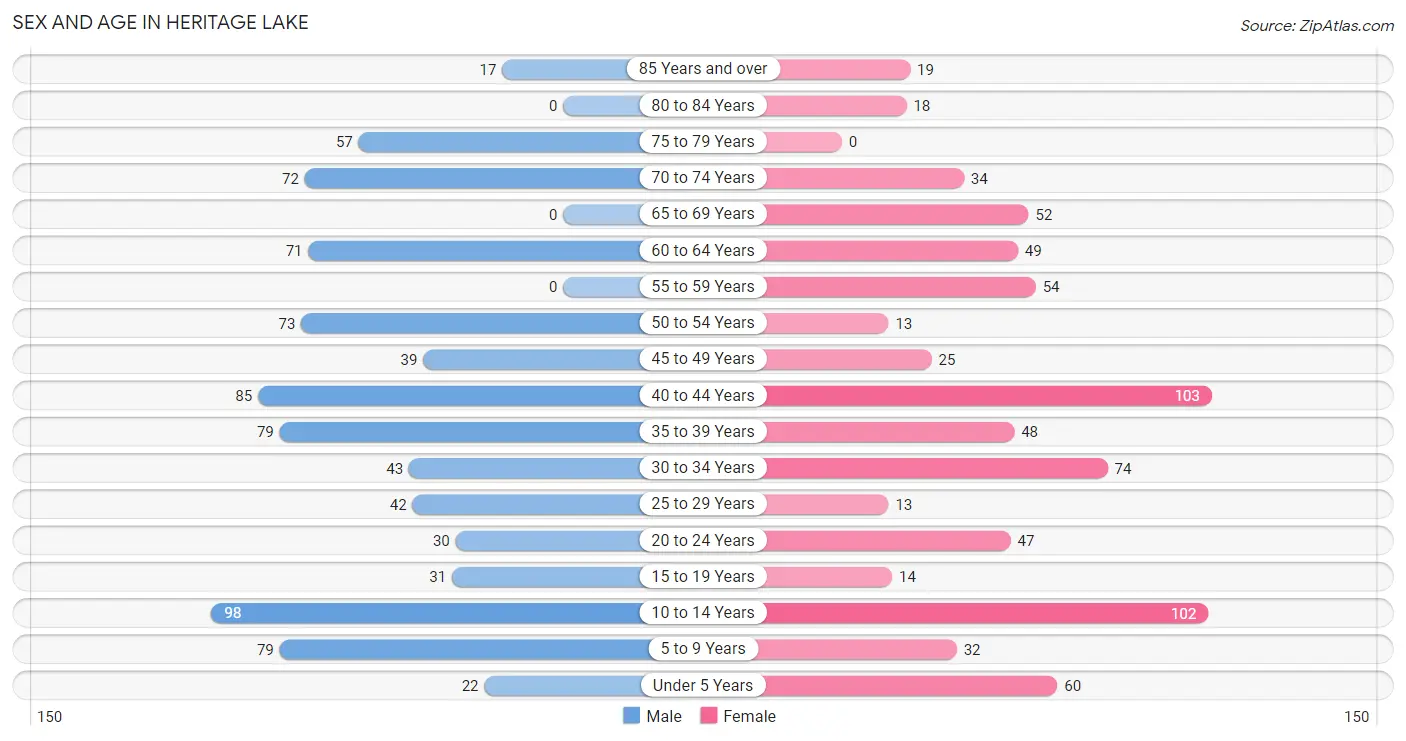
| Age Bracket | Male | Female |
| Under 5 Years | 22 (2.6%) | 60 (7.9%) |
| 5 to 9 Years | 79 (9.4%) | 32 (4.2%) |
| 10 to 14 Years | 98 (11.7%) | 102 (13.5%) |
| 15 to 19 Years | 31 (3.7%) | 14 (1.8%) |
| 20 to 24 Years | 30 (3.6%) | 47 (6.2%) |
| 25 to 29 Years | 42 (5.0%) | 13 (1.7%) |
| 30 to 34 Years | 43 (5.1%) | 74 (9.8%) |
| 35 to 39 Years | 79 (9.4%) | 48 (6.3%) |
| 40 to 44 Years | 85 (10.1%) | 103 (13.6%) |
| 45 to 49 Years | 39 (4.6%) | 25 (3.3%) |
| 50 to 54 Years | 73 (8.7%) | 13 (1.7%) |
| 55 to 59 Years | 0 (0.0%) | 54 (7.1%) |
| 60 to 64 Years | 71 (8.5%) | 49 (6.5%) |
| 65 to 69 Years | 0 (0.0%) | 52 (6.9%) |
| 70 to 74 Years | 72 (8.6%) | 34 (4.5%) |
| 75 to 79 Years | 57 (6.8%) | 0 (0.0%) |
| 80 to 84 Years | 0 (0.0%) | 18 (2.4%) |
| 85 Years and over | 17 (2.0%) | 19 (2.5%) |
| Total | 838 (100.0%) | 757 (100.0%) |
Families and Households in Heritage Lake
Median Family Size in Heritage Lake
The median family size in Heritage Lake is 3.03 persons per family, with single female/mother families (50 | 10.5%) accounting for the largest median family size of 3.08 persons per family. On the other hand, single male/father families (18 | 3.8%) represent the smallest median family size with 2.11 persons per family.
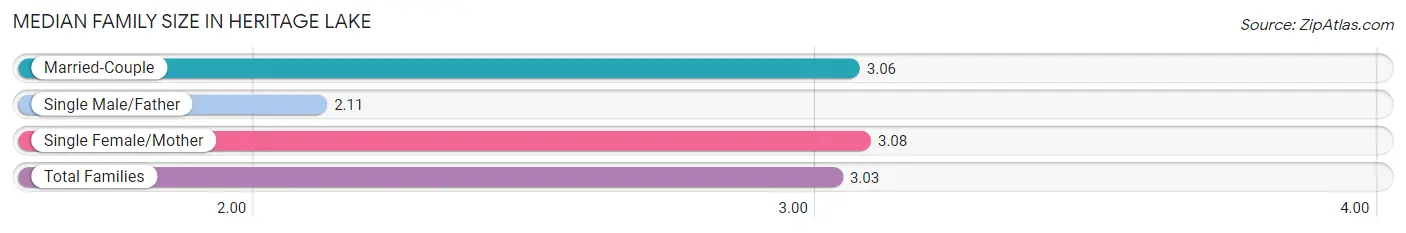
| Family Type | # Families | Family Size |
| Married-Couple | 410 (85.8%) | 3.06 |
| Single Male/Father | 18 (3.8%) | 2.11 |
| Single Female/Mother | 50 (10.5%) | 3.08 |
| Total Families | 478 (100.0%) | 3.03 |
Median Household Size in Heritage Lake
The median household size in Heritage Lake is 2.86 persons per household, with single female/mother households (50 | 9.0%) accounting for the largest median household size of 3.8 persons per household. non-family households (79 | 14.2%) represent the smallest median household size with 1.41 persons per household.
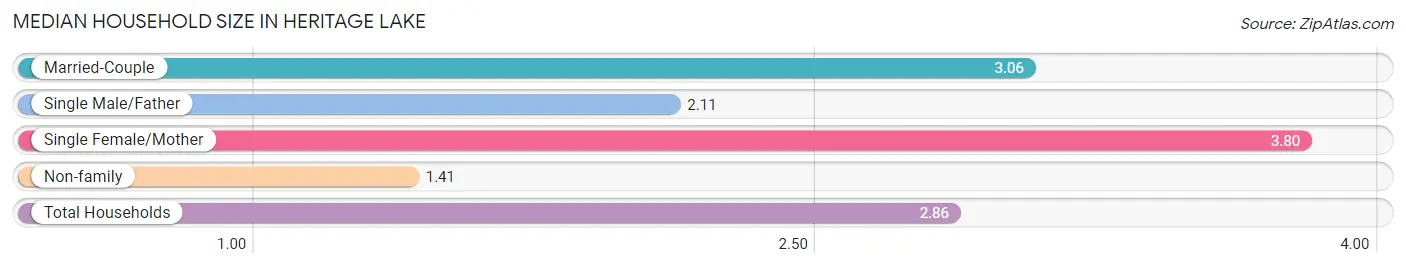
| Household Type | # Households | Household Size |
| Married-Couple | 410 (73.6%) | 3.06 |
| Single Male/Father | 18 (3.2%) | 2.11 |
| Single Female/Mother | 50 (9.0%) | 3.80 |
| Non-family | 79 (14.2%) | 1.41 |
| Total Households | 557 (100.0%) | 2.86 |
Household Size by Marriage Status in Heritage Lake
Out of a total of 557 households in Heritage Lake, 478 (85.8%) are family households, while 79 (14.2%) are nonfamily households. The most numerous type of family households are 2-person households, comprising 198, and the most common type of nonfamily households are 1-person households, comprising 43.
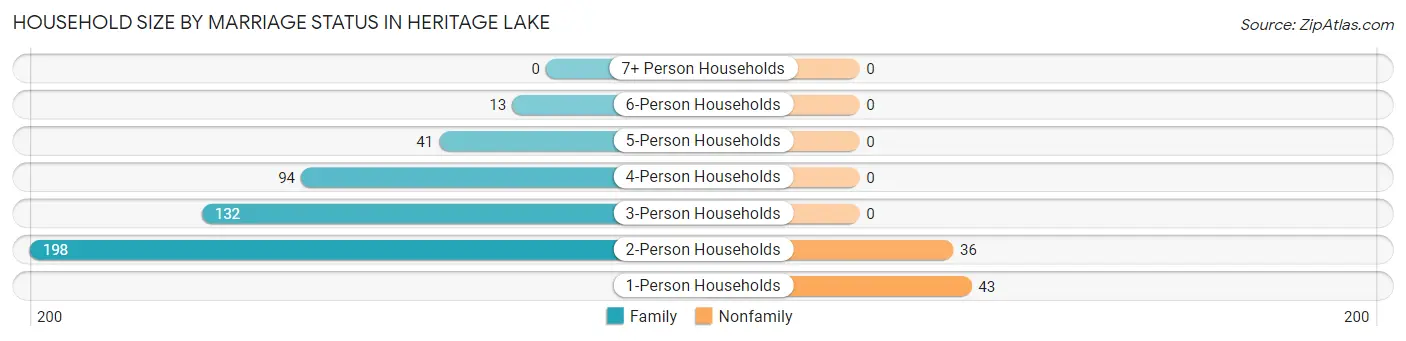
| Household Size | Family Households | Nonfamily Households |
| 1-Person Households | - | 43 (7.7%) |
| 2-Person Households | 198 (35.5%) | 36 (6.5%) |
| 3-Person Households | 132 (23.7%) | 0 (0.0%) |
| 4-Person Households | 94 (16.9%) | 0 (0.0%) |
| 5-Person Households | 41 (7.4%) | 0 (0.0%) |
| 6-Person Households | 13 (2.3%) | 0 (0.0%) |
| 7+ Person Households | 0 (0.0%) | 0 (0.0%) |
| Total | 478 (85.8%) | 79 (14.2%) |
Female Fertility in Heritage Lake
Fertility by Age in Heritage Lake
Average fertility rate in Heritage Lake is 28.0 births per 1,000 women. Women in the age bracket of 35 to 50 years have the highest fertility rate with 51.0 births per 1,000 women. Women in the age bracket of 35 to 50 years acount for 100.0% of all women with births.
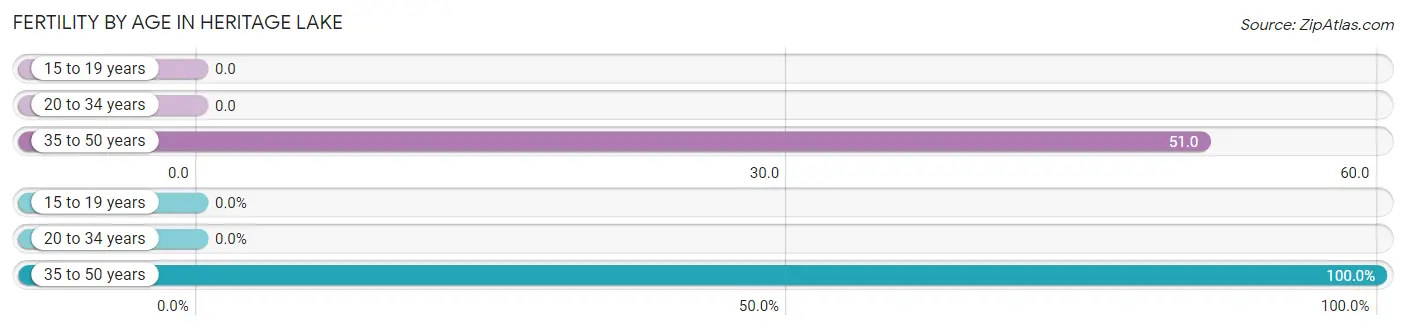
| Age Bracket | Women with Births | Births / 1,000 Women |
| 15 to 19 years | 0 (0.0%) | 0.0 |
| 20 to 34 years | 0 (0.0%) | 0.0 |
| 35 to 50 years | 9 (100.0%) | 51.0 |
| Total | 9 (100.0%) | 28.0 |
Fertility by Age by Marriage Status in Heritage Lake
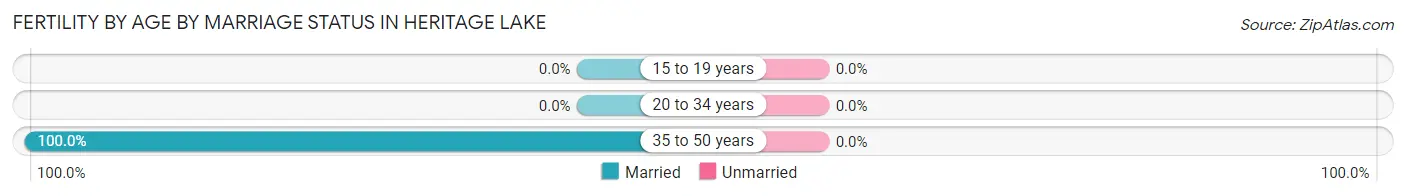
| Age Bracket | Married | Unmarried |
| 15 to 19 years | 0 (0.0%) | 0 (0.0%) |
| 20 to 34 years | 0 (0.0%) | 0 (0.0%) |
| 35 to 50 years | 9 (100.0%) | 0 (0.0%) |
| Total | 9 (100.0%) | 0 (0.0%) |
Fertility by Education in Heritage Lake
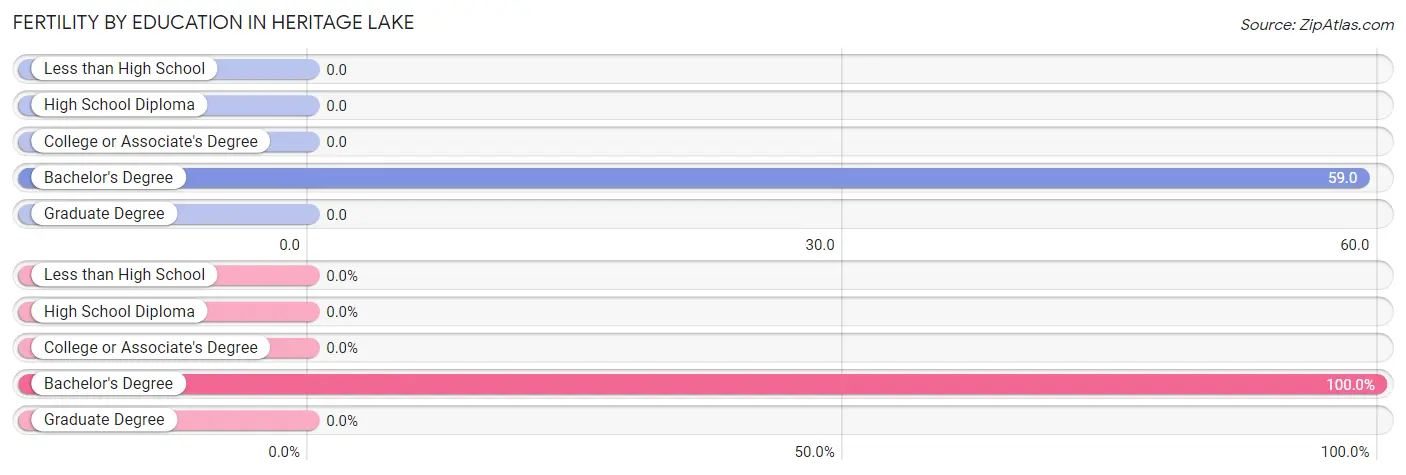
| Educational Attainment | Women with Births | Births / 1,000 Women |
| Less than High School | 0 (0.0%) | 0.0 |
| High School Diploma | 0 (0.0%) | 0.0 |
| College or Associate's Degree | 0 (0.0%) | 0.0 |
| Bachelor's Degree | 9 (100.0%) | 59.0 |
| Graduate Degree | 0 (0.0%) | 0.0 |
| Total | 9 (100.0%) | 28.0 |
Fertility by Education by Marriage Status in Heritage Lake
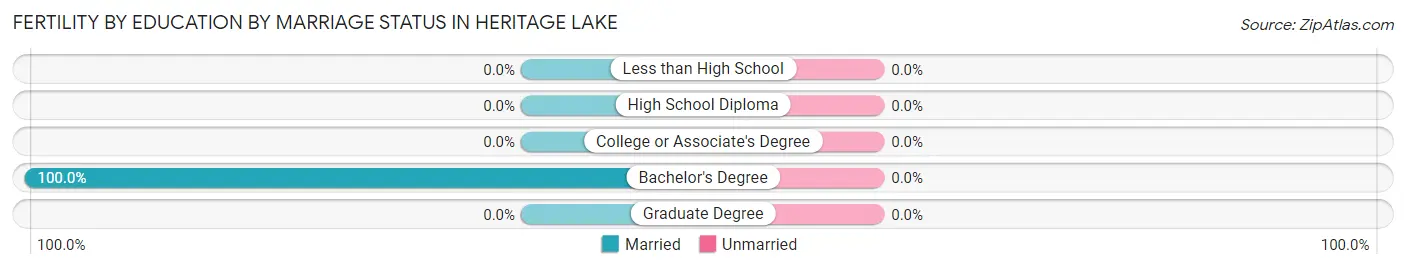
| Educational Attainment | Married | Unmarried |
| Less than High School | 0 (0.0%) | 0 (0.0%) |
| High School Diploma | 0 (0.0%) | 0 (0.0%) |
| College or Associate's Degree | 0 (0.0%) | 0 (0.0%) |
| Bachelor's Degree | 9 (100.0%) | 0 (0.0%) |
| Graduate Degree | 0 (0.0%) | 0 (0.0%) |
| Total | 9 (100.0%) | 0 (0.0%) |
Employment Characteristics in Heritage Lake
Employment by Class of Employer in Heritage Lake
Among the 791 employed individuals in Heritage Lake, private company employees (439 | 55.5%), local government employees (127 | 16.1%), and state government employees (84 | 10.6%) make up the most common classes of employment.
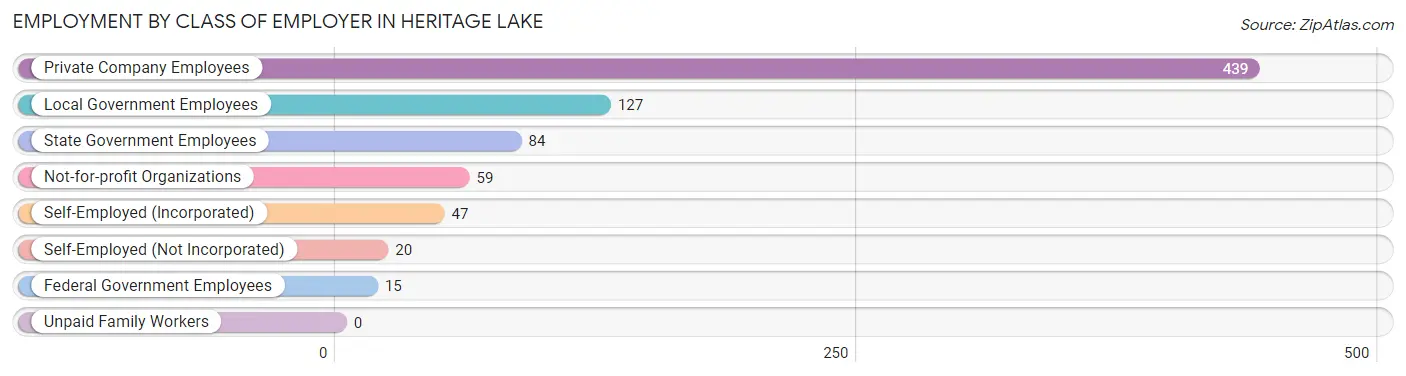
| Employer Class | # Employees | % Employees |
| Private Company Employees | 439 | 55.5% |
| Self-Employed (Incorporated) | 47 | 5.9% |
| Self-Employed (Not Incorporated) | 20 | 2.5% |
| Not-for-profit Organizations | 59 | 7.5% |
| Local Government Employees | 127 | 16.1% |
| State Government Employees | 84 | 10.6% |
| Federal Government Employees | 15 | 1.9% |
| Unpaid Family Workers | 0 | 0.0% |
| Total | 791 | 100.0% |
Employment Status by Age in Heritage Lake
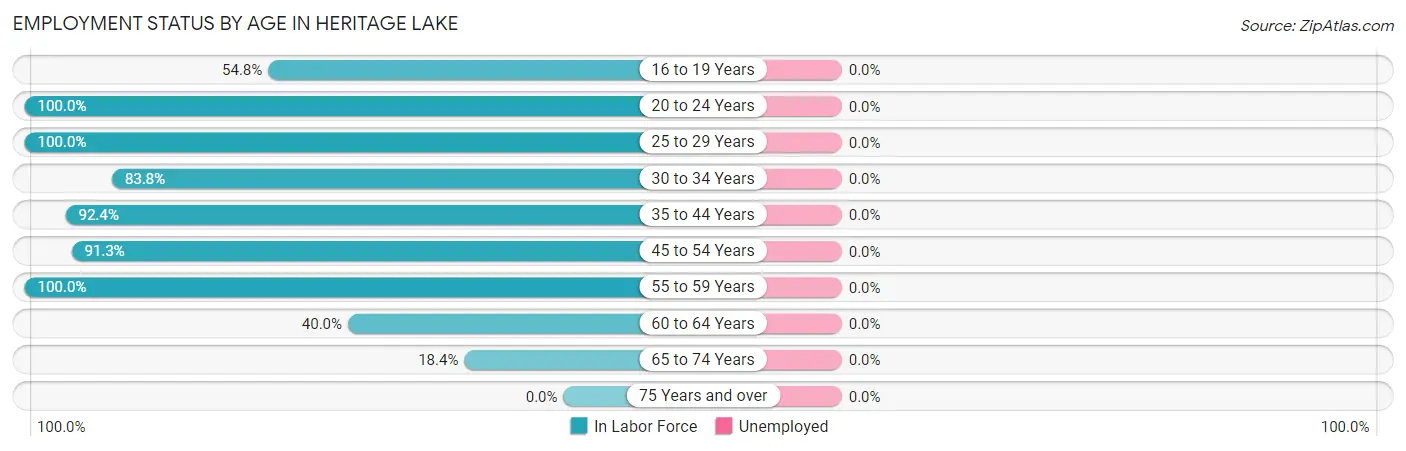
| Age Bracket | In Labor Force | Unemployed |
| 16 to 19 Years | 17 (54.8%) | 0 (0.0%) |
| 20 to 24 Years | 77 (100.0%) | 0 (0.0%) |
| 25 to 29 Years | 55 (100.0%) | 0 (0.0%) |
| 30 to 34 Years | 98 (83.8%) | 0 (0.0%) |
| 35 to 44 Years | 291 (92.4%) | 0 (0.0%) |
| 45 to 54 Years | 137 (91.3%) | 0 (0.0%) |
| 55 to 59 Years | 54 (100.0%) | 0 (0.0%) |
| 60 to 64 Years | 48 (40.0%) | 0 (0.0%) |
| 65 to 74 Years | 29 (18.4%) | 0 (0.0%) |
| 75 Years and over | 0 (0.0%) | 0 (0.0%) |
| Total | 805 (67.8%) | 0 (0.0%) |
Employment Status by Educational Attainment in Heritage Lake
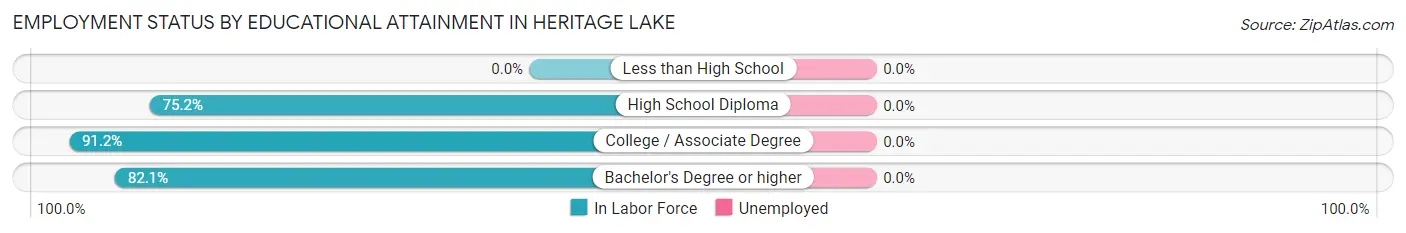
| Educational Attainment | In Labor Force | Unemployed |
| Less than High School | 0 (0.0%) | 0 (0.0%) |
| High School Diploma | 118 (75.2%) | 0 (0.0%) |
| College / Associate Degree | 281 (91.2%) | 0 (0.0%) |
| Bachelor's Degree or higher | 284 (82.1%) | 0 (0.0%) |
| Total | 683 (84.2%) | 0 (0.0%) |
Employment Occupations by Sex in Heritage Lake
Management, Business, Science and Arts Occupations
The most common Management, Business, Science and Arts occupations in Heritage Lake are Computers, Engineering & Science (138 | 17.1%), Community & Social Service (121 | 15.0%), Management (99 | 12.3%), Education Instruction & Library (80 | 9.9%), and Architecture & Engineering (52 | 6.5%).
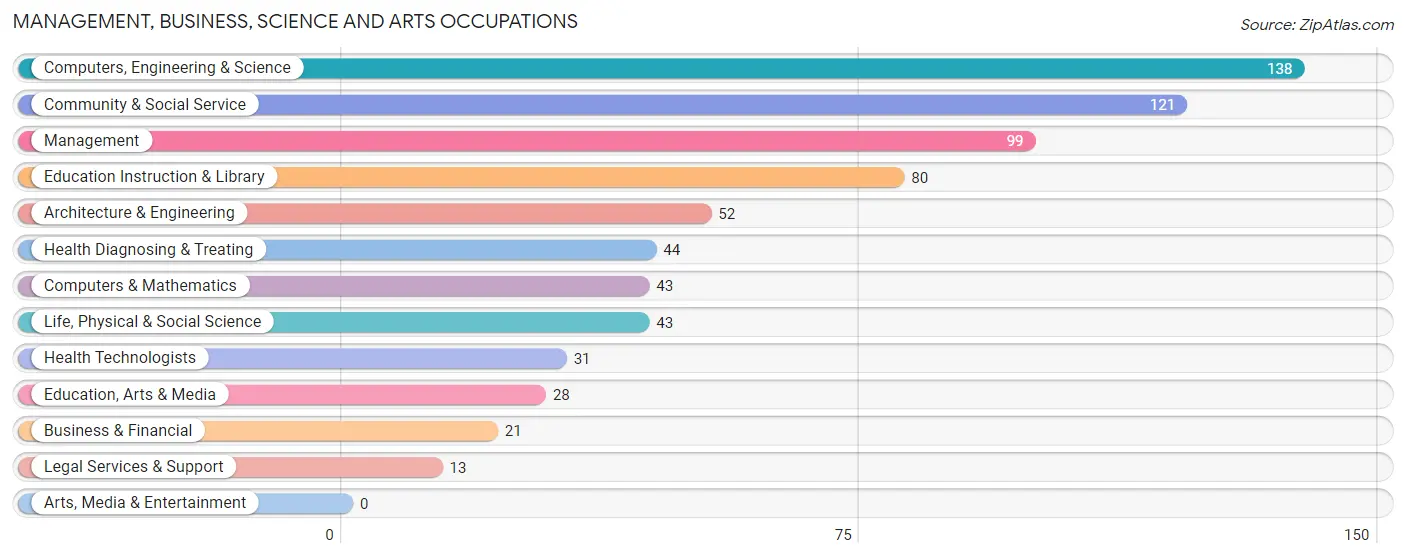
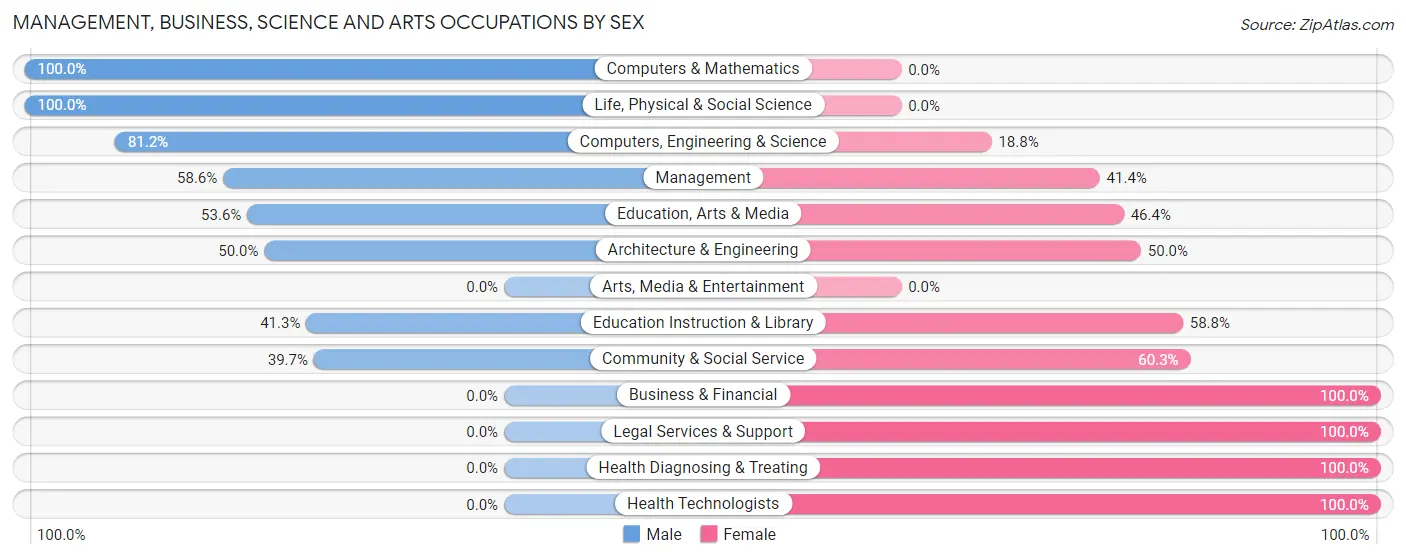
Management, Business, Science and Arts Occupations by Sex
Within the Management, Business, Science and Arts occupations in Heritage Lake, the most male-oriented occupations are Computers & Mathematics (100.0%), Life, Physical & Social Science (100.0%), and Computers, Engineering & Science (81.2%), while the most female-oriented occupations are Business & Financial (100.0%), Legal Services & Support (100.0%), and Health Diagnosing & Treating (100.0%).
| Occupation | Male | Female |
| Management | 58 (58.6%) | 41 (41.4%) |
| Business & Financial | 0 (0.0%) | 21 (100.0%) |
| Computers, Engineering & Science | 112 (81.2%) | 26 (18.8%) |
| Computers & Mathematics | 43 (100.0%) | 0 (0.0%) |
| Architecture & Engineering | 26 (50.0%) | 26 (50.0%) |
| Life, Physical & Social Science | 43 (100.0%) | 0 (0.0%) |
| Community & Social Service | 48 (39.7%) | 73 (60.3%) |
| Education, Arts & Media | 15 (53.6%) | 13 (46.4%) |
| Legal Services & Support | 0 (0.0%) | 13 (100.0%) |
| Education Instruction & Library | 33 (41.2%) | 47 (58.8%) |
| Arts, Media & Entertainment | 0 (0.0%) | 0 (0.0%) |
| Health Diagnosing & Treating | 0 (0.0%) | 44 (100.0%) |
| Health Technologists | 0 (0.0%) | 31 (100.0%) |
| Total (Category) | 218 (51.5%) | 205 (48.5%) |
| Total (Overall) | 471 (58.4%) | 335 (41.6%) |
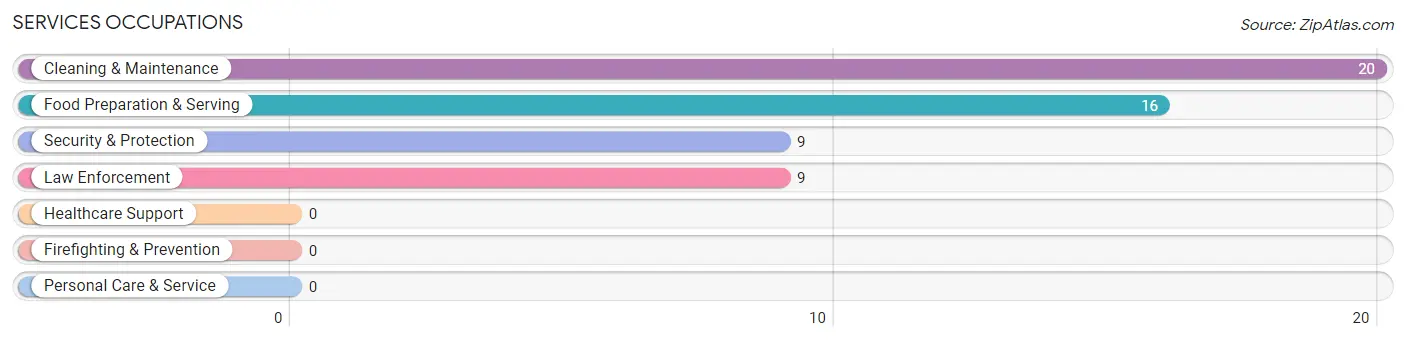
Services Occupations
The most common Services occupations in Heritage Lake are Cleaning & Maintenance (20 | 2.5%), Food Preparation & Serving (16 | 2.0%), Security & Protection (9 | 1.1%), and Law Enforcement (9 | 1.1%).
Services Occupations by Sex
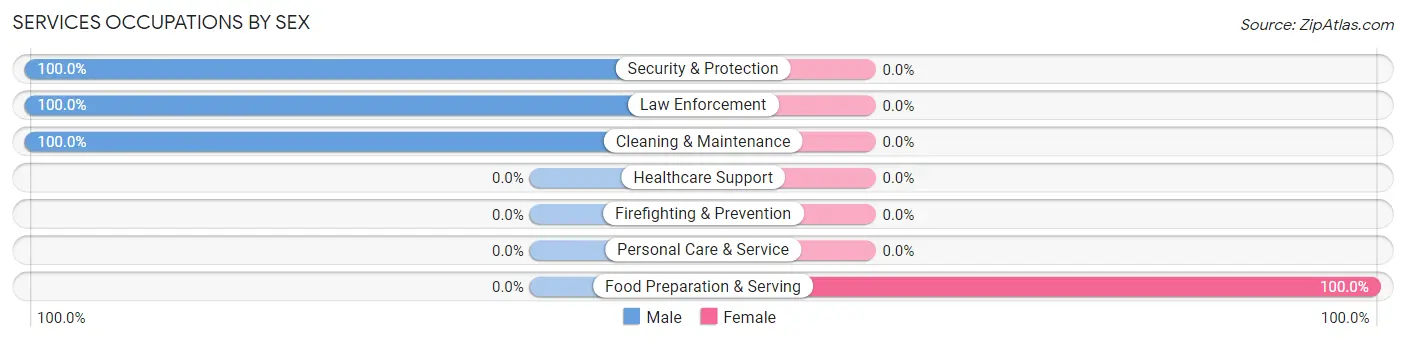
| Occupation | Male | Female |
| Healthcare Support | 0 (0.0%) | 0 (0.0%) |
| Security & Protection | 9 (100.0%) | 0 (0.0%) |
| Firefighting & Prevention | 0 (0.0%) | 0 (0.0%) |
| Law Enforcement | 9 (100.0%) | 0 (0.0%) |
| Food Preparation & Serving | 0 (0.0%) | 16 (100.0%) |
| Cleaning & Maintenance | 20 (100.0%) | 0 (0.0%) |
| Personal Care & Service | 0 (0.0%) | 0 (0.0%) |
| Total (Category) | 29 (64.4%) | 16 (35.6%) |
| Total (Overall) | 471 (58.4%) | 335 (41.6%) |
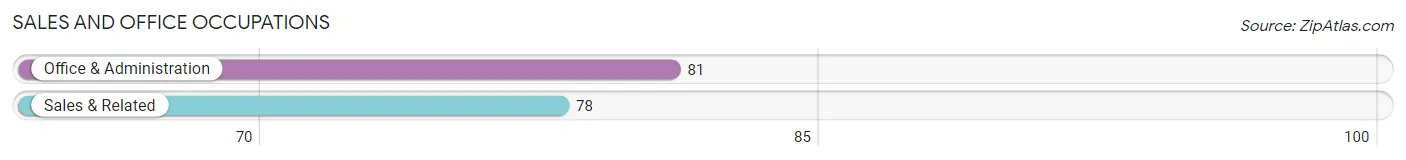
Sales and Office Occupations
The most common Sales and Office occupations in Heritage Lake are Office & Administration (81 | 10.1%), and Sales & Related (78 | 9.7%).
Sales and Office Occupations by Sex
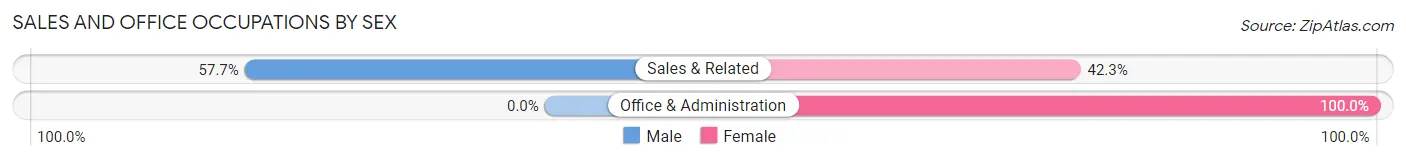
| Occupation | Male | Female |
| Sales & Related | 45 (57.7%) | 33 (42.3%) |
| Office & Administration | 0 (0.0%) | 81 (100.0%) |
| Total (Category) | 45 (28.3%) | 114 (71.7%) |
| Total (Overall) | 471 (58.4%) | 335 (41.6%) |
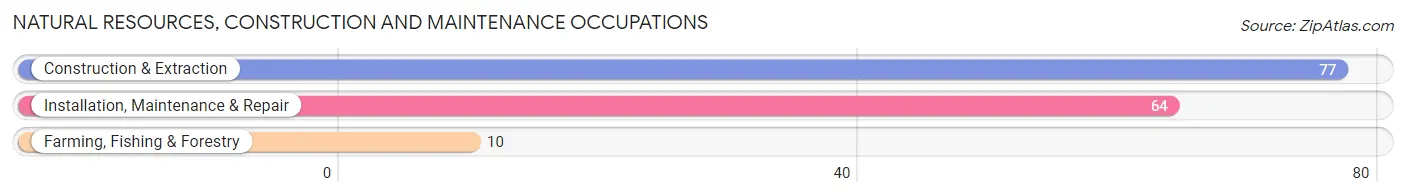
Natural Resources, Construction and Maintenance Occupations
The most common Natural Resources, Construction and Maintenance occupations in Heritage Lake are Construction & Extraction (77 | 9.6%), Installation, Maintenance & Repair (64 | 7.9%), and Farming, Fishing & Forestry (10 | 1.2%).
Natural Resources, Construction and Maintenance Occupations by Sex
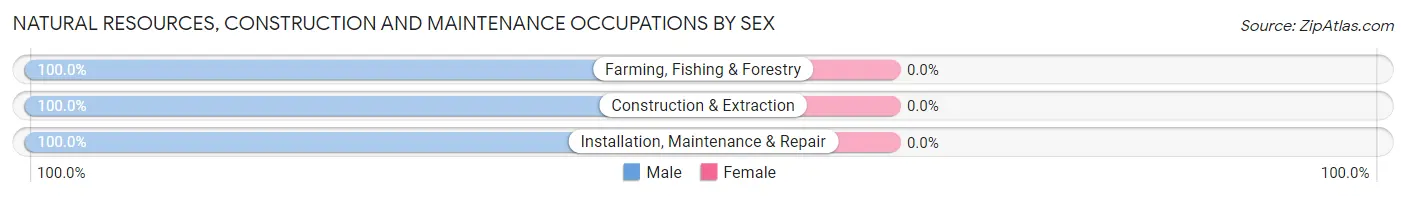
| Occupation | Male | Female |
| Farming, Fishing & Forestry | 10 (100.0%) | 0 (0.0%) |
| Construction & Extraction | 77 (100.0%) | 0 (0.0%) |
| Installation, Maintenance & Repair | 64 (100.0%) | 0 (0.0%) |
| Total (Category) | 151 (100.0%) | 0 (0.0%) |
| Total (Overall) | 471 (58.4%) | 335 (41.6%) |
Production, Transportation and Moving Occupations
The most common Production, Transportation and Moving occupations in Heritage Lake are Transportation (17 | 2.1%), and Production (11 | 1.4%).
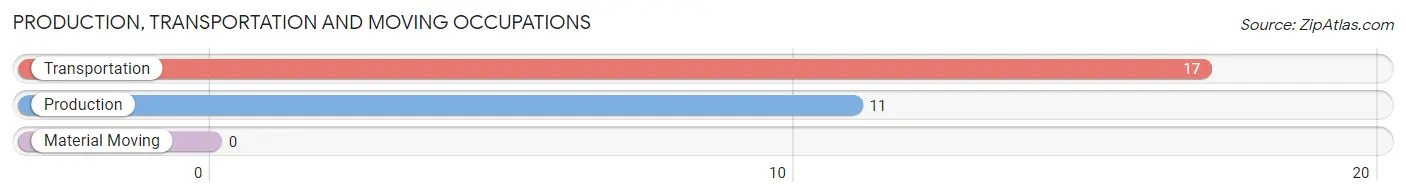
Production, Transportation and Moving Occupations by Sex
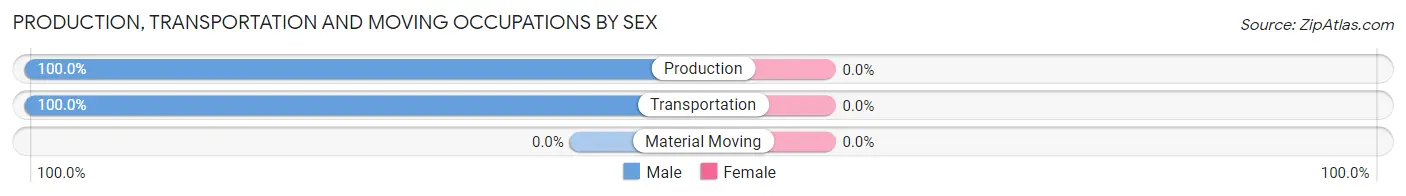
| Occupation | Male | Female |
| Production | 11 (100.0%) | 0 (0.0%) |
| Transportation | 17 (100.0%) | 0 (0.0%) |
| Material Moving | 0 (0.0%) | 0 (0.0%) |
| Total (Category) | 28 (100.0%) | 0 (0.0%) |
| Total (Overall) | 471 (58.4%) | 335 (41.6%) |
Employment Industries by Sex in Heritage Lake
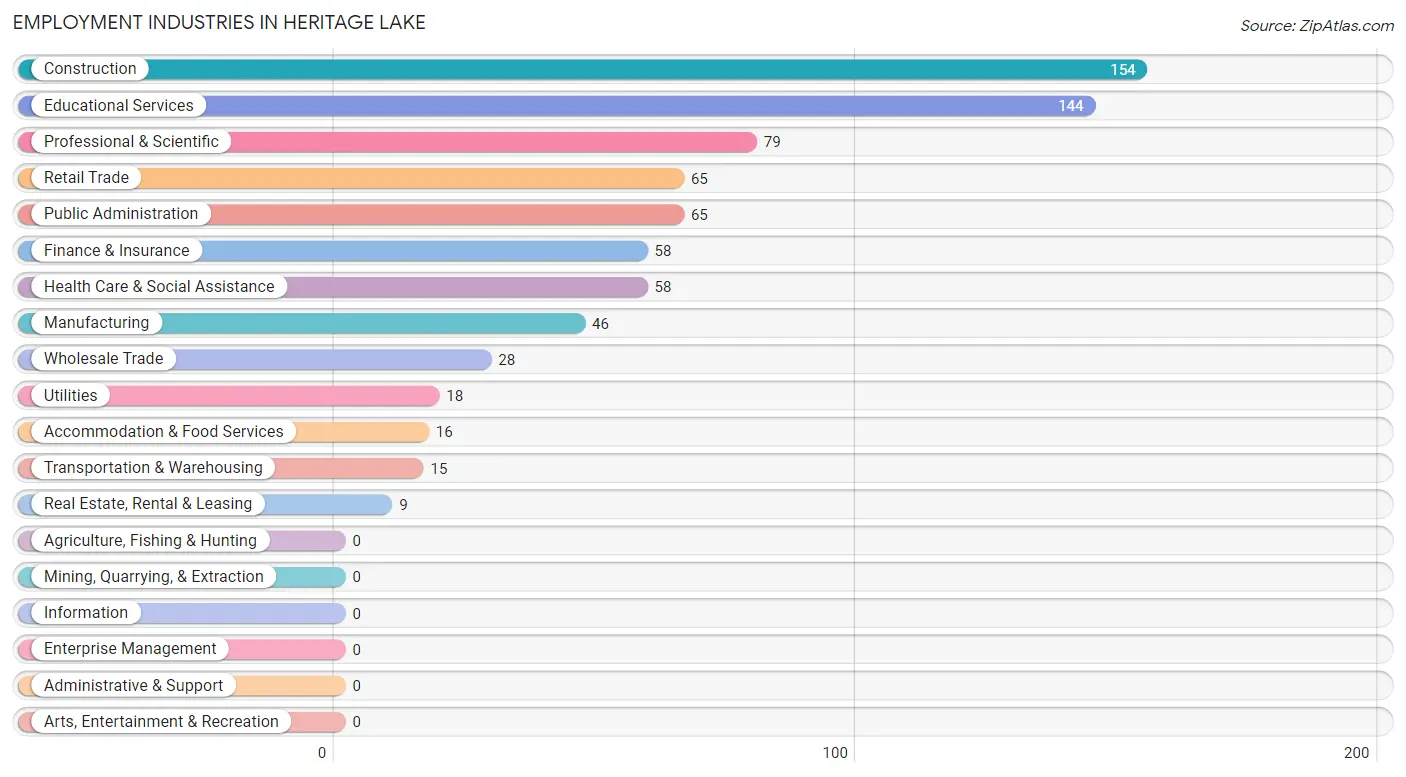
Employment Industries in Heritage Lake
The major employment industries in Heritage Lake include Construction (154 | 19.1%), Educational Services (144 | 17.9%), Professional & Scientific (79 | 9.8%), Retail Trade (65 | 8.1%), and Public Administration (65 | 8.1%).
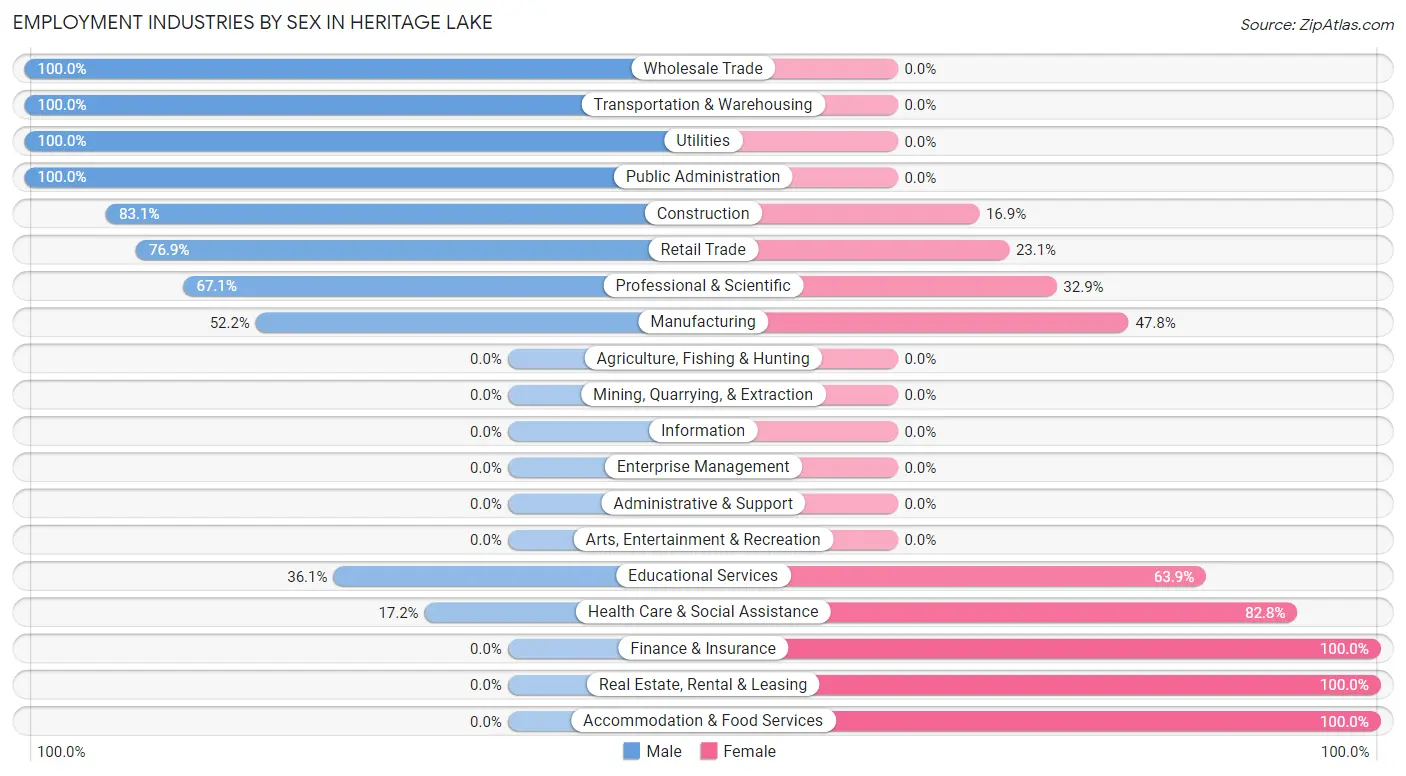
Employment Industries by Sex in Heritage Lake
The Heritage Lake industries that see more men than women are Wholesale Trade (100.0%), Transportation & Warehousing (100.0%), and Utilities (100.0%), whereas the industries that tend to have a higher number of women are Finance & Insurance (100.0%), Real Estate, Rental & Leasing (100.0%), and Accommodation & Food Services (100.0%).
| Industry | Male | Female |
| Agriculture, Fishing & Hunting | 0 (0.0%) | 0 (0.0%) |
| Mining, Quarrying, & Extraction | 0 (0.0%) | 0 (0.0%) |
| Construction | 128 (83.1%) | 26 (16.9%) |
| Manufacturing | 24 (52.2%) | 22 (47.8%) |
| Wholesale Trade | 28 (100.0%) | 0 (0.0%) |
| Retail Trade | 50 (76.9%) | 15 (23.1%) |
| Transportation & Warehousing | 15 (100.0%) | 0 (0.0%) |
| Utilities | 18 (100.0%) | 0 (0.0%) |
| Information | 0 (0.0%) | 0 (0.0%) |
| Finance & Insurance | 0 (0.0%) | 58 (100.0%) |
| Real Estate, Rental & Leasing | 0 (0.0%) | 9 (100.0%) |
| Professional & Scientific | 53 (67.1%) | 26 (32.9%) |
| Enterprise Management | 0 (0.0%) | 0 (0.0%) |
| Administrative & Support | 0 (0.0%) | 0 (0.0%) |
| Educational Services | 52 (36.1%) | 92 (63.9%) |
| Health Care & Social Assistance | 10 (17.2%) | 48 (82.8%) |
| Arts, Entertainment & Recreation | 0 (0.0%) | 0 (0.0%) |
| Accommodation & Food Services | 0 (0.0%) | 16 (100.0%) |
| Public Administration | 65 (100.0%) | 0 (0.0%) |
| Total | 471 (58.4%) | 335 (41.6%) |
Education in Heritage Lake
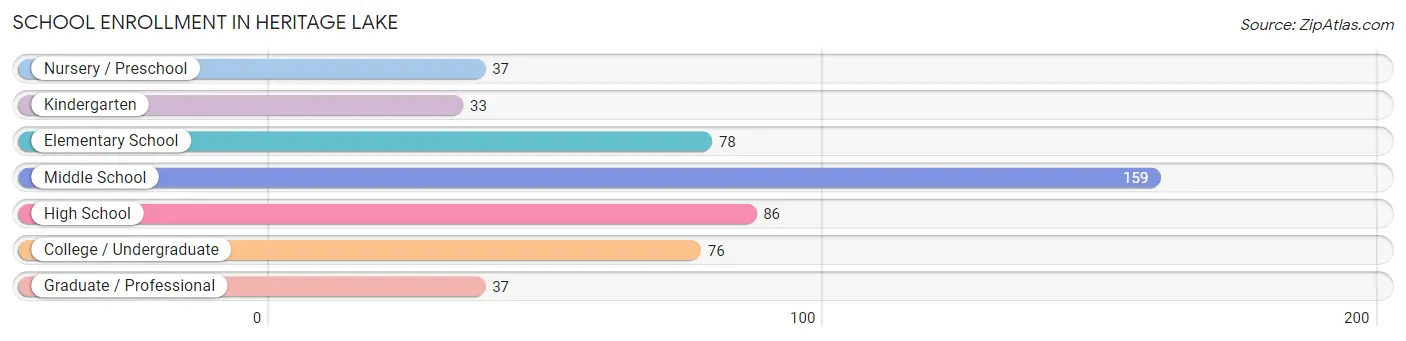
School Enrollment in Heritage Lake
The most common levels of schooling among the 506 students in Heritage Lake are middle school (159 | 31.4%), high school (86 | 17.0%), and elementary school (78 | 15.4%).
| School Level | # Students | % Students |
| Nursery / Preschool | 37 | 7.3% |
| Kindergarten | 33 | 6.5% |
| Elementary School | 78 | 15.4% |
| Middle School | 159 | 31.4% |
| High School | 86 | 17.0% |
| College / Undergraduate | 76 | 15.0% |
| Graduate / Professional | 37 | 7.3% |
| Total | 506 | 100.0% |
School Enrollment by Age by Funding Source in Heritage Lake
Out of a total of 506 students who are enrolled in schools in Heritage Lake, 77 (15.2%) attend a private institution, while the remaining 429 (84.8%) are enrolled in public schools. The age group of 35 years and over has the highest likelihood of being enrolled in private schools, with 19 (100.0% in the age bracket) enrolled. Conversely, the age group of 3 to 4 year olds has the lowest likelihood of being enrolled in a private school, with 37 (100.0% in the age bracket) attending a public institution.
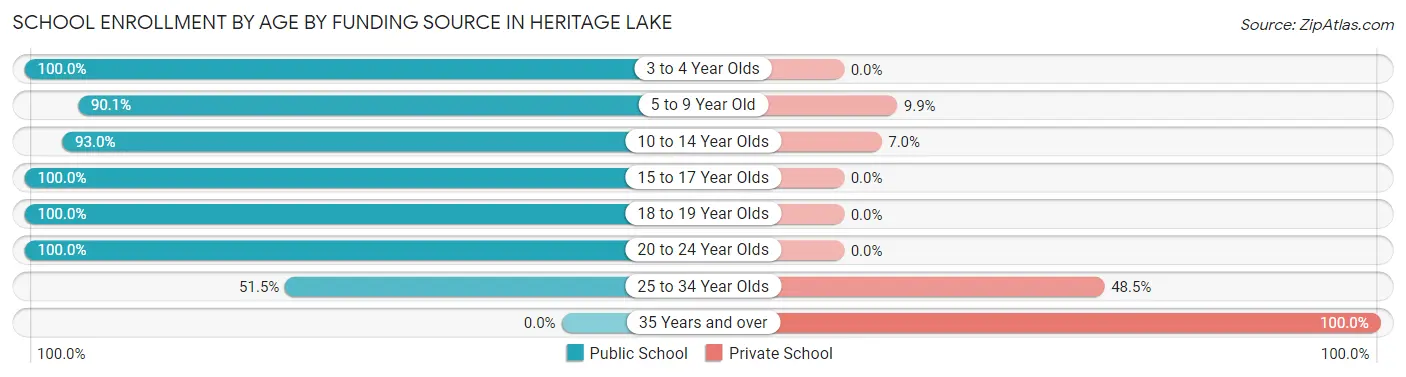
| Age Bracket | Public School | Private School |
| 3 to 4 Year Olds | 37 (100.0%) | 0 (0.0%) |
| 5 to 9 Year Old | 100 (90.1%) | 11 (9.9%) |
| 10 to 14 Year Olds | 186 (93.0%) | 14 (7.0%) |
| 15 to 17 Year Olds | 28 (100.0%) | 0 (0.0%) |
| 18 to 19 Year Olds | 17 (100.0%) | 0 (0.0%) |
| 20 to 24 Year Olds | 26 (100.0%) | 0 (0.0%) |
| 25 to 34 Year Olds | 35 (51.5%) | 33 (48.5%) |
| 35 Years and over | 0 (0.0%) | 19 (100.0%) |
| Total | 429 (84.8%) | 77 (15.2%) |
Educational Attainment by Field of Study in Heritage Lake
Engineering (82 | 18.9%), education (79 | 18.2%), business (71 | 16.4%), science & technology (69 | 15.9%), and social sciences (19 | 4.4%) are the most common fields of study among 434 individuals in Heritage Lake who have obtained a bachelor's degree or higher.
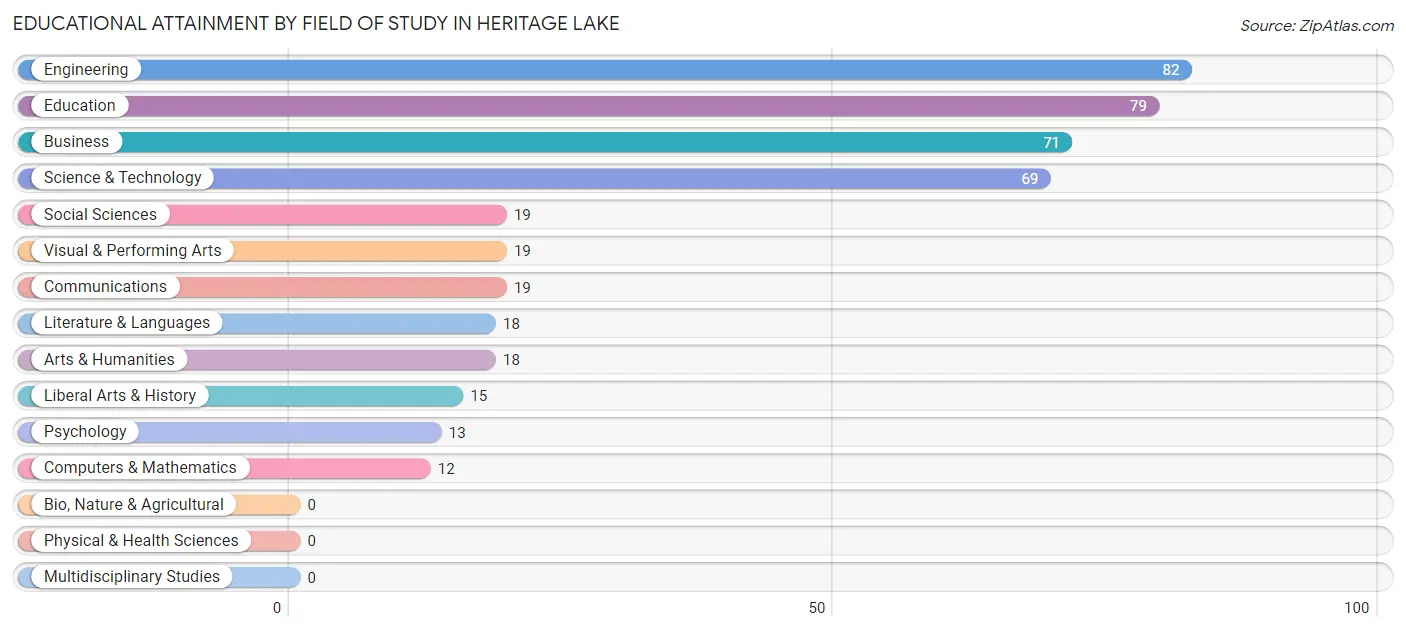
| Field of Study | # Graduates | % Graduates |
| Computers & Mathematics | 12 | 2.8% |
| Bio, Nature & Agricultural | 0 | 0.0% |
| Physical & Health Sciences | 0 | 0.0% |
| Psychology | 13 | 3.0% |
| Social Sciences | 19 | 4.4% |
| Engineering | 82 | 18.9% |
| Multidisciplinary Studies | 0 | 0.0% |
| Science & Technology | 69 | 15.9% |
| Business | 71 | 16.4% |
| Education | 79 | 18.2% |
| Literature & Languages | 18 | 4.2% |
| Liberal Arts & History | 15 | 3.5% |
| Visual & Performing Arts | 19 | 4.4% |
| Communications | 19 | 4.4% |
| Arts & Humanities | 18 | 4.2% |
| Total | 434 | 100.0% |
Transportation & Commute in Heritage Lake
Vehicle Availability by Sex in Heritage Lake
The most prevalent vehicle ownership categories in Heritage Lake are males with 2 vehicles (199, accounting for 43.6%) and females with 2 vehicles (197, making up 59.4%).
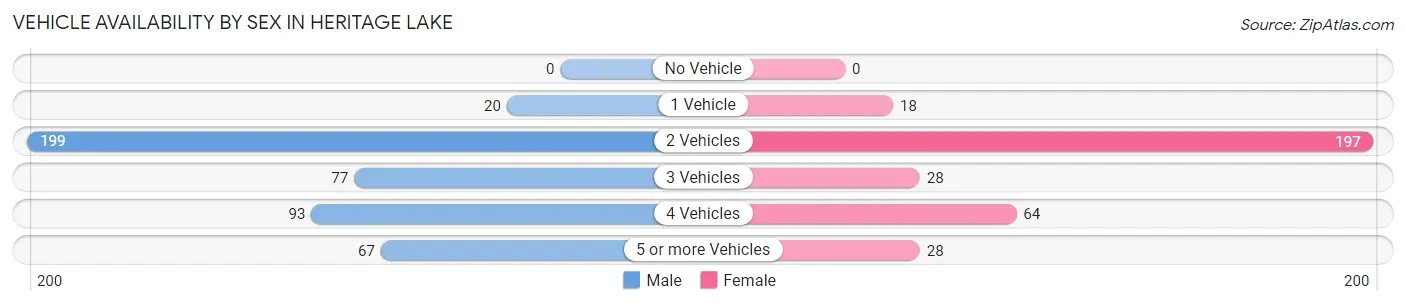
| Vehicles Available | Male | Female |
| No Vehicle | 0 (0.0%) | 0 (0.0%) |
| 1 Vehicle | 20 (4.4%) | 18 (5.4%) |
| 2 Vehicles | 199 (43.6%) | 197 (58.8%) |
| 3 Vehicles | 77 (16.9%) | 28 (8.4%) |
| 4 Vehicles | 93 (20.4%) | 64 (19.1%) |
| 5 or more Vehicles | 67 (14.7%) | 28 (8.4%) |
| Total | 456 (100.0%) | 335 (100.0%) |
Commute Time in Heritage Lake
The most frequently occuring commute durations in Heritage Lake are 30 to 34 minutes (189 commuters, 26.1%), 45 to 59 minutes (111 commuters, 15.3%), and 25 to 29 minutes (85 commuters, 11.7%).
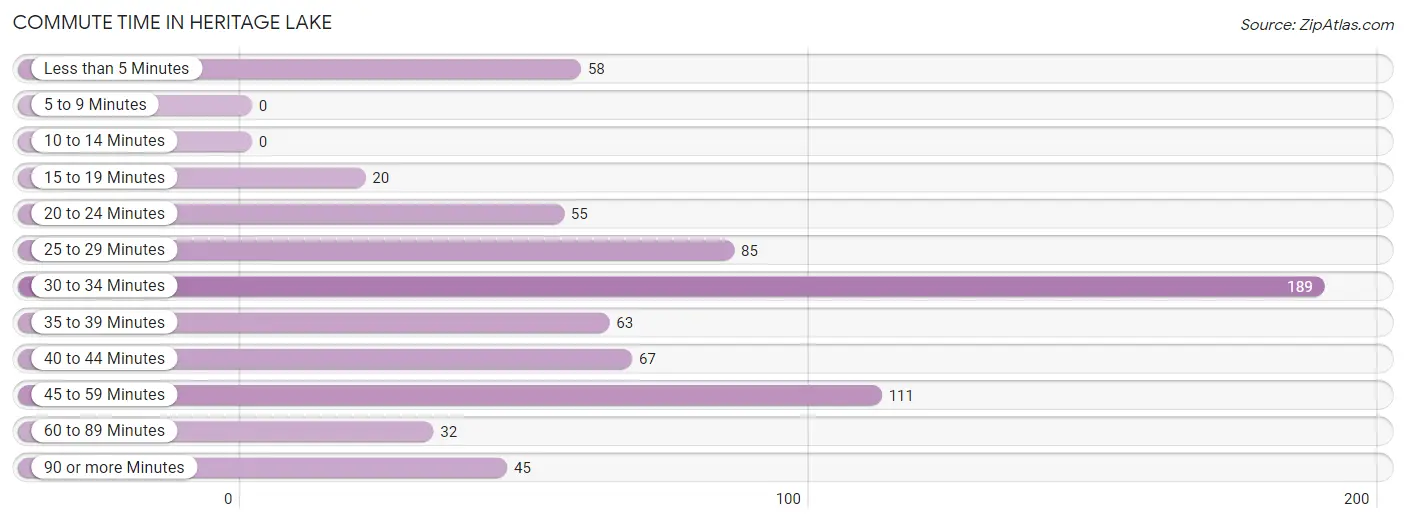
| Commute Time | # Commuters | % Commuters |
| Less than 5 Minutes | 58 | 8.0% |
| 5 to 9 Minutes | 0 | 0.0% |
| 10 to 14 Minutes | 0 | 0.0% |
| 15 to 19 Minutes | 20 | 2.8% |
| 20 to 24 Minutes | 55 | 7.6% |
| 25 to 29 Minutes | 85 | 11.7% |
| 30 to 34 Minutes | 189 | 26.1% |
| 35 to 39 Minutes | 63 | 8.7% |
| 40 to 44 Minutes | 67 | 9.2% |
| 45 to 59 Minutes | 111 | 15.3% |
| 60 to 89 Minutes | 32 | 4.4% |
| 90 or more Minutes | 45 | 6.2% |
Commute Time by Sex in Heritage Lake
The most common commute times in Heritage Lake are 30 to 34 minutes (147 commuters, 36.5%) for males and 25 to 29 minutes (46 commuters, 14.3%) for females.
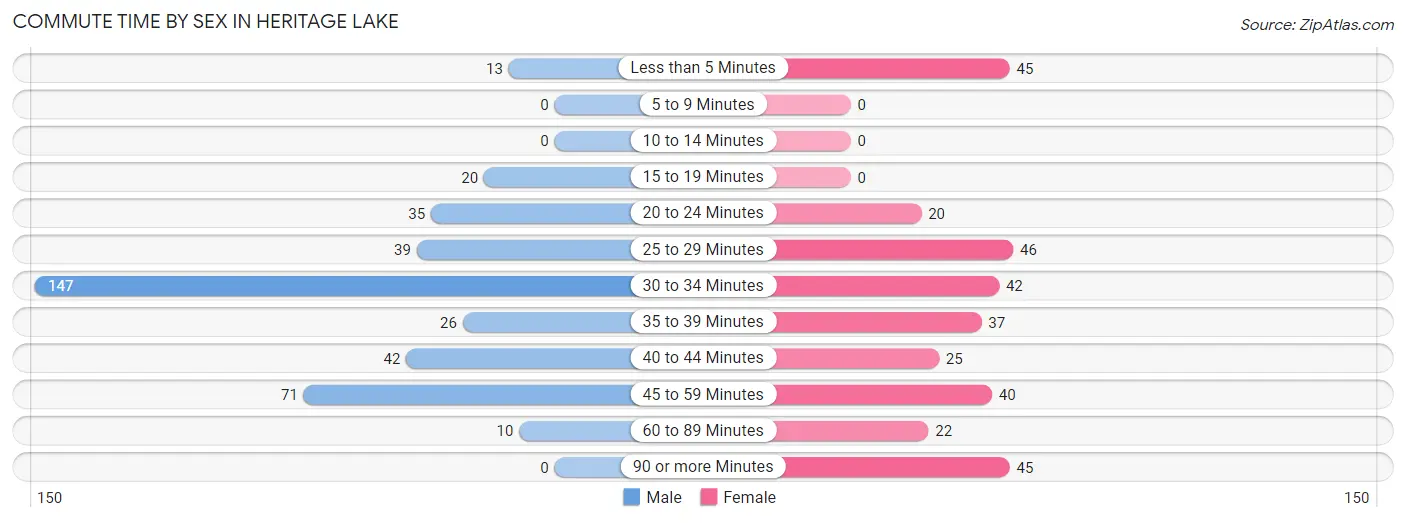
| Commute Time | Male | Female |
| Less than 5 Minutes | 13 (3.2%) | 45 (14.0%) |
| 5 to 9 Minutes | 0 (0.0%) | 0 (0.0%) |
| 10 to 14 Minutes | 0 (0.0%) | 0 (0.0%) |
| 15 to 19 Minutes | 20 (5.0%) | 0 (0.0%) |
| 20 to 24 Minutes | 35 (8.7%) | 20 (6.2%) |
| 25 to 29 Minutes | 39 (9.7%) | 46 (14.3%) |
| 30 to 34 Minutes | 147 (36.5%) | 42 (13.0%) |
| 35 to 39 Minutes | 26 (6.5%) | 37 (11.5%) |
| 40 to 44 Minutes | 42 (10.4%) | 25 (7.8%) |
| 45 to 59 Minutes | 71 (17.6%) | 40 (12.4%) |
| 60 to 89 Minutes | 10 (2.5%) | 22 (6.8%) |
| 90 or more Minutes | 0 (0.0%) | 45 (14.0%) |
Time of Departure to Work by Sex in Heritage Lake
The most frequent times of departure to work in Heritage Lake are 7:00 AM to 7:29 AM (84, 20.8%) for males and 7:30 AM to 7:59 AM (117, 36.3%) for females.
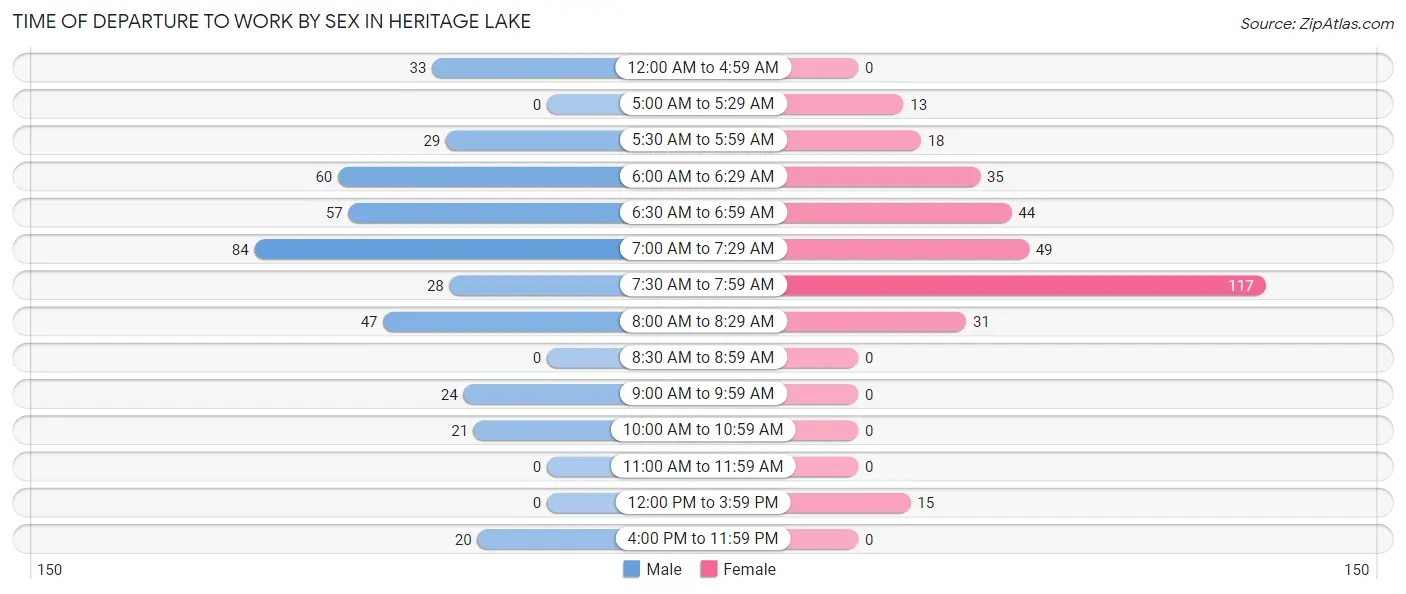
| Time of Departure | Male | Female |
| 12:00 AM to 4:59 AM | 33 (8.2%) | 0 (0.0%) |
| 5:00 AM to 5:29 AM | 0 (0.0%) | 13 (4.0%) |
| 5:30 AM to 5:59 AM | 29 (7.2%) | 18 (5.6%) |
| 6:00 AM to 6:29 AM | 60 (14.9%) | 35 (10.9%) |
| 6:30 AM to 6:59 AM | 57 (14.1%) | 44 (13.7%) |
| 7:00 AM to 7:29 AM | 84 (20.8%) | 49 (15.2%) |
| 7:30 AM to 7:59 AM | 28 (7.0%) | 117 (36.3%) |
| 8:00 AM to 8:29 AM | 47 (11.7%) | 31 (9.6%) |
| 8:30 AM to 8:59 AM | 0 (0.0%) | 0 (0.0%) |
| 9:00 AM to 9:59 AM | 24 (6.0%) | 0 (0.0%) |
| 10:00 AM to 10:59 AM | 21 (5.2%) | 0 (0.0%) |
| 11:00 AM to 11:59 AM | 0 (0.0%) | 0 (0.0%) |
| 12:00 PM to 3:59 PM | 0 (0.0%) | 15 (4.7%) |
| 4:00 PM to 11:59 PM | 20 (5.0%) | 0 (0.0%) |
| Total | 403 (100.0%) | 322 (100.0%) |
Housing Occupancy in Heritage Lake
Occupancy by Ownership in Heritage Lake
Of the total 557 dwellings in Heritage Lake, owner-occupied units account for 539 (96.8%), while renter-occupied units make up 18 (3.2%).
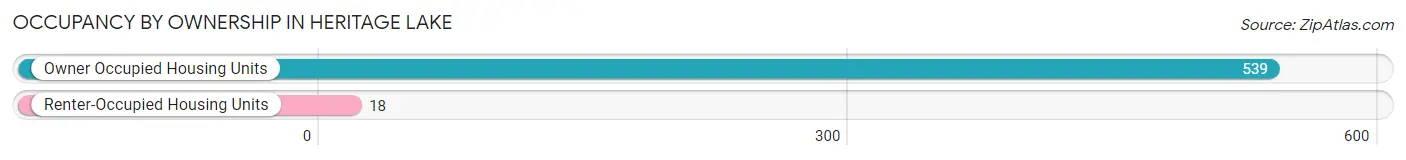
| Occupancy | # Housing Units | % Housing Units |
| Owner Occupied Housing Units | 539 | 96.8% |
| Renter-Occupied Housing Units | 18 | 3.2% |
| Total Occupied Housing Units | 557 | 100.0% |
Occupancy by Household Size in Heritage Lake
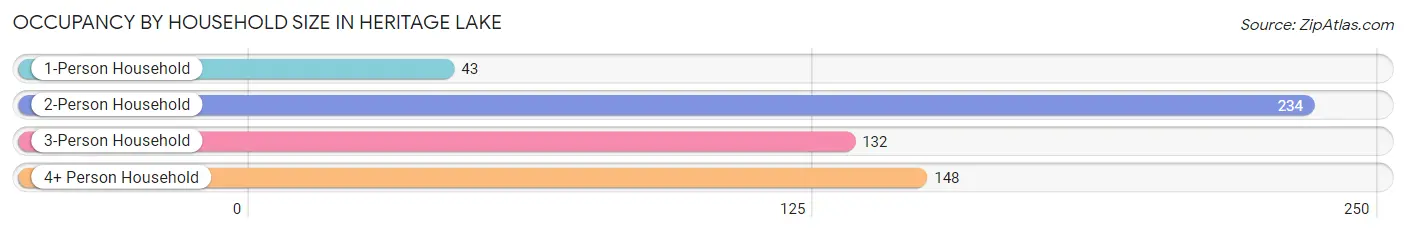
| Household Size | # Housing Units | % Housing Units |
| 1-Person Household | 43 | 7.7% |
| 2-Person Household | 234 | 42.0% |
| 3-Person Household | 132 | 23.7% |
| 4+ Person Household | 148 | 26.6% |
| Total Housing Units | 557 | 100.0% |
Occupancy by Ownership by Household Size in Heritage Lake
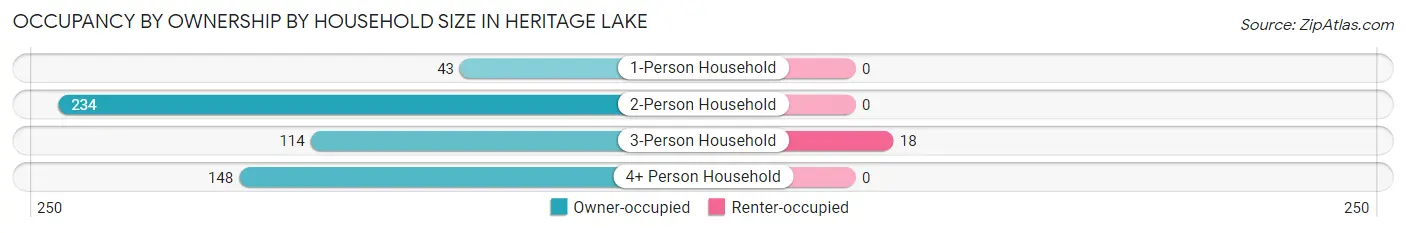
| Household Size | Owner-occupied | Renter-occupied |
| 1-Person Household | 43 (100.0%) | 0 (0.0%) |
| 2-Person Household | 234 (100.0%) | 0 (0.0%) |
| 3-Person Household | 114 (86.4%) | 18 (13.6%) |
| 4+ Person Household | 148 (100.0%) | 0 (0.0%) |
| Total Housing Units | 539 (96.8%) | 18 (3.2%) |
Occupancy by Educational Attainment in Heritage Lake
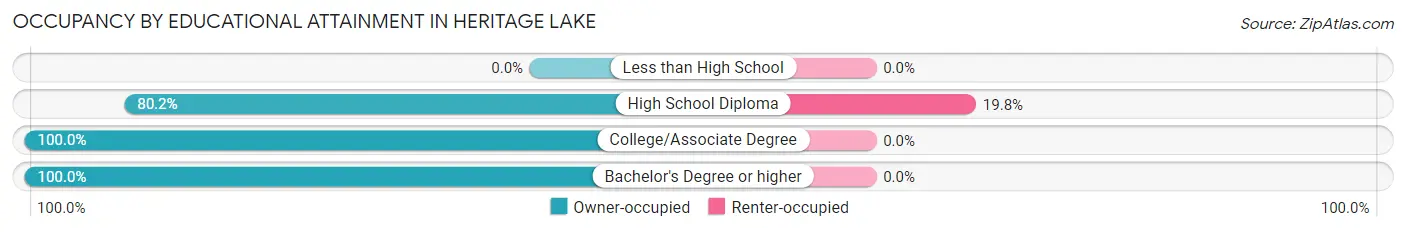
| Household Size | Owner-occupied | Renter-occupied |
| Less than High School | 0 (0.0%) | 0 (0.0%) |
| High School Diploma | 73 (80.2%) | 18 (19.8%) |
| College/Associate Degree | 203 (100.0%) | 0 (0.0%) |
| Bachelor's Degree or higher | 263 (100.0%) | 0 (0.0%) |
Occupancy by Age of Householder in Heritage Lake
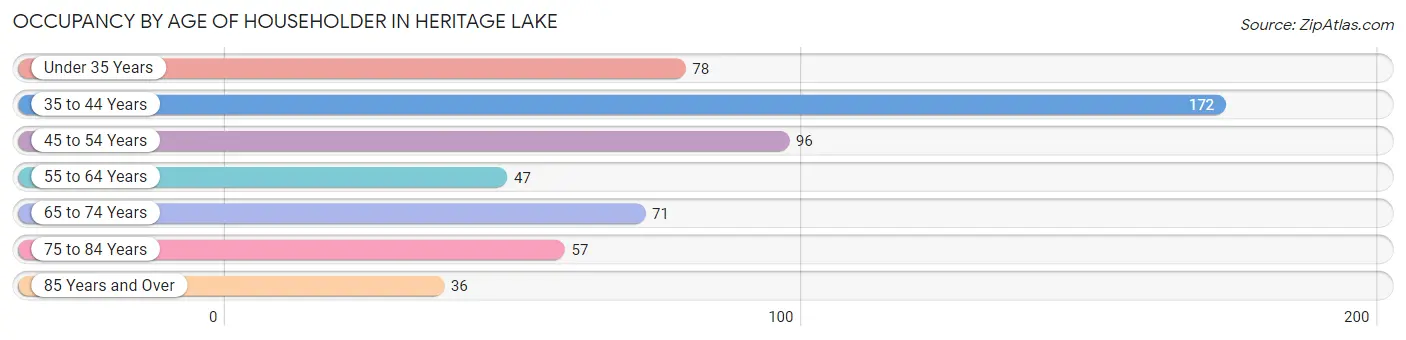
| Age Bracket | # Households | % Households |
| Under 35 Years | 78 | 14.0% |
| 35 to 44 Years | 172 | 30.9% |
| 45 to 54 Years | 96 | 17.2% |
| 55 to 64 Years | 47 | 8.4% |
| 65 to 74 Years | 71 | 12.8% |
| 75 to 84 Years | 57 | 10.2% |
| 85 Years and Over | 36 | 6.5% |
| Total | 557 | 100.0% |
Housing Finances in Heritage Lake
Median Income by Occupancy in Heritage Lake
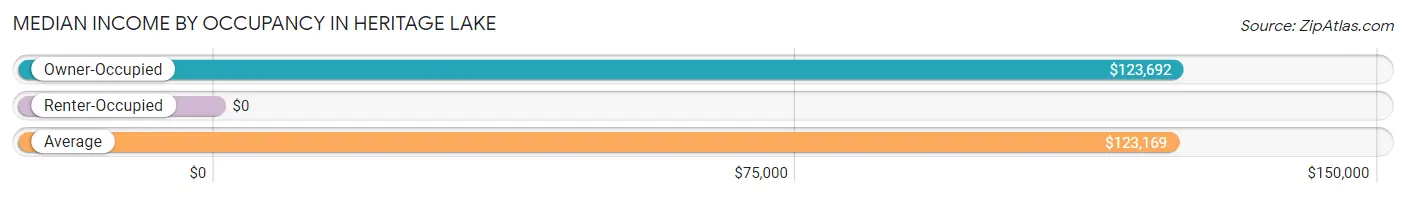
| Occupancy Type | # Households | Median Income |
| Owner-Occupied | 539 (96.8%) | $123,692 |
| Renter-Occupied | 18 (3.2%) | $0 |
| Average | 557 (100.0%) | $123,169 |
Occupancy by Householder Income Bracket in Heritage Lake
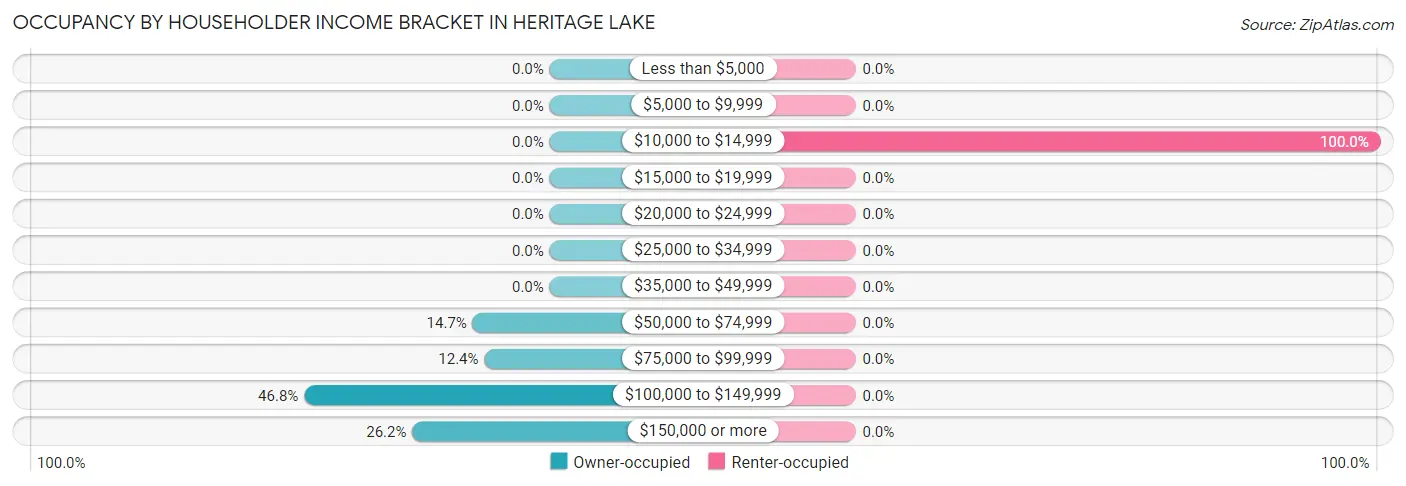
| Income Bracket | Owner-occupied | Renter-occupied |
| Less than $5,000 | 0 (0.0%) | 0 (0.0%) |
| $5,000 to $9,999 | 0 (0.0%) | 0 (0.0%) |
| $10,000 to $14,999 | 0 (0.0%) | 18 (100.0%) |
| $15,000 to $19,999 | 0 (0.0%) | 0 (0.0%) |
| $20,000 to $24,999 | 0 (0.0%) | 0 (0.0%) |
| $25,000 to $34,999 | 0 (0.0%) | 0 (0.0%) |
| $35,000 to $49,999 | 0 (0.0%) | 0 (0.0%) |
| $50,000 to $74,999 | 79 (14.7%) | 0 (0.0%) |
| $75,000 to $99,999 | 67 (12.4%) | 0 (0.0%) |
| $100,000 to $149,999 | 252 (46.8%) | 0 (0.0%) |
| $150,000 or more | 141 (26.2%) | 0 (0.0%) |
| Total | 539 (100.0%) | 18 (100.0%) |
Monthly Housing Cost Tiers in Heritage Lake
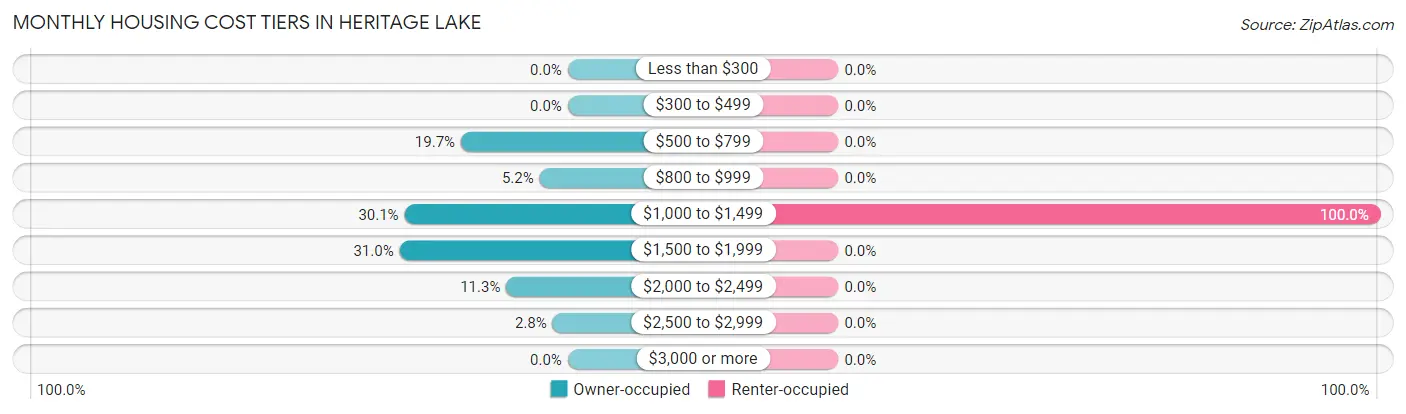
| Monthly Cost | Owner-occupied | Renter-occupied |
| Less than $300 | 0 (0.0%) | 0 (0.0%) |
| $300 to $499 | 0 (0.0%) | 0 (0.0%) |
| $500 to $799 | 106 (19.7%) | 0 (0.0%) |
| $800 to $999 | 28 (5.2%) | 0 (0.0%) |
| $1,000 to $1,499 | 162 (30.1%) | 18 (100.0%) |
| $1,500 to $1,999 | 167 (31.0%) | 0 (0.0%) |
| $2,000 to $2,499 | 61 (11.3%) | 0 (0.0%) |
| $2,500 to $2,999 | 15 (2.8%) | 0 (0.0%) |
| $3,000 or more | 0 (0.0%) | 0 (0.0%) |
| Total | 539 (100.0%) | 18 (100.0%) |
Physical Housing Characteristics in Heritage Lake
Housing Structures in Heritage Lake
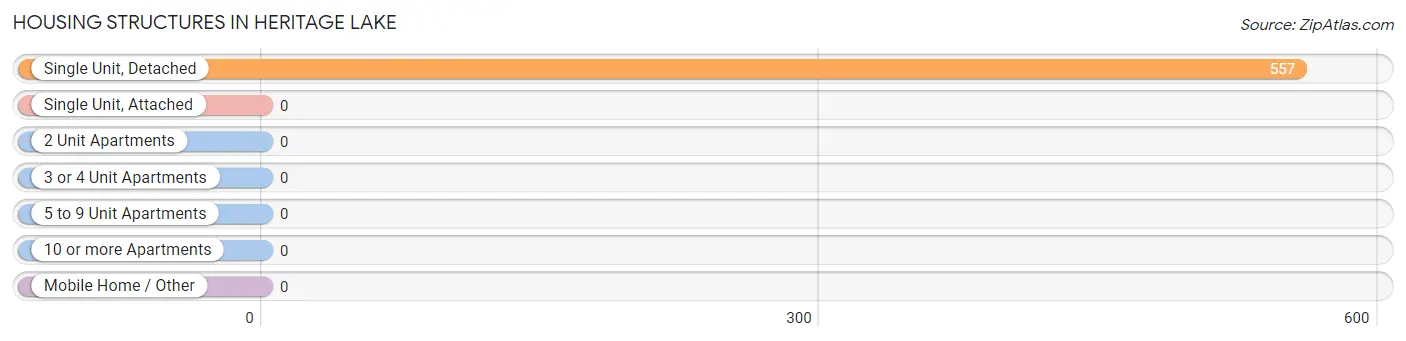
| Structure Type | # Housing Units | % Housing Units |
| Single Unit, Detached | 557 | 100.0% |
| Single Unit, Attached | 0 | 0.0% |
| 2 Unit Apartments | 0 | 0.0% |
| 3 or 4 Unit Apartments | 0 | 0.0% |
| 5 to 9 Unit Apartments | 0 | 0.0% |
| 10 or more Apartments | 0 | 0.0% |
| Mobile Home / Other | 0 | 0.0% |
| Total | 557 | 100.0% |
Housing Structures by Occupancy in Heritage Lake
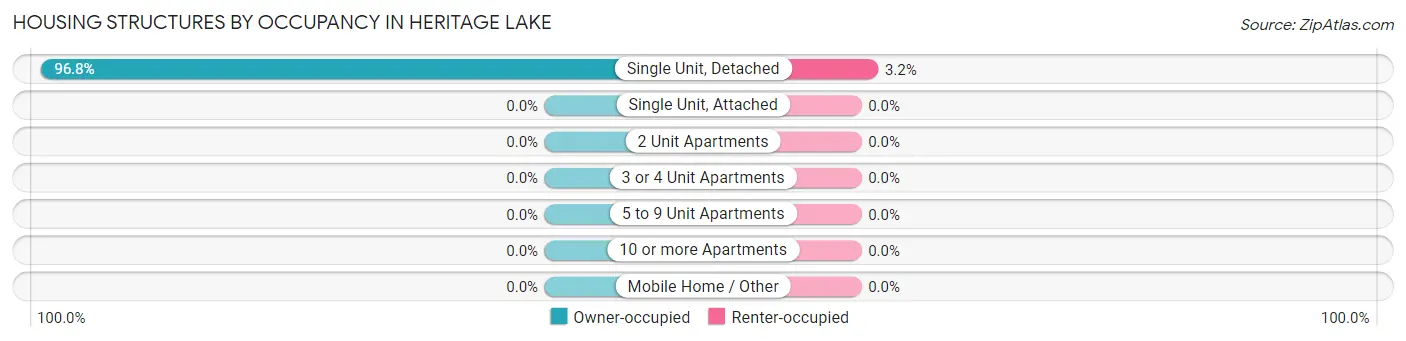
| Structure Type | Owner-occupied | Renter-occupied |
| Single Unit, Detached | 539 (96.8%) | 18 (3.2%) |
| Single Unit, Attached | 0 (0.0%) | 0 (0.0%) |
| 2 Unit Apartments | 0 (0.0%) | 0 (0.0%) |
| 3 or 4 Unit Apartments | 0 (0.0%) | 0 (0.0%) |
| 5 to 9 Unit Apartments | 0 (0.0%) | 0 (0.0%) |
| 10 or more Apartments | 0 (0.0%) | 0 (0.0%) |
| Mobile Home / Other | 0 (0.0%) | 0 (0.0%) |
| Total | 539 (96.8%) | 18 (3.2%) |
Housing Structures by Number of Rooms in Heritage Lake
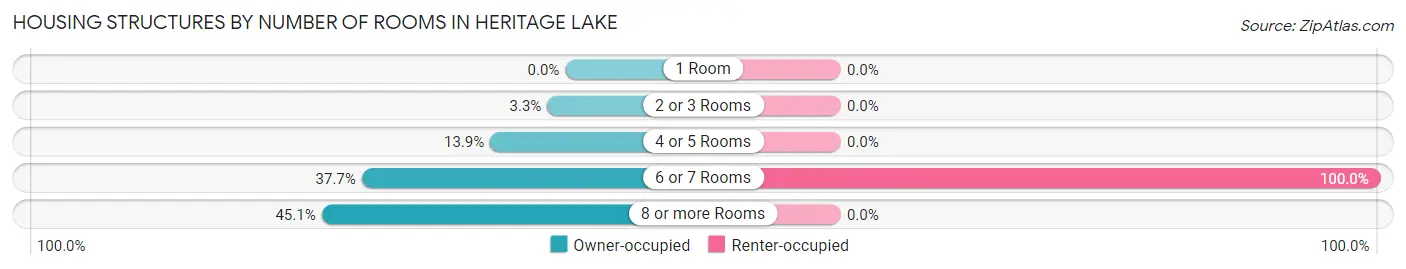
| Number of Rooms | Owner-occupied | Renter-occupied |
| 1 Room | 0 (0.0%) | 0 (0.0%) |
| 2 or 3 Rooms | 18 (3.3%) | 0 (0.0%) |
| 4 or 5 Rooms | 75 (13.9%) | 0 (0.0%) |
| 6 or 7 Rooms | 203 (37.7%) | 18 (100.0%) |
| 8 or more Rooms | 243 (45.1%) | 0 (0.0%) |
| Total | 539 (100.0%) | 18 (100.0%) |
Housing Structure by Heating Type in Heritage Lake
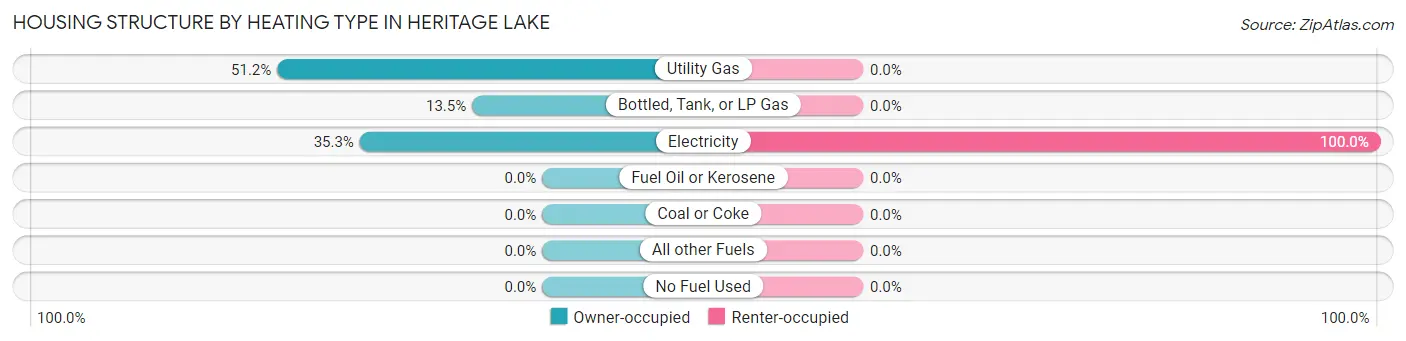
| Heating Type | Owner-occupied | Renter-occupied |
| Utility Gas | 276 (51.2%) | 0 (0.0%) |
| Bottled, Tank, or LP Gas | 73 (13.5%) | 0 (0.0%) |
| Electricity | 190 (35.2%) | 18 (100.0%) |
| Fuel Oil or Kerosene | 0 (0.0%) | 0 (0.0%) |
| Coal or Coke | 0 (0.0%) | 0 (0.0%) |
| All other Fuels | 0 (0.0%) | 0 (0.0%) |
| No Fuel Used | 0 (0.0%) | 0 (0.0%) |
| Total | 539 (100.0%) | 18 (100.0%) |
Household Vehicle Usage in Heritage Lake
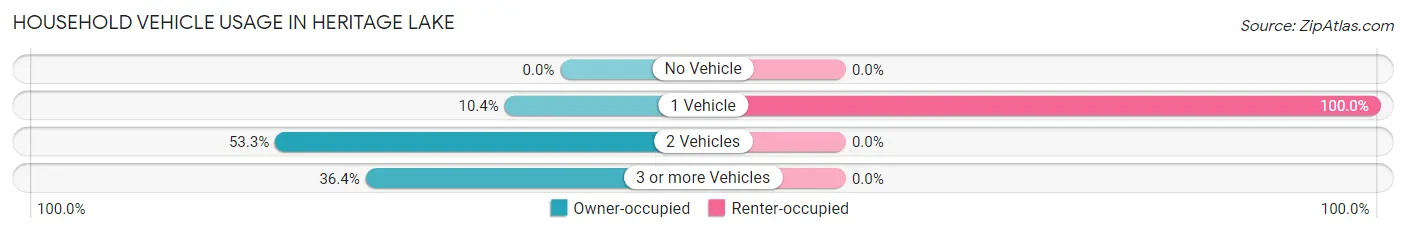
| Vehicles per Household | Owner-occupied | Renter-occupied |
| No Vehicle | 0 (0.0%) | 0 (0.0%) |
| 1 Vehicle | 56 (10.4%) | 18 (100.0%) |
| 2 Vehicles | 287 (53.2%) | 0 (0.0%) |
| 3 or more Vehicles | 196 (36.4%) | 0 (0.0%) |
| Total | 539 (100.0%) | 18 (100.0%) |
Real Estate & Mortgages in Heritage Lake
Real Estate and Mortgage Overview in Heritage Lake
| Characteristic | Without Mortgage | With Mortgage |
| Housing Units | 134 | 405 |
| Median Property Value | $213,300 | $205,900 |
| Median Household Income | $76,833 | $123 |
| Monthly Housing Costs | $692 | $0 |
| Real Estate Taxes | $4,686 | $0 |
Property Value by Mortgage Status in Heritage Lake
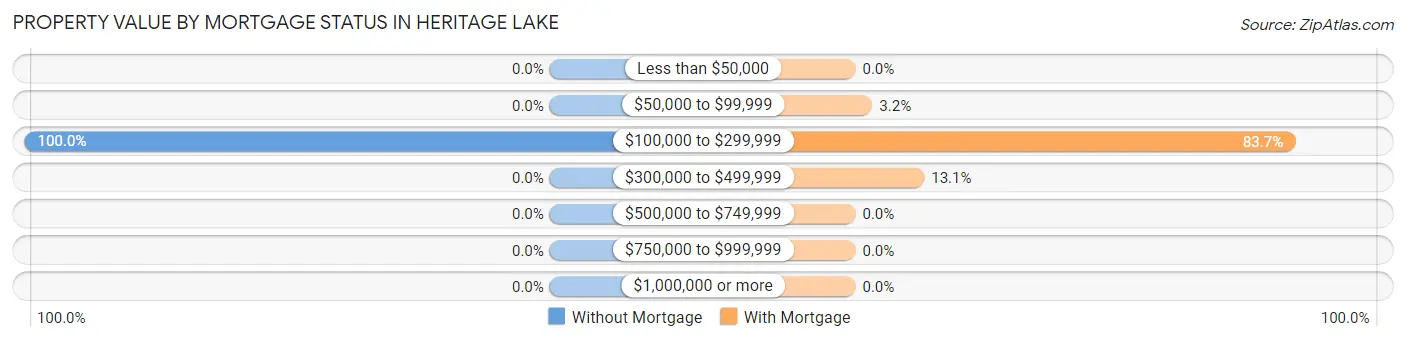
| Property Value | Without Mortgage | With Mortgage |
| Less than $50,000 | 0 (0.0%) | 0 (0.0%) |
| $50,000 to $99,999 | 0 (0.0%) | 13 (3.2%) |
| $100,000 to $299,999 | 134 (100.0%) | 339 (83.7%) |
| $300,000 to $499,999 | 0 (0.0%) | 53 (13.1%) |
| $500,000 to $749,999 | 0 (0.0%) | 0 (0.0%) |
| $750,000 to $999,999 | 0 (0.0%) | 0 (0.0%) |
| $1,000,000 or more | 0 (0.0%) | 0 (0.0%) |
| Total | 134 (100.0%) | 405 (100.0%) |
Household Income by Mortgage Status in Heritage Lake
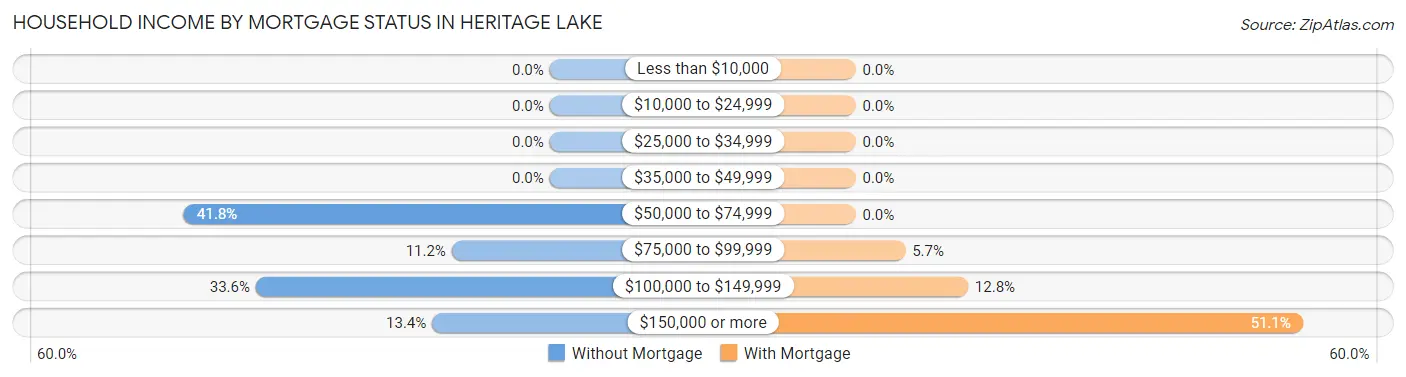
| Household Income | Without Mortgage | With Mortgage |
| Less than $10,000 | 0 (0.0%) | 0 (0.0%) |
| $10,000 to $24,999 | 0 (0.0%) | 0 (0.0%) |
| $25,000 to $34,999 | 0 (0.0%) | 0 (0.0%) |
| $35,000 to $49,999 | 0 (0.0%) | 0 (0.0%) |
| $50,000 to $74,999 | 56 (41.8%) | 0 (0.0%) |
| $75,000 to $99,999 | 15 (11.2%) | 23 (5.7%) |
| $100,000 to $149,999 | 45 (33.6%) | 52 (12.8%) |
| $150,000 or more | 18 (13.4%) | 207 (51.1%) |
| Total | 134 (100.0%) | 405 (100.0%) |
Property Value to Household Income Ratio in Heritage Lake
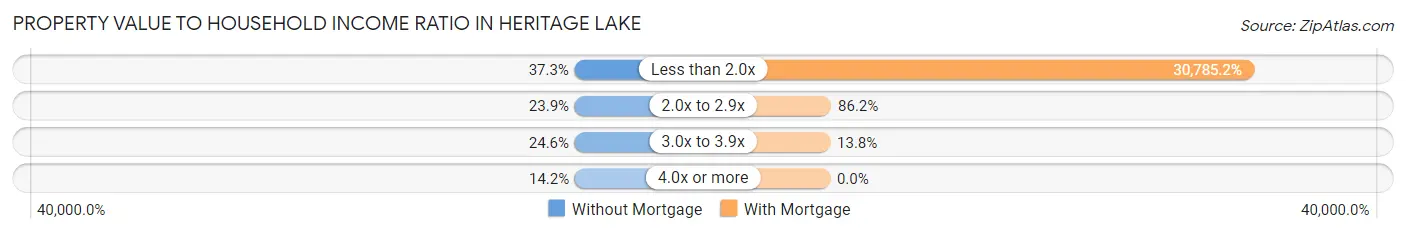
| Value-to-Income Ratio | Without Mortgage | With Mortgage |
| Less than 2.0x | 50 (37.3%) | 124,680 (30,785.2%) |
| 2.0x to 2.9x | 32 (23.9%) | 349 (86.2%) |
| 3.0x to 3.9x | 33 (24.6%) | 56 (13.8%) |
| 4.0x or more | 19 (14.2%) | 0 (0.0%) |
| Total | 134 (100.0%) | 405 (100.0%) |
Real Estate Taxes by Mortgage Status in Heritage Lake
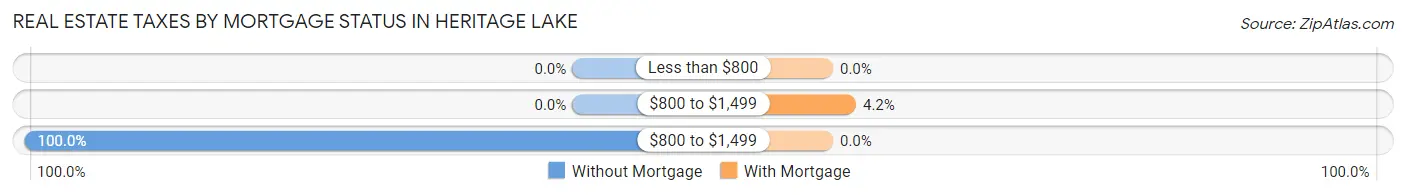
| Property Taxes | Without Mortgage | With Mortgage |
| Less than $800 | 0 (0.0%) | 0 (0.0%) |
| $800 to $1,499 | 0 (0.0%) | 17 (4.2%) |
| $800 to $1,499 | 134 (100.0%) | 0 (0.0%) |
| Total | 134 (100.0%) | 405 (100.0%) |
Health & Disability in Heritage Lake
Health Insurance Coverage by Age in Heritage Lake
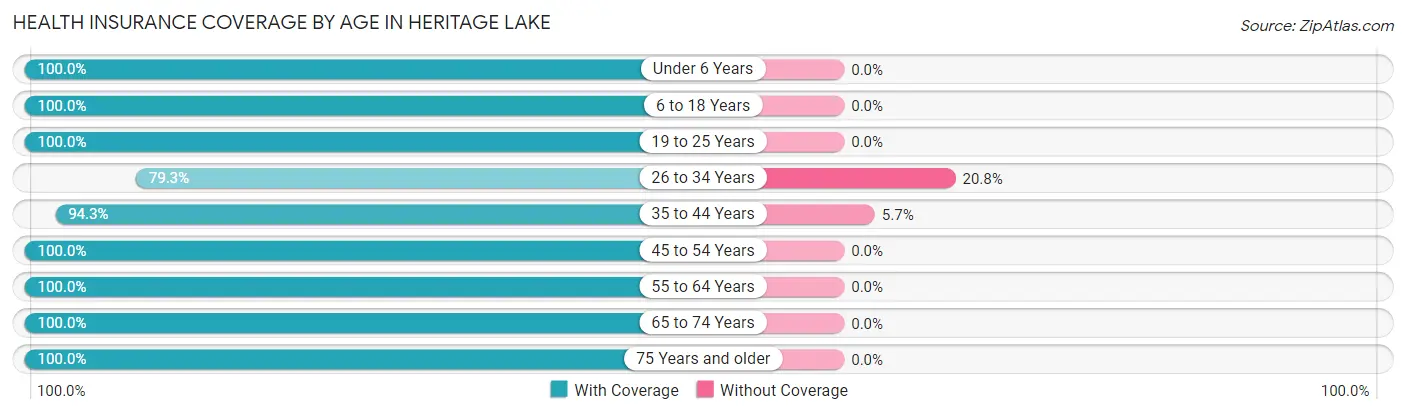
| Age Bracket | With Coverage | Without Coverage |
| Under 6 Years | 98 (100.0%) | 0 (0.0%) |
| 6 to 18 Years | 340 (100.0%) | 0 (0.0%) |
| 19 to 25 Years | 90 (100.0%) | 0 (0.0%) |
| 26 to 34 Years | 126 (79.2%) | 33 (20.7%) |
| 35 to 44 Years | 297 (94.3%) | 18 (5.7%) |
| 45 to 54 Years | 150 (100.0%) | 0 (0.0%) |
| 55 to 64 Years | 174 (100.0%) | 0 (0.0%) |
| 65 to 74 Years | 158 (100.0%) | 0 (0.0%) |
| 75 Years and older | 111 (100.0%) | 0 (0.0%) |
| Total | 1,544 (96.8%) | 51 (3.2%) |
Health Insurance Coverage by Citizenship Status in Heritage Lake
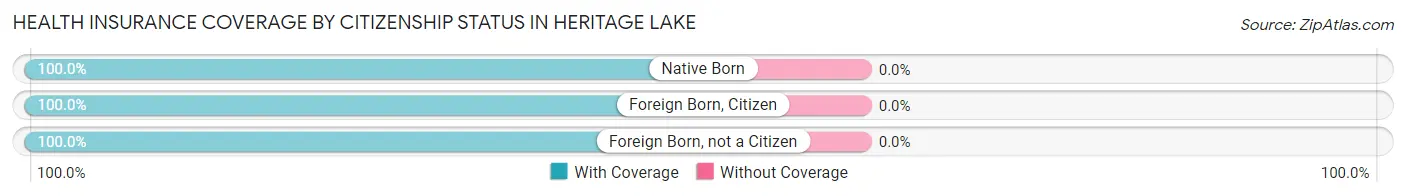
| Citizenship Status | With Coverage | Without Coverage |
| Native Born | 98 (100.0%) | 0 (0.0%) |
| Foreign Born, Citizen | 340 (100.0%) | 0 (0.0%) |
| Foreign Born, not a Citizen | 90 (100.0%) | 0 (0.0%) |
Health Insurance Coverage by Household Income in Heritage Lake
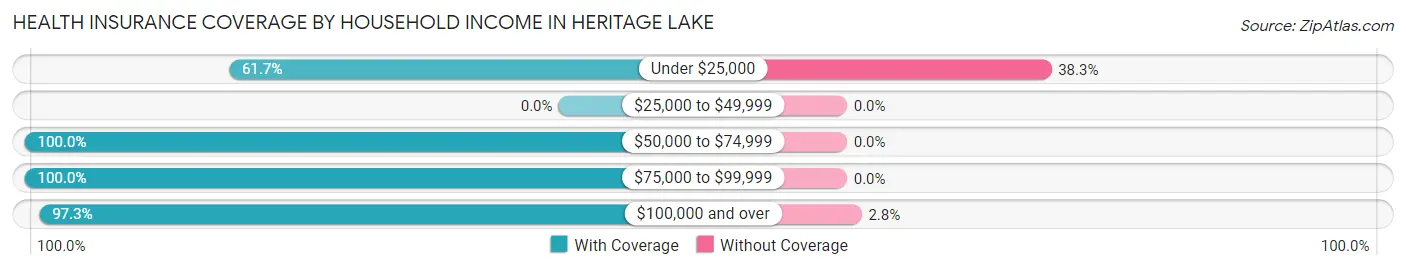
| Household Income | With Coverage | Without Coverage |
| Under $25,000 | 29 (61.7%) | 18 (38.3%) |
| $25,000 to $49,999 | 0 (0.0%) | 0 (0.0%) |
| $50,000 to $74,999 | 188 (100.0%) | 0 (0.0%) |
| $75,000 to $99,999 | 160 (100.0%) | 0 (0.0%) |
| $100,000 and over | 1,167 (97.3%) | 33 (2.8%) |
Public vs Private Health Insurance Coverage by Age in Heritage Lake
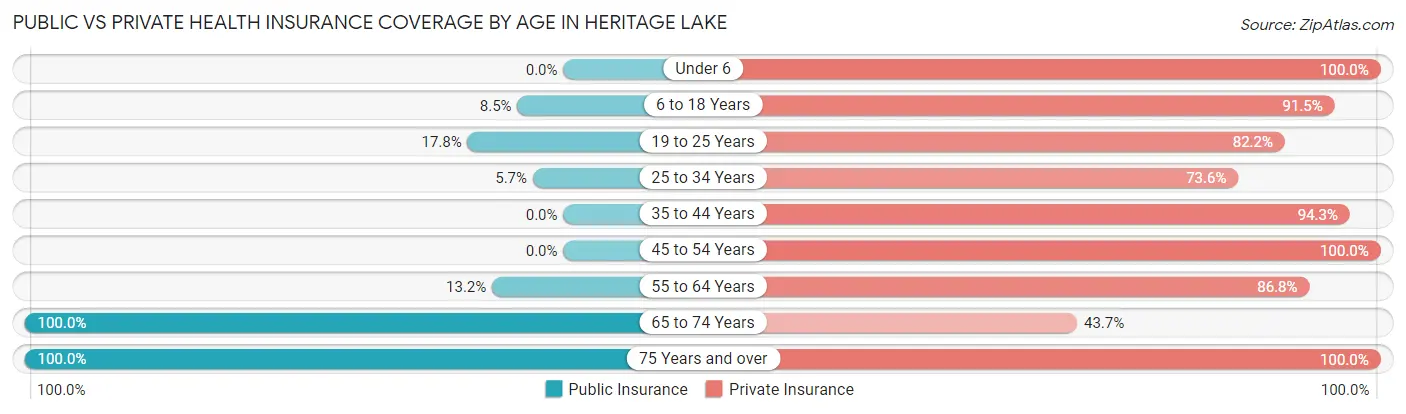
| Age Bracket | Public Insurance | Private Insurance |
| Under 6 | 0 (0.0%) | 98 (100.0%) |
| 6 to 18 Years | 29 (8.5%) | 311 (91.5%) |
| 19 to 25 Years | 16 (17.8%) | 74 (82.2%) |
| 25 to 34 Years | 9 (5.7%) | 117 (73.6%) |
| 35 to 44 Years | 0 (0.0%) | 297 (94.3%) |
| 45 to 54 Years | 0 (0.0%) | 150 (100.0%) |
| 55 to 64 Years | 23 (13.2%) | 151 (86.8%) |
| 65 to 74 Years | 158 (100.0%) | 69 (43.7%) |
| 75 Years and over | 111 (100.0%) | 111 (100.0%) |
| Total | 346 (21.7%) | 1,378 (86.4%) |
Disability Status by Sex by Age in Heritage Lake
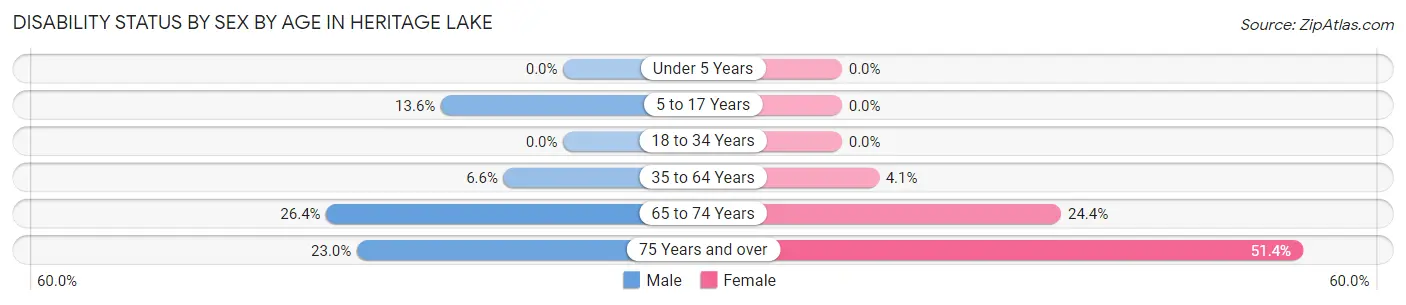
| Age Bracket | Male | Female |
| Under 5 Years | 0 (0.0%) | 0 (0.0%) |
| 5 to 17 Years | 26 (13.6%) | 0 (0.0%) |
| 18 to 34 Years | 0 (0.0%) | 0 (0.0%) |
| 35 to 64 Years | 23 (6.6%) | 12 (4.1%) |
| 65 to 74 Years | 19 (26.4%) | 21 (24.4%) |
| 75 Years and over | 17 (23.0%) | 19 (51.3%) |
Disability Class by Sex by Age in Heritage Lake
Disability Class: Hearing Difficulty
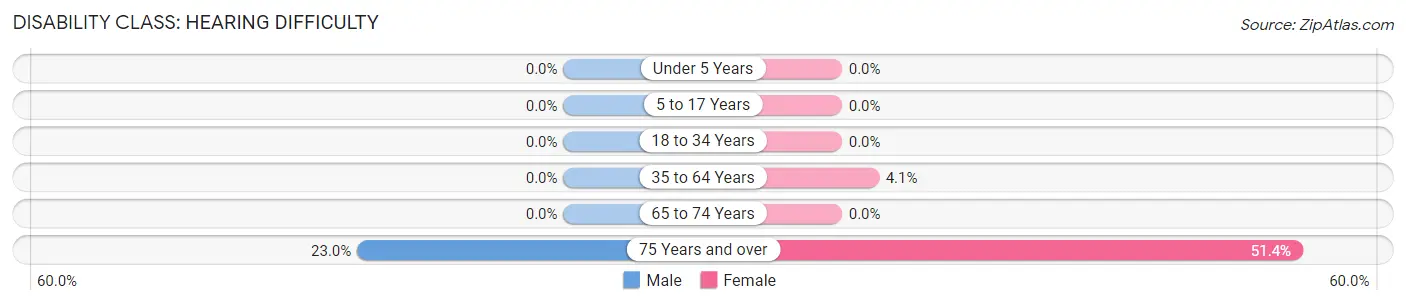
| Age Bracket | Male | Female |
| Under 5 Years | 0 (0.0%) | 0 (0.0%) |
| 5 to 17 Years | 0 (0.0%) | 0 (0.0%) |
| 18 to 34 Years | 0 (0.0%) | 0 (0.0%) |
| 35 to 64 Years | 0 (0.0%) | 12 (4.1%) |
| 65 to 74 Years | 0 (0.0%) | 0 (0.0%) |
| 75 Years and over | 17 (23.0%) | 19 (51.3%) |
Disability Class: Vision Difficulty
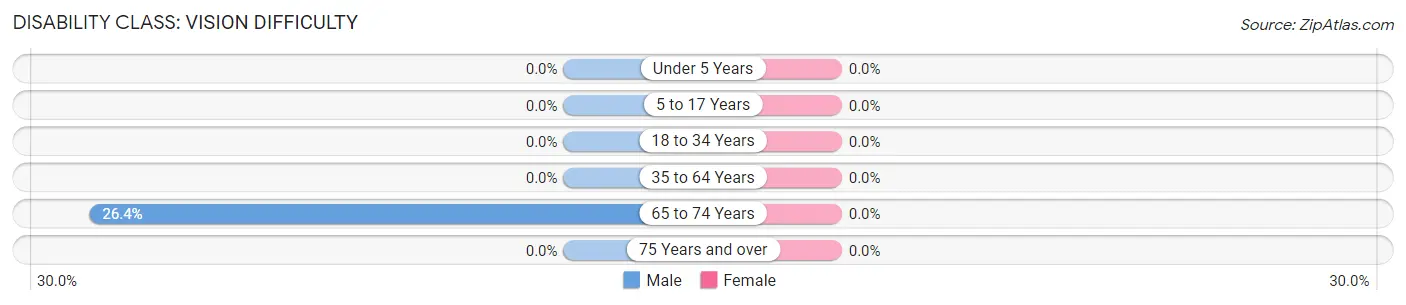
| Age Bracket | Male | Female |
| Under 5 Years | 0 (0.0%) | 0 (0.0%) |
| 5 to 17 Years | 0 (0.0%) | 0 (0.0%) |
| 18 to 34 Years | 0 (0.0%) | 0 (0.0%) |
| 35 to 64 Years | 0 (0.0%) | 0 (0.0%) |
| 65 to 74 Years | 19 (26.4%) | 0 (0.0%) |
| 75 Years and over | 0 (0.0%) | 0 (0.0%) |
Disability Class: Cognitive Difficulty
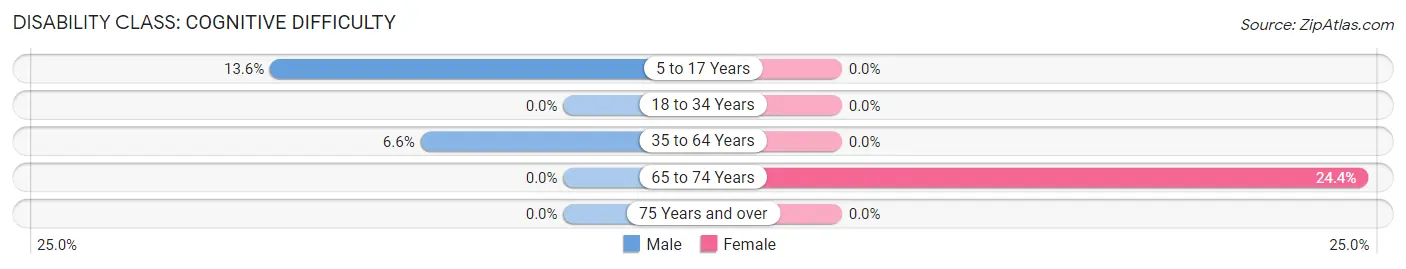
| Age Bracket | Male | Female |
| 5 to 17 Years | 26 (13.6%) | 0 (0.0%) |
| 18 to 34 Years | 0 (0.0%) | 0 (0.0%) |
| 35 to 64 Years | 23 (6.6%) | 0 (0.0%) |
| 65 to 74 Years | 0 (0.0%) | 21 (24.4%) |
| 75 Years and over | 0 (0.0%) | 0 (0.0%) |
Disability Class: Ambulatory Difficulty
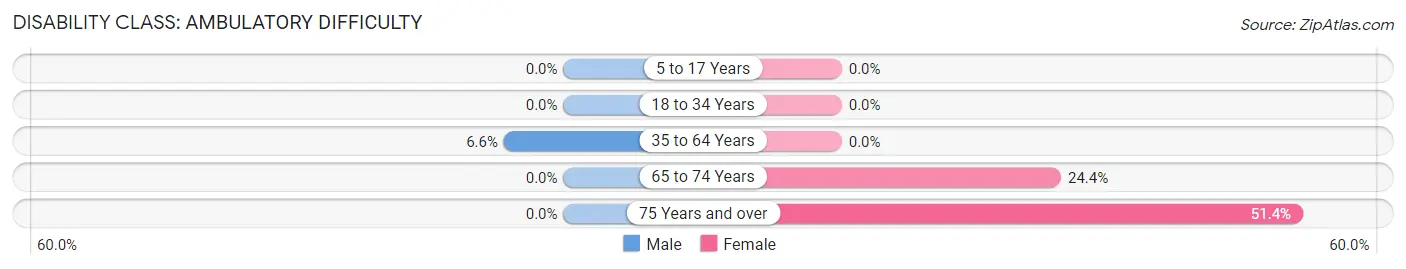
| Age Bracket | Male | Female |
| 5 to 17 Years | 0 (0.0%) | 0 (0.0%) |
| 18 to 34 Years | 0 (0.0%) | 0 (0.0%) |
| 35 to 64 Years | 23 (6.6%) | 0 (0.0%) |
| 65 to 74 Years | 0 (0.0%) | 21 (24.4%) |
| 75 Years and over | 0 (0.0%) | 19 (51.3%) |
Disability Class: Self-Care Difficulty
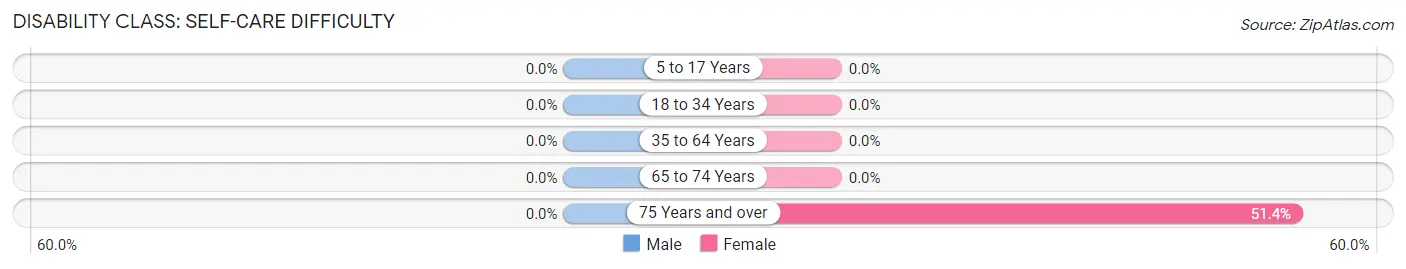
| Age Bracket | Male | Female |
| 5 to 17 Years | 0 (0.0%) | 0 (0.0%) |
| 18 to 34 Years | 0 (0.0%) | 0 (0.0%) |
| 35 to 64 Years | 0 (0.0%) | 0 (0.0%) |
| 65 to 74 Years | 0 (0.0%) | 0 (0.0%) |
| 75 Years and over | 0 (0.0%) | 19 (51.3%) |
Technology Access in Heritage Lake
Computing Device Access in Heritage Lake
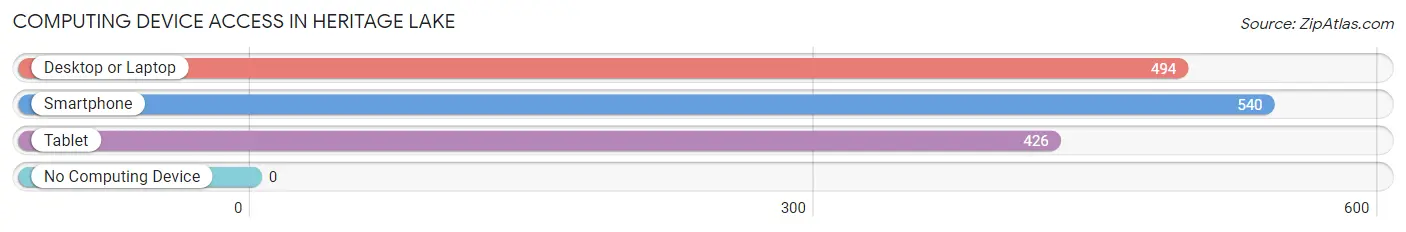
| Device Type | # Households | % Households |
| Desktop or Laptop | 494 | 88.7% |
| Smartphone | 540 | 97.0% |
| Tablet | 426 | 76.5% |
| No Computing Device | 0 | 0.0% |
| Total | 557 | 100.0% |
Internet Access in Heritage Lake
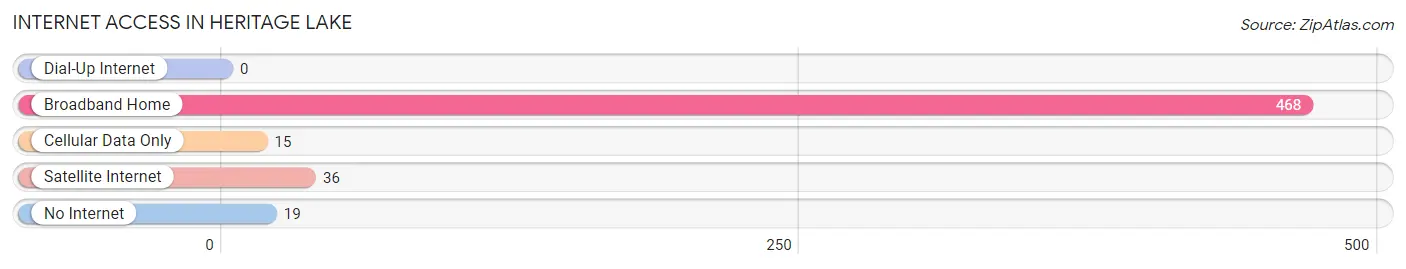
| Internet Type | # Households | % Households |
| Dial-Up Internet | 0 | 0.0% |
| Broadband Home | 468 | 84.0% |
| Cellular Data Only | 15 | 2.7% |
| Satellite Internet | 36 | 6.5% |
| No Internet | 19 | 3.4% |
| Total | 557 | 100.0% |
Heritage Lake Summary
Heritage Lake is a census-designated place located in McHenry County, Illinois. It is situated in the northeastern corner of the county, approximately 40 miles northwest of Chicago. The population of Heritage Lake was 2,845 at the 2010 census.
Geography
Heritage Lake is located at 42°17'25"N 88°20'45"W (42.290278, -88.345833). According to the United States Census Bureau, the CDP has a total area of 4.2 square miles, all of it land.
History
Heritage Lake was first settled in the early 1800s by German immigrants. The area was originally known as “German Valley” and was home to a number of small farms. In the late 1800s, the area was renamed “Heritage Lake” after a nearby lake. The lake was named after the first settlers of the area, who were of German heritage.
In the early 1900s, the area began to develop as a resort community. The lake was a popular destination for fishing and swimming, and the area was home to several resorts and cabins. In the 1950s, the area began to develop as a residential community. The population of Heritage Lake has grown steadily since then, and the area is now home to a variety of businesses and services.
Economy
Heritage Lake is primarily a residential community, but it is also home to a variety of businesses and services. The area is home to a number of retail stores, restaurants, and other businesses. The area is also home to a number of medical and professional services.
The largest employer in the area is the McHenry County government, which employs a number of people in the area. Other major employers include the local school district, a number of manufacturing companies, and a variety of other businesses.
Demographics
As of the 2010 census, the population of Heritage Lake was 2,845. The racial makeup of the area was 94.3% White, 1.2% African American, 0.3% Native American, 1.2% Asian, 0.1% Pacific Islander, 1.2% from other races, and 1.9% from two or more races. Hispanic or Latino of any race were 4.2% of the population.
The median income for a household in the area was $68,958, and the median income for a family was $76,958. The per capita income for the area was $30,958. About 4.2% of families and 5.2% of the population were below the poverty line, including 6.2% of those under age 18 and 4.2% of those age 65 or over.
Conclusion
Heritage Lake is a census-designated place located in McHenry County, Illinois. It is situated in the northeastern corner of the county, approximately 40 miles northwest of Chicago. The population of Heritage Lake was 2,845 at the 2010 census. The area is primarily a residential community, but it is also home to a variety of businesses and services. The largest employer in the area is the McHenry County government. The racial makeup of the area was 94.3% White, 1.2% African American, 0.3% Native American, 1.2% Asian, 0.1% Pacific Islander, 1.2% from other races, and 1.9% from two or more races. The median income for a household in the area was $68,958, and the median income for a family was $76,958.
Common Questions
What is Per Capita Income in Heritage Lake?
Per Capita income in Heritage Lake is $44,553.
What is the Median Family Income in Heritage Lake?
Median Family Income in Heritage Lake is $126,538.
What is the Median Household income in Heritage Lake?
Median Household Income in Heritage Lake is $123,169.
What is Income or Wage Gap in Heritage Lake?
Income or Wage Gap in Heritage Lake is 31.3%.
Women in Heritage Lake earn 68.7 cents for every dollar earned by a man.
What is Inequality or Gini Index in Heritage Lake?
Inequality or Gini Index in Heritage Lake is 0.23.
What is the Total Population of Heritage Lake?
Total Population of Heritage Lake is 1,595.
What is the Total Male Population of Heritage Lake?
Total Male Population of Heritage Lake is 838.
What is the Total Female Population of Heritage Lake?
Total Female Population of Heritage Lake is 757.
What is the Ratio of Males per 100 Females in Heritage Lake?
There are 110.70 Males per 100 Females in Heritage Lake.
What is the Ratio of Females per 100 Males in Heritage Lake?
There are 90.33 Females per 100 Males in Heritage Lake.
What is the Median Population Age in Heritage Lake?
Median Population Age in Heritage Lake is 37.8 Years.
What is the Average Family Size in Heritage Lake
Average Family Size in Heritage Lake is 3.0 People.
What is the Average Household Size in Heritage Lake
Average Household Size in Heritage Lake is 2.9 People.
How Large is the Labor Force in Heritage Lake?
There are 805 People in the Labor Forcein in Heritage Lake.
What is the Percentage of People in the Labor Force in Heritage Lake?
67.8% of People are in the Labor Force in Heritage Lake.