Ingalls Park, IL Map & Demographics
Ingalls Park Map
Ingalls Park Overview
$27,673
PER CAPITA INCOME
$79,647
AVG FAMILY INCOME
$53,257
AVG HOUSEHOLD INCOME
27.8%
WAGE / INCOME GAP [ % ]
72.2¢/ $1
WAGE / INCOME GAP [ $ ]
0.40
INEQUALITY / GINI INDEX
3,102
TOTAL POPULATION
1,455
MALE POPULATION
1,647
FEMALE POPULATION
88.34
MALES / 100 FEMALES
113.20
FEMALES / 100 MALES
35.9
MEDIAN AGE
3.7
AVG FAMILY SIZE
2.6
AVG HOUSEHOLD SIZE
1,695
LABOR FORCE [ PEOPLE ]
68.0%
PERCENT IN LABOR FORCE
9.3%
UNEMPLOYMENT RATE
Income in Ingalls Park
Income Overview in Ingalls Park
Per Capita Income in Ingalls Park is $27,673, while median incomes of families and households are $79,647 and $53,257 respectively.
| Characteristic | Number | Measure |
| Per Capita Income | 3,102 | $27,673 |
| Median Family Income | 601 | $79,647 |
| Mean Family Income | 601 | $85,431 |
| Median Household Income | 1,209 | $53,257 |
| Mean Household Income | 1,209 | $66,921 |
| Income Deficit | 601 | $0 |
| Wage / Income Gap (%) | 3,102 | 27.75% |
| Wage / Income Gap ($) | 3,102 | 72.25¢ per $1 |
| Gini / Inequality Index | 3,102 | 0.40 |
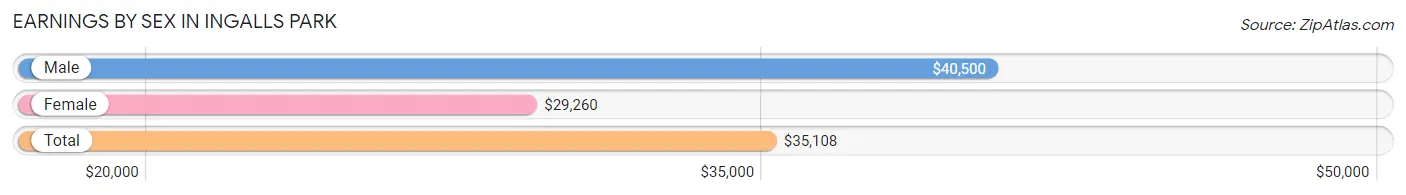
Earnings by Sex in Ingalls Park
Average Earnings in Ingalls Park are $35,108, $40,500 for men and $29,260 for women, a difference of 27.8%.
| Sex | Number | Average Earnings |
| Male | 858 (50.8%) | $40,500 |
| Female | 831 (49.2%) | $29,260 |
| Total | 1,689 (100.0%) | $35,108 |
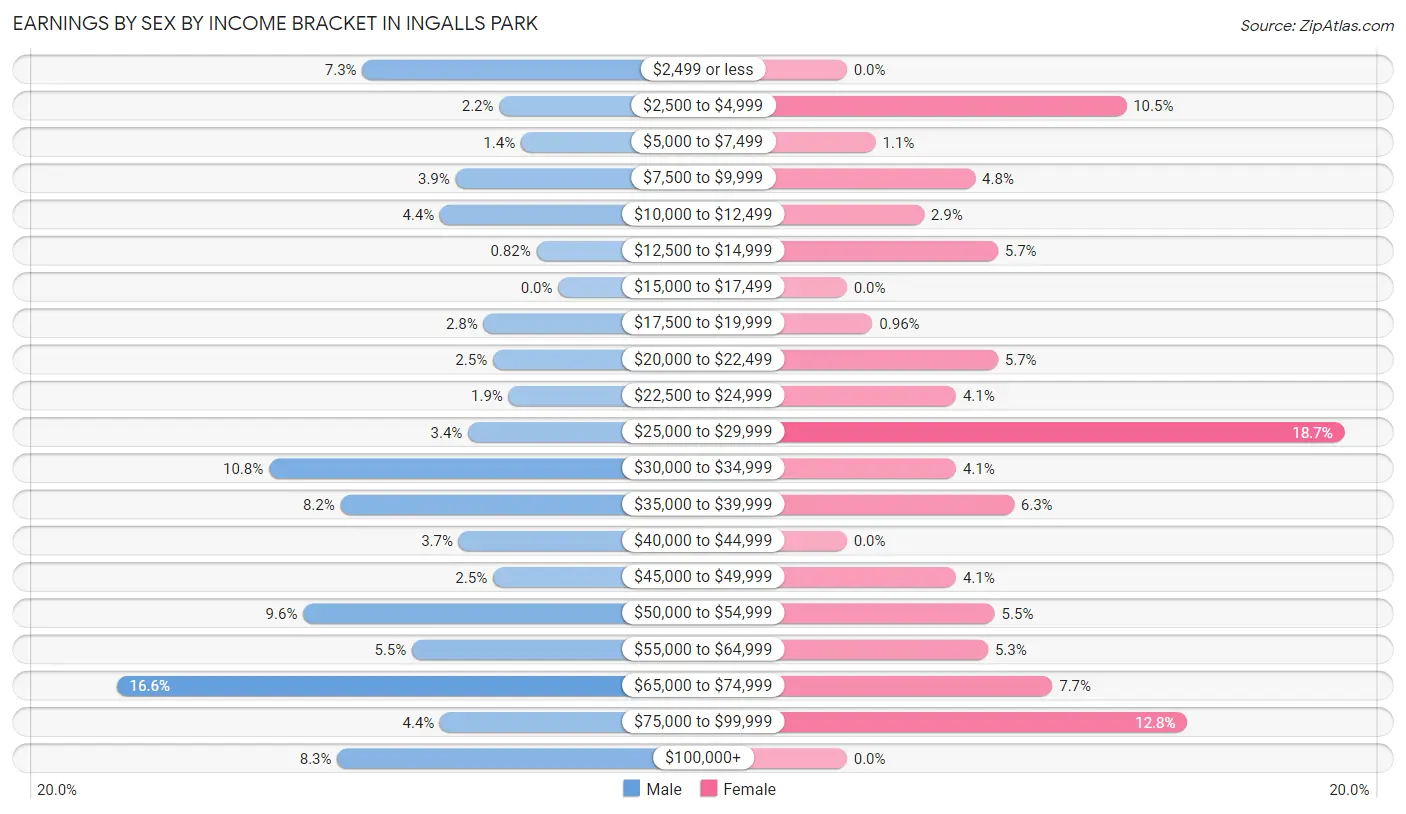
Earnings by Sex by Income Bracket in Ingalls Park
The most common earnings brackets in Ingalls Park are $65,000 to $74,999 for men (142 | 16.6%) and $25,000 to $29,999 for women (155 | 18.6%).
| Income | Male | Female |
| $2,499 or less | 63 (7.3%) | 0 (0.0%) |
| $2,500 to $4,999 | 19 (2.2%) | 87 (10.5%) |
| $5,000 to $7,499 | 12 (1.4%) | 9 (1.1%) |
| $7,500 to $9,999 | 33 (3.8%) | 40 (4.8%) |
| $10,000 to $12,499 | 38 (4.4%) | 24 (2.9%) |
| $12,500 to $14,999 | 7 (0.8%) | 47 (5.7%) |
| $15,000 to $17,499 | 0 (0.0%) | 0 (0.0%) |
| $17,500 to $19,999 | 24 (2.8%) | 8 (1.0%) |
| $20,000 to $22,499 | 21 (2.5%) | 47 (5.7%) |
| $22,500 to $24,999 | 16 (1.9%) | 34 (4.1%) |
| $25,000 to $29,999 | 29 (3.4%) | 155 (18.6%) |
| $30,000 to $34,999 | 93 (10.8%) | 34 (4.1%) |
| $35,000 to $39,999 | 70 (8.2%) | 52 (6.3%) |
| $40,000 to $44,999 | 32 (3.7%) | 0 (0.0%) |
| $45,000 to $49,999 | 21 (2.5%) | 34 (4.1%) |
| $50,000 to $54,999 | 82 (9.6%) | 46 (5.5%) |
| $55,000 to $64,999 | 47 (5.5%) | 44 (5.3%) |
| $65,000 to $74,999 | 142 (16.6%) | 64 (7.7%) |
| $75,000 to $99,999 | 38 (4.4%) | 106 (12.8%) |
| $100,000+ | 71 (8.3%) | 0 (0.0%) |
| Total | 858 (100.0%) | 831 (100.0%) |
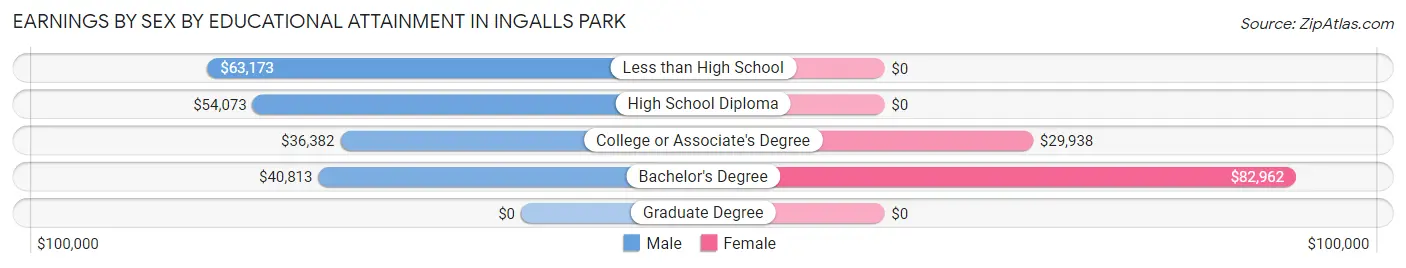
Earnings by Sex by Educational Attainment in Ingalls Park
Average earnings in Ingalls Park are $50,990 for men and $29,656 for women, a difference of 41.8%. Men with an educational attainment of less than high school enjoy the highest average annual earnings of $63,173, while those with college or associate's degree education earn the least with $36,382. Women with an educational attainment of bachelor's degree earn the most with the average annual earnings of $82,962, while those with college or associate's degree education have the smallest earnings of $29,938.
| Educational Attainment | Male Income | Female Income |
| Less than High School | $63,173 | $0 |
| High School Diploma | $54,073 | $0 |
| College or Associate's Degree | $36,382 | $29,938 |
| Bachelor's Degree | $40,813 | $82,962 |
| Graduate Degree | - | - |
| Total | $50,990 | $29,656 |
Family Income in Ingalls Park
Family Income Brackets in Ingalls Park
According to the Ingalls Park family income data, there are 199 families falling into the $100,000 to $149,999 income range, which is the most common income bracket and makes up 33.1% of all families.
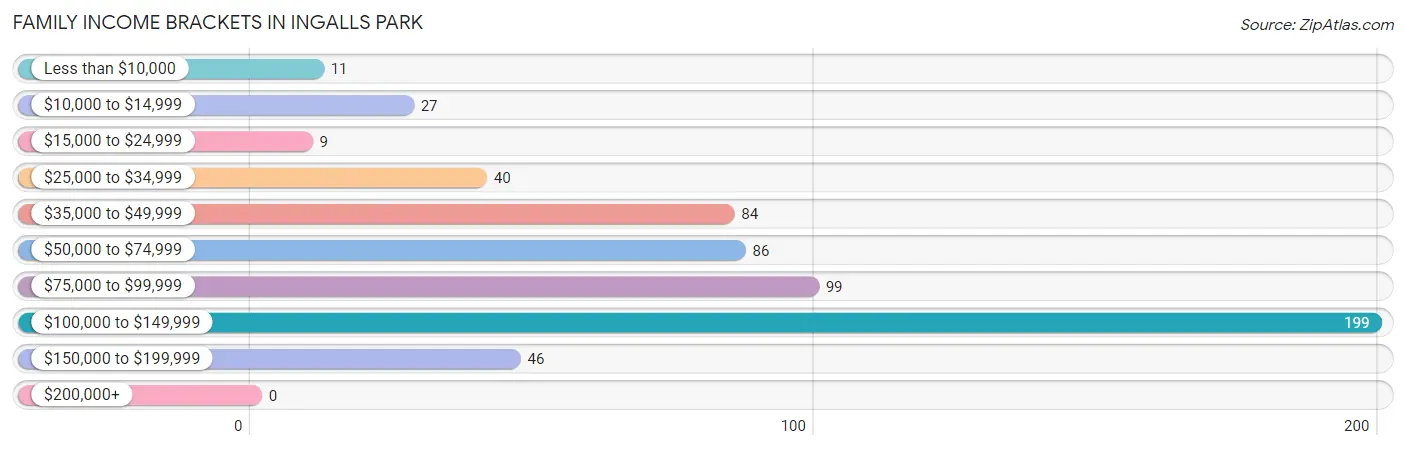
| Income Bracket | # Families | % Families |
| Less than $10,000 | 11 | 1.8% |
| $10,000 to $14,999 | 27 | 4.5% |
| $15,000 to $24,999 | 9 | 1.5% |
| $25,000 to $34,999 | 40 | 6.7% |
| $35,000 to $49,999 | 84 | 14.0% |
| $50,000 to $74,999 | 86 | 14.3% |
| $75,000 to $99,999 | 99 | 16.5% |
| $100,000 to $149,999 | 199 | 33.1% |
| $150,000 to $199,999 | 46 | 7.7% |
| $200,000+ | 0 | 0.0% |
Family Income by Famaliy Size in Ingalls Park
4-person families (105 | 17.5%) account for the highest median family income in Ingalls Park with $133,060 per family, while 4-person families (105 | 17.5%) have the highest median income of $33,265 per family member.
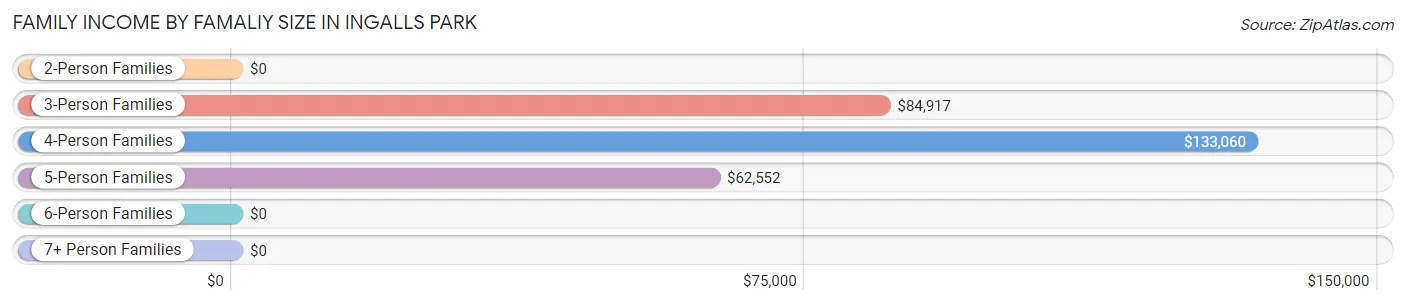
| Income Bracket | # Families | Median Income |
| 2-Person Families | 155 (25.8%) | $0 |
| 3-Person Families | 218 (36.3%) | $84,917 |
| 4-Person Families | 105 (17.5%) | $133,060 |
| 5-Person Families | 89 (14.8%) | $62,552 |
| 6-Person Families | 20 (3.3%) | $0 |
| 7+ Person Families | 14 (2.3%) | $0 |
| Total | 601 (100.0%) | $79,647 |
Family Income by Number of Earners in Ingalls Park

| Number of Earners | # Families | Median Income |
| No Earners | 22 (3.7%) | $0 |
| 1 Earner | 278 (46.3%) | $62,813 |
| 2 Earners | 252 (41.9%) | $106,042 |
| 3+ Earners | 49 (8.2%) | $167,958 |
| Total | 601 (100.0%) | $79,647 |
Household Income in Ingalls Park
Household Income Brackets in Ingalls Park
With 280 households falling in the category, the $50,000 to $74,999 income range is the most frequent in Ingalls Park, accounting for 23.2% of all households. In contrast, only 11 households (0.9%) fall into the $10,000 to $14,999 income bracket, making it the least populous group.
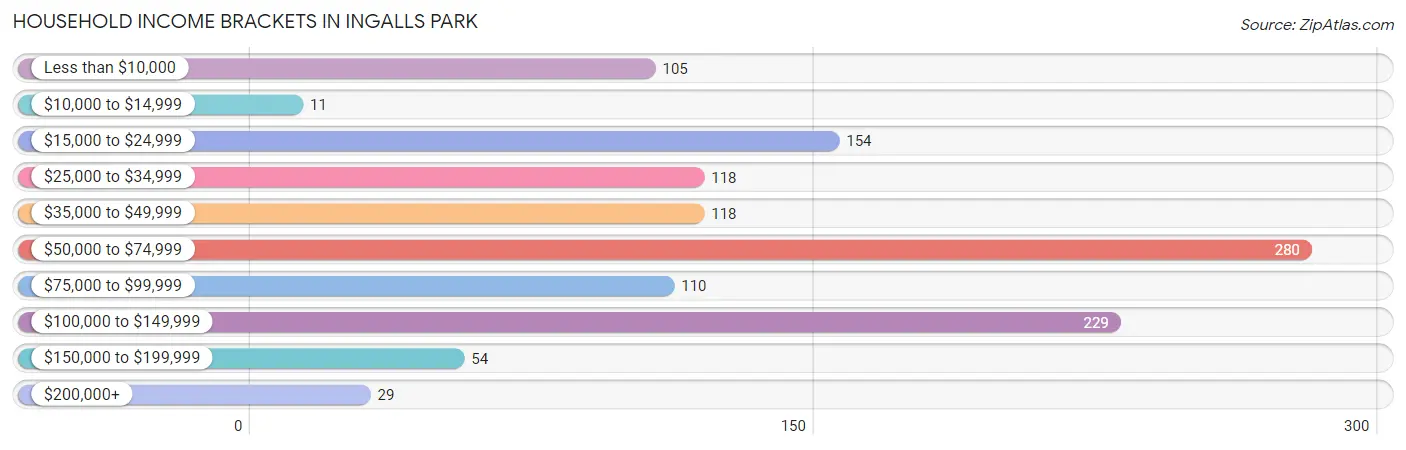
| Income Bracket | # Households | % Households |
| Less than $10,000 | 105 | 8.7% |
| $10,000 to $14,999 | 11 | 0.9% |
| $15,000 to $24,999 | 154 | 12.7% |
| $25,000 to $34,999 | 118 | 9.8% |
| $35,000 to $49,999 | 118 | 9.8% |
| $50,000 to $74,999 | 280 | 23.2% |
| $75,000 to $99,999 | 110 | 9.1% |
| $100,000 to $149,999 | 229 | 18.9% |
| $150,000 to $199,999 | 54 | 4.5% |
| $200,000+ | 29 | 2.4% |
Household Income by Householder Age in Ingalls Park
The median household income in Ingalls Park is $53,257, with the highest median household income of $63,357 found in the 45 to 64 years age bracket for the primary householder. A total of 468 households (38.7%) fall into this category. Meanwhile, the 15 to 24 years age bracket for the primary householder has the lowest median household income of $0, with 35 households (2.9%) in this group.
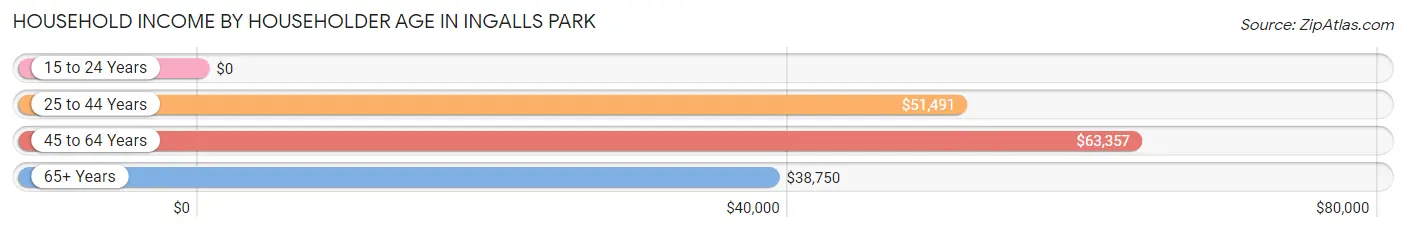
| Income Bracket | # Households | Median Income |
| 15 to 24 Years | 35 (2.9%) | $0 |
| 25 to 44 Years | 464 (38.4%) | $51,491 |
| 45 to 64 Years | 468 (38.7%) | $63,357 |
| 65+ Years | 242 (20.0%) | $38,750 |
| Total | 1,209 (100.0%) | $53,257 |
Poverty in Ingalls Park
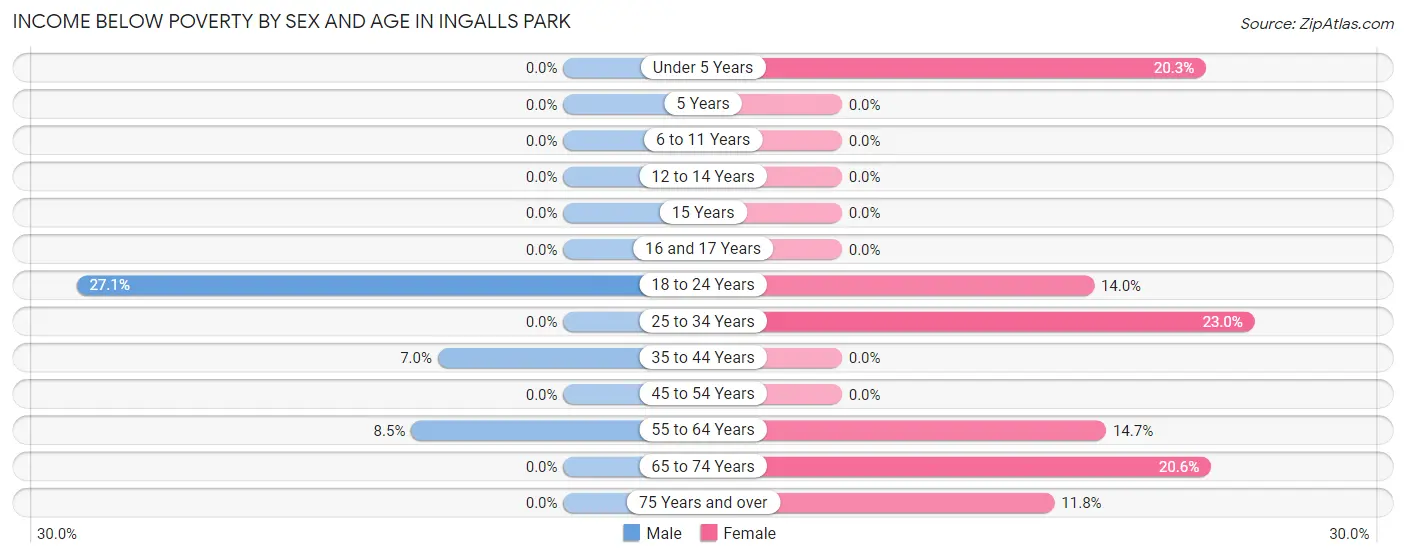
Income Below Poverty by Sex and Age in Ingalls Park
With 6.0% poverty level for males and 12.8% for females among the residents of Ingalls Park, 18 to 24 year old males and 25 to 34 year old females are the most vulnerable to poverty, with 45 males (27.1%) and 83 females (23.0%) in their respective age groups living below the poverty level.
| Age Bracket | Male | Female |
| Under 5 Years | 0 (0.0%) | 29 (20.3%) |
| 5 Years | 0 (0.0%) | 0 (0.0%) |
| 6 to 11 Years | 0 (0.0%) | 0 (0.0%) |
| 12 to 14 Years | 0 (0.0%) | 0 (0.0%) |
| 15 Years | 0 (0.0%) | 0 (0.0%) |
| 16 and 17 Years | 0 (0.0%) | 0 (0.0%) |
| 18 to 24 Years | 45 (27.1%) | 33 (14.0%) |
| 25 to 34 Years | 0 (0.0%) | 83 (23.0%) |
| 35 to 44 Years | 23 (7.0%) | 0 (0.0%) |
| 45 to 54 Years | 0 (0.0%) | 0 (0.0%) |
| 55 to 64 Years | 20 (8.5%) | 35 (14.7%) |
| 65 to 74 Years | 0 (0.0%) | 22 (20.6%) |
| 75 Years and over | 0 (0.0%) | 9 (11.8%) |
| Total | 88 (6.0%) | 211 (12.8%) |
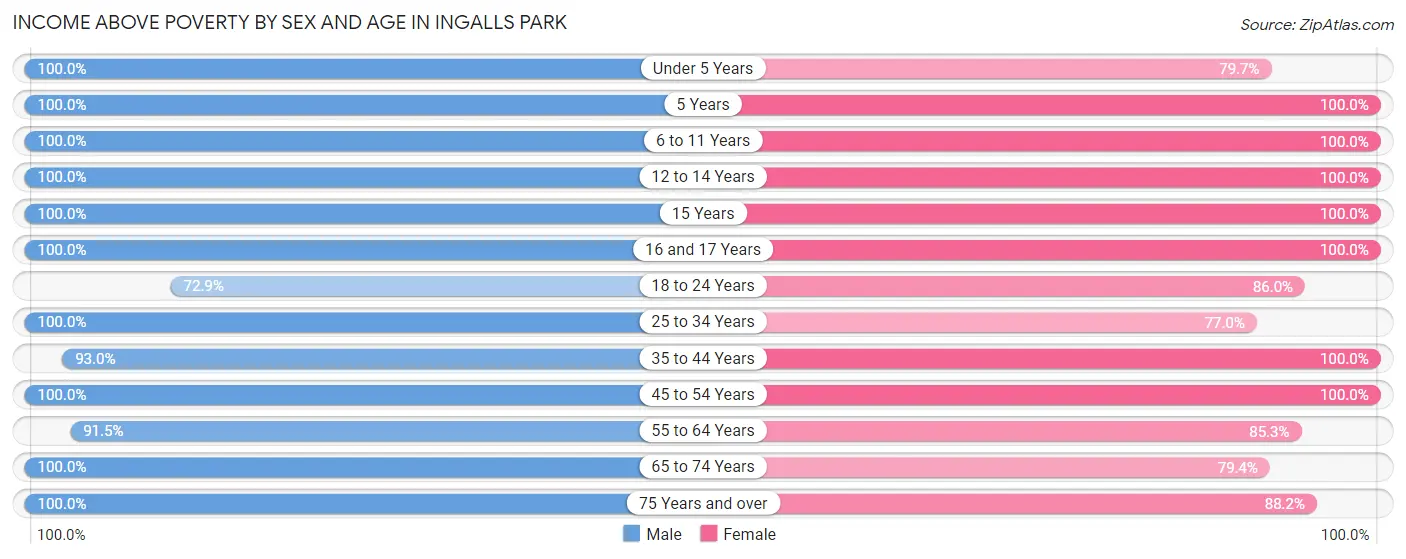
Income Above Poverty by Sex and Age in Ingalls Park
According to the poverty statistics in Ingalls Park, males aged under 5 years and females aged 5 years are the age groups that are most secure financially, with 100.0% of males and 100.0% of females in these age groups living above the poverty line.
| Age Bracket | Male | Female |
| Under 5 Years | 65 (100.0%) | 114 (79.7%) |
| 5 Years | 37 (100.0%) | 7 (100.0%) |
| 6 to 11 Years | 118 (100.0%) | 92 (100.0%) |
| 12 to 14 Years | 85 (100.0%) | 20 (100.0%) |
| 15 Years | 28 (100.0%) | 14 (100.0%) |
| 16 and 17 Years | 14 (100.0%) | 41 (100.0%) |
| 18 to 24 Years | 121 (72.9%) | 202 (86.0%) |
| 25 to 34 Years | 51 (100.0%) | 278 (77.0%) |
| 35 to 44 Years | 306 (93.0%) | 204 (100.0%) |
| 45 to 54 Years | 174 (100.0%) | 109 (100.0%) |
| 55 to 64 Years | 216 (91.5%) | 203 (85.3%) |
| 65 to 74 Years | 145 (100.0%) | 85 (79.4%) |
| 75 Years and over | 7 (100.0%) | 67 (88.2%) |
| Total | 1,367 (94.0%) | 1,436 (87.2%) |
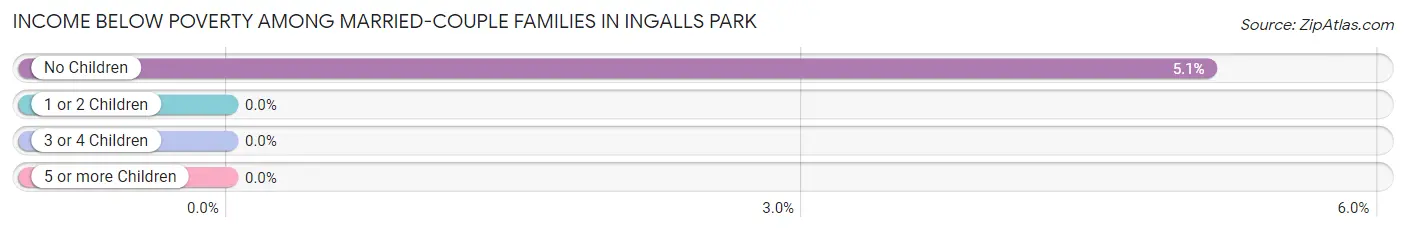
Income Below Poverty Among Married-Couple Families in Ingalls Park
The poverty statistics for married-couple families in Ingalls Park show that 2.5% or 9 of the total 368 families live below the poverty line. Families with no children have the highest poverty rate of 5.1%, comprising of 9 families. On the other hand, families with 1 or 2 children have the lowest poverty rate of 0.0%, which includes 0 families.
| Children | Above Poverty | Below Poverty |
| No Children | 167 (94.9%) | 9 (5.1%) |
| 1 or 2 Children | 120 (100.0%) | 0 (0.0%) |
| 3 or 4 Children | 72 (100.0%) | 0 (0.0%) |
| 5 or more Children | 0 (0.0%) | 0 (0.0%) |
| Total | 359 (97.6%) | 9 (2.5%) |
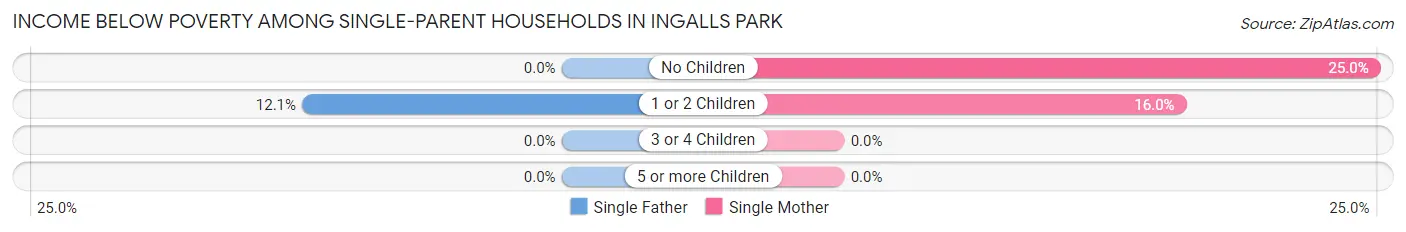
Income Below Poverty Among Single-Parent Households in Ingalls Park
According to the poverty data in Ingalls Park, 12.1% or 11 single-father households and 19.0% or 27 single-mother households are living below the poverty line. Among single-father households, those with 1 or 2 children have the highest poverty rate, with 11 households (12.1%) experiencing poverty. Likewise, among single-mother households, those with no children have the highest poverty rate, with 12 households (25.0%) falling below the poverty line.
| Children | Single Father | Single Mother |
| No Children | 0 (0.0%) | 12 (25.0%) |
| 1 or 2 Children | 11 (12.1%) | 15 (16.0%) |
| 3 or 4 Children | 0 (0.0%) | 0 (0.0%) |
| 5 or more Children | 0 (0.0%) | 0 (0.0%) |
| Total | 11 (12.1%) | 27 (19.0%) |
Income Below Poverty Among Married-Couple vs Single-Parent Households in Ingalls Park
The poverty data for Ingalls Park shows that 9 of the married-couple family households (2.5%) and 38 of the single-parent households (16.3%) are living below the poverty level. Within the married-couple family households, those with no children have the highest poverty rate, with 9 households (5.1%) falling below the poverty line. Among the single-parent households, those with no children have the highest poverty rate, with 12 household (25.0%) living below poverty.
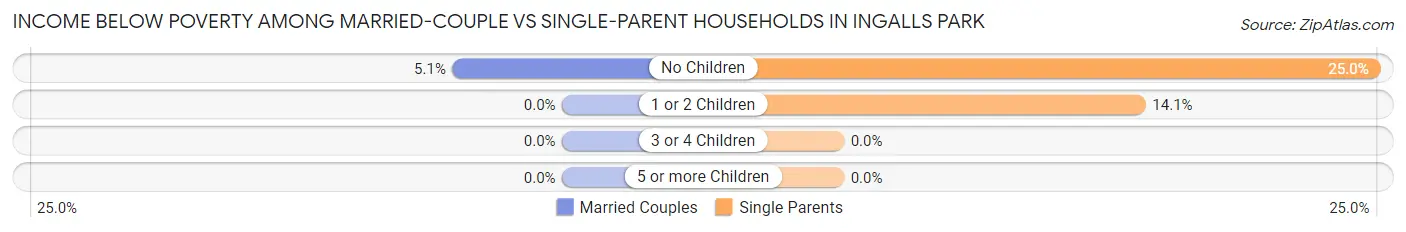
| Children | Married-Couple Families | Single-Parent Households |
| No Children | 9 (5.1%) | 12 (25.0%) |
| 1 or 2 Children | 0 (0.0%) | 26 (14.1%) |
| 3 or 4 Children | 0 (0.0%) | 0 (0.0%) |
| 5 or more Children | 0 (0.0%) | 0 (0.0%) |
| Total | 9 (2.5%) | 38 (16.3%) |
Race in Ingalls Park
The most populous races in Ingalls Park are White / Caucasian (1,918 | 61.8%), Hispanic or Latino (1,059 | 34.1%), and Black / African American (403 | 13.0%).
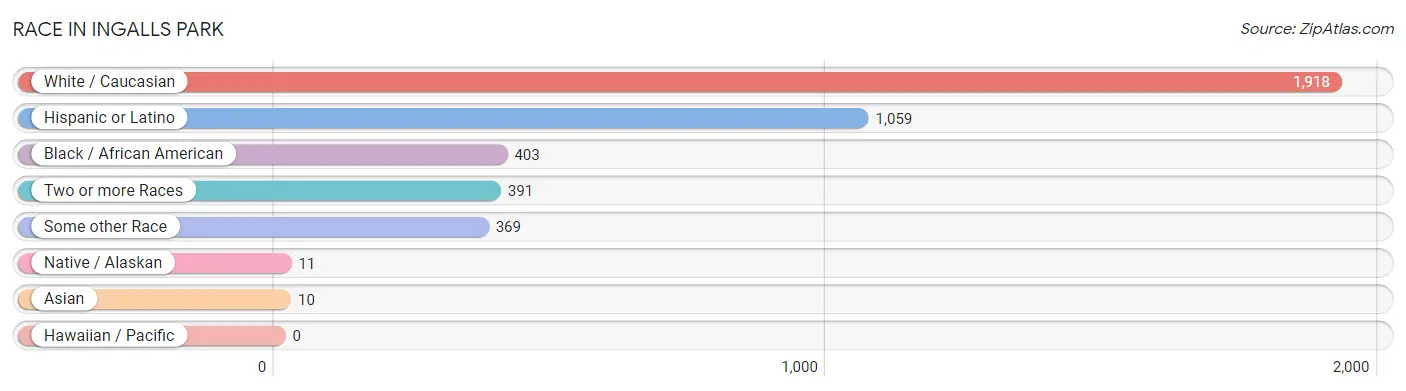
| Race | # Population | % Population |
| Asian | 10 | 0.3% |
| Black / African American | 403 | 13.0% |
| Hawaiian / Pacific | 0 | 0.0% |
| Hispanic or Latino | 1,059 | 34.1% |
| Native / Alaskan | 11 | 0.4% |
| White / Caucasian | 1,918 | 61.8% |
| Two or more Races | 391 | 12.6% |
| Some other Race | 369 | 11.9% |
| Total | 3,102 | 100.0% |
Ancestry in Ingalls Park
The most populous ancestries reported in Ingalls Park are Mexican (962 | 31.0%), German (446 | 14.4%), Irish (337 | 10.9%), English (267 | 8.6%), and Italian (178 | 5.7%), together accounting for 70.6% of all Ingalls Park residents.
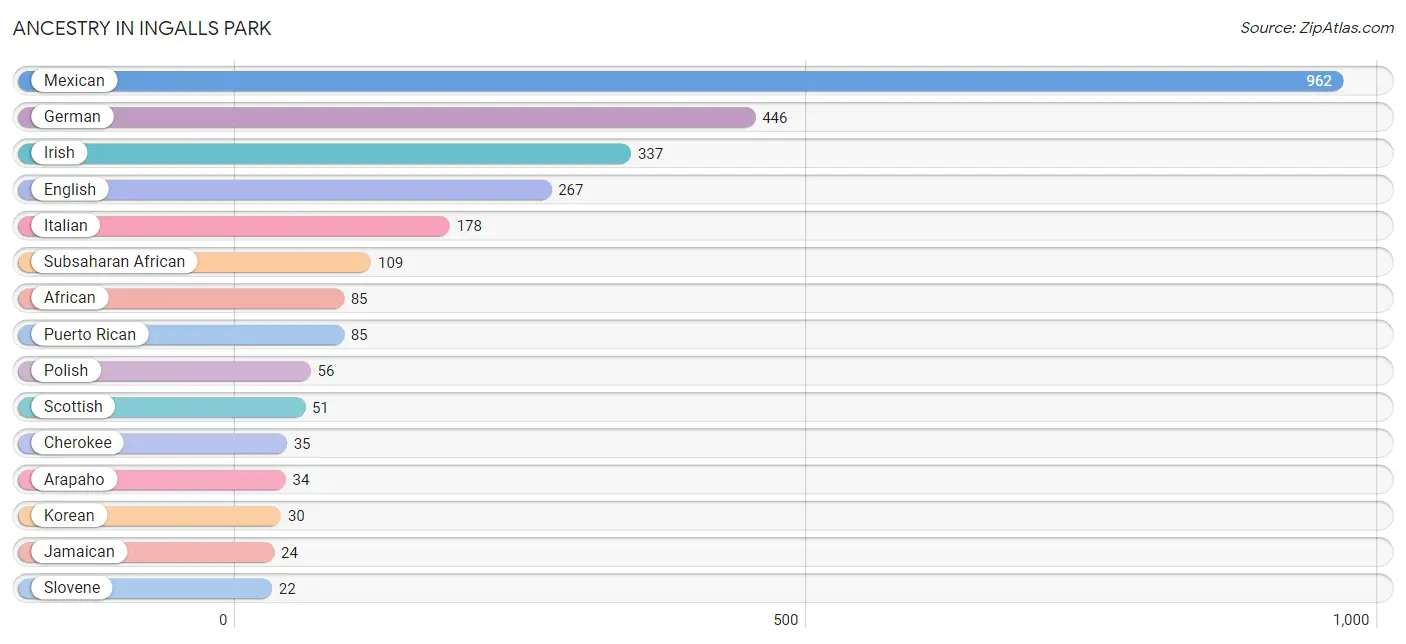
| Ancestry | # Population | % Population |
| African | 85 | 2.7% |
| Arapaho | 34 | 1.1% |
| Central American | 12 | 0.4% |
| Cherokee | 35 | 1.1% |
| Dutch | 20 | 0.6% |
| Eastern European | 13 | 0.4% |
| English | 267 | 8.6% |
| European | 11 | 0.4% |
| German | 446 | 14.4% |
| Guatemalan | 12 | 0.4% |
| Irish | 337 | 10.9% |
| Italian | 178 | 5.7% |
| Jamaican | 24 | 0.8% |
| Korean | 30 | 1.0% |
| Mexican | 962 | 31.0% |
| Norwegian | 9 | 0.3% |
| Polish | 56 | 1.8% |
| Puerto Rican | 85 | 2.7% |
| Scottish | 51 | 1.6% |
| Seminole | 11 | 0.4% |
| Slovak | 9 | 0.3% |
| Slovene | 22 | 0.7% |
| Subsaharan African | 109 | 3.5% |
| Swedish | 11 | 0.4% |
| Ukrainian | 11 | 0.4% | View All 25 Rows |
Immigrants in Ingalls Park
The most numerous immigrant groups reported in Ingalls Park came from Central America (299 | 9.6%), Latin America (299 | 9.6%), Mexico (299 | 9.6%), Europe (22 | 0.7%), and Germany (11 | 0.4%), together accounting for 30.0% of all Ingalls Park residents.
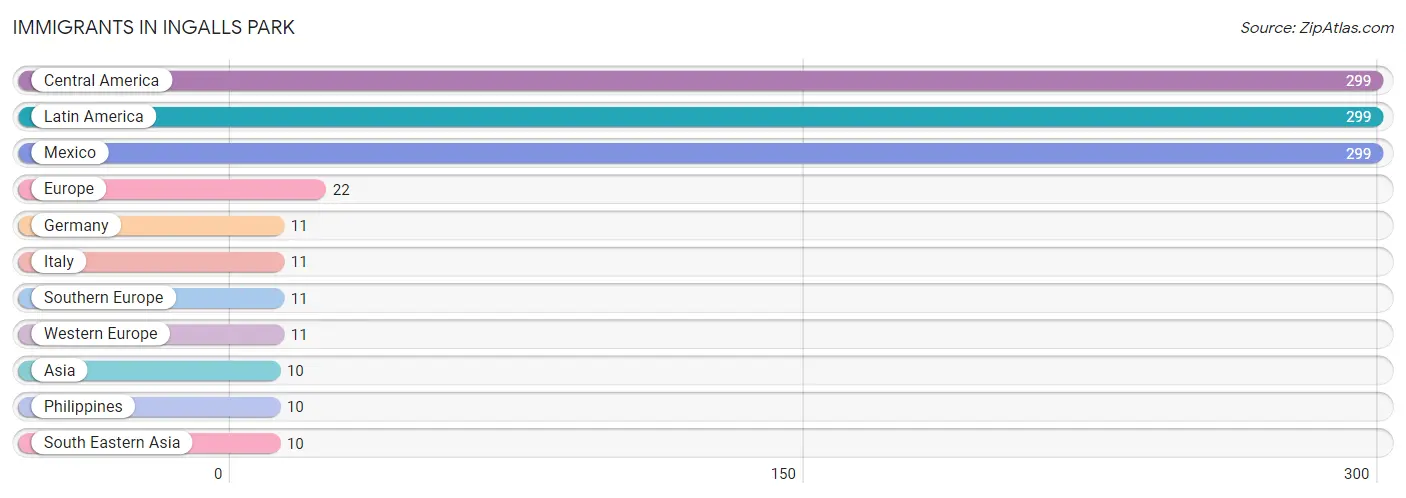
| Immigration Origin | # Population | % Population |
| Asia | 10 | 0.3% |
| Central America | 299 | 9.6% |
| Europe | 22 | 0.7% |
| Germany | 11 | 0.4% |
| Italy | 11 | 0.4% |
| Latin America | 299 | 9.6% |
| Mexico | 299 | 9.6% |
| Philippines | 10 | 0.3% |
| South Eastern Asia | 10 | 0.3% |
| Southern Europe | 11 | 0.4% |
| Western Europe | 11 | 0.4% | View All 11 Rows |
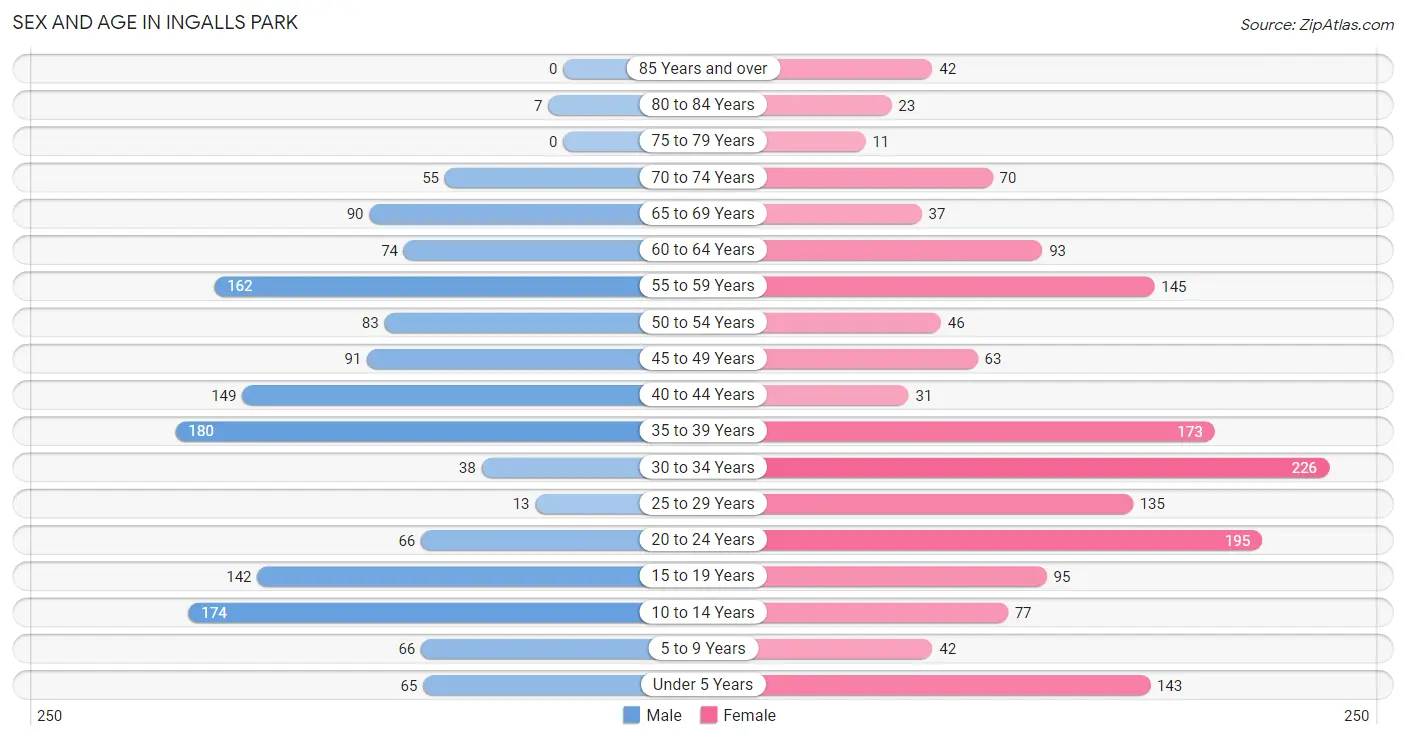
Sex and Age in Ingalls Park
Sex and Age in Ingalls Park
The most populous age groups in Ingalls Park are 35 to 39 Years (180 | 12.4%) for men and 30 to 34 Years (226 | 13.7%) for women.
| Age Bracket | Male | Female |
| Under 5 Years | 65 (4.5%) | 143 (8.7%) |
| 5 to 9 Years | 66 (4.5%) | 42 (2.5%) |
| 10 to 14 Years | 174 (12.0%) | 77 (4.7%) |
| 15 to 19 Years | 142 (9.8%) | 95 (5.8%) |
| 20 to 24 Years | 66 (4.5%) | 195 (11.8%) |
| 25 to 29 Years | 13 (0.9%) | 135 (8.2%) |
| 30 to 34 Years | 38 (2.6%) | 226 (13.7%) |
| 35 to 39 Years | 180 (12.4%) | 173 (10.5%) |
| 40 to 44 Years | 149 (10.2%) | 31 (1.9%) |
| 45 to 49 Years | 91 (6.2%) | 63 (3.8%) |
| 50 to 54 Years | 83 (5.7%) | 46 (2.8%) |
| 55 to 59 Years | 162 (11.1%) | 145 (8.8%) |
| 60 to 64 Years | 74 (5.1%) | 93 (5.7%) |
| 65 to 69 Years | 90 (6.2%) | 37 (2.2%) |
| 70 to 74 Years | 55 (3.8%) | 70 (4.3%) |
| 75 to 79 Years | 0 (0.0%) | 11 (0.7%) |
| 80 to 84 Years | 7 (0.5%) | 23 (1.4%) |
| 85 Years and over | 0 (0.0%) | 42 (2.5%) |
| Total | 1,455 (100.0%) | 1,647 (100.0%) |
Families and Households in Ingalls Park
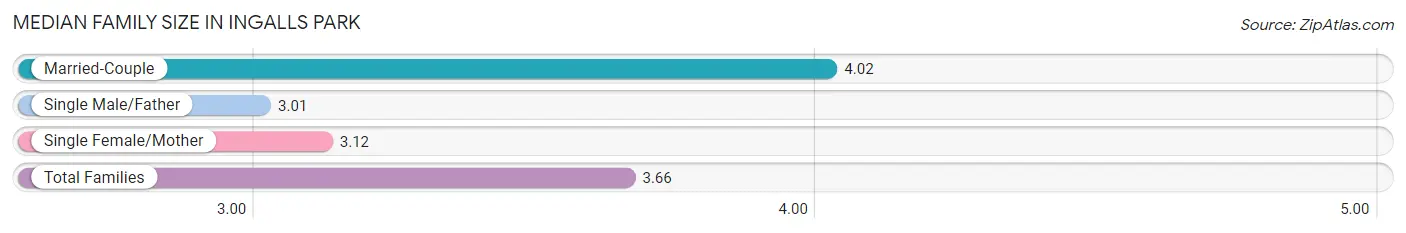
Median Family Size in Ingalls Park
The median family size in Ingalls Park is 3.66 persons per family, with married-couple families (368 | 61.2%) accounting for the largest median family size of 4.02 persons per family. On the other hand, single male/father families (91 | 15.1%) represent the smallest median family size with 3.01 persons per family.
| Family Type | # Families | Family Size |
| Married-Couple | 368 (61.2%) | 4.02 |
| Single Male/Father | 91 (15.1%) | 3.01 |
| Single Female/Mother | 142 (23.6%) | 3.12 |
| Total Families | 601 (100.0%) | 3.66 |
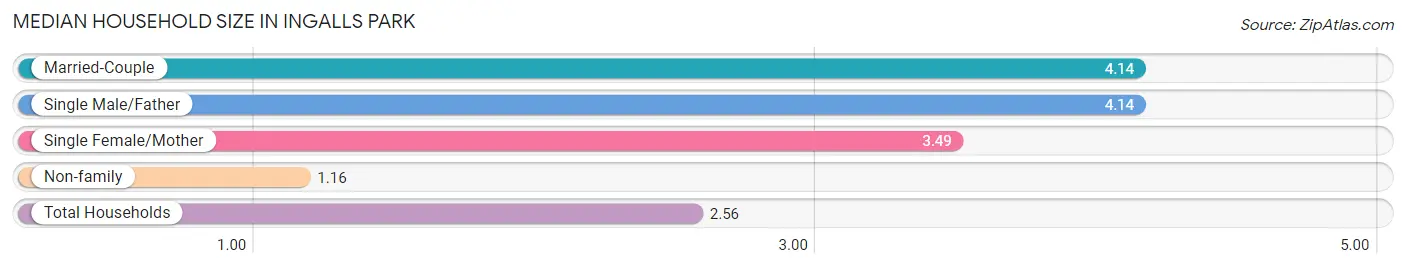
Median Household Size in Ingalls Park
The median household size in Ingalls Park is 2.56 persons per household, with married-couple households (368 | 30.4%) accounting for the largest median household size of 4.14 persons per household. non-family households (608 | 50.3%) represent the smallest median household size with 1.16 persons per household.
| Household Type | # Households | Household Size |
| Married-Couple | 368 (30.4%) | 4.14 |
| Single Male/Father | 91 (7.5%) | 4.14 |
| Single Female/Mother | 142 (11.7%) | 3.49 |
| Non-family | 608 (50.3%) | 1.16 |
| Total Households | 1,209 (100.0%) | 2.56 |
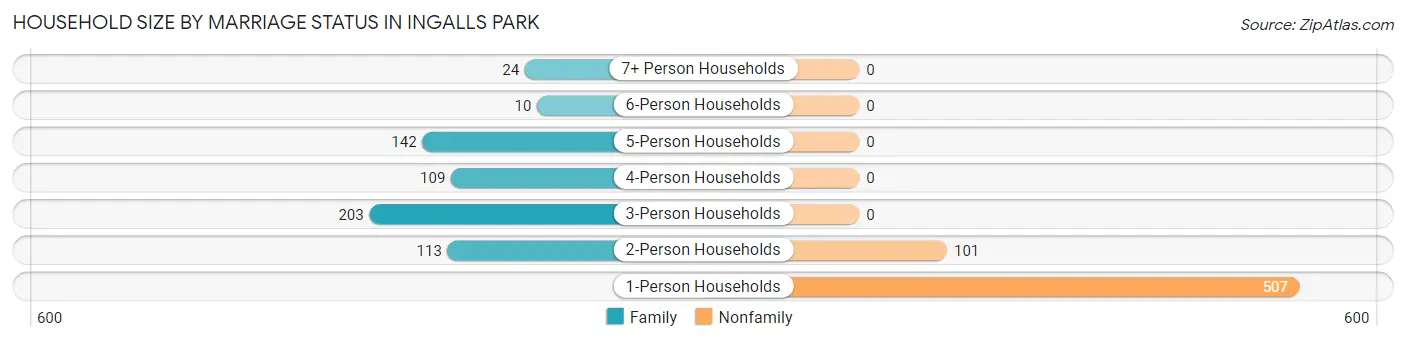
Household Size by Marriage Status in Ingalls Park
Out of a total of 1,209 households in Ingalls Park, 601 (49.7%) are family households, while 608 (50.3%) are nonfamily households. The most numerous type of family households are 3-person households, comprising 203, and the most common type of nonfamily households are 1-person households, comprising 507.
| Household Size | Family Households | Nonfamily Households |
| 1-Person Households | - | 507 (41.9%) |
| 2-Person Households | 113 (9.3%) | 101 (8.4%) |
| 3-Person Households | 203 (16.8%) | 0 (0.0%) |
| 4-Person Households | 109 (9.0%) | 0 (0.0%) |
| 5-Person Households | 142 (11.7%) | 0 (0.0%) |
| 6-Person Households | 10 (0.8%) | 0 (0.0%) |
| 7+ Person Households | 24 (2.0%) | 0 (0.0%) |
| Total | 601 (49.7%) | 608 (50.3%) |
Female Fertility in Ingalls Park
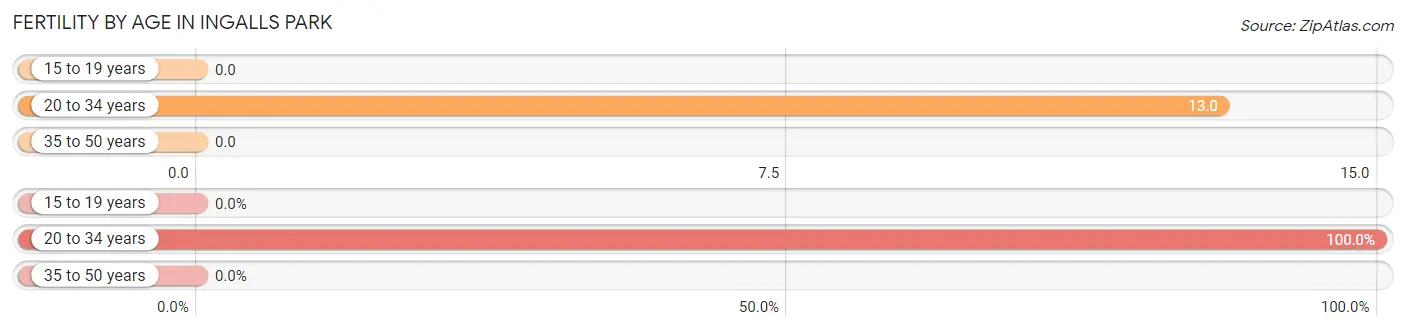
Fertility by Age in Ingalls Park
Average fertility rate in Ingalls Park is 7.0 births per 1,000 women. Women in the age bracket of 20 to 34 years have the highest fertility rate with 13.0 births per 1,000 women. Women in the age bracket of 20 to 34 years acount for 100.0% of all women with births.
| Age Bracket | Women with Births | Births / 1,000 Women |
| 15 to 19 years | 0 (0.0%) | 0.0 |
| 20 to 34 years | 7 (100.0%) | 13.0 |
| 35 to 50 years | 0 (0.0%) | 0.0 |
| Total | 7 (100.0%) | 7.0 |
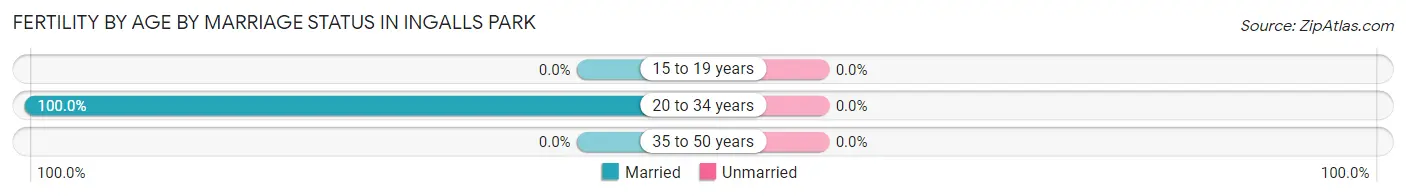
Fertility by Age by Marriage Status in Ingalls Park
| Age Bracket | Married | Unmarried |
| 15 to 19 years | 0 (0.0%) | 0 (0.0%) |
| 20 to 34 years | 7 (100.0%) | 0 (0.0%) |
| 35 to 50 years | 0 (0.0%) | 0 (0.0%) |
| Total | 7 (100.0%) | 0 (0.0%) |
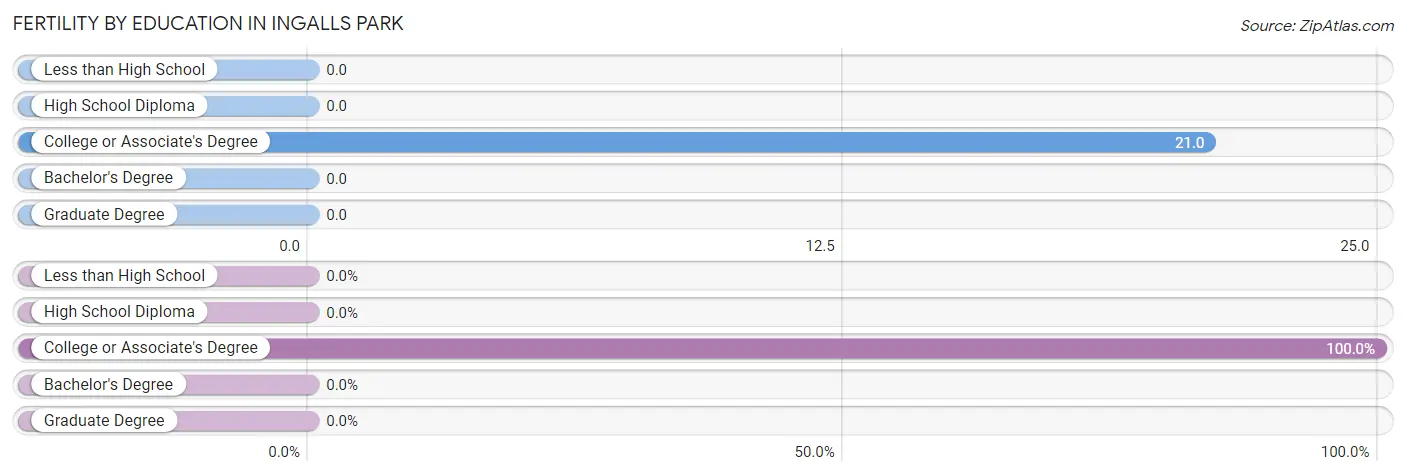
Fertility by Education in Ingalls Park
| Educational Attainment | Women with Births | Births / 1,000 Women |
| Less than High School | 0 (0.0%) | 0.0 |
| High School Diploma | 0 (0.0%) | 0.0 |
| College or Associate's Degree | 7 (100.0%) | 21.0 |
| Bachelor's Degree | 0 (0.0%) | 0.0 |
| Graduate Degree | 0 (0.0%) | 0.0 |
| Total | 7 (100.0%) | 7.0 |
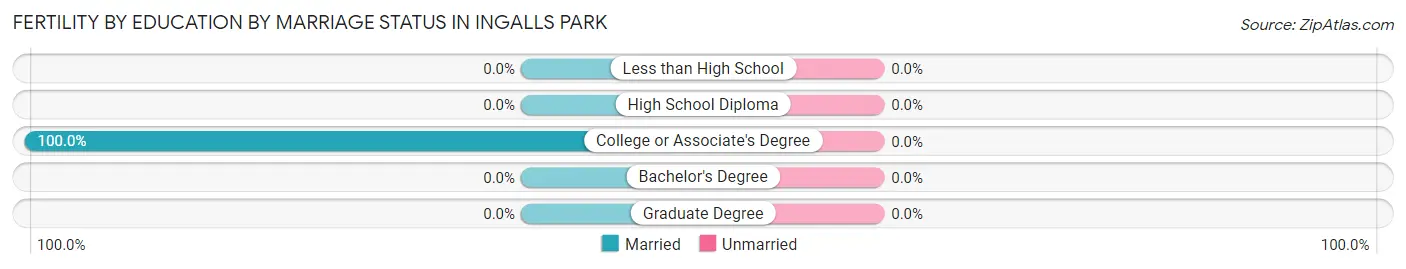
Fertility by Education by Marriage Status in Ingalls Park
| Educational Attainment | Married | Unmarried |
| Less than High School | 0 (0.0%) | 0 (0.0%) |
| High School Diploma | 0 (0.0%) | 0 (0.0%) |
| College or Associate's Degree | 7 (100.0%) | 0 (0.0%) |
| Bachelor's Degree | 0 (0.0%) | 0 (0.0%) |
| Graduate Degree | 0 (0.0%) | 0 (0.0%) |
| Total | 7 (100.0%) | 0 (0.0%) |
Employment Characteristics in Ingalls Park
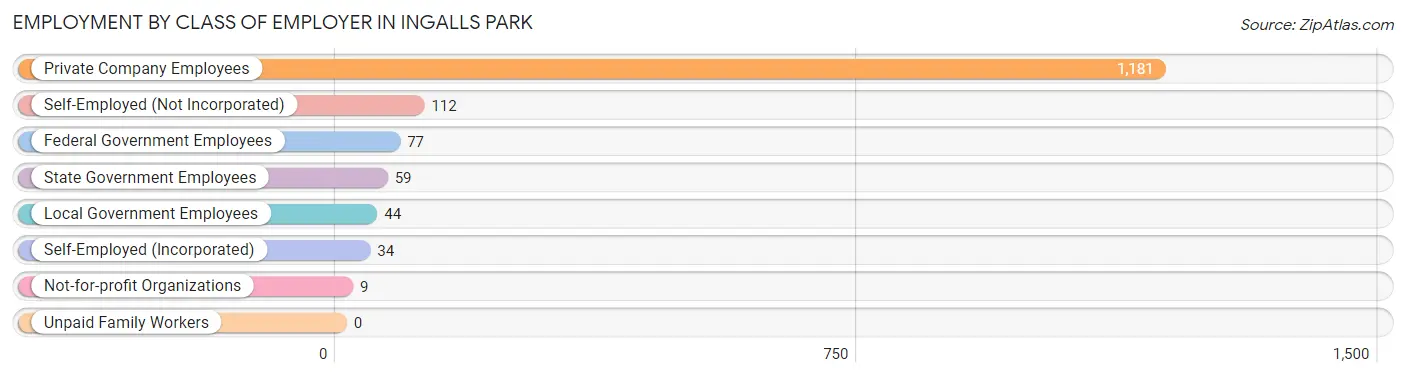
Employment by Class of Employer in Ingalls Park
Among the 1,516 employed individuals in Ingalls Park, private company employees (1,181 | 77.9%), self-employed (not incorporated) (112 | 7.4%), and federal government employees (77 | 5.1%) make up the most common classes of employment.
| Employer Class | # Employees | % Employees |
| Private Company Employees | 1,181 | 77.9% |
| Self-Employed (Incorporated) | 34 | 2.2% |
| Self-Employed (Not Incorporated) | 112 | 7.4% |
| Not-for-profit Organizations | 9 | 0.6% |
| Local Government Employees | 44 | 2.9% |
| State Government Employees | 59 | 3.9% |
| Federal Government Employees | 77 | 5.1% |
| Unpaid Family Workers | 0 | 0.0% |
| Total | 1,516 | 100.0% |
Employment Status by Age in Ingalls Park
According to the labor force statistics for Ingalls Park, out of the total population over 16 years of age (2,493), 68.0% or 1,695 individuals are in the labor force, with 9.3% or 158 of them unemployed. The age group with the highest labor force participation rate is 55 to 59 years, with 91.2% or 280 individuals in the labor force. Within the labor force, the 16 to 19 years age range has the highest percentage of unemployed individuals, with 51.2% or 43 of them being unemployed.
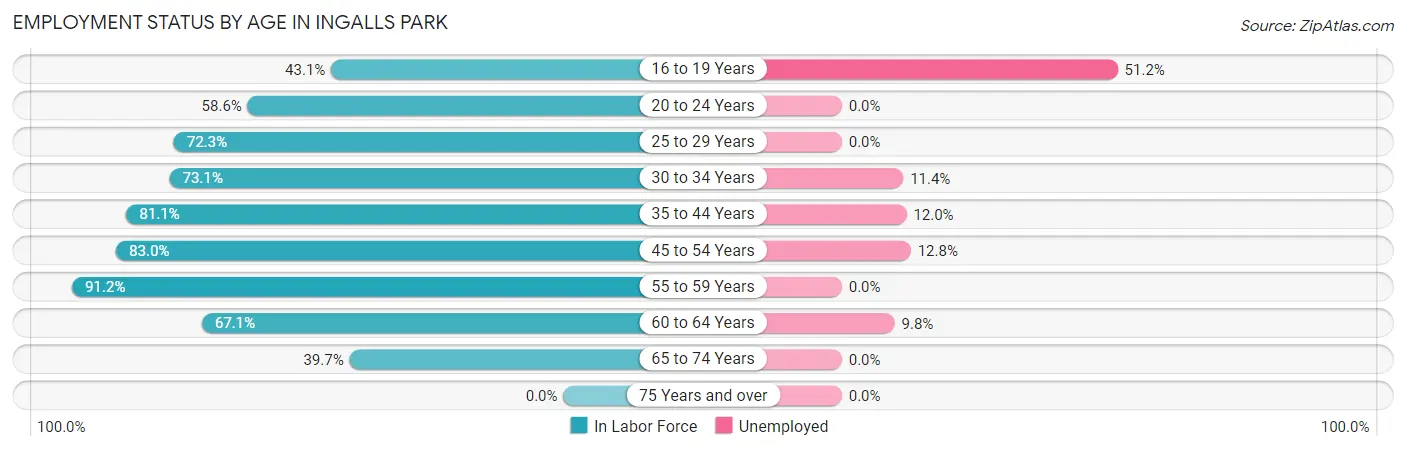
| Age Bracket | In Labor Force | Unemployed |
| 16 to 19 Years | 84 (43.1%) | 43 (51.2%) |
| 20 to 24 Years | 153 (58.6%) | 0 (0.0%) |
| 25 to 29 Years | 107 (72.3%) | 0 (0.0%) |
| 30 to 34 Years | 193 (73.1%) | 22 (11.4%) |
| 35 to 44 Years | 432 (81.1%) | 52 (12.0%) |
| 45 to 54 Years | 235 (83.0%) | 30 (12.8%) |
| 55 to 59 Years | 280 (91.2%) | 0 (0.0%) |
| 60 to 64 Years | 112 (67.1%) | 11 (9.8%) |
| 65 to 74 Years | 100 (39.7%) | 0 (0.0%) |
| 75 Years and over | 0 (0.0%) | 0 (0.0%) |
| Total | 1,695 (68.0%) | 158 (9.3%) |
Employment Status by Educational Attainment in Ingalls Park
According to labor force statistics for Ingalls Park, 79.8% of individuals (1,358) out of the total population between 25 and 64 years of age (1,702) are in the labor force, with 8.5% or 115 of them being unemployed. The group with the highest labor force participation rate are those with the educational attainment of college / associate degree, with 84.6% or 564 individuals in the labor force. Within the labor force, individuals with high school diploma education have the highest percentage of unemployment, with 21.5% or 96 of them being unemployed.
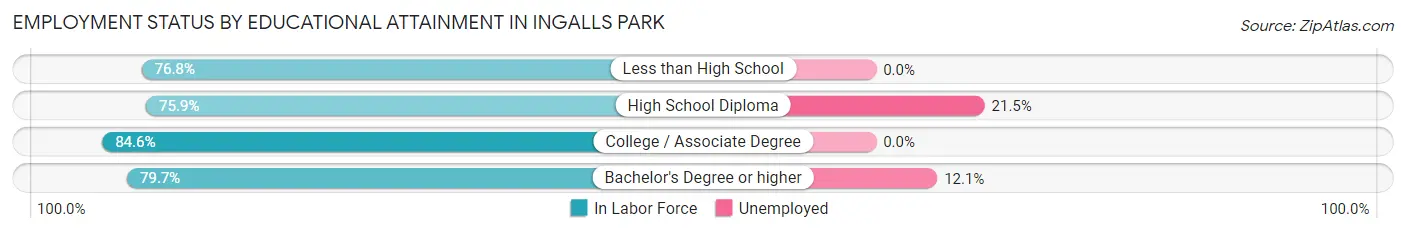
| Educational Attainment | In Labor Force | Unemployed |
| Less than High School | 192 (76.8%) | 0 (0.0%) |
| High School Diploma | 446 (75.9%) | 126 (21.5%) |
| College / Associate Degree | 564 (84.6%) | 0 (0.0%) |
| Bachelor's Degree or higher | 157 (79.7%) | 24 (12.1%) |
| Total | 1,358 (79.8%) | 145 (8.5%) |
Employment Occupations by Sex in Ingalls Park
Management, Business, Science and Arts Occupations
The most common Management, Business, Science and Arts occupations in Ingalls Park are Computers, Engineering & Science (142 | 9.2%), Management (118 | 7.7%), Architecture & Engineering (85 | 5.5%), Community & Social Service (71 | 4.6%), and Arts, Media & Entertainment (61 | 4.0%).
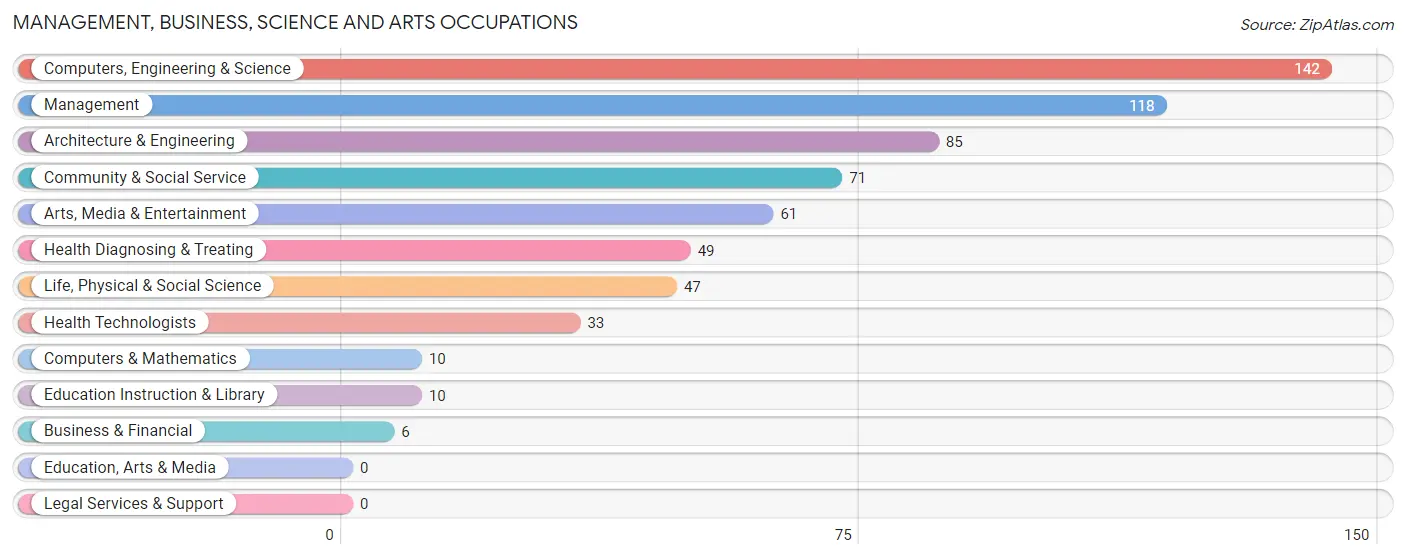
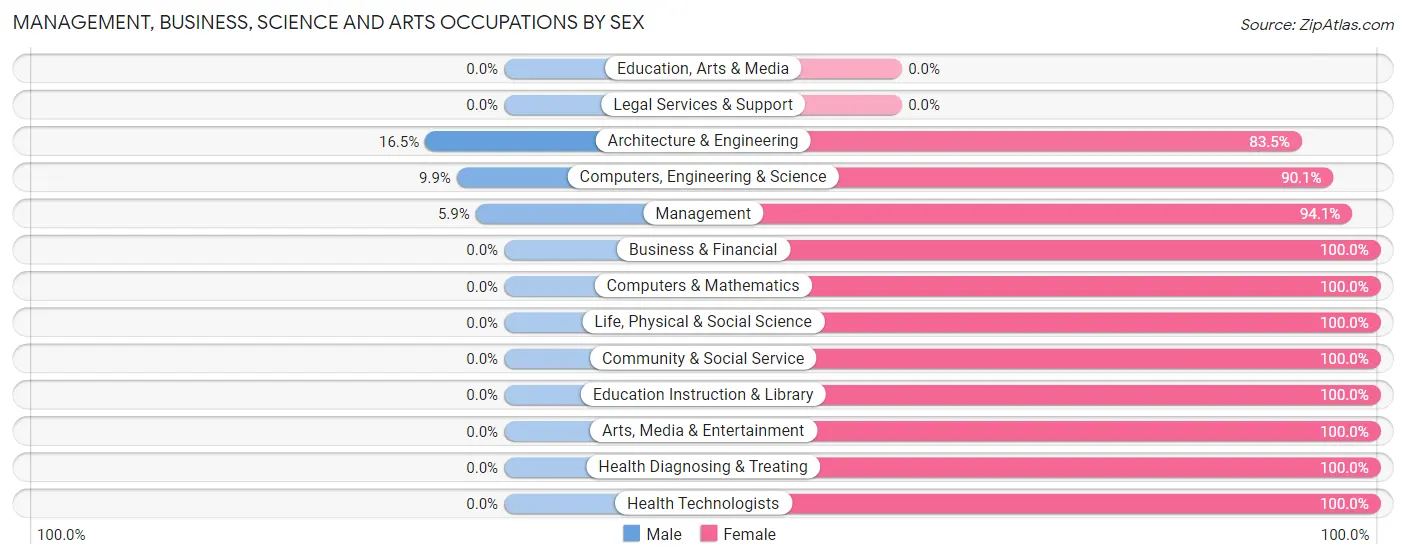
Management, Business, Science and Arts Occupations by Sex
Within the Management, Business, Science and Arts occupations in Ingalls Park, the most male-oriented occupations are Architecture & Engineering (16.5%), Computers, Engineering & Science (9.9%), and Management (5.9%), while the most female-oriented occupations are Business & Financial (100.0%), Computers & Mathematics (100.0%), and Life, Physical & Social Science (100.0%).
| Occupation | Male | Female |
| Management | 7 (5.9%) | 111 (94.1%) |
| Business & Financial | 0 (0.0%) | 6 (100.0%) |
| Computers, Engineering & Science | 14 (9.9%) | 128 (90.1%) |
| Computers & Mathematics | 0 (0.0%) | 10 (100.0%) |
| Architecture & Engineering | 14 (16.5%) | 71 (83.5%) |
| Life, Physical & Social Science | 0 (0.0%) | 47 (100.0%) |
| Community & Social Service | 0 (0.0%) | 71 (100.0%) |
| Education, Arts & Media | 0 (0.0%) | 0 (0.0%) |
| Legal Services & Support | 0 (0.0%) | 0 (0.0%) |
| Education Instruction & Library | 0 (0.0%) | 10 (100.0%) |
| Arts, Media & Entertainment | 0 (0.0%) | 61 (100.0%) |
| Health Diagnosing & Treating | 0 (0.0%) | 49 (100.0%) |
| Health Technologists | 0 (0.0%) | 33 (100.0%) |
| Total (Category) | 21 (5.4%) | 365 (94.6%) |
| Total (Overall) | 737 (47.9%) | 801 (52.1%) |
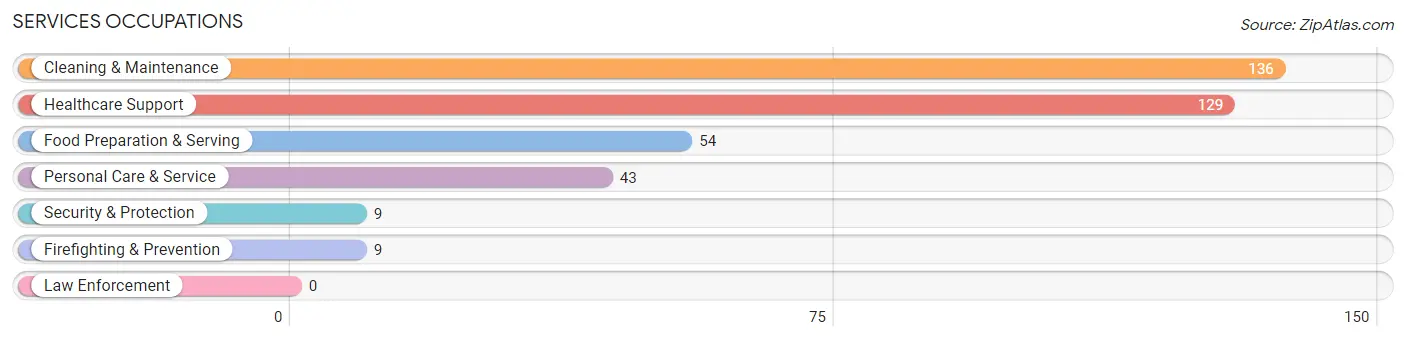
Services Occupations
The most common Services occupations in Ingalls Park are Cleaning & Maintenance (136 | 8.8%), Healthcare Support (129 | 8.4%), Food Preparation & Serving (54 | 3.5%), Personal Care & Service (43 | 2.8%), and Security & Protection (9 | 0.6%).
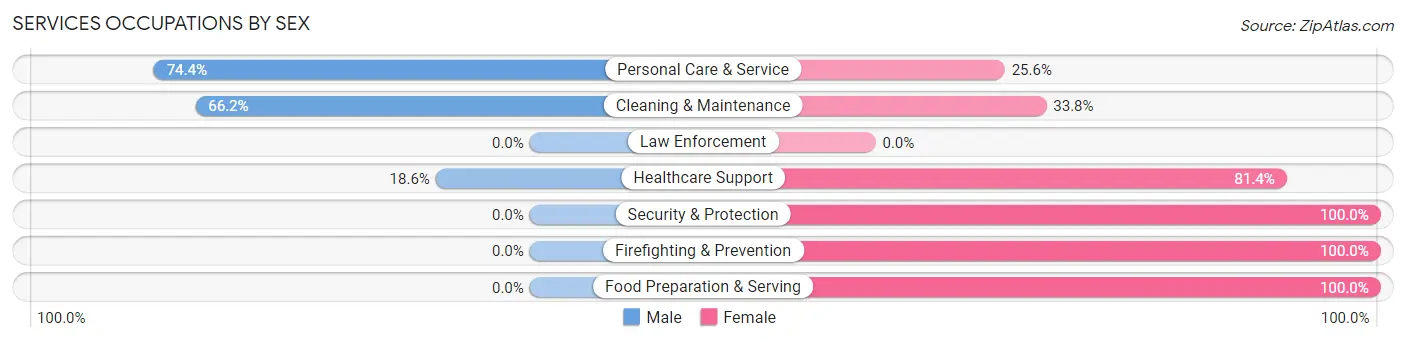
Services Occupations by Sex
Within the Services occupations in Ingalls Park, the most male-oriented occupations are Personal Care & Service (74.4%), Cleaning & Maintenance (66.2%), and Healthcare Support (18.6%), while the most female-oriented occupations are Security & Protection (100.0%), Firefighting & Prevention (100.0%), and Food Preparation & Serving (100.0%).
| Occupation | Male | Female |
| Healthcare Support | 24 (18.6%) | 105 (81.4%) |
| Security & Protection | 0 (0.0%) | 9 (100.0%) |
| Firefighting & Prevention | 0 (0.0%) | 9 (100.0%) |
| Law Enforcement | 0 (0.0%) | 0 (0.0%) |
| Food Preparation & Serving | 0 (0.0%) | 54 (100.0%) |
| Cleaning & Maintenance | 90 (66.2%) | 46 (33.8%) |
| Personal Care & Service | 32 (74.4%) | 11 (25.6%) |
| Total (Category) | 146 (39.4%) | 225 (60.7%) |
| Total (Overall) | 737 (47.9%) | 801 (52.1%) |
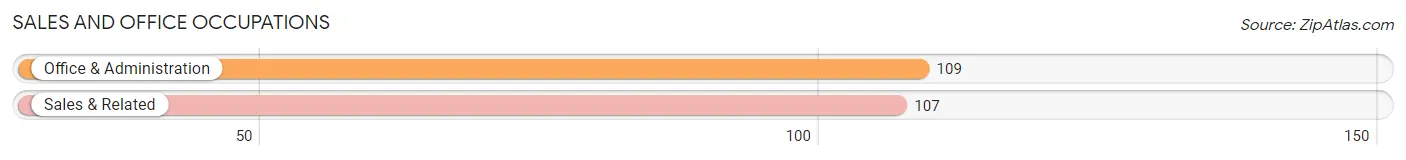
Sales and Office Occupations
The most common Sales and Office occupations in Ingalls Park are Office & Administration (109 | 7.1%), and Sales & Related (107 | 7.0%).
Sales and Office Occupations by Sex
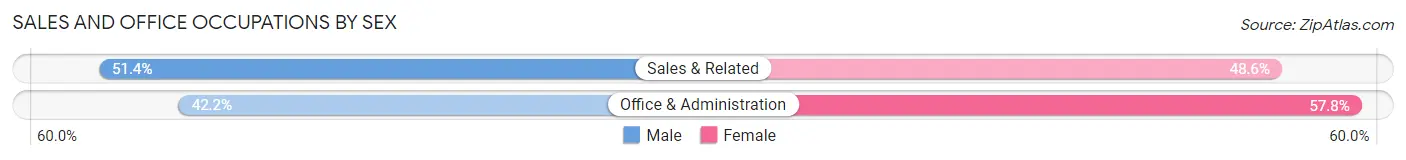
| Occupation | Male | Female |
| Sales & Related | 55 (51.4%) | 52 (48.6%) |
| Office & Administration | 46 (42.2%) | 63 (57.8%) |
| Total (Category) | 101 (46.8%) | 115 (53.2%) |
| Total (Overall) | 737 (47.9%) | 801 (52.1%) |
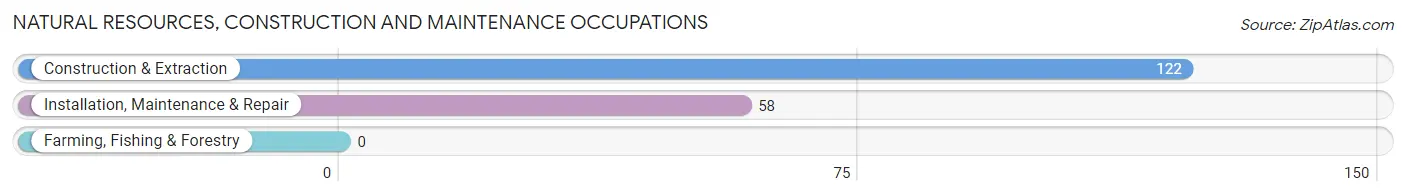
Natural Resources, Construction and Maintenance Occupations
The most common Natural Resources, Construction and Maintenance occupations in Ingalls Park are Construction & Extraction (122 | 7.9%), and Installation, Maintenance & Repair (58 | 3.8%).
Natural Resources, Construction and Maintenance Occupations by Sex
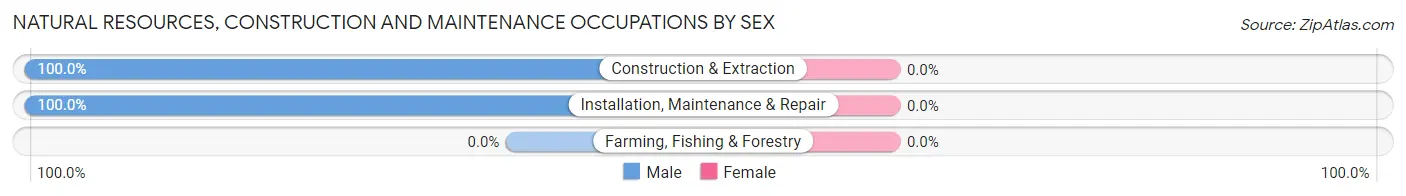
| Occupation | Male | Female |
| Farming, Fishing & Forestry | 0 (0.0%) | 0 (0.0%) |
| Construction & Extraction | 122 (100.0%) | 0 (0.0%) |
| Installation, Maintenance & Repair | 58 (100.0%) | 0 (0.0%) |
| Total (Category) | 180 (100.0%) | 0 (0.0%) |
| Total (Overall) | 737 (47.9%) | 801 (52.1%) |
Production, Transportation and Moving Occupations
The most common Production, Transportation and Moving occupations in Ingalls Park are Material Moving (209 | 13.6%), Production (164 | 10.7%), and Transportation (12 | 0.8%).
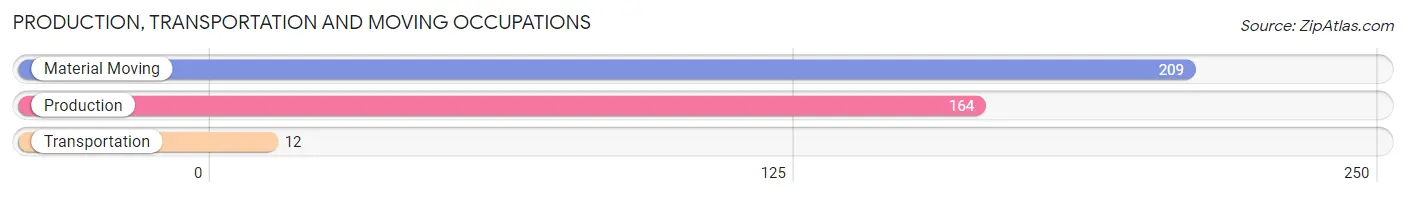
Production, Transportation and Moving Occupations by Sex
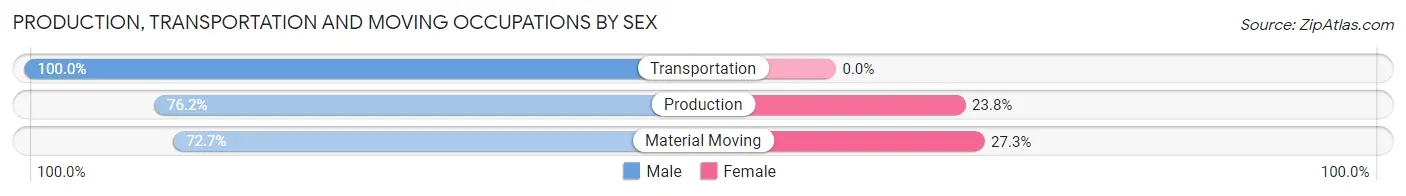
| Occupation | Male | Female |
| Production | 125 (76.2%) | 39 (23.8%) |
| Transportation | 12 (100.0%) | 0 (0.0%) |
| Material Moving | 152 (72.7%) | 57 (27.3%) |
| Total (Category) | 289 (75.1%) | 96 (24.9%) |
| Total (Overall) | 737 (47.9%) | 801 (52.1%) |
Employment Industries by Sex in Ingalls Park
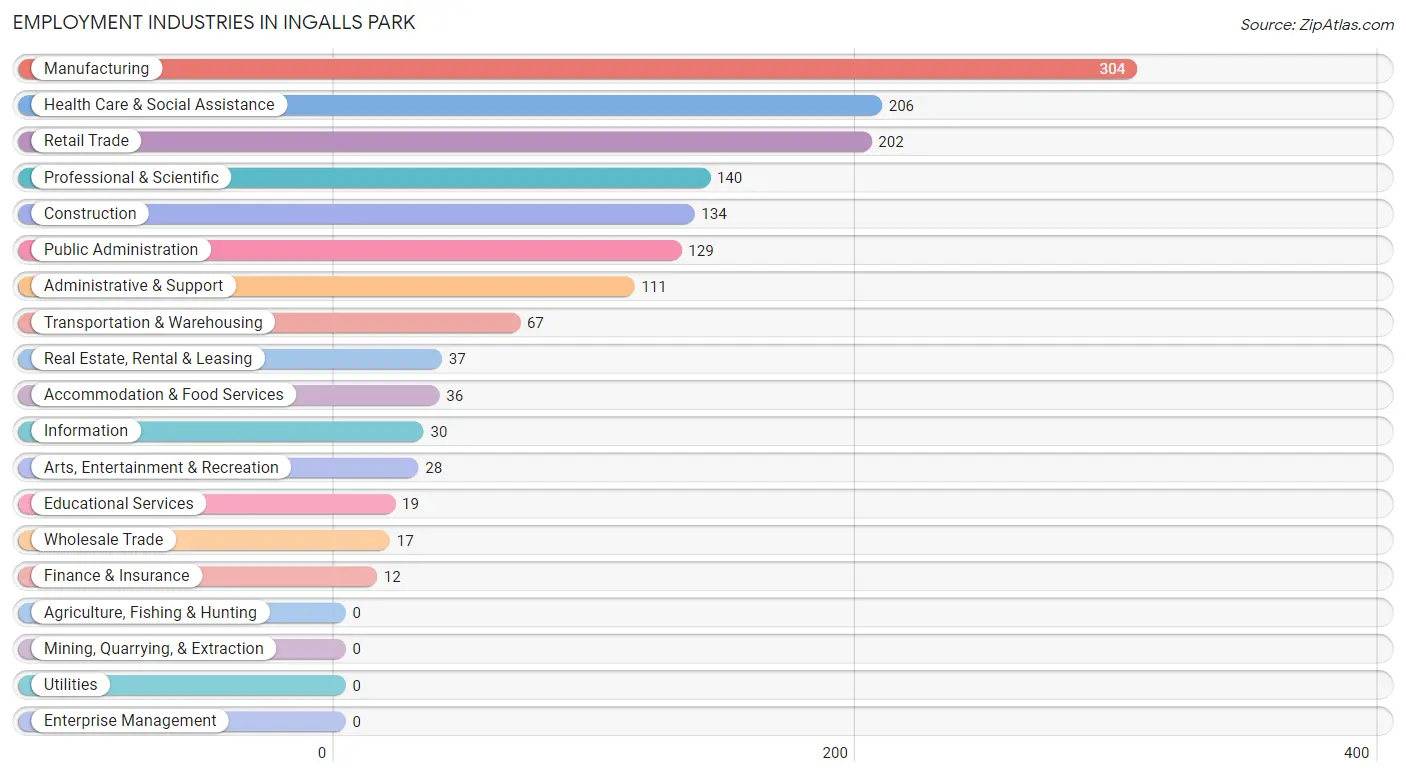
Employment Industries in Ingalls Park
The major employment industries in Ingalls Park include Manufacturing (304 | 19.8%), Health Care & Social Assistance (206 | 13.4%), Retail Trade (202 | 13.1%), Professional & Scientific (140 | 9.1%), and Construction (134 | 8.7%).
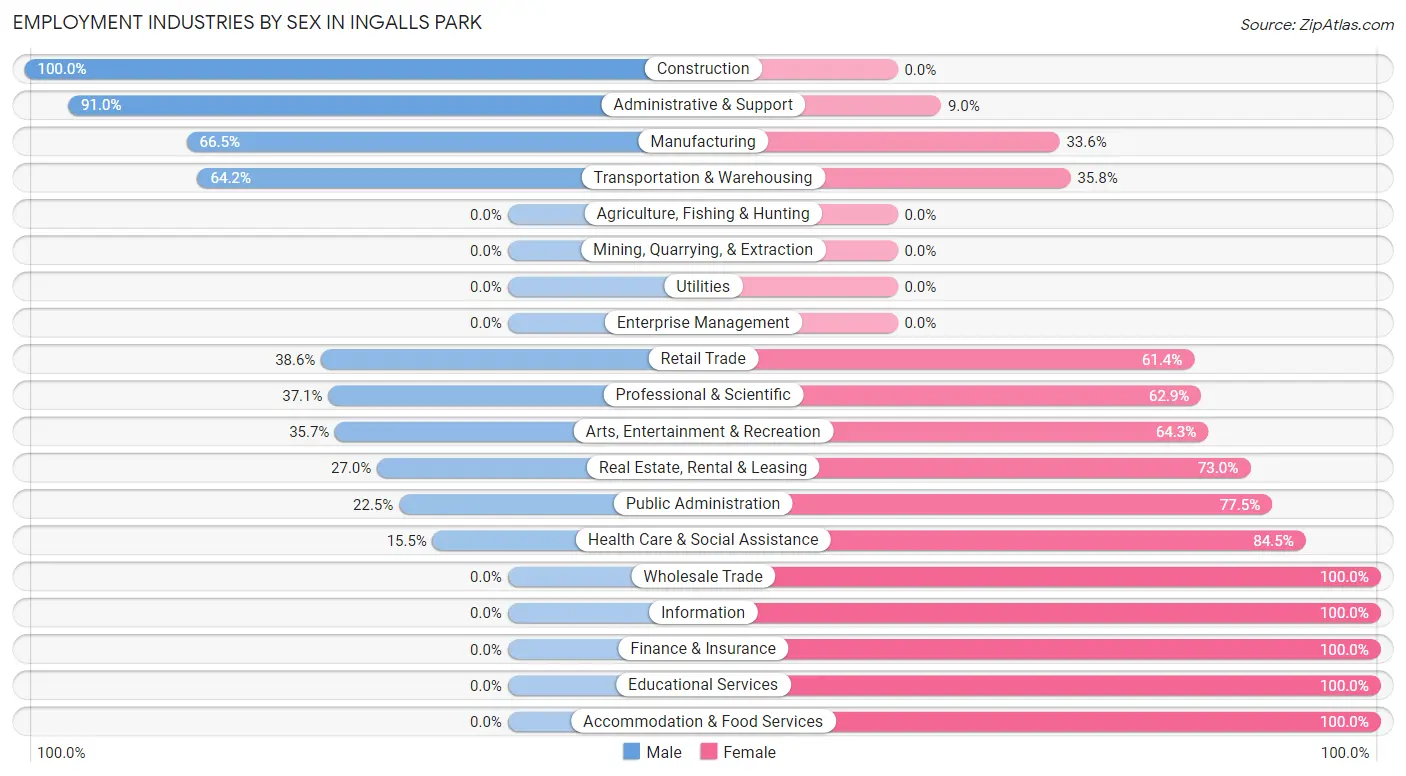
Employment Industries by Sex in Ingalls Park
The Ingalls Park industries that see more men than women are Construction (100.0%), Administrative & Support (91.0%), and Manufacturing (66.4%), whereas the industries that tend to have a higher number of women are Wholesale Trade (100.0%), Information (100.0%), and Finance & Insurance (100.0%).
| Industry | Male | Female |
| Agriculture, Fishing & Hunting | 0 (0.0%) | 0 (0.0%) |
| Mining, Quarrying, & Extraction | 0 (0.0%) | 0 (0.0%) |
| Construction | 134 (100.0%) | 0 (0.0%) |
| Manufacturing | 202 (66.4%) | 102 (33.6%) |
| Wholesale Trade | 0 (0.0%) | 17 (100.0%) |
| Retail Trade | 78 (38.6%) | 124 (61.4%) |
| Transportation & Warehousing | 43 (64.2%) | 24 (35.8%) |
| Utilities | 0 (0.0%) | 0 (0.0%) |
| Information | 0 (0.0%) | 30 (100.0%) |
| Finance & Insurance | 0 (0.0%) | 12 (100.0%) |
| Real Estate, Rental & Leasing | 10 (27.0%) | 27 (73.0%) |
| Professional & Scientific | 52 (37.1%) | 88 (62.9%) |
| Enterprise Management | 0 (0.0%) | 0 (0.0%) |
| Administrative & Support | 101 (91.0%) | 10 (9.0%) |
| Educational Services | 0 (0.0%) | 19 (100.0%) |
| Health Care & Social Assistance | 32 (15.5%) | 174 (84.5%) |
| Arts, Entertainment & Recreation | 10 (35.7%) | 18 (64.3%) |
| Accommodation & Food Services | 0 (0.0%) | 36 (100.0%) |
| Public Administration | 29 (22.5%) | 100 (77.5%) |
| Total | 737 (47.9%) | 801 (52.1%) |
Education in Ingalls Park
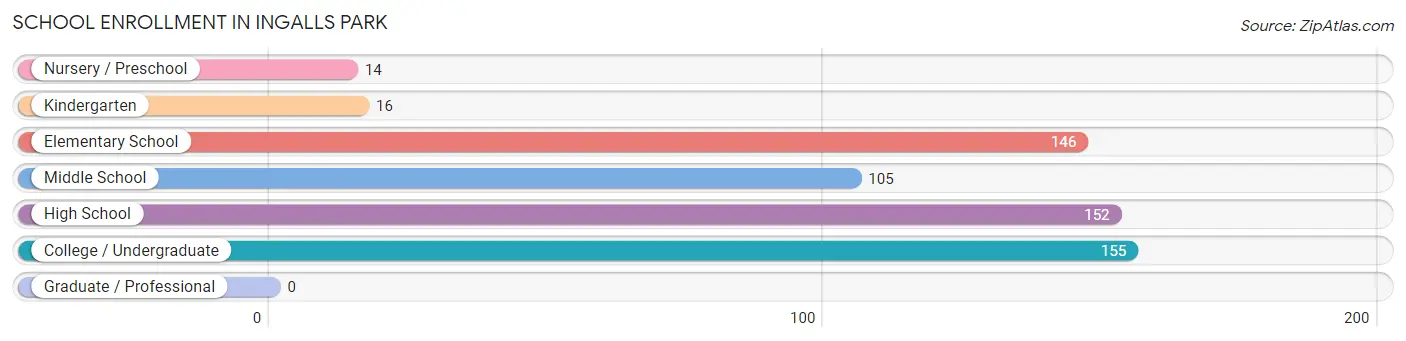
School Enrollment in Ingalls Park
The most common levels of schooling among the 588 students in Ingalls Park are college / undergraduate (155 | 26.4%), high school (152 | 25.9%), and elementary school (146 | 24.8%).
| School Level | # Students | % Students |
| Nursery / Preschool | 14 | 2.4% |
| Kindergarten | 16 | 2.7% |
| Elementary School | 146 | 24.8% |
| Middle School | 105 | 17.9% |
| High School | 152 | 25.9% |
| College / Undergraduate | 155 | 26.4% |
| Graduate / Professional | 0 | 0.0% |
| Total | 588 | 100.0% |
School Enrollment by Age by Funding Source in Ingalls Park
Out of a total of 588 students who are enrolled in schools in Ingalls Park, 39 (6.6%) attend a private institution, while the remaining 549 (93.4%) are enrolled in public schools. The age group of 10 to 14 year olds has the highest likelihood of being enrolled in private schools, with 39 (17.4% in the age bracket) enrolled. Conversely, the age group of 3 to 4 year olds has the lowest likelihood of being enrolled in a private school, with 14 (100.0% in the age bracket) attending a public institution.
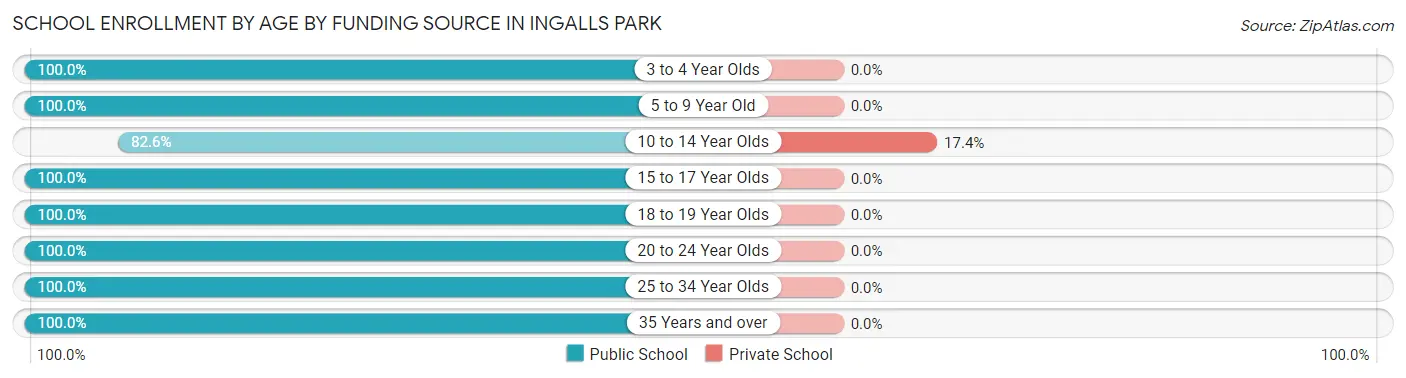
| Age Bracket | Public School | Private School |
| 3 to 4 Year Olds | 14 (100.0%) | 0 (0.0%) |
| 5 to 9 Year Old | 80 (100.0%) | 0 (0.0%) |
| 10 to 14 Year Olds | 185 (82.6%) | 39 (17.4%) |
| 15 to 17 Year Olds | 83 (100.0%) | 0 (0.0%) |
| 18 to 19 Year Olds | 51 (100.0%) | 0 (0.0%) |
| 20 to 24 Year Olds | 84 (100.0%) | 0 (0.0%) |
| 25 to 34 Year Olds | 33 (100.0%) | 0 (0.0%) |
| 35 Years and over | 19 (100.0%) | 0 (0.0%) |
| Total | 549 (93.4%) | 39 (6.6%) |
Educational Attainment by Field of Study in Ingalls Park
Business (78 | 33.5%), psychology (53 | 22.8%), social sciences (43 | 18.4%), arts & humanities (24 | 10.3%), and literature & languages (11 | 4.7%) are the most common fields of study among 233 individuals in Ingalls Park who have obtained a bachelor's degree or higher.
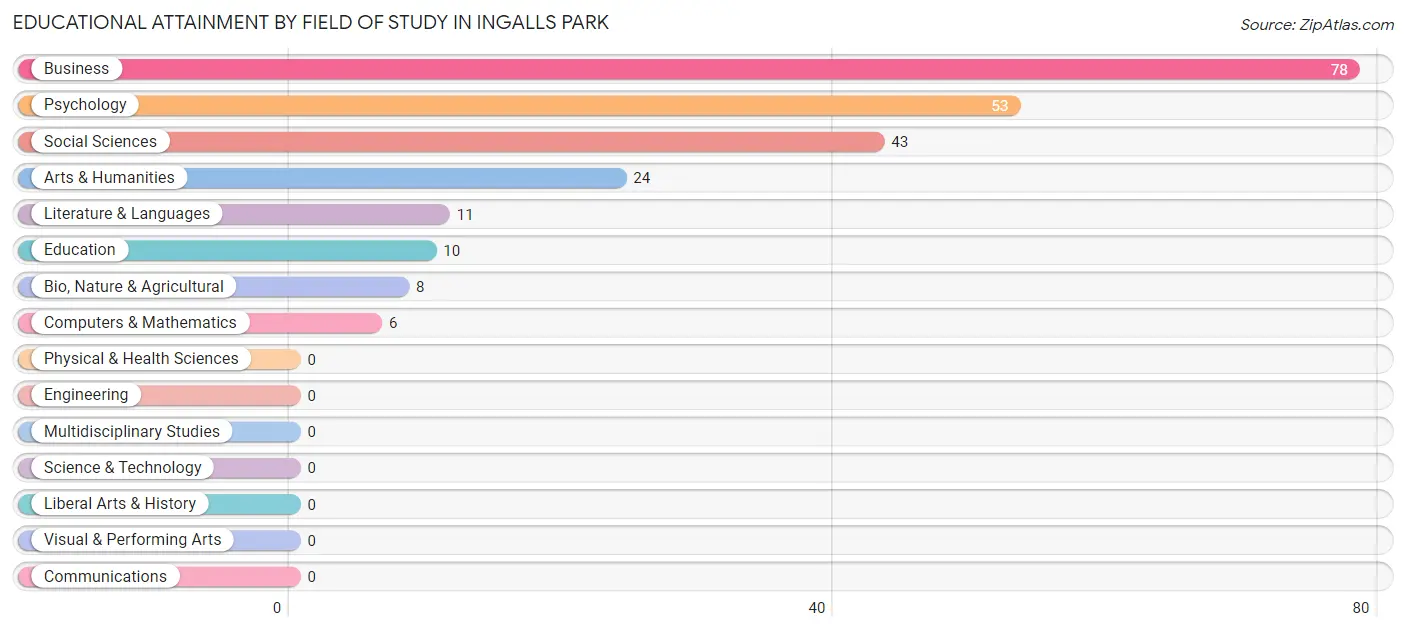
| Field of Study | # Graduates | % Graduates |
| Computers & Mathematics | 6 | 2.6% |
| Bio, Nature & Agricultural | 8 | 3.4% |
| Physical & Health Sciences | 0 | 0.0% |
| Psychology | 53 | 22.8% |
| Social Sciences | 43 | 18.4% |
| Engineering | 0 | 0.0% |
| Multidisciplinary Studies | 0 | 0.0% |
| Science & Technology | 0 | 0.0% |
| Business | 78 | 33.5% |
| Education | 10 | 4.3% |
| Literature & Languages | 11 | 4.7% |
| Liberal Arts & History | 0 | 0.0% |
| Visual & Performing Arts | 0 | 0.0% |
| Communications | 0 | 0.0% |
| Arts & Humanities | 24 | 10.3% |
| Total | 233 | 100.0% |
Transportation & Commute in Ingalls Park
Vehicle Availability by Sex in Ingalls Park
The most prevalent vehicle ownership categories in Ingalls Park are males with 2 vehicles (379, accounting for 51.4%) and females with 2 vehicles (260, making up 48.6%).
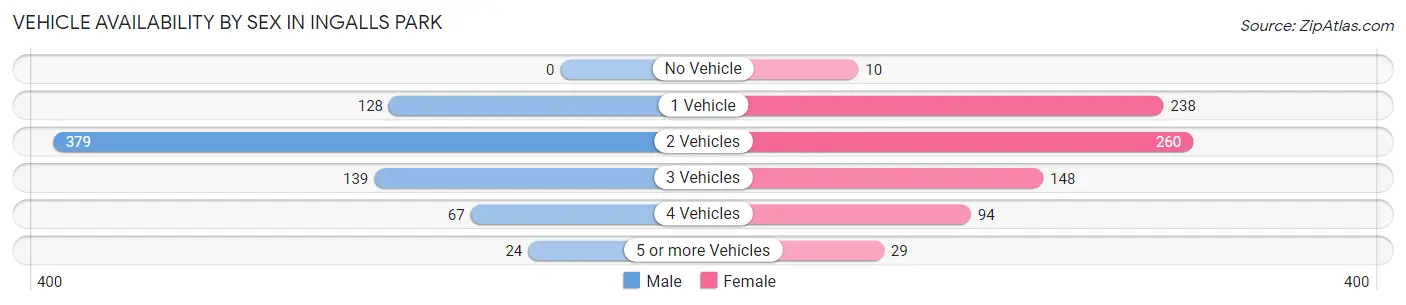
| Vehicles Available | Male | Female |
| No Vehicle | 0 (0.0%) | 10 (1.3%) |
| 1 Vehicle | 128 (17.4%) | 238 (30.5%) |
| 2 Vehicles | 379 (51.4%) | 260 (33.4%) |
| 3 Vehicles | 139 (18.9%) | 148 (19.0%) |
| 4 Vehicles | 67 (9.1%) | 94 (12.1%) |
| 5 or more Vehicles | 24 (3.3%) | 29 (3.7%) |
| Total | 737 (100.0%) | 779 (100.0%) |
Commute Time in Ingalls Park
The most frequently occuring commute durations in Ingalls Park are 30 to 34 minutes (281 commuters, 20.2%), 45 to 59 minutes (261 commuters, 18.7%), and 15 to 19 minutes (221 commuters, 15.9%).
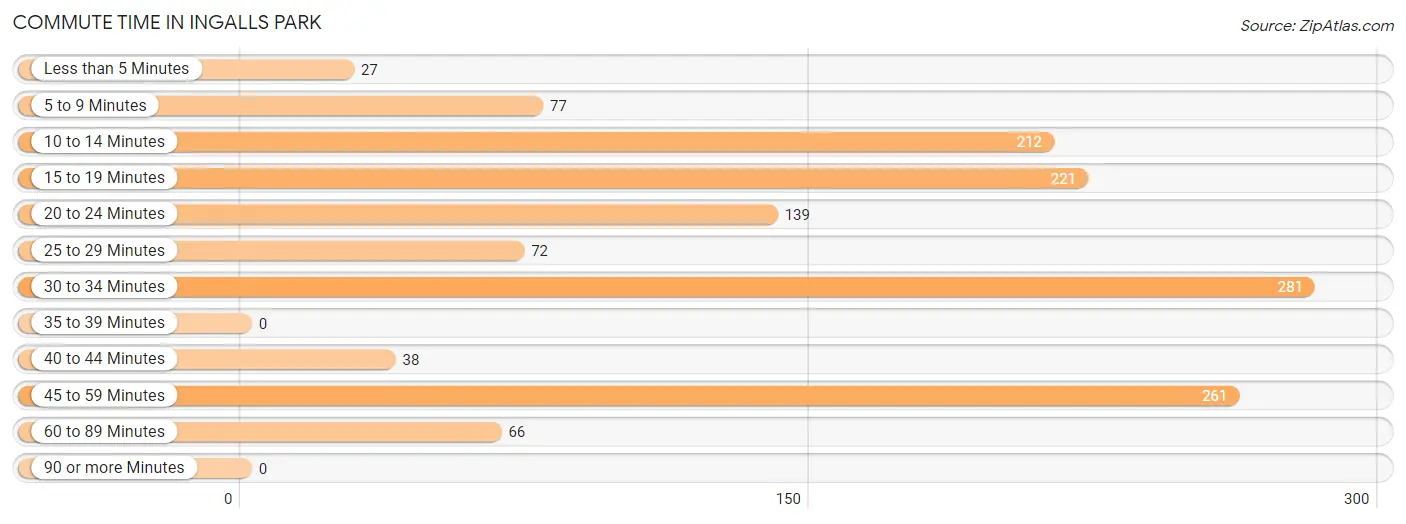
| Commute Time | # Commuters | % Commuters |
| Less than 5 Minutes | 27 | 1.9% |
| 5 to 9 Minutes | 77 | 5.5% |
| 10 to 14 Minutes | 212 | 15.2% |
| 15 to 19 Minutes | 221 | 15.9% |
| 20 to 24 Minutes | 139 | 10.0% |
| 25 to 29 Minutes | 72 | 5.2% |
| 30 to 34 Minutes | 281 | 20.2% |
| 35 to 39 Minutes | 0 | 0.0% |
| 40 to 44 Minutes | 38 | 2.7% |
| 45 to 59 Minutes | 261 | 18.7% |
| 60 to 89 Minutes | 66 | 4.7% |
| 90 or more Minutes | 0 | 0.0% |
Commute Time by Sex in Ingalls Park
The most common commute times in Ingalls Park are 30 to 34 minutes (191 commuters, 27.3%) for males and 10 to 14 minutes (146 commuters, 21.1%) for females.
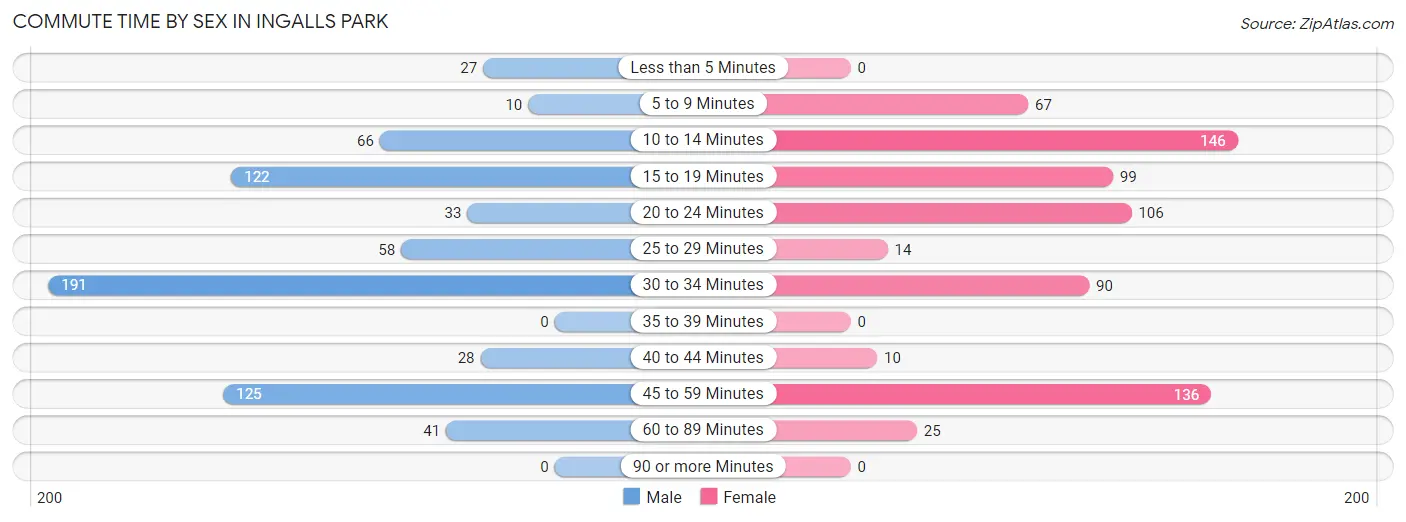
| Commute Time | Male | Female |
| Less than 5 Minutes | 27 (3.8%) | 0 (0.0%) |
| 5 to 9 Minutes | 10 (1.4%) | 67 (9.7%) |
| 10 to 14 Minutes | 66 (9.4%) | 146 (21.1%) |
| 15 to 19 Minutes | 122 (17.4%) | 99 (14.3%) |
| 20 to 24 Minutes | 33 (4.7%) | 106 (15.3%) |
| 25 to 29 Minutes | 58 (8.3%) | 14 (2.0%) |
| 30 to 34 Minutes | 191 (27.3%) | 90 (13.0%) |
| 35 to 39 Minutes | 0 (0.0%) | 0 (0.0%) |
| 40 to 44 Minutes | 28 (4.0%) | 10 (1.4%) |
| 45 to 59 Minutes | 125 (17.8%) | 136 (19.6%) |
| 60 to 89 Minutes | 41 (5.9%) | 25 (3.6%) |
| 90 or more Minutes | 0 (0.0%) | 0 (0.0%) |
Time of Departure to Work by Sex in Ingalls Park
The most frequent times of departure to work in Ingalls Park are 12:00 AM to 4:59 AM (126, 18.0%) for males and 6:30 AM to 6:59 AM (142, 20.5%) for females.
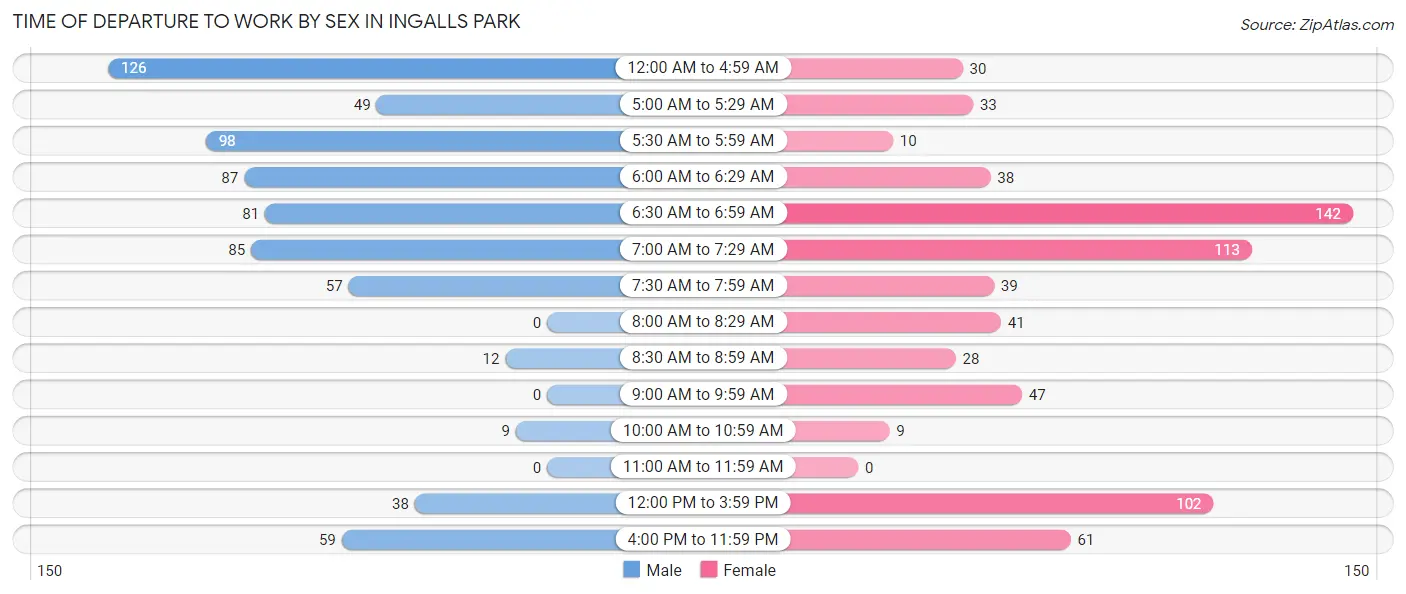
| Time of Departure | Male | Female |
| 12:00 AM to 4:59 AM | 126 (18.0%) | 30 (4.3%) |
| 5:00 AM to 5:29 AM | 49 (7.0%) | 33 (4.8%) |
| 5:30 AM to 5:59 AM | 98 (14.0%) | 10 (1.4%) |
| 6:00 AM to 6:29 AM | 87 (12.4%) | 38 (5.5%) |
| 6:30 AM to 6:59 AM | 81 (11.6%) | 142 (20.5%) |
| 7:00 AM to 7:29 AM | 85 (12.1%) | 113 (16.3%) |
| 7:30 AM to 7:59 AM | 57 (8.1%) | 39 (5.6%) |
| 8:00 AM to 8:29 AM | 0 (0.0%) | 41 (5.9%) |
| 8:30 AM to 8:59 AM | 12 (1.7%) | 28 (4.0%) |
| 9:00 AM to 9:59 AM | 0 (0.0%) | 47 (6.8%) |
| 10:00 AM to 10:59 AM | 9 (1.3%) | 9 (1.3%) |
| 11:00 AM to 11:59 AM | 0 (0.0%) | 0 (0.0%) |
| 12:00 PM to 3:59 PM | 38 (5.4%) | 102 (14.7%) |
| 4:00 PM to 11:59 PM | 59 (8.4%) | 61 (8.8%) |
| Total | 701 (100.0%) | 693 (100.0%) |
Housing Occupancy in Ingalls Park
Occupancy by Ownership in Ingalls Park
Of the total 1,209 dwellings in Ingalls Park, owner-occupied units account for 874 (72.3%), while renter-occupied units make up 335 (27.7%).
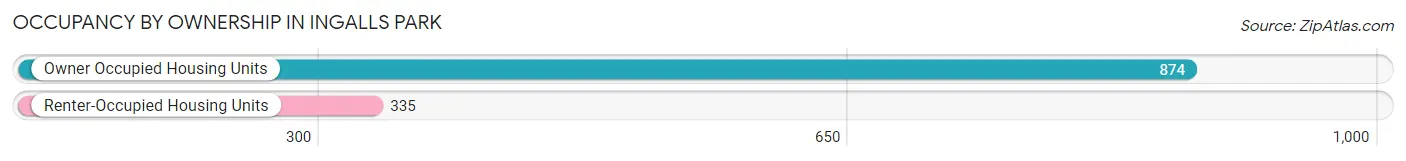
| Occupancy | # Housing Units | % Housing Units |
| Owner Occupied Housing Units | 874 | 72.3% |
| Renter-Occupied Housing Units | 335 | 27.7% |
| Total Occupied Housing Units | 1,209 | 100.0% |
Occupancy by Household Size in Ingalls Park
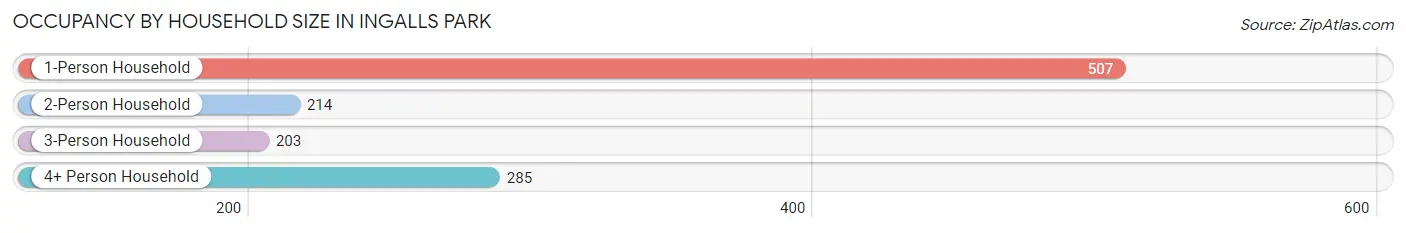
| Household Size | # Housing Units | % Housing Units |
| 1-Person Household | 507 | 41.9% |
| 2-Person Household | 214 | 17.7% |
| 3-Person Household | 203 | 16.8% |
| 4+ Person Household | 285 | 23.6% |
| Total Housing Units | 1,209 | 100.0% |
Occupancy by Ownership by Household Size in Ingalls Park
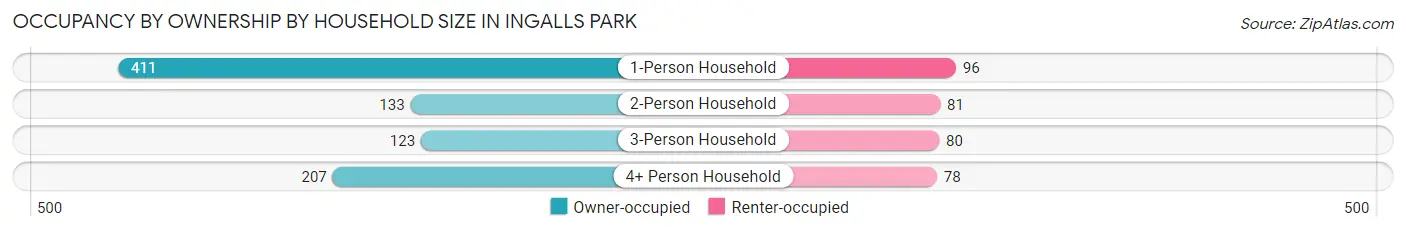
| Household Size | Owner-occupied | Renter-occupied |
| 1-Person Household | 411 (81.1%) | 96 (18.9%) |
| 2-Person Household | 133 (62.2%) | 81 (37.9%) |
| 3-Person Household | 123 (60.6%) | 80 (39.4%) |
| 4+ Person Household | 207 (72.6%) | 78 (27.4%) |
| Total Housing Units | 874 (72.3%) | 335 (27.7%) |
Occupancy by Educational Attainment in Ingalls Park
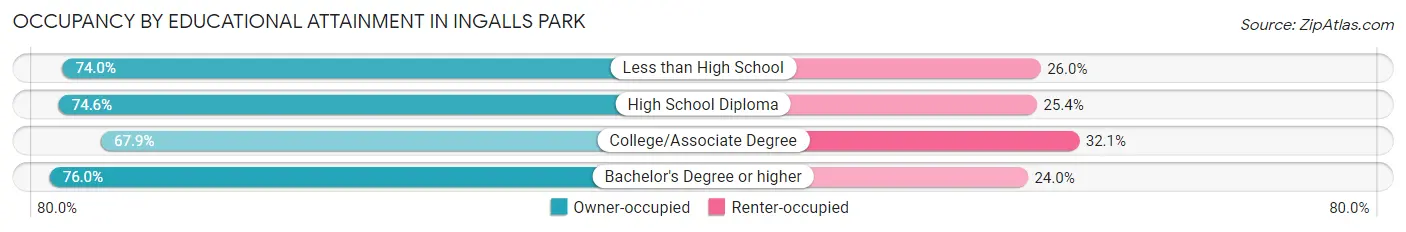
| Household Size | Owner-occupied | Renter-occupied |
| Less than High School | 91 (74.0%) | 32 (26.0%) |
| High School Diploma | 422 (74.6%) | 144 (25.4%) |
| College/Associate Degree | 285 (67.9%) | 135 (32.1%) |
| Bachelor's Degree or higher | 76 (76.0%) | 24 (24.0%) |
Occupancy by Age of Householder in Ingalls Park
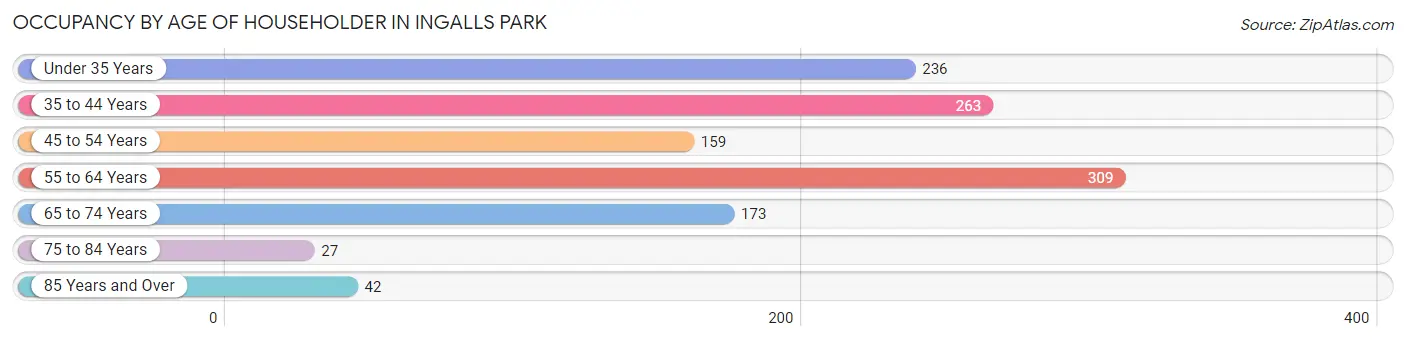
| Age Bracket | # Households | % Households |
| Under 35 Years | 236 | 19.5% |
| 35 to 44 Years | 263 | 21.7% |
| 45 to 54 Years | 159 | 13.2% |
| 55 to 64 Years | 309 | 25.6% |
| 65 to 74 Years | 173 | 14.3% |
| 75 to 84 Years | 27 | 2.2% |
| 85 Years and Over | 42 | 3.5% |
| Total | 1,209 | 100.0% |
Housing Finances in Ingalls Park
Median Income by Occupancy in Ingalls Park
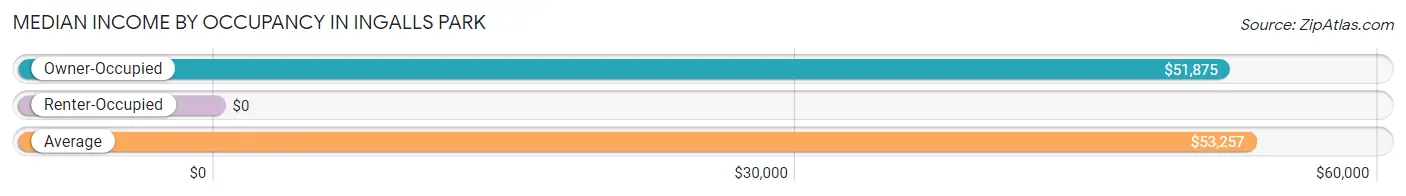
| Occupancy Type | # Households | Median Income |
| Owner-Occupied | 874 (72.3%) | $51,875 |
| Renter-Occupied | 335 (27.7%) | $0 |
| Average | 1,209 (100.0%) | $53,257 |
Occupancy by Householder Income Bracket in Ingalls Park
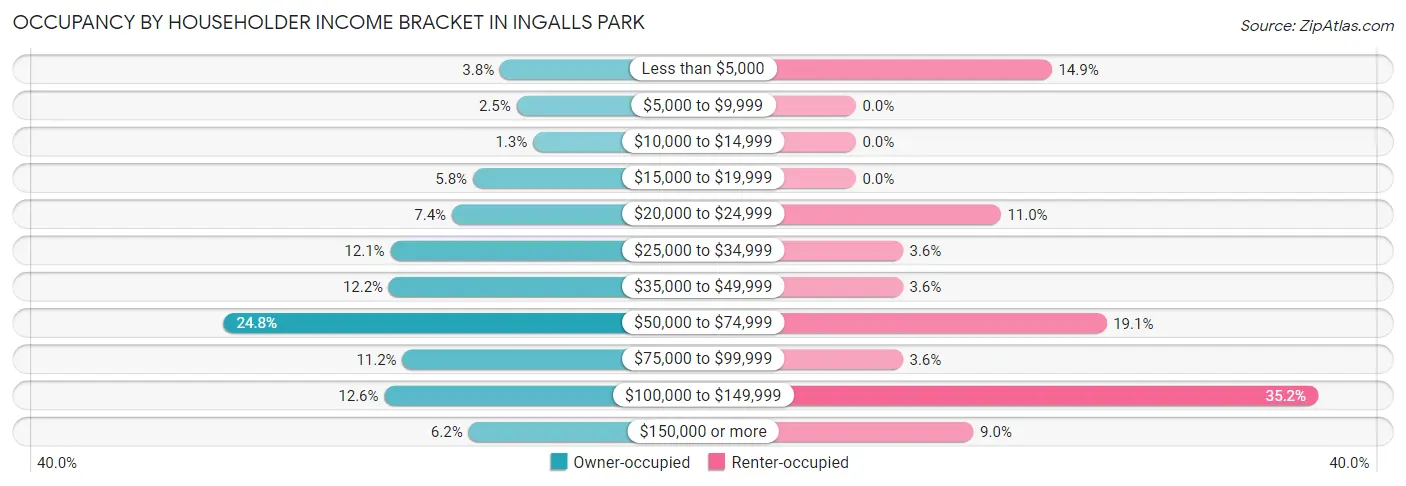
| Income Bracket | Owner-occupied | Renter-occupied |
| Less than $5,000 | 33 (3.8%) | 50 (14.9%) |
| $5,000 to $9,999 | 22 (2.5%) | 0 (0.0%) |
| $10,000 to $14,999 | 11 (1.3%) | 0 (0.0%) |
| $15,000 to $19,999 | 51 (5.8%) | 0 (0.0%) |
| $20,000 to $24,999 | 65 (7.4%) | 37 (11.0%) |
| $25,000 to $34,999 | 106 (12.1%) | 12 (3.6%) |
| $35,000 to $49,999 | 107 (12.2%) | 12 (3.6%) |
| $50,000 to $74,999 | 217 (24.8%) | 64 (19.1%) |
| $75,000 to $99,999 | 98 (11.2%) | 12 (3.6%) |
| $100,000 to $149,999 | 110 (12.6%) | 118 (35.2%) |
| $150,000 or more | 54 (6.2%) | 30 (9.0%) |
| Total | 874 (100.0%) | 335 (100.0%) |
Monthly Housing Cost Tiers in Ingalls Park
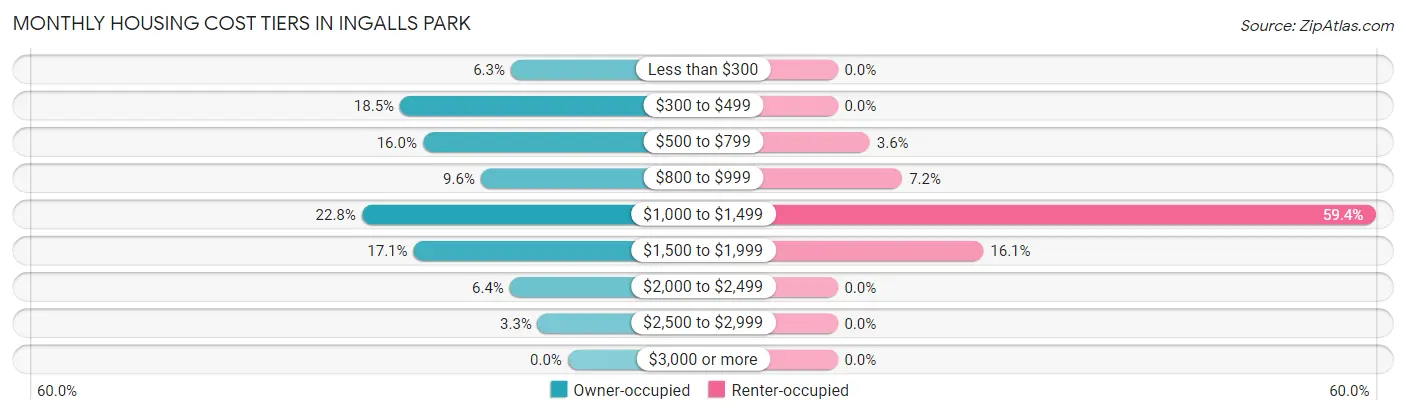
| Monthly Cost | Owner-occupied | Renter-occupied |
| Less than $300 | 55 (6.3%) | 0 (0.0%) |
| $300 to $499 | 162 (18.5%) | 0 (0.0%) |
| $500 to $799 | 140 (16.0%) | 12 (3.6%) |
| $800 to $999 | 84 (9.6%) | 24 (7.2%) |
| $1,000 to $1,499 | 199 (22.8%) | 199 (59.4%) |
| $1,500 to $1,999 | 149 (17.1%) | 54 (16.1%) |
| $2,000 to $2,499 | 56 (6.4%) | 0 (0.0%) |
| $2,500 to $2,999 | 29 (3.3%) | 0 (0.0%) |
| $3,000 or more | 0 (0.0%) | 0 (0.0%) |
| Total | 874 (100.0%) | 335 (100.0%) |
Physical Housing Characteristics in Ingalls Park
Housing Structures in Ingalls Park
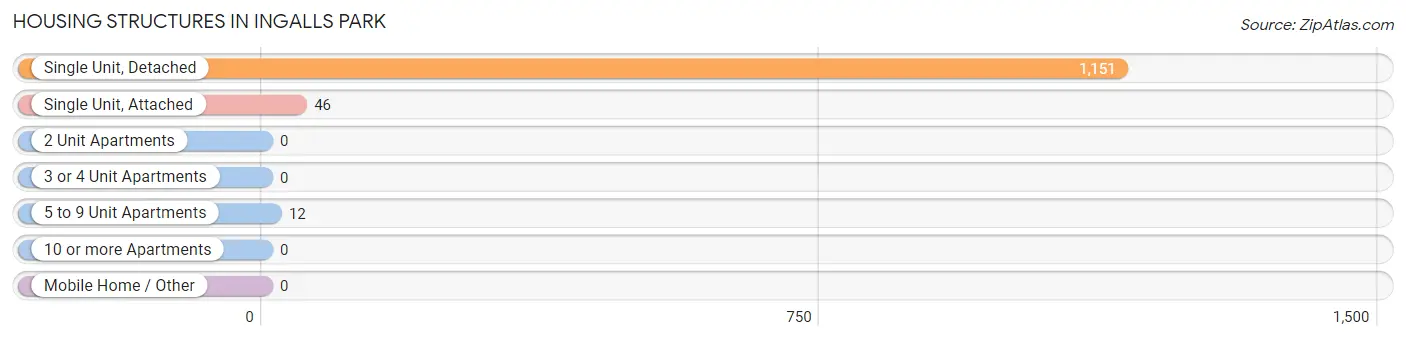
| Structure Type | # Housing Units | % Housing Units |
| Single Unit, Detached | 1,151 | 95.2% |
| Single Unit, Attached | 46 | 3.8% |
| 2 Unit Apartments | 0 | 0.0% |
| 3 or 4 Unit Apartments | 0 | 0.0% |
| 5 to 9 Unit Apartments | 12 | 1.0% |
| 10 or more Apartments | 0 | 0.0% |
| Mobile Home / Other | 0 | 0.0% |
| Total | 1,209 | 100.0% |
Housing Structures by Occupancy in Ingalls Park
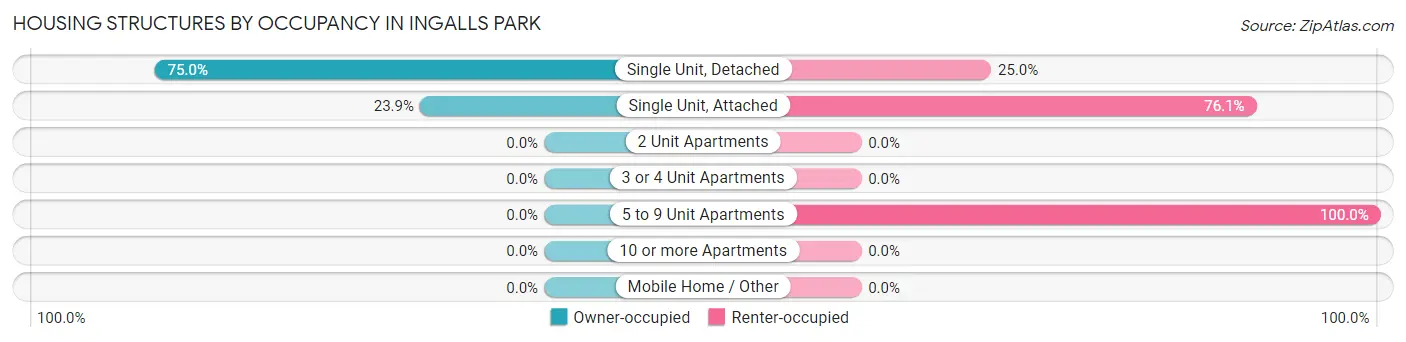
| Structure Type | Owner-occupied | Renter-occupied |
| Single Unit, Detached | 863 (75.0%) | 288 (25.0%) |
| Single Unit, Attached | 11 (23.9%) | 35 (76.1%) |
| 2 Unit Apartments | 0 (0.0%) | 0 (0.0%) |
| 3 or 4 Unit Apartments | 0 (0.0%) | 0 (0.0%) |
| 5 to 9 Unit Apartments | 0 (0.0%) | 12 (100.0%) |
| 10 or more Apartments | 0 (0.0%) | 0 (0.0%) |
| Mobile Home / Other | 0 (0.0%) | 0 (0.0%) |
| Total | 874 (72.3%) | 335 (27.7%) |
Housing Structures by Number of Rooms in Ingalls Park
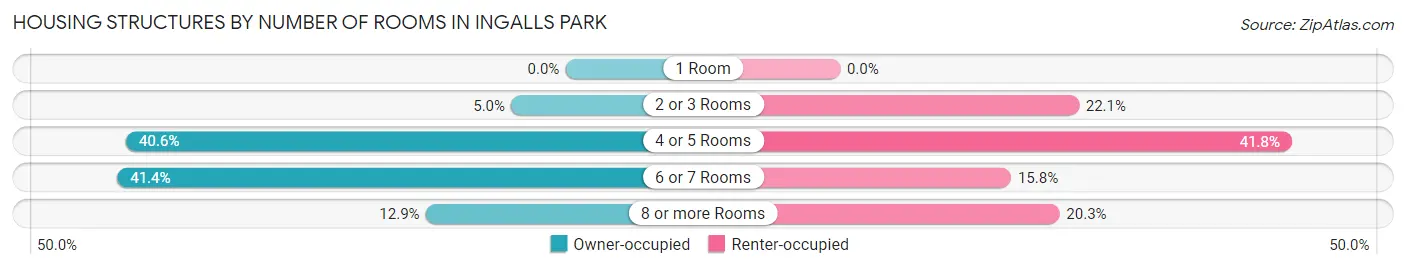
| Number of Rooms | Owner-occupied | Renter-occupied |
| 1 Room | 0 (0.0%) | 0 (0.0%) |
| 2 or 3 Rooms | 44 (5.0%) | 74 (22.1%) |
| 4 or 5 Rooms | 355 (40.6%) | 140 (41.8%) |
| 6 or 7 Rooms | 362 (41.4%) | 53 (15.8%) |
| 8 or more Rooms | 113 (12.9%) | 68 (20.3%) |
| Total | 874 (100.0%) | 335 (100.0%) |
Housing Structure by Heating Type in Ingalls Park
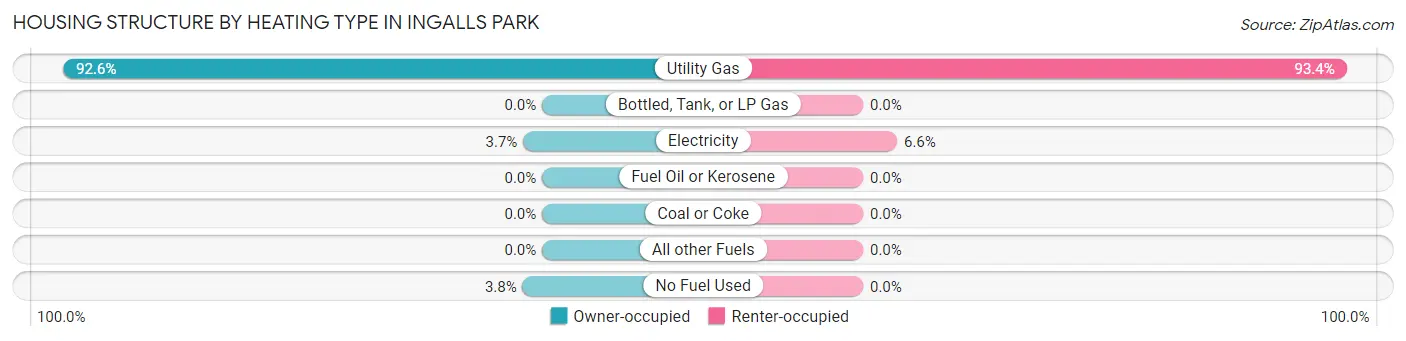
| Heating Type | Owner-occupied | Renter-occupied |
| Utility Gas | 809 (92.6%) | 313 (93.4%) |
| Bottled, Tank, or LP Gas | 0 (0.0%) | 0 (0.0%) |
| Electricity | 32 (3.7%) | 22 (6.6%) |
| Fuel Oil or Kerosene | 0 (0.0%) | 0 (0.0%) |
| Coal or Coke | 0 (0.0%) | 0 (0.0%) |
| All other Fuels | 0 (0.0%) | 0 (0.0%) |
| No Fuel Used | 33 (3.8%) | 0 (0.0%) |
| Total | 874 (100.0%) | 335 (100.0%) |
Household Vehicle Usage in Ingalls Park
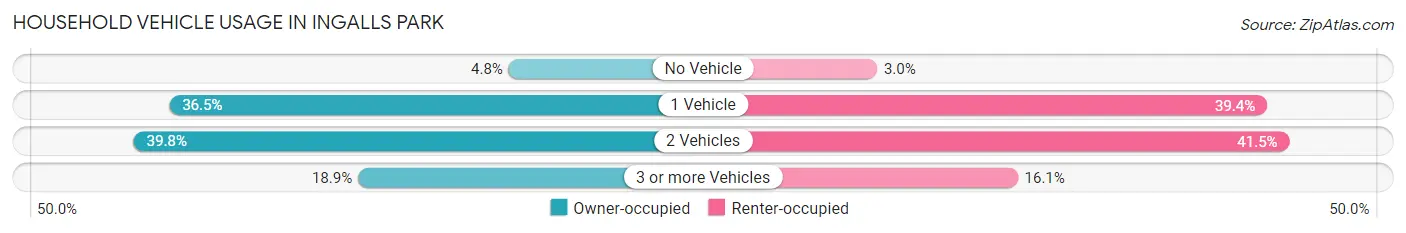
| Vehicles per Household | Owner-occupied | Renter-occupied |
| No Vehicle | 42 (4.8%) | 10 (3.0%) |
| 1 Vehicle | 319 (36.5%) | 132 (39.4%) |
| 2 Vehicles | 348 (39.8%) | 139 (41.5%) |
| 3 or more Vehicles | 165 (18.9%) | 54 (16.1%) |
| Total | 874 (100.0%) | 335 (100.0%) |
Real Estate & Mortgages in Ingalls Park
Real Estate and Mortgage Overview in Ingalls Park
| Characteristic | Without Mortgage | With Mortgage |
| Housing Units | 388 | 486 |
| Median Property Value | $125,900 | $140,700 |
| Median Household Income | $35,379 | $48 |
| Monthly Housing Costs | $477 | $0 |
| Real Estate Taxes | $2,149 | $11 |
Property Value by Mortgage Status in Ingalls Park
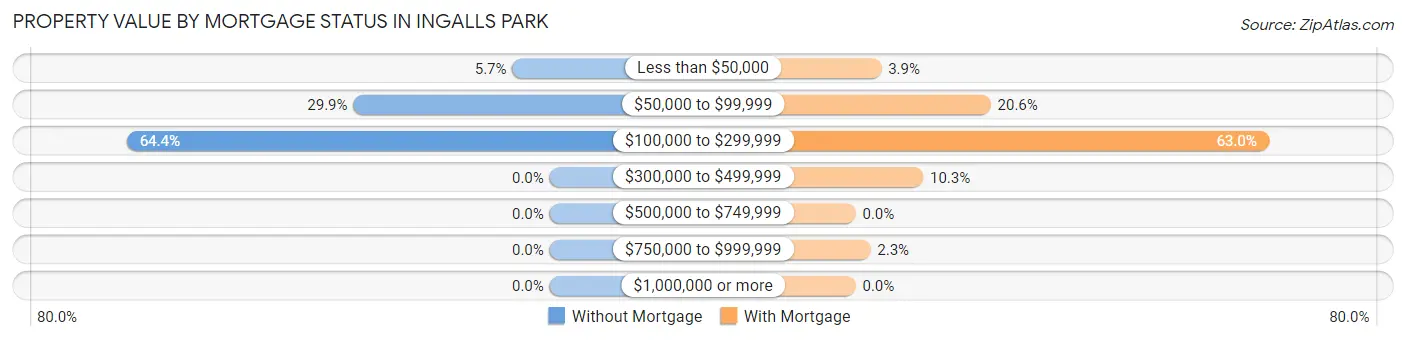
| Property Value | Without Mortgage | With Mortgage |
| Less than $50,000 | 22 (5.7%) | 19 (3.9%) |
| $50,000 to $99,999 | 116 (29.9%) | 100 (20.6%) |
| $100,000 to $299,999 | 250 (64.4%) | 306 (63.0%) |
| $300,000 to $499,999 | 0 (0.0%) | 50 (10.3%) |
| $500,000 to $749,999 | 0 (0.0%) | 0 (0.0%) |
| $750,000 to $999,999 | 0 (0.0%) | 11 (2.3%) |
| $1,000,000 or more | 0 (0.0%) | 0 (0.0%) |
| Total | 388 (100.0%) | 486 (100.0%) |
Household Income by Mortgage Status in Ingalls Park
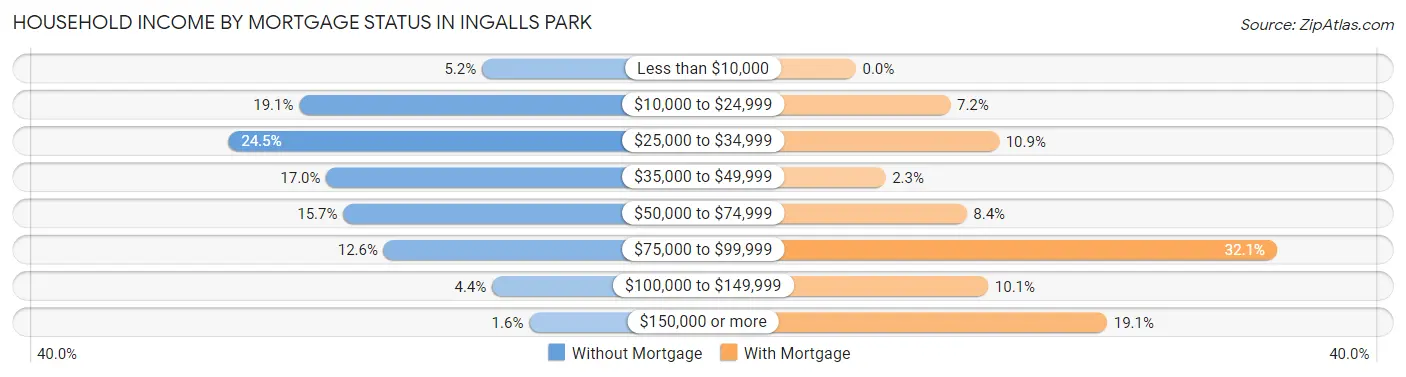
| Household Income | Without Mortgage | With Mortgage |
| Less than $10,000 | 20 (5.1%) | 0 (0.0%) |
| $10,000 to $24,999 | 74 (19.1%) | 35 (7.2%) |
| $25,000 to $34,999 | 95 (24.5%) | 53 (10.9%) |
| $35,000 to $49,999 | 66 (17.0%) | 11 (2.3%) |
| $50,000 to $74,999 | 61 (15.7%) | 41 (8.4%) |
| $75,000 to $99,999 | 49 (12.6%) | 156 (32.1%) |
| $100,000 to $149,999 | 17 (4.4%) | 49 (10.1%) |
| $150,000 or more | 6 (1.5%) | 93 (19.1%) |
| Total | 388 (100.0%) | 486 (100.0%) |
Property Value to Household Income Ratio in Ingalls Park
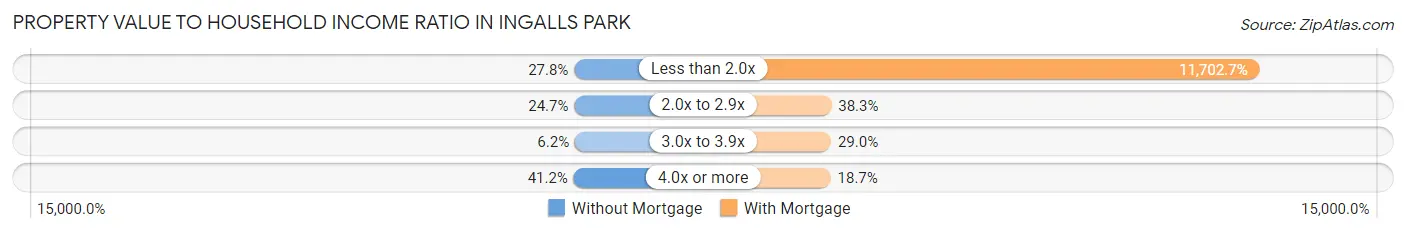
| Value-to-Income Ratio | Without Mortgage | With Mortgage |
| Less than 2.0x | 108 (27.8%) | 56,875 (11,702.7%) |
| 2.0x to 2.9x | 96 (24.7%) | 186 (38.3%) |
| 3.0x to 3.9x | 24 (6.2%) | 141 (29.0%) |
| 4.0x or more | 160 (41.2%) | 91 (18.7%) |
| Total | 388 (100.0%) | 486 (100.0%) |
Real Estate Taxes by Mortgage Status in Ingalls Park
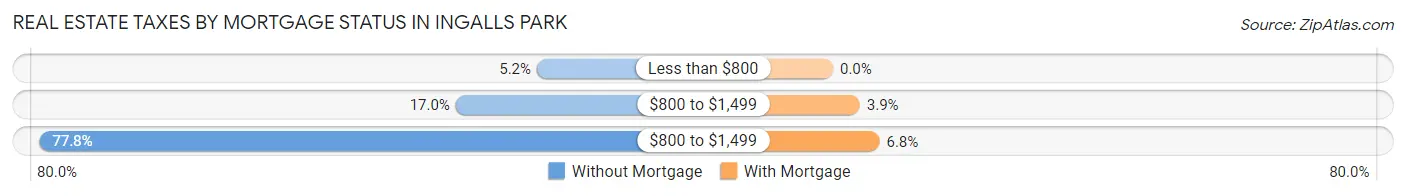
| Property Taxes | Without Mortgage | With Mortgage |
| Less than $800 | 20 (5.1%) | 0 (0.0%) |
| $800 to $1,499 | 66 (17.0%) | 19 (3.9%) |
| $800 to $1,499 | 302 (77.8%) | 33 (6.8%) |
| Total | 388 (100.0%) | 486 (100.0%) |
Health & Disability in Ingalls Park
Health Insurance Coverage by Age in Ingalls Park
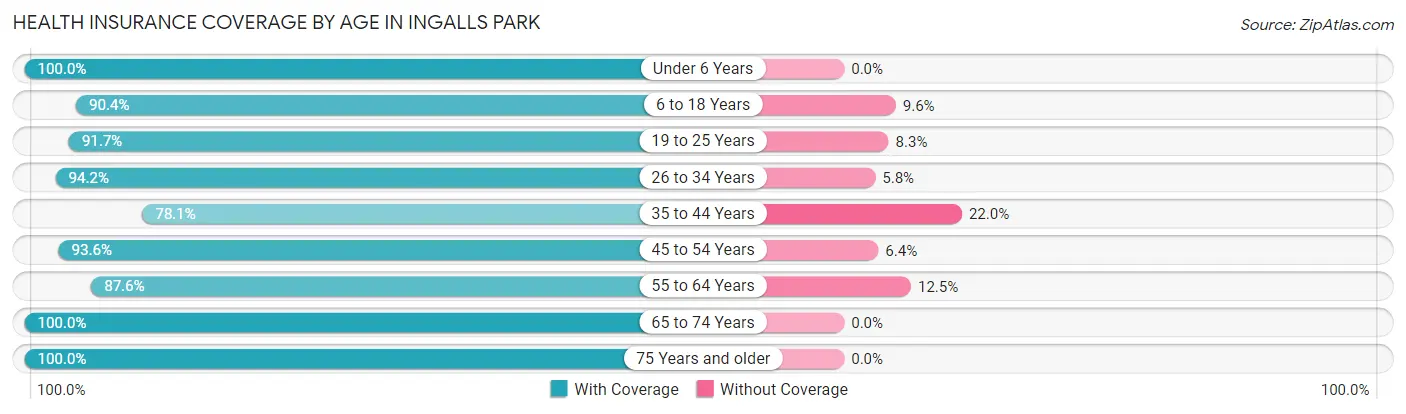
| Age Bracket | With Coverage | Without Coverage |
| Under 6 Years | 252 (100.0%) | 0 (0.0%) |
| 6 to 18 Years | 414 (90.4%) | 44 (9.6%) |
| 19 to 25 Years | 355 (91.7%) | 32 (8.3%) |
| 26 to 34 Years | 358 (94.2%) | 22 (5.8%) |
| 35 to 44 Years | 416 (78.0%) | 117 (22.0%) |
| 45 to 54 Years | 265 (93.6%) | 18 (6.4%) |
| 55 to 64 Years | 415 (87.5%) | 59 (12.4%) |
| 65 to 74 Years | 252 (100.0%) | 0 (0.0%) |
| 75 Years and older | 83 (100.0%) | 0 (0.0%) |
| Total | 2,810 (90.6%) | 292 (9.4%) |
Health Insurance Coverage by Citizenship Status in Ingalls Park
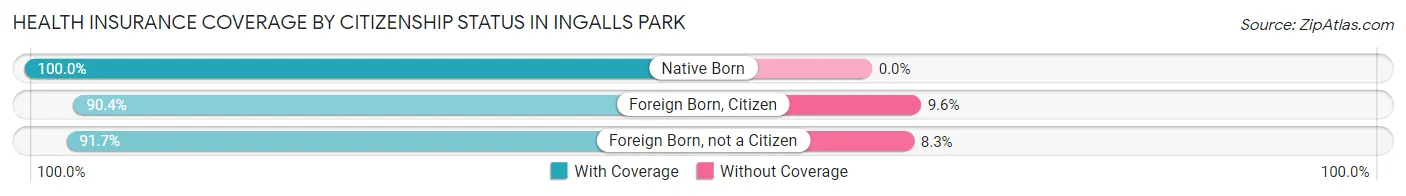
| Citizenship Status | With Coverage | Without Coverage |
| Native Born | 252 (100.0%) | 0 (0.0%) |
| Foreign Born, Citizen | 414 (90.4%) | 44 (9.6%) |
| Foreign Born, not a Citizen | 355 (91.7%) | 32 (8.3%) |
Health Insurance Coverage by Household Income in Ingalls Park
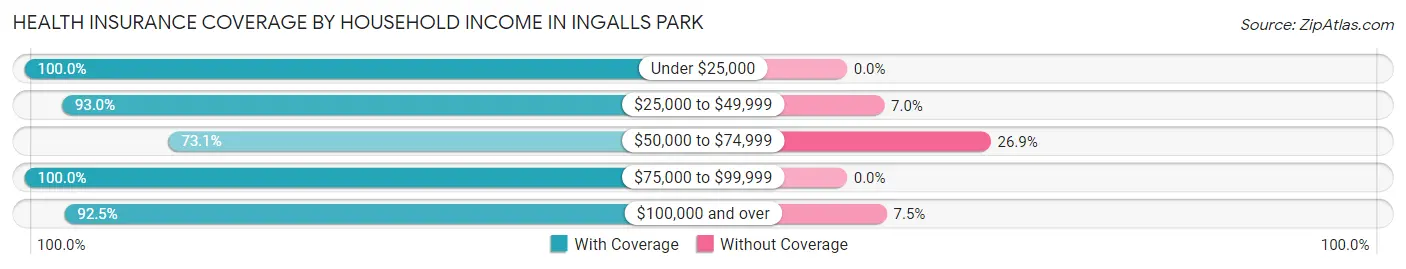
| Household Income | With Coverage | Without Coverage |
| Under $25,000 | 355 (100.0%) | 0 (0.0%) |
| $25,000 to $49,999 | 466 (93.0%) | 35 (7.0%) |
| $50,000 to $74,999 | 464 (73.1%) | 171 (26.9%) |
| $75,000 to $99,999 | 457 (100.0%) | 0 (0.0%) |
| $100,000 and over | 1,067 (92.5%) | 86 (7.5%) |
Public vs Private Health Insurance Coverage by Age in Ingalls Park
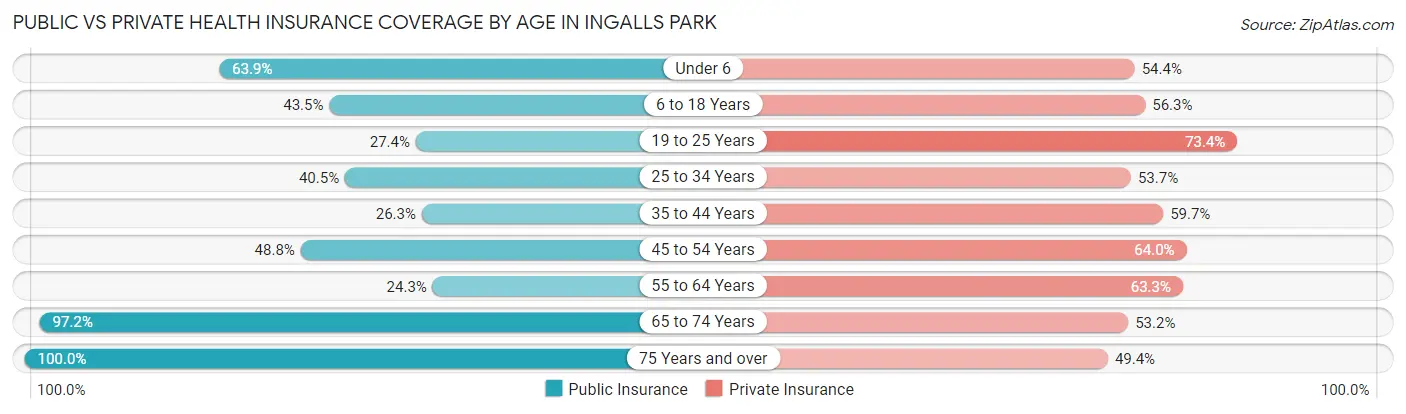
| Age Bracket | Public Insurance | Private Insurance |
| Under 6 | 161 (63.9%) | 137 (54.4%) |
| 6 to 18 Years | 199 (43.4%) | 258 (56.3%) |
| 19 to 25 Years | 106 (27.4%) | 284 (73.4%) |
| 25 to 34 Years | 154 (40.5%) | 204 (53.7%) |
| 35 to 44 Years | 140 (26.3%) | 318 (59.7%) |
| 45 to 54 Years | 138 (48.8%) | 181 (64.0%) |
| 55 to 64 Years | 115 (24.3%) | 300 (63.3%) |
| 65 to 74 Years | 245 (97.2%) | 134 (53.2%) |
| 75 Years and over | 83 (100.0%) | 41 (49.4%) |
| Total | 1,341 (43.2%) | 1,857 (59.9%) |
Disability Status by Sex by Age in Ingalls Park
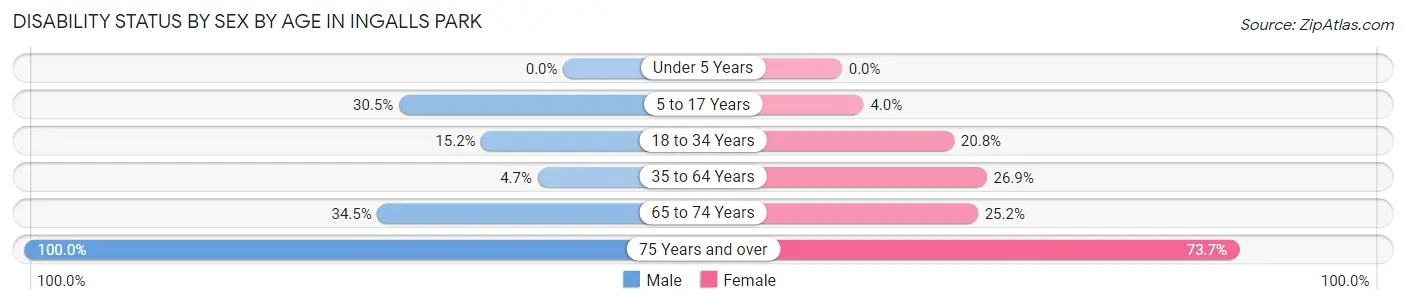
| Age Bracket | Male | Female |
| Under 5 Years | 0 (0.0%) | 0 (0.0%) |
| 5 to 17 Years | 86 (30.5%) | 7 (4.0%) |
| 18 to 34 Years | 33 (15.2%) | 124 (20.8%) |
| 35 to 64 Years | 35 (4.7%) | 148 (26.9%) |
| 65 to 74 Years | 50 (34.5%) | 27 (25.2%) |
| 75 Years and over | 7 (100.0%) | 56 (73.7%) |
Disability Class by Sex by Age in Ingalls Park
Disability Class: Hearing Difficulty
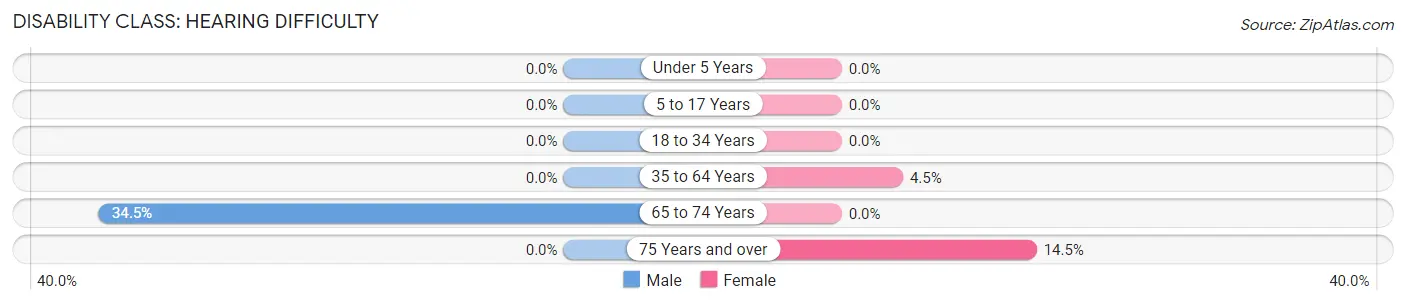
| Age Bracket | Male | Female |
| Under 5 Years | 0 (0.0%) | 0 (0.0%) |
| 5 to 17 Years | 0 (0.0%) | 0 (0.0%) |
| 18 to 34 Years | 0 (0.0%) | 0 (0.0%) |
| 35 to 64 Years | 0 (0.0%) | 25 (4.5%) |
| 65 to 74 Years | 50 (34.5%) | 0 (0.0%) |
| 75 Years and over | 0 (0.0%) | 11 (14.5%) |
Disability Class: Vision Difficulty
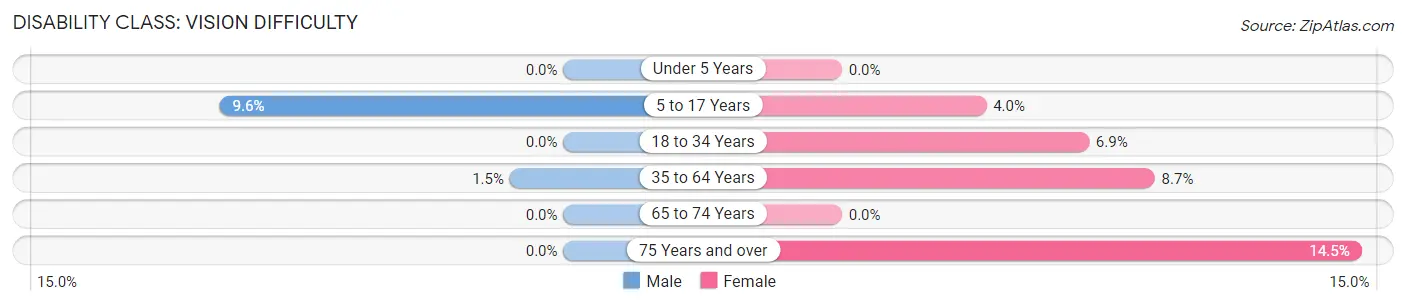
| Age Bracket | Male | Female |
| Under 5 Years | 0 (0.0%) | 0 (0.0%) |
| 5 to 17 Years | 27 (9.6%) | 7 (4.0%) |
| 18 to 34 Years | 0 (0.0%) | 41 (6.9%) |
| 35 to 64 Years | 11 (1.5%) | 48 (8.7%) |
| 65 to 74 Years | 0 (0.0%) | 0 (0.0%) |
| 75 Years and over | 0 (0.0%) | 11 (14.5%) |
Disability Class: Cognitive Difficulty
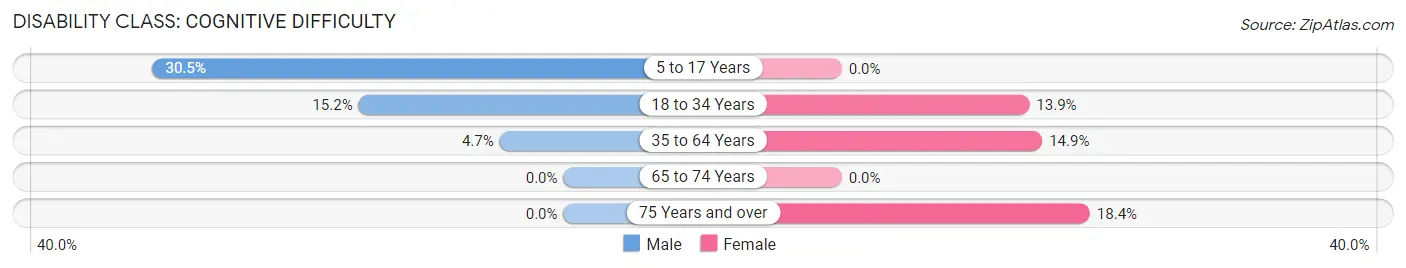
| Age Bracket | Male | Female |
| 5 to 17 Years | 86 (30.5%) | 0 (0.0%) |
| 18 to 34 Years | 33 (15.2%) | 83 (13.9%) |
| 35 to 64 Years | 35 (4.7%) | 82 (14.9%) |
| 65 to 74 Years | 0 (0.0%) | 0 (0.0%) |
| 75 Years and over | 0 (0.0%) | 14 (18.4%) |
Disability Class: Ambulatory Difficulty
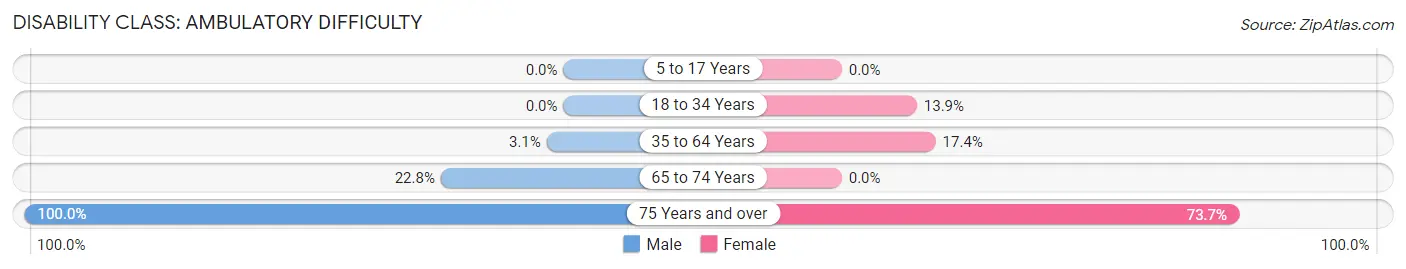
| Age Bracket | Male | Female |
| 5 to 17 Years | 0 (0.0%) | 0 (0.0%) |
| 18 to 34 Years | 0 (0.0%) | 83 (13.9%) |
| 35 to 64 Years | 23 (3.1%) | 96 (17.4%) |
| 65 to 74 Years | 33 (22.8%) | 0 (0.0%) |
| 75 Years and over | 7 (100.0%) | 56 (73.7%) |
Disability Class: Self-Care Difficulty
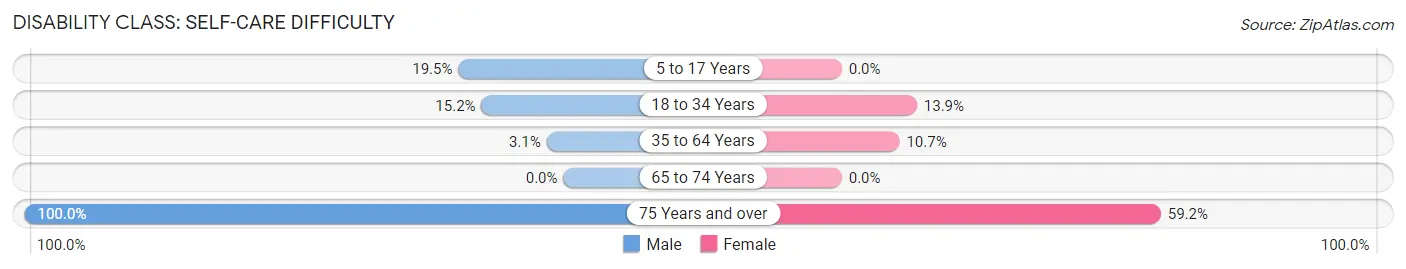
| Age Bracket | Male | Female |
| 5 to 17 Years | 55 (19.5%) | 0 (0.0%) |
| 18 to 34 Years | 33 (15.2%) | 83 (13.9%) |
| 35 to 64 Years | 23 (3.1%) | 59 (10.7%) |
| 65 to 74 Years | 0 (0.0%) | 0 (0.0%) |
| 75 Years and over | 7 (100.0%) | 45 (59.2%) |
Technology Access in Ingalls Park
Computing Device Access in Ingalls Park
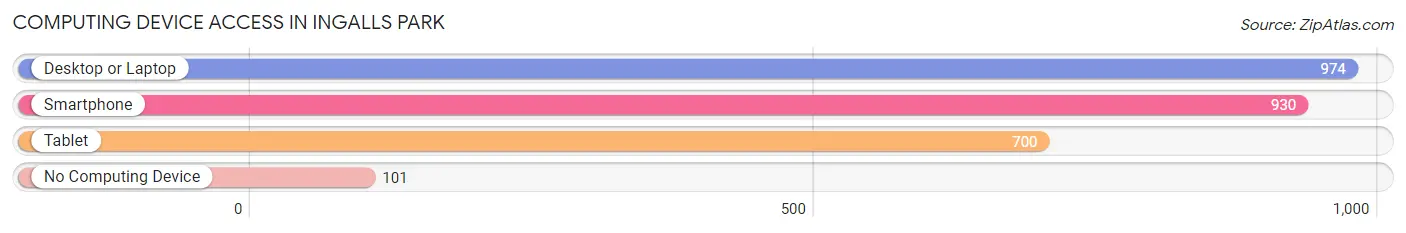
| Device Type | # Households | % Households |
| Desktop or Laptop | 974 | 80.6% |
| Smartphone | 930 | 76.9% |
| Tablet | 700 | 57.9% |
| No Computing Device | 101 | 8.4% |
| Total | 1,209 | 100.0% |
Internet Access in Ingalls Park
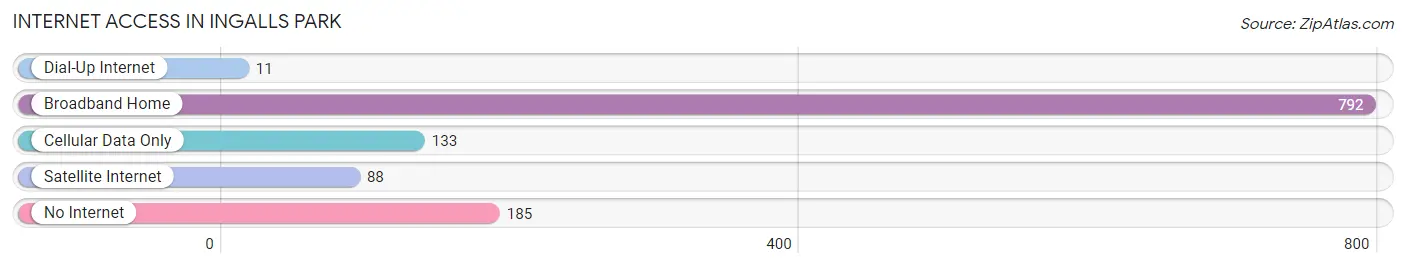
| Internet Type | # Households | % Households |
| Dial-Up Internet | 11 | 0.9% |
| Broadband Home | 792 | 65.5% |
| Cellular Data Only | 133 | 11.0% |
| Satellite Internet | 88 | 7.3% |
| No Internet | 185 | 15.3% |
| Total | 1,209 | 100.0% |
Ingalls Park Summary
Ingalls Park is a small village located in Will County, Illinois, United States. The village is situated in the southwestern part of the county, approximately 30 miles southwest of Chicago. As of the 2010 census, the population of Ingalls Park was 1,845.
History
The area that is now Ingalls Park was first settled in the early 1800s by a group of settlers from New England. The settlers named the area after their leader, John Ingalls. The village was officially incorporated in 1892.
In the early 1900s, Ingalls Park was a thriving agricultural community. The village was home to several farms, as well as a few small businesses. The village also had a train station, which allowed for easy access to Chicago.
In the 1950s, the village began to experience a population decline as many of the residents moved away to larger cities. This trend continued until the late 1980s, when the village began to experience a population increase. This was due to the village's proximity to Chicago, as well as its affordable housing prices.
Geography
Ingalls Park is located in southwestern Will County, approximately 30 miles southwest of Chicago. The village is situated on the banks of the Des Plaines River. The village is bordered by the villages of Homer Glen to the north, Lockport to the east, and Joliet to the south.
The village has a total area of 1.3 square miles, all of which is land. The village is located in a flat, open area, with no major hills or mountains.
Economy
The economy of Ingalls Park is largely based on agriculture and manufacturing. The village is home to several farms, as well as a few small businesses. The village also has a few industrial parks, which are home to several manufacturing companies.
The village also has a few retail stores, including a grocery store, a hardware store, and a few restaurants.
Demographics
As of the 2010 census, the population of Ingalls Park was 1,845. The racial makeup of the village was 94.3% White, 1.2% African American, 0.3% Native American, 0.7% Asian, and 3.5% from other races. Hispanic or Latino of any race were 6.2% of the population.
The median household income in Ingalls Park was $60,938, and the median family income was $68,750. The per capita income for the village was $25,945. About 4.3% of families and 5.7% of the population were below the poverty line, including 8.2% of those under age 18 and 4.2% of those age 65 or over.
Common Questions
What is Per Capita Income in Ingalls Park?
Per Capita income in Ingalls Park is $27,673.
What is the Median Family Income in Ingalls Park?
Median Family Income in Ingalls Park is $79,647.
What is the Median Household income in Ingalls Park?
Median Household Income in Ingalls Park is $53,257.
What is Income or Wage Gap in Ingalls Park?
Income or Wage Gap in Ingalls Park is 27.8%.
Women in Ingalls Park earn 72.2 cents for every dollar earned by a man.
What is Inequality or Gini Index in Ingalls Park?
Inequality or Gini Index in Ingalls Park is 0.40.
What is the Total Population of Ingalls Park?
Total Population of Ingalls Park is 3,102.
What is the Total Male Population of Ingalls Park?
Total Male Population of Ingalls Park is 1,455.
What is the Total Female Population of Ingalls Park?
Total Female Population of Ingalls Park is 1,647.
What is the Ratio of Males per 100 Females in Ingalls Park?
There are 88.34 Males per 100 Females in Ingalls Park.
What is the Ratio of Females per 100 Males in Ingalls Park?
There are 113.20 Females per 100 Males in Ingalls Park.
What is the Median Population Age in Ingalls Park?
Median Population Age in Ingalls Park is 35.9 Years.
What is the Average Family Size in Ingalls Park
Average Family Size in Ingalls Park is 3.7 People.
What is the Average Household Size in Ingalls Park
Average Household Size in Ingalls Park is 2.6 People.
How Large is the Labor Force in Ingalls Park?
There are 1,695 People in the Labor Forcein in Ingalls Park.
What is the Percentage of People in the Labor Force in Ingalls Park?
68.0% of People are in the Labor Force in Ingalls Park.
What is the Unemployment Rate in Ingalls Park?
Unemployment Rate in Ingalls Park is 9.3%.