St David, IL Map & Demographics
St David Map
St David Overview
$29,149
PER CAPITA INCOME
$52,011
AVG FAMILY INCOME
$50,792
AVG HOUSEHOLD INCOME
26.6%
WAGE / INCOME GAP [ % ]
73.4¢/ $1
WAGE / INCOME GAP [ $ ]
0.40
INEQUALITY / GINI INDEX
540
TOTAL POPULATION
284
MALE POPULATION
256
FEMALE POPULATION
110.94
MALES / 100 FEMALES
90.14
FEMALES / 100 MALES
42.2
MEDIAN AGE
2.8
AVG FAMILY SIZE
2.2
AVG HOUSEHOLD SIZE
241
LABOR FORCE [ PEOPLE ]
52.3%
PERCENT IN LABOR FORCE
0.8%
UNEMPLOYMENT RATE
Income in St David
Income Overview in St David
Per Capita Income in St David is $29,149, while median incomes of families and households are $52,011 and $50,792 respectively.
| Characteristic | Number | Measure |
| Per Capita Income | 540 | $29,149 |
| Median Family Income | 151 | $52,011 |
| Mean Family Income | 151 | $72,525 |
| Median Household Income | 243 | $50,792 |
| Mean Household Income | 243 | $63,239 |
| Income Deficit | 151 | $0 |
| Wage / Income Gap (%) | 540 | 26.62% |
| Wage / Income Gap ($) | 540 | 73.38¢ per $1 |
| Gini / Inequality Index | 540 | 0.40 |
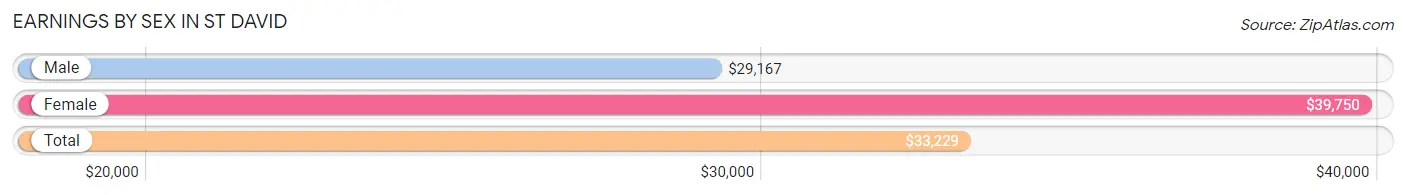
Earnings by Sex in St David
Average Earnings in St David are $33,229, $29,167 for men and $39,750 for women, a difference of 26.6%.
| Sex | Number | Average Earnings |
| Male | 140 (55.8%) | $29,167 |
| Female | 111 (44.2%) | $39,750 |
| Total | 251 (100.0%) | $33,229 |
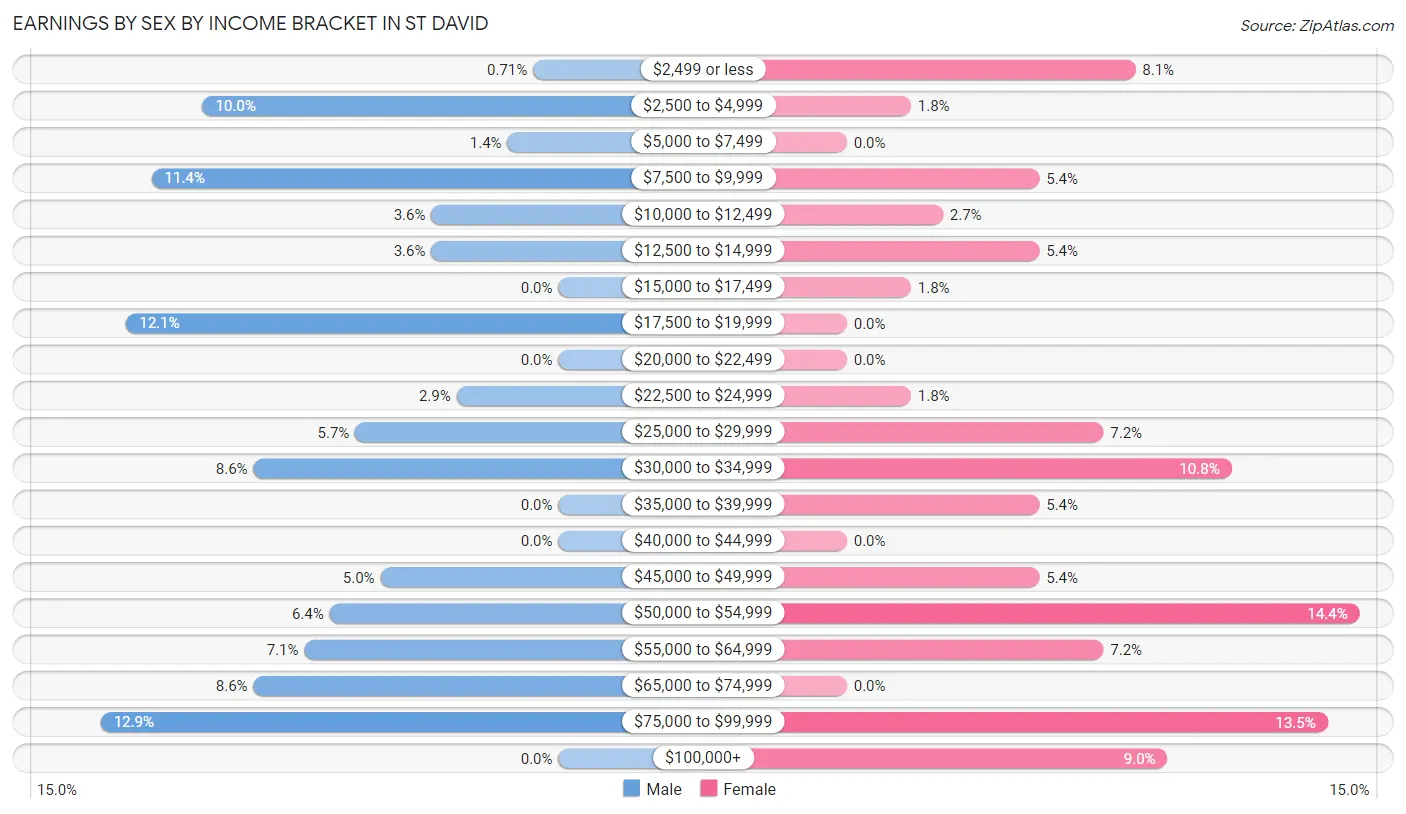
Earnings by Sex by Income Bracket in St David
The most common earnings brackets in St David are $75,000 to $99,999 for men (18 | 12.9%) and $50,000 to $54,999 for women (16 | 14.4%).
| Income | Male | Female |
| $2,499 or less | 1 (0.7%) | 9 (8.1%) |
| $2,500 to $4,999 | 14 (10.0%) | 2 (1.8%) |
| $5,000 to $7,499 | 2 (1.4%) | 0 (0.0%) |
| $7,500 to $9,999 | 16 (11.4%) | 6 (5.4%) |
| $10,000 to $12,499 | 5 (3.6%) | 3 (2.7%) |
| $12,500 to $14,999 | 5 (3.6%) | 6 (5.4%) |
| $15,000 to $17,499 | 0 (0.0%) | 2 (1.8%) |
| $17,500 to $19,999 | 17 (12.1%) | 0 (0.0%) |
| $20,000 to $22,499 | 0 (0.0%) | 0 (0.0%) |
| $22,500 to $24,999 | 4 (2.9%) | 2 (1.8%) |
| $25,000 to $29,999 | 8 (5.7%) | 8 (7.2%) |
| $30,000 to $34,999 | 12 (8.6%) | 12 (10.8%) |
| $35,000 to $39,999 | 0 (0.0%) | 6 (5.4%) |
| $40,000 to $44,999 | 0 (0.0%) | 0 (0.0%) |
| $45,000 to $49,999 | 7 (5.0%) | 6 (5.4%) |
| $50,000 to $54,999 | 9 (6.4%) | 16 (14.4%) |
| $55,000 to $64,999 | 10 (7.1%) | 8 (7.2%) |
| $65,000 to $74,999 | 12 (8.6%) | 0 (0.0%) |
| $75,000 to $99,999 | 18 (12.9%) | 15 (13.5%) |
| $100,000+ | 0 (0.0%) | 10 (9.0%) |
| Total | 140 (100.0%) | 111 (100.0%) |
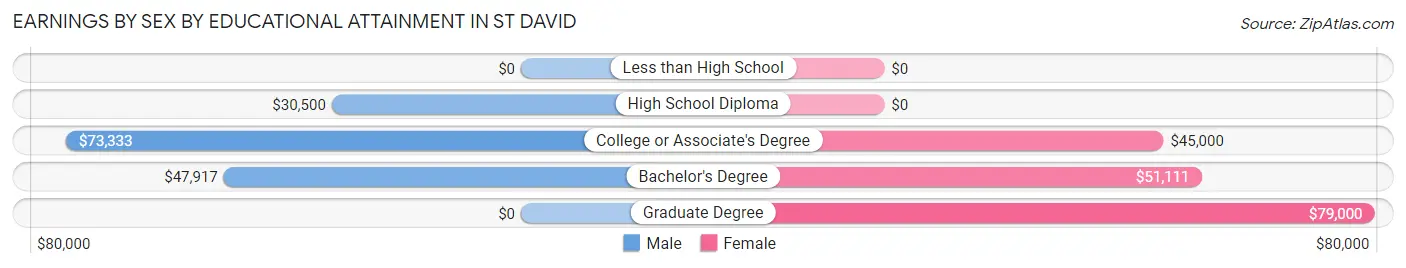
Earnings by Sex by Educational Attainment in St David
Average earnings in St David are $32,000 for men and $50,089 for women, a difference of 36.1%. Men with an educational attainment of college or associate's degree enjoy the highest average annual earnings of $73,333, while those with high school diploma education earn the least with $30,500. Women with an educational attainment of graduate degree earn the most with the average annual earnings of $79,000, while those with college or associate's degree education have the smallest earnings of $45,000.
| Educational Attainment | Male Income | Female Income |
| Less than High School | - | - |
| High School Diploma | $30,500 | $0 |
| College or Associate's Degree | $73,333 | $45,000 |
| Bachelor's Degree | $47,917 | $51,111 |
| Graduate Degree | - | - |
| Total | $32,000 | $50,089 |
Family Income in St David
Family Income Brackets in St David
According to the St David family income data, there are 43 families falling into the $50,000 to $74,999 income range, which is the most common income bracket and makes up 28.5% of all families. Conversely, the less than $10,000 income bracket is the least frequent group with only 1 families (0.7%) belonging to this category.
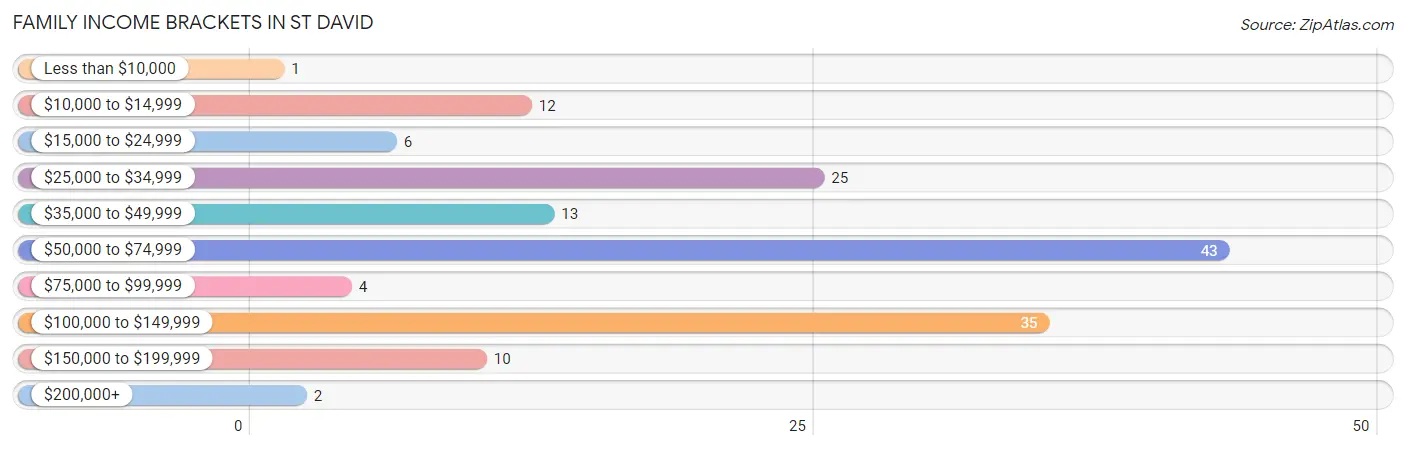
| Income Bracket | # Families | % Families |
| Less than $10,000 | 1 | 0.7% |
| $10,000 to $14,999 | 12 | 7.9% |
| $15,000 to $24,999 | 6 | 4.0% |
| $25,000 to $34,999 | 25 | 16.6% |
| $35,000 to $49,999 | 13 | 8.6% |
| $50,000 to $74,999 | 43 | 28.5% |
| $75,000 to $99,999 | 4 | 2.6% |
| $100,000 to $149,999 | 35 | 23.2% |
| $150,000 to $199,999 | 10 | 6.6% |
| $200,000+ | 2 | 1.3% |
Family Income by Famaliy Size in St David
4-person families (21 | 13.9%) account for the highest median family income in St David with $127,250 per family, while 2-person families (73 | 48.3%) have the highest median income of $32,292 per family member.
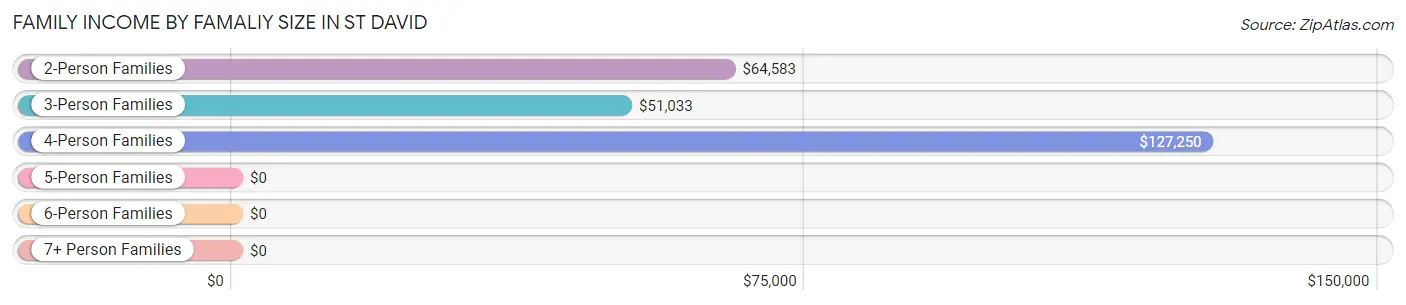
| Income Bracket | # Families | Median Income |
| 2-Person Families | 73 (48.3%) | $64,583 |
| 3-Person Families | 57 (37.8%) | $51,033 |
| 4-Person Families | 21 (13.9%) | $127,250 |
| 5-Person Families | 0 (0.0%) | $0 |
| 6-Person Families | 0 (0.0%) | $0 |
| 7+ Person Families | 0 (0.0%) | $0 |
| Total | 151 (100.0%) | $52,011 |
Family Income by Number of Earners in St David
The median family income in St David is $52,011, with families comprising 3+ earners (11) having the highest median family income of $127,250, while families with no earners (27) have the lowest median family income of $28,594, accounting for 7.3% and 17.9% of families, respectively.
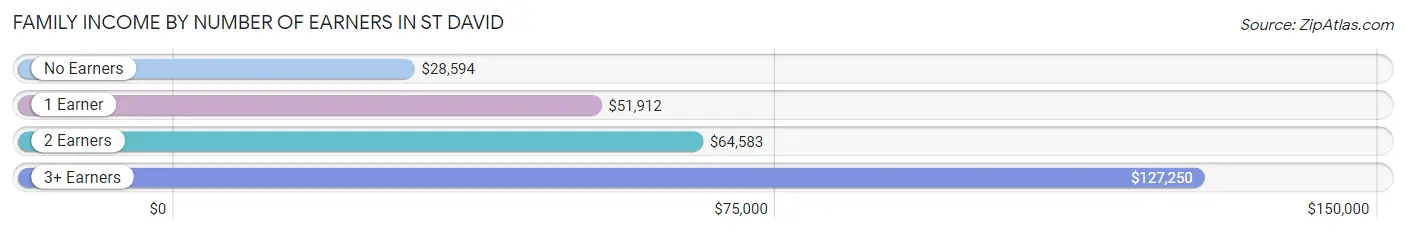
| Number of Earners | # Families | Median Income |
| No Earners | 27 (17.9%) | $28,594 |
| 1 Earner | 74 (49.0%) | $51,912 |
| 2 Earners | 39 (25.8%) | $64,583 |
| 3+ Earners | 11 (7.3%) | $127,250 |
| Total | 151 (100.0%) | $52,011 |
Household Income in St David
Household Income Brackets in St David
With 65 households falling in the category, the $50,000 to $74,999 income range is the most frequent in St David, accounting for 26.8% of all households. In contrast, only 2 households (0.8%) fall into the $200,000+ income bracket, making it the least populous group.
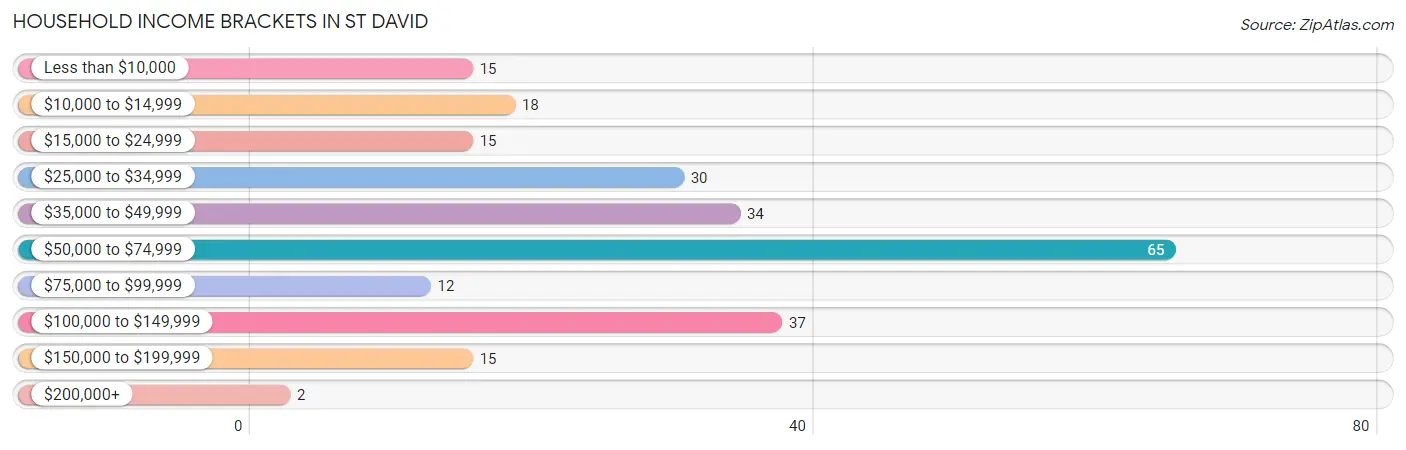
| Income Bracket | # Households | % Households |
| Less than $10,000 | 15 | 6.2% |
| $10,000 to $14,999 | 18 | 7.4% |
| $15,000 to $24,999 | 15 | 6.2% |
| $25,000 to $34,999 | 30 | 12.3% |
| $35,000 to $49,999 | 34 | 14.0% |
| $50,000 to $74,999 | 65 | 26.7% |
| $75,000 to $99,999 | 12 | 4.9% |
| $100,000 to $149,999 | 37 | 15.2% |
| $150,000 to $199,999 | 15 | 6.2% |
| $200,000+ | 2 | 0.8% |
Household Income by Householder Age in St David
The median household income in St David is $50,792, with the highest median household income of $53,750 found in the 45 to 64 years age bracket for the primary householder. A total of 66 households (27.2%) fall into this category. Meanwhile, the 15 to 24 years age bracket for the primary householder has the lowest median household income of $0, with 8 households (3.3%) in this group.
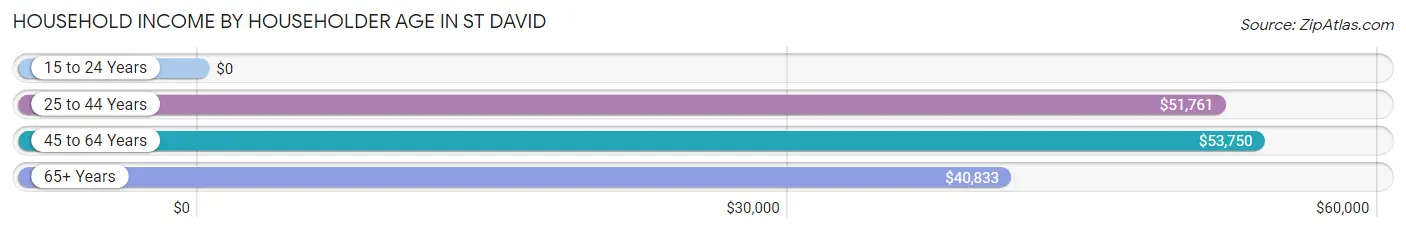
| Income Bracket | # Households | Median Income |
| 15 to 24 Years | 8 (3.3%) | $0 |
| 25 to 44 Years | 81 (33.3%) | $51,761 |
| 45 to 64 Years | 66 (27.2%) | $53,750 |
| 65+ Years | 88 (36.2%) | $40,833 |
| Total | 243 (100.0%) | $50,792 |
Poverty in St David
Income Below Poverty by Sex and Age in St David
With 9.2% poverty level for males and 13.3% for females among the residents of St David, 55 to 64 year old males and 12 to 14 year old females are the most vulnerable to poverty, with 10 males (33.3%) and 8 females (100.0%) in their respective age groups living below the poverty level.
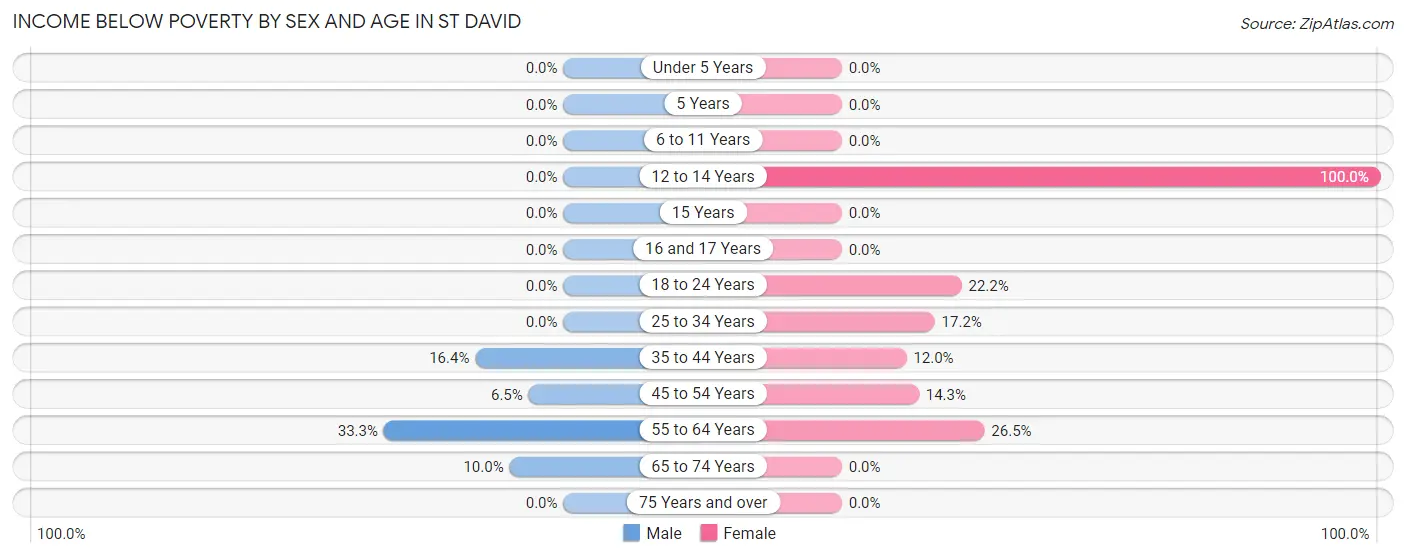
| Age Bracket | Male | Female |
| Under 5 Years | 0 (0.0%) | 0 (0.0%) |
| 5 Years | 0 (0.0%) | 0 (0.0%) |
| 6 to 11 Years | 0 (0.0%) | 0 (0.0%) |
| 12 to 14 Years | 0 (0.0%) | 8 (100.0%) |
| 15 Years | 0 (0.0%) | 0 (0.0%) |
| 16 and 17 Years | 0 (0.0%) | 0 (0.0%) |
| 18 to 24 Years | 0 (0.0%) | 4 (22.2%) |
| 25 to 34 Years | 0 (0.0%) | 5 (17.2%) |
| 35 to 44 Years | 9 (16.4%) | 6 (12.0%) |
| 45 to 54 Years | 2 (6.5%) | 2 (14.3%) |
| 55 to 64 Years | 10 (33.3%) | 9 (26.5%) |
| 65 to 74 Years | 5 (10.0%) | 0 (0.0%) |
| 75 Years and over | 0 (0.0%) | 0 (0.0%) |
| Total | 26 (9.2%) | 34 (13.3%) |
Income Above Poverty by Sex and Age in St David
According to the poverty statistics in St David, males aged under 5 years and females aged under 5 years are the age groups that are most secure financially, with 100.0% of males and 100.0% of females in these age groups living above the poverty line.
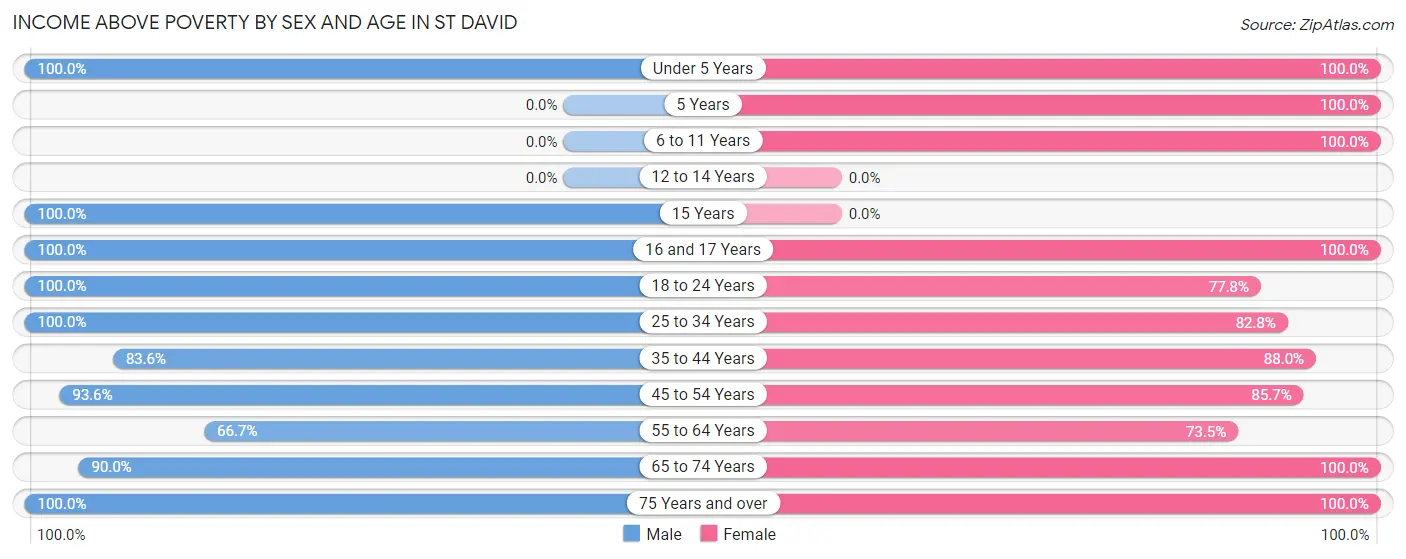
| Age Bracket | Male | Female |
| Under 5 Years | 23 (100.0%) | 18 (100.0%) |
| 5 Years | 0 (0.0%) | 2 (100.0%) |
| 6 to 11 Years | 0 (0.0%) | 18 (100.0%) |
| 12 to 14 Years | 0 (0.0%) | 0 (0.0%) |
| 15 Years | 7 (100.0%) | 0 (0.0%) |
| 16 and 17 Years | 8 (100.0%) | 5 (100.0%) |
| 18 to 24 Years | 30 (100.0%) | 14 (77.8%) |
| 25 to 34 Years | 26 (100.0%) | 24 (82.8%) |
| 35 to 44 Years | 46 (83.6%) | 44 (88.0%) |
| 45 to 54 Years | 29 (93.5%) | 12 (85.7%) |
| 55 to 64 Years | 20 (66.7%) | 25 (73.5%) |
| 65 to 74 Years | 45 (90.0%) | 51 (100.0%) |
| 75 Years and over | 21 (100.0%) | 9 (100.0%) |
| Total | 255 (90.7%) | 222 (86.7%) |
Income Below Poverty Among Married-Couple Families in St David
The poverty statistics for married-couple families in St David show that 6.1% or 7 of the total 115 families live below the poverty line. Families with no children have the highest poverty rate of 9.6%, comprising of 7 families. On the other hand, families with 1 or 2 children have the lowest poverty rate of 0.0%, which includes 0 families.
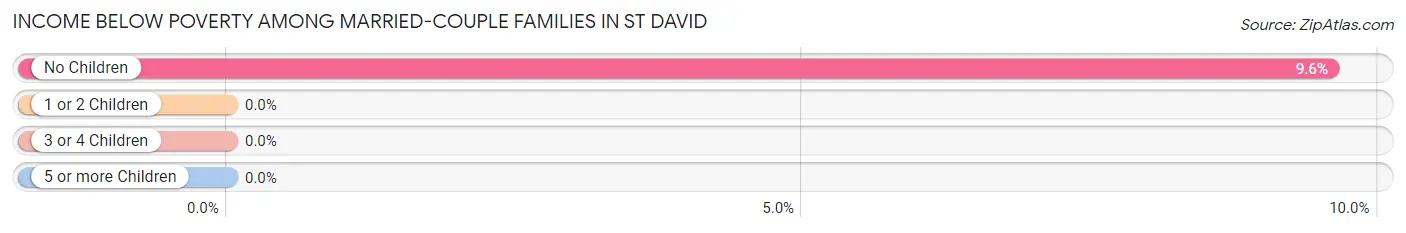
| Children | Above Poverty | Below Poverty |
| No Children | 66 (90.4%) | 7 (9.6%) |
| 1 or 2 Children | 42 (100.0%) | 0 (0.0%) |
| 3 or 4 Children | 0 (0.0%) | 0 (0.0%) |
| 5 or more Children | 0 (0.0%) | 0 (0.0%) |
| Total | 108 (93.9%) | 7 (6.1%) |
Income Below Poverty Among Single-Parent Households in St David
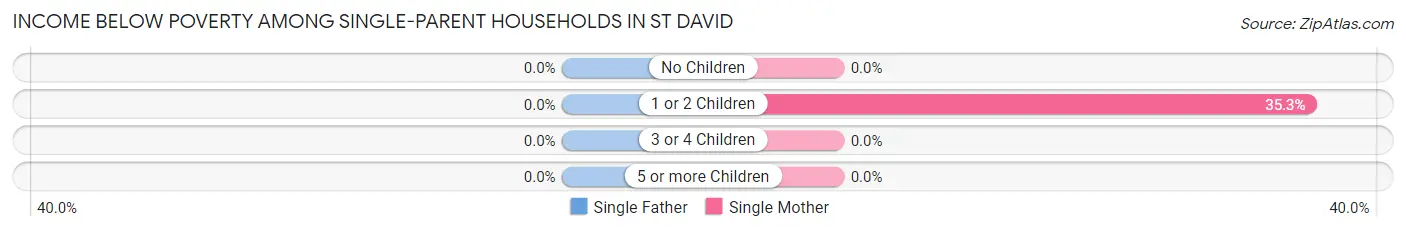
| Children | Single Father | Single Mother |
| No Children | 0 (0.0%) | 0 (0.0%) |
| 1 or 2 Children | 0 (0.0%) | 6 (35.3%) |
| 3 or 4 Children | 0 (0.0%) | 0 (0.0%) |
| 5 or more Children | 0 (0.0%) | 0 (0.0%) |
| Total | 0 (0.0%) | 6 (20.7%) |
Income Below Poverty Among Married-Couple vs Single-Parent Households in St David
The poverty data for St David shows that 7 of the married-couple family households (6.1%) and 6 of the single-parent households (16.7%) are living below the poverty level. Within the married-couple family households, those with no children have the highest poverty rate, with 7 households (9.6%) falling below the poverty line. Among the single-parent households, those with 1 or 2 children have the highest poverty rate, with 6 household (28.6%) living below poverty.
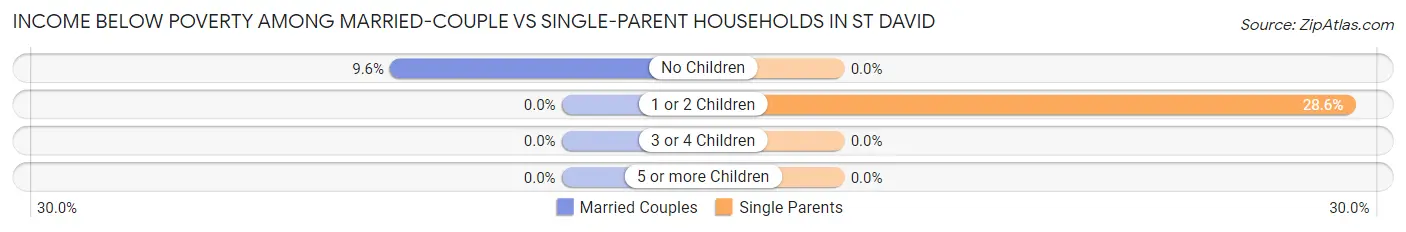
| Children | Married-Couple Families | Single-Parent Households |
| No Children | 7 (9.6%) | 0 (0.0%) |
| 1 or 2 Children | 0 (0.0%) | 6 (28.6%) |
| 3 or 4 Children | 0 (0.0%) | 0 (0.0%) |
| 5 or more Children | 0 (0.0%) | 0 (0.0%) |
| Total | 7 (6.1%) | 6 (16.7%) |
Race in St David
The most populous races in St David are White / Caucasian (537 | 99.4%), Hispanic or Latino (4 | 0.7%), and Two or more Races (3 | 0.6%).
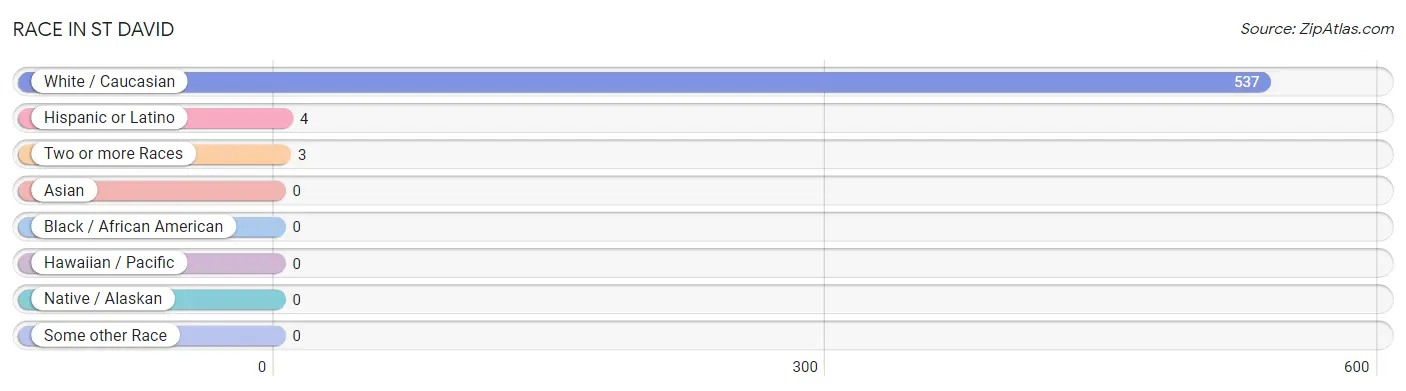
| Race | # Population | % Population |
| Asian | 0 | 0.0% |
| Black / African American | 0 | 0.0% |
| Hawaiian / Pacific | 0 | 0.0% |
| Hispanic or Latino | 4 | 0.7% |
| Native / Alaskan | 0 | 0.0% |
| White / Caucasian | 537 | 99.4% |
| Two or more Races | 3 | 0.6% |
| Some other Race | 0 | 0.0% |
| Total | 540 | 100.0% |
Ancestry in St David
The most populous ancestries reported in St David are German (121 | 22.4%), Irish (81 | 15.0%), English (62 | 11.5%), American (28 | 5.2%), and Croatian (18 | 3.3%), together accounting for 57.4% of all St David residents.
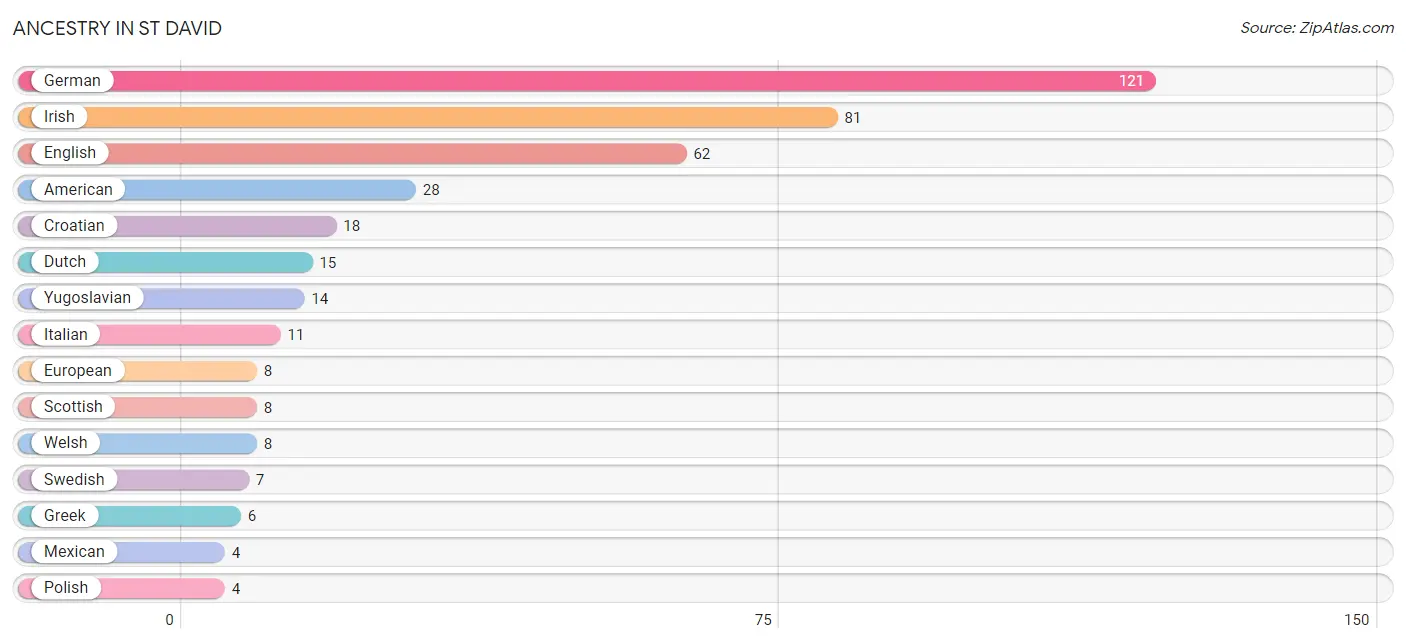
| Ancestry | # Population | % Population |
| American | 28 | 5.2% |
| Austrian | 2 | 0.4% |
| Croatian | 18 | 3.3% |
| Danish | 2 | 0.4% |
| Dutch | 15 | 2.8% |
| English | 62 | 11.5% |
| European | 8 | 1.5% |
| French | 1 | 0.2% |
| German | 121 | 22.4% |
| Greek | 6 | 1.1% |
| Irish | 81 | 15.0% |
| Italian | 11 | 2.0% |
| Mexican | 4 | 0.7% |
| Pennsylvania German | 2 | 0.4% |
| Polish | 4 | 0.7% |
| Scotch-Irish | 4 | 0.7% |
| Scottish | 8 | 1.5% |
| Swedish | 7 | 1.3% |
| Welsh | 8 | 1.5% |
| Yugoslavian | 14 | 2.6% | View All 20 Rows |
Immigrants in St David
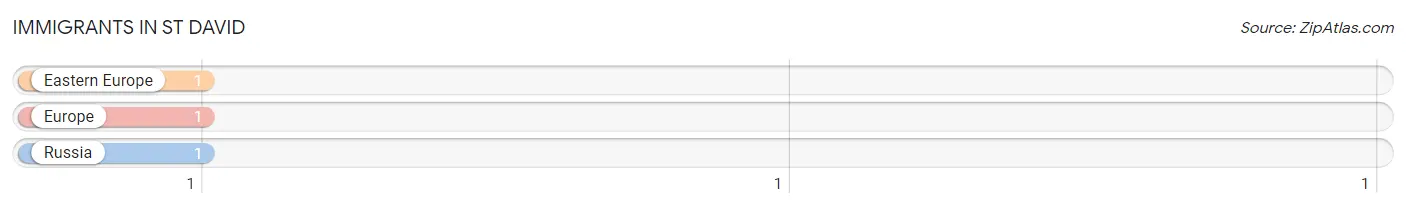
The most numerous immigrant groups reported in St David came from Eastern Europe (1 | 0.2%), Europe (1 | 0.2%), and Russia (1 | 0.2%), together accounting for 0.6% of all St David residents.
| Immigration Origin | # Population | % Population |
| Eastern Europe | 1 | 0.2% |
| Europe | 1 | 0.2% |
| Russia | 1 | 0.2% | View All 3 Rows |
Sex and Age in St David
Sex and Age in St David
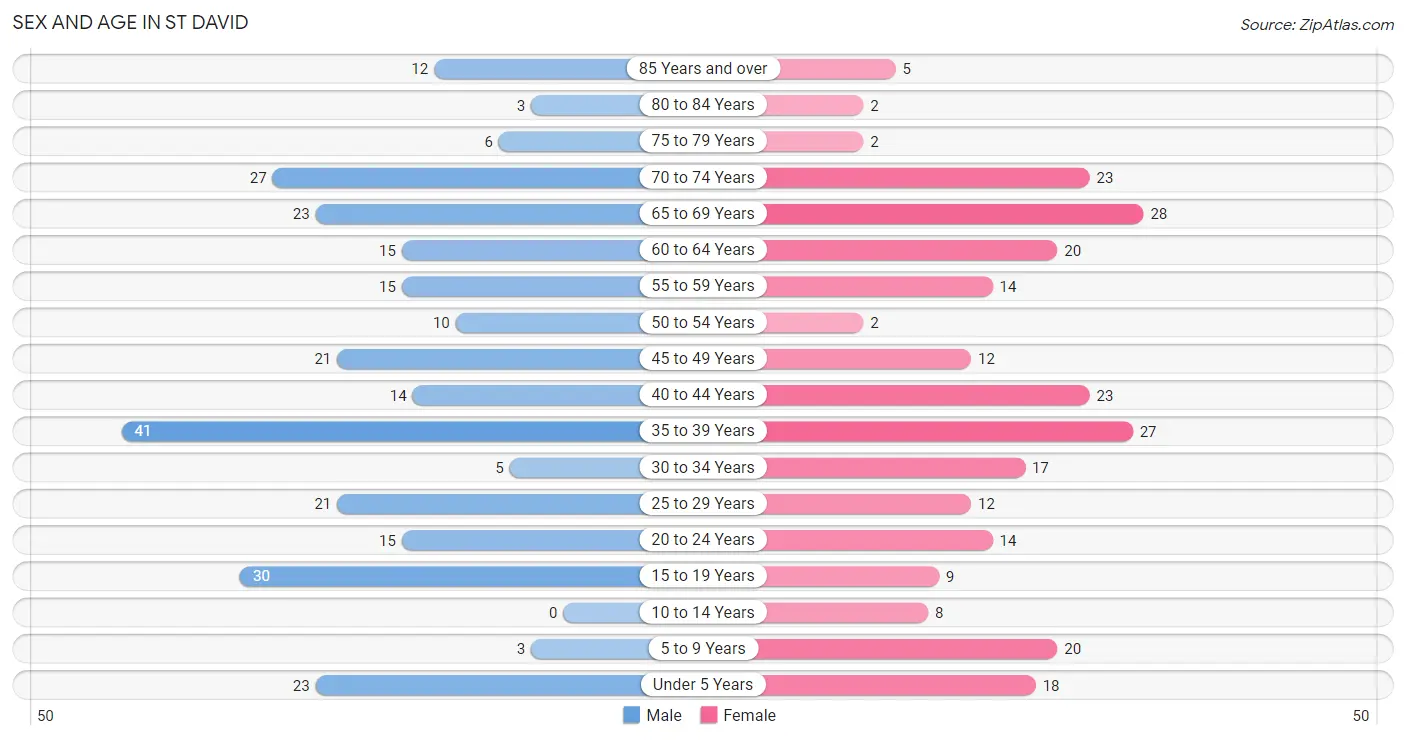
The most populous age groups in St David are 35 to 39 Years (41 | 14.4%) for men and 65 to 69 Years (28 | 10.9%) for women.
| Age Bracket | Male | Female |
| Under 5 Years | 23 (8.1%) | 18 (7.0%) |
| 5 to 9 Years | 3 (1.1%) | 20 (7.8%) |
| 10 to 14 Years | 0 (0.0%) | 8 (3.1%) |
| 15 to 19 Years | 30 (10.6%) | 9 (3.5%) |
| 20 to 24 Years | 15 (5.3%) | 14 (5.5%) |
| 25 to 29 Years | 21 (7.4%) | 12 (4.7%) |
| 30 to 34 Years | 5 (1.8%) | 17 (6.6%) |
| 35 to 39 Years | 41 (14.4%) | 27 (10.5%) |
| 40 to 44 Years | 14 (4.9%) | 23 (9.0%) |
| 45 to 49 Years | 21 (7.4%) | 12 (4.7%) |
| 50 to 54 Years | 10 (3.5%) | 2 (0.8%) |
| 55 to 59 Years | 15 (5.3%) | 14 (5.5%) |
| 60 to 64 Years | 15 (5.3%) | 20 (7.8%) |
| 65 to 69 Years | 23 (8.1%) | 28 (10.9%) |
| 70 to 74 Years | 27 (9.5%) | 23 (9.0%) |
| 75 to 79 Years | 6 (2.1%) | 2 (0.8%) |
| 80 to 84 Years | 3 (1.1%) | 2 (0.8%) |
| 85 Years and over | 12 (4.2%) | 5 (1.9%) |
| Total | 284 (100.0%) | 256 (100.0%) |
Families and Households in St David
Median Family Size in St David
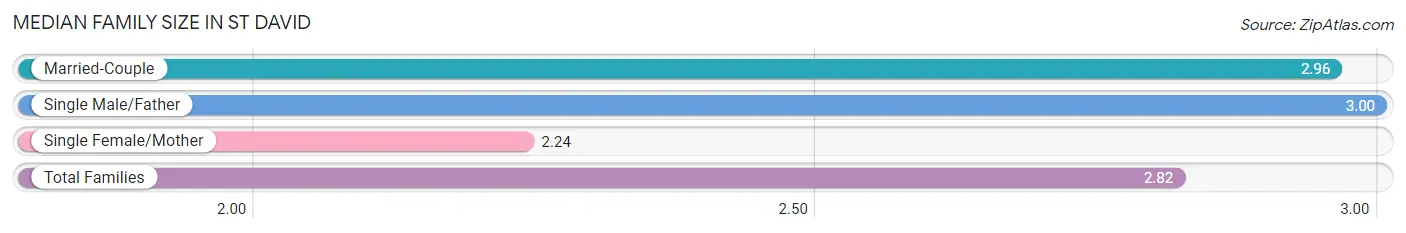
The median family size in St David is 2.82 persons per family, with single male/father families (7 | 4.6%) accounting for the largest median family size of 3 persons per family. On the other hand, single female/mother families (29 | 19.2%) represent the smallest median family size with 2.24 persons per family.
| Family Type | # Families | Family Size |
| Married-Couple | 115 (76.2%) | 2.96 |
| Single Male/Father | 7 (4.6%) | 3.00 |
| Single Female/Mother | 29 (19.2%) | 2.24 |
| Total Families | 151 (100.0%) | 2.82 |
Median Household Size in St David
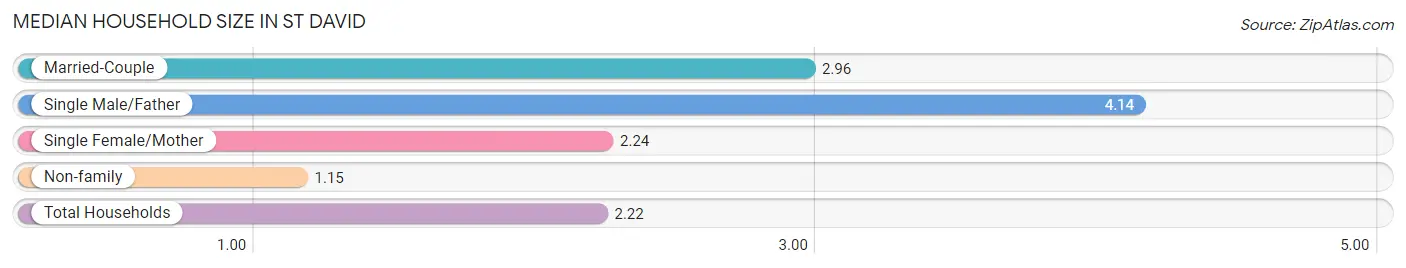
The median household size in St David is 2.22 persons per household, with single male/father households (7 | 2.9%) accounting for the largest median household size of 4.14 persons per household. non-family households (92 | 37.9%) represent the smallest median household size with 1.15 persons per household.
| Household Type | # Households | Household Size |
| Married-Couple | 115 (47.3%) | 2.96 |
| Single Male/Father | 7 (2.9%) | 4.14 |
| Single Female/Mother | 29 (11.9%) | 2.24 |
| Non-family | 92 (37.9%) | 1.15 |
| Total Households | 243 (100.0%) | 2.22 |
Household Size by Marriage Status in St David
Out of a total of 243 households in St David, 151 (62.1%) are family households, while 92 (37.9%) are nonfamily households. The most numerous type of family households are 2-person households, comprising 73, and the most common type of nonfamily households are 1-person households, comprising 79.
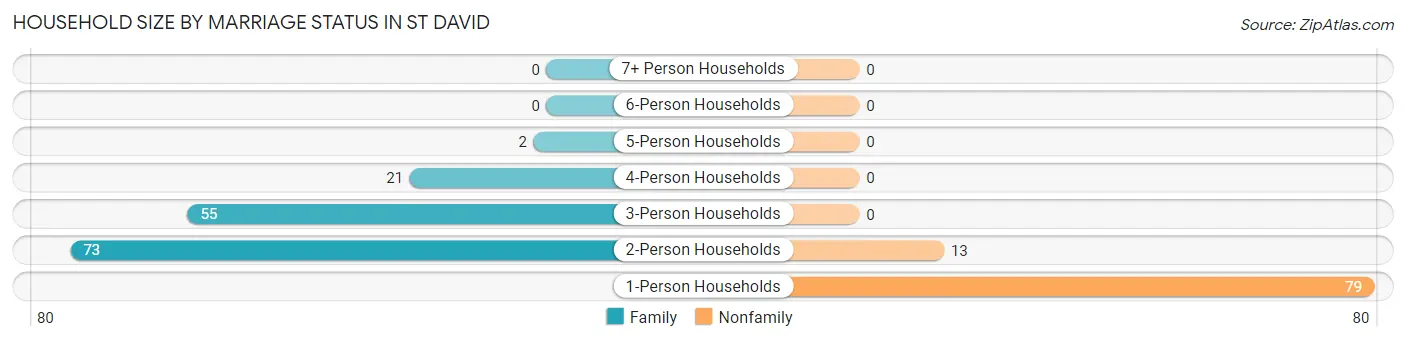
| Household Size | Family Households | Nonfamily Households |
| 1-Person Households | - | 79 (32.5%) |
| 2-Person Households | 73 (30.0%) | 13 (5.3%) |
| 3-Person Households | 55 (22.6%) | 0 (0.0%) |
| 4-Person Households | 21 (8.6%) | 0 (0.0%) |
| 5-Person Households | 2 (0.8%) | 0 (0.0%) |
| 6-Person Households | 0 (0.0%) | 0 (0.0%) |
| 7+ Person Households | 0 (0.0%) | 0 (0.0%) |
| Total | 151 (62.1%) | 92 (37.9%) |
Female Fertility in St David
Fertility by Age in St David
Average fertility rate in St David is 114.0 births per 1,000 women. Women in the age bracket of 20 to 34 years have the highest fertility rate with 302.0 births per 1,000 women. Women in the age bracket of 20 to 34 years acount for 100.0% of all women with births.
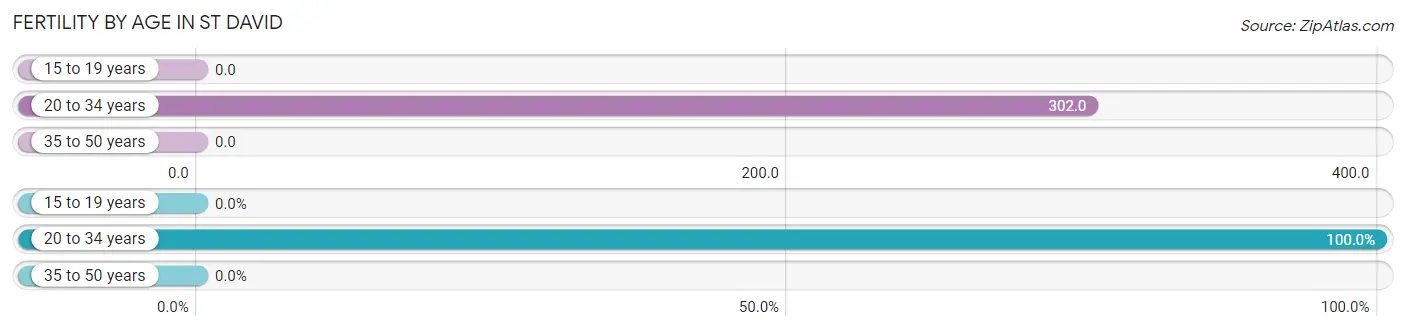
| Age Bracket | Women with Births | Births / 1,000 Women |
| 15 to 19 years | 0 (0.0%) | 0.0 |
| 20 to 34 years | 13 (100.0%) | 302.0 |
| 35 to 50 years | 0 (0.0%) | 0.0 |
| Total | 13 (100.0%) | 114.0 |
Fertility by Age by Marriage Status in St David
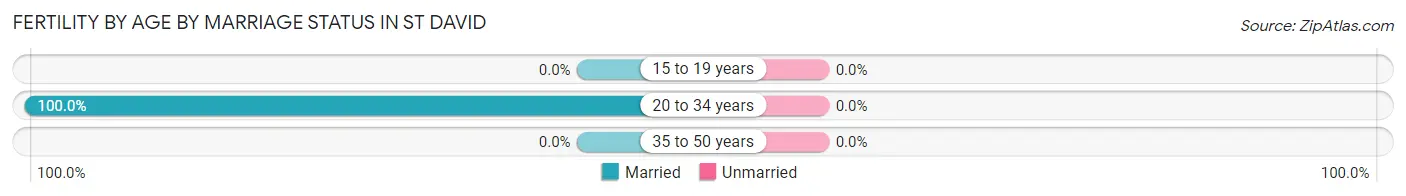
| Age Bracket | Married | Unmarried |
| 15 to 19 years | 0 (0.0%) | 0 (0.0%) |
| 20 to 34 years | 13 (100.0%) | 0 (0.0%) |
| 35 to 50 years | 0 (0.0%) | 0 (0.0%) |
| Total | 13 (100.0%) | 0 (0.0%) |
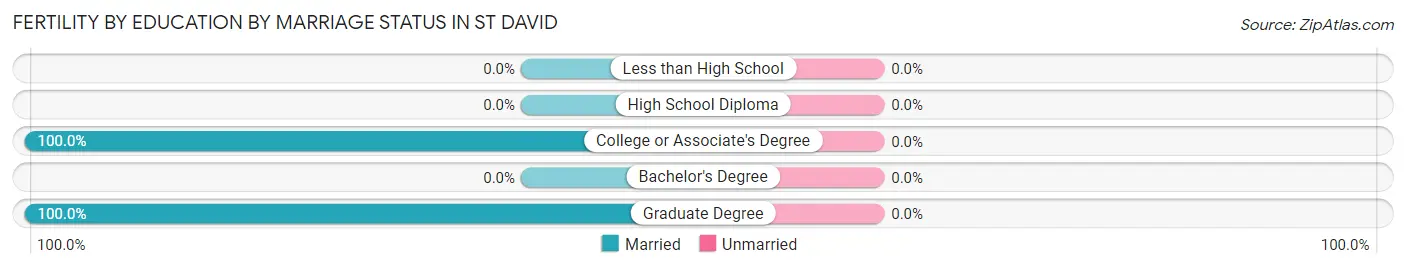
Fertility by Education in St David
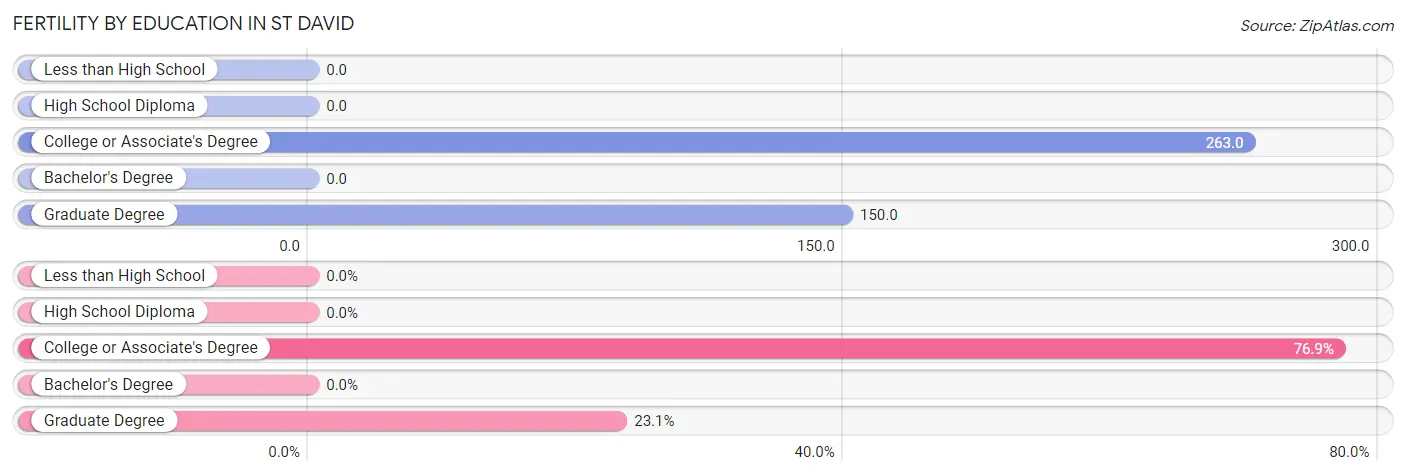
| Educational Attainment | Women with Births | Births / 1,000 Women |
| Less than High School | 0 (0.0%) | 0.0 |
| High School Diploma | 0 (0.0%) | 0.0 |
| College or Associate's Degree | 10 (76.9%) | 263.0 |
| Bachelor's Degree | 0 (0.0%) | 0.0 |
| Graduate Degree | 3 (23.1%) | 150.0 |
| Total | 13 (100.0%) | 114.0 |
Fertility by Education by Marriage Status in St David
| Educational Attainment | Married | Unmarried |
| Less than High School | 0 (0.0%) | 0 (0.0%) |
| High School Diploma | 0 (0.0%) | 0 (0.0%) |
| College or Associate's Degree | 10 (100.0%) | 0 (0.0%) |
| Bachelor's Degree | 0 (0.0%) | 0 (0.0%) |
| Graduate Degree | 3 (100.0%) | 0 (0.0%) |
| Total | 13 (100.0%) | 0 (0.0%) |
Employment Characteristics in St David
Employment by Class of Employer in St David
Among the 239 employed individuals in St David, private company employees (141 | 59.0%), not-for-profit organizations (38 | 15.9%), and local government employees (20 | 8.4%) make up the most common classes of employment.
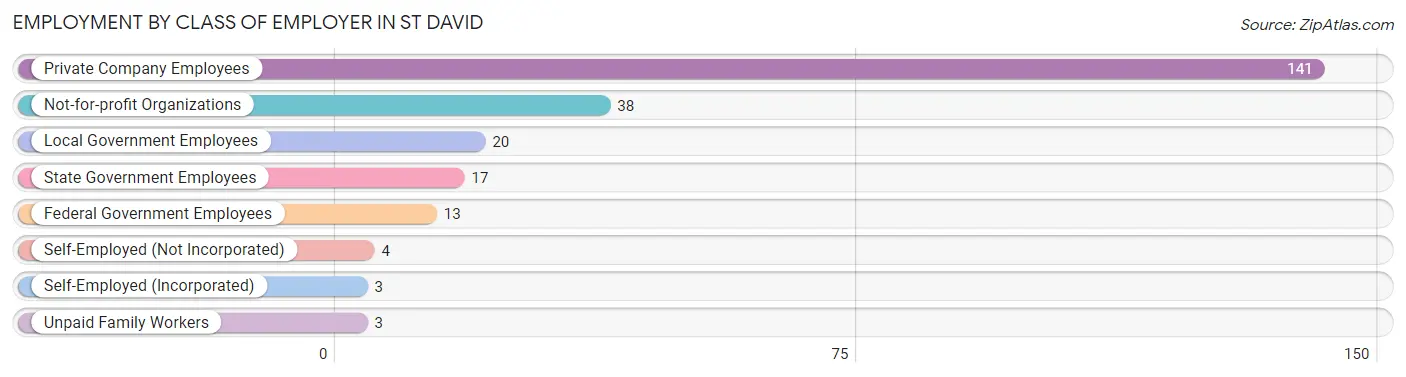
| Employer Class | # Employees | % Employees |
| Private Company Employees | 141 | 59.0% |
| Self-Employed (Incorporated) | 3 | 1.3% |
| Self-Employed (Not Incorporated) | 4 | 1.7% |
| Not-for-profit Organizations | 38 | 15.9% |
| Local Government Employees | 20 | 8.4% |
| State Government Employees | 17 | 7.1% |
| Federal Government Employees | 13 | 5.4% |
| Unpaid Family Workers | 3 | 1.3% |
| Total | 239 | 100.0% |
Employment Status by Age in St David
According to the labor force statistics for St David, out of the total population over 16 years of age (461), 52.3% or 241 individuals are in the labor force, with 0.8% or 2 of them unemployed. The age group with the highest labor force participation rate is 30 to 34 years, with 100.0% or 22 individuals in the labor force. Within the labor force, the 25 to 29 years age range has the highest percentage of unemployed individuals, with 7.1% or 2 of them being unemployed.
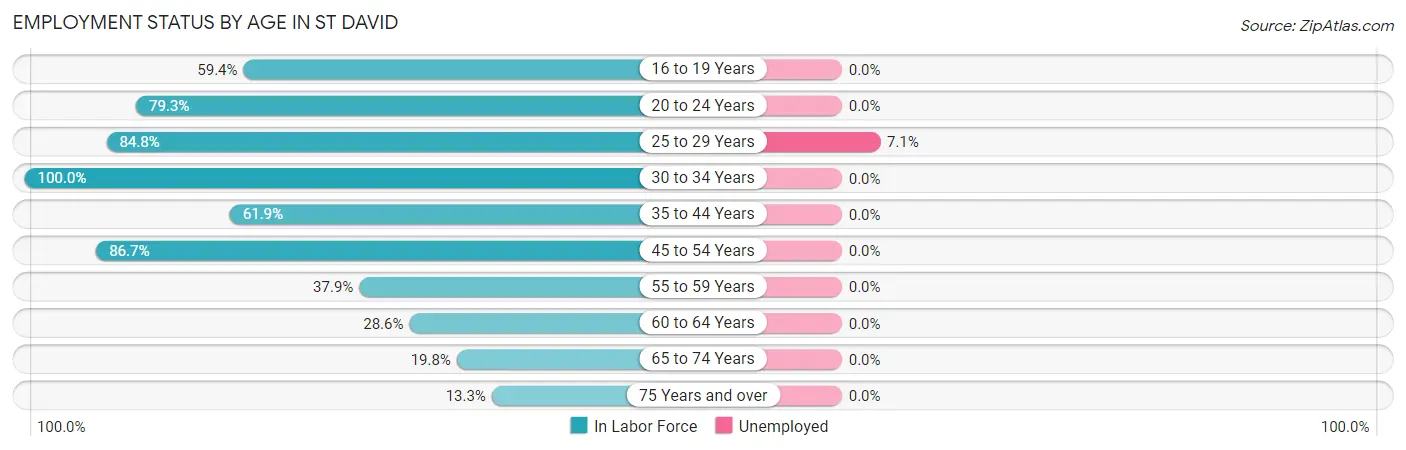
| Age Bracket | In Labor Force | Unemployed |
| 16 to 19 Years | 19 (59.4%) | 0 (0.0%) |
| 20 to 24 Years | 23 (79.3%) | 0 (0.0%) |
| 25 to 29 Years | 28 (84.8%) | 2 (7.1%) |
| 30 to 34 Years | 22 (100.0%) | 0 (0.0%) |
| 35 to 44 Years | 65 (61.9%) | 0 (0.0%) |
| 45 to 54 Years | 39 (86.7%) | 0 (0.0%) |
| 55 to 59 Years | 11 (37.9%) | 0 (0.0%) |
| 60 to 64 Years | 10 (28.6%) | 0 (0.0%) |
| 65 to 74 Years | 20 (19.8%) | 0 (0.0%) |
| 75 Years and over | 4 (13.3%) | 0 (0.0%) |
| Total | 241 (52.3%) | 2 (0.8%) |
Employment Status by Educational Attainment in St David
According to labor force statistics for St David, 65.1% of individuals (175) out of the total population between 25 and 64 years of age (269) are in the labor force, with 1.1% or 2 of them being unemployed. The group with the highest labor force participation rate are those with the educational attainment of high school diploma, with 67.7% or 65 individuals in the labor force. Within the labor force, individuals with high school diploma education have the highest percentage of unemployment, with 3.1% or 2 of them being unemployed.
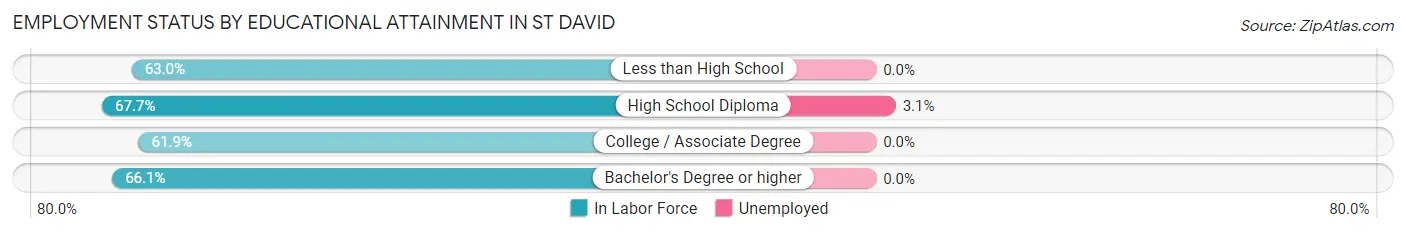
| Educational Attainment | In Labor Force | Unemployed |
| Less than High School | 17 (63.0%) | 0 (0.0%) |
| High School Diploma | 65 (67.7%) | 3 (3.1%) |
| College / Associate Degree | 52 (61.9%) | 0 (0.0%) |
| Bachelor's Degree or higher | 41 (66.1%) | 0 (0.0%) |
| Total | 175 (65.1%) | 3 (1.1%) |
Employment Occupations by Sex in St David
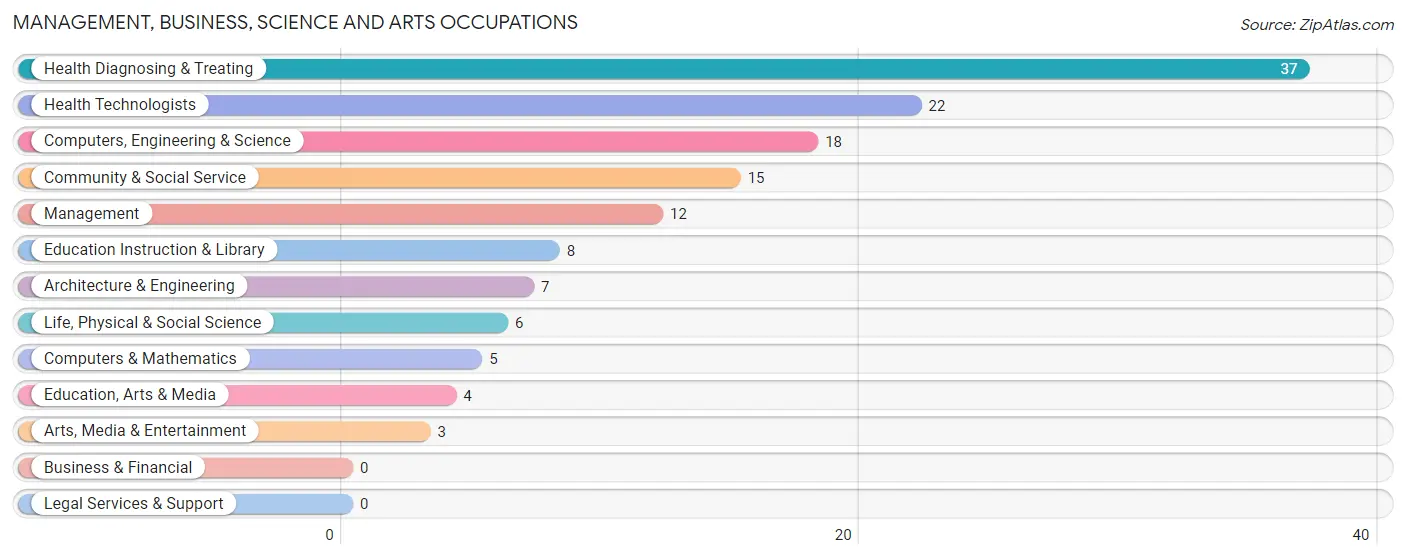
Management, Business, Science and Arts Occupations
The most common Management, Business, Science and Arts occupations in St David are Health Diagnosing & Treating (37 | 15.5%), Health Technologists (22 | 9.2%), Computers, Engineering & Science (18 | 7.5%), Community & Social Service (15 | 6.3%), and Management (12 | 5.0%).
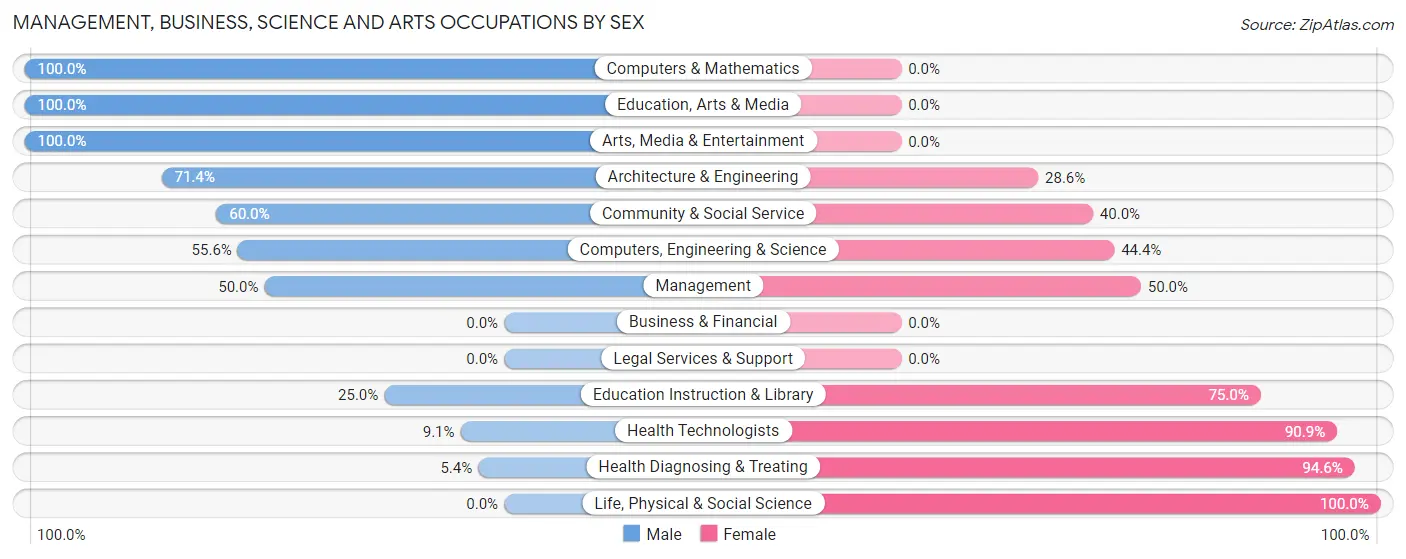
Management, Business, Science and Arts Occupations by Sex
Within the Management, Business, Science and Arts occupations in St David, the most male-oriented occupations are Computers & Mathematics (100.0%), Education, Arts & Media (100.0%), and Arts, Media & Entertainment (100.0%), while the most female-oriented occupations are Life, Physical & Social Science (100.0%), Health Diagnosing & Treating (94.6%), and Health Technologists (90.9%).
| Occupation | Male | Female |
| Management | 6 (50.0%) | 6 (50.0%) |
| Business & Financial | 0 (0.0%) | 0 (0.0%) |
| Computers, Engineering & Science | 10 (55.6%) | 8 (44.4%) |
| Computers & Mathematics | 5 (100.0%) | 0 (0.0%) |
| Architecture & Engineering | 5 (71.4%) | 2 (28.6%) |
| Life, Physical & Social Science | 0 (0.0%) | 6 (100.0%) |
| Community & Social Service | 9 (60.0%) | 6 (40.0%) |
| Education, Arts & Media | 4 (100.0%) | 0 (0.0%) |
| Legal Services & Support | 0 (0.0%) | 0 (0.0%) |
| Education Instruction & Library | 2 (25.0%) | 6 (75.0%) |
| Arts, Media & Entertainment | 3 (100.0%) | 0 (0.0%) |
| Health Diagnosing & Treating | 2 (5.4%) | 35 (94.6%) |
| Health Technologists | 2 (9.1%) | 20 (90.9%) |
| Total (Category) | 27 (32.9%) | 55 (67.1%) |
| Total (Overall) | 134 (56.1%) | 105 (43.9%) |
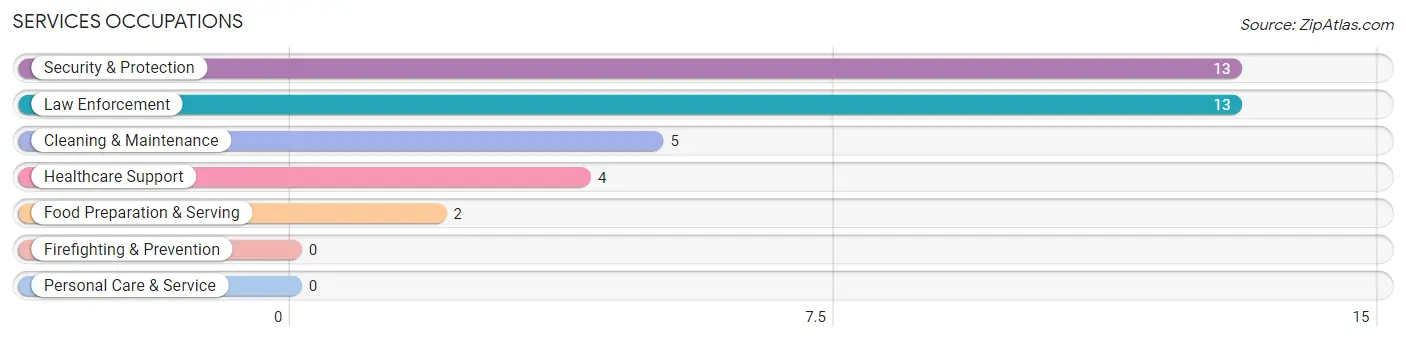
Services Occupations
The most common Services occupations in St David are Security & Protection (13 | 5.4%), Law Enforcement (13 | 5.4%), Cleaning & Maintenance (5 | 2.1%), Healthcare Support (4 | 1.7%), and Food Preparation & Serving (2 | 0.8%).
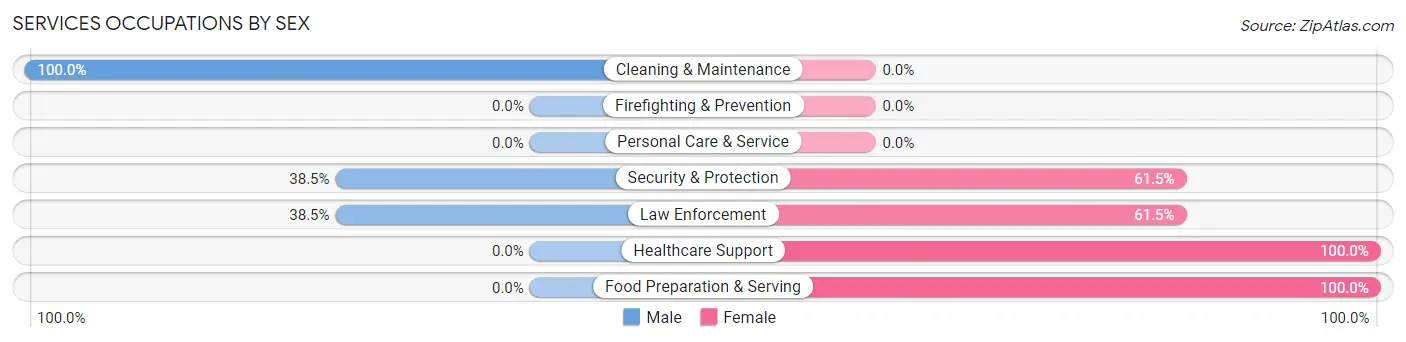
Services Occupations by Sex
Within the Services occupations in St David, the most male-oriented occupations are Cleaning & Maintenance (100.0%), Security & Protection (38.5%), and Law Enforcement (38.5%), while the most female-oriented occupations are Healthcare Support (100.0%), Food Preparation & Serving (100.0%), and Security & Protection (61.5%).
| Occupation | Male | Female |
| Healthcare Support | 0 (0.0%) | 4 (100.0%) |
| Security & Protection | 5 (38.5%) | 8 (61.5%) |
| Firefighting & Prevention | 0 (0.0%) | 0 (0.0%) |
| Law Enforcement | 5 (38.5%) | 8 (61.5%) |
| Food Preparation & Serving | 0 (0.0%) | 2 (100.0%) |
| Cleaning & Maintenance | 5 (100.0%) | 0 (0.0%) |
| Personal Care & Service | 0 (0.0%) | 0 (0.0%) |
| Total (Category) | 10 (41.7%) | 14 (58.3%) |
| Total (Overall) | 134 (56.1%) | 105 (43.9%) |
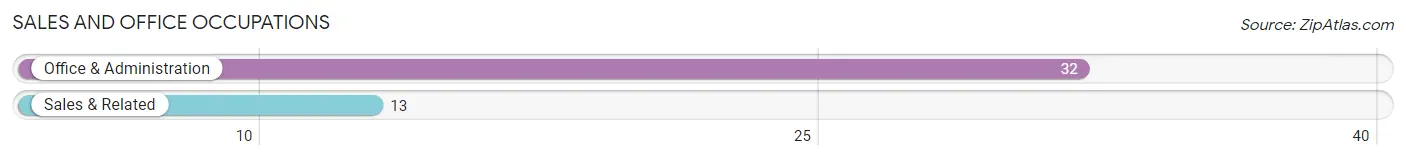
Sales and Office Occupations
The most common Sales and Office occupations in St David are Office & Administration (32 | 13.4%), and Sales & Related (13 | 5.4%).
Sales and Office Occupations by Sex
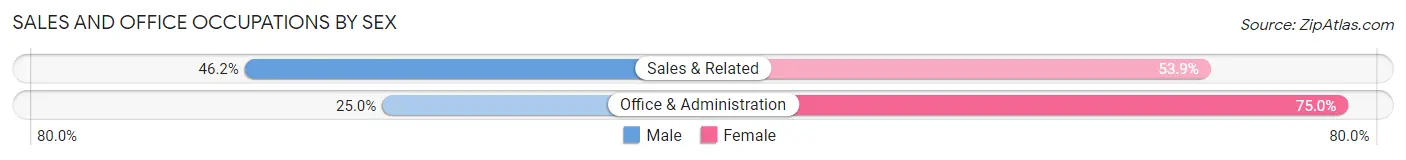
| Occupation | Male | Female |
| Sales & Related | 6 (46.2%) | 7 (53.8%) |
| Office & Administration | 8 (25.0%) | 24 (75.0%) |
| Total (Category) | 14 (31.1%) | 31 (68.9%) |
| Total (Overall) | 134 (56.1%) | 105 (43.9%) |
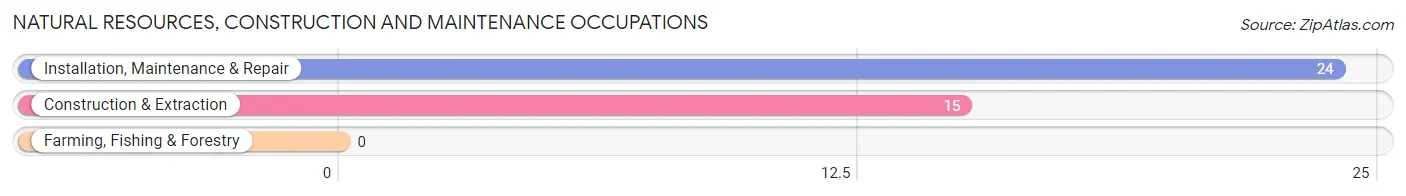
Natural Resources, Construction and Maintenance Occupations
The most common Natural Resources, Construction and Maintenance occupations in St David are Installation, Maintenance & Repair (24 | 10.0%), and Construction & Extraction (15 | 6.3%).
Natural Resources, Construction and Maintenance Occupations by Sex
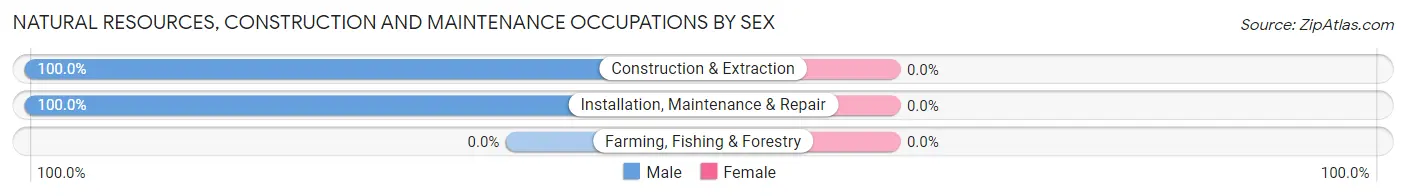
| Occupation | Male | Female |
| Farming, Fishing & Forestry | 0 (0.0%) | 0 (0.0%) |
| Construction & Extraction | 15 (100.0%) | 0 (0.0%) |
| Installation, Maintenance & Repair | 24 (100.0%) | 0 (0.0%) |
| Total (Category) | 39 (100.0%) | 0 (0.0%) |
| Total (Overall) | 134 (56.1%) | 105 (43.9%) |
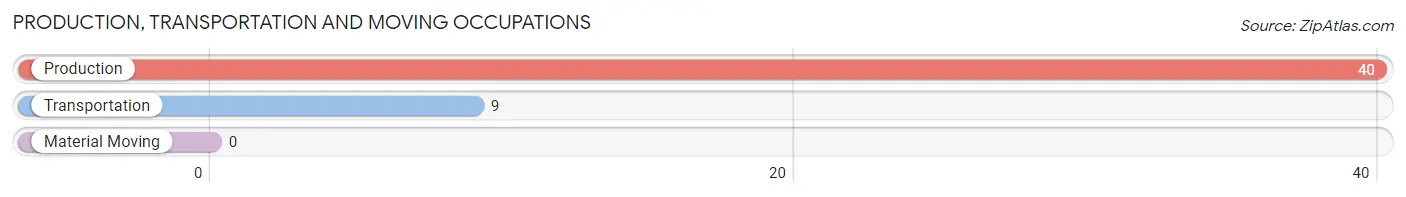
Production, Transportation and Moving Occupations
The most common Production, Transportation and Moving occupations in St David are Production (40 | 16.7%), and Transportation (9 | 3.8%).
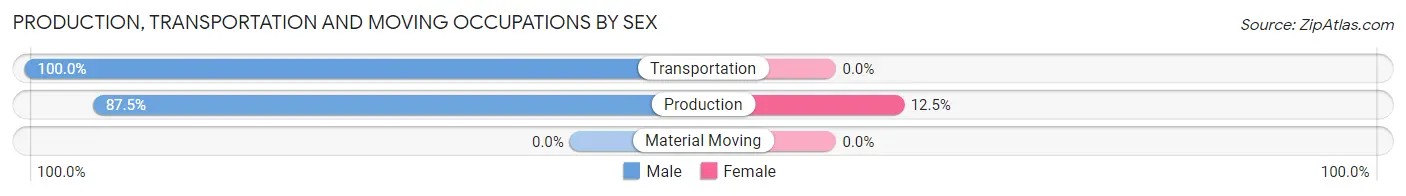
Production, Transportation and Moving Occupations by Sex
| Occupation | Male | Female |
| Production | 35 (87.5%) | 5 (12.5%) |
| Transportation | 9 (100.0%) | 0 (0.0%) |
| Material Moving | 0 (0.0%) | 0 (0.0%) |
| Total (Category) | 44 (89.8%) | 5 (10.2%) |
| Total (Overall) | 134 (56.1%) | 105 (43.9%) |
Employment Industries by Sex in St David
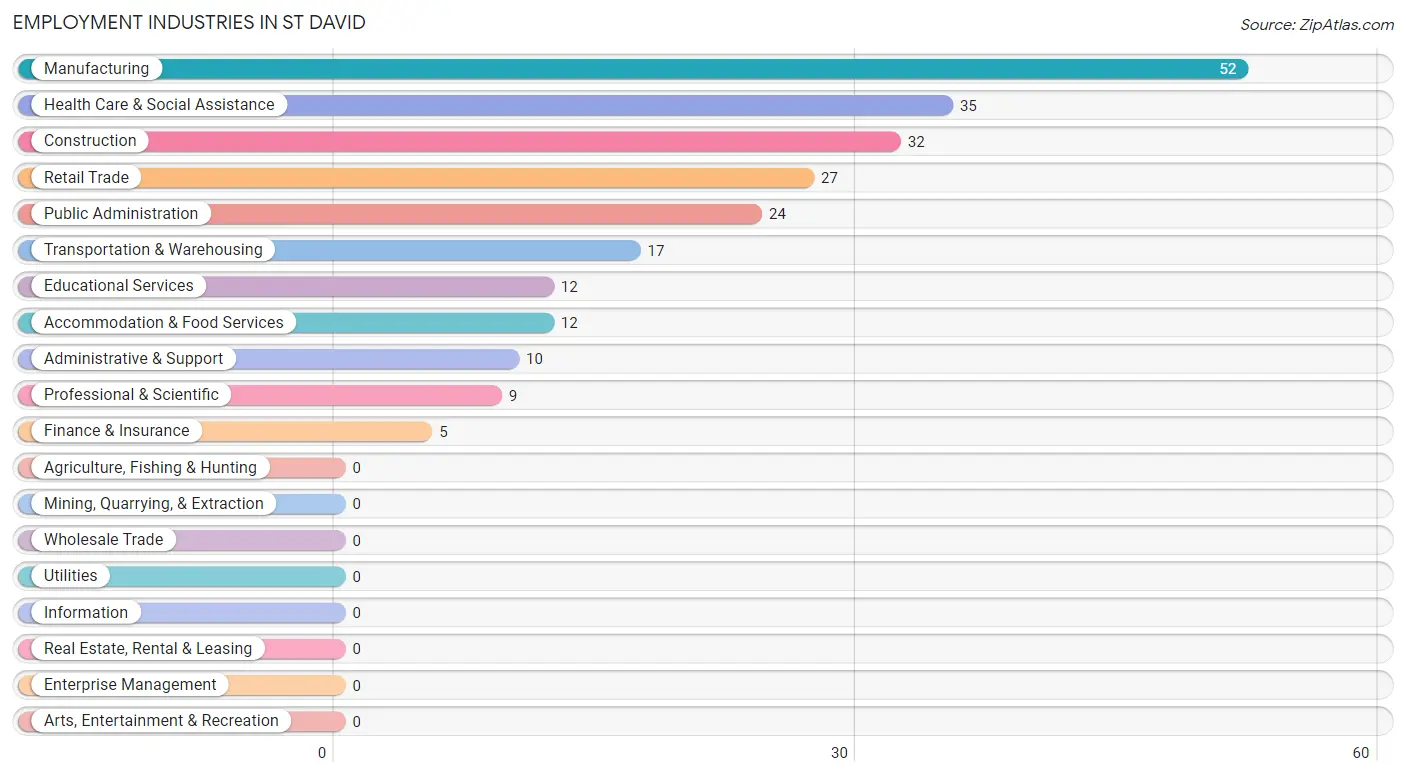
Employment Industries in St David
The major employment industries in St David include Manufacturing (52 | 21.8%), Health Care & Social Assistance (35 | 14.6%), Construction (32 | 13.4%), Retail Trade (27 | 11.3%), and Public Administration (24 | 10.0%).
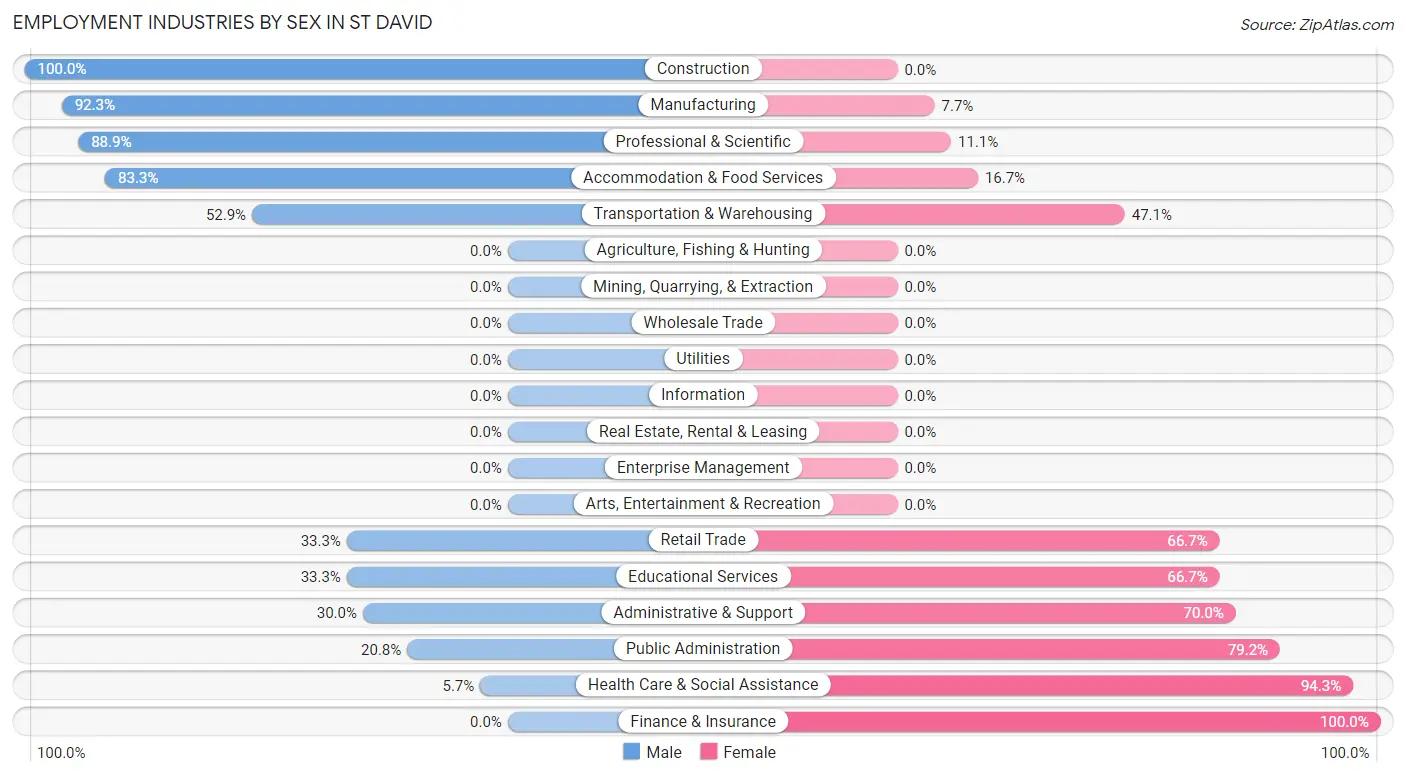
Employment Industries by Sex in St David
The St David industries that see more men than women are Construction (100.0%), Manufacturing (92.3%), and Professional & Scientific (88.9%), whereas the industries that tend to have a higher number of women are Finance & Insurance (100.0%), Health Care & Social Assistance (94.3%), and Public Administration (79.2%).
| Industry | Male | Female |
| Agriculture, Fishing & Hunting | 0 (0.0%) | 0 (0.0%) |
| Mining, Quarrying, & Extraction | 0 (0.0%) | 0 (0.0%) |
| Construction | 32 (100.0%) | 0 (0.0%) |
| Manufacturing | 48 (92.3%) | 4 (7.7%) |
| Wholesale Trade | 0 (0.0%) | 0 (0.0%) |
| Retail Trade | 9 (33.3%) | 18 (66.7%) |
| Transportation & Warehousing | 9 (52.9%) | 8 (47.1%) |
| Utilities | 0 (0.0%) | 0 (0.0%) |
| Information | 0 (0.0%) | 0 (0.0%) |
| Finance & Insurance | 0 (0.0%) | 5 (100.0%) |
| Real Estate, Rental & Leasing | 0 (0.0%) | 0 (0.0%) |
| Professional & Scientific | 8 (88.9%) | 1 (11.1%) |
| Enterprise Management | 0 (0.0%) | 0 (0.0%) |
| Administrative & Support | 3 (30.0%) | 7 (70.0%) |
| Educational Services | 4 (33.3%) | 8 (66.7%) |
| Health Care & Social Assistance | 2 (5.7%) | 33 (94.3%) |
| Arts, Entertainment & Recreation | 0 (0.0%) | 0 (0.0%) |
| Accommodation & Food Services | 10 (83.3%) | 2 (16.7%) |
| Public Administration | 5 (20.8%) | 19 (79.2%) |
| Total | 134 (56.1%) | 105 (43.9%) |
Education in St David
School Enrollment in St David
The most common levels of schooling among the 75 students in St David are high school (20 | 26.7%), college / undergraduate (16 | 21.3%), and kindergarten (14 | 18.7%).
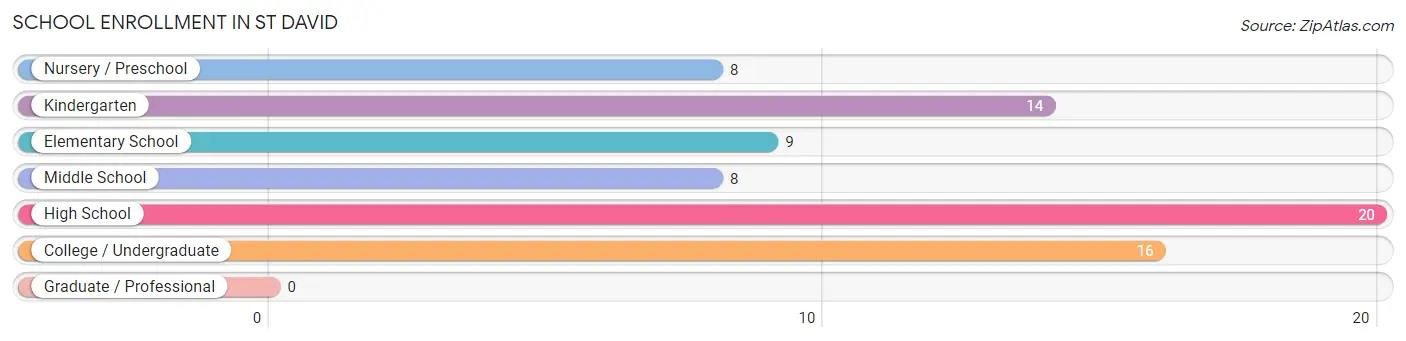
| School Level | # Students | % Students |
| Nursery / Preschool | 8 | 10.7% |
| Kindergarten | 14 | 18.7% |
| Elementary School | 9 | 12.0% |
| Middle School | 8 | 10.7% |
| High School | 20 | 26.7% |
| College / Undergraduate | 16 | 21.3% |
| Graduate / Professional | 0 | 0.0% |
| Total | 75 | 100.0% |
School Enrollment by Age by Funding Source in St David
Out of a total of 75 students who are enrolled in schools in St David, 3 (4.0%) attend a private institution, while the remaining 72 (96.0%) are enrolled in public schools. The age group of 3 to 4 year olds has the highest likelihood of being enrolled in private schools, with 3 (37.5% in the age bracket) enrolled. Conversely, the age group of 5 to 9 year old has the lowest likelihood of being enrolled in a private school, with 23 (100.0% in the age bracket) attending a public institution.
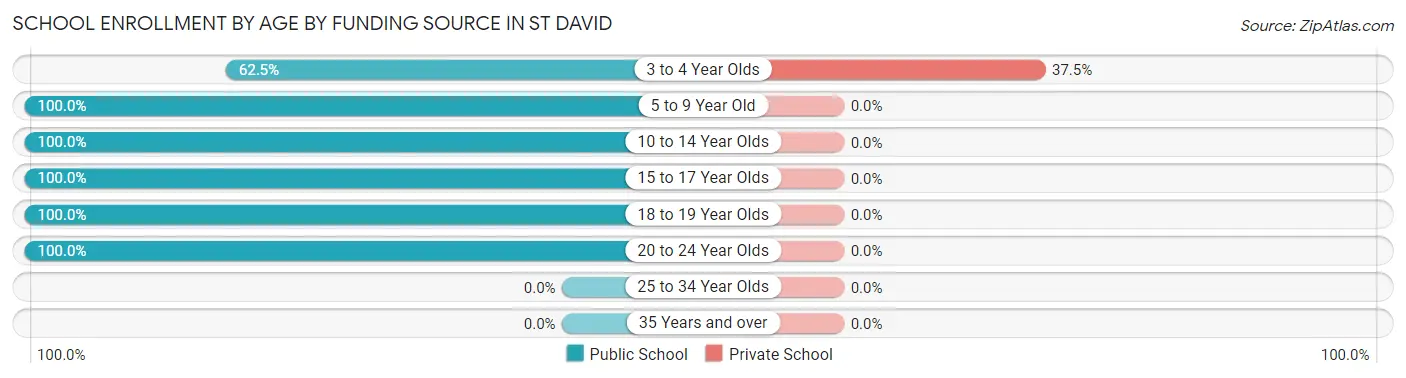
| Age Bracket | Public School | Private School |
| 3 to 4 Year Olds | 5 (62.5%) | 3 (37.5%) |
| 5 to 9 Year Old | 23 (100.0%) | 0 (0.0%) |
| 10 to 14 Year Olds | 8 (100.0%) | 0 (0.0%) |
| 15 to 17 Year Olds | 20 (100.0%) | 0 (0.0%) |
| 18 to 19 Year Olds | 4 (100.0%) | 0 (0.0%) |
| 20 to 24 Year Olds | 12 (100.0%) | 0 (0.0%) |
| 25 to 34 Year Olds | 0 (0.0%) | 0 (0.0%) |
| 35 Years and over | 0 (0.0%) | 0 (0.0%) |
| Total | 72 (96.0%) | 3 (4.0%) |
Educational Attainment by Field of Study in St David
Arts & humanities (24 | 34.3%), science & technology (20 | 28.6%), education (11 | 15.7%), liberal arts & history (5 | 7.1%), and bio, nature & agricultural (3 | 4.3%) are the most common fields of study among 70 individuals in St David who have obtained a bachelor's degree or higher.
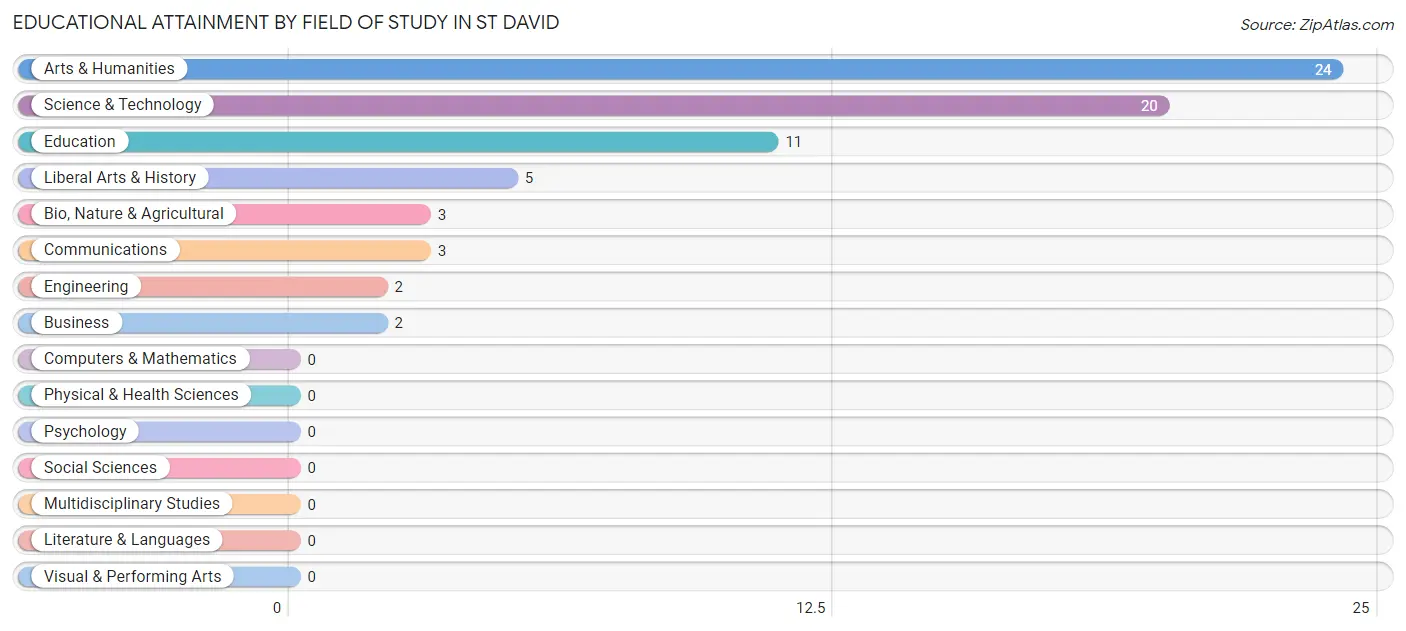
| Field of Study | # Graduates | % Graduates |
| Computers & Mathematics | 0 | 0.0% |
| Bio, Nature & Agricultural | 3 | 4.3% |
| Physical & Health Sciences | 0 | 0.0% |
| Psychology | 0 | 0.0% |
| Social Sciences | 0 | 0.0% |
| Engineering | 2 | 2.9% |
| Multidisciplinary Studies | 0 | 0.0% |
| Science & Technology | 20 | 28.6% |
| Business | 2 | 2.9% |
| Education | 11 | 15.7% |
| Literature & Languages | 0 | 0.0% |
| Liberal Arts & History | 5 | 7.1% |
| Visual & Performing Arts | 0 | 0.0% |
| Communications | 3 | 4.3% |
| Arts & Humanities | 24 | 34.3% |
| Total | 70 | 100.0% |
Transportation & Commute in St David
Vehicle Availability by Sex in St David
The most prevalent vehicle ownership categories in St David are males with 2 vehicles (75, accounting for 56.0%) and females with 2 vehicles (57, making up 71.4%).
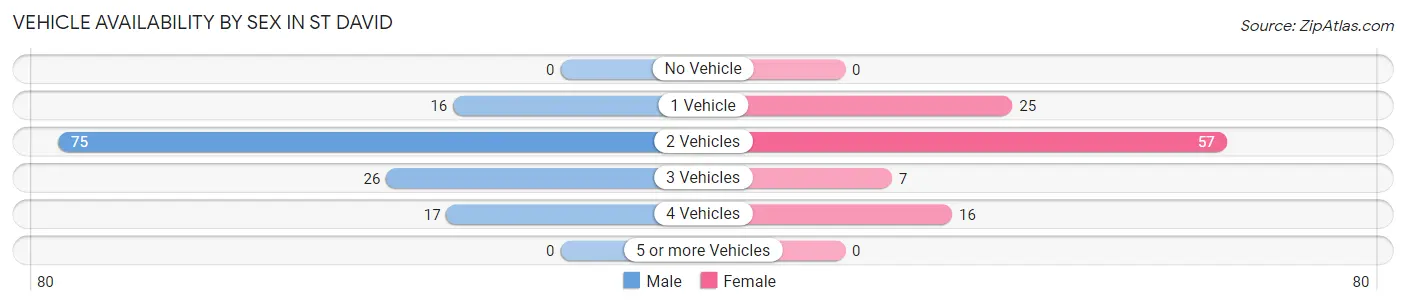
| Vehicles Available | Male | Female |
| No Vehicle | 0 (0.0%) | 0 (0.0%) |
| 1 Vehicle | 16 (11.9%) | 25 (23.8%) |
| 2 Vehicles | 75 (56.0%) | 57 (54.3%) |
| 3 Vehicles | 26 (19.4%) | 7 (6.7%) |
| 4 Vehicles | 17 (12.7%) | 16 (15.2%) |
| 5 or more Vehicles | 0 (0.0%) | 0 (0.0%) |
| Total | 134 (100.0%) | 105 (100.0%) |
Commute Time in St David
The most frequently occuring commute durations in St David are 45 to 59 minutes (55 commuters, 25.4%), 10 to 14 minutes (47 commuters, 21.7%), and 15 to 19 minutes (33 commuters, 15.2%).
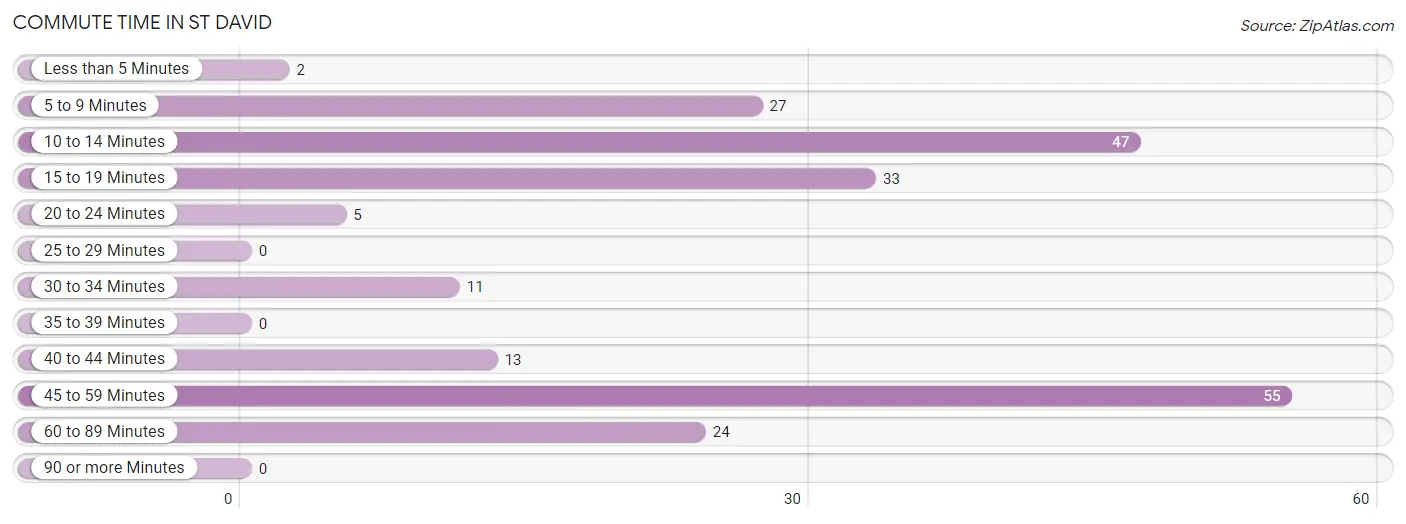
| Commute Time | # Commuters | % Commuters |
| Less than 5 Minutes | 2 | 0.9% |
| 5 to 9 Minutes | 27 | 12.4% |
| 10 to 14 Minutes | 47 | 21.7% |
| 15 to 19 Minutes | 33 | 15.2% |
| 20 to 24 Minutes | 5 | 2.3% |
| 25 to 29 Minutes | 0 | 0.0% |
| 30 to 34 Minutes | 11 | 5.1% |
| 35 to 39 Minutes | 0 | 0.0% |
| 40 to 44 Minutes | 13 | 6.0% |
| 45 to 59 Minutes | 55 | 25.4% |
| 60 to 89 Minutes | 24 | 11.1% |
| 90 or more Minutes | 0 | 0.0% |
Commute Time by Sex in St David
The most common commute times in St David are 45 to 59 minutes (51 commuters, 38.9%) for males and 10 to 14 minutes (24 commuters, 27.9%) for females.
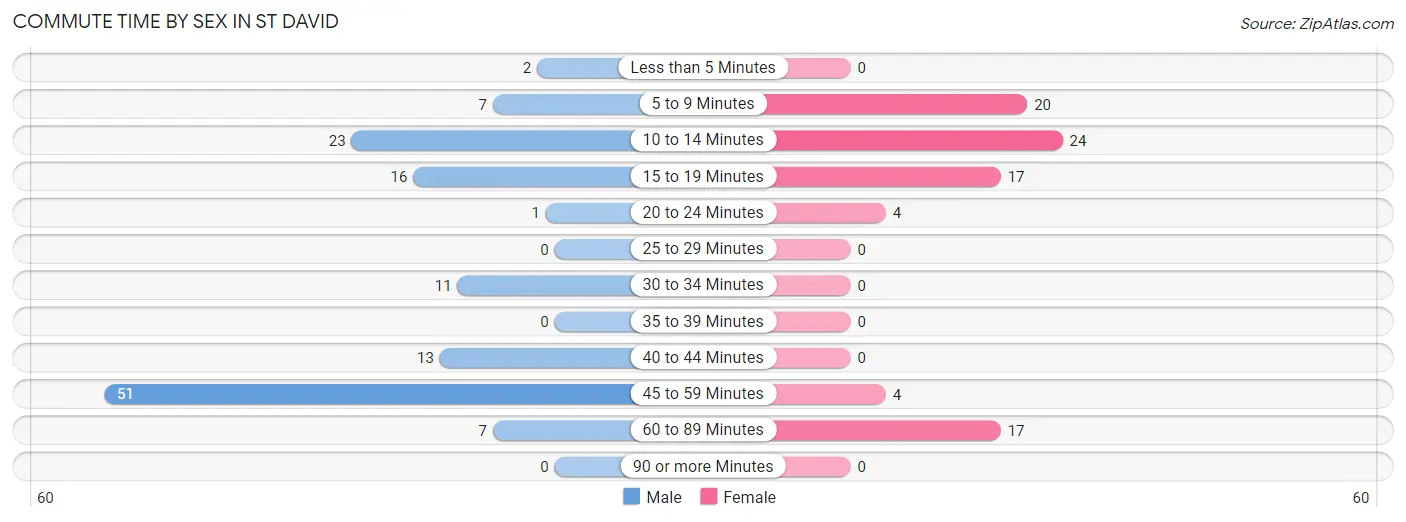
| Commute Time | Male | Female |
| Less than 5 Minutes | 2 (1.5%) | 0 (0.0%) |
| 5 to 9 Minutes | 7 (5.3%) | 20 (23.3%) |
| 10 to 14 Minutes | 23 (17.6%) | 24 (27.9%) |
| 15 to 19 Minutes | 16 (12.2%) | 17 (19.8%) |
| 20 to 24 Minutes | 1 (0.8%) | 4 (4.6%) |
| 25 to 29 Minutes | 0 (0.0%) | 0 (0.0%) |
| 30 to 34 Minutes | 11 (8.4%) | 0 (0.0%) |
| 35 to 39 Minutes | 0 (0.0%) | 0 (0.0%) |
| 40 to 44 Minutes | 13 (9.9%) | 0 (0.0%) |
| 45 to 59 Minutes | 51 (38.9%) | 4 (4.6%) |
| 60 to 89 Minutes | 7 (5.3%) | 17 (19.8%) |
| 90 or more Minutes | 0 (0.0%) | 0 (0.0%) |
Time of Departure to Work by Sex in St David
The most frequent times of departure to work in St David are 6:00 AM to 6:29 AM (37, 28.2%) for males and 7:30 AM to 7:59 AM (49, 57.0%) for females.
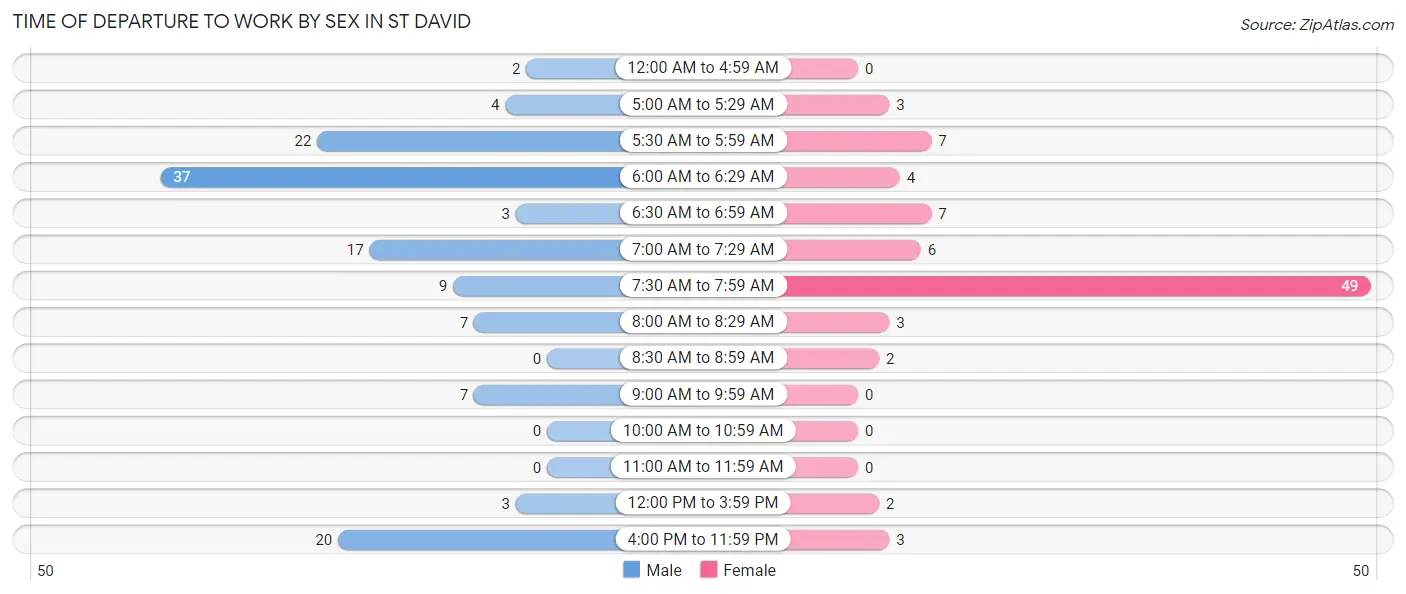
| Time of Departure | Male | Female |
| 12:00 AM to 4:59 AM | 2 (1.5%) | 0 (0.0%) |
| 5:00 AM to 5:29 AM | 4 (3.0%) | 3 (3.5%) |
| 5:30 AM to 5:59 AM | 22 (16.8%) | 7 (8.1%) |
| 6:00 AM to 6:29 AM | 37 (28.2%) | 4 (4.6%) |
| 6:30 AM to 6:59 AM | 3 (2.3%) | 7 (8.1%) |
| 7:00 AM to 7:29 AM | 17 (13.0%) | 6 (7.0%) |
| 7:30 AM to 7:59 AM | 9 (6.9%) | 49 (57.0%) |
| 8:00 AM to 8:29 AM | 7 (5.3%) | 3 (3.5%) |
| 8:30 AM to 8:59 AM | 0 (0.0%) | 2 (2.3%) |
| 9:00 AM to 9:59 AM | 7 (5.3%) | 0 (0.0%) |
| 10:00 AM to 10:59 AM | 0 (0.0%) | 0 (0.0%) |
| 11:00 AM to 11:59 AM | 0 (0.0%) | 0 (0.0%) |
| 12:00 PM to 3:59 PM | 3 (2.3%) | 2 (2.3%) |
| 4:00 PM to 11:59 PM | 20 (15.3%) | 3 (3.5%) |
| Total | 131 (100.0%) | 86 (100.0%) |
Housing Occupancy in St David
Occupancy by Ownership in St David
Of the total 243 dwellings in St David, owner-occupied units account for 233 (95.9%), while renter-occupied units make up 10 (4.1%).
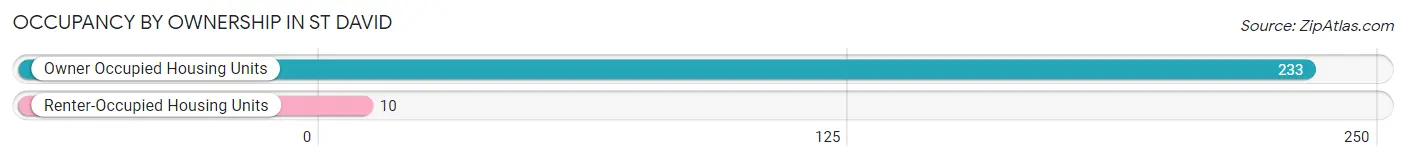
| Occupancy | # Housing Units | % Housing Units |
| Owner Occupied Housing Units | 233 | 95.9% |
| Renter-Occupied Housing Units | 10 | 4.1% |
| Total Occupied Housing Units | 243 | 100.0% |
Occupancy by Household Size in St David
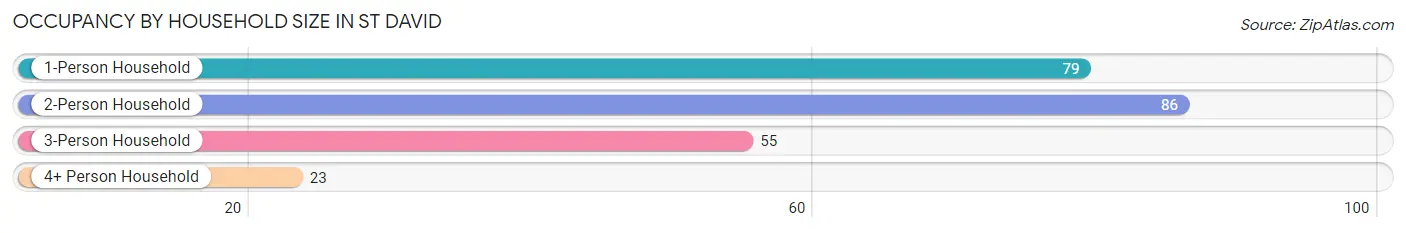
| Household Size | # Housing Units | % Housing Units |
| 1-Person Household | 79 | 32.5% |
| 2-Person Household | 86 | 35.4% |
| 3-Person Household | 55 | 22.6% |
| 4+ Person Household | 23 | 9.5% |
| Total Housing Units | 243 | 100.0% |
Occupancy by Ownership by Household Size in St David
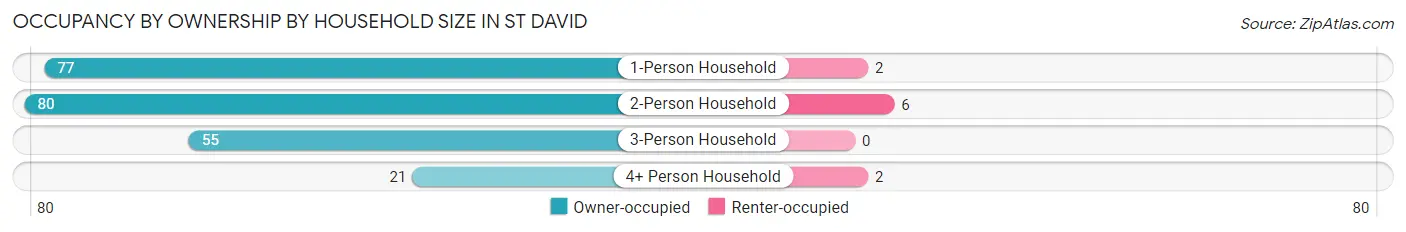
| Household Size | Owner-occupied | Renter-occupied |
| 1-Person Household | 77 (97.5%) | 2 (2.5%) |
| 2-Person Household | 80 (93.0%) | 6 (7.0%) |
| 3-Person Household | 55 (100.0%) | 0 (0.0%) |
| 4+ Person Household | 21 (91.3%) | 2 (8.7%) |
| Total Housing Units | 233 (95.9%) | 10 (4.1%) |
Occupancy by Educational Attainment in St David
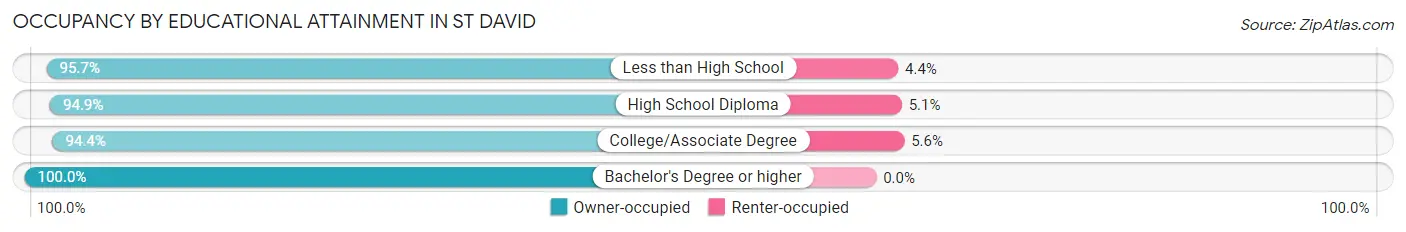
| Household Size | Owner-occupied | Renter-occupied |
| Less than High School | 22 (95.7%) | 1 (4.3%) |
| High School Diploma | 75 (94.9%) | 4 (5.1%) |
| College/Associate Degree | 85 (94.4%) | 5 (5.6%) |
| Bachelor's Degree or higher | 51 (100.0%) | 0 (0.0%) |
Occupancy by Age of Householder in St David
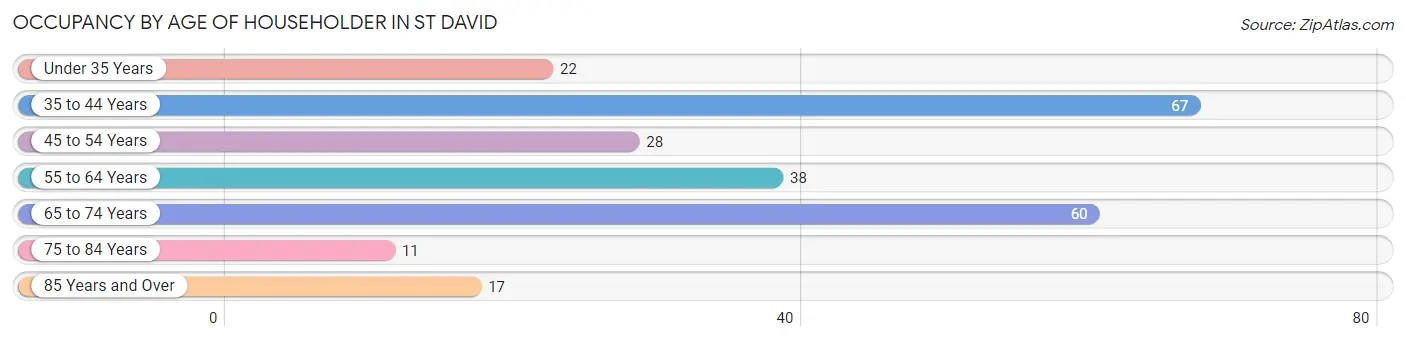
| Age Bracket | # Households | % Households |
| Under 35 Years | 22 | 9.0% |
| 35 to 44 Years | 67 | 27.6% |
| 45 to 54 Years | 28 | 11.5% |
| 55 to 64 Years | 38 | 15.6% |
| 65 to 74 Years | 60 | 24.7% |
| 75 to 84 Years | 11 | 4.5% |
| 85 Years and Over | 17 | 7.0% |
| Total | 243 | 100.0% |
Housing Finances in St David
Median Income by Occupancy in St David
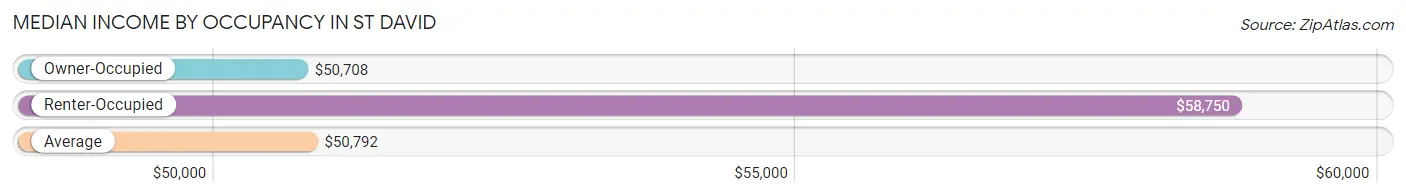
| Occupancy Type | # Households | Median Income |
| Owner-Occupied | 233 (95.9%) | $50,708 |
| Renter-Occupied | 10 (4.1%) | $58,750 |
| Average | 243 (100.0%) | $50,792 |
Occupancy by Householder Income Bracket in St David
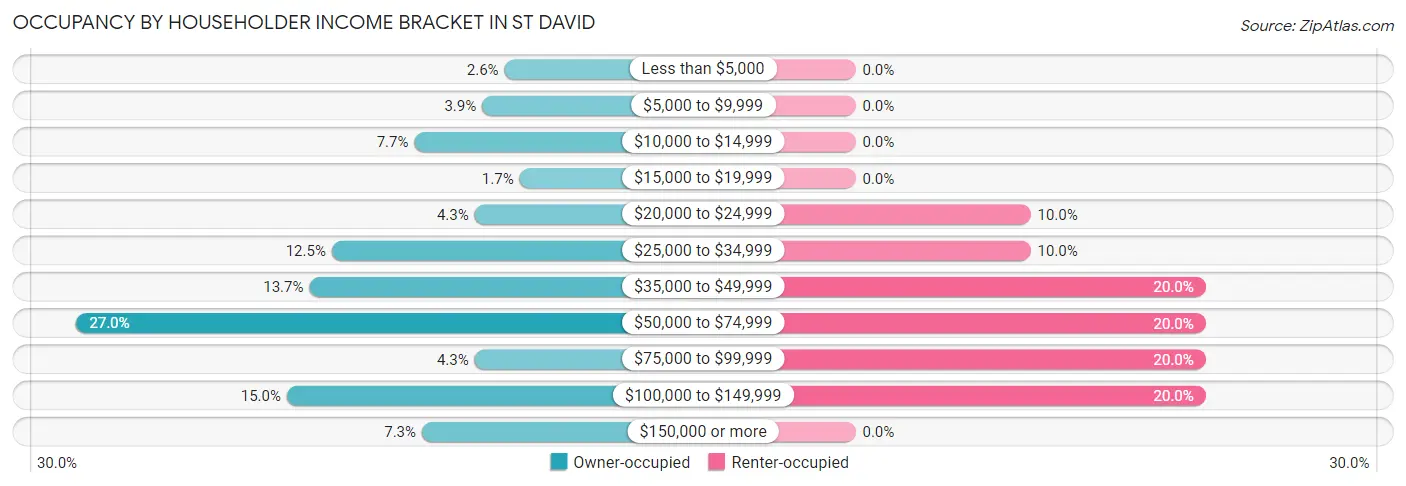
| Income Bracket | Owner-occupied | Renter-occupied |
| Less than $5,000 | 6 (2.6%) | 0 (0.0%) |
| $5,000 to $9,999 | 9 (3.9%) | 0 (0.0%) |
| $10,000 to $14,999 | 18 (7.7%) | 0 (0.0%) |
| $15,000 to $19,999 | 4 (1.7%) | 0 (0.0%) |
| $20,000 to $24,999 | 10 (4.3%) | 1 (10.0%) |
| $25,000 to $34,999 | 29 (12.4%) | 1 (10.0%) |
| $35,000 to $49,999 | 32 (13.7%) | 2 (20.0%) |
| $50,000 to $74,999 | 63 (27.0%) | 2 (20.0%) |
| $75,000 to $99,999 | 10 (4.3%) | 2 (20.0%) |
| $100,000 to $149,999 | 35 (15.0%) | 2 (20.0%) |
| $150,000 or more | 17 (7.3%) | 0 (0.0%) |
| Total | 233 (100.0%) | 10 (100.0%) |
Monthly Housing Cost Tiers in St David
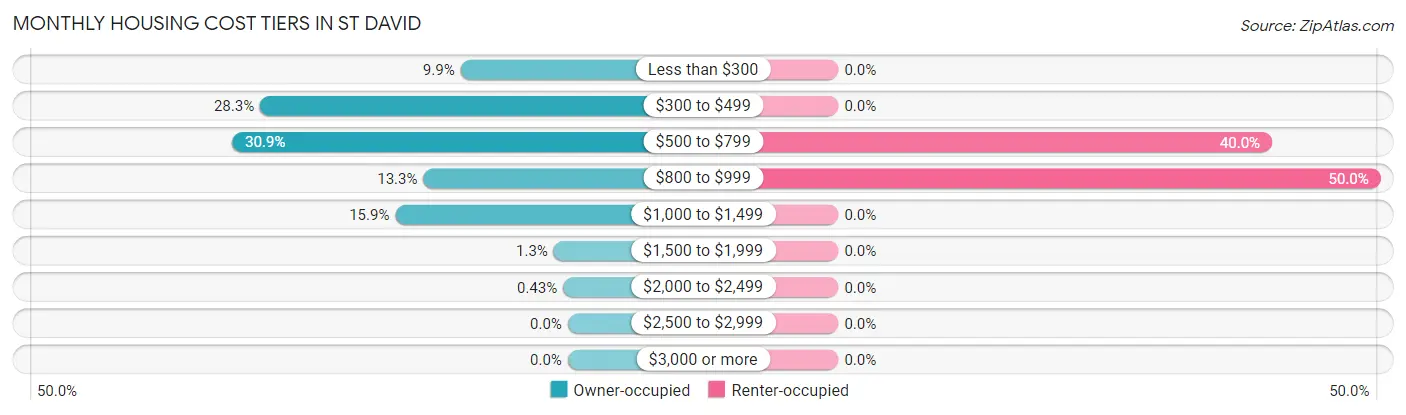
| Monthly Cost | Owner-occupied | Renter-occupied |
| Less than $300 | 23 (9.9%) | 0 (0.0%) |
| $300 to $499 | 66 (28.3%) | 0 (0.0%) |
| $500 to $799 | 72 (30.9%) | 4 (40.0%) |
| $800 to $999 | 31 (13.3%) | 5 (50.0%) |
| $1,000 to $1,499 | 37 (15.9%) | 0 (0.0%) |
| $1,500 to $1,999 | 3 (1.3%) | 0 (0.0%) |
| $2,000 to $2,499 | 1 (0.4%) | 0 (0.0%) |
| $2,500 to $2,999 | 0 (0.0%) | 0 (0.0%) |
| $3,000 or more | 0 (0.0%) | 0 (0.0%) |
| Total | 233 (100.0%) | 10 (100.0%) |
Physical Housing Characteristics in St David
Housing Structures in St David
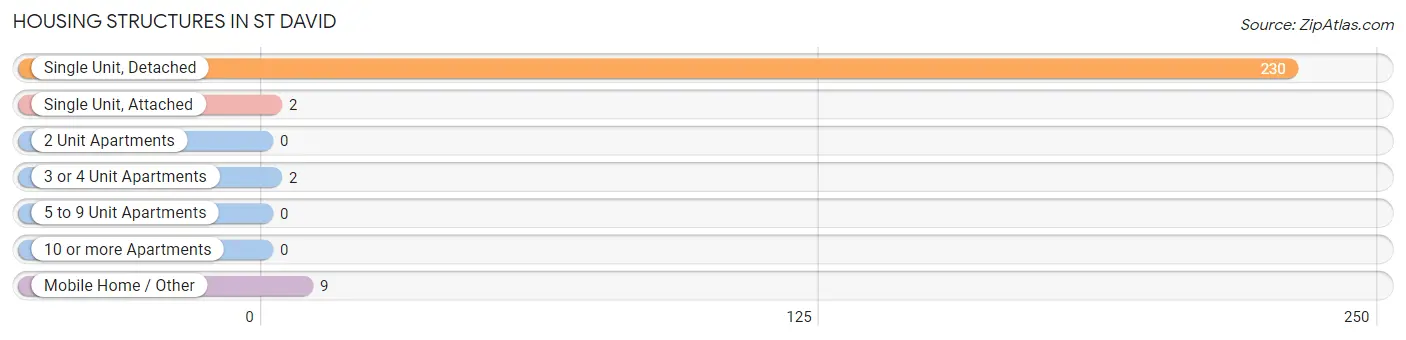
| Structure Type | # Housing Units | % Housing Units |
| Single Unit, Detached | 230 | 94.7% |
| Single Unit, Attached | 2 | 0.8% |
| 2 Unit Apartments | 0 | 0.0% |
| 3 or 4 Unit Apartments | 2 | 0.8% |
| 5 to 9 Unit Apartments | 0 | 0.0% |
| 10 or more Apartments | 0 | 0.0% |
| Mobile Home / Other | 9 | 3.7% |
| Total | 243 | 100.0% |
Housing Structures by Occupancy in St David
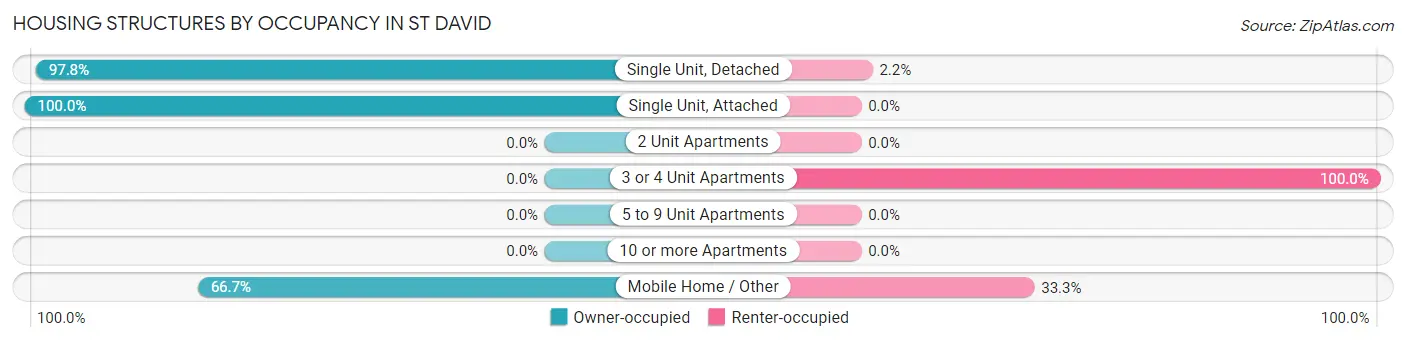
| Structure Type | Owner-occupied | Renter-occupied |
| Single Unit, Detached | 225 (97.8%) | 5 (2.2%) |
| Single Unit, Attached | 2 (100.0%) | 0 (0.0%) |
| 2 Unit Apartments | 0 (0.0%) | 0 (0.0%) |
| 3 or 4 Unit Apartments | 0 (0.0%) | 2 (100.0%) |
| 5 to 9 Unit Apartments | 0 (0.0%) | 0 (0.0%) |
| 10 or more Apartments | 0 (0.0%) | 0 (0.0%) |
| Mobile Home / Other | 6 (66.7%) | 3 (33.3%) |
| Total | 233 (95.9%) | 10 (4.1%) |
Housing Structures by Number of Rooms in St David
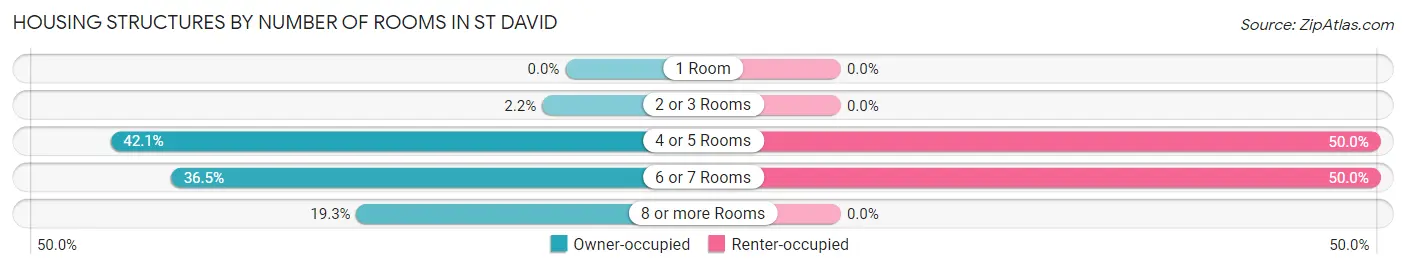
| Number of Rooms | Owner-occupied | Renter-occupied |
| 1 Room | 0 (0.0%) | 0 (0.0%) |
| 2 or 3 Rooms | 5 (2.1%) | 0 (0.0%) |
| 4 or 5 Rooms | 98 (42.1%) | 5 (50.0%) |
| 6 or 7 Rooms | 85 (36.5%) | 5 (50.0%) |
| 8 or more Rooms | 45 (19.3%) | 0 (0.0%) |
| Total | 233 (100.0%) | 10 (100.0%) |
Housing Structure by Heating Type in St David
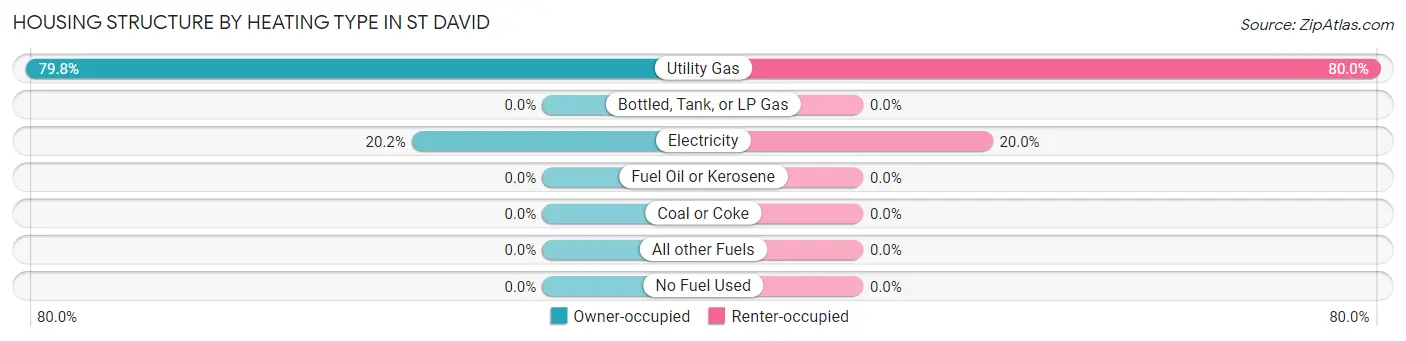
| Heating Type | Owner-occupied | Renter-occupied |
| Utility Gas | 186 (79.8%) | 8 (80.0%) |
| Bottled, Tank, or LP Gas | 0 (0.0%) | 0 (0.0%) |
| Electricity | 47 (20.2%) | 2 (20.0%) |
| Fuel Oil or Kerosene | 0 (0.0%) | 0 (0.0%) |
| Coal or Coke | 0 (0.0%) | 0 (0.0%) |
| All other Fuels | 0 (0.0%) | 0 (0.0%) |
| No Fuel Used | 0 (0.0%) | 0 (0.0%) |
| Total | 233 (100.0%) | 10 (100.0%) |
Household Vehicle Usage in St David
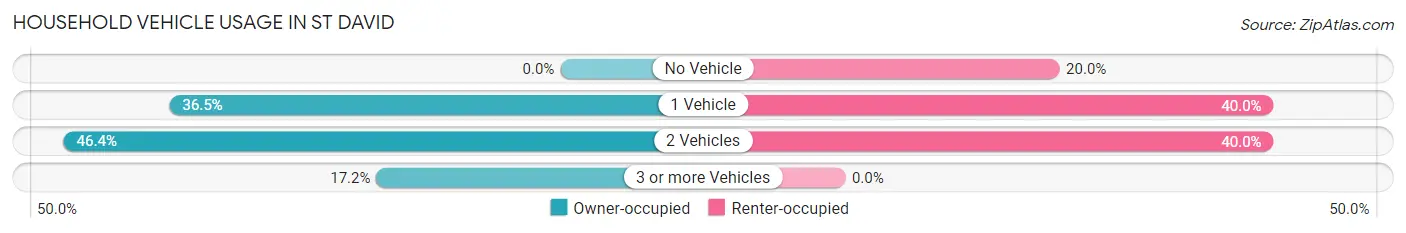
| Vehicles per Household | Owner-occupied | Renter-occupied |
| No Vehicle | 0 (0.0%) | 2 (20.0%) |
| 1 Vehicle | 85 (36.5%) | 4 (40.0%) |
| 2 Vehicles | 108 (46.4%) | 4 (40.0%) |
| 3 or more Vehicles | 40 (17.2%) | 0 (0.0%) |
| Total | 233 (100.0%) | 10 (100.0%) |
Real Estate & Mortgages in St David
Real Estate and Mortgage Overview in St David
| Characteristic | Without Mortgage | With Mortgage |
| Housing Units | 149 | 84 |
| Median Property Value | $55,500 | $66,400 |
| Median Household Income | $50,050 | $8 |
| Monthly Housing Costs | $465 | $0 |
| Real Estate Taxes | $1,194 | $0 |
Property Value by Mortgage Status in St David
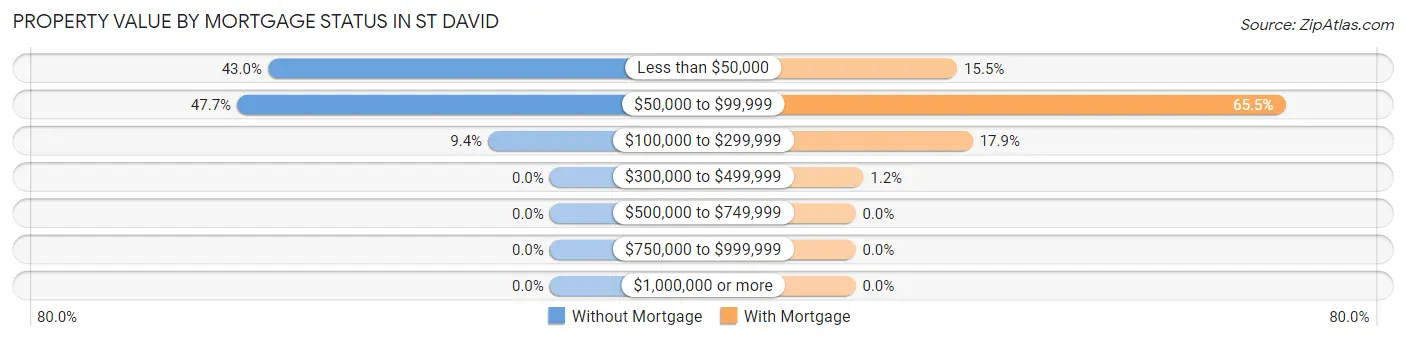
| Property Value | Without Mortgage | With Mortgage |
| Less than $50,000 | 64 (42.9%) | 13 (15.5%) |
| $50,000 to $99,999 | 71 (47.6%) | 55 (65.5%) |
| $100,000 to $299,999 | 14 (9.4%) | 15 (17.9%) |
| $300,000 to $499,999 | 0 (0.0%) | 1 (1.2%) |
| $500,000 to $749,999 | 0 (0.0%) | 0 (0.0%) |
| $750,000 to $999,999 | 0 (0.0%) | 0 (0.0%) |
| $1,000,000 or more | 0 (0.0%) | 0 (0.0%) |
| Total | 149 (100.0%) | 84 (100.0%) |
Household Income by Mortgage Status in St David
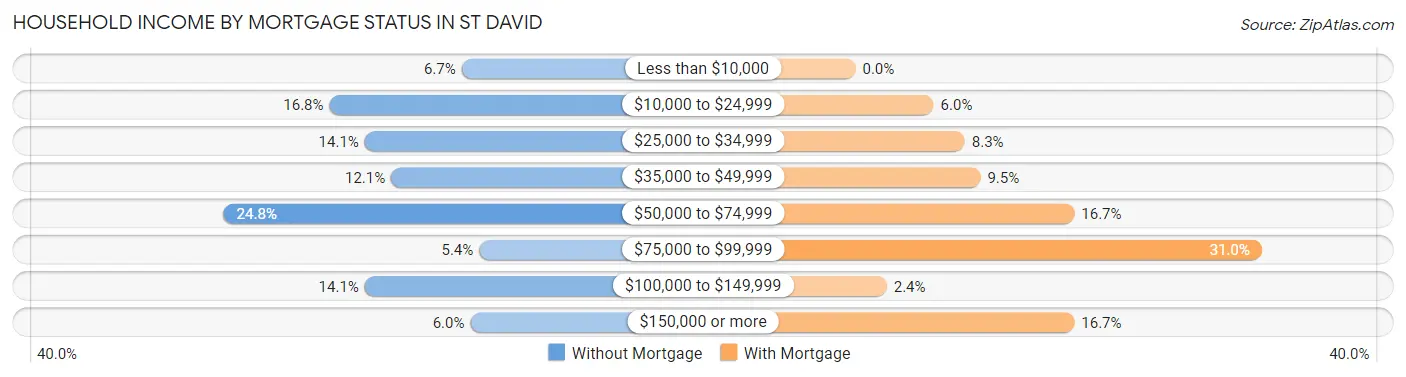
| Household Income | Without Mortgage | With Mortgage |
| Less than $10,000 | 10 (6.7%) | 0 (0.0%) |
| $10,000 to $24,999 | 25 (16.8%) | 5 (5.9%) |
| $25,000 to $34,999 | 21 (14.1%) | 7 (8.3%) |
| $35,000 to $49,999 | 18 (12.1%) | 8 (9.5%) |
| $50,000 to $74,999 | 37 (24.8%) | 14 (16.7%) |
| $75,000 to $99,999 | 8 (5.4%) | 26 (30.9%) |
| $100,000 to $149,999 | 21 (14.1%) | 2 (2.4%) |
| $150,000 or more | 9 (6.0%) | 14 (16.7%) |
| Total | 149 (100.0%) | 84 (100.0%) |
Property Value to Household Income Ratio in St David
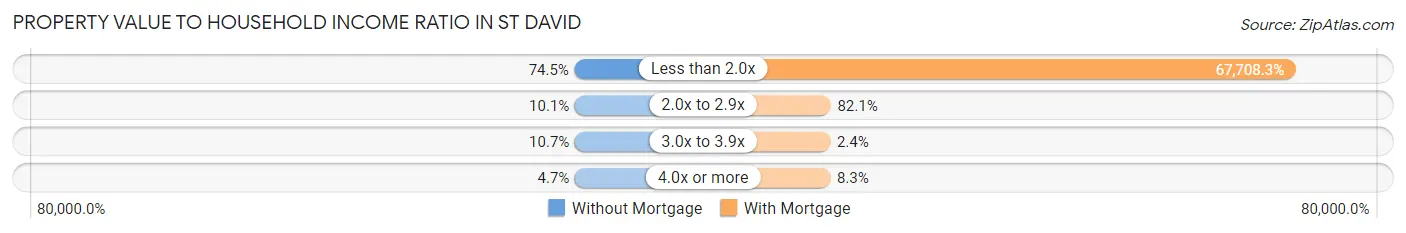
| Value-to-Income Ratio | Without Mortgage | With Mortgage |
| Less than 2.0x | 111 (74.5%) | 56,875 (67,708.3%) |
| 2.0x to 2.9x | 15 (10.1%) | 69 (82.1%) |
| 3.0x to 3.9x | 16 (10.7%) | 2 (2.4%) |
| 4.0x or more | 7 (4.7%) | 7 (8.3%) |
| Total | 149 (100.0%) | 84 (100.0%) |
Real Estate Taxes by Mortgage Status in St David
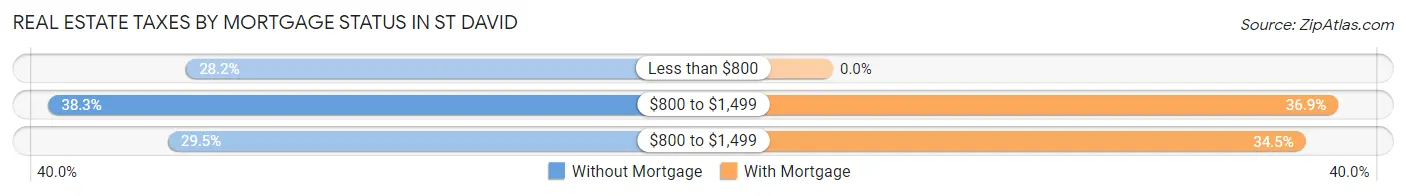
| Property Taxes | Without Mortgage | With Mortgage |
| Less than $800 | 42 (28.2%) | 0 (0.0%) |
| $800 to $1,499 | 57 (38.3%) | 31 (36.9%) |
| $800 to $1,499 | 44 (29.5%) | 29 (34.5%) |
| Total | 149 (100.0%) | 84 (100.0%) |
Health & Disability in St David
Health Insurance Coverage by Age in St David
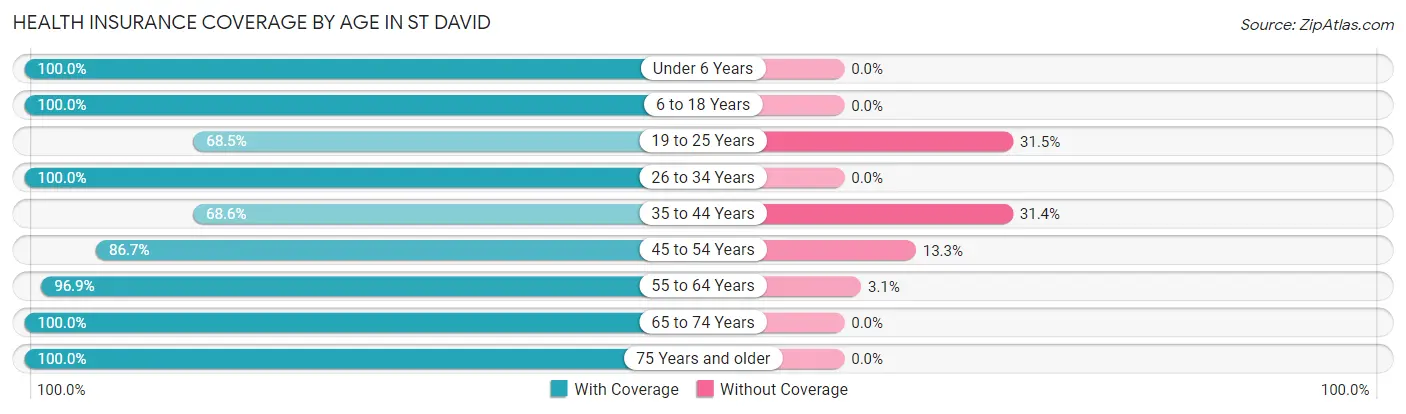
| Age Bracket | With Coverage | Without Coverage |
| Under 6 Years | 43 (100.0%) | 0 (0.0%) |
| 6 to 18 Years | 60 (100.0%) | 0 (0.0%) |
| 19 to 25 Years | 37 (68.5%) | 17 (31.5%) |
| 26 to 34 Years | 38 (100.0%) | 0 (0.0%) |
| 35 to 44 Years | 72 (68.6%) | 33 (31.4%) |
| 45 to 54 Years | 39 (86.7%) | 6 (13.3%) |
| 55 to 64 Years | 62 (96.9%) | 2 (3.1%) |
| 65 to 74 Years | 101 (100.0%) | 0 (0.0%) |
| 75 Years and older | 30 (100.0%) | 0 (0.0%) |
| Total | 482 (89.3%) | 58 (10.7%) |
Health Insurance Coverage by Citizenship Status in St David
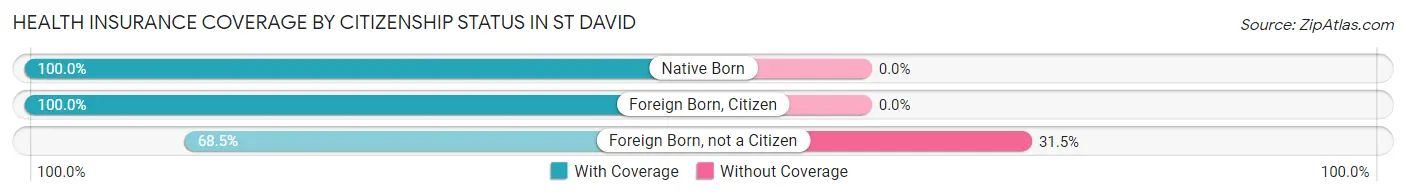
| Citizenship Status | With Coverage | Without Coverage |
| Native Born | 43 (100.0%) | 0 (0.0%) |
| Foreign Born, Citizen | 60 (100.0%) | 0 (0.0%) |
| Foreign Born, not a Citizen | 37 (68.5%) | 17 (31.5%) |
Health Insurance Coverage by Household Income in St David
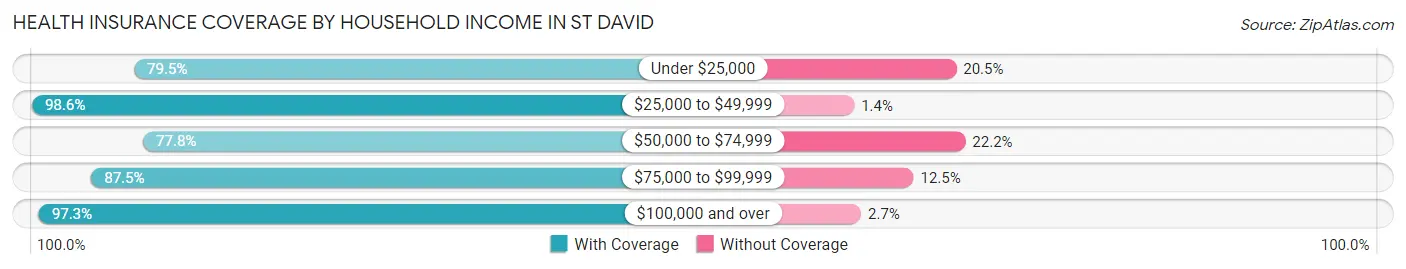
| Household Income | With Coverage | Without Coverage |
| Under $25,000 | 62 (79.5%) | 16 (20.5%) |
| $25,000 to $49,999 | 142 (98.6%) | 2 (1.4%) |
| $50,000 to $74,999 | 119 (77.8%) | 34 (22.2%) |
| $75,000 to $99,999 | 14 (87.5%) | 2 (12.5%) |
| $100,000 and over | 145 (97.3%) | 4 (2.7%) |
Public vs Private Health Insurance Coverage by Age in St David
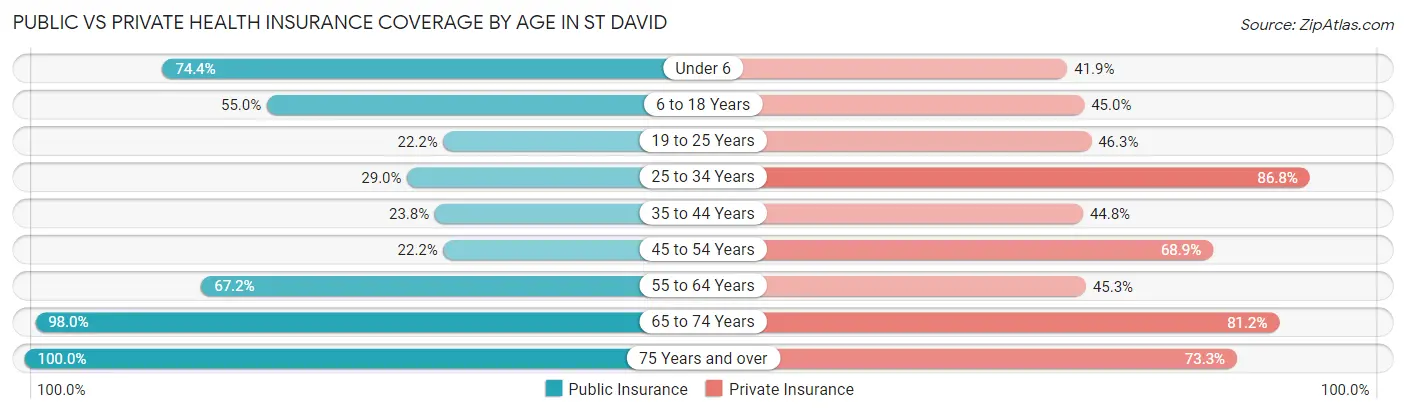
| Age Bracket | Public Insurance | Private Insurance |
| Under 6 | 32 (74.4%) | 18 (41.9%) |
| 6 to 18 Years | 33 (55.0%) | 27 (45.0%) |
| 19 to 25 Years | 12 (22.2%) | 25 (46.3%) |
| 25 to 34 Years | 11 (28.9%) | 33 (86.8%) |
| 35 to 44 Years | 25 (23.8%) | 47 (44.8%) |
| 45 to 54 Years | 10 (22.2%) | 31 (68.9%) |
| 55 to 64 Years | 43 (67.2%) | 29 (45.3%) |
| 65 to 74 Years | 99 (98.0%) | 82 (81.2%) |
| 75 Years and over | 30 (100.0%) | 22 (73.3%) |
| Total | 295 (54.6%) | 314 (58.2%) |
Disability Status by Sex by Age in St David
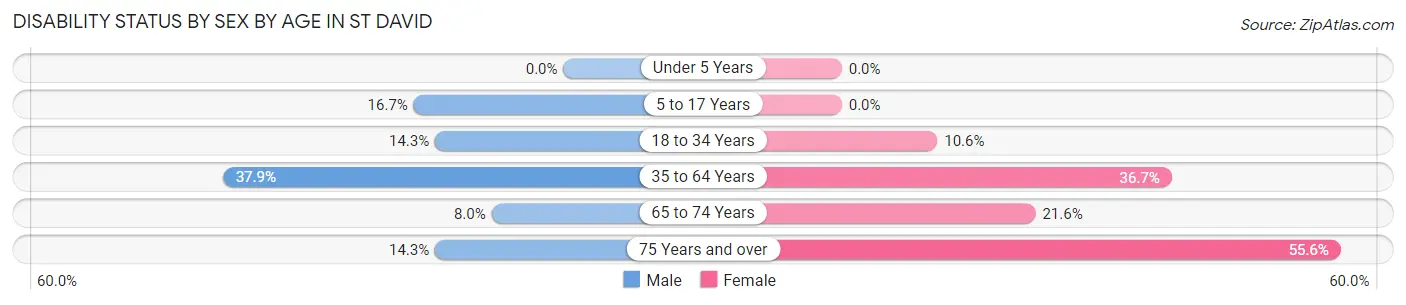
| Age Bracket | Male | Female |
| Under 5 Years | 0 (0.0%) | 0 (0.0%) |
| 5 to 17 Years | 3 (16.7%) | 0 (0.0%) |
| 18 to 34 Years | 8 (14.3%) | 5 (10.6%) |
| 35 to 64 Years | 44 (37.9%) | 36 (36.7%) |
| 65 to 74 Years | 4 (8.0%) | 11 (21.6%) |
| 75 Years and over | 3 (14.3%) | 5 (55.6%) |
Disability Class by Sex by Age in St David
Disability Class: Hearing Difficulty
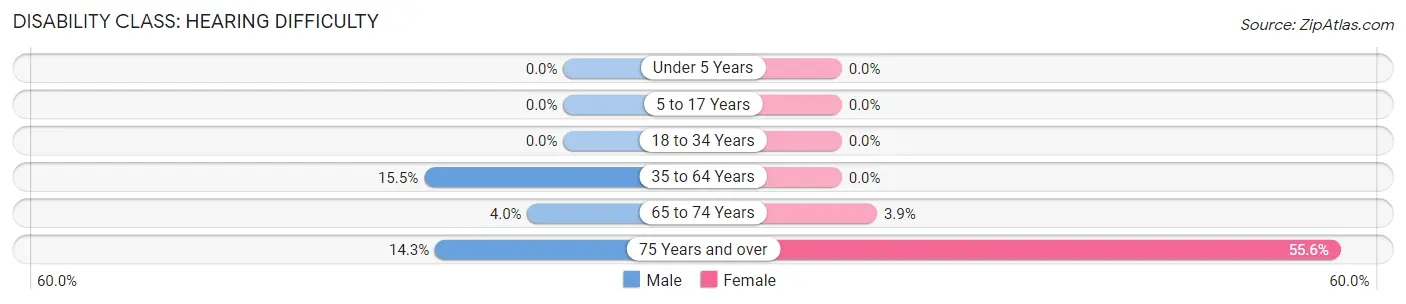
| Age Bracket | Male | Female |
| Under 5 Years | 0 (0.0%) | 0 (0.0%) |
| 5 to 17 Years | 0 (0.0%) | 0 (0.0%) |
| 18 to 34 Years | 0 (0.0%) | 0 (0.0%) |
| 35 to 64 Years | 18 (15.5%) | 0 (0.0%) |
| 65 to 74 Years | 2 (4.0%) | 2 (3.9%) |
| 75 Years and over | 3 (14.3%) | 5 (55.6%) |
Disability Class: Vision Difficulty
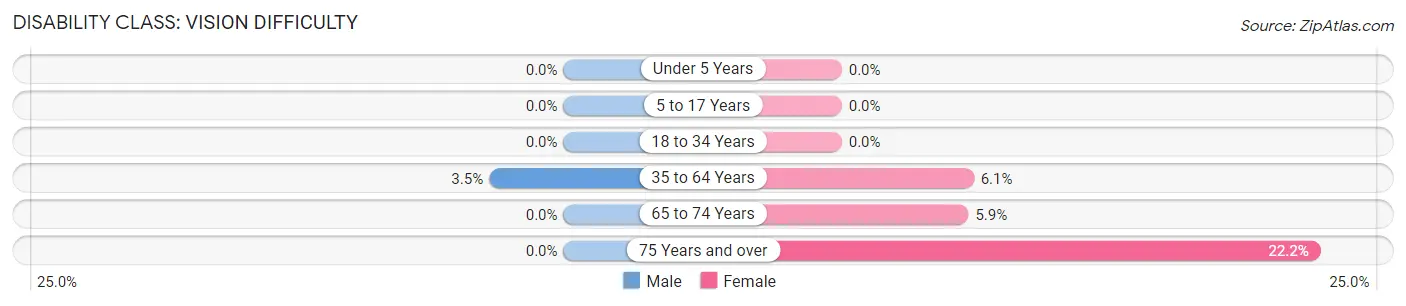
| Age Bracket | Male | Female |
| Under 5 Years | 0 (0.0%) | 0 (0.0%) |
| 5 to 17 Years | 0 (0.0%) | 0 (0.0%) |
| 18 to 34 Years | 0 (0.0%) | 0 (0.0%) |
| 35 to 64 Years | 4 (3.5%) | 6 (6.1%) |
| 65 to 74 Years | 0 (0.0%) | 3 (5.9%) |
| 75 Years and over | 0 (0.0%) | 2 (22.2%) |
Disability Class: Cognitive Difficulty
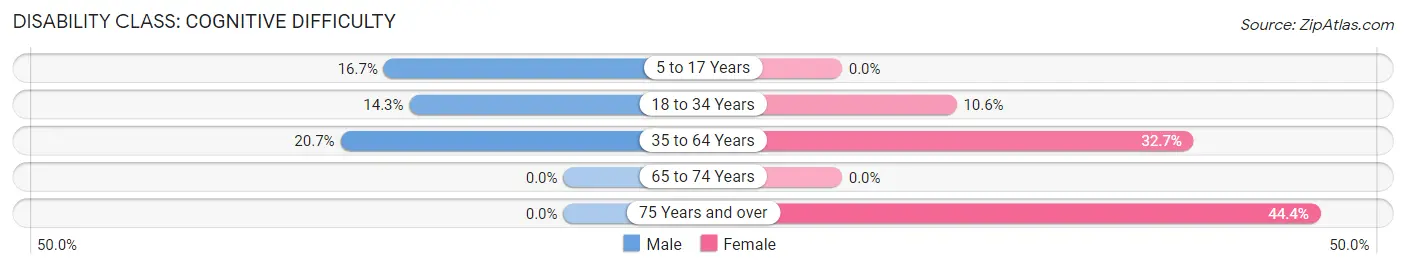
| Age Bracket | Male | Female |
| 5 to 17 Years | 3 (16.7%) | 0 (0.0%) |
| 18 to 34 Years | 8 (14.3%) | 5 (10.6%) |
| 35 to 64 Years | 24 (20.7%) | 32 (32.7%) |
| 65 to 74 Years | 0 (0.0%) | 0 (0.0%) |
| 75 Years and over | 0 (0.0%) | 4 (44.4%) |
Disability Class: Ambulatory Difficulty
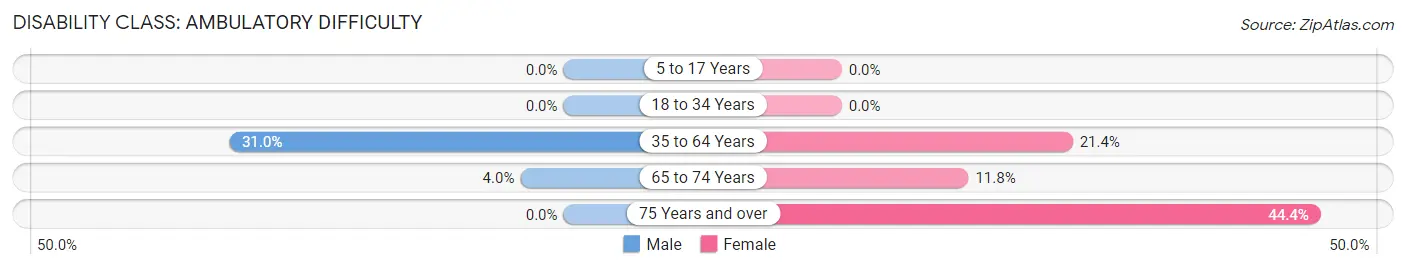
| Age Bracket | Male | Female |
| 5 to 17 Years | 0 (0.0%) | 0 (0.0%) |
| 18 to 34 Years | 0 (0.0%) | 0 (0.0%) |
| 35 to 64 Years | 36 (31.0%) | 21 (21.4%) |
| 65 to 74 Years | 2 (4.0%) | 6 (11.8%) |
| 75 Years and over | 0 (0.0%) | 4 (44.4%) |
Disability Class: Self-Care Difficulty
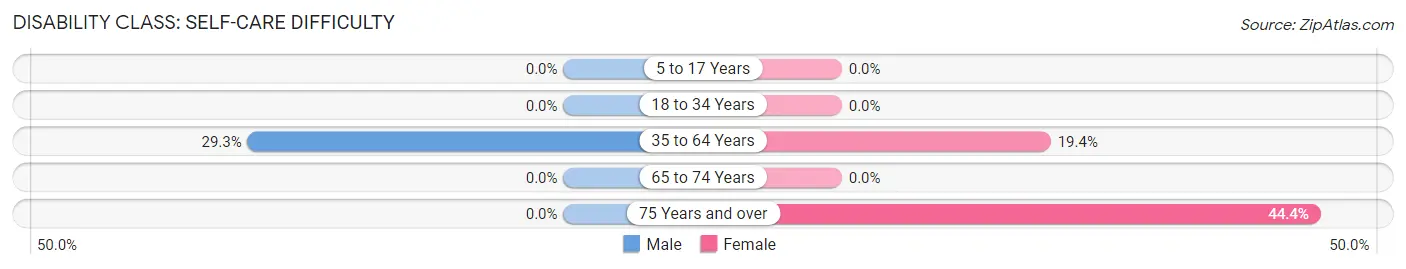
| Age Bracket | Male | Female |
| 5 to 17 Years | 0 (0.0%) | 0 (0.0%) |
| 18 to 34 Years | 0 (0.0%) | 0 (0.0%) |
| 35 to 64 Years | 34 (29.3%) | 19 (19.4%) |
| 65 to 74 Years | 0 (0.0%) | 0 (0.0%) |
| 75 Years and over | 0 (0.0%) | 4 (44.4%) |
Technology Access in St David
Computing Device Access in St David
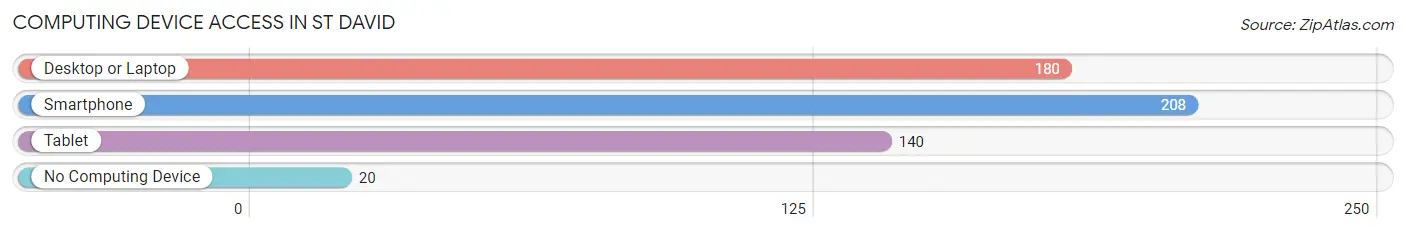
| Device Type | # Households | % Households |
| Desktop or Laptop | 180 | 74.1% |
| Smartphone | 208 | 85.6% |
| Tablet | 140 | 57.6% |
| No Computing Device | 20 | 8.2% |
| Total | 243 | 100.0% |
Internet Access in St David
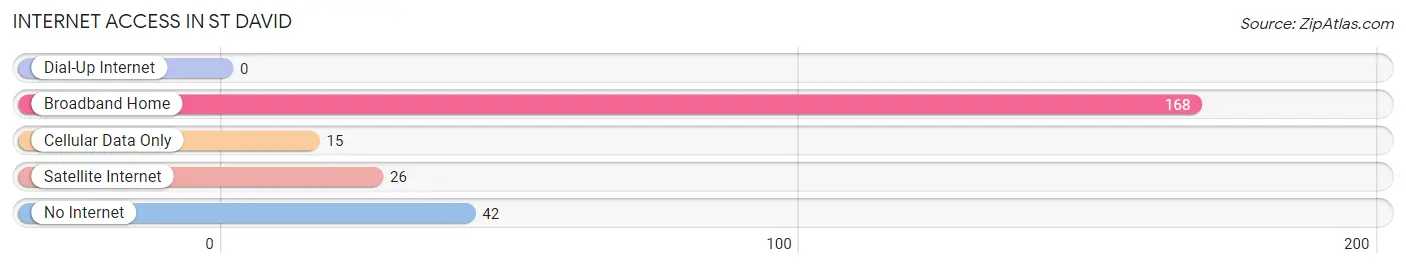
| Internet Type | # Households | % Households |
| Dial-Up Internet | 0 | 0.0% |
| Broadband Home | 168 | 69.1% |
| Cellular Data Only | 15 | 6.2% |
| Satellite Internet | 26 | 10.7% |
| No Internet | 42 | 17.3% |
| Total | 243 | 100.0% |
St David Summary
David, Illinois is a small village located in the northern part of the state, in Iroquois County. It is situated on the banks of the Iroquois River, and is home to a population of just over 500 people. The village was founded in 1854 by a group of settlers from Wales, and was named after the patron saint of Wales, Saint David.
History
The first settlers in the area were a group of Welsh immigrants who arrived in 1854. They were led by Reverend David Jones, who had been sent by the Welsh Congregational Church to establish a Welsh settlement in the United States. The settlers chose the area because of its proximity to the Iroquois River, which provided them with a source of water for their crops and livestock.
The settlers quickly established a small village, which they named after their leader, Saint David. The village grew slowly, but steadily, and by the turn of the century, it had become a thriving community. The village was home to a variety of businesses, including a general store, a blacksmith, a post office, and a school.
In the early 1900s, the village was incorporated as the Village of St. David. The village continued to grow and prosper, and by the 1950s, it had become a popular tourist destination. The village was home to a variety of attractions, including a golf course, a swimming pool, and a movie theater.
Geography
St. David is located in the northern part of Illinois, in Iroquois County. It is situated on the banks of the Iroquois River, and is surrounded by rolling hills and farmland. The village is located approximately 30 miles south of Chicago, and is easily accessible by car or train.
The village is home to a variety of parks and recreational areas, including a golf course, a swimming pool, and a movie theater. The village also has a variety of shops and restaurants, as well as a post office and a library.
Economy
The economy of St. David is largely based on agriculture. The village is home to a variety of farms, which produce a variety of crops, including corn, soybeans, and wheat. The village also has a number of small businesses, including a general store, a blacksmith, and a post office.
The village is also home to a variety of tourist attractions, including a golf course, a swimming pool, and a movie theater. These attractions bring in a significant amount of revenue for the village, and help to support the local economy.
Demographics
As of the 2010 census, the population of St. David was 514. The village is predominantly white, with 92.3% of the population identifying as white. The remaining 7.7% of the population is made up of African Americans, Hispanics, and other races.
The median household income in St. David is $45,000, and the median home value is $90,000. The village has a low unemployment rate, and a high rate of homeownership.
Conclusion
St. David, Illinois is a small village located in the northern part of the state, in Iroquois County. It was founded in 1854 by a group of Welsh settlers, and was named after the patron saint of Wales, Saint David. The village is home to a population of just over 500 people, and is largely supported by agriculture and tourism. The village is home to a variety of parks and recreational areas, as well as a variety of shops and restaurants. The village has a median household income of $45,000, and a median home value of $90,000.
Common Questions
What is Per Capita Income in St David?
Per Capita income in St David is $29,149.
What is the Median Family Income in St David?
Median Family Income in St David is $52,011.
What is the Median Household income in St David?
Median Household Income in St David is $50,792.
What is Income or Wage Gap in St David?
Income or Wage Gap in St David is 26.6%.
Women in St David earn 73.4 cents for every dollar earned by a man.
What is Inequality or Gini Index in St David?
Inequality or Gini Index in St David is 0.40.
What is the Total Population of St David?
Total Population of St David is 540.
What is the Total Male Population of St David?
Total Male Population of St David is 284.
What is the Total Female Population of St David?
Total Female Population of St David is 256.
What is the Ratio of Males per 100 Females in St David?
There are 110.94 Males per 100 Females in St David.
What is the Ratio of Females per 100 Males in St David?
There are 90.14 Females per 100 Males in St David.
What is the Median Population Age in St David?
Median Population Age in St David is 42.2 Years.
What is the Average Family Size in St David
Average Family Size in St David is 2.8 People.
What is the Average Household Size in St David
Average Household Size in St David is 2.2 People.
How Large is the Labor Force in St David?
There are 241 People in the Labor Forcein in St David.
What is the Percentage of People in the Labor Force in St David?
52.3% of People are in the Labor Force in St David.
What is the Unemployment Rate in St David?
Unemployment Rate in St David is 0.8%.