Lake Petersburg, IL Map & Demographics
Lake Petersburg Map
Lake Petersburg Overview
$61,783
PER CAPITA INCOME
$135,089
AVG FAMILY INCOME
$113,897
AVG HOUSEHOLD INCOME
54.3%
WAGE / INCOME GAP [ % ]
45.7¢/ $1
WAGE / INCOME GAP [ $ ]
0.33
INEQUALITY / GINI INDEX
763
TOTAL POPULATION
387
MALE POPULATION
376
FEMALE POPULATION
102.93
MALES / 100 FEMALES
97.16
FEMALES / 100 MALES
59.5
MEDIAN AGE
2.5
AVG FAMILY SIZE
2.1
AVG HOUSEHOLD SIZE
354
LABOR FORCE [ PEOPLE ]
52.9%
PERCENT IN LABOR FORCE
2.3%
UNEMPLOYMENT RATE
Income in Lake Petersburg
Income Overview in Lake Petersburg
Per Capita Income in Lake Petersburg is $61,783, while median incomes of families and households are $135,089 and $113,897 respectively.
| Characteristic | Number | Measure |
| Per Capita Income | 763 | $61,783 |
| Median Family Income | 257 | $135,089 |
| Mean Family Income | 257 | $148,063 |
| Median Household Income | 369 | $113,897 |
| Mean Household Income | 369 | $126,154 |
| Income Deficit | 257 | $0 |
| Wage / Income Gap (%) | 763 | 54.32% |
| Wage / Income Gap ($) | 763 | 45.68¢ per $1 |
| Gini / Inequality Index | 763 | 0.33 |
Earnings by Sex in Lake Petersburg
Average Earnings in Lake Petersburg are $62,674, $65,368 for men and $29,861 for women, a difference of 54.3%.
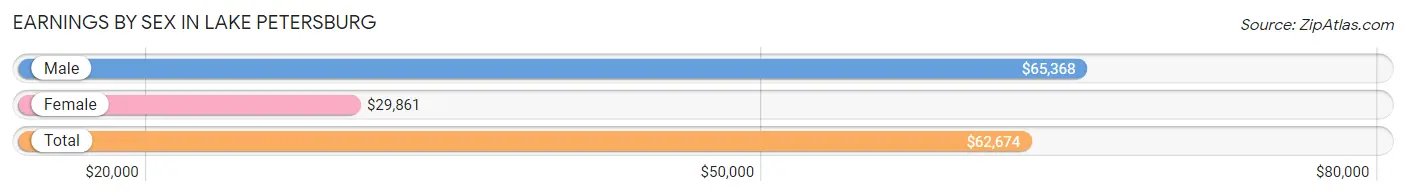
| Sex | Number | Average Earnings |
| Male | 221 (56.7%) | $65,368 |
| Female | 169 (43.3%) | $29,861 |
| Total | 390 (100.0%) | $62,674 |
Earnings by Sex by Income Bracket in Lake Petersburg
The most common earnings brackets in Lake Petersburg are $100,000+ for men (62 | 28.1%) and $75,000 to $99,999 for women (32 | 18.9%).
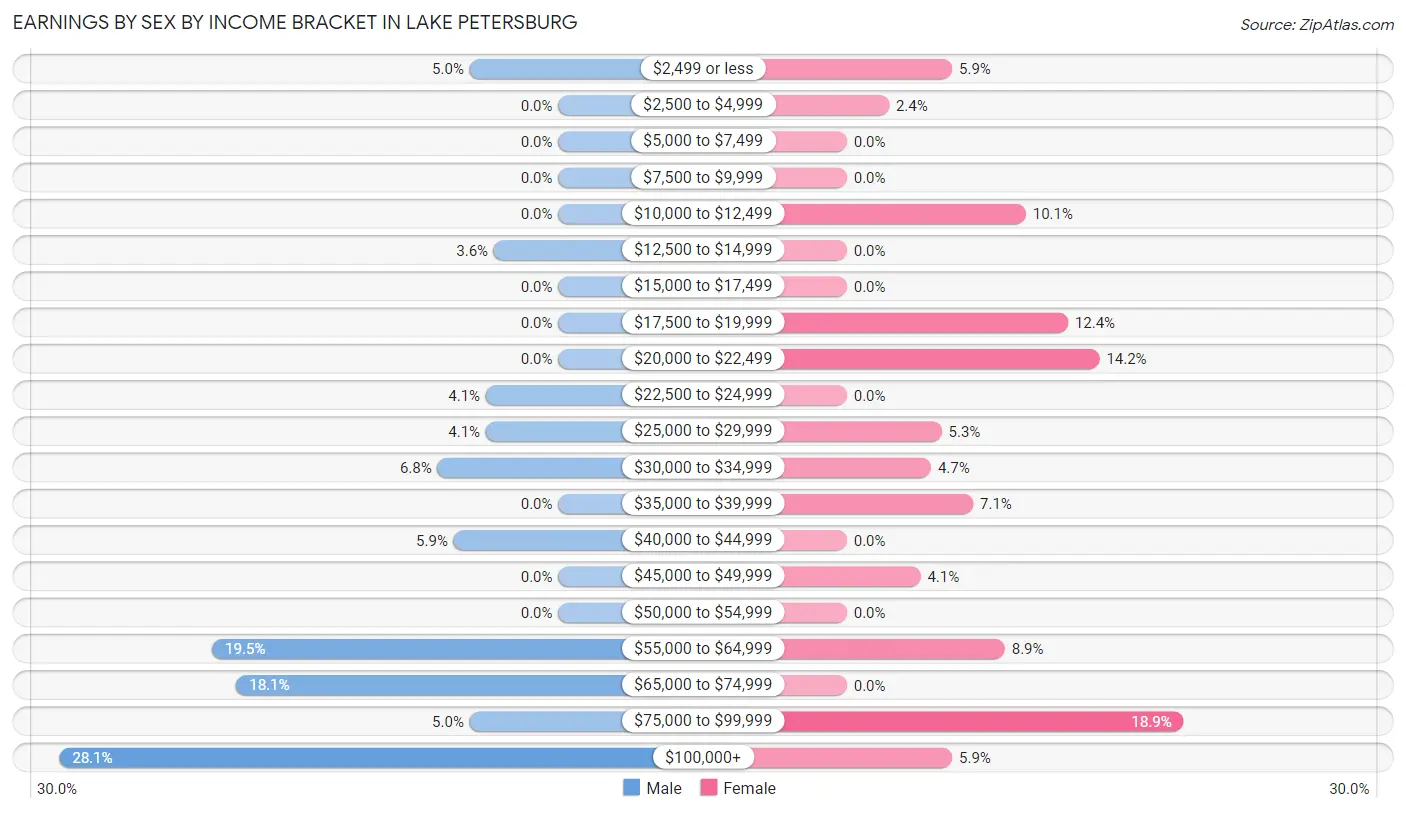
| Income | Male | Female |
| $2,499 or less | 11 (5.0%) | 10 (5.9%) |
| $2,500 to $4,999 | 0 (0.0%) | 4 (2.4%) |
| $5,000 to $7,499 | 0 (0.0%) | 0 (0.0%) |
| $7,500 to $9,999 | 0 (0.0%) | 0 (0.0%) |
| $10,000 to $12,499 | 0 (0.0%) | 17 (10.1%) |
| $12,500 to $14,999 | 8 (3.6%) | 0 (0.0%) |
| $15,000 to $17,499 | 0 (0.0%) | 0 (0.0%) |
| $17,500 to $19,999 | 0 (0.0%) | 21 (12.4%) |
| $20,000 to $22,499 | 0 (0.0%) | 24 (14.2%) |
| $22,500 to $24,999 | 9 (4.1%) | 0 (0.0%) |
| $25,000 to $29,999 | 9 (4.1%) | 9 (5.3%) |
| $30,000 to $34,999 | 15 (6.8%) | 8 (4.7%) |
| $35,000 to $39,999 | 0 (0.0%) | 12 (7.1%) |
| $40,000 to $44,999 | 13 (5.9%) | 0 (0.0%) |
| $45,000 to $49,999 | 0 (0.0%) | 7 (4.1%) |
| $50,000 to $54,999 | 0 (0.0%) | 0 (0.0%) |
| $55,000 to $64,999 | 43 (19.5%) | 15 (8.9%) |
| $65,000 to $74,999 | 40 (18.1%) | 0 (0.0%) |
| $75,000 to $99,999 | 11 (5.0%) | 32 (18.9%) |
| $100,000+ | 62 (28.1%) | 10 (5.9%) |
| Total | 221 (100.0%) | 169 (100.0%) |
Earnings by Sex by Educational Attainment in Lake Petersburg
Average earnings in Lake Petersburg are $65,956 for men and $29,861 for women, a difference of 54.7%. Men with an educational attainment of bachelor's degree enjoy the highest average annual earnings of $115,298, while those with college or associate's degree education earn the least with $64,964. Women with an educational attainment of college or associate's degree earn the most with the average annual earnings of $76,875, while those with high school diploma education have the smallest earnings of $18,000.
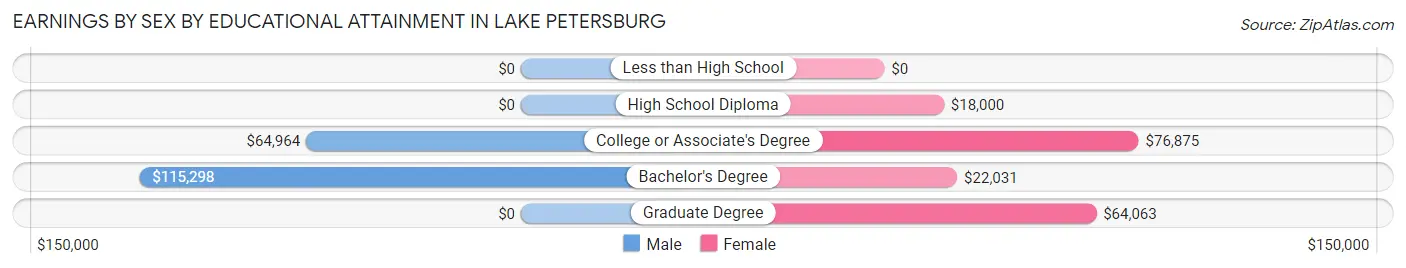
| Educational Attainment | Male Income | Female Income |
| Less than High School | - | - |
| High School Diploma | - | - |
| College or Associate's Degree | $64,964 | $76,875 |
| Bachelor's Degree | $115,298 | $22,031 |
| Graduate Degree | - | - |
| Total | $65,956 | $29,861 |
Family Income in Lake Petersburg
Family Income Brackets in Lake Petersburg
According to the Lake Petersburg family income data, there are 131 families falling into the $100,000 to $149,999 income range, which is the most common income bracket and makes up 51.0% of all families.
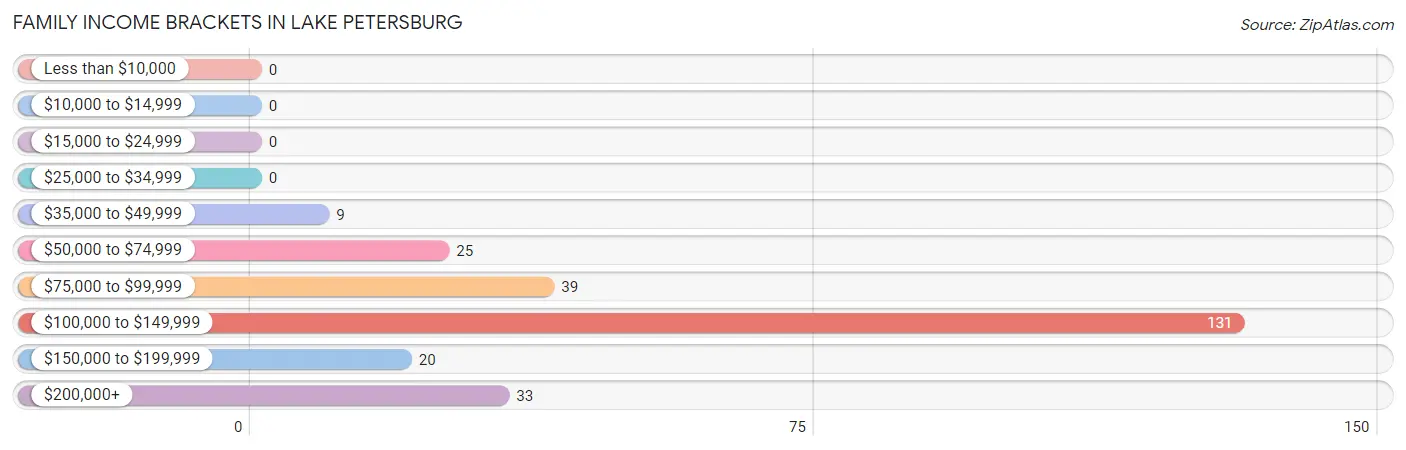
| Income Bracket | # Families | % Families |
| Less than $10,000 | 0 | 0.0% |
| $10,000 to $14,999 | 0 | 0.0% |
| $15,000 to $24,999 | 0 | 0.0% |
| $25,000 to $34,999 | 0 | 0.0% |
| $35,000 to $49,999 | 9 | 3.5% |
| $50,000 to $74,999 | 25 | 9.7% |
| $75,000 to $99,999 | 39 | 15.2% |
| $100,000 to $149,999 | 131 | 51.0% |
| $150,000 to $199,999 | 20 | 7.8% |
| $200,000+ | 33 | 12.8% |
Family Income by Famaliy Size in Lake Petersburg
4-person families (37 | 14.4%) account for the highest median family income in Lake Petersburg with $137,798 per family, while 2-person families (184 | 71.6%) have the highest median income of $67,738 per family member.
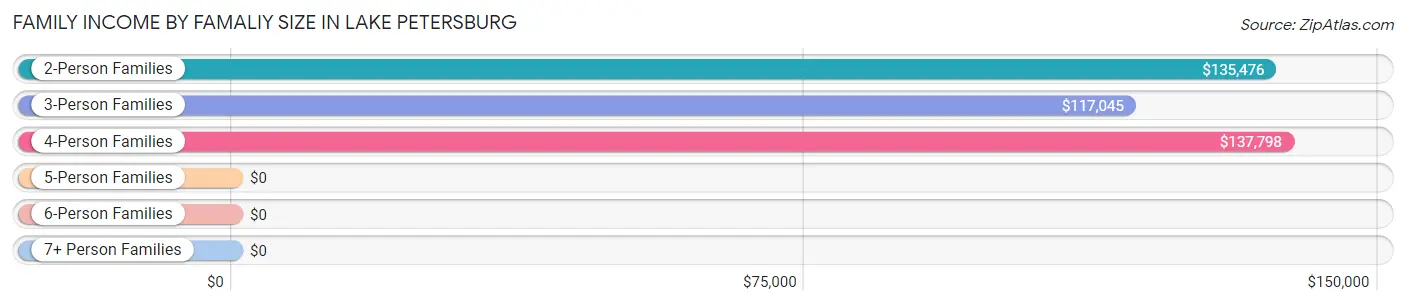
| Income Bracket | # Families | Median Income |
| 2-Person Families | 184 (71.6%) | $135,476 |
| 3-Person Families | 36 (14.0%) | $117,045 |
| 4-Person Families | 37 (14.4%) | $137,798 |
| 5-Person Families | 0 (0.0%) | $0 |
| 6-Person Families | 0 (0.0%) | $0 |
| 7+ Person Families | 0 (0.0%) | $0 |
| Total | 257 (100.0%) | $135,089 |
Family Income by Number of Earners in Lake Petersburg
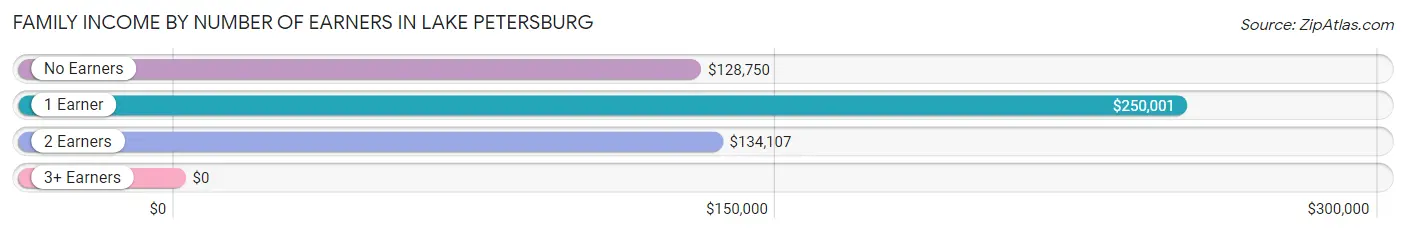
| Number of Earners | # Families | Median Income |
| No Earners | 94 (36.6%) | $128,750 |
| 1 Earner | 35 (13.6%) | $250,001 |
| 2 Earners | 119 (46.3%) | $134,107 |
| 3+ Earners | 9 (3.5%) | $0 |
| Total | 257 (100.0%) | $135,089 |
Household Income in Lake Petersburg
Household Income Brackets in Lake Petersburg
With 161 households falling in the category, the $100,000 to $149,999 income range is the most frequent in Lake Petersburg, accounting for 43.6% of all households.
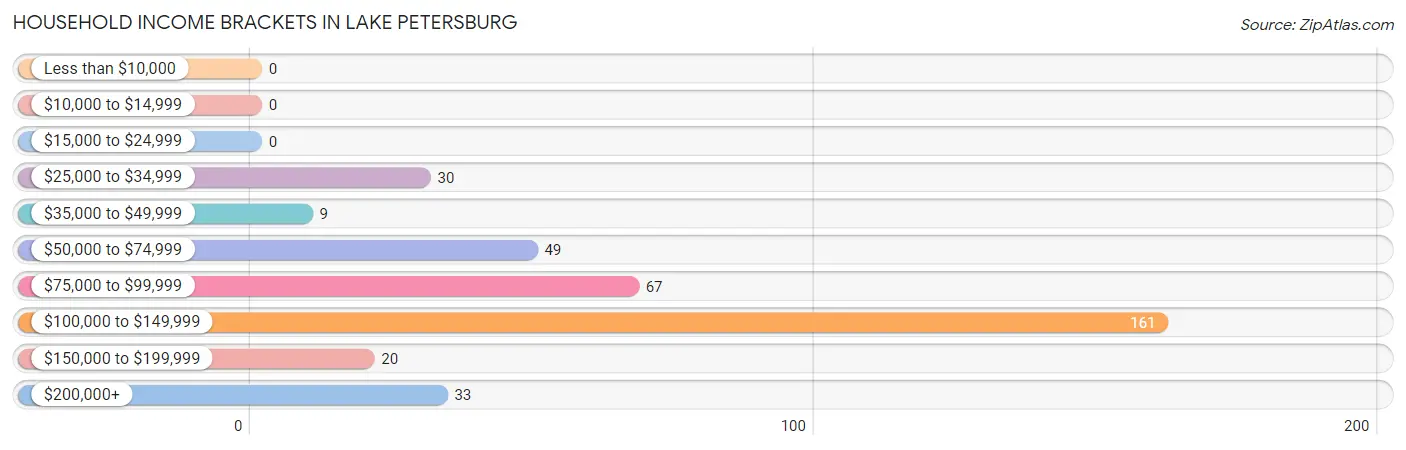
| Income Bracket | # Households | % Households |
| Less than $10,000 | 0 | 0.0% |
| $10,000 to $14,999 | 0 | 0.0% |
| $15,000 to $24,999 | 0 | 0.0% |
| $25,000 to $34,999 | 30 | 8.1% |
| $35,000 to $49,999 | 9 | 2.4% |
| $50,000 to $74,999 | 49 | 13.3% |
| $75,000 to $99,999 | 67 | 18.2% |
| $100,000 to $149,999 | 161 | 43.6% |
| $150,000 to $199,999 | 20 | 5.4% |
| $200,000+ | 33 | 8.9% |
Household Income by Householder Age in Lake Petersburg
The median household income in Lake Petersburg is $113,897, with the highest median household income of $143,750 found in the 45 to 64 years age bracket for the primary householder. A total of 117 households (31.7%) fall into this category.
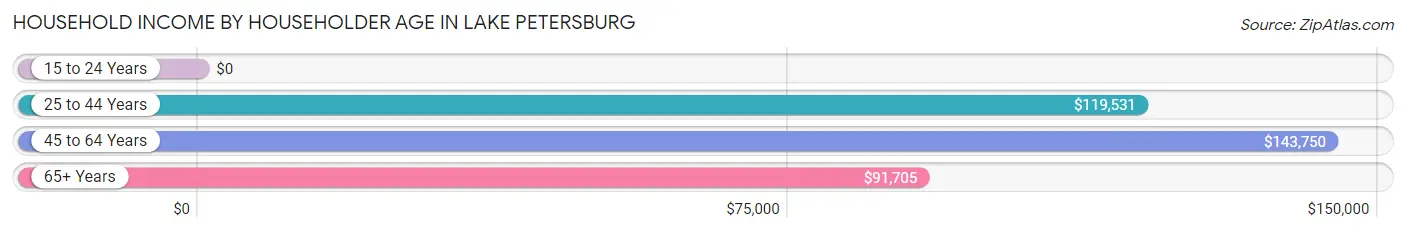
| Income Bracket | # Households | Median Income |
| 15 to 24 Years | 0 (0.0%) | $0 |
| 25 to 44 Years | 63 (17.1%) | $119,531 |
| 45 to 64 Years | 117 (31.7%) | $143,750 |
| 65+ Years | 189 (51.2%) | $91,705 |
| Total | 369 (100.0%) | $113,897 |
Poverty in Lake Petersburg
Income Below Poverty by Sex and Age in Lake Petersburg
| Age Bracket | Male | Female |
| Under 5 Years | 0 (0.0%) | 0 (0.0%) |
| 5 Years | 0 (0.0%) | 0 (0.0%) |
| 6 to 11 Years | 0 (0.0%) | 0 (0.0%) |
| 12 to 14 Years | 0 (0.0%) | 0 (0.0%) |
| 15 Years | 0 (0.0%) | 0 (0.0%) |
| 16 and 17 Years | 0 (0.0%) | 0 (0.0%) |
| 18 to 24 Years | 0 (0.0%) | 0 (0.0%) |
| 25 to 34 Years | 0 (0.0%) | 0 (0.0%) |
| 35 to 44 Years | 0 (0.0%) | 0 (0.0%) |
| 45 to 54 Years | 0 (0.0%) | 0 (0.0%) |
| 55 to 64 Years | 0 (0.0%) | 0 (0.0%) |
| 65 to 74 Years | 0 (0.0%) | 0 (0.0%) |
| 75 Years and over | 0 (0.0%) | 0 (0.0%) |
| Total | 0 (0.0%) | 0 (0.0%) |
Income Above Poverty by Sex and Age in Lake Petersburg
According to the poverty statistics in Lake Petersburg, males aged under 5 years and females aged under 5 years are the age groups that are most secure financially, with 100.0% of males and 100.0% of females in these age groups living above the poverty line.
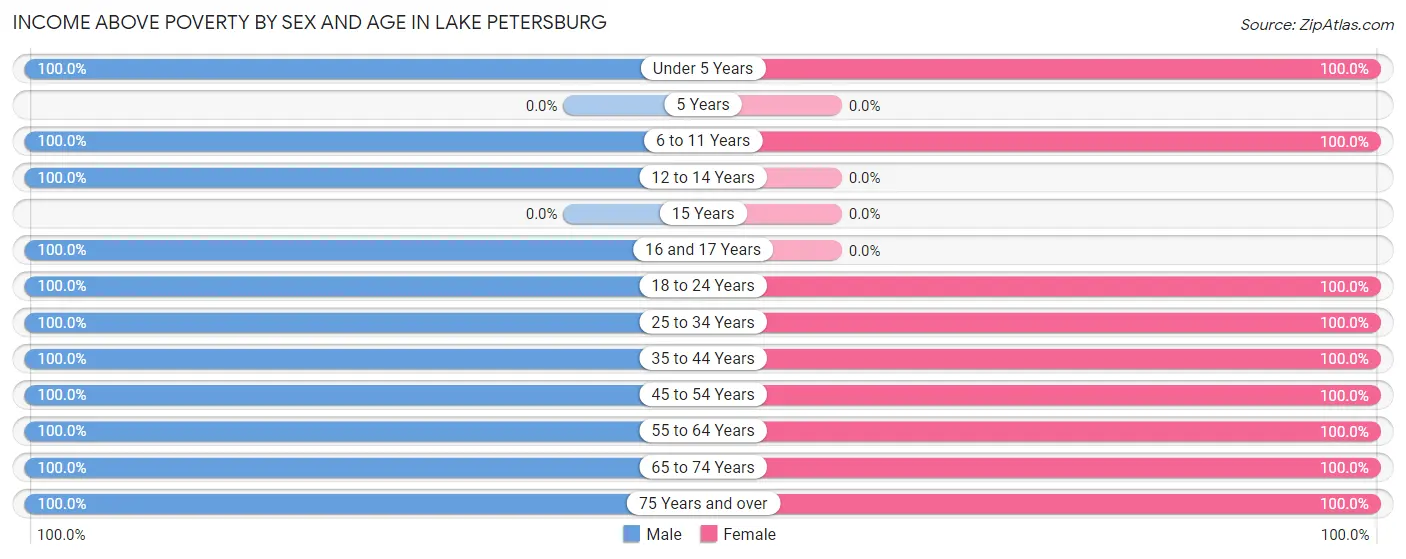
| Age Bracket | Male | Female |
| Under 5 Years | 14 (100.0%) | 25 (100.0%) |
| 5 Years | 0 (0.0%) | 0 (0.0%) |
| 6 to 11 Years | 22 (100.0%) | 24 (100.0%) |
| 12 to 14 Years | 9 (100.0%) | 0 (0.0%) |
| 15 Years | 0 (0.0%) | 0 (0.0%) |
| 16 and 17 Years | 8 (100.0%) | 0 (0.0%) |
| 18 to 24 Years | 8 (100.0%) | 7 (100.0%) |
| 25 to 34 Years | 30 (100.0%) | 52 (100.0%) |
| 35 to 44 Years | 8 (100.0%) | 16 (100.0%) |
| 45 to 54 Years | 55 (100.0%) | 36 (100.0%) |
| 55 to 64 Years | 93 (100.0%) | 76 (100.0%) |
| 65 to 74 Years | 102 (100.0%) | 97 (100.0%) |
| 75 Years and over | 38 (100.0%) | 43 (100.0%) |
| Total | 387 (100.0%) | 376 (100.0%) |
Income Below Poverty Among Married-Couple Families in Lake Petersburg
| Children | Above Poverty | Below Poverty |
| No Children | 193 (100.0%) | 0 (0.0%) |
| 1 or 2 Children | 55 (100.0%) | 0 (0.0%) |
| 3 or 4 Children | 0 (0.0%) | 0 (0.0%) |
| 5 or more Children | 0 (0.0%) | 0 (0.0%) |
| Total | 248 (100.0%) | 0 (0.0%) |
Income Below Poverty Among Single-Parent Households in Lake Petersburg
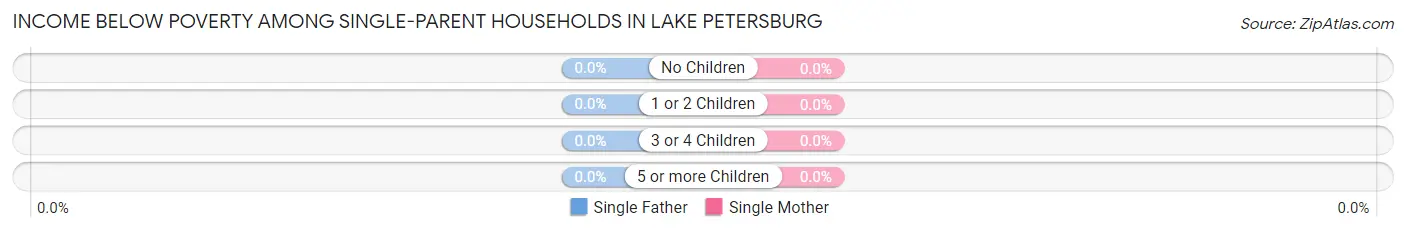
| Children | Single Father | Single Mother |
| No Children | 0 (0.0%) | 0 (0.0%) |
| 1 or 2 Children | 0 (0.0%) | 0 (0.0%) |
| 3 or 4 Children | 0 (0.0%) | 0 (0.0%) |
| 5 or more Children | 0 (0.0%) | 0 (0.0%) |
| Total | 0 (0.0%) | 0 (0.0%) |
Income Below Poverty Among Married-Couple vs Single-Parent Households in Lake Petersburg
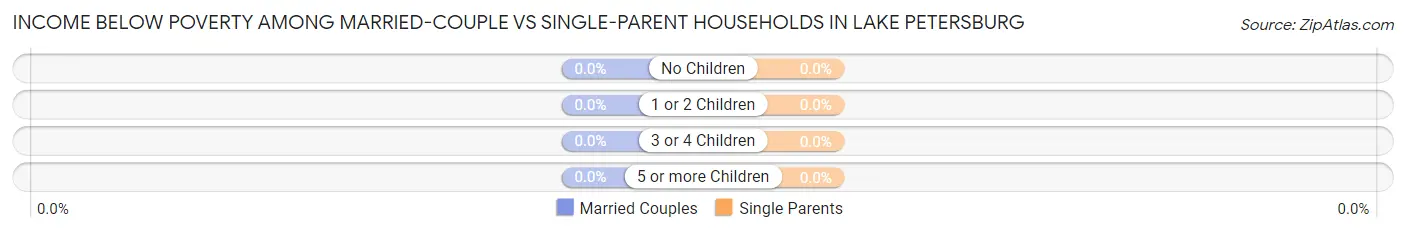
| Children | Married-Couple Families | Single-Parent Households |
| No Children | 0 (0.0%) | 0 (0.0%) |
| 1 or 2 Children | 0 (0.0%) | 0 (0.0%) |
| 3 or 4 Children | 0 (0.0%) | 0 (0.0%) |
| 5 or more Children | 0 (0.0%) | 0 (0.0%) |
| Total | 0 (0.0%) | 0 (0.0%) |
Race in Lake Petersburg
The most populous races in Lake Petersburg are White / Caucasian (714 | 93.6%), Two or more Races (32 | 4.2%), and Hispanic or Latino (24 | 3.2%).
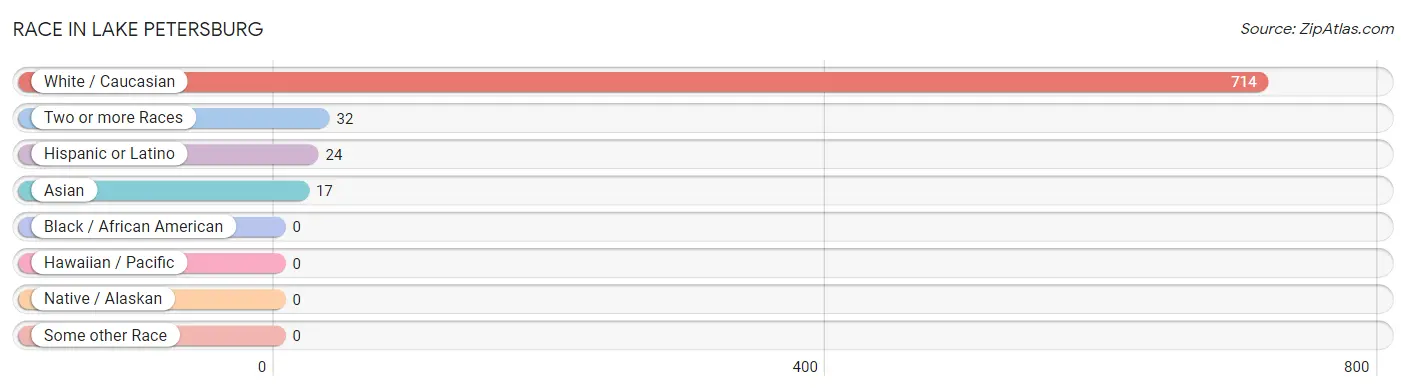
| Race | # Population | % Population |
| Asian | 17 | 2.2% |
| Black / African American | 0 | 0.0% |
| Hawaiian / Pacific | 0 | 0.0% |
| Hispanic or Latino | 24 | 3.2% |
| Native / Alaskan | 0 | 0.0% |
| White / Caucasian | 714 | 93.6% |
| Two or more Races | 32 | 4.2% |
| Some other Race | 0 | 0.0% |
| Total | 763 | 100.0% |
Ancestry in Lake Petersburg
The most populous ancestries reported in Lake Petersburg are German (182 | 23.8%), English (160 | 21.0%), Irish (104 | 13.6%), Italian (87 | 11.4%), and American (59 | 7.7%), together accounting for 77.6% of all Lake Petersburg residents.
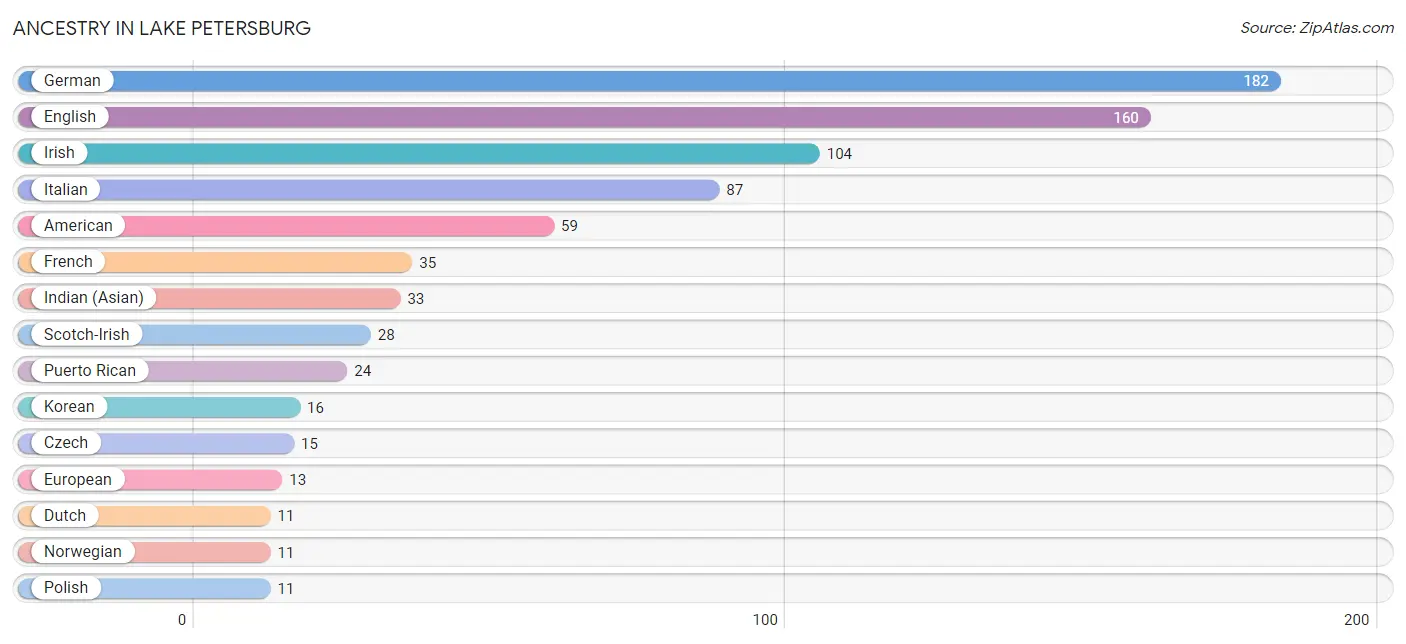
| Ancestry | # Population | % Population |
| American | 59 | 7.7% |
| Czech | 15 | 2.0% |
| Danish | 10 | 1.3% |
| Dutch | 11 | 1.4% |
| English | 160 | 21.0% |
| European | 13 | 1.7% |
| French | 35 | 4.6% |
| German | 182 | 23.8% |
| Indian (Asian) | 33 | 4.3% |
| Irish | 104 | 13.6% |
| Italian | 87 | 11.4% |
| Korean | 16 | 2.1% |
| Lithuanian | 7 | 0.9% |
| Norwegian | 11 | 1.4% |
| Polish | 11 | 1.4% |
| Puerto Rican | 24 | 3.2% |
| Scotch-Irish | 28 | 3.7% |
| Scottish | 11 | 1.4% |
| Swedish | 10 | 1.3% | View All 19 Rows |
Immigrants in Lake Petersburg
The most numerous immigrant groups reported in Lake Petersburg came from Asia (17 | 2.2%), Europe (12 | 1.6%), France (12 | 1.6%), Western Europe (12 | 1.6%), and China (9 | 1.2%), together accounting for 8.1% of all Lake Petersburg residents.
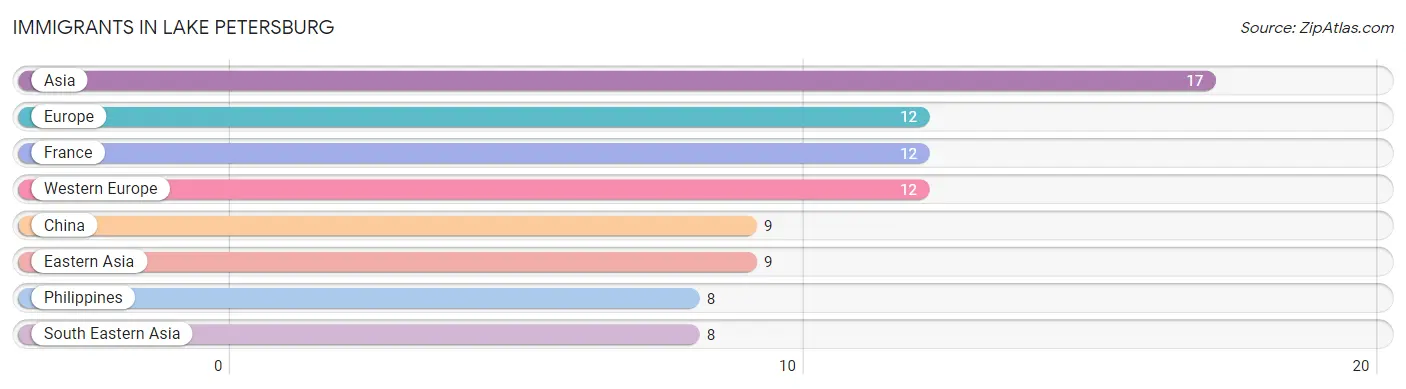
| Immigration Origin | # Population | % Population |
| Asia | 17 | 2.2% |
| China | 9 | 1.2% |
| Eastern Asia | 9 | 1.2% |
| Europe | 12 | 1.6% |
| France | 12 | 1.6% |
| Philippines | 8 | 1.1% |
| South Eastern Asia | 8 | 1.1% |
| Western Europe | 12 | 1.6% | View All 8 Rows |
Sex and Age in Lake Petersburg
Sex and Age in Lake Petersburg
The most populous age groups in Lake Petersburg are 70 to 74 Years (78 | 20.2%) for men and 65 to 69 Years (78 | 20.7%) for women.
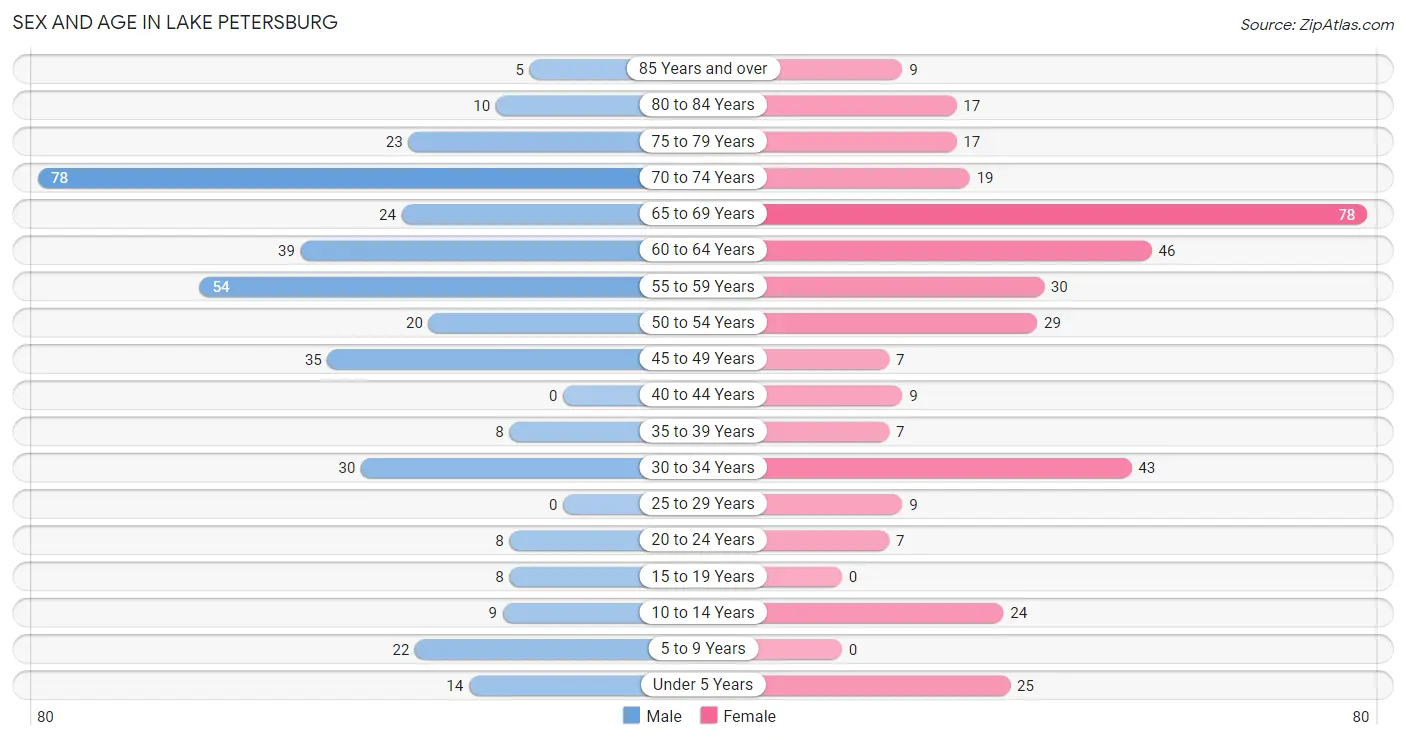
| Age Bracket | Male | Female |
| Under 5 Years | 14 (3.6%) | 25 (6.7%) |
| 5 to 9 Years | 22 (5.7%) | 0 (0.0%) |
| 10 to 14 Years | 9 (2.3%) | 24 (6.4%) |
| 15 to 19 Years | 8 (2.1%) | 0 (0.0%) |
| 20 to 24 Years | 8 (2.1%) | 7 (1.9%) |
| 25 to 29 Years | 0 (0.0%) | 9 (2.4%) |
| 30 to 34 Years | 30 (7.7%) | 43 (11.4%) |
| 35 to 39 Years | 8 (2.1%) | 7 (1.9%) |
| 40 to 44 Years | 0 (0.0%) | 9 (2.4%) |
| 45 to 49 Years | 35 (9.0%) | 7 (1.9%) |
| 50 to 54 Years | 20 (5.2%) | 29 (7.7%) |
| 55 to 59 Years | 54 (14.0%) | 30 (8.0%) |
| 60 to 64 Years | 39 (10.1%) | 46 (12.2%) |
| 65 to 69 Years | 24 (6.2%) | 78 (20.7%) |
| 70 to 74 Years | 78 (20.2%) | 19 (5.1%) |
| 75 to 79 Years | 23 (5.9%) | 17 (4.5%) |
| 80 to 84 Years | 10 (2.6%) | 17 (4.5%) |
| 85 Years and over | 5 (1.3%) | 9 (2.4%) |
| Total | 387 (100.0%) | 376 (100.0%) |
Families and Households in Lake Petersburg
Median Family Size in Lake Petersburg
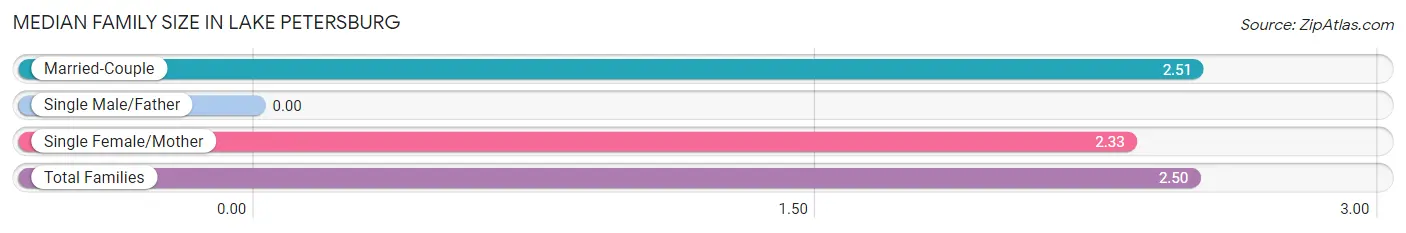
| Family Type | # Families | Family Size |
| Married-Couple | 248 (96.5%) | 2.51 |
| Single Male/Father | 0 (0.0%) | - |
| Single Female/Mother | 9 (3.5%) | 2.33 |
| Total Families | 257 (100.0%) | 2.50 |
Median Household Size in Lake Petersburg
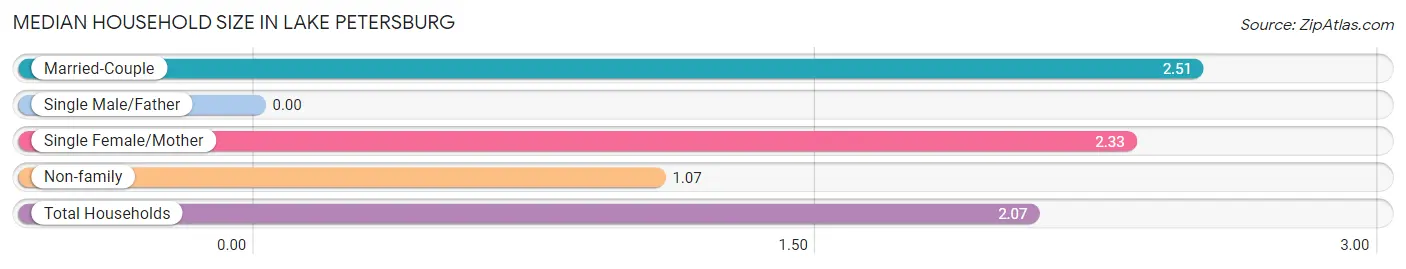
| Household Type | # Households | Household Size |
| Married-Couple | 248 (67.2%) | 2.51 |
| Single Male/Father | 0 (0.0%) | - |
| Single Female/Mother | 9 (2.4%) | 2.33 |
| Non-family | 112 (30.3%) | 1.07 |
| Total Households | 369 (100.0%) | 2.07 |
Household Size by Marriage Status in Lake Petersburg
Out of a total of 369 households in Lake Petersburg, 257 (69.7%) are family households, while 112 (30.3%) are nonfamily households. The most numerous type of family households are 2-person households, comprising 184, and the most common type of nonfamily households are 1-person households, comprising 104.
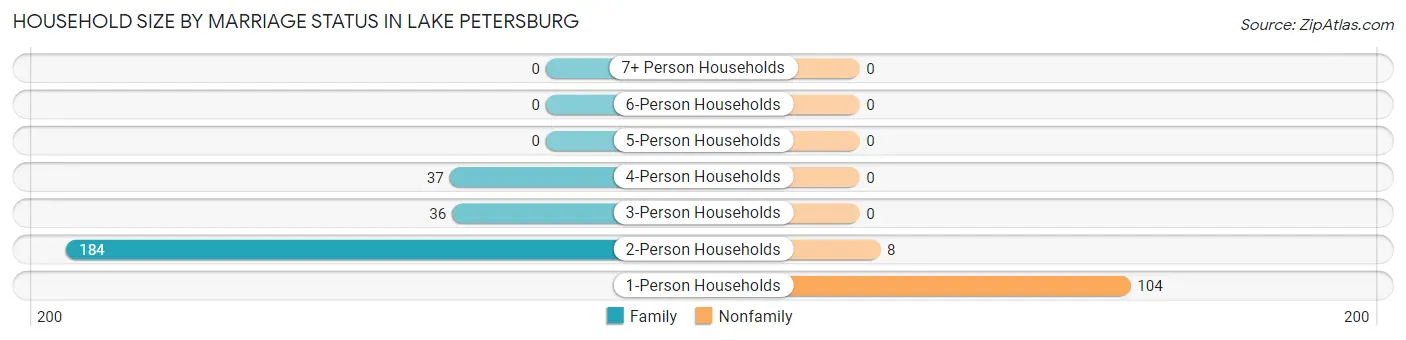
| Household Size | Family Households | Nonfamily Households |
| 1-Person Households | - | 104 (28.2%) |
| 2-Person Households | 184 (49.9%) | 8 (2.2%) |
| 3-Person Households | 36 (9.8%) | 0 (0.0%) |
| 4-Person Households | 37 (10.0%) | 0 (0.0%) |
| 5-Person Households | 0 (0.0%) | 0 (0.0%) |
| 6-Person Households | 0 (0.0%) | 0 (0.0%) |
| 7+ Person Households | 0 (0.0%) | 0 (0.0%) |
| Total | 257 (69.7%) | 112 (30.3%) |
Female Fertility in Lake Petersburg
Fertility by Age in Lake Petersburg
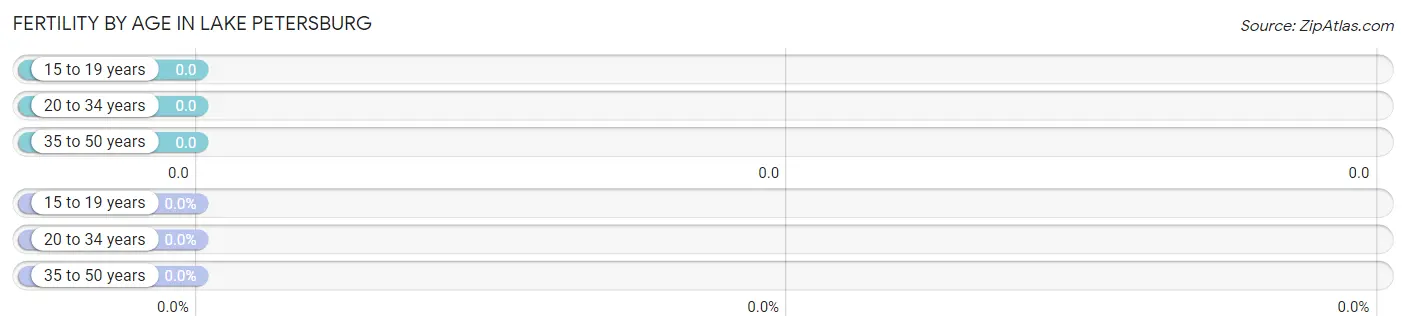
| Age Bracket | Women with Births | Births / 1,000 Women |
| 15 to 19 years | 0 (0.0%) | 0.0 |
| 20 to 34 years | 0 (0.0%) | 0.0 |
| 35 to 50 years | 0 (0.0%) | 0.0 |
| Total | 0 (0.0%) | 0.0 |
Fertility by Age by Marriage Status in Lake Petersburg
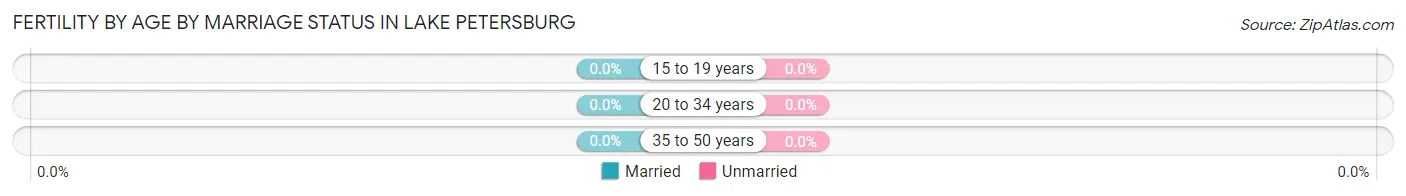
| Age Bracket | Married | Unmarried |
| 15 to 19 years | 0 (0.0%) | 0 (0.0%) |
| 20 to 34 years | 0 (0.0%) | 0 (0.0%) |
| 35 to 50 years | 0 (0.0%) | 0 (0.0%) |
| Total | 0 (0.0%) | 0 (0.0%) |
Fertility by Education in Lake Petersburg
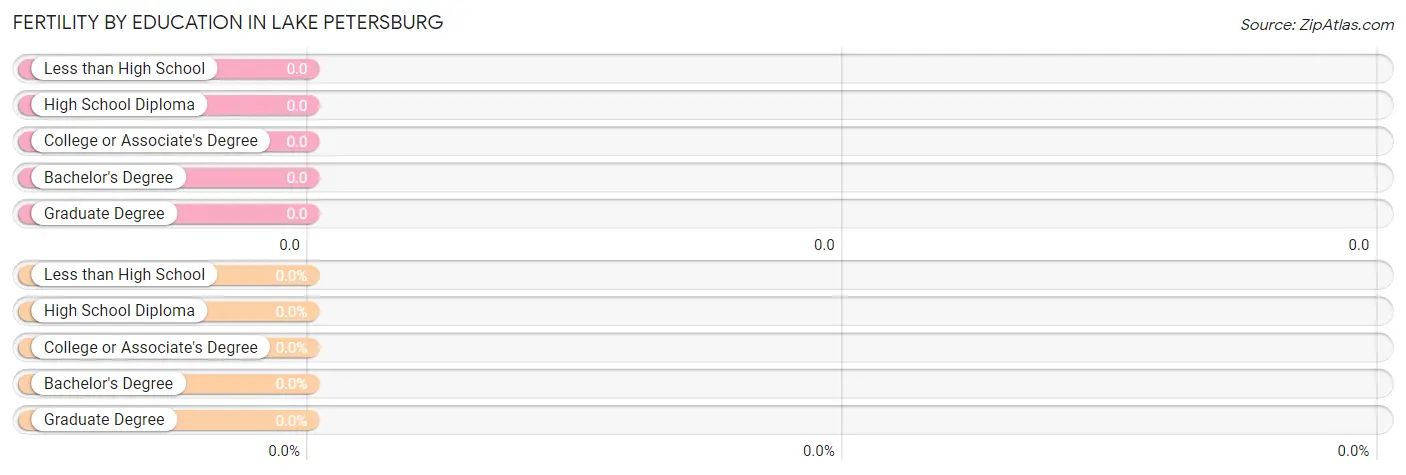
| Educational Attainment | Women with Births | Births / 1,000 Women |
| Less than High School | 0 (0.0%) | 0.0 |
| High School Diploma | 0 (0.0%) | 0.0 |
| College or Associate's Degree | 0 (0.0%) | 0.0 |
| Bachelor's Degree | 0 (0.0%) | 0.0 |
| Graduate Degree | 0 (0.0%) | 0.0 |
| Total | 0 (0.0%) | 0.0 |
Fertility by Education by Marriage Status in Lake Petersburg
| Educational Attainment | Married | Unmarried |
| Less than High School | 0 (0.0%) | 0 (0.0%) |
| High School Diploma | 0 (0.0%) | 0 (0.0%) |
| College or Associate's Degree | 0 (0.0%) | 0 (0.0%) |
| Bachelor's Degree | 0 (0.0%) | 0 (0.0%) |
| Graduate Degree | 0 (0.0%) | 0 (0.0%) |
| Total | 0 (0.0%) | 0 (0.0%) |
Employment Characteristics in Lake Petersburg
Employment by Class of Employer in Lake Petersburg
Among the 346 employed individuals in Lake Petersburg, private company employees (229 | 66.2%), local government employees (37 | 10.7%), and not-for-profit organizations (33 | 9.5%) make up the most common classes of employment.
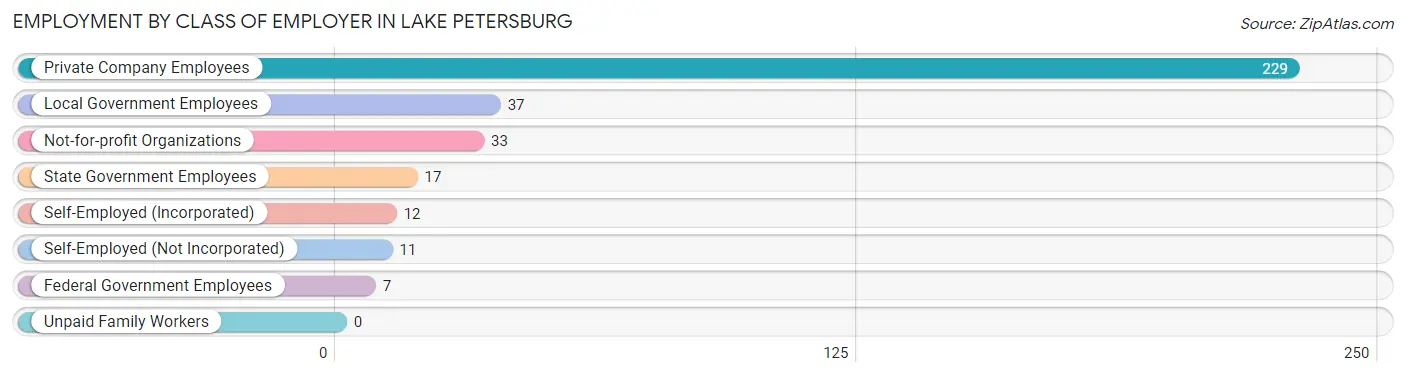
| Employer Class | # Employees | % Employees |
| Private Company Employees | 229 | 66.2% |
| Self-Employed (Incorporated) | 12 | 3.5% |
| Self-Employed (Not Incorporated) | 11 | 3.2% |
| Not-for-profit Organizations | 33 | 9.5% |
| Local Government Employees | 37 | 10.7% |
| State Government Employees | 17 | 4.9% |
| Federal Government Employees | 7 | 2.0% |
| Unpaid Family Workers | 0 | 0.0% |
| Total | 346 | 100.0% |
Employment Status by Age in Lake Petersburg
According to the labor force statistics for Lake Petersburg, out of the total population over 16 years of age (669), 52.9% or 354 individuals are in the labor force, with 2.3% or 8 of them unemployed. The age group with the highest labor force participation rate is 25 to 29 years, with 100.0% or 9 individuals in the labor force. Within the labor force, the 20 to 24 years age range has the highest percentage of unemployed individuals, with 100.0% or 8 of them being unemployed.
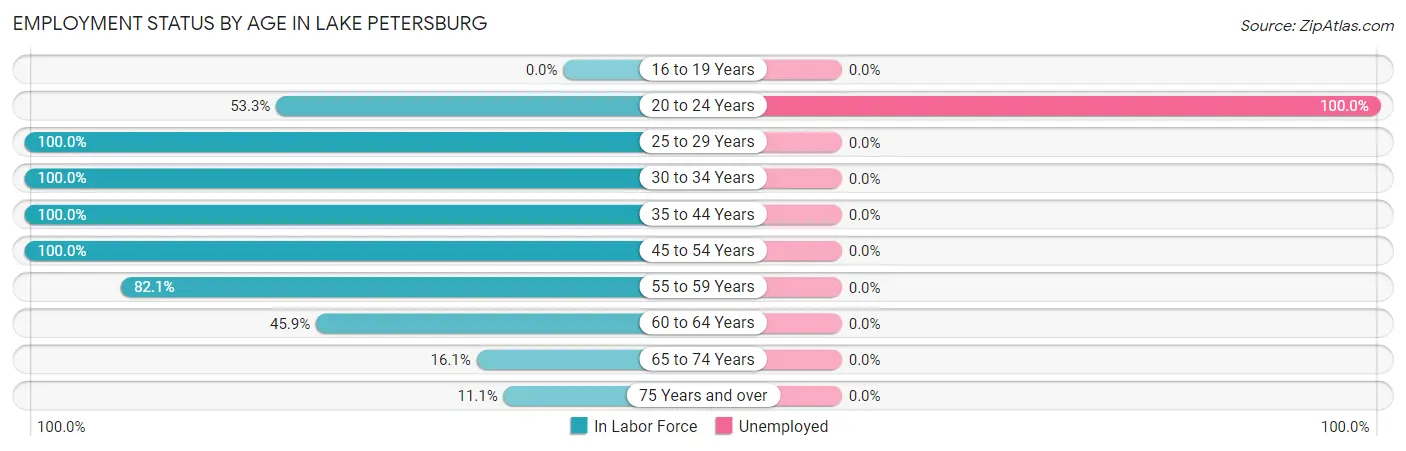
| Age Bracket | In Labor Force | Unemployed |
| 16 to 19 Years | 0 (0.0%) | 0 (0.0%) |
| 20 to 24 Years | 8 (53.3%) | 8 (100.0%) |
| 25 to 29 Years | 9 (100.0%) | 0 (0.0%) |
| 30 to 34 Years | 73 (100.0%) | 0 (0.0%) |
| 35 to 44 Years | 24 (100.0%) | 0 (0.0%) |
| 45 to 54 Years | 91 (100.0%) | 0 (0.0%) |
| 55 to 59 Years | 69 (82.1%) | 0 (0.0%) |
| 60 to 64 Years | 39 (45.9%) | 0 (0.0%) |
| 65 to 74 Years | 32 (16.1%) | 0 (0.0%) |
| 75 Years and over | 9 (11.1%) | 0 (0.0%) |
| Total | 354 (52.9%) | 8 (2.3%) |
Employment Status by Educational Attainment in Lake Petersburg
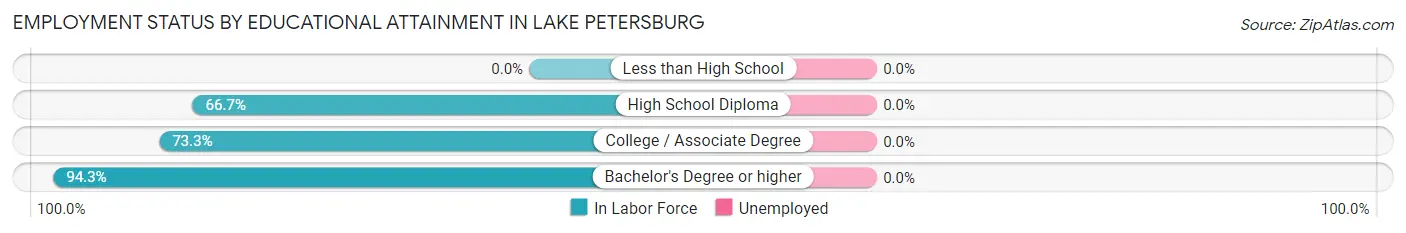
| Educational Attainment | In Labor Force | Unemployed |
| Less than High School | 0 (0.0%) | 0 (0.0%) |
| High School Diploma | 36 (66.7%) | 0 (0.0%) |
| College / Associate Degree | 88 (73.3%) | 0 (0.0%) |
| Bachelor's Degree or higher | 181 (94.3%) | 0 (0.0%) |
| Total | 305 (83.3%) | 0 (0.0%) |
Employment Occupations by Sex in Lake Petersburg
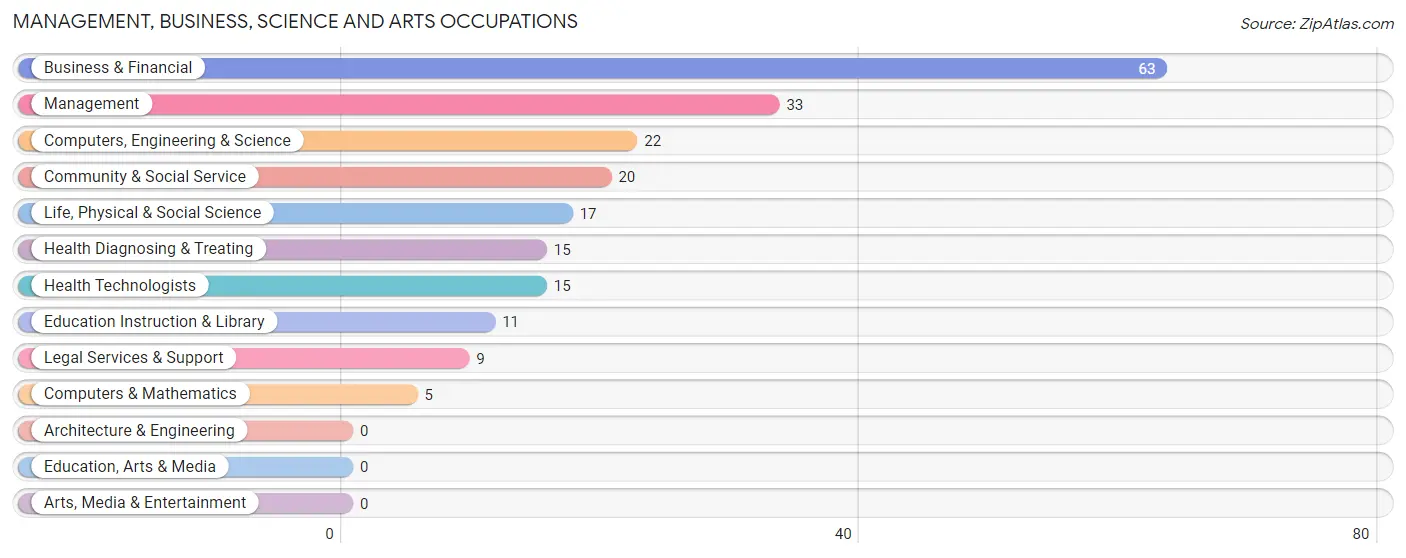
Management, Business, Science and Arts Occupations
The most common Management, Business, Science and Arts occupations in Lake Petersburg are Business & Financial (63 | 18.2%), Management (33 | 9.5%), Computers, Engineering & Science (22 | 6.4%), Community & Social Service (20 | 5.8%), and Life, Physical & Social Science (17 | 4.9%).
Management, Business, Science and Arts Occupations by Sex
Within the Management, Business, Science and Arts occupations in Lake Petersburg, the most male-oriented occupations are Management (100.0%), Computers & Mathematics (100.0%), and Business & Financial (42.9%), while the most female-oriented occupations are Life, Physical & Social Science (100.0%), Community & Social Service (100.0%), and Legal Services & Support (100.0%).
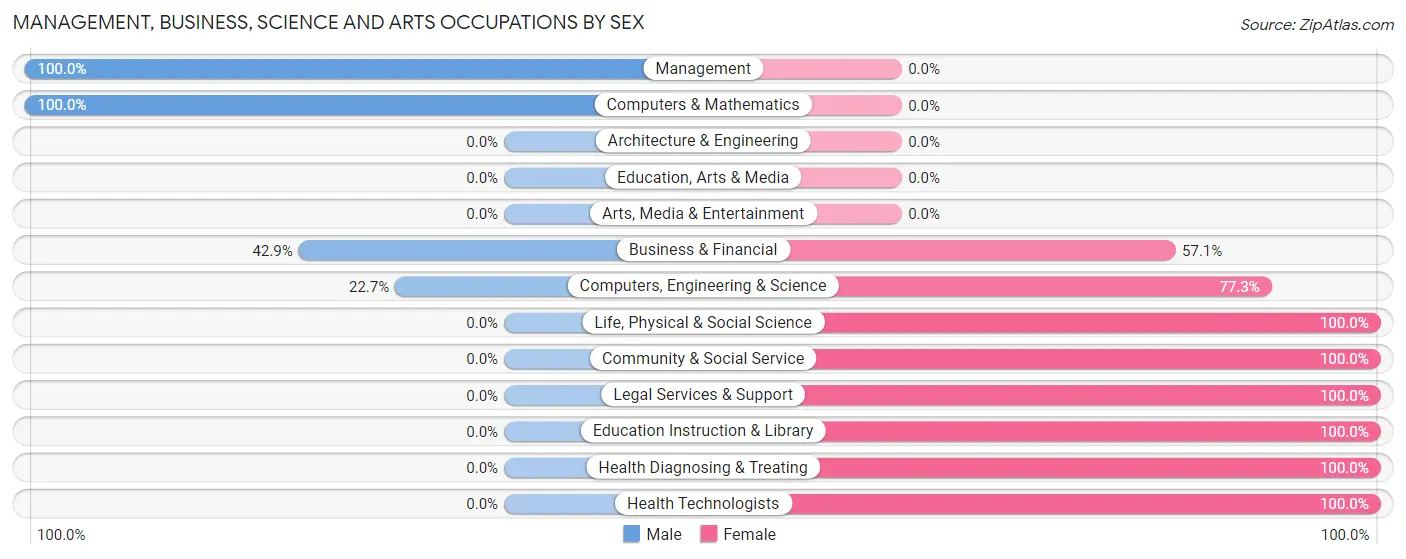
| Occupation | Male | Female |
| Management | 33 (100.0%) | 0 (0.0%) |
| Business & Financial | 27 (42.9%) | 36 (57.1%) |
| Computers, Engineering & Science | 5 (22.7%) | 17 (77.3%) |
| Computers & Mathematics | 5 (100.0%) | 0 (0.0%) |
| Architecture & Engineering | 0 (0.0%) | 0 (0.0%) |
| Life, Physical & Social Science | 0 (0.0%) | 17 (100.0%) |
| Community & Social Service | 0 (0.0%) | 20 (100.0%) |
| Education, Arts & Media | 0 (0.0%) | 0 (0.0%) |
| Legal Services & Support | 0 (0.0%) | 9 (100.0%) |
| Education Instruction & Library | 0 (0.0%) | 11 (100.0%) |
| Arts, Media & Entertainment | 0 (0.0%) | 0 (0.0%) |
| Health Diagnosing & Treating | 0 (0.0%) | 15 (100.0%) |
| Health Technologists | 0 (0.0%) | 15 (100.0%) |
| Total (Category) | 65 (42.5%) | 88 (57.5%) |
| Total (Overall) | 187 (54.0%) | 159 (46.0%) |
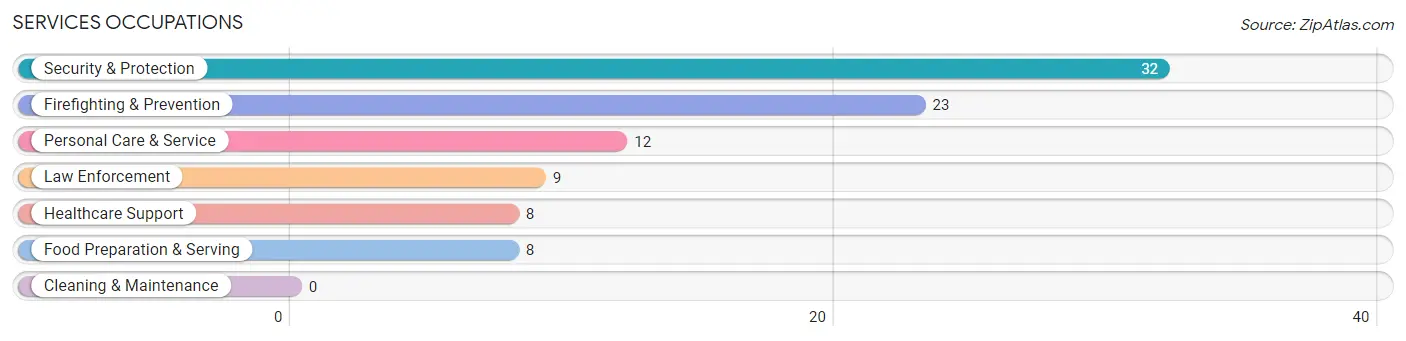
Services Occupations
The most common Services occupations in Lake Petersburg are Security & Protection (32 | 9.2%), Firefighting & Prevention (23 | 6.7%), Personal Care & Service (12 | 3.5%), Law Enforcement (9 | 2.6%), and Healthcare Support (8 | 2.3%).
Services Occupations by Sex
Within the Services occupations in Lake Petersburg, the most male-oriented occupations are Law Enforcement (100.0%), Security & Protection (68.8%), and Firefighting & Prevention (56.5%), while the most female-oriented occupations are Healthcare Support (100.0%), Food Preparation & Serving (100.0%), and Personal Care & Service (100.0%).
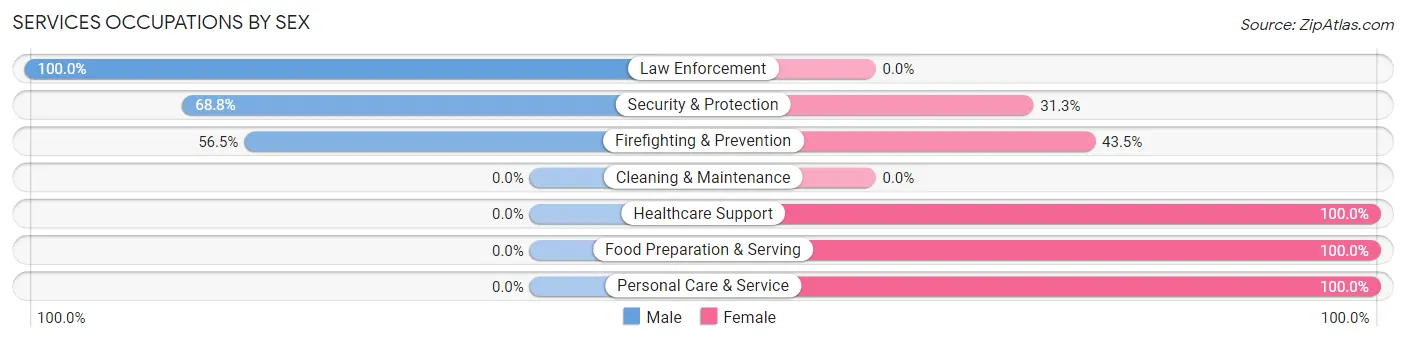
| Occupation | Male | Female |
| Healthcare Support | 0 (0.0%) | 8 (100.0%) |
| Security & Protection | 22 (68.8%) | 10 (31.2%) |
| Firefighting & Prevention | 13 (56.5%) | 10 (43.5%) |
| Law Enforcement | 9 (100.0%) | 0 (0.0%) |
| Food Preparation & Serving | 0 (0.0%) | 8 (100.0%) |
| Cleaning & Maintenance | 0 (0.0%) | 0 (0.0%) |
| Personal Care & Service | 0 (0.0%) | 12 (100.0%) |
| Total (Category) | 22 (36.7%) | 38 (63.3%) |
| Total (Overall) | 187 (54.0%) | 159 (46.0%) |
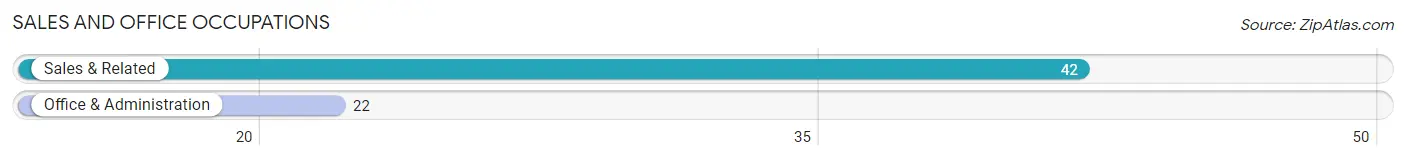
Sales and Office Occupations
The most common Sales and Office occupations in Lake Petersburg are Sales & Related (42 | 12.1%), and Office & Administration (22 | 6.4%).
Sales and Office Occupations by Sex
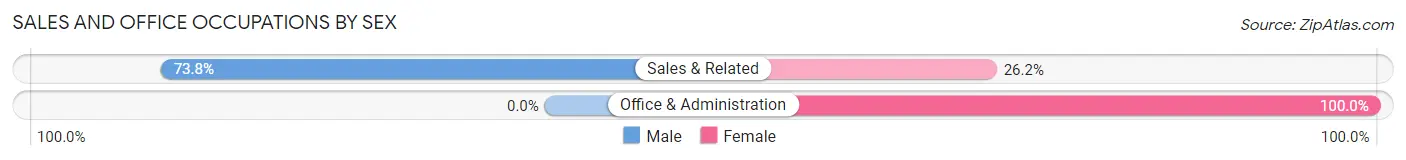
| Occupation | Male | Female |
| Sales & Related | 31 (73.8%) | 11 (26.2%) |
| Office & Administration | 0 (0.0%) | 22 (100.0%) |
| Total (Category) | 31 (48.4%) | 33 (51.6%) |
| Total (Overall) | 187 (54.0%) | 159 (46.0%) |
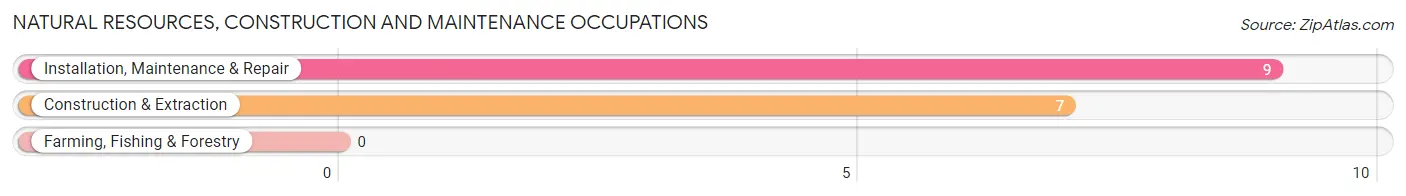
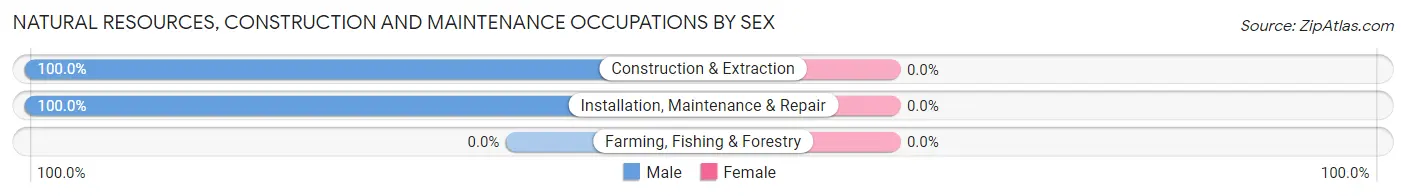
Natural Resources, Construction and Maintenance Occupations
The most common Natural Resources, Construction and Maintenance occupations in Lake Petersburg are Installation, Maintenance & Repair (9 | 2.6%), and Construction & Extraction (7 | 2.0%).
Natural Resources, Construction and Maintenance Occupations by Sex
| Occupation | Male | Female |
| Farming, Fishing & Forestry | 0 (0.0%) | 0 (0.0%) |
| Construction & Extraction | 7 (100.0%) | 0 (0.0%) |
| Installation, Maintenance & Repair | 9 (100.0%) | 0 (0.0%) |
| Total (Category) | 16 (100.0%) | 0 (0.0%) |
| Total (Overall) | 187 (54.0%) | 159 (46.0%) |
Production, Transportation and Moving Occupations
The most common Production, Transportation and Moving occupations in Lake Petersburg are Production (35 | 10.1%), and Transportation (18 | 5.2%).
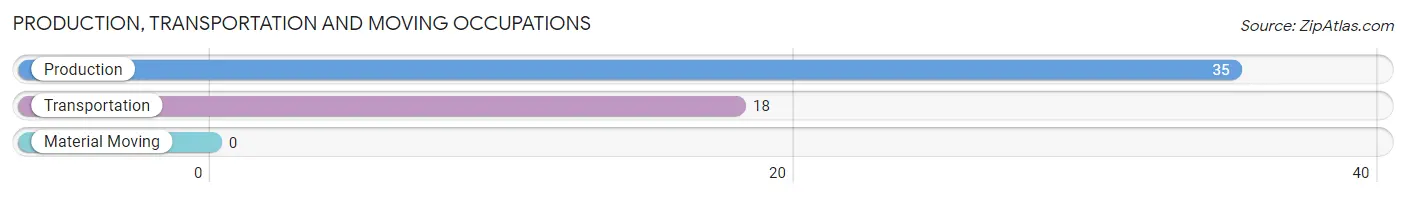
Production, Transportation and Moving Occupations by Sex
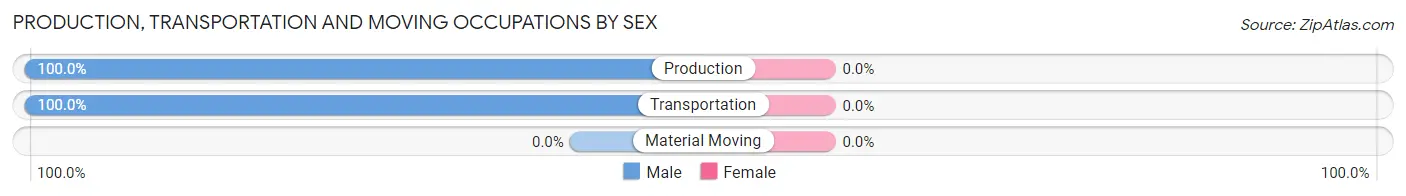
| Occupation | Male | Female |
| Production | 35 (100.0%) | 0 (0.0%) |
| Transportation | 18 (100.0%) | 0 (0.0%) |
| Material Moving | 0 (0.0%) | 0 (0.0%) |
| Total (Category) | 53 (100.0%) | 0 (0.0%) |
| Total (Overall) | 187 (54.0%) | 159 (46.0%) |
Employment Industries by Sex in Lake Petersburg
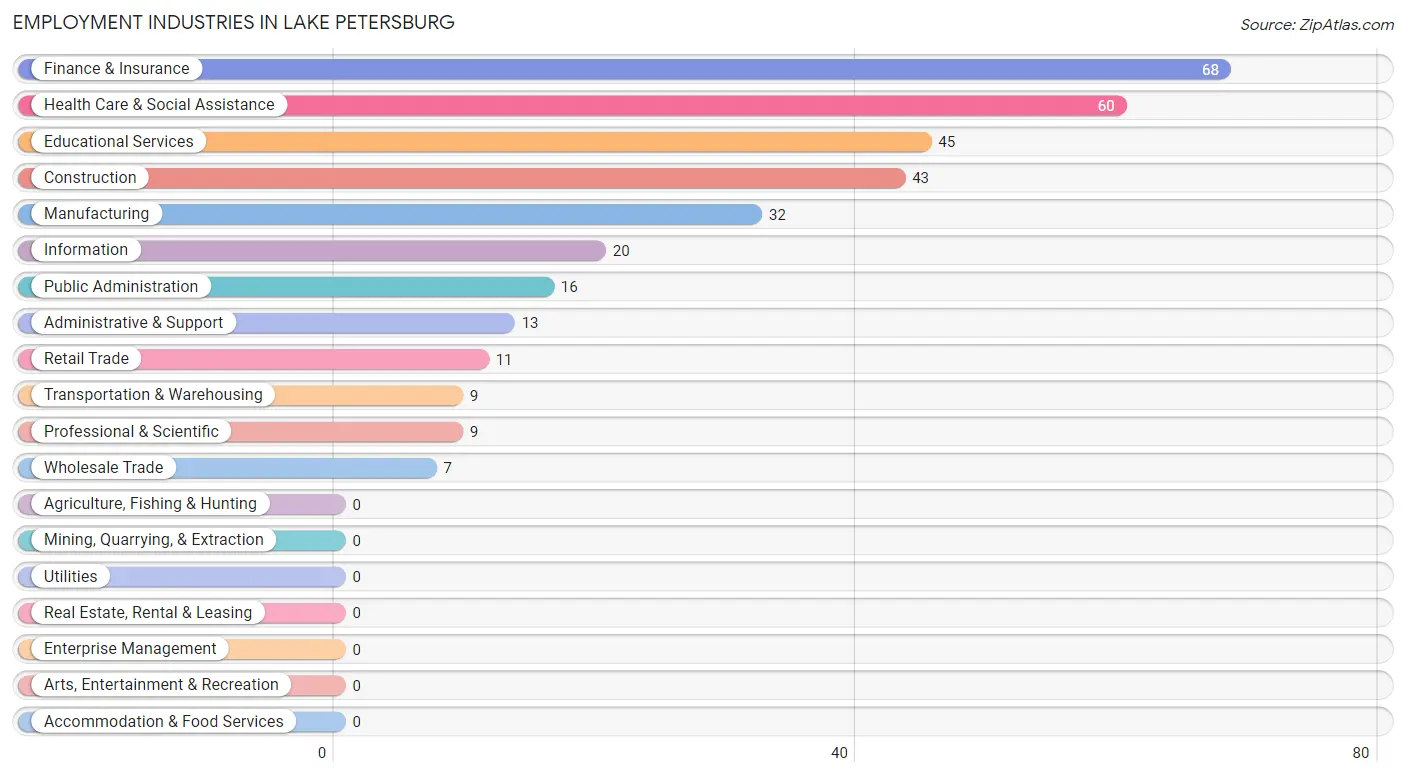
Employment Industries in Lake Petersburg
The major employment industries in Lake Petersburg include Finance & Insurance (68 | 19.7%), Health Care & Social Assistance (60 | 17.3%), Educational Services (45 | 13.0%), Construction (43 | 12.4%), and Manufacturing (32 | 9.2%).
Employment Industries by Sex in Lake Petersburg
The Lake Petersburg industries that see more men than women are Construction (100.0%), Wholesale Trade (100.0%), and Transportation & Warehousing (100.0%), whereas the industries that tend to have a higher number of women are Retail Trade (100.0%), Professional & Scientific (100.0%), and Health Care & Social Assistance (100.0%).
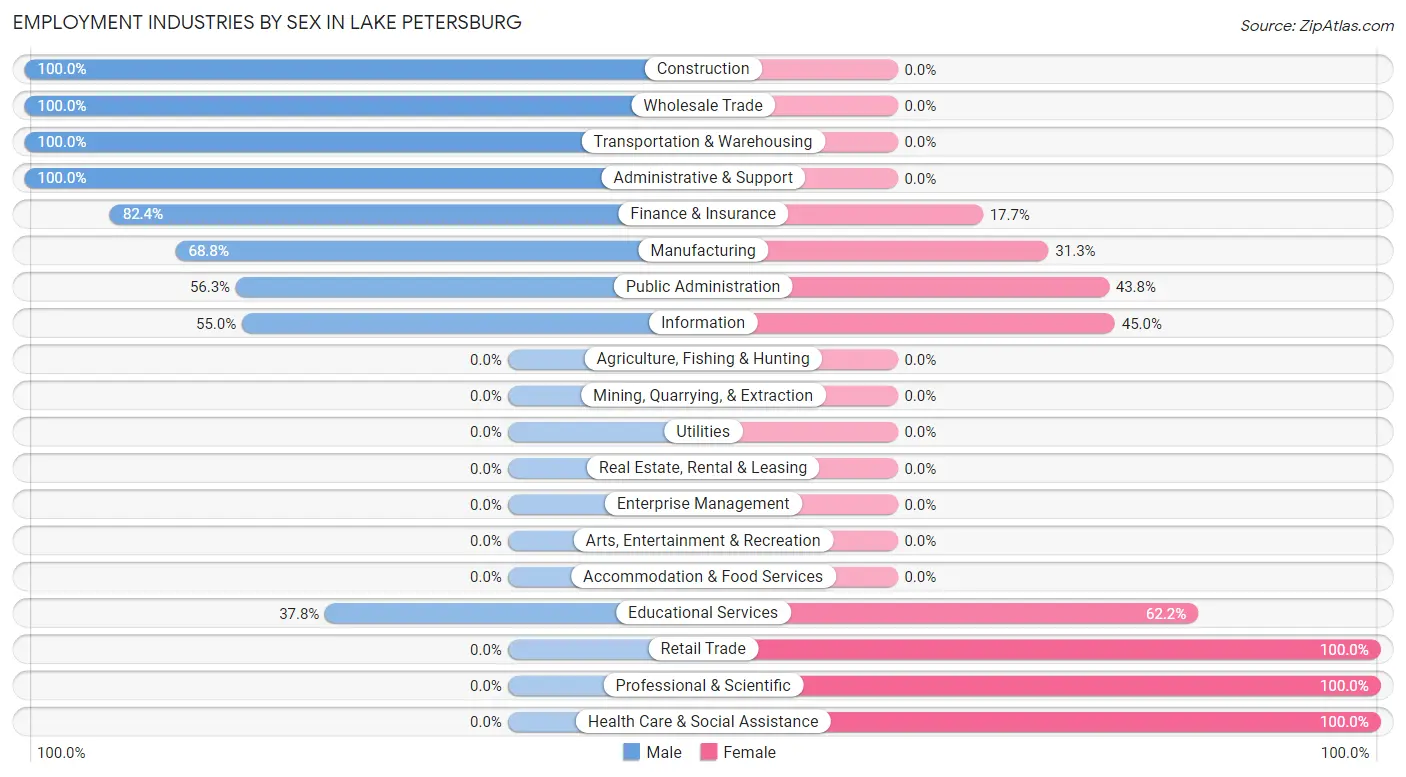
| Industry | Male | Female |
| Agriculture, Fishing & Hunting | 0 (0.0%) | 0 (0.0%) |
| Mining, Quarrying, & Extraction | 0 (0.0%) | 0 (0.0%) |
| Construction | 43 (100.0%) | 0 (0.0%) |
| Manufacturing | 22 (68.8%) | 10 (31.2%) |
| Wholesale Trade | 7 (100.0%) | 0 (0.0%) |
| Retail Trade | 0 (0.0%) | 11 (100.0%) |
| Transportation & Warehousing | 9 (100.0%) | 0 (0.0%) |
| Utilities | 0 (0.0%) | 0 (0.0%) |
| Information | 11 (55.0%) | 9 (45.0%) |
| Finance & Insurance | 56 (82.4%) | 12 (17.6%) |
| Real Estate, Rental & Leasing | 0 (0.0%) | 0 (0.0%) |
| Professional & Scientific | 0 (0.0%) | 9 (100.0%) |
| Enterprise Management | 0 (0.0%) | 0 (0.0%) |
| Administrative & Support | 13 (100.0%) | 0 (0.0%) |
| Educational Services | 17 (37.8%) | 28 (62.2%) |
| Health Care & Social Assistance | 0 (0.0%) | 60 (100.0%) |
| Arts, Entertainment & Recreation | 0 (0.0%) | 0 (0.0%) |
| Accommodation & Food Services | 0 (0.0%) | 0 (0.0%) |
| Public Administration | 9 (56.2%) | 7 (43.8%) |
| Total | 187 (54.0%) | 159 (46.0%) |
Education in Lake Petersburg
School Enrollment in Lake Petersburg
The most common levels of schooling among the 95 students in Lake Petersburg are middle school (33 | 34.7%), kindergarten (22 | 23.2%), and college / undergraduate (18 | 19.0%).
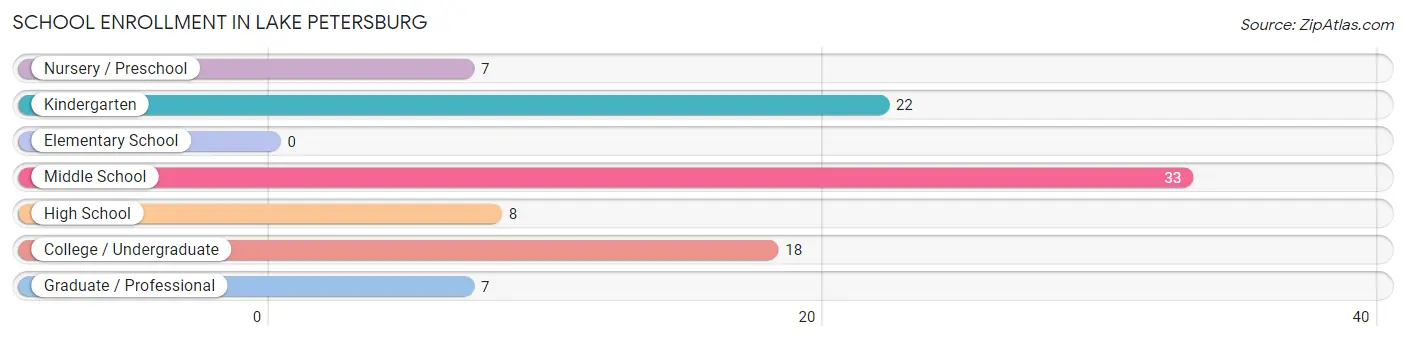
| School Level | # Students | % Students |
| Nursery / Preschool | 7 | 7.4% |
| Kindergarten | 22 | 23.2% |
| Elementary School | 0 | 0.0% |
| Middle School | 33 | 34.7% |
| High School | 8 | 8.4% |
| College / Undergraduate | 18 | 19.0% |
| Graduate / Professional | 7 | 7.4% |
| Total | 95 | 100.0% |
School Enrollment by Age by Funding Source in Lake Petersburg
Out of a total of 95 students who are enrolled in schools in Lake Petersburg, 24 (25.3%) attend a private institution, while the remaining 71 (74.7%) are enrolled in public schools. The age group of 10 to 14 year olds has the highest likelihood of being enrolled in private schools, with 24 (72.7% in the age bracket) enrolled. Conversely, the age group of 3 to 4 year olds has the lowest likelihood of being enrolled in a private school, with 7 (100.0% in the age bracket) attending a public institution.
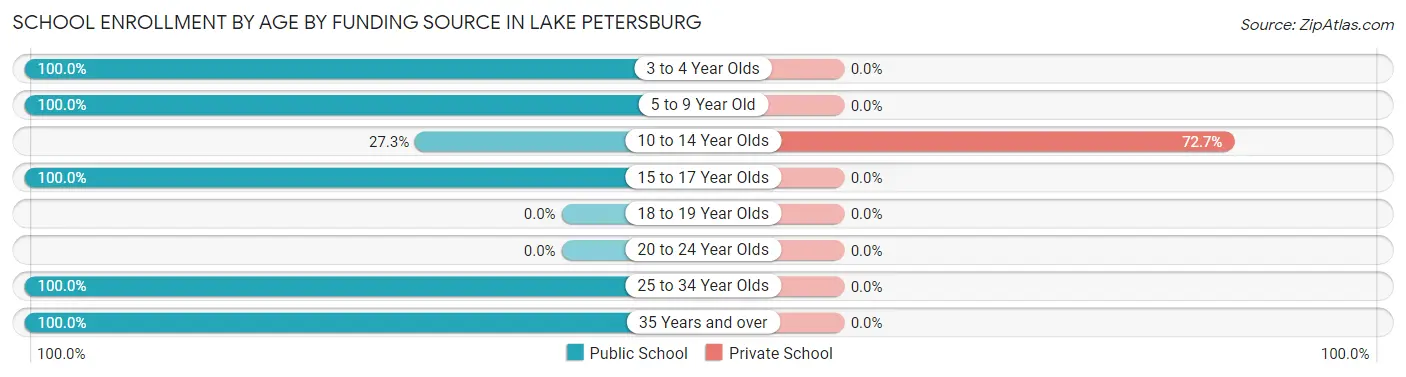
| Age Bracket | Public School | Private School |
| 3 to 4 Year Olds | 7 (100.0%) | 0 (0.0%) |
| 5 to 9 Year Old | 22 (100.0%) | 0 (0.0%) |
| 10 to 14 Year Olds | 9 (27.3%) | 24 (72.7%) |
| 15 to 17 Year Olds | 8 (100.0%) | 0 (0.0%) |
| 18 to 19 Year Olds | 0 (0.0%) | 0 (0.0%) |
| 20 to 24 Year Olds | 0 (0.0%) | 0 (0.0%) |
| 25 to 34 Year Olds | 18 (100.0%) | 0 (0.0%) |
| 35 Years and over | 7 (100.0%) | 0 (0.0%) |
| Total | 71 (74.7%) | 24 (25.3%) |
Educational Attainment by Field of Study in Lake Petersburg
Business (59 | 22.4%), science & technology (49 | 18.6%), social sciences (28 | 10.6%), communications (24 | 9.1%), and bio, nature & agricultural (23 | 8.7%) are the most common fields of study among 264 individuals in Lake Petersburg who have obtained a bachelor's degree or higher.
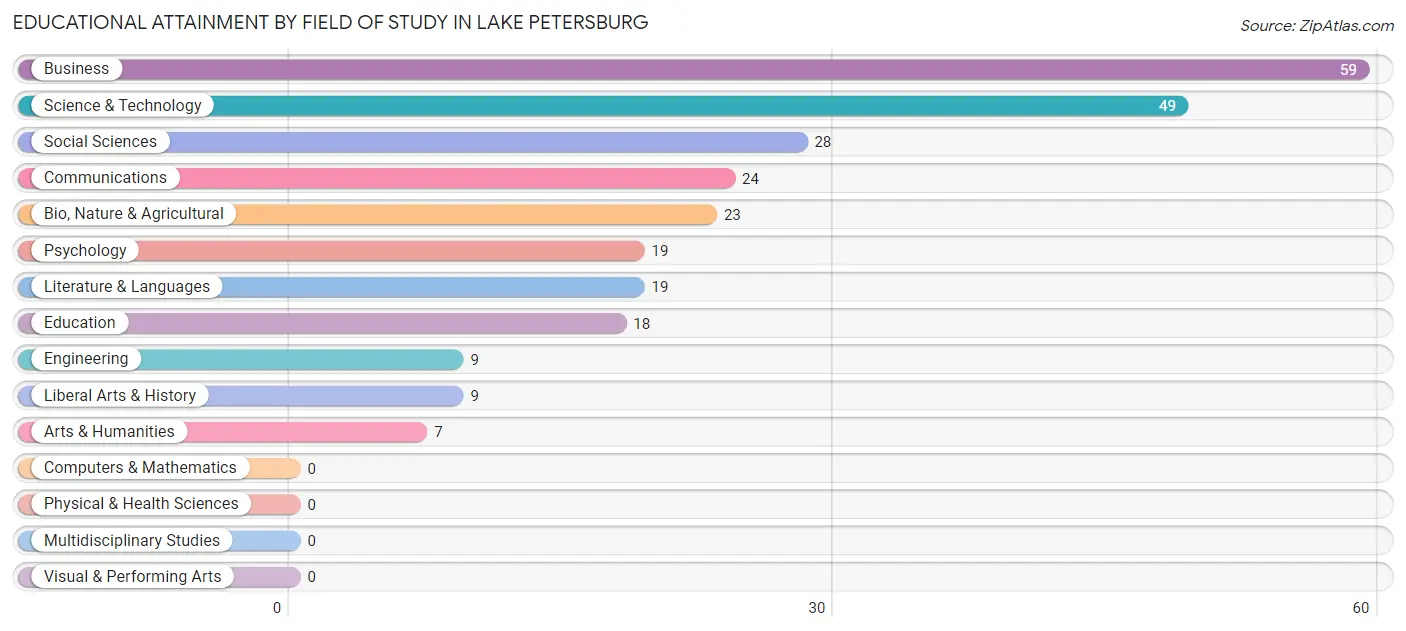
| Field of Study | # Graduates | % Graduates |
| Computers & Mathematics | 0 | 0.0% |
| Bio, Nature & Agricultural | 23 | 8.7% |
| Physical & Health Sciences | 0 | 0.0% |
| Psychology | 19 | 7.2% |
| Social Sciences | 28 | 10.6% |
| Engineering | 9 | 3.4% |
| Multidisciplinary Studies | 0 | 0.0% |
| Science & Technology | 49 | 18.6% |
| Business | 59 | 22.4% |
| Education | 18 | 6.8% |
| Literature & Languages | 19 | 7.2% |
| Liberal Arts & History | 9 | 3.4% |
| Visual & Performing Arts | 0 | 0.0% |
| Communications | 24 | 9.1% |
| Arts & Humanities | 7 | 2.6% |
| Total | 264 | 100.0% |
Transportation & Commute in Lake Petersburg
Vehicle Availability by Sex in Lake Petersburg
The most prevalent vehicle ownership categories in Lake Petersburg are males with 2 vehicles (101, accounting for 54.0%) and females with 2 vehicles (89, making up 63.5%).
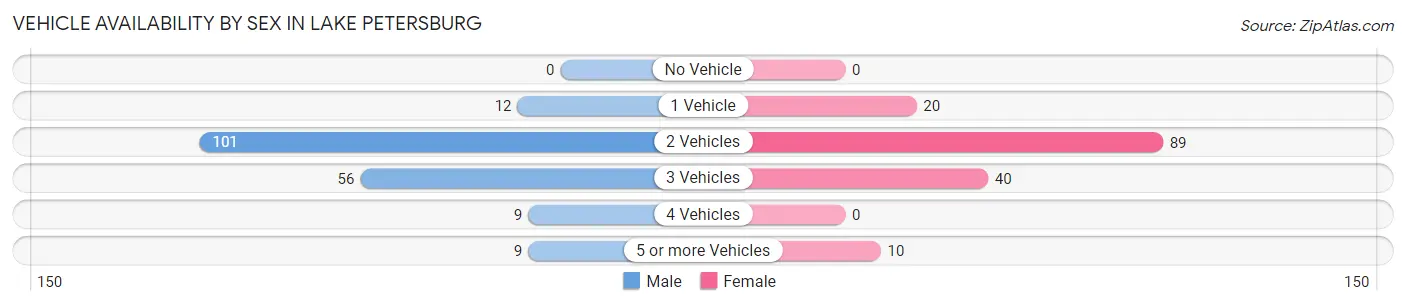
| Vehicles Available | Male | Female |
| No Vehicle | 0 (0.0%) | 0 (0.0%) |
| 1 Vehicle | 12 (6.4%) | 20 (12.6%) |
| 2 Vehicles | 101 (54.0%) | 89 (56.0%) |
| 3 Vehicles | 56 (29.9%) | 40 (25.2%) |
| 4 Vehicles | 9 (4.8%) | 0 (0.0%) |
| 5 or more Vehicles | 9 (4.8%) | 10 (6.3%) |
| Total | 187 (100.0%) | 159 (100.0%) |
Commute Time in Lake Petersburg
The most frequently occuring commute durations in Lake Petersburg are 30 to 34 minutes (92 commuters, 30.8%), 25 to 29 minutes (41 commuters, 13.7%), and 35 to 39 minutes (36 commuters, 12.0%).
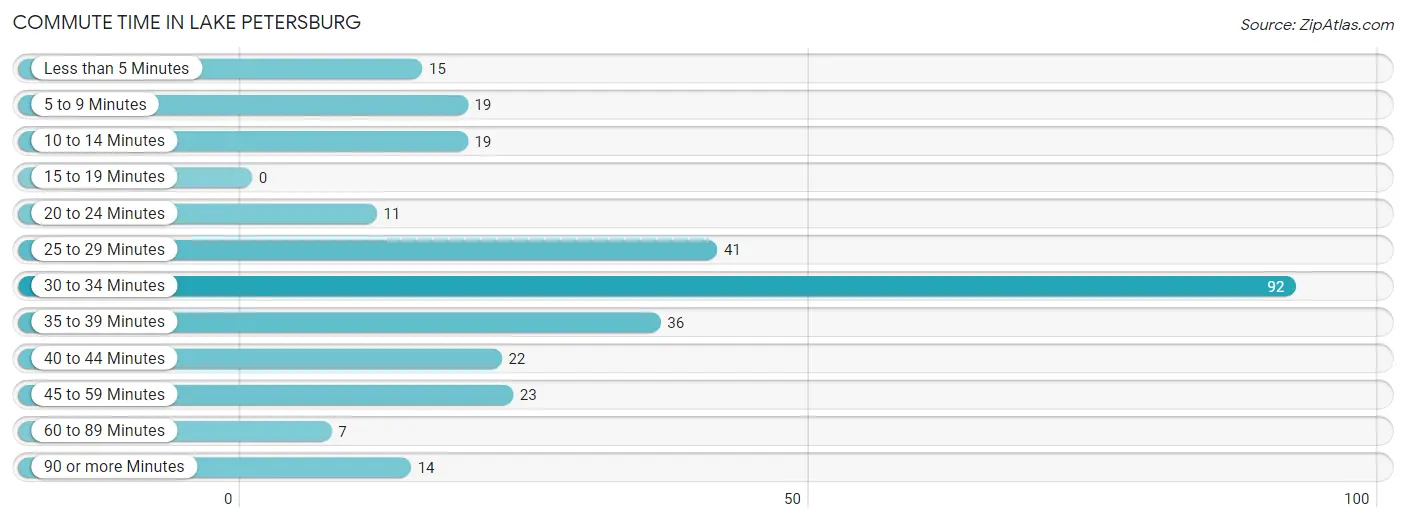
| Commute Time | # Commuters | % Commuters |
| Less than 5 Minutes | 15 | 5.0% |
| 5 to 9 Minutes | 19 | 6.4% |
| 10 to 14 Minutes | 19 | 6.4% |
| 15 to 19 Minutes | 0 | 0.0% |
| 20 to 24 Minutes | 11 | 3.7% |
| 25 to 29 Minutes | 41 | 13.7% |
| 30 to 34 Minutes | 92 | 30.8% |
| 35 to 39 Minutes | 36 | 12.0% |
| 40 to 44 Minutes | 22 | 7.4% |
| 45 to 59 Minutes | 23 | 7.7% |
| 60 to 89 Minutes | 7 | 2.3% |
| 90 or more Minutes | 14 | 4.7% |
Commute Time by Sex in Lake Petersburg
The most common commute times in Lake Petersburg are 30 to 34 minutes (63 commuters, 39.1%) for males and 25 to 29 minutes (32 commuters, 23.2%) for females.
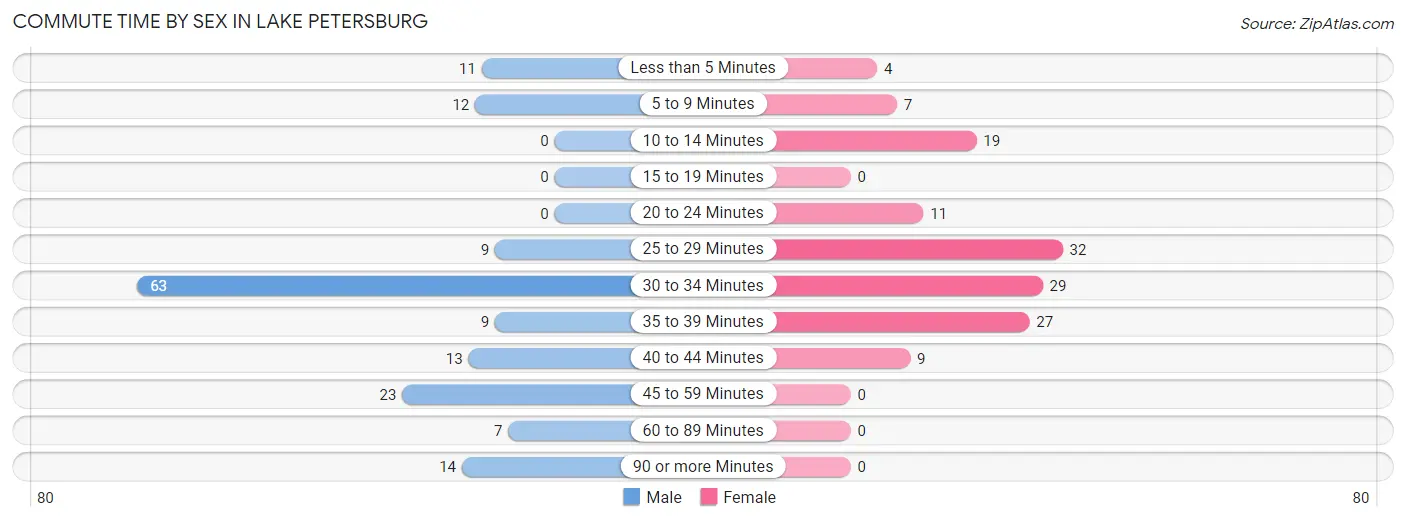
| Commute Time | Male | Female |
| Less than 5 Minutes | 11 (6.8%) | 4 (2.9%) |
| 5 to 9 Minutes | 12 (7.4%) | 7 (5.1%) |
| 10 to 14 Minutes | 0 (0.0%) | 19 (13.8%) |
| 15 to 19 Minutes | 0 (0.0%) | 0 (0.0%) |
| 20 to 24 Minutes | 0 (0.0%) | 11 (8.0%) |
| 25 to 29 Minutes | 9 (5.6%) | 32 (23.2%) |
| 30 to 34 Minutes | 63 (39.1%) | 29 (21.0%) |
| 35 to 39 Minutes | 9 (5.6%) | 27 (19.6%) |
| 40 to 44 Minutes | 13 (8.1%) | 9 (6.5%) |
| 45 to 59 Minutes | 23 (14.3%) | 0 (0.0%) |
| 60 to 89 Minutes | 7 (4.3%) | 0 (0.0%) |
| 90 or more Minutes | 14 (8.7%) | 0 (0.0%) |
Time of Departure to Work by Sex in Lake Petersburg
The most frequent times of departure to work in Lake Petersburg are 7:00 AM to 7:29 AM (45, 28.0%) for males and 7:00 AM to 7:29 AM (43, 31.2%) for females.
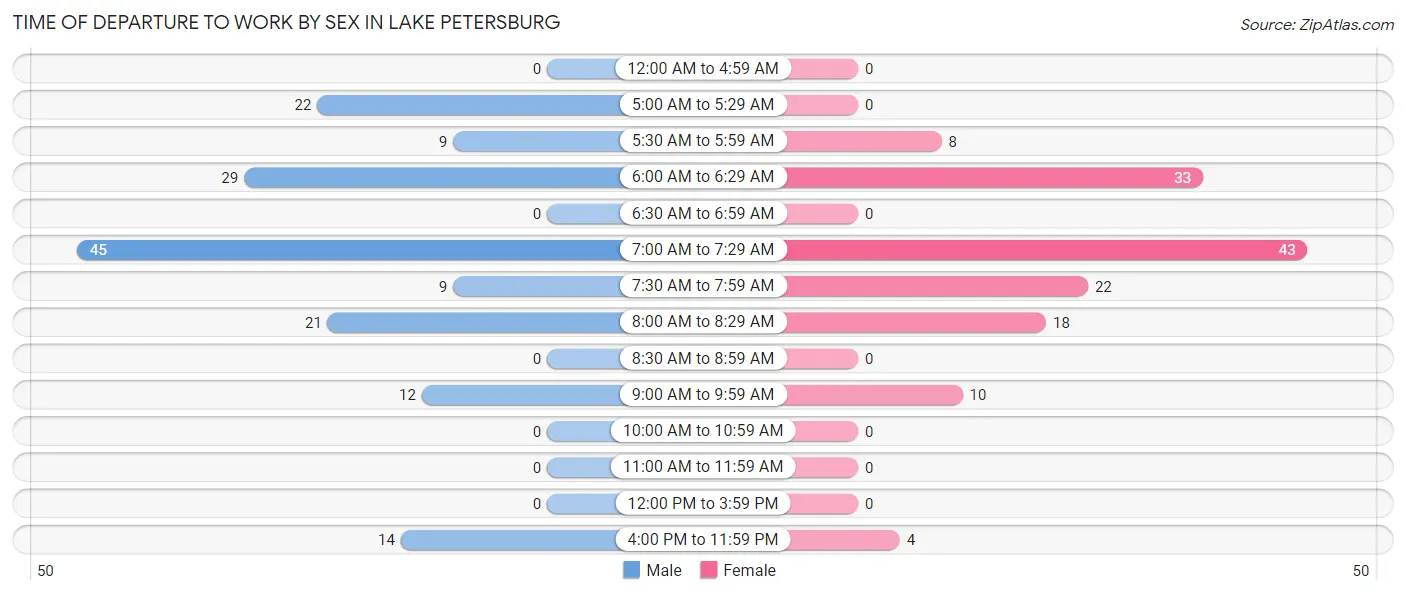
| Time of Departure | Male | Female |
| 12:00 AM to 4:59 AM | 0 (0.0%) | 0 (0.0%) |
| 5:00 AM to 5:29 AM | 22 (13.7%) | 0 (0.0%) |
| 5:30 AM to 5:59 AM | 9 (5.6%) | 8 (5.8%) |
| 6:00 AM to 6:29 AM | 29 (18.0%) | 33 (23.9%) |
| 6:30 AM to 6:59 AM | 0 (0.0%) | 0 (0.0%) |
| 7:00 AM to 7:29 AM | 45 (28.0%) | 43 (31.2%) |
| 7:30 AM to 7:59 AM | 9 (5.6%) | 22 (15.9%) |
| 8:00 AM to 8:29 AM | 21 (13.0%) | 18 (13.0%) |
| 8:30 AM to 8:59 AM | 0 (0.0%) | 0 (0.0%) |
| 9:00 AM to 9:59 AM | 12 (7.4%) | 10 (7.2%) |
| 10:00 AM to 10:59 AM | 0 (0.0%) | 0 (0.0%) |
| 11:00 AM to 11:59 AM | 0 (0.0%) | 0 (0.0%) |
| 12:00 PM to 3:59 PM | 0 (0.0%) | 0 (0.0%) |
| 4:00 PM to 11:59 PM | 14 (8.7%) | 4 (2.9%) |
| Total | 161 (100.0%) | 138 (100.0%) |
Housing Occupancy in Lake Petersburg
Occupancy by Ownership in Lake Petersburg
Of the total 369 dwellings in Lake Petersburg, owner-occupied units account for 362 (98.1%), while renter-occupied units make up 7 (1.9%).
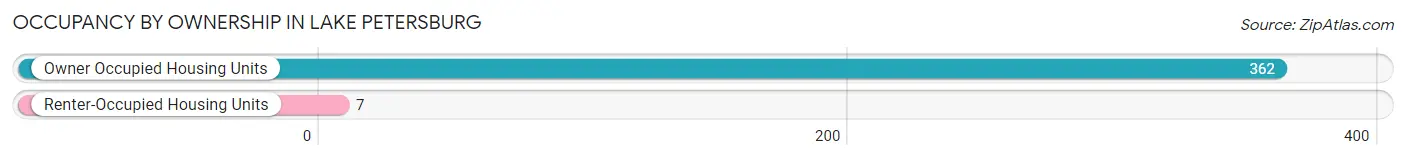
| Occupancy | # Housing Units | % Housing Units |
| Owner Occupied Housing Units | 362 | 98.1% |
| Renter-Occupied Housing Units | 7 | 1.9% |
| Total Occupied Housing Units | 369 | 100.0% |
Occupancy by Household Size in Lake Petersburg
| Household Size | # Housing Units | % Housing Units |
| 1-Person Household | 104 | 28.2% |
| 2-Person Household | 192 | 52.0% |
| 3-Person Household | 36 | 9.8% |
| 4+ Person Household | 37 | 10.0% |
| Total Housing Units | 369 | 100.0% |
Occupancy by Ownership by Household Size in Lake Petersburg
| Household Size | Owner-occupied | Renter-occupied |
| 1-Person Household | 97 (93.3%) | 7 (6.7%) |
| 2-Person Household | 192 (100.0%) | 0 (0.0%) |
| 3-Person Household | 36 (100.0%) | 0 (0.0%) |
| 4+ Person Household | 37 (100.0%) | 0 (0.0%) |
| Total Housing Units | 362 (98.1%) | 7 (1.9%) |
Occupancy by Educational Attainment in Lake Petersburg
| Household Size | Owner-occupied | Renter-occupied |
| Less than High School | 9 (100.0%) | 0 (0.0%) |
| High School Diploma | 62 (100.0%) | 0 (0.0%) |
| College/Associate Degree | 150 (100.0%) | 0 (0.0%) |
| Bachelor's Degree or higher | 141 (95.3%) | 7 (4.7%) |
Occupancy by Age of Householder in Lake Petersburg
| Age Bracket | # Households | % Households |
| Under 35 Years | 39 | 10.6% |
| 35 to 44 Years | 24 | 6.5% |
| 45 to 54 Years | 7 | 1.9% |
| 55 to 64 Years | 110 | 29.8% |
| 65 to 74 Years | 121 | 32.8% |
| 75 to 84 Years | 59 | 16.0% |
| 85 Years and Over | 9 | 2.4% |
| Total | 369 | 100.0% |
Housing Finances in Lake Petersburg
Median Income by Occupancy in Lake Petersburg
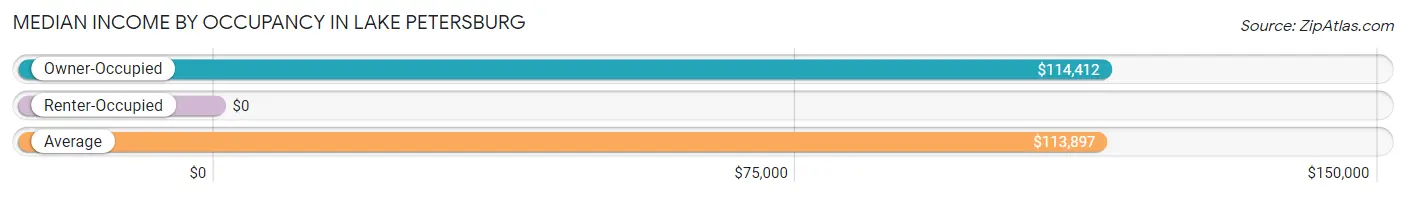
| Occupancy Type | # Households | Median Income |
| Owner-Occupied | 362 (98.1%) | $114,412 |
| Renter-Occupied | 7 (1.9%) | $0 |
| Average | 369 (100.0%) | $113,897 |
Occupancy by Householder Income Bracket in Lake Petersburg
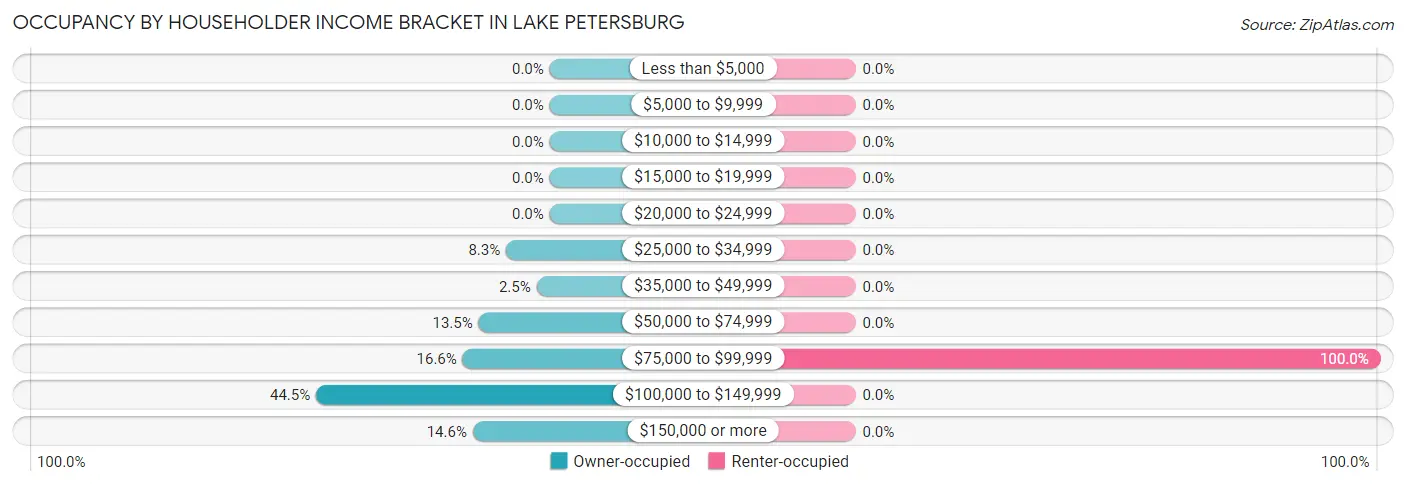
| Income Bracket | Owner-occupied | Renter-occupied |
| Less than $5,000 | 0 (0.0%) | 0 (0.0%) |
| $5,000 to $9,999 | 0 (0.0%) | 0 (0.0%) |
| $10,000 to $14,999 | 0 (0.0%) | 0 (0.0%) |
| $15,000 to $19,999 | 0 (0.0%) | 0 (0.0%) |
| $20,000 to $24,999 | 0 (0.0%) | 0 (0.0%) |
| $25,000 to $34,999 | 30 (8.3%) | 0 (0.0%) |
| $35,000 to $49,999 | 9 (2.5%) | 0 (0.0%) |
| $50,000 to $74,999 | 49 (13.5%) | 0 (0.0%) |
| $75,000 to $99,999 | 60 (16.6%) | 7 (100.0%) |
| $100,000 to $149,999 | 161 (44.5%) | 0 (0.0%) |
| $150,000 or more | 53 (14.6%) | 0 (0.0%) |
| Total | 362 (100.0%) | 7 (100.0%) |
Monthly Housing Cost Tiers in Lake Petersburg
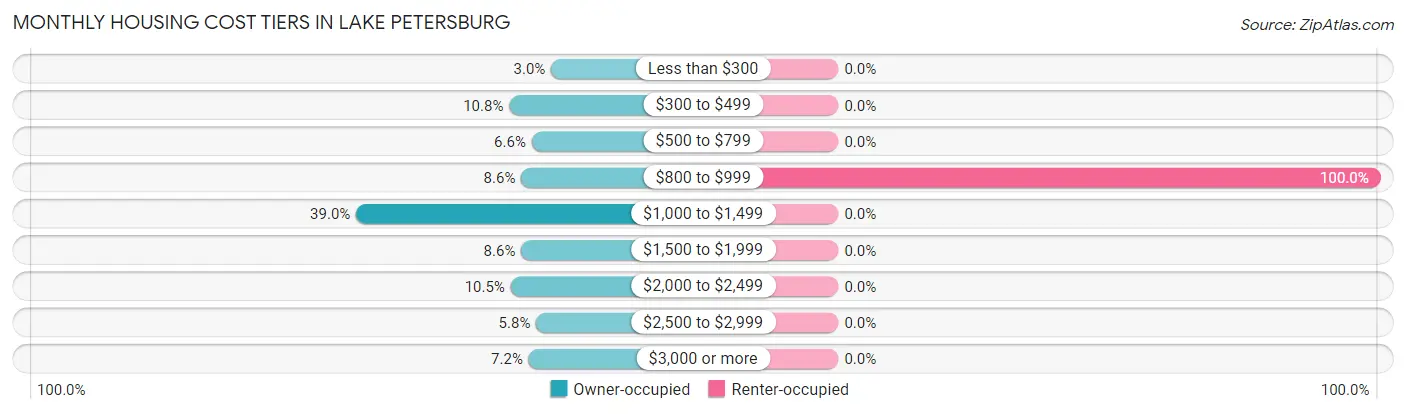
| Monthly Cost | Owner-occupied | Renter-occupied |
| Less than $300 | 11 (3.0%) | 0 (0.0%) |
| $300 to $499 | 39 (10.8%) | 0 (0.0%) |
| $500 to $799 | 24 (6.6%) | 0 (0.0%) |
| $800 to $999 | 31 (8.6%) | 7 (100.0%) |
| $1,000 to $1,499 | 141 (39.0%) | 0 (0.0%) |
| $1,500 to $1,999 | 31 (8.6%) | 0 (0.0%) |
| $2,000 to $2,499 | 38 (10.5%) | 0 (0.0%) |
| $2,500 to $2,999 | 21 (5.8%) | 0 (0.0%) |
| $3,000 or more | 26 (7.2%) | 0 (0.0%) |
| Total | 362 (100.0%) | 7 (100.0%) |
Physical Housing Characteristics in Lake Petersburg
Housing Structures in Lake Petersburg
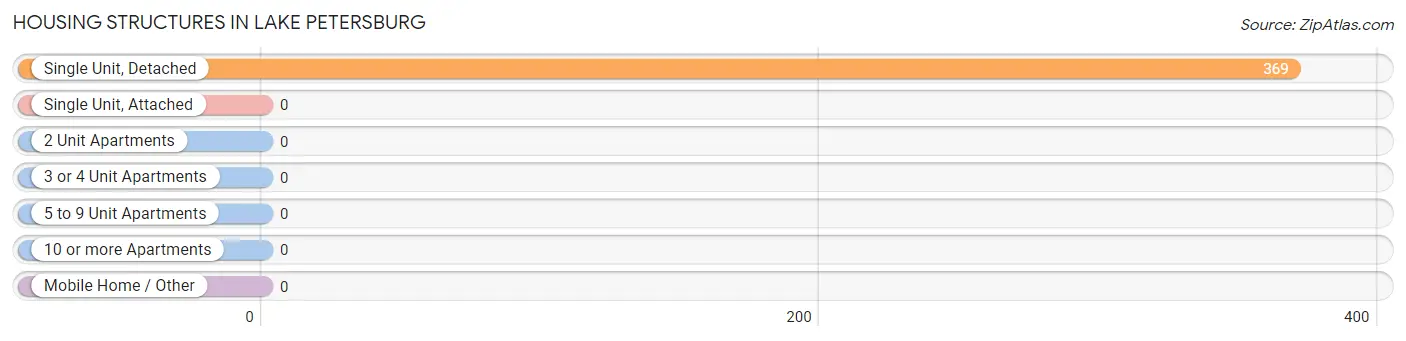
| Structure Type | # Housing Units | % Housing Units |
| Single Unit, Detached | 369 | 100.0% |
| Single Unit, Attached | 0 | 0.0% |
| 2 Unit Apartments | 0 | 0.0% |
| 3 or 4 Unit Apartments | 0 | 0.0% |
| 5 to 9 Unit Apartments | 0 | 0.0% |
| 10 or more Apartments | 0 | 0.0% |
| Mobile Home / Other | 0 | 0.0% |
| Total | 369 | 100.0% |
Housing Structures by Occupancy in Lake Petersburg
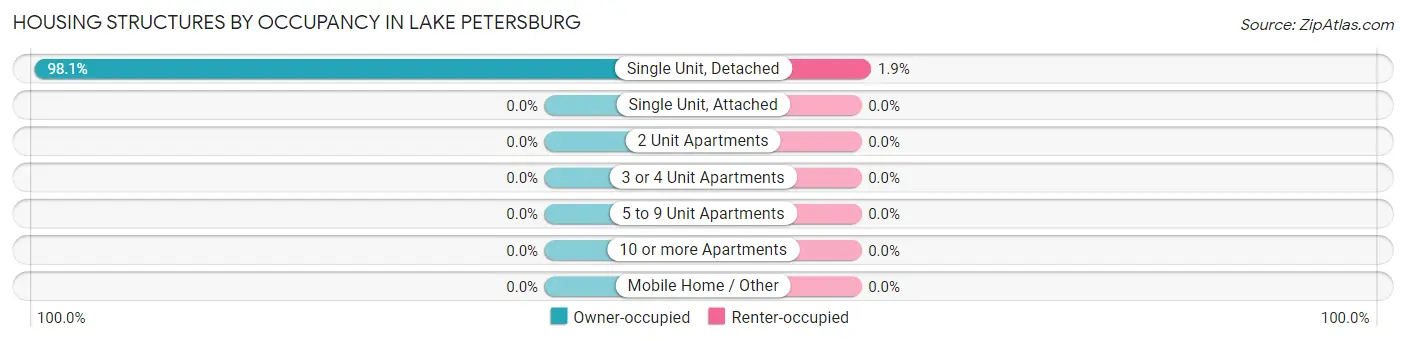
| Structure Type | Owner-occupied | Renter-occupied |
| Single Unit, Detached | 362 (98.1%) | 7 (1.9%) |
| Single Unit, Attached | 0 (0.0%) | 0 (0.0%) |
| 2 Unit Apartments | 0 (0.0%) | 0 (0.0%) |
| 3 or 4 Unit Apartments | 0 (0.0%) | 0 (0.0%) |
| 5 to 9 Unit Apartments | 0 (0.0%) | 0 (0.0%) |
| 10 or more Apartments | 0 (0.0%) | 0 (0.0%) |
| Mobile Home / Other | 0 (0.0%) | 0 (0.0%) |
| Total | 362 (98.1%) | 7 (1.9%) |
Housing Structures by Number of Rooms in Lake Petersburg
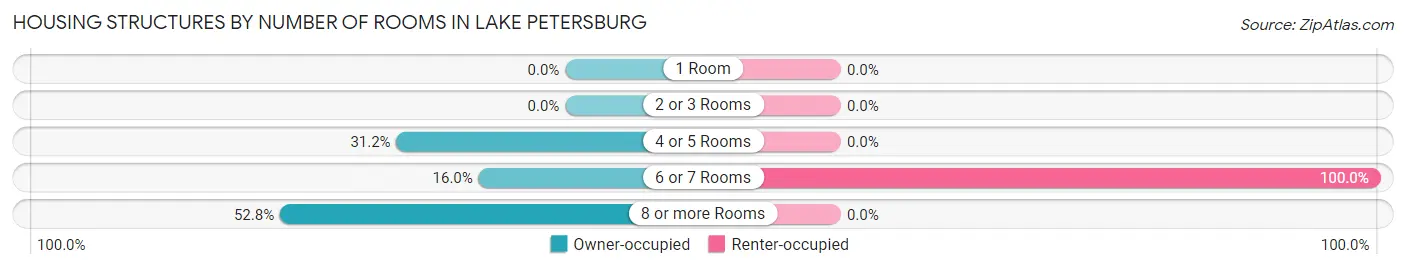
| Number of Rooms | Owner-occupied | Renter-occupied |
| 1 Room | 0 (0.0%) | 0 (0.0%) |
| 2 or 3 Rooms | 0 (0.0%) | 0 (0.0%) |
| 4 or 5 Rooms | 113 (31.2%) | 0 (0.0%) |
| 6 or 7 Rooms | 58 (16.0%) | 7 (100.0%) |
| 8 or more Rooms | 191 (52.8%) | 0 (0.0%) |
| Total | 362 (100.0%) | 7 (100.0%) |
Housing Structure by Heating Type in Lake Petersburg
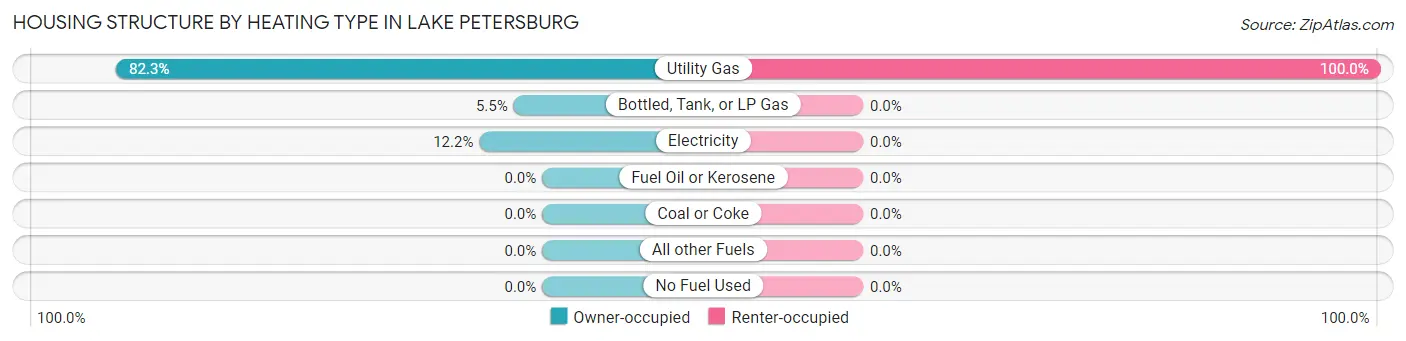
| Heating Type | Owner-occupied | Renter-occupied |
| Utility Gas | 298 (82.3%) | 7 (100.0%) |
| Bottled, Tank, or LP Gas | 20 (5.5%) | 0 (0.0%) |
| Electricity | 44 (12.1%) | 0 (0.0%) |
| Fuel Oil or Kerosene | 0 (0.0%) | 0 (0.0%) |
| Coal or Coke | 0 (0.0%) | 0 (0.0%) |
| All other Fuels | 0 (0.0%) | 0 (0.0%) |
| No Fuel Used | 0 (0.0%) | 0 (0.0%) |
| Total | 362 (100.0%) | 7 (100.0%) |
Household Vehicle Usage in Lake Petersburg
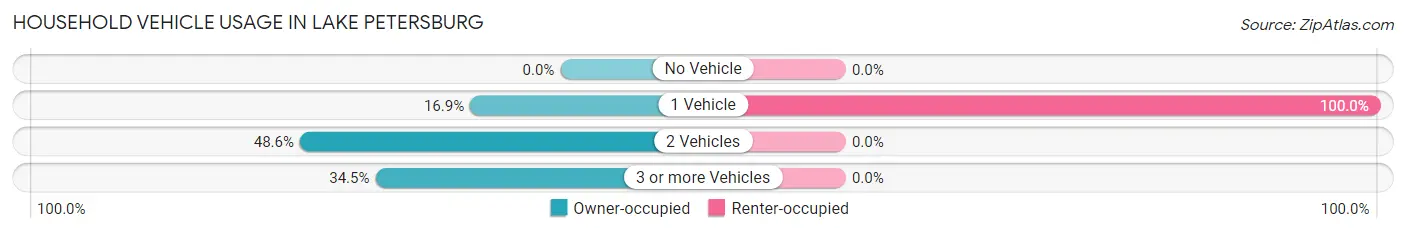
| Vehicles per Household | Owner-occupied | Renter-occupied |
| No Vehicle | 0 (0.0%) | 0 (0.0%) |
| 1 Vehicle | 61 (16.9%) | 7 (100.0%) |
| 2 Vehicles | 176 (48.6%) | 0 (0.0%) |
| 3 or more Vehicles | 125 (34.5%) | 0 (0.0%) |
| Total | 362 (100.0%) | 7 (100.0%) |
Real Estate & Mortgages in Lake Petersburg
Real Estate and Mortgage Overview in Lake Petersburg
| Characteristic | Without Mortgage | With Mortgage |
| Housing Units | 128 | 234 |
| Median Property Value | $307,500 | $321,300 |
| Median Household Income | $86,250 | $46 |
| Monthly Housing Costs | $780 | $26 |
| Real Estate Taxes | $5,296 | $10 |
Property Value by Mortgage Status in Lake Petersburg
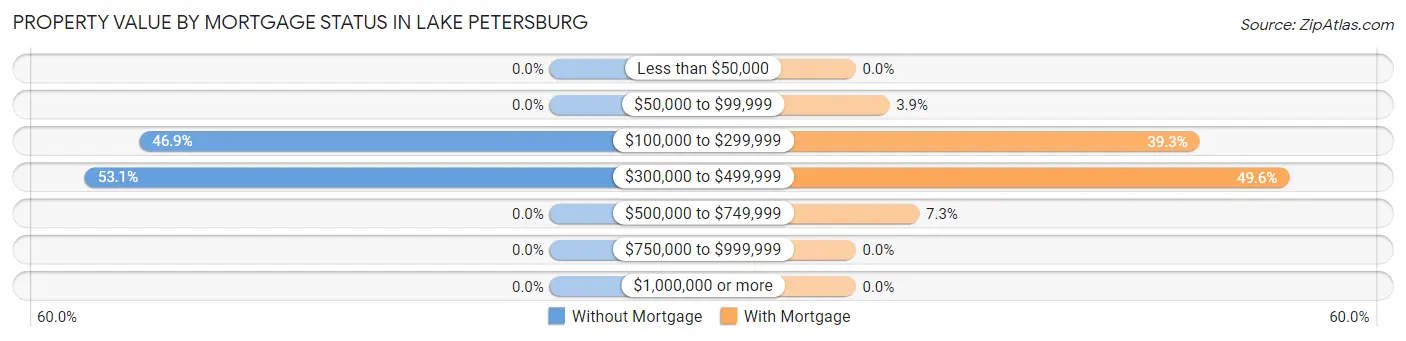
| Property Value | Without Mortgage | With Mortgage |
| Less than $50,000 | 0 (0.0%) | 0 (0.0%) |
| $50,000 to $99,999 | 0 (0.0%) | 9 (3.8%) |
| $100,000 to $299,999 | 60 (46.9%) | 92 (39.3%) |
| $300,000 to $499,999 | 68 (53.1%) | 116 (49.6%) |
| $500,000 to $749,999 | 0 (0.0%) | 17 (7.3%) |
| $750,000 to $999,999 | 0 (0.0%) | 0 (0.0%) |
| $1,000,000 or more | 0 (0.0%) | 0 (0.0%) |
| Total | 128 (100.0%) | 234 (100.0%) |
Household Income by Mortgage Status in Lake Petersburg
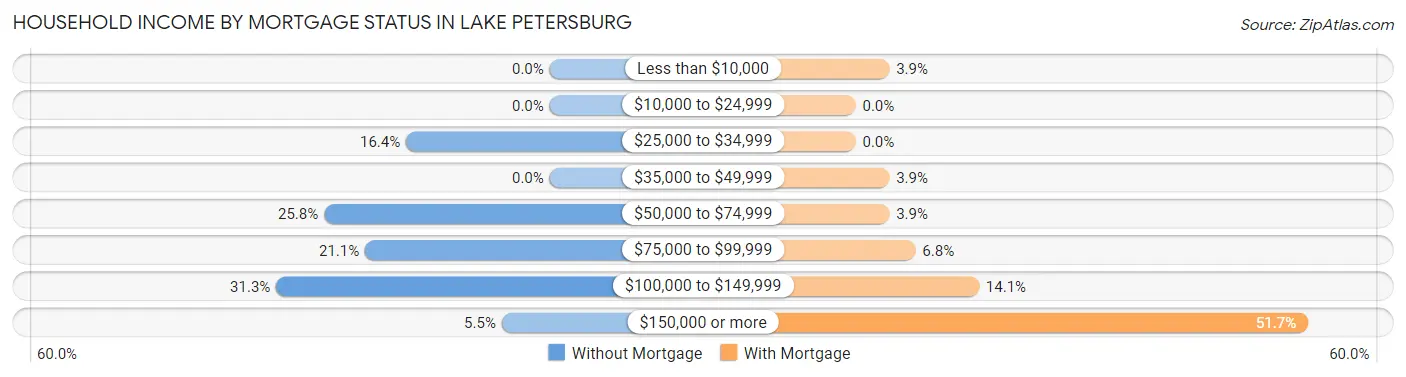
| Household Income | Without Mortgage | With Mortgage |
| Less than $10,000 | 0 (0.0%) | 9 (3.8%) |
| $10,000 to $24,999 | 0 (0.0%) | 0 (0.0%) |
| $25,000 to $34,999 | 21 (16.4%) | 0 (0.0%) |
| $35,000 to $49,999 | 0 (0.0%) | 9 (3.8%) |
| $50,000 to $74,999 | 33 (25.8%) | 9 (3.8%) |
| $75,000 to $99,999 | 27 (21.1%) | 16 (6.8%) |
| $100,000 to $149,999 | 40 (31.2%) | 33 (14.1%) |
| $150,000 or more | 7 (5.5%) | 121 (51.7%) |
| Total | 128 (100.0%) | 234 (100.0%) |
Property Value to Household Income Ratio in Lake Petersburg
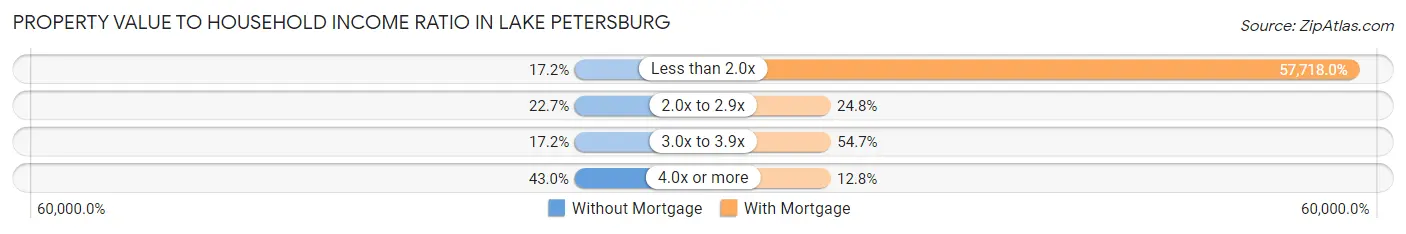
| Value-to-Income Ratio | Without Mortgage | With Mortgage |
| Less than 2.0x | 22 (17.2%) | 135,060 (57,717.9%) |
| 2.0x to 2.9x | 29 (22.7%) | 58 (24.8%) |
| 3.0x to 3.9x | 22 (17.2%) | 128 (54.7%) |
| 4.0x or more | 55 (43.0%) | 30 (12.8%) |
| Total | 128 (100.0%) | 234 (100.0%) |
Real Estate Taxes by Mortgage Status in Lake Petersburg
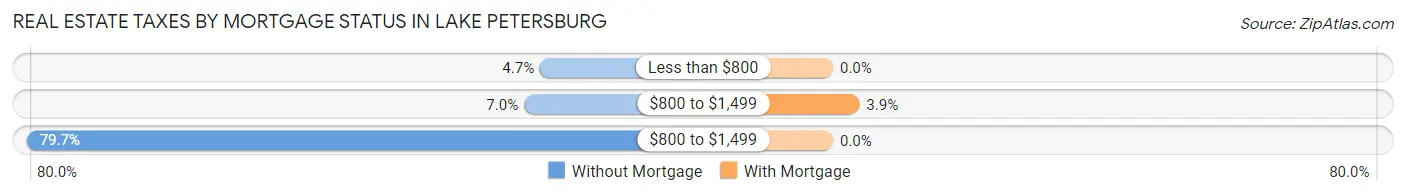
| Property Taxes | Without Mortgage | With Mortgage |
| Less than $800 | 6 (4.7%) | 0 (0.0%) |
| $800 to $1,499 | 9 (7.0%) | 9 (3.8%) |
| $800 to $1,499 | 102 (79.7%) | 0 (0.0%) |
| Total | 128 (100.0%) | 234 (100.0%) |
Health & Disability in Lake Petersburg
Health Insurance Coverage by Age in Lake Petersburg
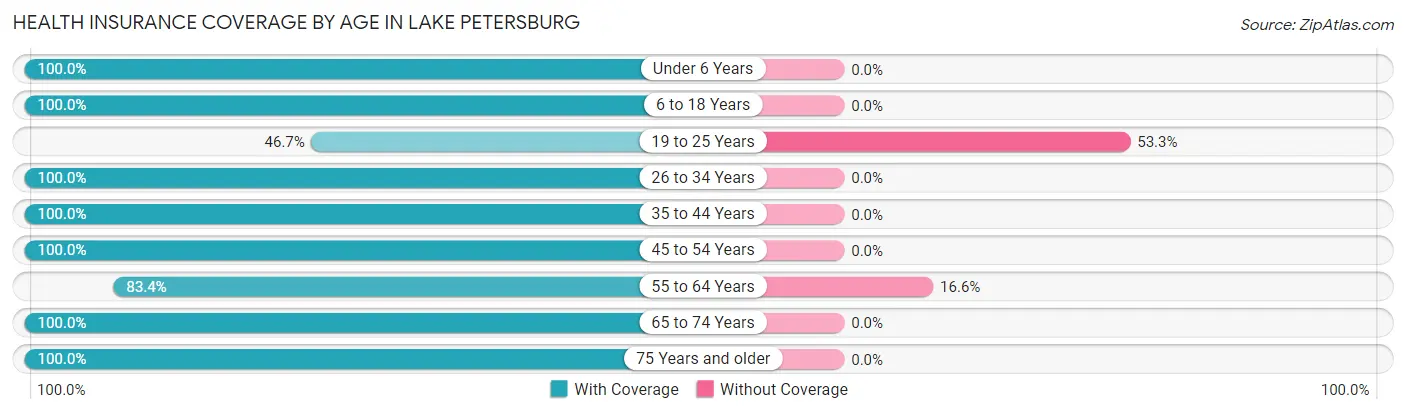
| Age Bracket | With Coverage | Without Coverage |
| Under 6 Years | 39 (100.0%) | 0 (0.0%) |
| 6 to 18 Years | 63 (100.0%) | 0 (0.0%) |
| 19 to 25 Years | 7 (46.7%) | 8 (53.3%) |
| 26 to 34 Years | 82 (100.0%) | 0 (0.0%) |
| 35 to 44 Years | 24 (100.0%) | 0 (0.0%) |
| 45 to 54 Years | 91 (100.0%) | 0 (0.0%) |
| 55 to 64 Years | 141 (83.4%) | 28 (16.6%) |
| 65 to 74 Years | 199 (100.0%) | 0 (0.0%) |
| 75 Years and older | 81 (100.0%) | 0 (0.0%) |
| Total | 727 (95.3%) | 36 (4.7%) |
Health Insurance Coverage by Citizenship Status in Lake Petersburg
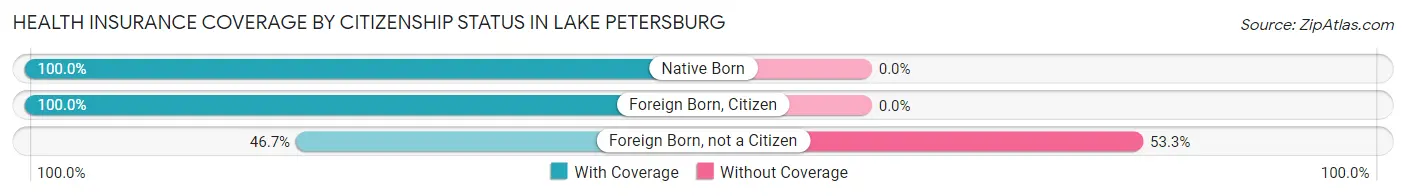
| Citizenship Status | With Coverage | Without Coverage |
| Native Born | 39 (100.0%) | 0 (0.0%) |
| Foreign Born, Citizen | 63 (100.0%) | 0 (0.0%) |
| Foreign Born, not a Citizen | 7 (46.7%) | 8 (53.3%) |
Health Insurance Coverage by Household Income in Lake Petersburg
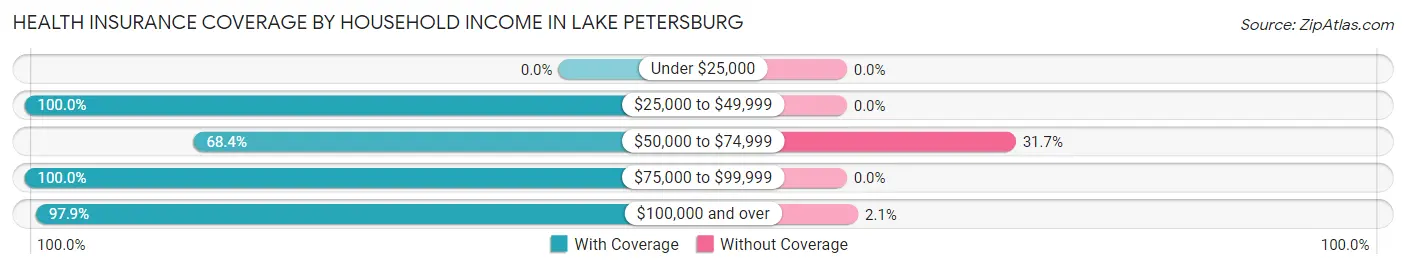
| Household Income | With Coverage | Without Coverage |
| Under $25,000 | 0 (0.0%) | 0 (0.0%) |
| $25,000 to $49,999 | 47 (100.0%) | 0 (0.0%) |
| $50,000 to $74,999 | 54 (68.3%) | 25 (31.7%) |
| $75,000 to $99,999 | 119 (100.0%) | 0 (0.0%) |
| $100,000 and over | 507 (97.9%) | 11 (2.1%) |
Public vs Private Health Insurance Coverage by Age in Lake Petersburg
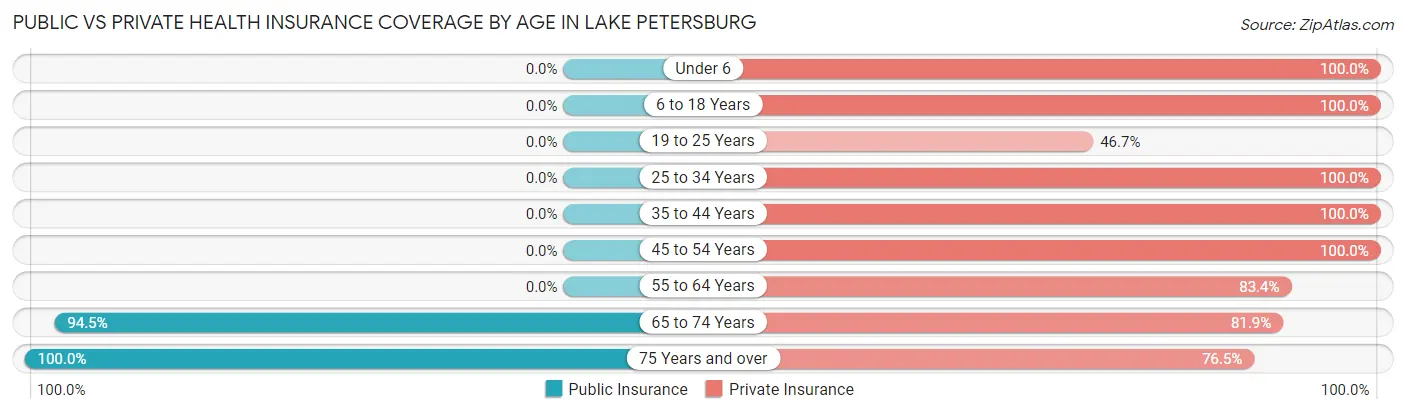
| Age Bracket | Public Insurance | Private Insurance |
| Under 6 | 0 (0.0%) | 39 (100.0%) |
| 6 to 18 Years | 0 (0.0%) | 63 (100.0%) |
| 19 to 25 Years | 0 (0.0%) | 7 (46.7%) |
| 25 to 34 Years | 0 (0.0%) | 82 (100.0%) |
| 35 to 44 Years | 0 (0.0%) | 24 (100.0%) |
| 45 to 54 Years | 0 (0.0%) | 91 (100.0%) |
| 55 to 64 Years | 0 (0.0%) | 141 (83.4%) |
| 65 to 74 Years | 188 (94.5%) | 163 (81.9%) |
| 75 Years and over | 81 (100.0%) | 62 (76.5%) |
| Total | 269 (35.3%) | 672 (88.1%) |
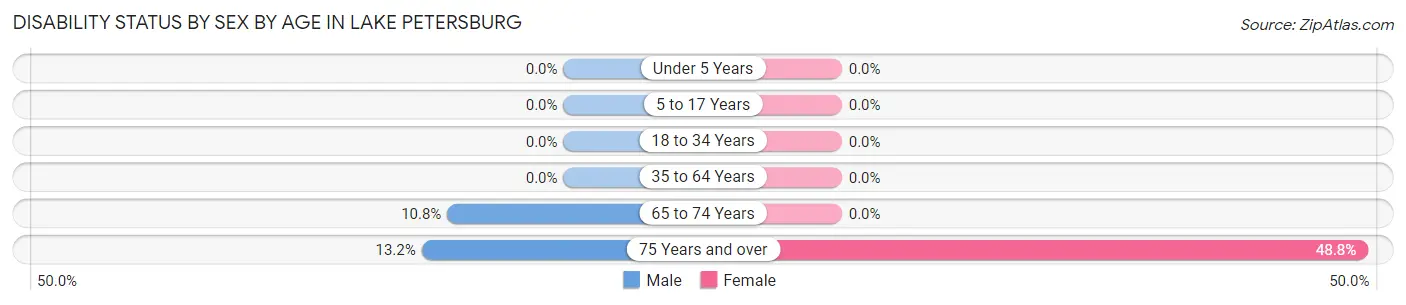
Disability Status by Sex by Age in Lake Petersburg
| Age Bracket | Male | Female |
| Under 5 Years | 0 (0.0%) | 0 (0.0%) |
| 5 to 17 Years | 0 (0.0%) | 0 (0.0%) |
| 18 to 34 Years | 0 (0.0%) | 0 (0.0%) |
| 35 to 64 Years | 0 (0.0%) | 0 (0.0%) |
| 65 to 74 Years | 11 (10.8%) | 0 (0.0%) |
| 75 Years and over | 5 (13.2%) | 21 (48.8%) |
Disability Class by Sex by Age in Lake Petersburg
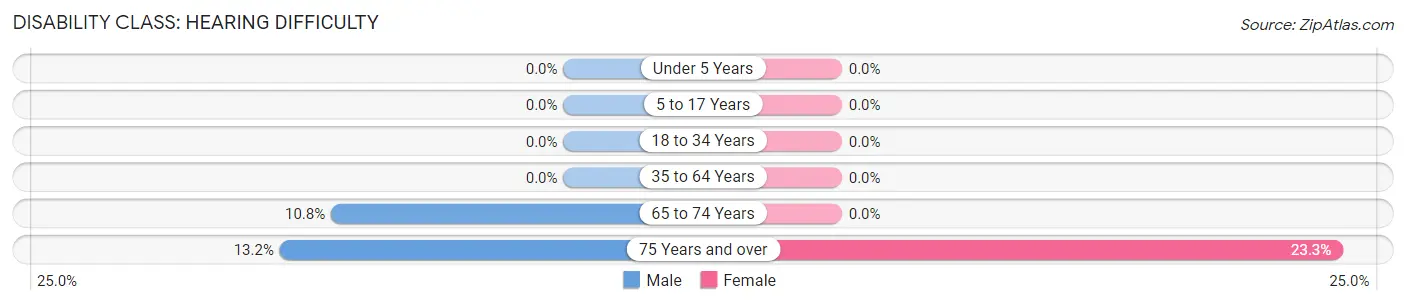
Disability Class: Hearing Difficulty
| Age Bracket | Male | Female |
| Under 5 Years | 0 (0.0%) | 0 (0.0%) |
| 5 to 17 Years | 0 (0.0%) | 0 (0.0%) |
| 18 to 34 Years | 0 (0.0%) | 0 (0.0%) |
| 35 to 64 Years | 0 (0.0%) | 0 (0.0%) |
| 65 to 74 Years | 11 (10.8%) | 0 (0.0%) |
| 75 Years and over | 5 (13.2%) | 10 (23.3%) |
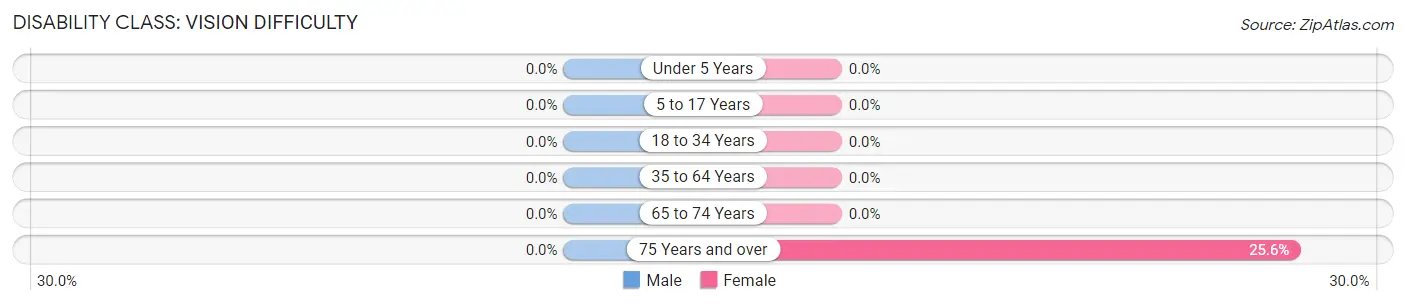
Disability Class: Vision Difficulty
| Age Bracket | Male | Female |
| Under 5 Years | 0 (0.0%) | 0 (0.0%) |
| 5 to 17 Years | 0 (0.0%) | 0 (0.0%) |
| 18 to 34 Years | 0 (0.0%) | 0 (0.0%) |
| 35 to 64 Years | 0 (0.0%) | 0 (0.0%) |
| 65 to 74 Years | 0 (0.0%) | 0 (0.0%) |
| 75 Years and over | 0 (0.0%) | 11 (25.6%) |
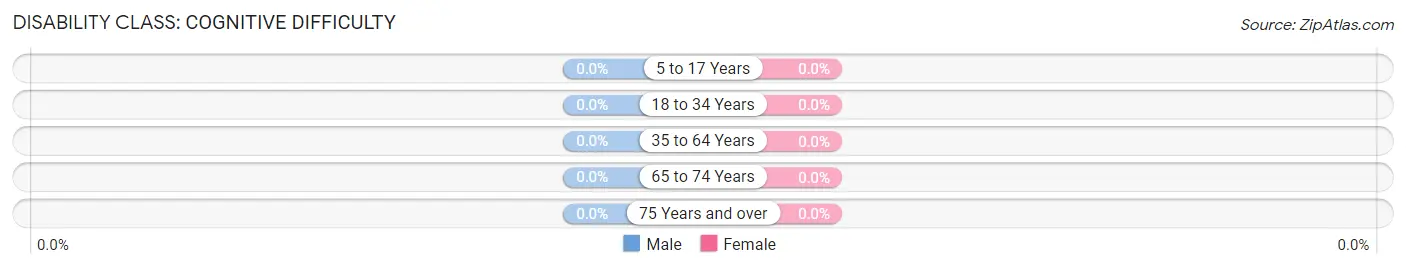
Disability Class: Cognitive Difficulty
| Age Bracket | Male | Female |
| 5 to 17 Years | 0 (0.0%) | 0 (0.0%) |
| 18 to 34 Years | 0 (0.0%) | 0 (0.0%) |
| 35 to 64 Years | 0 (0.0%) | 0 (0.0%) |
| 65 to 74 Years | 0 (0.0%) | 0 (0.0%) |
| 75 Years and over | 0 (0.0%) | 0 (0.0%) |
Disability Class: Ambulatory Difficulty
| Age Bracket | Male | Female |
| 5 to 17 Years | 0 (0.0%) | 0 (0.0%) |
| 18 to 34 Years | 0 (0.0%) | 0 (0.0%) |
| 35 to 64 Years | 0 (0.0%) | 0 (0.0%) |
| 65 to 74 Years | 0 (0.0%) | 0 (0.0%) |
| 75 Years and over | 0 (0.0%) | 0 (0.0%) |
Disability Class: Self-Care Difficulty
| Age Bracket | Male | Female |
| 5 to 17 Years | 0 (0.0%) | 0 (0.0%) |
| 18 to 34 Years | 0 (0.0%) | 0 (0.0%) |
| 35 to 64 Years | 0 (0.0%) | 0 (0.0%) |
| 65 to 74 Years | 0 (0.0%) | 0 (0.0%) |
| 75 Years and over | 0 (0.0%) | 0 (0.0%) |
Technology Access in Lake Petersburg
Computing Device Access in Lake Petersburg
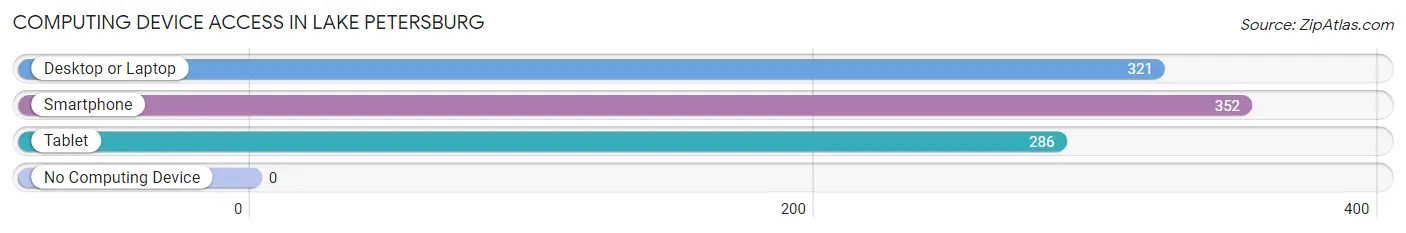
| Device Type | # Households | % Households |
| Desktop or Laptop | 321 | 87.0% |
| Smartphone | 352 | 95.4% |
| Tablet | 286 | 77.5% |
| No Computing Device | 0 | 0.0% |
| Total | 369 | 100.0% |
Internet Access in Lake Petersburg
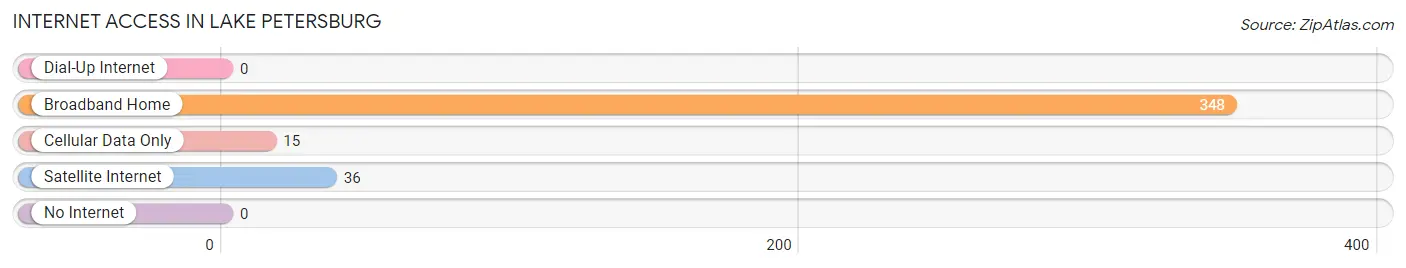
| Internet Type | # Households | % Households |
| Dial-Up Internet | 0 | 0.0% |
| Broadband Home | 348 | 94.3% |
| Cellular Data Only | 15 | 4.1% |
| Satellite Internet | 36 | 9.8% |
| No Internet | 0 | 0.0% |
| Total | 369 | 100.0% |
Lake Petersburg Summary
History
Lake Petersburg is a small village located in Menard County, Illinois. It is situated on the banks of the Sangamon River, approximately 10 miles south of the city of Petersburg. The village was founded in 1837 by a group of settlers from the nearby town of Petersburg. The settlers were looking for a place to settle and build a community, and they chose the area around Lake Petersburg due to its abundance of natural resources.
The first settlers of Lake Petersburg were mostly farmers, and they quickly began to cultivate the land and build homes. The village grew slowly but steadily, and by the late 1800s, it had become a thriving community. The village was home to a variety of businesses, including a general store, a blacksmith shop, a sawmill, and a gristmill.
In the early 1900s, the village began to experience a period of growth and prosperity. The population increased, and new businesses opened up, including a bank, a post office, and a hotel. The village also became a popular destination for tourists, who came to enjoy the scenic beauty of the area.
In the mid-1900s, the village experienced a period of decline. Many of the businesses closed, and the population began to decline. However, in recent years, the village has experienced a resurgence. New businesses have opened up, and the population has begun to increase.
Geography
Lake Petersburg is located in the central part of Menard County, Illinois. It is situated on the banks of the Sangamon River, approximately 10 miles south of the city of Petersburg. The village is surrounded by rolling hills and farmland, and is located in a rural area. The climate in the area is generally mild, with hot summers and cold winters.
The village is home to a variety of natural resources, including forests, lakes, and rivers. The area is also home to a variety of wildlife, including deer, turkey, and other small game.
Economy
The economy of Lake Petersburg is largely based on agriculture. The village is home to a variety of farms, which produce a variety of crops, including corn, soybeans, and wheat. The village also has a number of small businesses, including a general store, a bank, and a post office.
The village is also home to a number of recreational activities, including fishing, boating, and camping. The area is also home to a variety of parks and trails, which are popular with visitors.
Demographics
As of the 2010 census, the population of Lake Petersburg was 545. The population is largely white, with a small percentage of African Americans and Hispanics. The median household income in the village is $45,000, and the median age is 44. The village is home to a variety of religious denominations, including Baptist, Methodist, and Catholic.
Common Questions
What is Per Capita Income in Lake Petersburg?
Per Capita income in Lake Petersburg is $61,783.
What is the Median Family Income in Lake Petersburg?
Median Family Income in Lake Petersburg is $135,089.
What is the Median Household income in Lake Petersburg?
Median Household Income in Lake Petersburg is $113,897.
What is Income or Wage Gap in Lake Petersburg?
Income or Wage Gap in Lake Petersburg is 54.3%.
Women in Lake Petersburg earn 45.7 cents for every dollar earned by a man.
What is Inequality or Gini Index in Lake Petersburg?
Inequality or Gini Index in Lake Petersburg is 0.33.
What is the Total Population of Lake Petersburg?
Total Population of Lake Petersburg is 763.
What is the Total Male Population of Lake Petersburg?
Total Male Population of Lake Petersburg is 387.
What is the Total Female Population of Lake Petersburg?
Total Female Population of Lake Petersburg is 376.
What is the Ratio of Males per 100 Females in Lake Petersburg?
There are 102.93 Males per 100 Females in Lake Petersburg.
What is the Ratio of Females per 100 Males in Lake Petersburg?
There are 97.16 Females per 100 Males in Lake Petersburg.
What is the Median Population Age in Lake Petersburg?
Median Population Age in Lake Petersburg is 59.5 Years.
What is the Average Family Size in Lake Petersburg
Average Family Size in Lake Petersburg is 2.5 People.
What is the Average Household Size in Lake Petersburg
Average Household Size in Lake Petersburg is 2.1 People.
How Large is the Labor Force in Lake Petersburg?
There are 354 People in the Labor Forcein in Lake Petersburg.
What is the Percentage of People in the Labor Force in Lake Petersburg?
52.9% of People are in the Labor Force in Lake Petersburg.
What is the Unemployment Rate in Lake Petersburg?
Unemployment Rate in Lake Petersburg is 2.3%.