Zip Codes with the Highest Percentage of Population Employed in Life, Physical & Social Science in Crystal Lake, IL
RELATED REPORTS & OPTIONS
Life, Physical & Social Science
Crystal Lake
Compare Zip Codes
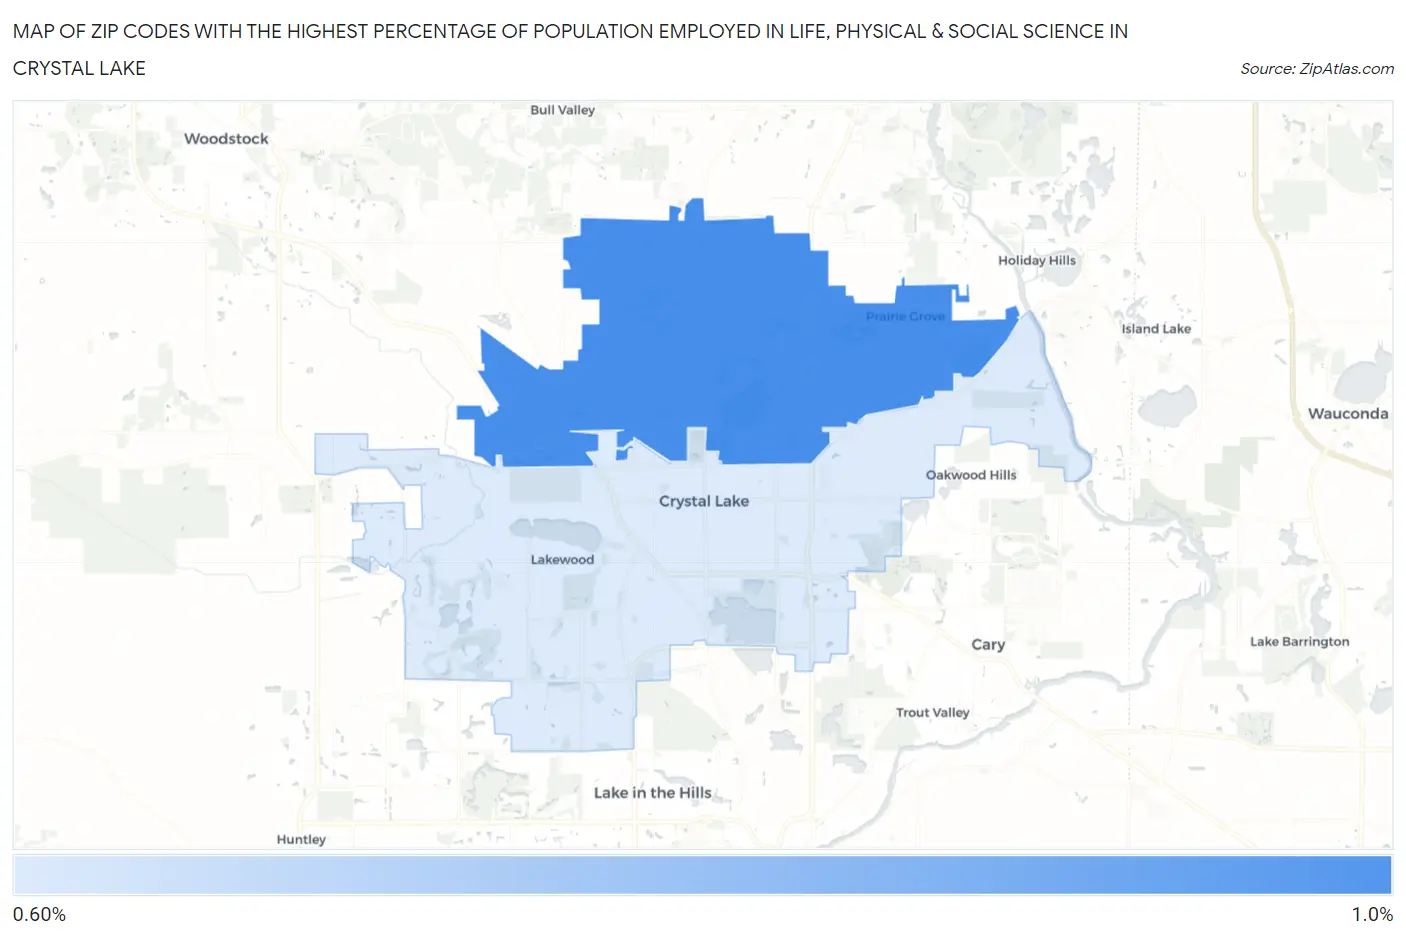
Map of Zip Codes with the Highest Percentage of Population Employed in Life, Physical & Social Science in Crystal Lake
0.69%
0.94%
Zip Codes with the Highest Percentage of Population Employed in Life, Physical & Social Science in Crystal Lake, IL
| Zip Code | % Employed | vs State | vs National | |
| 1. | 60012 | 0.94% | 0.98%(-0.043)#355 | 1.1%(-0.155)#9,610 |
| 2. | 60014 | 0.69% | 0.98%(-0.287)#462 | 1.1%(-0.399)#12,137 |
1
Common Questions
What are the Top Zip Codes with the Highest Percentage of Population Employed in Life, Physical & Social Science in Crystal Lake, IL?
Top Zip Codes with the Highest Percentage of Population Employed in Life, Physical & Social Science in Crystal Lake, IL are:
What zip code has the Highest Percentage of Population Employed in Life, Physical & Social Science in Crystal Lake, IL?
60012 has the Highest Percentage of Population Employed in Life, Physical & Social Science in Crystal Lake, IL with 0.94%.
What is the Percentage of Population Employed in Life, Physical & Social Science in Crystal Lake, IL?
Percentage of Population Employed in Life, Physical & Social Science in Crystal Lake is 0.45%.
What is the Percentage of Population Employed in Life, Physical & Social Science in Illinois?
Percentage of Population Employed in Life, Physical & Social Science in Illinois is 0.98%.
What is the Percentage of Population Employed in Life, Physical & Social Science in the United States?
Percentage of Population Employed in Life, Physical & Social Science in the United States is 1.1%.