Urbana, IL Map & Demographics
Urbana Map
Urbana Overview
$28,954
PER CAPITA INCOME
$80,916
AVG FAMILY INCOME
$41,115
AVG HOUSEHOLD INCOME
9.6%
WAGE / INCOME GAP [ % ]
90.4¢/ $1
WAGE / INCOME GAP [ $ ]
$10,448
FAMILY INCOME DEFICIT
0.54
INEQUALITY / GINI INDEX
38,741
TOTAL POPULATION
19,168
MALE POPULATION
19,573
FEMALE POPULATION
97.93
MALES / 100 FEMALES
102.11
FEMALES / 100 MALES
25.5
MEDIAN AGE
2.8
AVG FAMILY SIZE
2.0
AVG HOUSEHOLD SIZE
20,287
LABOR FORCE [ PEOPLE ]
58.0%
PERCENT IN LABOR FORCE
5.7%
UNEMPLOYMENT RATE
Urbana Area Codes
Income in Urbana
Income Overview in Urbana
Per Capita Income in Urbana is $28,954, while median incomes of families and households are $80,916 and $41,115 respectively.
| Characteristic | Number | Measure |
| Per Capita Income | 38,741 | $28,954 |
| Median Family Income | 5,847 | $80,916 |
| Mean Family Income | 5,847 | $105,414 |
| Median Household Income | 16,380 | $41,115 |
| Mean Household Income | 16,380 | $64,991 |
| Income Deficit | 5,847 | $10,448 |
| Wage / Income Gap (%) | 38,741 | 9.58% |
| Wage / Income Gap ($) | 38,741 | 90.42¢ per $1 |
| Gini / Inequality Index | 38,741 | 0.54 |
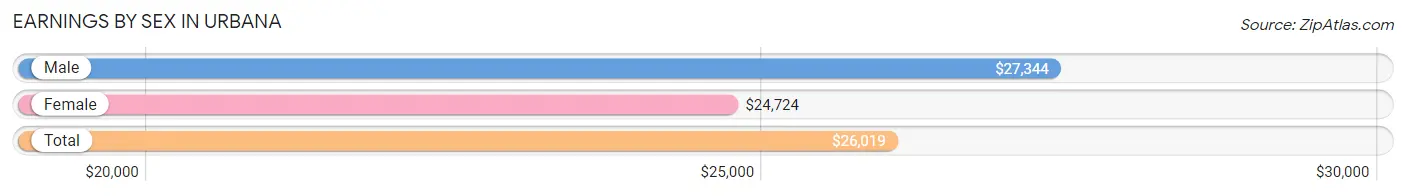
Earnings by Sex in Urbana
Average Earnings in Urbana are $26,019, $27,344 for men and $24,724 for women, a difference of 9.6%.
| Sex | Number | Average Earnings |
| Male | 11,726 (51.1%) | $27,344 |
| Female | 11,213 (48.9%) | $24,724 |
| Total | 22,939 (100.0%) | $26,019 |
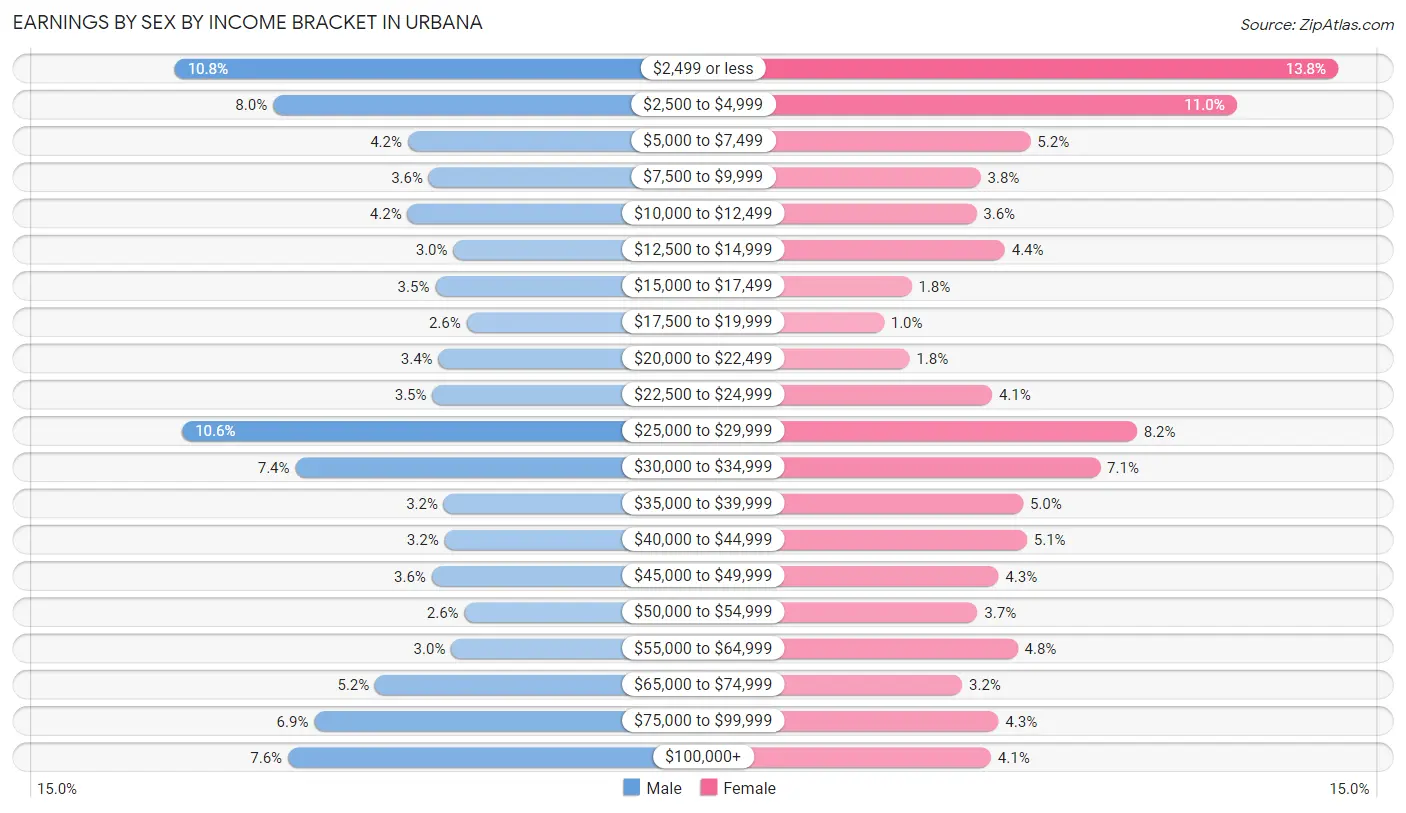
Earnings by Sex by Income Bracket in Urbana
The most common earnings brackets in Urbana are $2,499 or less for men (1,264 | 10.8%) and $2,499 or less for women (1,547 | 13.8%).
| Income | Male | Female |
| $2,499 or less | 1,264 (10.8%) | 1,547 (13.8%) |
| $2,500 to $4,999 | 940 (8.0%) | 1,228 (11.0%) |
| $5,000 to $7,499 | 496 (4.2%) | 579 (5.2%) |
| $7,500 to $9,999 | 427 (3.6%) | 422 (3.8%) |
| $10,000 to $12,499 | 497 (4.2%) | 408 (3.6%) |
| $12,500 to $14,999 | 346 (2.9%) | 498 (4.4%) |
| $15,000 to $17,499 | 406 (3.5%) | 204 (1.8%) |
| $17,500 to $19,999 | 302 (2.6%) | 117 (1.0%) |
| $20,000 to $22,499 | 395 (3.4%) | 197 (1.8%) |
| $22,500 to $24,999 | 415 (3.5%) | 457 (4.1%) |
| $25,000 to $29,999 | 1,240 (10.6%) | 914 (8.2%) |
| $30,000 to $34,999 | 866 (7.4%) | 798 (7.1%) |
| $35,000 to $39,999 | 378 (3.2%) | 555 (5.0%) |
| $40,000 to $44,999 | 375 (3.2%) | 567 (5.1%) |
| $45,000 to $49,999 | 417 (3.6%) | 478 (4.3%) |
| $50,000 to $54,999 | 310 (2.6%) | 411 (3.7%) |
| $55,000 to $64,999 | 353 (3.0%) | 538 (4.8%) |
| $65,000 to $74,999 | 604 (5.1%) | 363 (3.2%) |
| $75,000 to $99,999 | 804 (6.9%) | 478 (4.3%) |
| $100,000+ | 891 (7.6%) | 454 (4.1%) |
| Total | 11,726 (100.0%) | 11,213 (100.0%) |
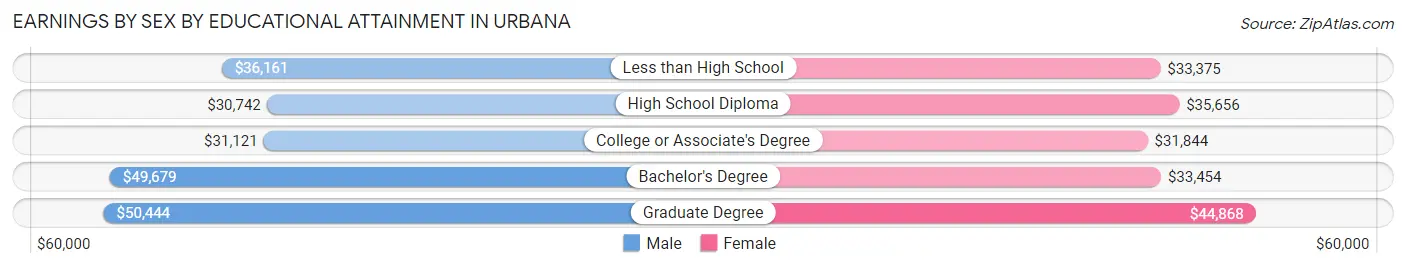
Earnings by Sex by Educational Attainment in Urbana
Average earnings in Urbana are $40,216 for men and $36,413 for women, a difference of 9.5%. Men with an educational attainment of graduate degree enjoy the highest average annual earnings of $50,444, while those with high school diploma education earn the least with $30,742. Women with an educational attainment of graduate degree earn the most with the average annual earnings of $44,868, while those with college or associate's degree education have the smallest earnings of $31,844.
| Educational Attainment | Male Income | Female Income |
| Less than High School | $36,161 | $33,375 |
| High School Diploma | $30,742 | $35,656 |
| College or Associate's Degree | $31,121 | $31,844 |
| Bachelor's Degree | $49,679 | $33,454 |
| Graduate Degree | $50,444 | $44,868 |
| Total | $40,216 | $36,413 |
Family Income in Urbana
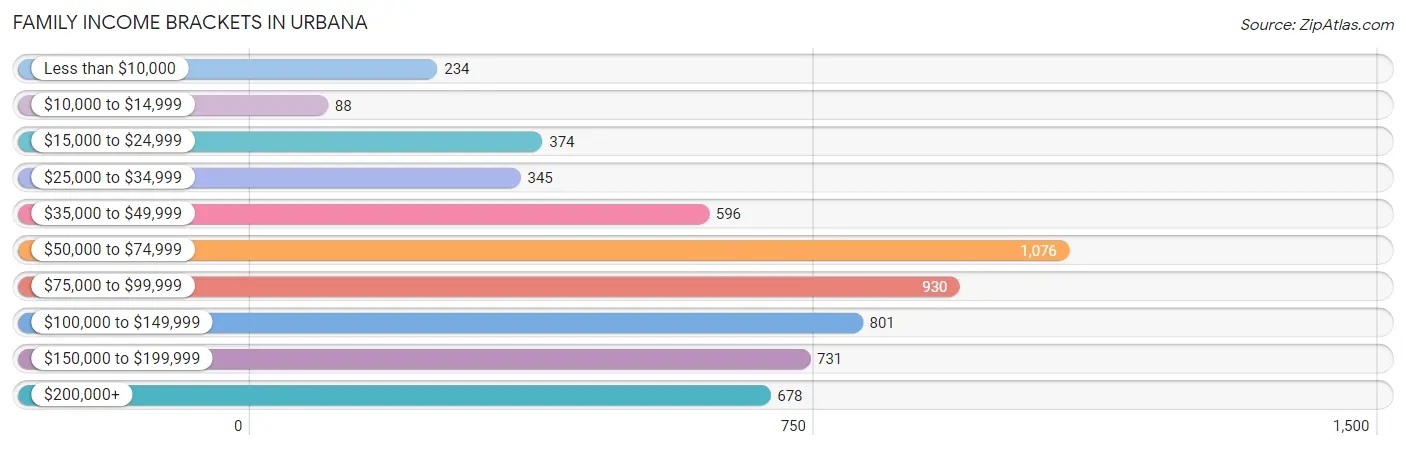
Family Income Brackets in Urbana
According to the Urbana family income data, there are 1,076 families falling into the $50,000 to $74,999 income range, which is the most common income bracket and makes up 18.4% of all families. Conversely, the $10,000 to $14,999 income bracket is the least frequent group with only 88 families (1.5%) belonging to this category.
| Income Bracket | # Families | % Families |
| Less than $10,000 | 234 | 4.0% |
| $10,000 to $14,999 | 88 | 1.5% |
| $15,000 to $24,999 | 374 | 6.4% |
| $25,000 to $34,999 | 345 | 5.9% |
| $35,000 to $49,999 | 596 | 10.2% |
| $50,000 to $74,999 | 1,076 | 18.4% |
| $75,000 to $99,999 | 930 | 15.9% |
| $100,000 to $149,999 | 801 | 13.7% |
| $150,000 to $199,999 | 731 | 12.5% |
| $200,000+ | 678 | 11.6% |
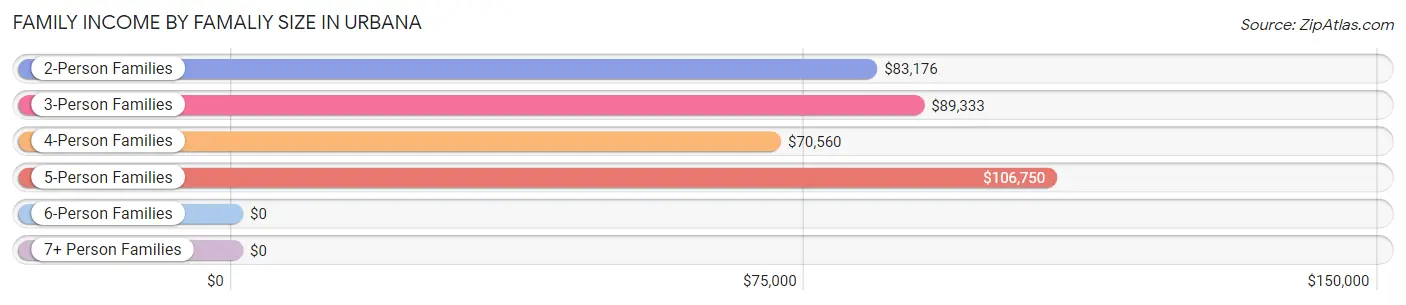
Family Income by Famaliy Size in Urbana
5-person families (232 | 4.0%) account for the highest median family income in Urbana with $106,750 per family, while 2-person families (3,629 | 62.1%) have the highest median income of $41,588 per family member.
| Income Bracket | # Families | Median Income |
| 2-Person Families | 3,629 (62.1%) | $83,176 |
| 3-Person Families | 1,052 (18.0%) | $89,333 |
| 4-Person Families | 890 (15.2%) | $70,560 |
| 5-Person Families | 232 (4.0%) | $106,750 |
| 6-Person Families | 9 (0.2%) | $0 |
| 7+ Person Families | 35 (0.6%) | $0 |
| Total | 5,847 (100.0%) | $80,916 |
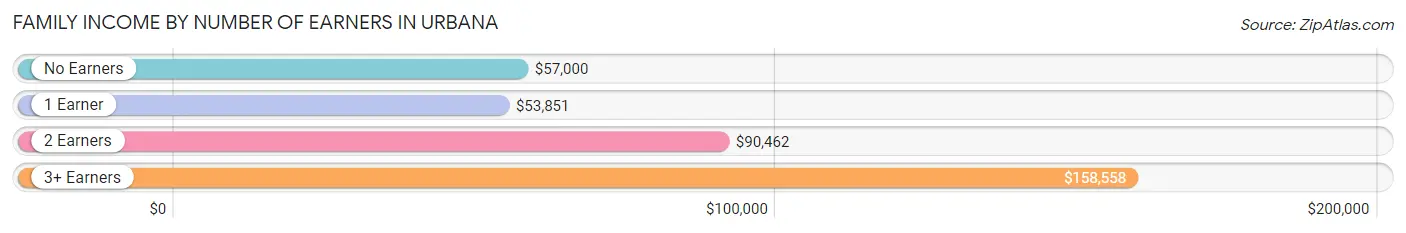
Family Income by Number of Earners in Urbana
The median family income in Urbana is $80,916, with families comprising 3+ earners (251) having the highest median family income of $158,558, while families with 1 earner (1,832) have the lowest median family income of $53,851, accounting for 4.3% and 31.3% of families, respectively.
| Number of Earners | # Families | Median Income |
| No Earners | 950 (16.3%) | $57,000 |
| 1 Earner | 1,832 (31.3%) | $53,851 |
| 2 Earners | 2,814 (48.1%) | $90,462 |
| 3+ Earners | 251 (4.3%) | $158,558 |
| Total | 5,847 (100.0%) | $80,916 |
Household Income in Urbana
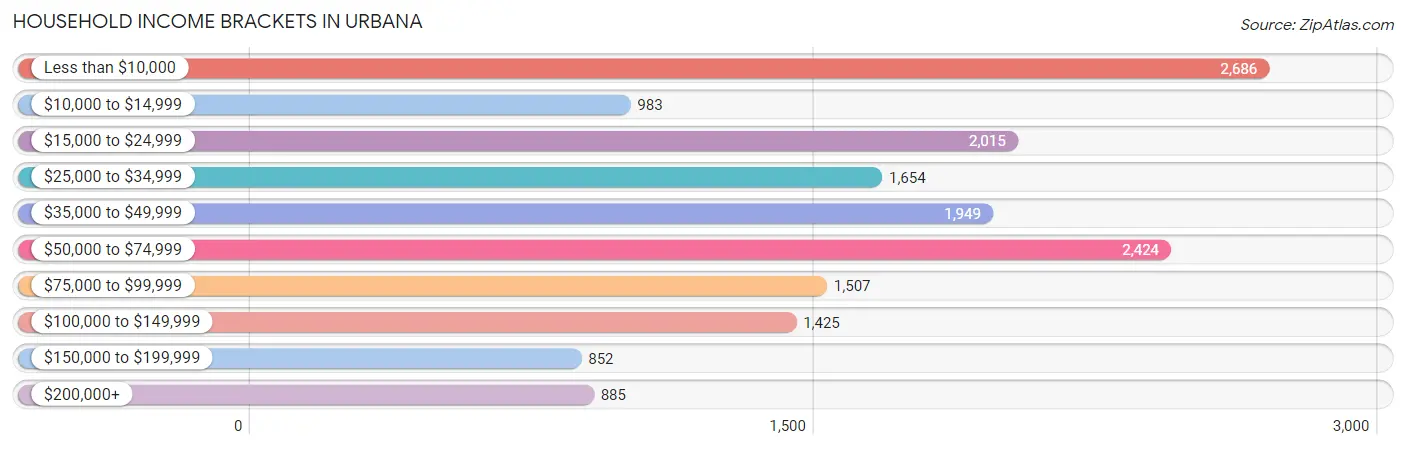
Household Income Brackets in Urbana
With 2,686 households falling in the category, the less than $10,000 income range is the most frequent in Urbana, accounting for 16.4% of all households. In contrast, only 852 households (5.2%) fall into the $150,000 to $199,999 income bracket, making it the least populous group.
| Income Bracket | # Households | % Households |
| Less than $10,000 | 2,686 | 16.4% |
| $10,000 to $14,999 | 983 | 6.0% |
| $15,000 to $24,999 | 2,015 | 12.3% |
| $25,000 to $34,999 | 1,654 | 10.1% |
| $35,000 to $49,999 | 1,949 | 11.9% |
| $50,000 to $74,999 | 2,424 | 14.8% |
| $75,000 to $99,999 | 1,507 | 9.2% |
| $100,000 to $149,999 | 1,425 | 8.7% |
| $150,000 to $199,999 | 852 | 5.2% |
| $200,000+ | 885 | 5.4% |
Household Income by Householder Age in Urbana
The median household income in Urbana is $41,115, with the highest median household income of $61,250 found in the 65+ years age bracket for the primary householder. A total of 2,877 households (17.6%) fall into this category. Meanwhile, the 15 to 24 years age bracket for the primary householder has the lowest median household income of $16,044, with 4,469 households (27.3%) in this group.
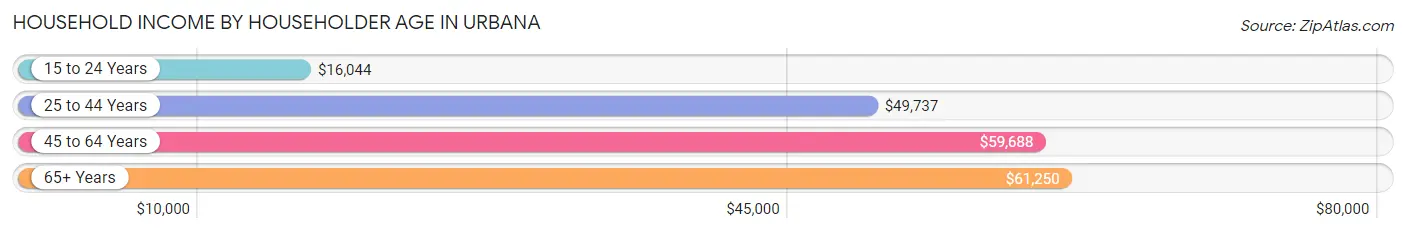
| Income Bracket | # Households | Median Income |
| 15 to 24 Years | 4,469 (27.3%) | $16,044 |
| 25 to 44 Years | 5,581 (34.1%) | $49,737 |
| 45 to 64 Years | 3,453 (21.1%) | $59,688 |
| 65+ Years | 2,877 (17.6%) | $61,250 |
| Total | 16,380 (100.0%) | $41,115 |
Poverty in Urbana
Income Below Poverty by Sex and Age in Urbana
With 27.0% poverty level for males and 28.3% for females among the residents of Urbana, 18 to 24 year old males and 18 to 24 year old females are the most vulnerable to poverty, with 2,690 males (52.5%) and 2,951 females (70.4%) in their respective age groups living below the poverty level.
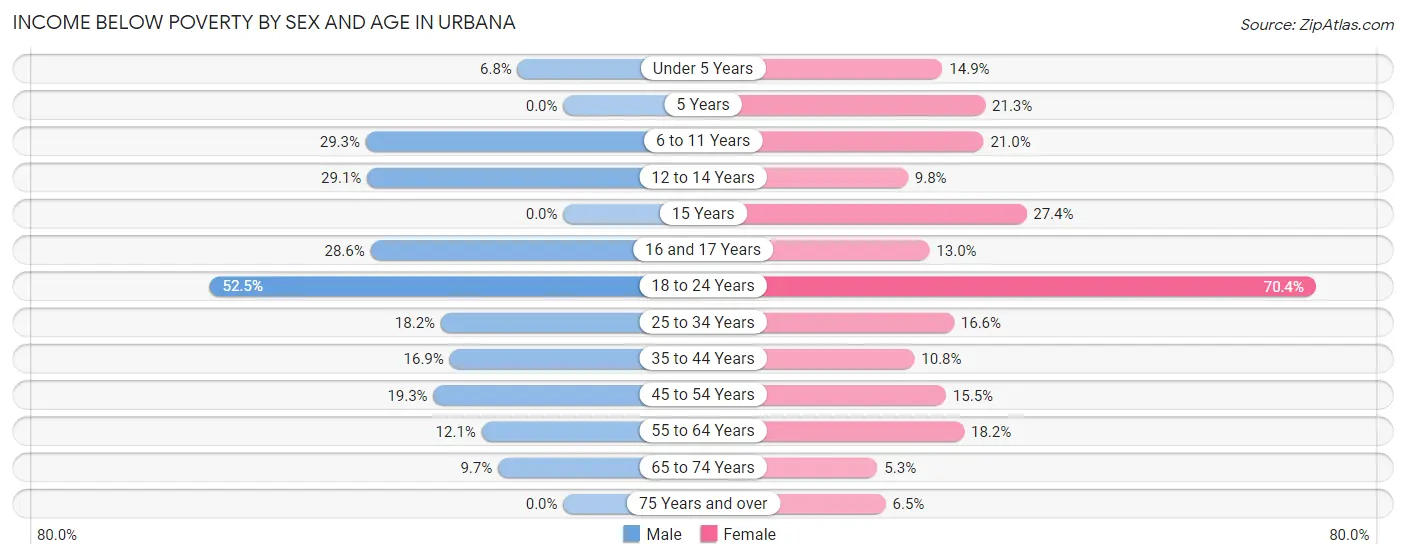
| Age Bracket | Male | Female |
| Under 5 Years | 44 (6.8%) | 131 (14.9%) |
| 5 Years | 0 (0.0%) | 20 (21.3%) |
| 6 to 11 Years | 115 (29.3%) | 93 (21.0%) |
| 12 to 14 Years | 120 (29.1%) | 42 (9.8%) |
| 15 Years | 0 (0.0%) | 20 (27.4%) |
| 16 and 17 Years | 75 (28.6%) | 16 (13.0%) |
| 18 to 24 Years | 2,690 (52.5%) | 2,951 (70.4%) |
| 25 to 34 Years | 613 (18.2%) | 578 (16.6%) |
| 35 to 44 Years | 257 (16.9%) | 151 (10.8%) |
| 45 to 54 Years | 208 (19.3%) | 231 (15.5%) |
| 55 to 64 Years | 160 (12.1%) | 289 (18.1%) |
| 65 to 74 Years | 118 (9.7%) | 63 (5.3%) |
| 75 Years and over | 0 (0.0%) | 67 (6.5%) |
| Total | 4,400 (27.0%) | 4,652 (28.3%) |
Income Above Poverty by Sex and Age in Urbana
According to the poverty statistics in Urbana, males aged 5 years and females aged 65 to 74 years are the age groups that are most secure financially, with 100.0% of males and 94.7% of females in these age groups living above the poverty line.
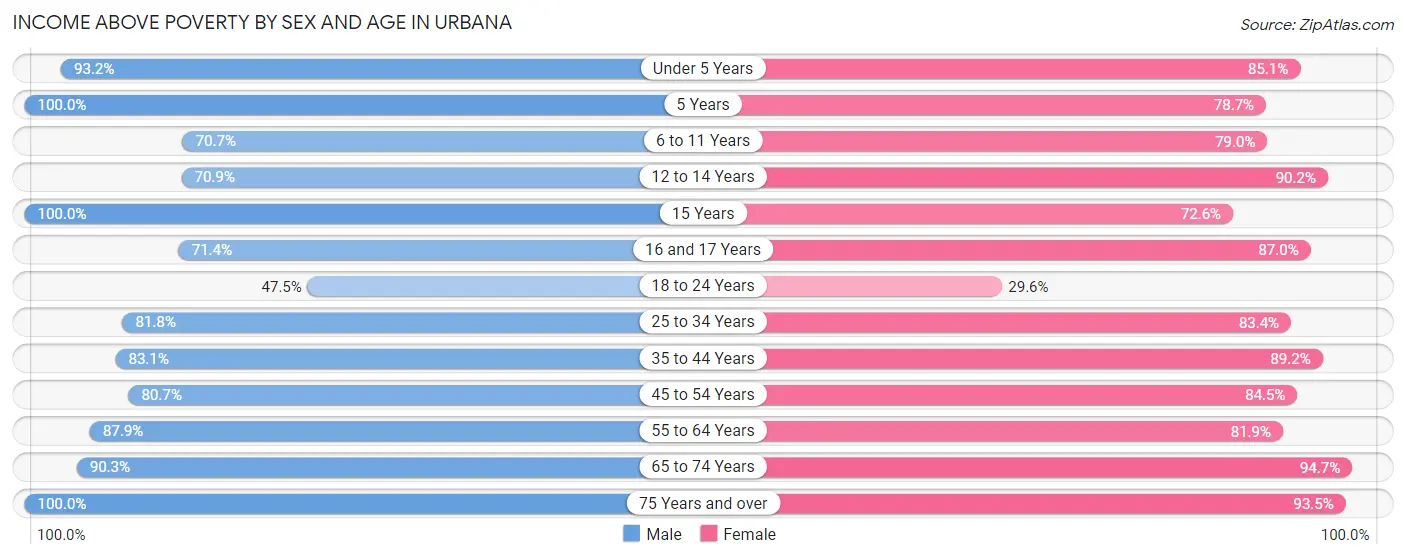
| Age Bracket | Male | Female |
| Under 5 Years | 605 (93.2%) | 746 (85.1%) |
| 5 Years | 58 (100.0%) | 74 (78.7%) |
| 6 to 11 Years | 277 (70.7%) | 349 (79.0%) |
| 12 to 14 Years | 292 (70.9%) | 386 (90.2%) |
| 15 Years | 214 (100.0%) | 53 (72.6%) |
| 16 and 17 Years | 187 (71.4%) | 107 (87.0%) |
| 18 to 24 Years | 2,431 (47.5%) | 1,242 (29.6%) |
| 25 to 34 Years | 2,759 (81.8%) | 2,896 (83.4%) |
| 35 to 44 Years | 1,265 (83.1%) | 1,250 (89.2%) |
| 45 to 54 Years | 870 (80.7%) | 1,263 (84.5%) |
| 55 to 64 Years | 1,159 (87.9%) | 1,303 (81.9%) |
| 65 to 74 Years | 1,099 (90.3%) | 1,129 (94.7%) |
| 75 Years and over | 687 (100.0%) | 963 (93.5%) |
| Total | 11,903 (73.0%) | 11,761 (71.7%) |
Income Below Poverty Among Married-Couple Families in Urbana
The poverty statistics for married-couple families in Urbana show that 3.8% or 165 of the total 4,344 families live below the poverty line. Families with 1 or 2 children have the highest poverty rate of 6.3%, comprising of 78 families. On the other hand, families with 3 or 4 children have the lowest poverty rate of 0.0%, which includes 0 families.
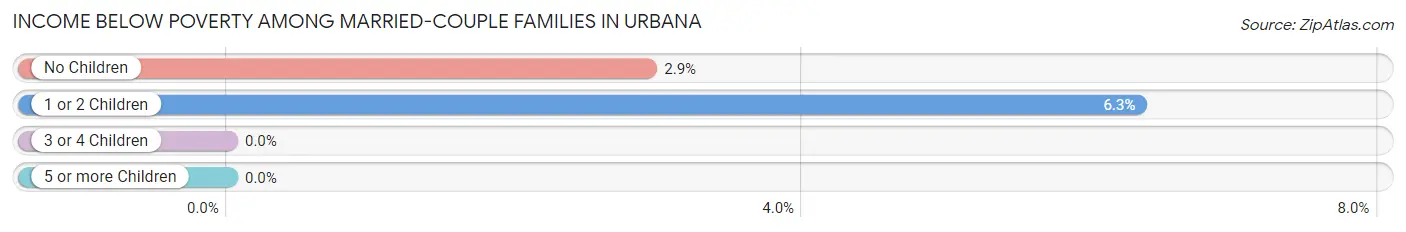
| Children | Above Poverty | Below Poverty |
| No Children | 2,892 (97.1%) | 87 (2.9%) |
| 1 or 2 Children | 1,154 (93.7%) | 78 (6.3%) |
| 3 or 4 Children | 133 (100.0%) | 0 (0.0%) |
| 5 or more Children | 0 (0.0%) | 0 (0.0%) |
| Total | 4,179 (96.2%) | 165 (3.8%) |
Income Below Poverty Among Single-Parent Households in Urbana
According to the poverty data in Urbana, 31.4% or 140 single-father households and 22.9% or 242 single-mother households are living below the poverty line. Among single-father households, those with 1 or 2 children have the highest poverty rate, with 78 households (52.7%) experiencing poverty. Likewise, among single-mother households, those with 3 or 4 children have the highest poverty rate, with 51 households (32.1%) falling below the poverty line.
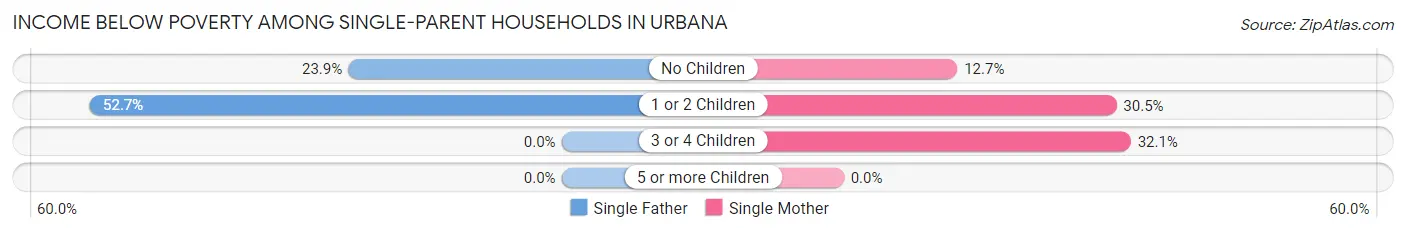
| Children | Single Father | Single Mother |
| No Children | 62 (23.8%) | 59 (12.7%) |
| 1 or 2 Children | 78 (52.7%) | 132 (30.5%) |
| 3 or 4 Children | 0 (0.0%) | 51 (32.1%) |
| 5 or more Children | 0 (0.0%) | 0 (0.0%) |
| Total | 140 (31.4%) | 242 (22.9%) |
Income Below Poverty Among Married-Couple vs Single-Parent Households in Urbana
The poverty data for Urbana shows that 165 of the married-couple family households (3.8%) and 382 of the single-parent households (25.4%) are living below the poverty level. Within the married-couple family households, those with 1 or 2 children have the highest poverty rate, with 78 households (6.3%) falling below the poverty line. Among the single-parent households, those with 1 or 2 children have the highest poverty rate, with 210 household (36.1%) living below poverty.
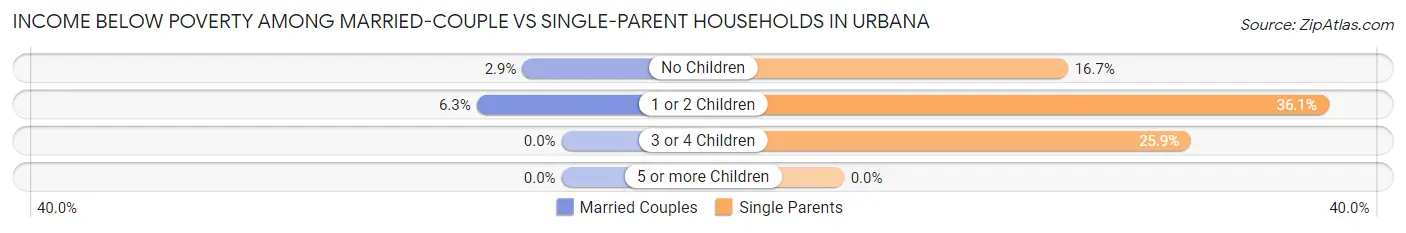
| Children | Married-Couple Families | Single-Parent Households |
| No Children | 87 (2.9%) | 121 (16.7%) |
| 1 or 2 Children | 78 (6.3%) | 210 (36.1%) |
| 3 or 4 Children | 0 (0.0%) | 51 (25.9%) |
| 5 or more Children | 0 (0.0%) | 0 (0.0%) |
| Total | 165 (3.8%) | 382 (25.4%) |
Race in Urbana
The most populous races in Urbana are White / Caucasian (23,351 | 60.3%), Black / African American (6,565 | 17.0%), and Asian (5,689 | 14.7%).
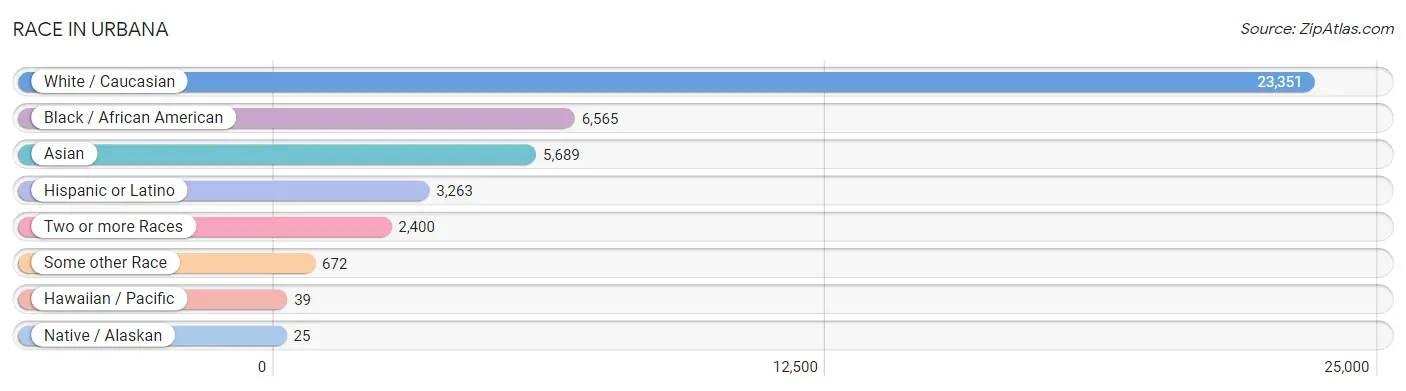
| Race | # Population | % Population |
| Asian | 5,689 | 14.7% |
| Black / African American | 6,565 | 17.0% |
| Hawaiian / Pacific | 39 | 0.1% |
| Hispanic or Latino | 3,263 | 8.4% |
| Native / Alaskan | 25 | 0.1% |
| White / Caucasian | 23,351 | 60.3% |
| Two or more Races | 2,400 | 6.2% |
| Some other Race | 672 | 1.7% |
| Total | 38,741 | 100.0% |
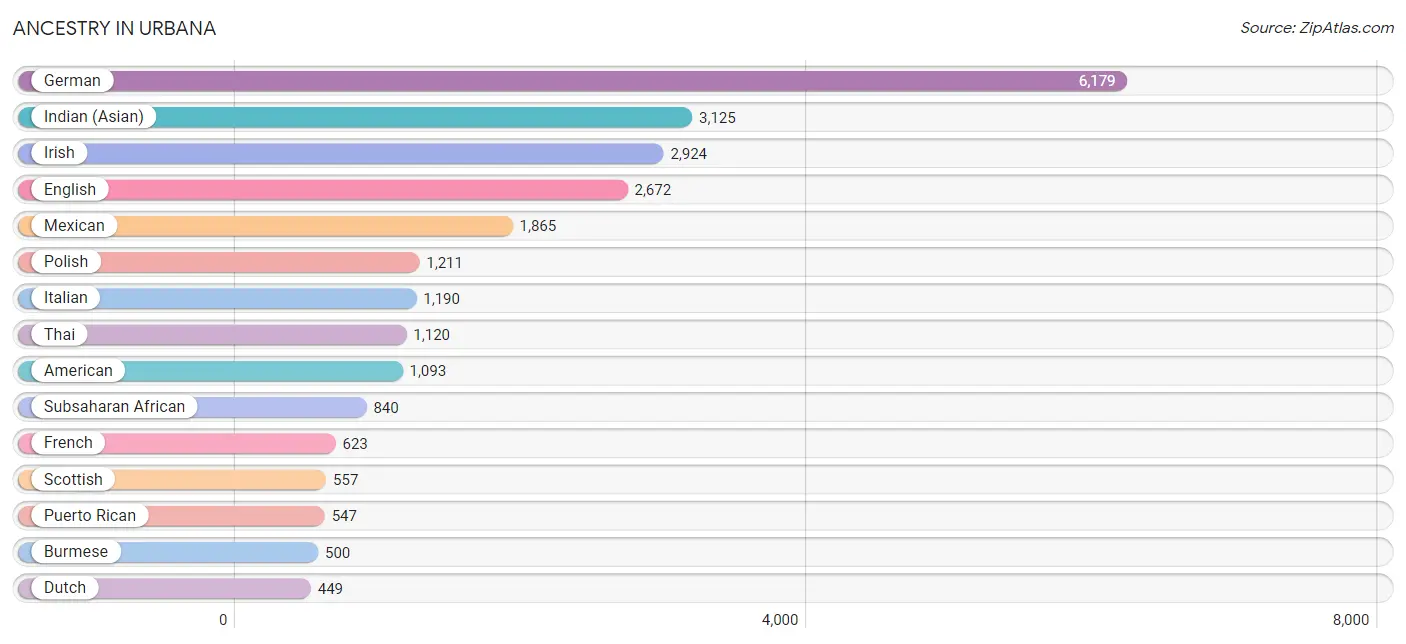
Ancestry in Urbana
The most populous ancestries reported in Urbana are German (6,179 | 16.0%), Indian (Asian) (3,125 | 8.1%), Irish (2,924 | 7.5%), English (2,672 | 6.9%), and Mexican (1,865 | 4.8%), together accounting for 43.3% of all Urbana residents.
| Ancestry | # Population | % Population |
| African | 228 | 0.6% |
| Albanian | 22 | 0.1% |
| Alsatian | 19 | 0.1% |
| American | 1,093 | 2.8% |
| Apache | 21 | 0.1% |
| Arab | 357 | 0.9% |
| Argentinean | 25 | 0.1% |
| Austrian | 97 | 0.3% |
| Belgian | 33 | 0.1% |
| Bhutanese | 239 | 0.6% |
| Blackfeet | 15 | 0.0% |
| Bolivian | 3 | 0.0% |
| Brazilian | 114 | 0.3% |
| British | 249 | 0.6% |
| Burmese | 500 | 1.3% |
| Cambodian | 37 | 0.1% |
| Central American | 109 | 0.3% |
| Central American Indian | 4 | 0.0% |
| Cherokee | 14 | 0.0% |
| Chilean | 75 | 0.2% |
| Colombian | 181 | 0.5% |
| Croatian | 26 | 0.1% |
| Cuban | 35 | 0.1% |
| Czech | 262 | 0.7% |
| Czechoslovakian | 26 | 0.1% |
| Danish | 94 | 0.2% |
| Dutch | 449 | 1.2% |
| Eastern European | 140 | 0.4% |
| Ecuadorian | 27 | 0.1% |
| Egyptian | 70 | 0.2% |
| English | 2,672 | 6.9% |
| Estonian | 61 | 0.2% |
| Ethiopian | 223 | 0.6% |
| European | 377 | 1.0% |
| Filipino | 133 | 0.3% |
| Finnish | 27 | 0.1% |
| French | 623 | 1.6% |
| French Canadian | 138 | 0.4% |
| German | 6,179 | 16.0% |
| German Russian | 122 | 0.3% |
| Ghanaian | 54 | 0.1% |
| Greek | 221 | 0.6% |
| Guatemalan | 33 | 0.1% |
| Hungarian | 155 | 0.4% |
| Icelander | 24 | 0.1% |
| Indian (Asian) | 3,125 | 8.1% |
| Indonesian | 9 | 0.0% |
| Iranian | 336 | 0.9% |
| Iraqi | 15 | 0.0% |
| Irish | 2,924 | 7.5% |
| Iroquois | 9 | 0.0% |
| Israeli | 42 | 0.1% |
| Italian | 1,190 | 3.1% |
| Japanese | 9 | 0.0% |
| Jordanian | 6 | 0.0% |
| Kenyan | 16 | 0.0% |
| Korean | 200 | 0.5% |
| Laotian | 61 | 0.2% |
| Lebanese | 22 | 0.1% |
| Liberian | 14 | 0.0% |
| Lithuanian | 235 | 0.6% |
| Malaysian | 141 | 0.4% |
| Mexican | 1,865 | 4.8% |
| Mexican American Indian | 13 | 0.0% |
| Native Hawaiian | 22 | 0.1% |
| Nicaraguan | 6 | 0.0% |
| Nigerian | 105 | 0.3% |
| Northern European | 119 | 0.3% |
| Norwegian | 300 | 0.8% |
| Okinawan | 9 | 0.0% |
| Pakistani | 63 | 0.2% |
| Palestinian | 6 | 0.0% |
| Paraguayan | 6 | 0.0% |
| Pennsylvania German | 41 | 0.1% |
| Peruvian | 22 | 0.1% |
| Polish | 1,211 | 3.1% |
| Portuguese | 92 | 0.2% |
| Puerto Rican | 547 | 1.4% |
| Romanian | 45 | 0.1% |
| Russian | 272 | 0.7% |
| Salvadoran | 70 | 0.2% |
| Samoan | 21 | 0.1% |
| Scandinavian | 137 | 0.4% |
| Scotch-Irish | 361 | 0.9% |
| Scottish | 557 | 1.4% |
| Sioux | 13 | 0.0% |
| Slavic | 28 | 0.1% |
| Slovak | 50 | 0.1% |
| Slovene | 41 | 0.1% |
| South African | 118 | 0.3% |
| South American | 369 | 0.9% |
| Spaniard | 111 | 0.3% |
| Spanish | 29 | 0.1% |
| Sri Lankan | 184 | 0.5% |
| Subsaharan African | 840 | 2.2% |
| Swedish | 270 | 0.7% |
| Swiss | 149 | 0.4% |
| Syrian | 16 | 0.0% |
| Thai | 1,120 | 2.9% |
| Turkish | 77 | 0.2% |
| U.S. Virgin Islander | 39 | 0.1% |
| Ugandan | 13 | 0.0% |
| Ukrainian | 102 | 0.3% |
| Venezuelan | 30 | 0.1% |
| Vietnamese | 120 | 0.3% |
| Welsh | 194 | 0.5% | View All 106 Rows |
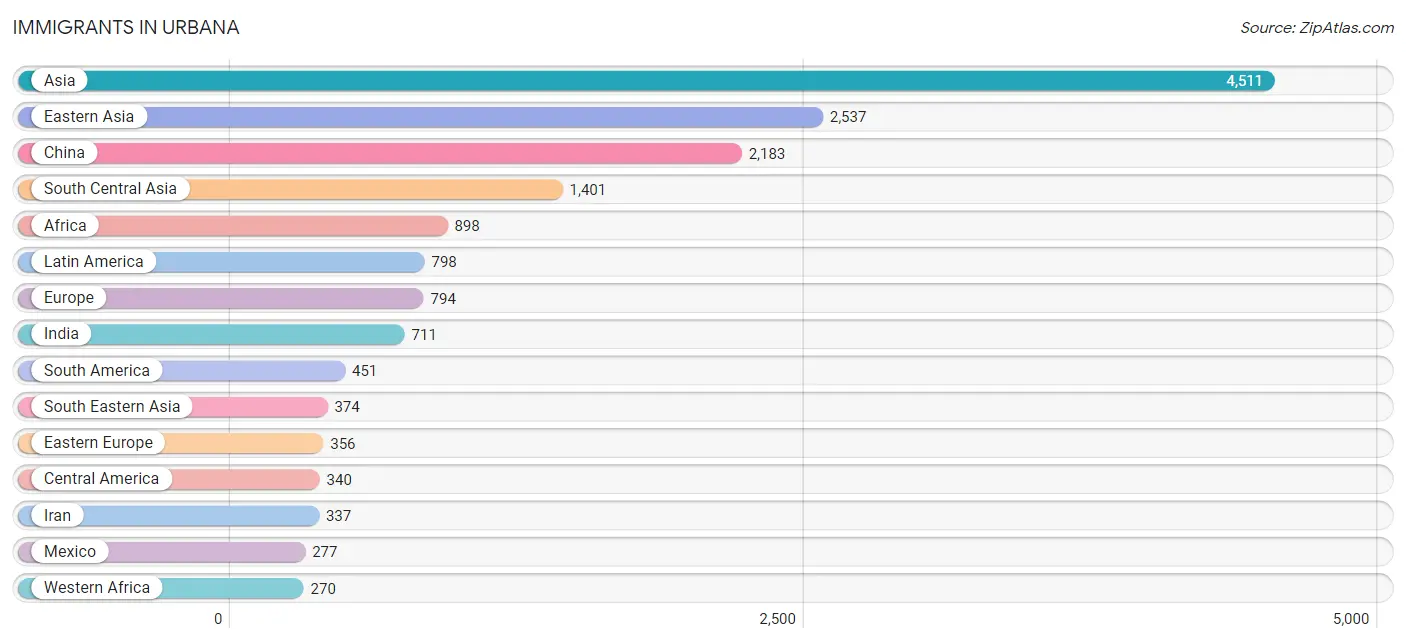
Immigrants in Urbana
The most numerous immigrant groups reported in Urbana came from Asia (4,511 | 11.6%), Eastern Asia (2,537 | 6.6%), China (2,183 | 5.6%), South Central Asia (1,401 | 3.6%), and Africa (898 | 2.3%), together accounting for 29.8% of all Urbana residents.
| Immigration Origin | # Population | % Population |
| Afghanistan | 3 | 0.0% |
| Africa | 898 | 2.3% |
| Albania | 8 | 0.0% |
| Asia | 4,511 | 11.6% |
| Bangladesh | 145 | 0.4% |
| Belize | 23 | 0.1% |
| Brazil | 120 | 0.3% |
| Canada | 116 | 0.3% |
| Caribbean | 7 | 0.0% |
| Central America | 340 | 0.9% |
| Chile | 75 | 0.2% |
| China | 2,183 | 5.6% |
| Colombia | 217 | 0.6% |
| Congo | 106 | 0.3% |
| Cuba | 7 | 0.0% |
| Czechoslovakia | 102 | 0.3% |
| Eastern Africa | 240 | 0.6% |
| Eastern Asia | 2,537 | 6.6% |
| Eastern Europe | 356 | 0.9% |
| Ecuador | 27 | 0.1% |
| Egypt | 70 | 0.2% |
| El Salvador | 28 | 0.1% |
| England | 44 | 0.1% |
| Ethiopia | 170 | 0.4% |
| Europe | 794 | 2.1% |
| France | 54 | 0.1% |
| Germany | 95 | 0.3% |
| Ghana | 25 | 0.1% |
| Greece | 65 | 0.2% |
| Guatemala | 12 | 0.0% |
| Hong Kong | 70 | 0.2% |
| India | 711 | 1.8% |
| Indonesia | 64 | 0.2% |
| Iran | 337 | 0.9% |
| Iraq | 15 | 0.0% |
| Israel | 51 | 0.1% |
| Italy | 24 | 0.1% |
| Japan | 153 | 0.4% |
| Kazakhstan | 28 | 0.1% |
| Kenya | 16 | 0.0% |
| Korea | 201 | 0.5% |
| Laos | 40 | 0.1% |
| Latin America | 798 | 2.1% |
| Lebanon | 10 | 0.0% |
| Liberia | 14 | 0.0% |
| Lithuania | 60 | 0.2% |
| Mexico | 277 | 0.7% |
| Micronesia | 39 | 0.1% |
| Middle Africa | 189 | 0.5% |
| Nepal | 11 | 0.0% |
| Netherlands | 8 | 0.0% |
| Nigeria | 231 | 0.6% |
| Northern Africa | 199 | 0.5% |
| Northern Europe | 99 | 0.3% |
| Oceania | 47 | 0.1% |
| Pakistan | 134 | 0.4% |
| Peru | 3 | 0.0% |
| Philippines | 77 | 0.2% |
| Poland | 30 | 0.1% |
| Portugal | 12 | 0.0% |
| Romania | 33 | 0.1% |
| Russia | 105 | 0.3% |
| Saudi Arabia | 40 | 0.1% |
| Scotland | 13 | 0.0% |
| Singapore | 72 | 0.2% |
| South America | 451 | 1.2% |
| South Central Asia | 1,401 | 3.6% |
| South Eastern Asia | 374 | 1.0% |
| Southern Europe | 182 | 0.5% |
| Spain | 81 | 0.2% |
| Sri Lanka | 29 | 0.1% |
| Taiwan | 85 | 0.2% |
| Thailand | 24 | 0.1% |
| Turkey | 66 | 0.2% |
| Uganda | 13 | 0.0% |
| Ukraine | 18 | 0.1% |
| Uzbekistan | 3 | 0.0% |
| Venezuela | 9 | 0.0% |
| Vietnam | 97 | 0.3% |
| Western Africa | 270 | 0.7% |
| Western Asia | 199 | 0.5% |
| Western Europe | 157 | 0.4% |
| Zaire | 83 | 0.2% | View All 83 Rows |
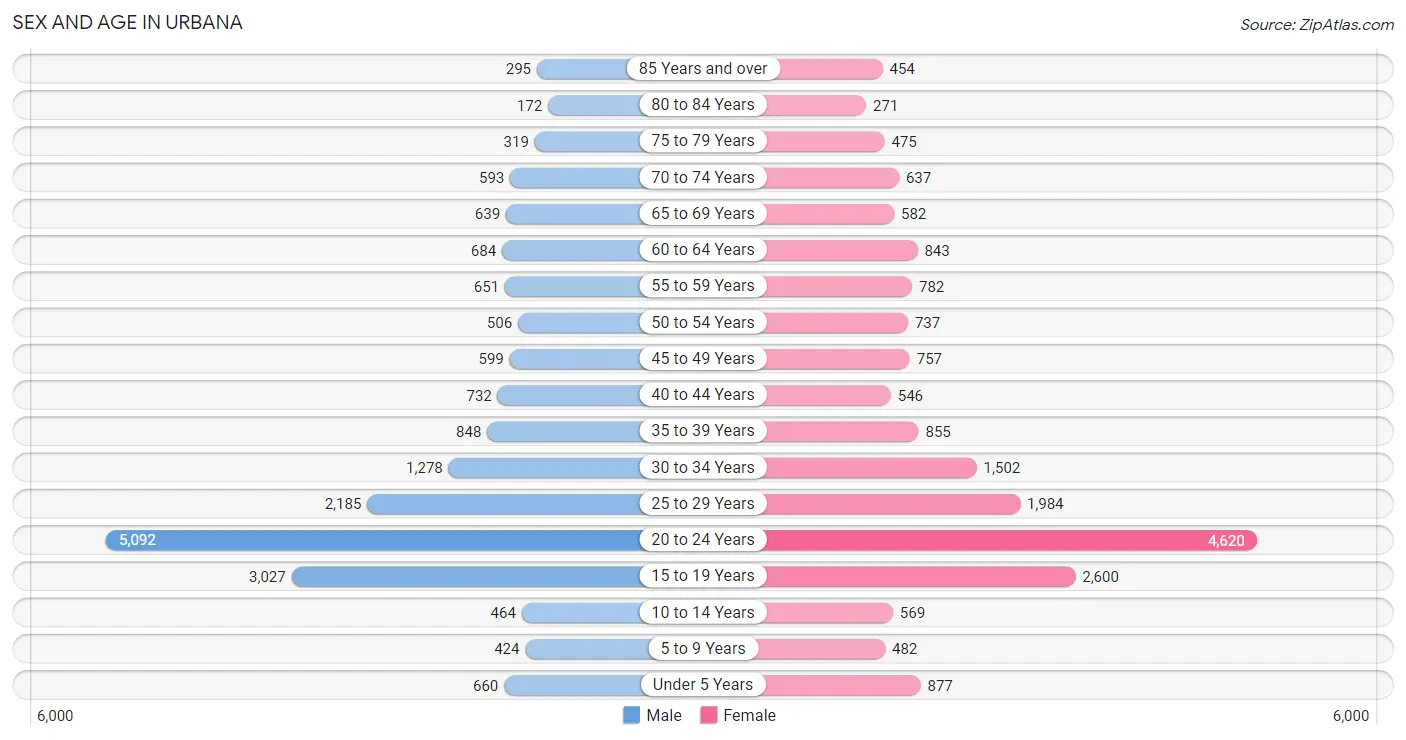
Sex and Age in Urbana
Sex and Age in Urbana
The most populous age groups in Urbana are 20 to 24 Years (5,092 | 26.6%) for men and 20 to 24 Years (4,620 | 23.6%) for women.
| Age Bracket | Male | Female |
| Under 5 Years | 660 (3.4%) | 877 (4.5%) |
| 5 to 9 Years | 424 (2.2%) | 482 (2.5%) |
| 10 to 14 Years | 464 (2.4%) | 569 (2.9%) |
| 15 to 19 Years | 3,027 (15.8%) | 2,600 (13.3%) |
| 20 to 24 Years | 5,092 (26.6%) | 4,620 (23.6%) |
| 25 to 29 Years | 2,185 (11.4%) | 1,984 (10.1%) |
| 30 to 34 Years | 1,278 (6.7%) | 1,502 (7.7%) |
| 35 to 39 Years | 848 (4.4%) | 855 (4.4%) |
| 40 to 44 Years | 732 (3.8%) | 546 (2.8%) |
| 45 to 49 Years | 599 (3.1%) | 757 (3.9%) |
| 50 to 54 Years | 506 (2.6%) | 737 (3.8%) |
| 55 to 59 Years | 651 (3.4%) | 782 (4.0%) |
| 60 to 64 Years | 684 (3.6%) | 843 (4.3%) |
| 65 to 69 Years | 639 (3.3%) | 582 (3.0%) |
| 70 to 74 Years | 593 (3.1%) | 637 (3.3%) |
| 75 to 79 Years | 319 (1.7%) | 475 (2.4%) |
| 80 to 84 Years | 172 (0.9%) | 271 (1.4%) |
| 85 Years and over | 295 (1.5%) | 454 (2.3%) |
| Total | 19,168 (100.0%) | 19,573 (100.0%) |
Families and Households in Urbana
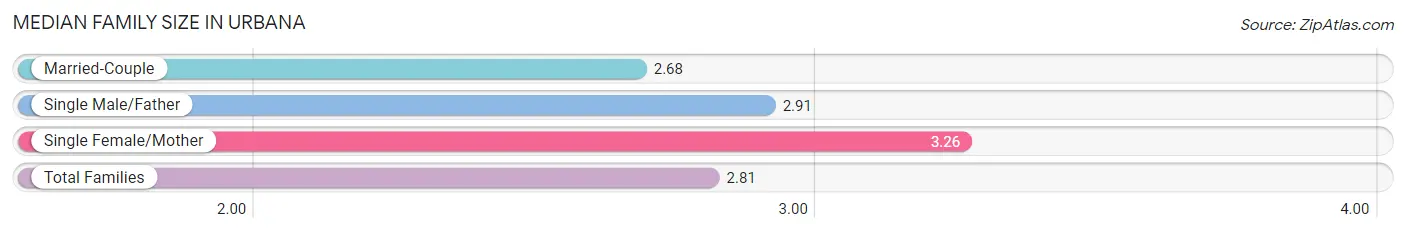
Median Family Size in Urbana
The median family size in Urbana is 2.81 persons per family, with single female/mother families (1,057 | 18.1%) accounting for the largest median family size of 3.26 persons per family. On the other hand, married-couple families (4,344 | 74.3%) represent the smallest median family size with 2.68 persons per family.
| Family Type | # Families | Family Size |
| Married-Couple | 4,344 (74.3%) | 2.68 |
| Single Male/Father | 446 (7.6%) | 2.91 |
| Single Female/Mother | 1,057 (18.1%) | 3.26 |
| Total Families | 5,847 (100.0%) | 2.81 |
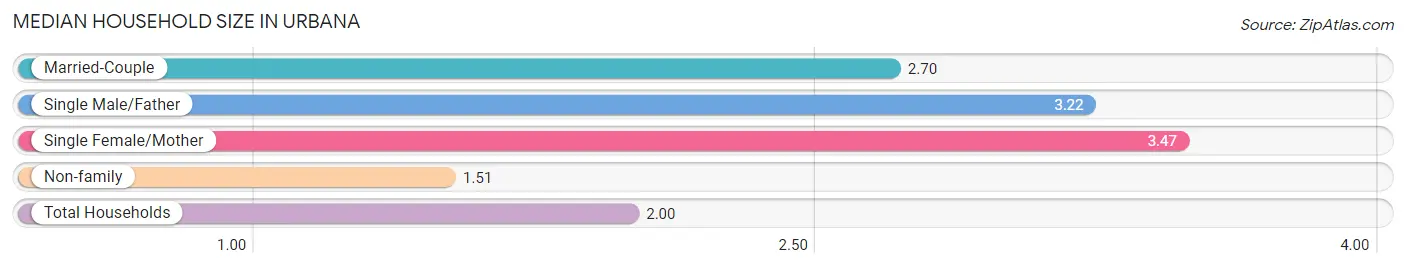
Median Household Size in Urbana
The median household size in Urbana is 2.00 persons per household, with single female/mother households (1,057 | 6.5%) accounting for the largest median household size of 3.47 persons per household. non-family households (10,533 | 64.3%) represent the smallest median household size with 1.51 persons per household.
| Household Type | # Households | Household Size |
| Married-Couple | 4,344 (26.5%) | 2.70 |
| Single Male/Father | 446 (2.7%) | 3.22 |
| Single Female/Mother | 1,057 (6.5%) | 3.47 |
| Non-family | 10,533 (64.3%) | 1.51 |
| Total Households | 16,380 (100.0%) | 2.00 |
Household Size by Marriage Status in Urbana
Out of a total of 16,380 households in Urbana, 5,847 (35.7%) are family households, while 10,533 (64.3%) are nonfamily households. The most numerous type of family households are 2-person households, comprising 3,427, and the most common type of nonfamily households are 1-person households, comprising 7,869.
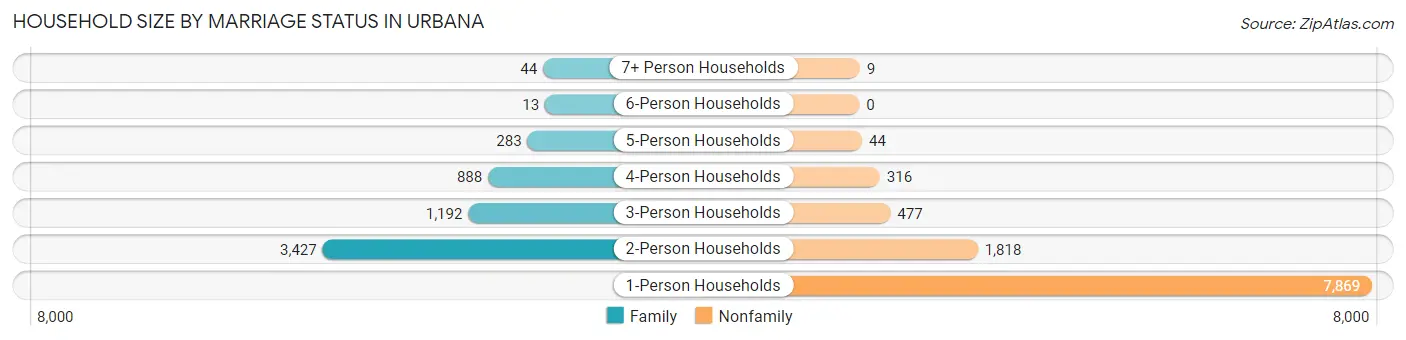
| Household Size | Family Households | Nonfamily Households |
| 1-Person Households | - | 7,869 (48.0%) |
| 2-Person Households | 3,427 (20.9%) | 1,818 (11.1%) |
| 3-Person Households | 1,192 (7.3%) | 477 (2.9%) |
| 4-Person Households | 888 (5.4%) | 316 (1.9%) |
| 5-Person Households | 283 (1.7%) | 44 (0.3%) |
| 6-Person Households | 13 (0.1%) | 0 (0.0%) |
| 7+ Person Households | 44 (0.3%) | 9 (0.1%) |
| Total | 5,847 (35.7%) | 10,533 (64.3%) |
Female Fertility in Urbana
Fertility by Age in Urbana
Average fertility rate in Urbana is 25.0 births per 1,000 women. Women in the age bracket of 35 to 50 years have the highest fertility rate with 87.0 births per 1,000 women. Women in the age bracket of 35 to 50 years acount for 63.8% of all women with births.
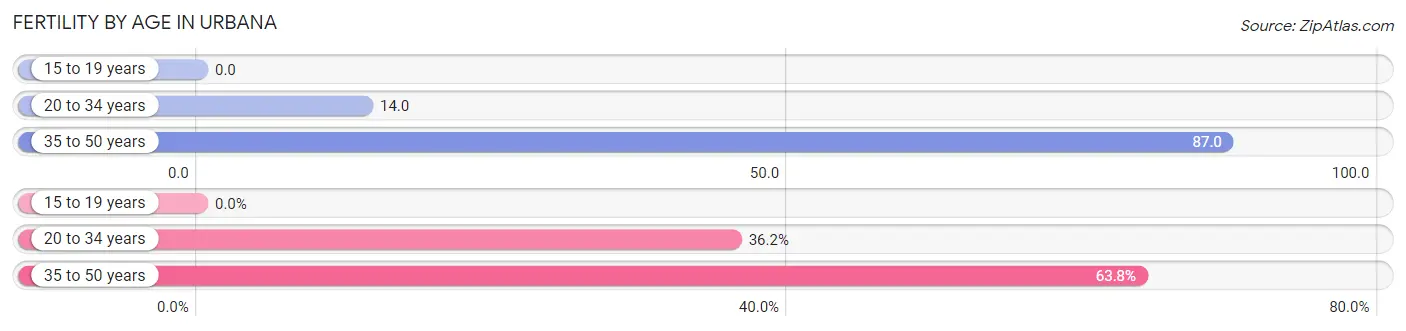
| Age Bracket | Women with Births | Births / 1,000 Women |
| 15 to 19 years | 0 (0.0%) | 0.0 |
| 20 to 34 years | 117 (36.2%) | 14.0 |
| 35 to 50 years | 206 (63.8%) | 87.0 |
| Total | 323 (100.0%) | 25.0 |
Fertility by Age by Marriage Status in Urbana
87.3% of women with births (323) in Urbana are married. The highest percentage of unmarried women with births falls into 35 to 50 years age bracket with 19.9% of them unmarried at the time of birth, while the lowest percentage of unmarried women with births belong to 20 to 34 years age bracket with 0.0% of them unmarried.
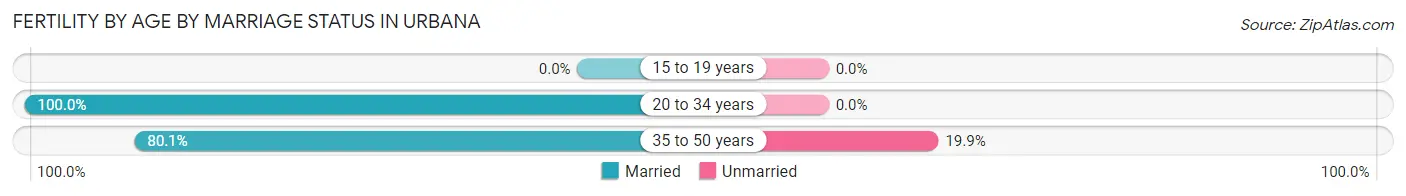
| Age Bracket | Married | Unmarried |
| 15 to 19 years | 0 (0.0%) | 0 (0.0%) |
| 20 to 34 years | 117 (100.0%) | 0 (0.0%) |
| 35 to 50 years | 165 (80.1%) | 41 (19.9%) |
| Total | 282 (87.3%) | 41 (12.7%) |
Fertility by Education in Urbana
Average fertility rate in Urbana is 25.0 births per 1,000 women. Women with the education attainment of graduate degree have the highest fertility rate of 65.0 births per 1,000 women, while women with the education attainment of college or associate's degree have the lowest fertility at 6.0 births per 1,000 women. Women with the education attainment of graduate degree represent 44.3% of all women with births.
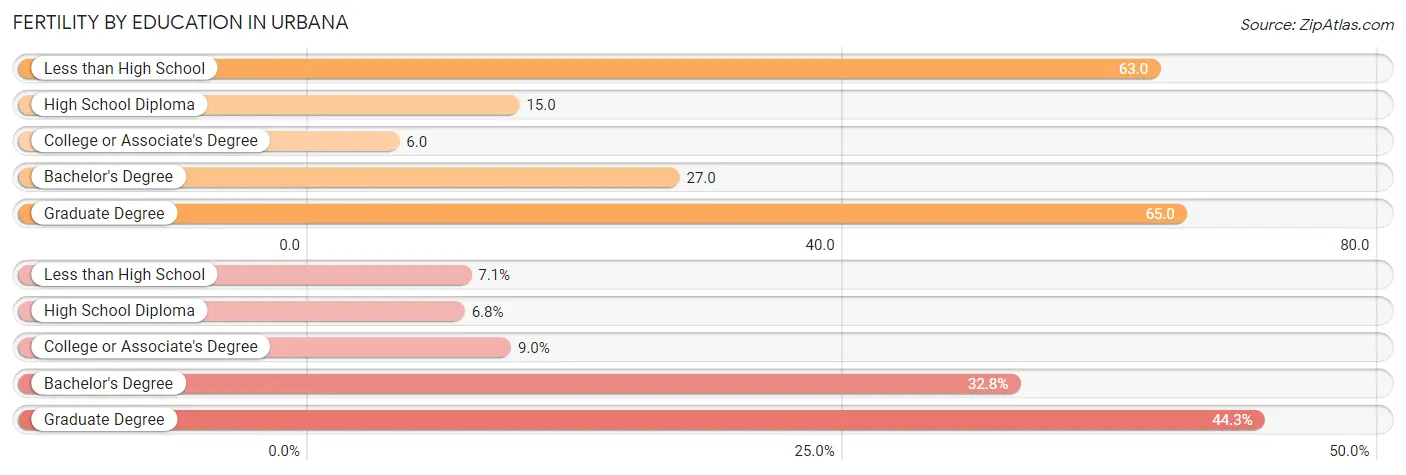
| Educational Attainment | Women with Births | Births / 1,000 Women |
| Less than High School | 23 (7.1%) | 63.0 |
| High School Diploma | 22 (6.8%) | 15.0 |
| College or Associate's Degree | 29 (9.0%) | 6.0 |
| Bachelor's Degree | 106 (32.8%) | 27.0 |
| Graduate Degree | 143 (44.3%) | 65.0 |
| Total | 323 (100.0%) | 25.0 |
Fertility by Education by Marriage Status in Urbana
12.7% of women with births in Urbana are unmarried. Women with the educational attainment of less than high school are most likely to be married with 100.0% of them married at childbirth, while women with the educational attainment of high school diploma are least likely to be married with 100.0% of them unmarried at childbirth.
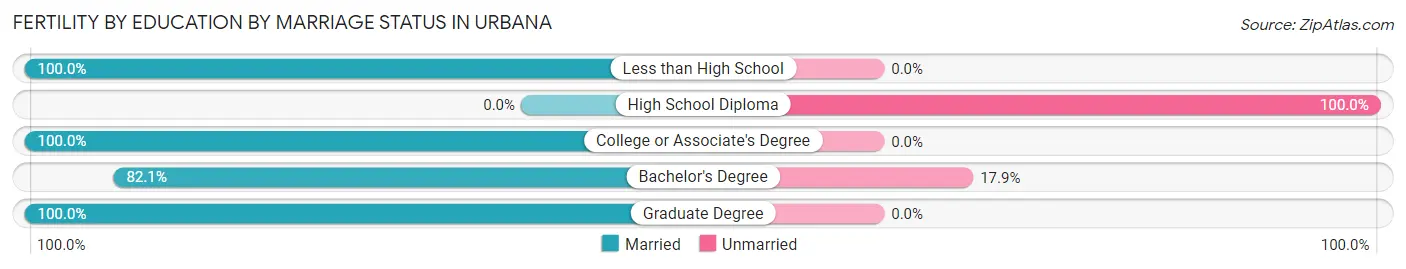
| Educational Attainment | Married | Unmarried |
| Less than High School | 23 (100.0%) | 0 (0.0%) |
| High School Diploma | 0 (0.0%) | 22 (100.0%) |
| College or Associate's Degree | 29 (100.0%) | 0 (0.0%) |
| Bachelor's Degree | 87 (82.1%) | 19 (17.9%) |
| Graduate Degree | 143 (100.0%) | 0 (0.0%) |
| Total | 282 (87.3%) | 41 (12.7%) |
Employment Characteristics in Urbana
Employment by Class of Employer in Urbana
Among the 18,737 employed individuals in Urbana, private company employees (7,578 | 40.4%), state government employees (6,908 | 36.9%), and not-for-profit organizations (1,735 | 9.3%) make up the most common classes of employment.
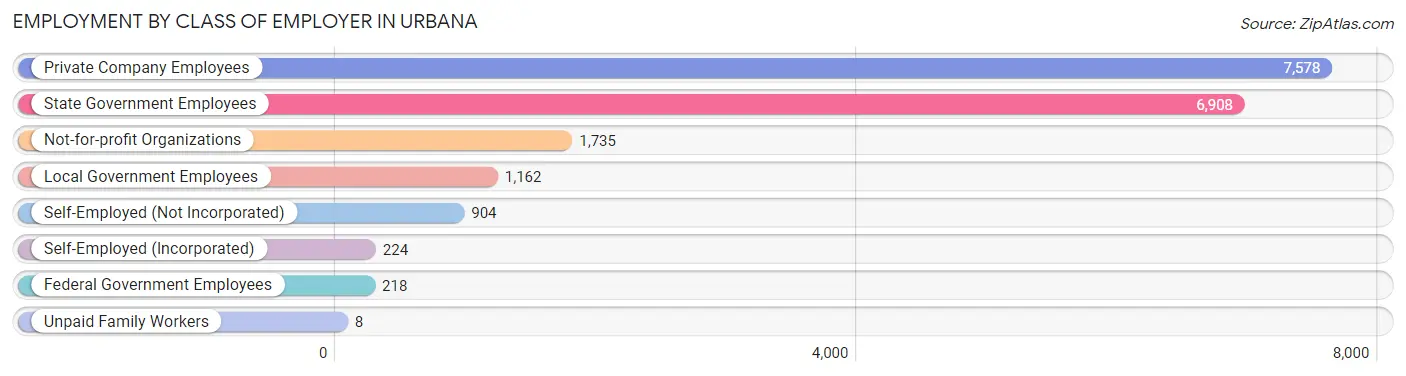
| Employer Class | # Employees | % Employees |
| Private Company Employees | 7,578 | 40.4% |
| Self-Employed (Incorporated) | 224 | 1.2% |
| Self-Employed (Not Incorporated) | 904 | 4.8% |
| Not-for-profit Organizations | 1,735 | 9.3% |
| Local Government Employees | 1,162 | 6.2% |
| State Government Employees | 6,908 | 36.9% |
| Federal Government Employees | 218 | 1.2% |
| Unpaid Family Workers | 8 | 0.0% |
| Total | 18,737 | 100.0% |
Employment Status by Age in Urbana
According to the labor force statistics for Urbana, out of the total population over 16 years of age (34,978), 58.0% or 20,287 individuals are in the labor force, with 5.7% or 1,156 of them unemployed. The age group with the highest labor force participation rate is 30 to 34 years, with 89.2% or 2,480 individuals in the labor force. Within the labor force, the 16 to 19 years age range has the highest percentage of unemployed individuals, with 14.7% or 221 of them being unemployed.
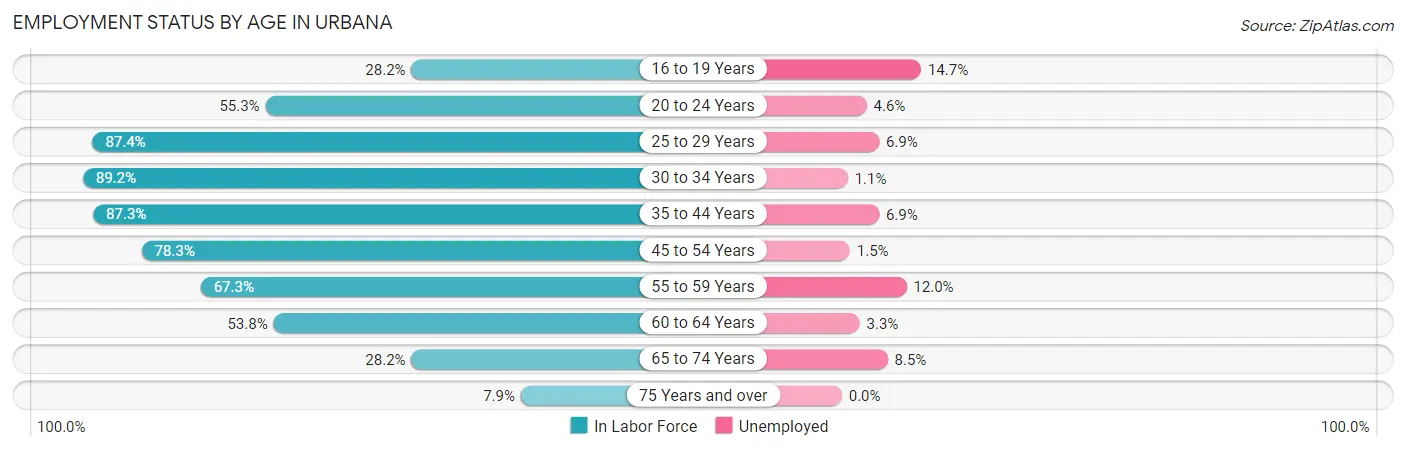
| Age Bracket | In Labor Force | Unemployed |
| 16 to 19 Years | 1,506 (28.2%) | 221 (14.7%) |
| 20 to 24 Years | 5,371 (55.3%) | 247 (4.6%) |
| 25 to 29 Years | 3,644 (87.4%) | 251 (6.9%) |
| 30 to 34 Years | 2,480 (89.2%) | 27 (1.1%) |
| 35 to 44 Years | 2,602 (87.3%) | 180 (6.9%) |
| 45 to 54 Years | 2,035 (78.3%) | 31 (1.5%) |
| 55 to 59 Years | 964 (67.3%) | 116 (12.0%) |
| 60 to 64 Years | 822 (53.8%) | 27 (3.3%) |
| 65 to 74 Years | 691 (28.2%) | 59 (8.5%) |
| 75 Years and over | 157 (7.9%) | 0 (0.0%) |
| Total | 20,287 (58.0%) | 1,156 (5.7%) |
Employment Status by Educational Attainment in Urbana
According to labor force statistics for Urbana, 81.0% of individuals (12,546) out of the total population between 25 and 64 years of age (15,489) are in the labor force, with 5.1% or 640 of them being unemployed. The group with the highest labor force participation rate are those with the educational attainment of bachelor's degree or higher, with 87.4% or 8,200 individuals in the labor force. Within the labor force, individuals with less than high school education have the highest percentage of unemployment, with 15.7% or 52 of them being unemployed.
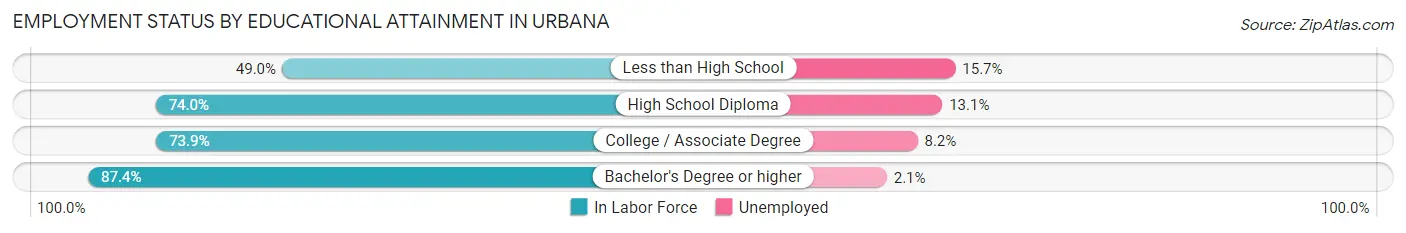
| Educational Attainment | In Labor Force | Unemployed |
| Less than High School | 331 (49.0%) | 106 (15.7%) |
| High School Diploma | 1,693 (74.0%) | 300 (13.1%) |
| College / Associate Degree | 2,323 (73.9%) | 258 (8.2%) |
| Bachelor's Degree or higher | 8,200 (87.4%) | 197 (2.1%) |
| Total | 12,546 (81.0%) | 790 (5.1%) |
Employment Occupations by Sex in Urbana
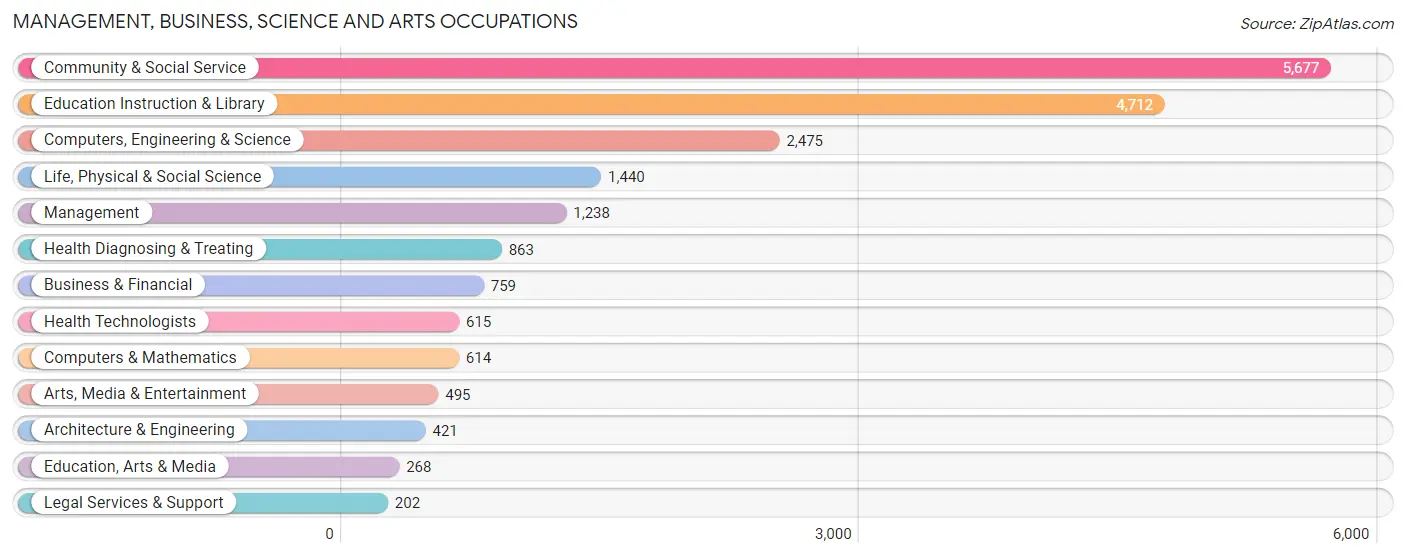
Management, Business, Science and Arts Occupations
The most common Management, Business, Science and Arts occupations in Urbana are Community & Social Service (5,677 | 29.7%), Education Instruction & Library (4,712 | 24.7%), Computers, Engineering & Science (2,475 | 13.0%), Life, Physical & Social Science (1,440 | 7.5%), and Management (1,238 | 6.5%).
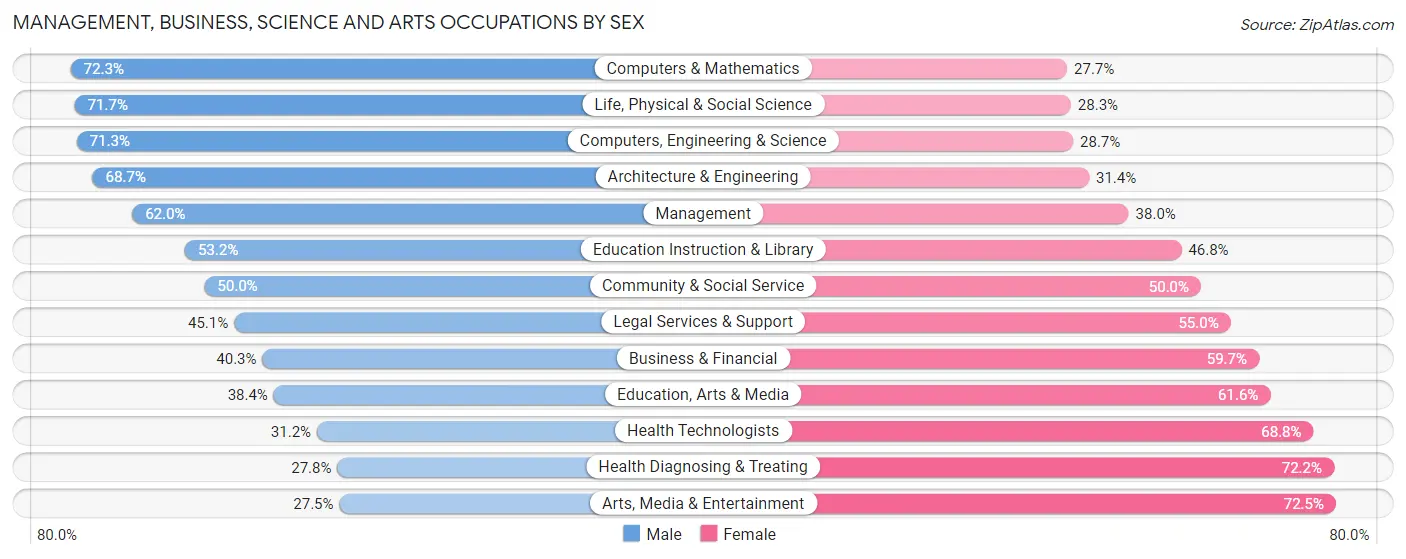
Management, Business, Science and Arts Occupations by Sex
Within the Management, Business, Science and Arts occupations in Urbana, the most male-oriented occupations are Computers & Mathematics (72.3%), Life, Physical & Social Science (71.7%), and Computers, Engineering & Science (71.3%), while the most female-oriented occupations are Arts, Media & Entertainment (72.5%), Health Diagnosing & Treating (72.2%), and Health Technologists (68.8%).
| Occupation | Male | Female |
| Management | 768 (62.0%) | 470 (38.0%) |
| Business & Financial | 306 (40.3%) | 453 (59.7%) |
| Computers, Engineering & Science | 1,765 (71.3%) | 710 (28.7%) |
| Computers & Mathematics | 444 (72.3%) | 170 (27.7%) |
| Architecture & Engineering | 289 (68.6%) | 132 (31.4%) |
| Life, Physical & Social Science | 1,032 (71.7%) | 408 (28.3%) |
| Community & Social Service | 2,838 (50.0%) | 2,839 (50.0%) |
| Education, Arts & Media | 103 (38.4%) | 165 (61.6%) |
| Legal Services & Support | 91 (45.1%) | 111 (54.9%) |
| Education Instruction & Library | 2,508 (53.2%) | 2,204 (46.8%) |
| Arts, Media & Entertainment | 136 (27.5%) | 359 (72.5%) |
| Health Diagnosing & Treating | 240 (27.8%) | 623 (72.2%) |
| Health Technologists | 192 (31.2%) | 423 (68.8%) |
| Total (Category) | 5,917 (53.7%) | 5,095 (46.3%) |
| Total (Overall) | 9,749 (51.0%) | 9,362 (49.0%) |
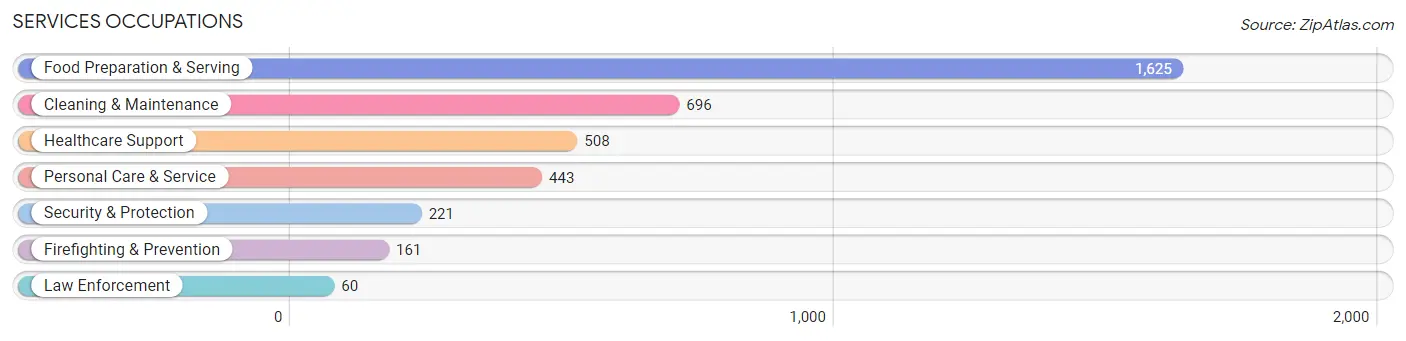
Services Occupations
The most common Services occupations in Urbana are Food Preparation & Serving (1,625 | 8.5%), Cleaning & Maintenance (696 | 3.6%), Healthcare Support (508 | 2.7%), Personal Care & Service (443 | 2.3%), and Security & Protection (221 | 1.2%).
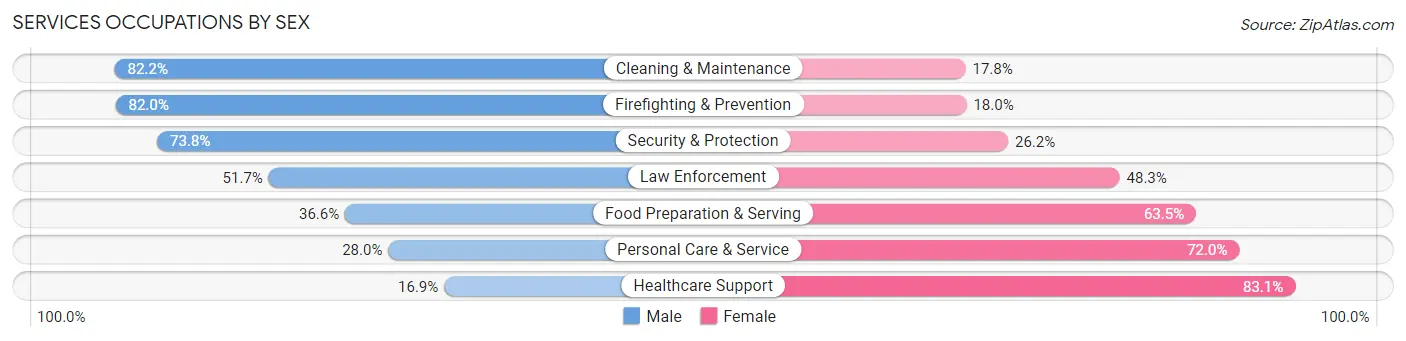
Services Occupations by Sex
Within the Services occupations in Urbana, the most male-oriented occupations are Cleaning & Maintenance (82.2%), Firefighting & Prevention (82.0%), and Security & Protection (73.8%), while the most female-oriented occupations are Healthcare Support (83.1%), Personal Care & Service (72.0%), and Food Preparation & Serving (63.4%).
| Occupation | Male | Female |
| Healthcare Support | 86 (16.9%) | 422 (83.1%) |
| Security & Protection | 163 (73.8%) | 58 (26.2%) |
| Firefighting & Prevention | 132 (82.0%) | 29 (18.0%) |
| Law Enforcement | 31 (51.7%) | 29 (48.3%) |
| Food Preparation & Serving | 594 (36.5%) | 1,031 (63.4%) |
| Cleaning & Maintenance | 572 (82.2%) | 124 (17.8%) |
| Personal Care & Service | 124 (28.0%) | 319 (72.0%) |
| Total (Category) | 1,539 (44.1%) | 1,954 (55.9%) |
| Total (Overall) | 9,749 (51.0%) | 9,362 (49.0%) |
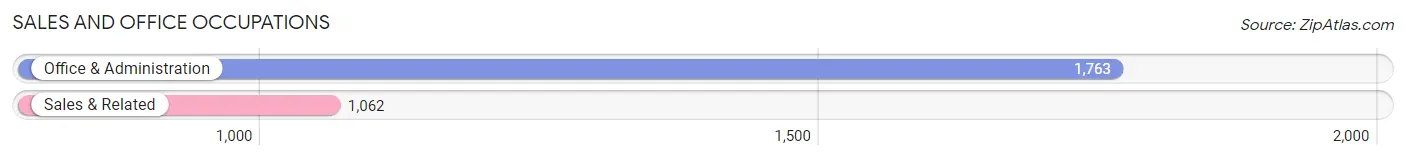
Sales and Office Occupations
The most common Sales and Office occupations in Urbana are Office & Administration (1,763 | 9.2%), and Sales & Related (1,062 | 5.6%).
Sales and Office Occupations by Sex
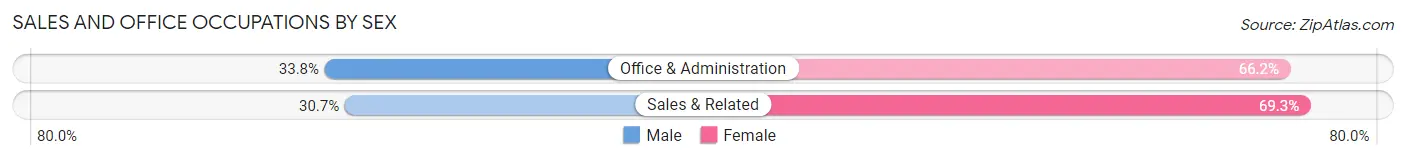
| Occupation | Male | Female |
| Sales & Related | 326 (30.7%) | 736 (69.3%) |
| Office & Administration | 596 (33.8%) | 1,167 (66.2%) |
| Total (Category) | 922 (32.6%) | 1,903 (67.4%) |
| Total (Overall) | 9,749 (51.0%) | 9,362 (49.0%) |
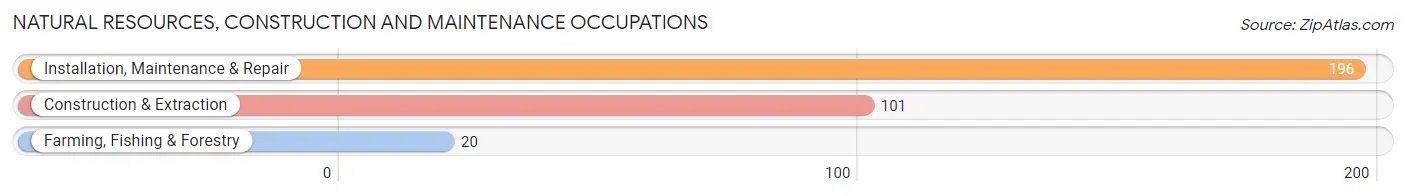
Natural Resources, Construction and Maintenance Occupations
The most common Natural Resources, Construction and Maintenance occupations in Urbana are Installation, Maintenance & Repair (196 | 1.0%), Construction & Extraction (101 | 0.5%), and Farming, Fishing & Forestry (20 | 0.1%).
Natural Resources, Construction and Maintenance Occupations by Sex
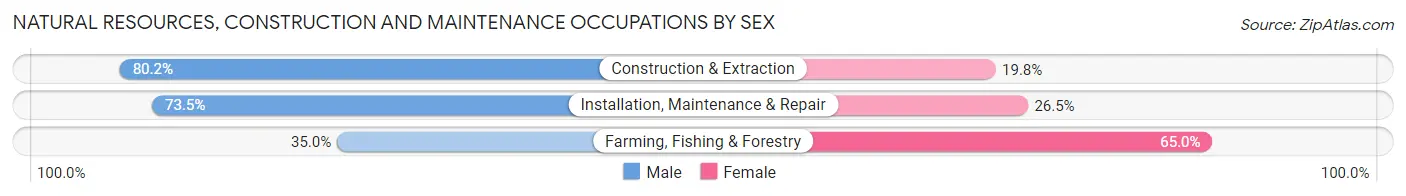
| Occupation | Male | Female |
| Farming, Fishing & Forestry | 7 (35.0%) | 13 (65.0%) |
| Construction & Extraction | 81 (80.2%) | 20 (19.8%) |
| Installation, Maintenance & Repair | 144 (73.5%) | 52 (26.5%) |
| Total (Category) | 232 (73.2%) | 85 (26.8%) |
| Total (Overall) | 9,749 (51.0%) | 9,362 (49.0%) |
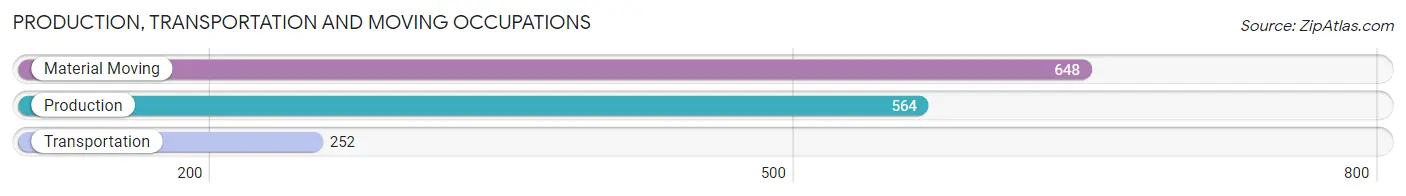
Production, Transportation and Moving Occupations
The most common Production, Transportation and Moving occupations in Urbana are Material Moving (648 | 3.4%), Production (564 | 2.9%), and Transportation (252 | 1.3%).
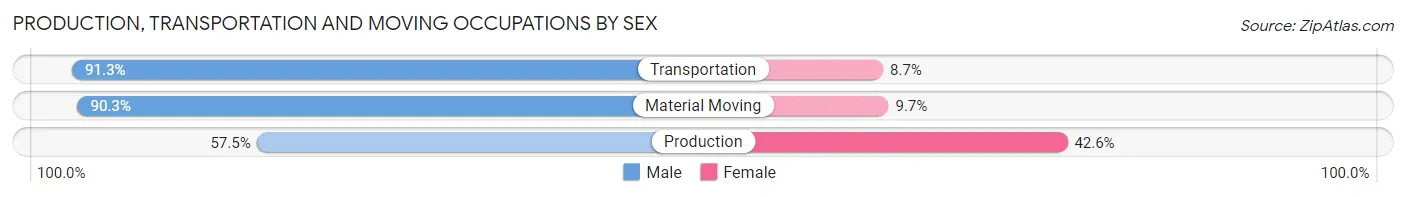
Production, Transportation and Moving Occupations by Sex
| Occupation | Male | Female |
| Production | 324 (57.5%) | 240 (42.5%) |
| Transportation | 230 (91.3%) | 22 (8.7%) |
| Material Moving | 585 (90.3%) | 63 (9.7%) |
| Total (Category) | 1,139 (77.8%) | 325 (22.2%) |
| Total (Overall) | 9,749 (51.0%) | 9,362 (49.0%) |
Employment Industries by Sex in Urbana
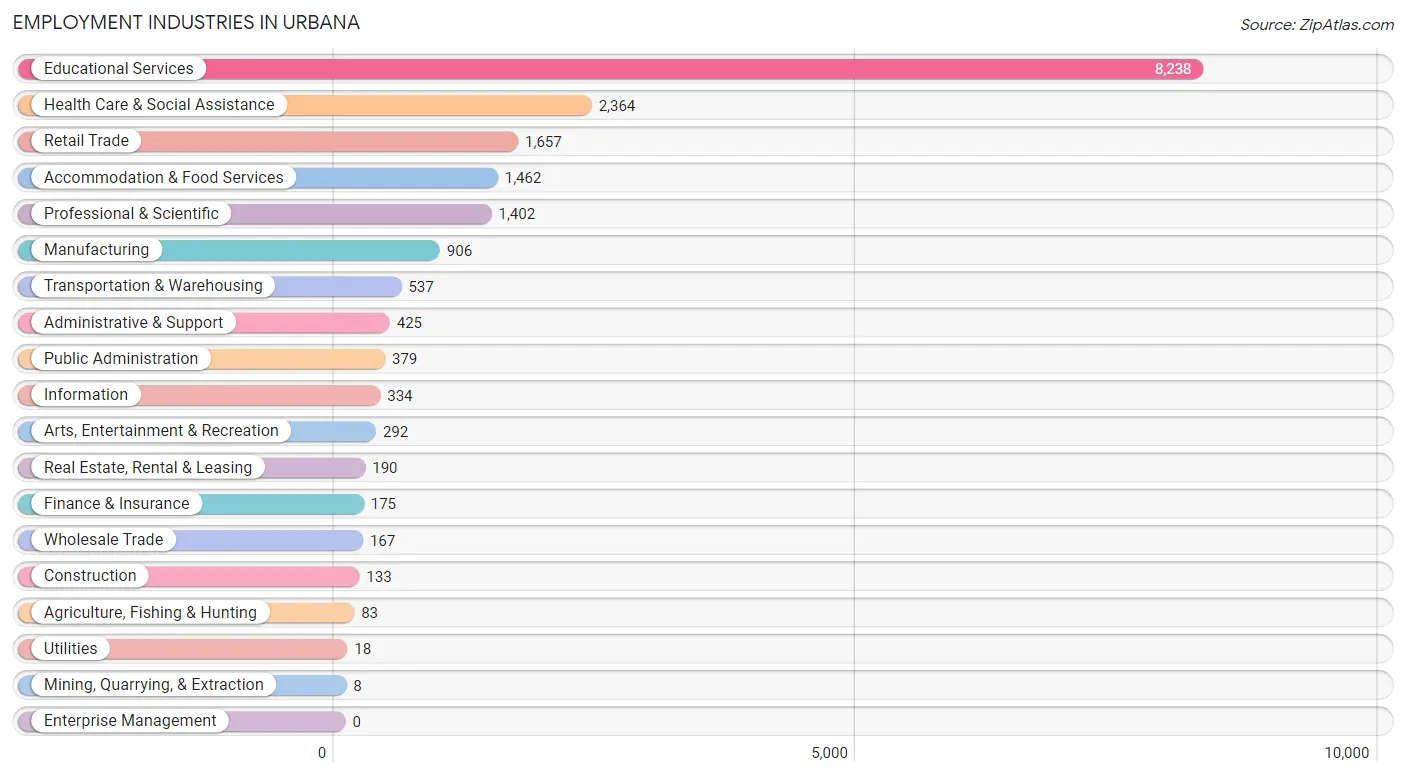
Employment Industries in Urbana
The major employment industries in Urbana include Educational Services (8,238 | 43.1%), Health Care & Social Assistance (2,364 | 12.4%), Retail Trade (1,657 | 8.7%), Accommodation & Food Services (1,462 | 7.6%), and Professional & Scientific (1,402 | 7.3%).
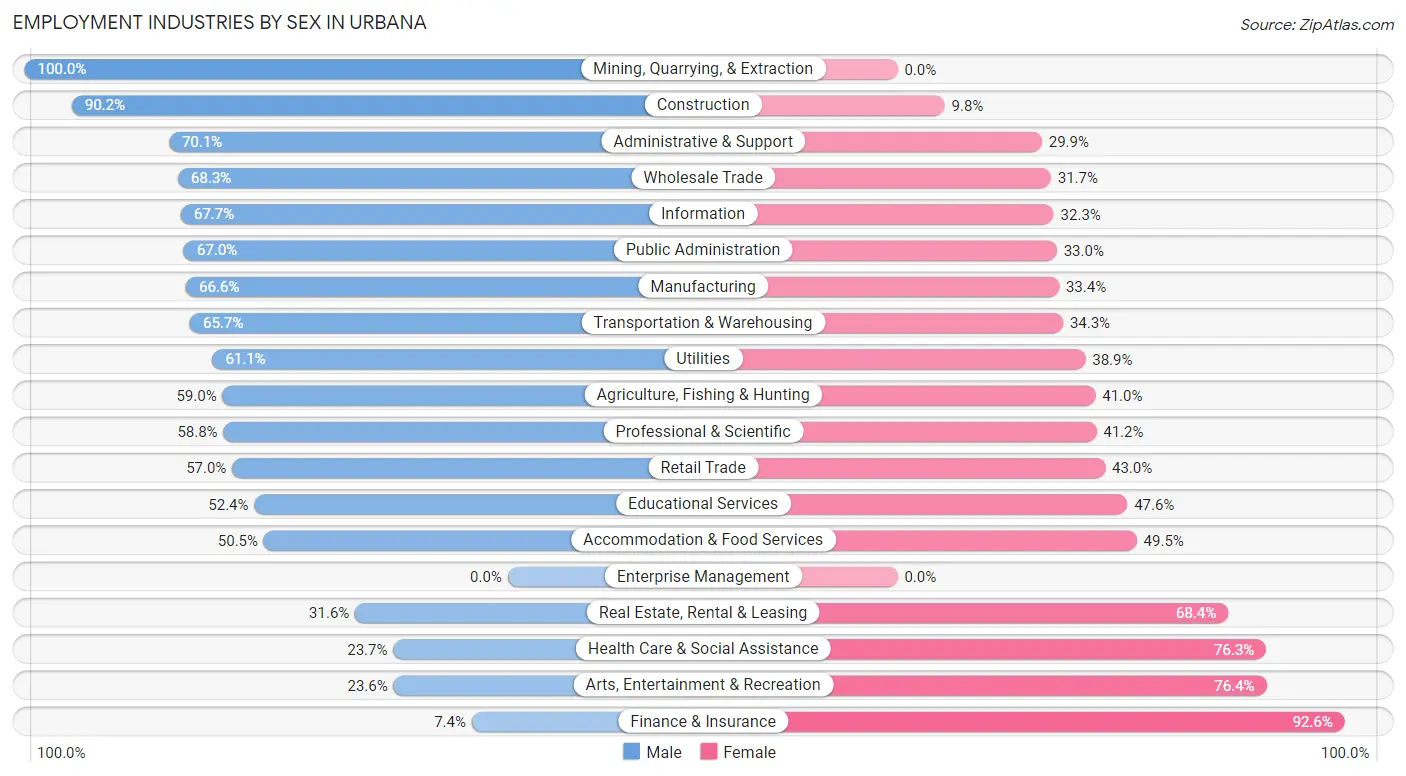
Employment Industries by Sex in Urbana
The Urbana industries that see more men than women are Mining, Quarrying, & Extraction (100.0%), Construction (90.2%), and Administrative & Support (70.1%), whereas the industries that tend to have a higher number of women are Finance & Insurance (92.6%), Arts, Entertainment & Recreation (76.4%), and Health Care & Social Assistance (76.3%).
| Industry | Male | Female |
| Agriculture, Fishing & Hunting | 49 (59.0%) | 34 (41.0%) |
| Mining, Quarrying, & Extraction | 8 (100.0%) | 0 (0.0%) |
| Construction | 120 (90.2%) | 13 (9.8%) |
| Manufacturing | 603 (66.6%) | 303 (33.4%) |
| Wholesale Trade | 114 (68.3%) | 53 (31.7%) |
| Retail Trade | 945 (57.0%) | 712 (43.0%) |
| Transportation & Warehousing | 353 (65.7%) | 184 (34.3%) |
| Utilities | 11 (61.1%) | 7 (38.9%) |
| Information | 226 (67.7%) | 108 (32.3%) |
| Finance & Insurance | 13 (7.4%) | 162 (92.6%) |
| Real Estate, Rental & Leasing | 60 (31.6%) | 130 (68.4%) |
| Professional & Scientific | 825 (58.8%) | 577 (41.2%) |
| Enterprise Management | 0 (0.0%) | 0 (0.0%) |
| Administrative & Support | 298 (70.1%) | 127 (29.9%) |
| Educational Services | 4,320 (52.4%) | 3,918 (47.6%) |
| Health Care & Social Assistance | 560 (23.7%) | 1,804 (76.3%) |
| Arts, Entertainment & Recreation | 69 (23.6%) | 223 (76.4%) |
| Accommodation & Food Services | 738 (50.5%) | 724 (49.5%) |
| Public Administration | 254 (67.0%) | 125 (33.0%) |
| Total | 9,749 (51.0%) | 9,362 (49.0%) |
Education in Urbana
School Enrollment in Urbana
The most common levels of schooling among the 17,923 students in Urbana are college / undergraduate (9,849 | 54.9%), graduate / professional (5,053 | 28.2%), and middle school (917 | 5.1%).
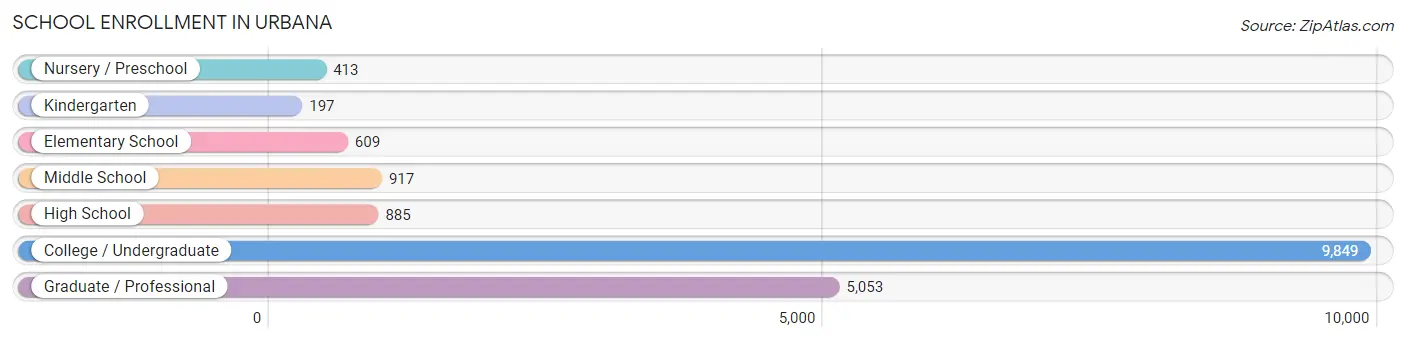
| School Level | # Students | % Students |
| Nursery / Preschool | 413 | 2.3% |
| Kindergarten | 197 | 1.1% |
| Elementary School | 609 | 3.4% |
| Middle School | 917 | 5.1% |
| High School | 885 | 4.9% |
| College / Undergraduate | 9,849 | 54.9% |
| Graduate / Professional | 5,053 | 28.2% |
| Total | 17,923 | 100.0% |
School Enrollment by Age by Funding Source in Urbana
Out of a total of 17,923 students who are enrolled in schools in Urbana, 914 (5.1%) attend a private institution, while the remaining 17,009 (94.9%) are enrolled in public schools. The age group of 3 to 4 year olds has the highest likelihood of being enrolled in private schools, with 149 (46.1% in the age bracket) enrolled. Conversely, the age group of 18 to 19 year olds has the lowest likelihood of being enrolled in a private school, with 4,661 (98.3% in the age bracket) attending a public institution.
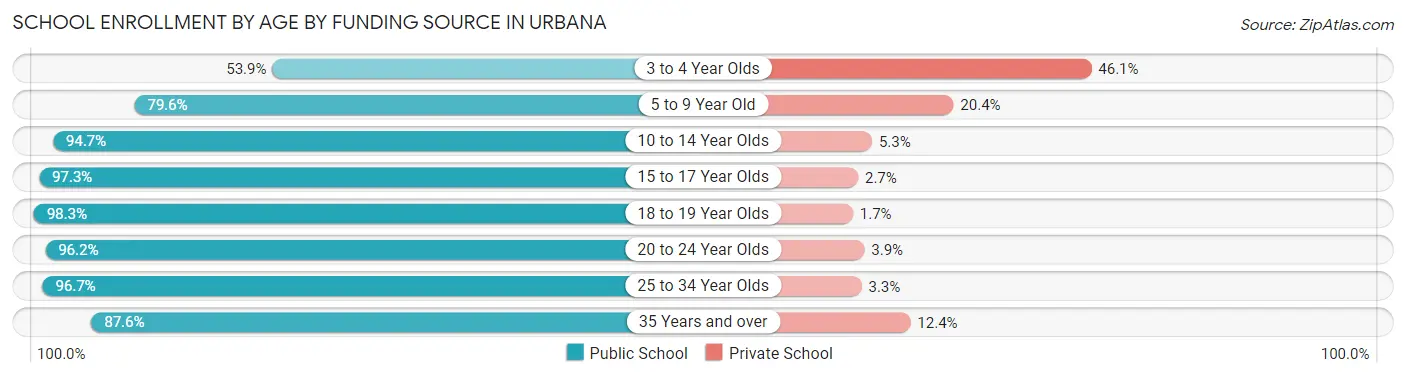
| Age Bracket | Public School | Private School |
| 3 to 4 Year Olds | 174 (53.9%) | 149 (46.1%) |
| 5 to 9 Year Old | 693 (79.6%) | 178 (20.4%) |
| 10 to 14 Year Olds | 970 (94.7%) | 54 (5.3%) |
| 15 to 17 Year Olds | 617 (97.3%) | 17 (2.7%) |
| 18 to 19 Year Olds | 4,661 (98.3%) | 81 (1.7%) |
| 20 to 24 Year Olds | 6,871 (96.2%) | 275 (3.8%) |
| 25 to 34 Year Olds | 2,587 (96.7%) | 89 (3.3%) |
| 35 Years and over | 444 (87.6%) | 63 (12.4%) |
| Total | 17,009 (94.9%) | 914 (5.1%) |
Educational Attainment by Field of Study in Urbana
Bio, nature & agricultural (1,875 | 14.7%), engineering (1,261 | 9.9%), education (1,180 | 9.2%), physical & health sciences (1,031 | 8.1%), and social sciences (977 | 7.6%) are the most common fields of study among 12,794 individuals in Urbana who have obtained a bachelor's degree or higher.
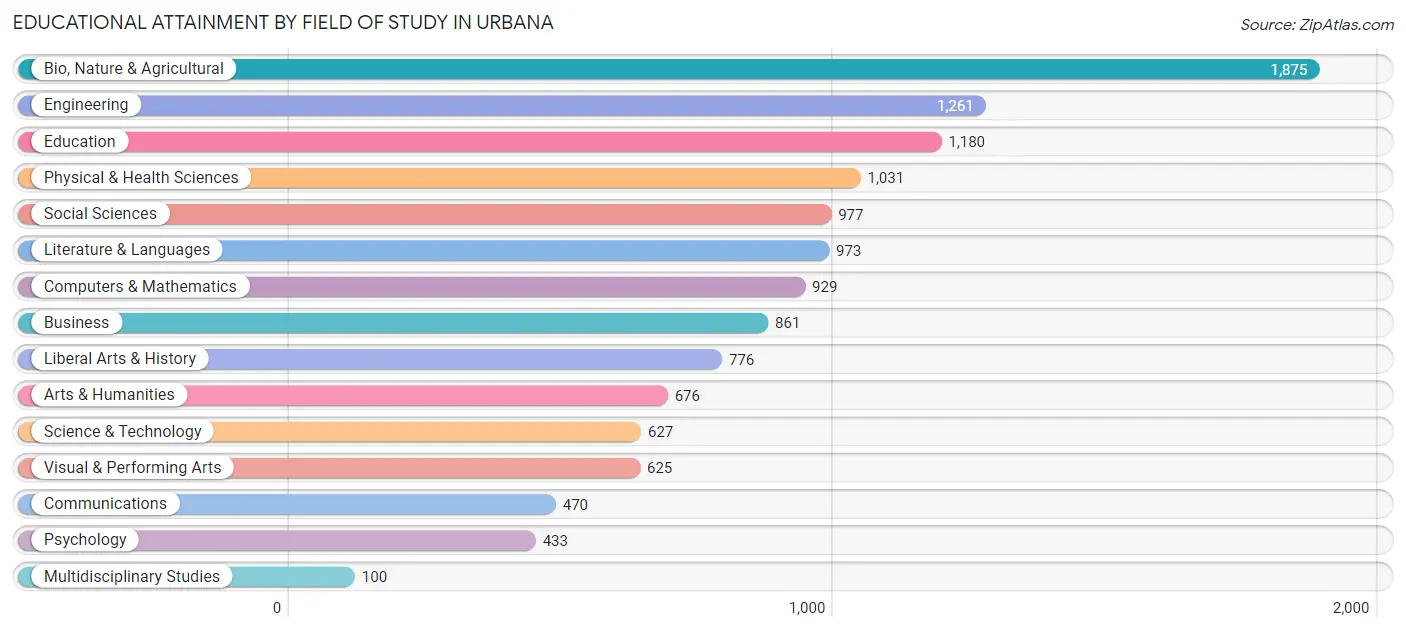
| Field of Study | # Graduates | % Graduates |
| Computers & Mathematics | 929 | 7.3% |
| Bio, Nature & Agricultural | 1,875 | 14.7% |
| Physical & Health Sciences | 1,031 | 8.1% |
| Psychology | 433 | 3.4% |
| Social Sciences | 977 | 7.6% |
| Engineering | 1,261 | 9.9% |
| Multidisciplinary Studies | 100 | 0.8% |
| Science & Technology | 627 | 4.9% |
| Business | 861 | 6.7% |
| Education | 1,180 | 9.2% |
| Literature & Languages | 973 | 7.6% |
| Liberal Arts & History | 776 | 6.1% |
| Visual & Performing Arts | 625 | 4.9% |
| Communications | 470 | 3.7% |
| Arts & Humanities | 676 | 5.3% |
| Total | 12,794 | 100.0% |
Transportation & Commute in Urbana
Vehicle Availability by Sex in Urbana
The most prevalent vehicle ownership categories in Urbana are males with 1 vehicle (3,538, accounting for 39.0%) and females with 1 vehicle (3,394, making up 42.5%).
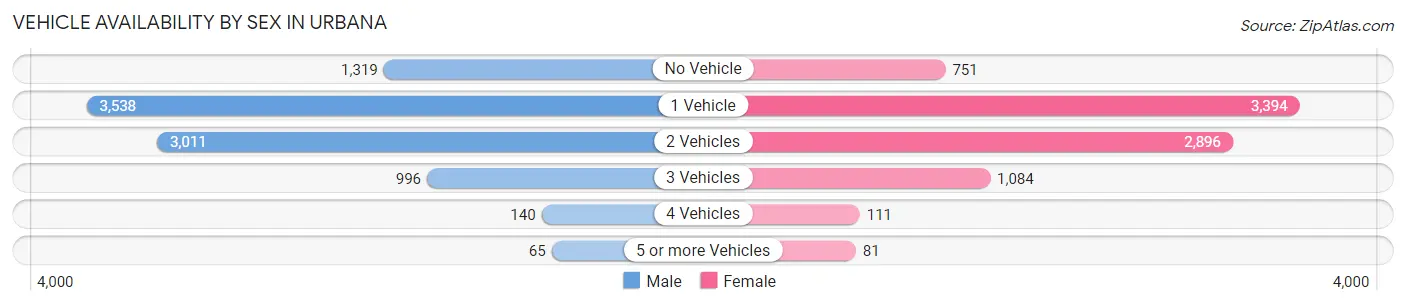
| Vehicles Available | Male | Female |
| No Vehicle | 1,319 (14.5%) | 751 (9.0%) |
| 1 Vehicle | 3,538 (39.0%) | 3,394 (40.8%) |
| 2 Vehicles | 3,011 (33.2%) | 2,896 (34.8%) |
| 3 Vehicles | 996 (11.0%) | 1,084 (13.0%) |
| 4 Vehicles | 140 (1.5%) | 111 (1.3%) |
| 5 or more Vehicles | 65 (0.7%) | 81 (1.0%) |
| Total | 9,069 (100.0%) | 8,317 (100.0%) |
Commute Time in Urbana
The most frequently occuring commute durations in Urbana are 10 to 14 minutes (6,196 commuters, 37.7%), 15 to 19 minutes (3,255 commuters, 19.8%), and 5 to 9 minutes (3,056 commuters, 18.6%).
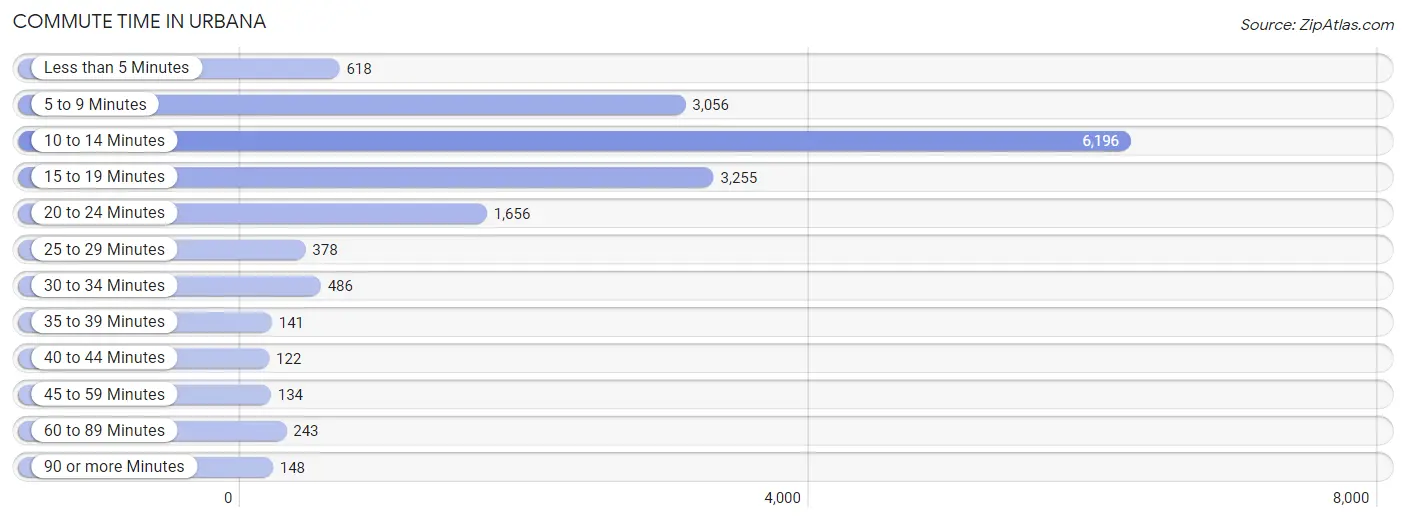
| Commute Time | # Commuters | % Commuters |
| Less than 5 Minutes | 618 | 3.8% |
| 5 to 9 Minutes | 3,056 | 18.6% |
| 10 to 14 Minutes | 6,196 | 37.7% |
| 15 to 19 Minutes | 3,255 | 19.8% |
| 20 to 24 Minutes | 1,656 | 10.1% |
| 25 to 29 Minutes | 378 | 2.3% |
| 30 to 34 Minutes | 486 | 3.0% |
| 35 to 39 Minutes | 141 | 0.9% |
| 40 to 44 Minutes | 122 | 0.7% |
| 45 to 59 Minutes | 134 | 0.8% |
| 60 to 89 Minutes | 243 | 1.5% |
| 90 or more Minutes | 148 | 0.9% |
Commute Time by Sex in Urbana
The most common commute times in Urbana are 10 to 14 minutes (3,229 commuters, 38.3%) for males and 10 to 14 minutes (2,967 commuters, 37.1%) for females.
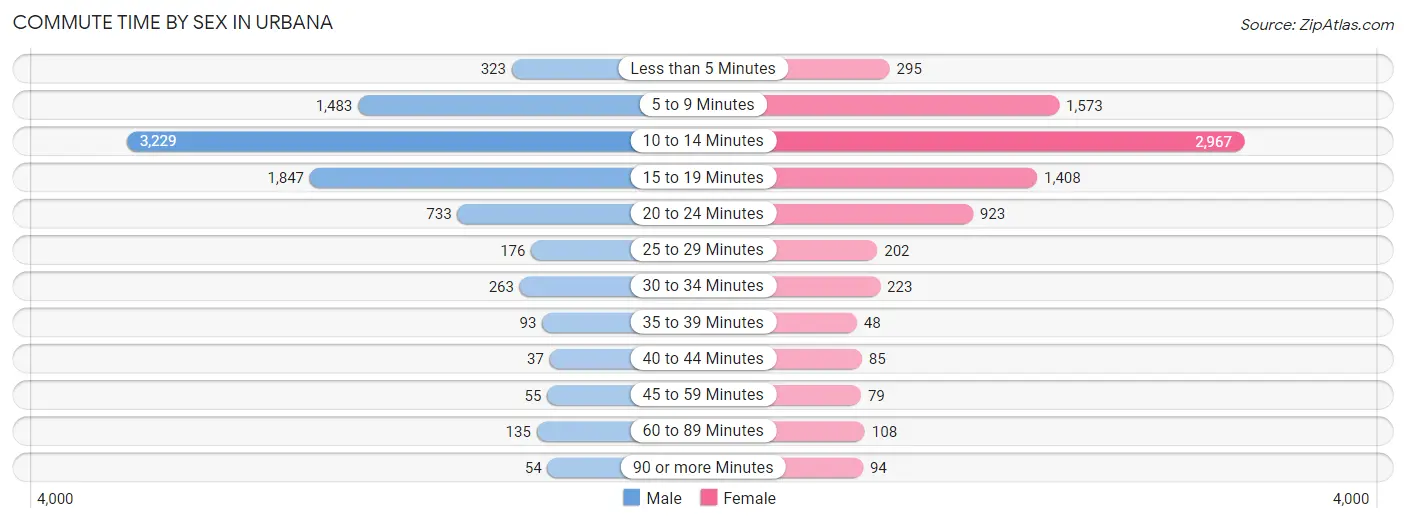
| Commute Time | Male | Female |
| Less than 5 Minutes | 323 (3.8%) | 295 (3.7%) |
| 5 to 9 Minutes | 1,483 (17.6%) | 1,573 (19.7%) |
| 10 to 14 Minutes | 3,229 (38.3%) | 2,967 (37.1%) |
| 15 to 19 Minutes | 1,847 (21.9%) | 1,408 (17.6%) |
| 20 to 24 Minutes | 733 (8.7%) | 923 (11.5%) |
| 25 to 29 Minutes | 176 (2.1%) | 202 (2.5%) |
| 30 to 34 Minutes | 263 (3.1%) | 223 (2.8%) |
| 35 to 39 Minutes | 93 (1.1%) | 48 (0.6%) |
| 40 to 44 Minutes | 37 (0.4%) | 85 (1.1%) |
| 45 to 59 Minutes | 55 (0.6%) | 79 (1.0%) |
| 60 to 89 Minutes | 135 (1.6%) | 108 (1.3%) |
| 90 or more Minutes | 54 (0.6%) | 94 (1.2%) |
Time of Departure to Work by Sex in Urbana
The most frequent times of departure to work in Urbana are 8:00 AM to 8:29 AM (1,092, 13.0%) for males and 7:30 AM to 7:59 AM (1,518, 19.0%) for females.
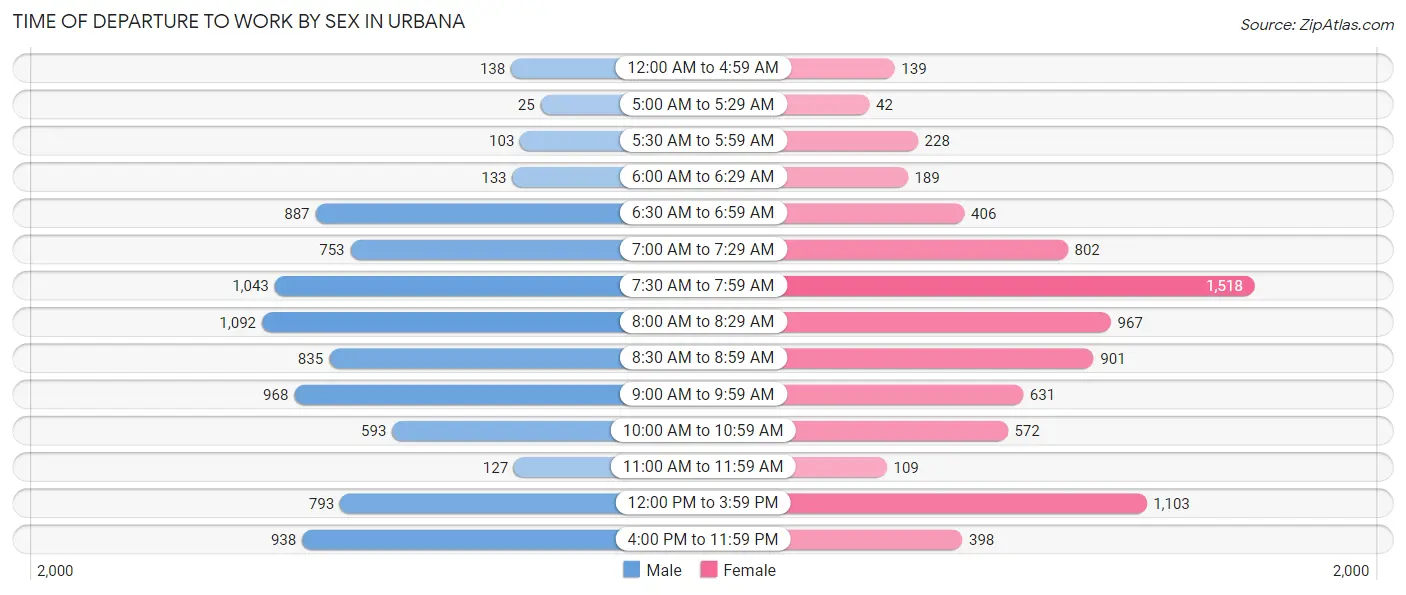
| Time of Departure | Male | Female |
| 12:00 AM to 4:59 AM | 138 (1.6%) | 139 (1.7%) |
| 5:00 AM to 5:29 AM | 25 (0.3%) | 42 (0.5%) |
| 5:30 AM to 5:59 AM | 103 (1.2%) | 228 (2.9%) |
| 6:00 AM to 6:29 AM | 133 (1.6%) | 189 (2.4%) |
| 6:30 AM to 6:59 AM | 887 (10.5%) | 406 (5.1%) |
| 7:00 AM to 7:29 AM | 753 (8.9%) | 802 (10.0%) |
| 7:30 AM to 7:59 AM | 1,043 (12.4%) | 1,518 (19.0%) |
| 8:00 AM to 8:29 AM | 1,092 (13.0%) | 967 (12.1%) |
| 8:30 AM to 8:59 AM | 835 (9.9%) | 901 (11.3%) |
| 9:00 AM to 9:59 AM | 968 (11.5%) | 631 (7.9%) |
| 10:00 AM to 10:59 AM | 593 (7.0%) | 572 (7.1%) |
| 11:00 AM to 11:59 AM | 127 (1.5%) | 109 (1.4%) |
| 12:00 PM to 3:59 PM | 793 (9.4%) | 1,103 (13.8%) |
| 4:00 PM to 11:59 PM | 938 (11.1%) | 398 (5.0%) |
| Total | 8,428 (100.0%) | 8,005 (100.0%) |
Housing Occupancy in Urbana
Occupancy by Ownership in Urbana
Of the total 16,380 dwellings in Urbana, owner-occupied units account for 5,378 (32.8%), while renter-occupied units make up 11,002 (67.2%).
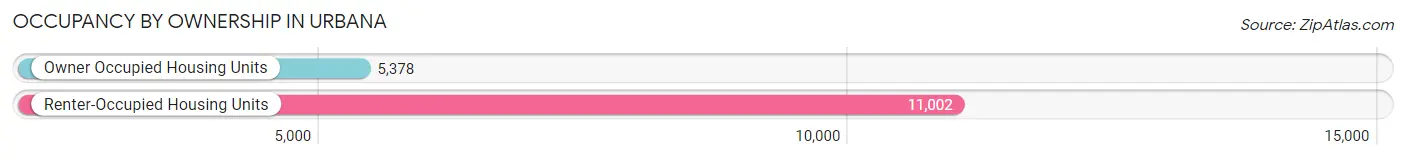
| Occupancy | # Housing Units | % Housing Units |
| Owner Occupied Housing Units | 5,378 | 32.8% |
| Renter-Occupied Housing Units | 11,002 | 67.2% |
| Total Occupied Housing Units | 16,380 | 100.0% |
Occupancy by Household Size in Urbana
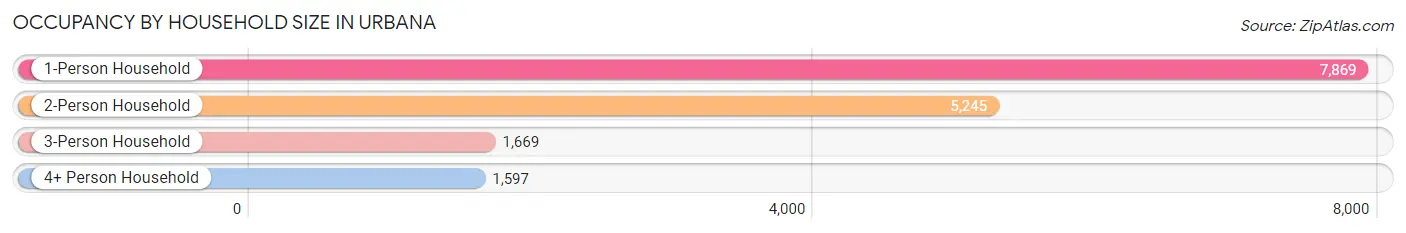
| Household Size | # Housing Units | % Housing Units |
| 1-Person Household | 7,869 | 48.0% |
| 2-Person Household | 5,245 | 32.0% |
| 3-Person Household | 1,669 | 10.2% |
| 4+ Person Household | 1,597 | 9.8% |
| Total Housing Units | 16,380 | 100.0% |
Occupancy by Ownership by Household Size in Urbana
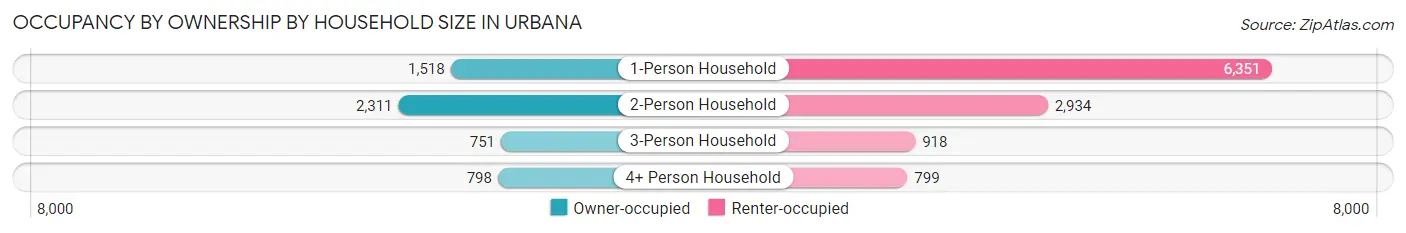
| Household Size | Owner-occupied | Renter-occupied |
| 1-Person Household | 1,518 (19.3%) | 6,351 (80.7%) |
| 2-Person Household | 2,311 (44.1%) | 2,934 (55.9%) |
| 3-Person Household | 751 (45.0%) | 918 (55.0%) |
| 4+ Person Household | 798 (50.0%) | 799 (50.0%) |
| Total Housing Units | 5,378 (32.8%) | 11,002 (67.2%) |
Occupancy by Educational Attainment in Urbana
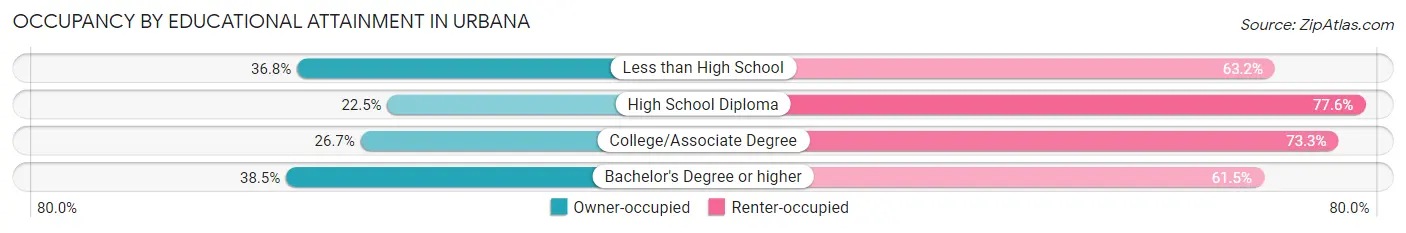
| Household Size | Owner-occupied | Renter-occupied |
| Less than High School | 185 (36.8%) | 318 (63.2%) |
| High School Diploma | 609 (22.5%) | 2,104 (77.5%) |
| College/Associate Degree | 1,103 (26.7%) | 3,027 (73.3%) |
| Bachelor's Degree or higher | 3,481 (38.5%) | 5,553 (61.5%) |
Occupancy by Age of Householder in Urbana
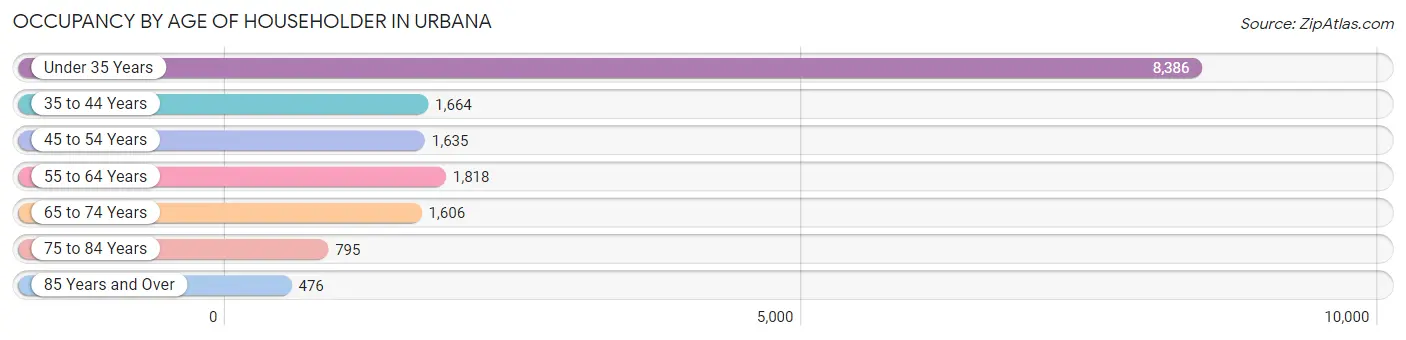
| Age Bracket | # Households | % Households |
| Under 35 Years | 8,386 | 51.2% |
| 35 to 44 Years | 1,664 | 10.2% |
| 45 to 54 Years | 1,635 | 10.0% |
| 55 to 64 Years | 1,818 | 11.1% |
| 65 to 74 Years | 1,606 | 9.8% |
| 75 to 84 Years | 795 | 4.9% |
| 85 Years and Over | 476 | 2.9% |
| Total | 16,380 | 100.0% |
Housing Finances in Urbana
Median Income by Occupancy in Urbana
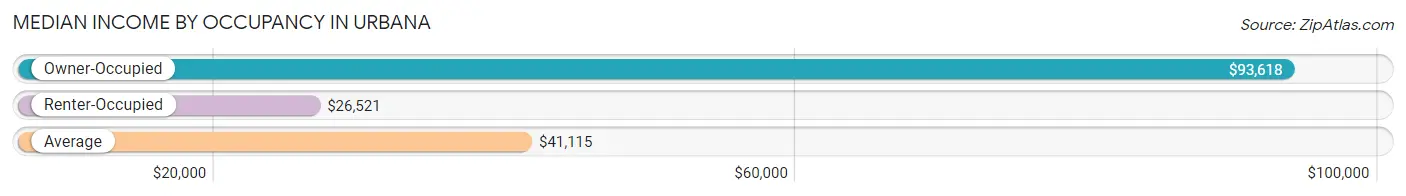
| Occupancy Type | # Households | Median Income |
| Owner-Occupied | 5,378 (32.8%) | $93,618 |
| Renter-Occupied | 11,002 (67.2%) | $26,521 |
| Average | 16,380 (100.0%) | $41,115 |
Occupancy by Householder Income Bracket in Urbana
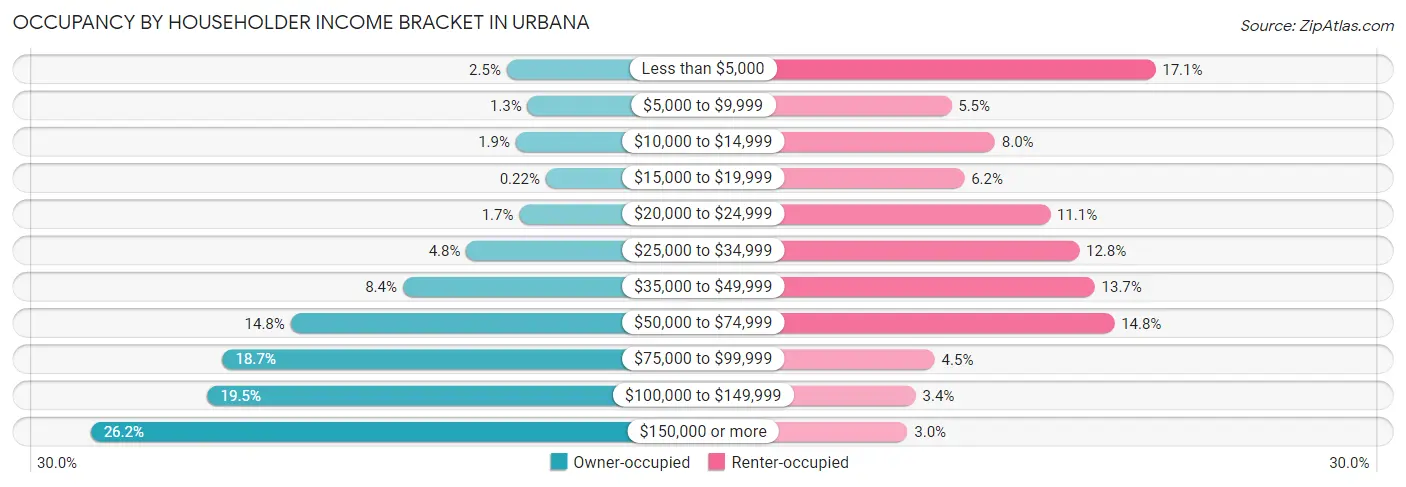
| Income Bracket | Owner-occupied | Renter-occupied |
| Less than $5,000 | 132 (2.5%) | 1,885 (17.1%) |
| $5,000 to $9,999 | 68 (1.3%) | 602 (5.5%) |
| $10,000 to $14,999 | 104 (1.9%) | 876 (8.0%) |
| $15,000 to $19,999 | 12 (0.2%) | 683 (6.2%) |
| $20,000 to $24,999 | 93 (1.7%) | 1,222 (11.1%) |
| $25,000 to $34,999 | 256 (4.8%) | 1,405 (12.8%) |
| $35,000 to $49,999 | 451 (8.4%) | 1,503 (13.7%) |
| $50,000 to $74,999 | 796 (14.8%) | 1,626 (14.8%) |
| $75,000 to $99,999 | 1,005 (18.7%) | 497 (4.5%) |
| $100,000 to $149,999 | 1,051 (19.5%) | 377 (3.4%) |
| $150,000 or more | 1,410 (26.2%) | 326 (3.0%) |
| Total | 5,378 (100.0%) | 11,002 (100.0%) |
Monthly Housing Cost Tiers in Urbana
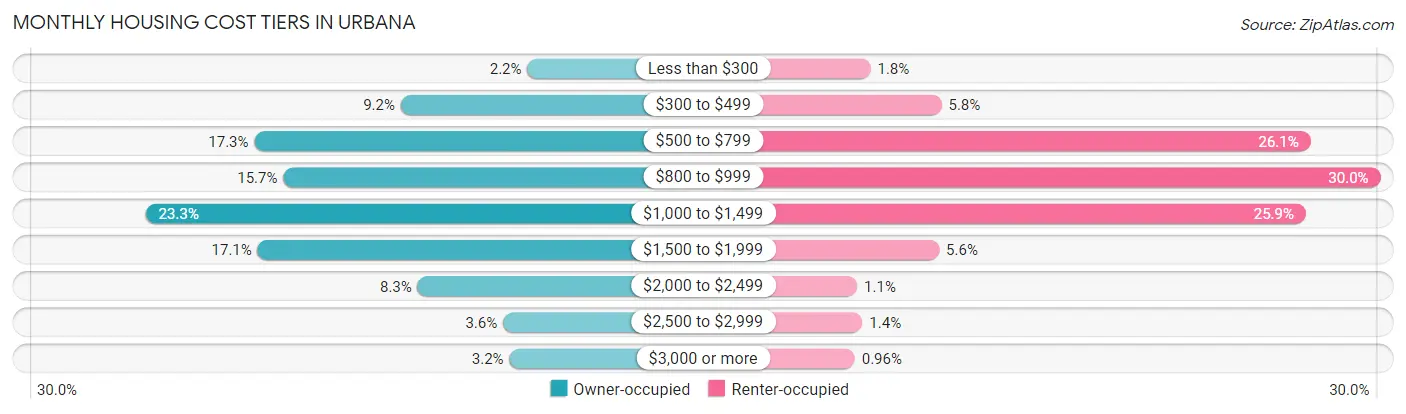
| Monthly Cost | Owner-occupied | Renter-occupied |
| Less than $300 | 120 (2.2%) | 201 (1.8%) |
| $300 to $499 | 496 (9.2%) | 633 (5.8%) |
| $500 to $799 | 931 (17.3%) | 2,875 (26.1%) |
| $800 to $999 | 845 (15.7%) | 3,300 (30.0%) |
| $1,000 to $1,499 | 1,254 (23.3%) | 2,846 (25.9%) |
| $1,500 to $1,999 | 921 (17.1%) | 618 (5.6%) |
| $2,000 to $2,499 | 446 (8.3%) | 120 (1.1%) |
| $2,500 to $2,999 | 192 (3.6%) | 152 (1.4%) |
| $3,000 or more | 173 (3.2%) | 106 (1.0%) |
| Total | 5,378 (100.0%) | 11,002 (100.0%) |
Physical Housing Characteristics in Urbana
Housing Structures in Urbana
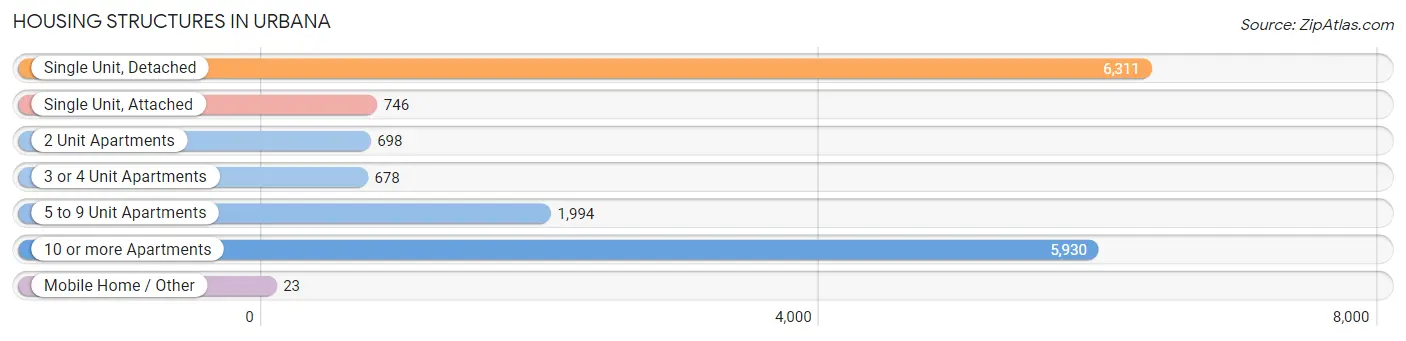
| Structure Type | # Housing Units | % Housing Units |
| Single Unit, Detached | 6,311 | 38.5% |
| Single Unit, Attached | 746 | 4.5% |
| 2 Unit Apartments | 698 | 4.3% |
| 3 or 4 Unit Apartments | 678 | 4.1% |
| 5 to 9 Unit Apartments | 1,994 | 12.2% |
| 10 or more Apartments | 5,930 | 36.2% |
| Mobile Home / Other | 23 | 0.1% |
| Total | 16,380 | 100.0% |
Housing Structures by Occupancy in Urbana
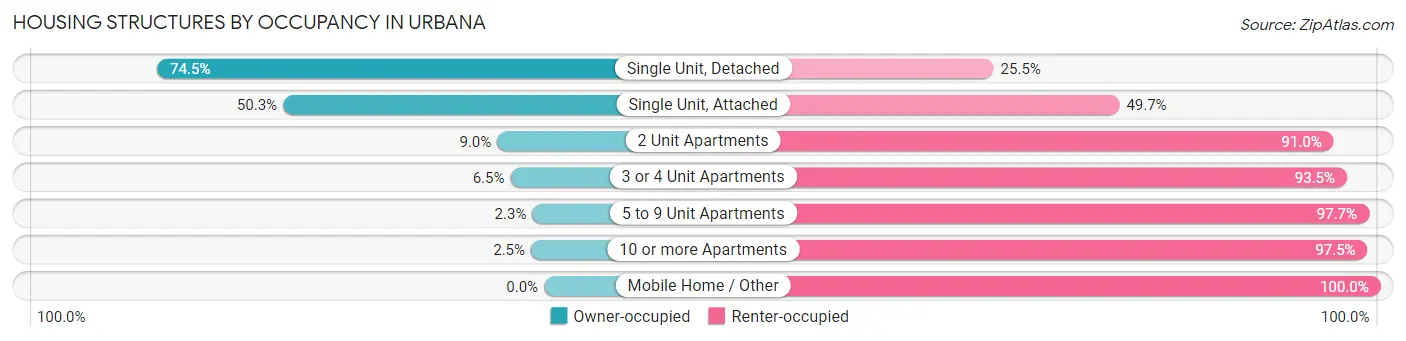
| Structure Type | Owner-occupied | Renter-occupied |
| Single Unit, Detached | 4,701 (74.5%) | 1,610 (25.5%) |
| Single Unit, Attached | 375 (50.3%) | 371 (49.7%) |
| 2 Unit Apartments | 63 (9.0%) | 635 (91.0%) |
| 3 or 4 Unit Apartments | 44 (6.5%) | 634 (93.5%) |
| 5 to 9 Unit Apartments | 45 (2.3%) | 1,949 (97.7%) |
| 10 or more Apartments | 150 (2.5%) | 5,780 (97.5%) |
| Mobile Home / Other | 0 (0.0%) | 23 (100.0%) |
| Total | 5,378 (32.8%) | 11,002 (67.2%) |
Housing Structures by Number of Rooms in Urbana
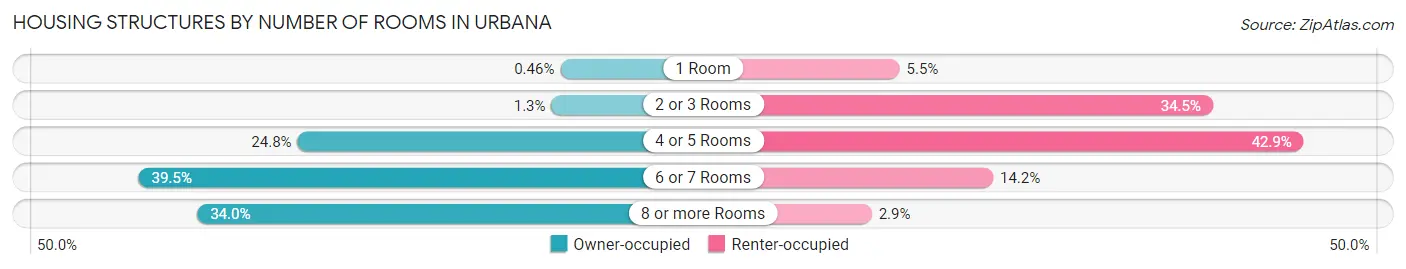
| Number of Rooms | Owner-occupied | Renter-occupied |
| 1 Room | 25 (0.5%) | 607 (5.5%) |
| 2 or 3 Rooms | 69 (1.3%) | 3,794 (34.5%) |
| 4 or 5 Rooms | 1,332 (24.8%) | 4,719 (42.9%) |
| 6 or 7 Rooms | 2,122 (39.5%) | 1,558 (14.2%) |
| 8 or more Rooms | 1,830 (34.0%) | 324 (2.9%) |
| Total | 5,378 (100.0%) | 11,002 (100.0%) |
Housing Structure by Heating Type in Urbana
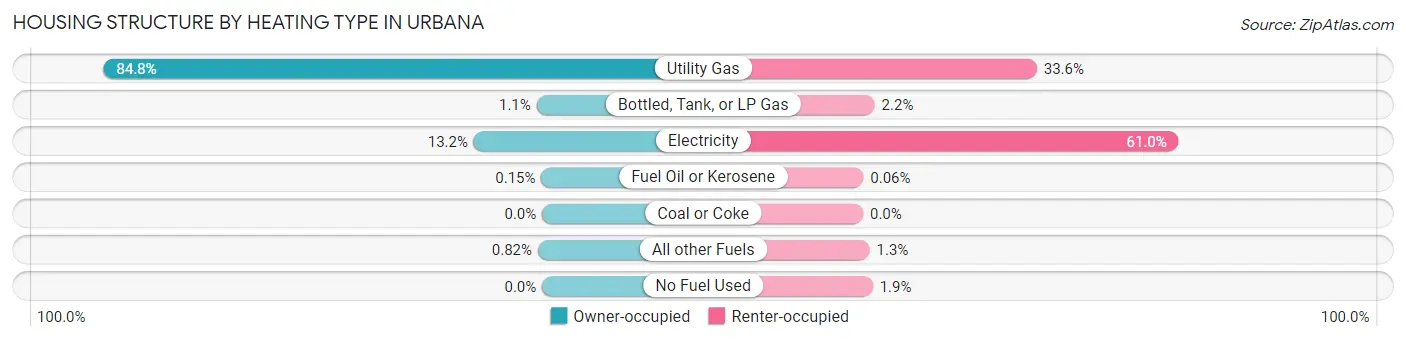
| Heating Type | Owner-occupied | Renter-occupied |
| Utility Gas | 4,559 (84.8%) | 3,695 (33.6%) |
| Bottled, Tank, or LP Gas | 57 (1.1%) | 246 (2.2%) |
| Electricity | 710 (13.2%) | 6,708 (61.0%) |
| Fuel Oil or Kerosene | 8 (0.2%) | 7 (0.1%) |
| Coal or Coke | 0 (0.0%) | 0 (0.0%) |
| All other Fuels | 44 (0.8%) | 140 (1.3%) |
| No Fuel Used | 0 (0.0%) | 206 (1.9%) |
| Total | 5,378 (100.0%) | 11,002 (100.0%) |
Household Vehicle Usage in Urbana
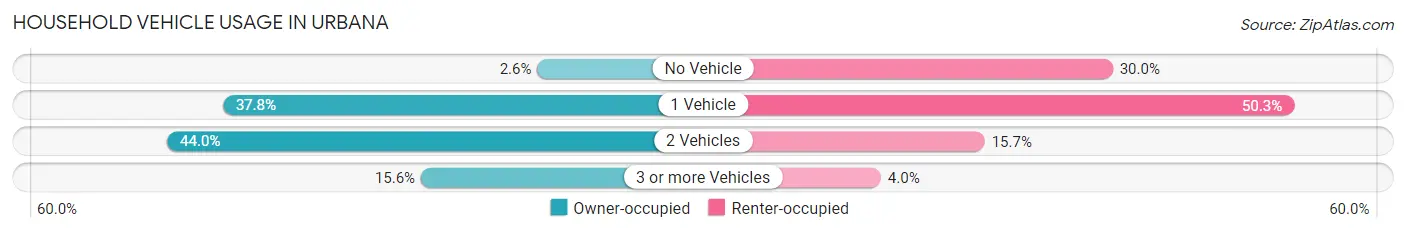
| Vehicles per Household | Owner-occupied | Renter-occupied |
| No Vehicle | 138 (2.6%) | 3,301 (30.0%) |
| 1 Vehicle | 2,033 (37.8%) | 5,535 (50.3%) |
| 2 Vehicles | 2,368 (44.0%) | 1,723 (15.7%) |
| 3 or more Vehicles | 839 (15.6%) | 443 (4.0%) |
| Total | 5,378 (100.0%) | 11,002 (100.0%) |
Real Estate & Mortgages in Urbana
Real Estate and Mortgage Overview in Urbana
| Characteristic | Without Mortgage | With Mortgage |
| Housing Units | 2,262 | 3,116 |
| Median Property Value | $181,200 | $171,700 |
| Median Household Income | $85,100 | $924 |
| Monthly Housing Costs | $681 | $164 |
| Real Estate Taxes | $4,690 | $81 |
Property Value by Mortgage Status in Urbana
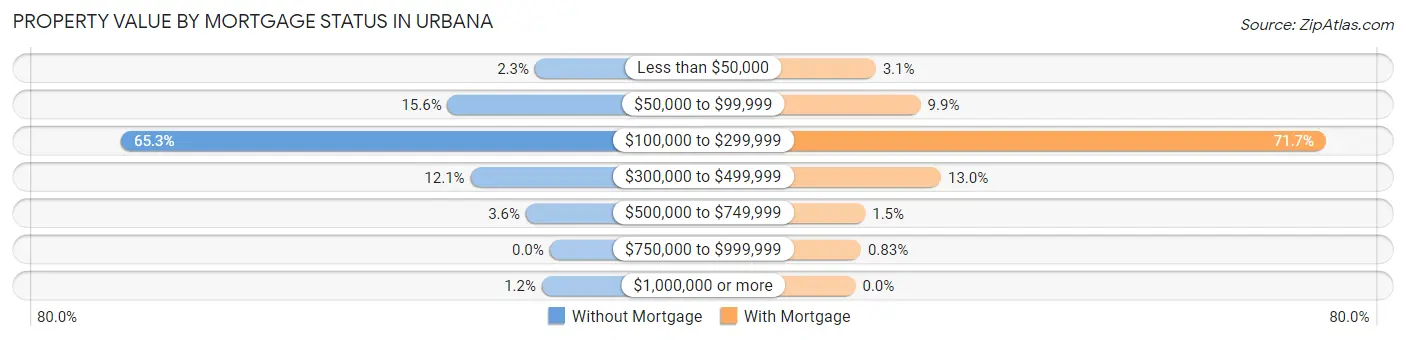
| Property Value | Without Mortgage | With Mortgage |
| Less than $50,000 | 51 (2.2%) | 96 (3.1%) |
| $50,000 to $99,999 | 352 (15.6%) | 309 (9.9%) |
| $100,000 to $299,999 | 1,477 (65.3%) | 2,233 (71.7%) |
| $300,000 to $499,999 | 273 (12.1%) | 406 (13.0%) |
| $500,000 to $749,999 | 82 (3.6%) | 46 (1.5%) |
| $750,000 to $999,999 | 0 (0.0%) | 26 (0.8%) |
| $1,000,000 or more | 27 (1.2%) | 0 (0.0%) |
| Total | 2,262 (100.0%) | 3,116 (100.0%) |
Household Income by Mortgage Status in Urbana
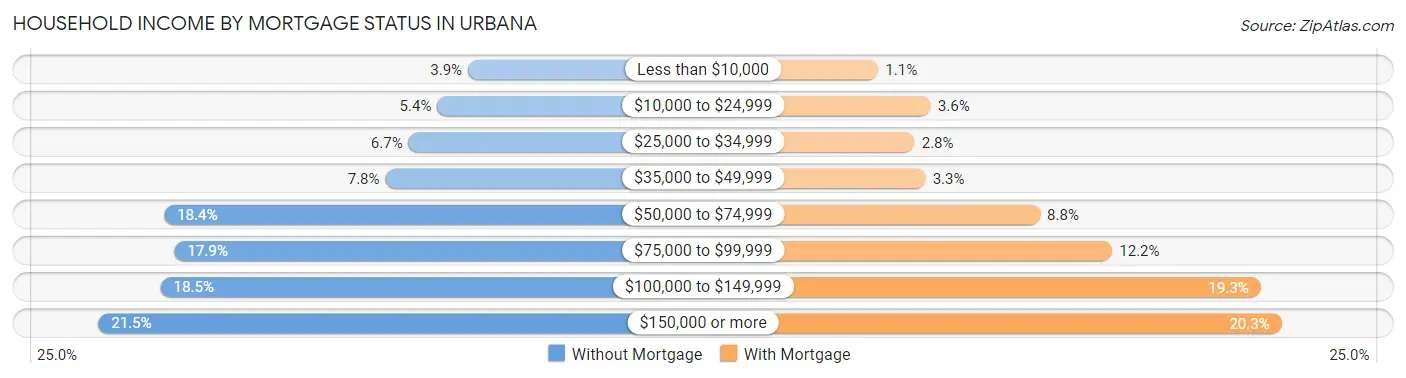
| Household Income | Without Mortgage | With Mortgage |
| Less than $10,000 | 88 (3.9%) | 34 (1.1%) |
| $10,000 to $24,999 | 121 (5.3%) | 112 (3.6%) |
| $25,000 to $34,999 | 152 (6.7%) | 88 (2.8%) |
| $35,000 to $49,999 | 177 (7.8%) | 104 (3.3%) |
| $50,000 to $74,999 | 415 (18.3%) | 274 (8.8%) |
| $75,000 to $99,999 | 404 (17.9%) | 381 (12.2%) |
| $100,000 to $149,999 | 419 (18.5%) | 601 (19.3%) |
| $150,000 or more | 486 (21.5%) | 632 (20.3%) |
| Total | 2,262 (100.0%) | 3,116 (100.0%) |
Property Value to Household Income Ratio in Urbana
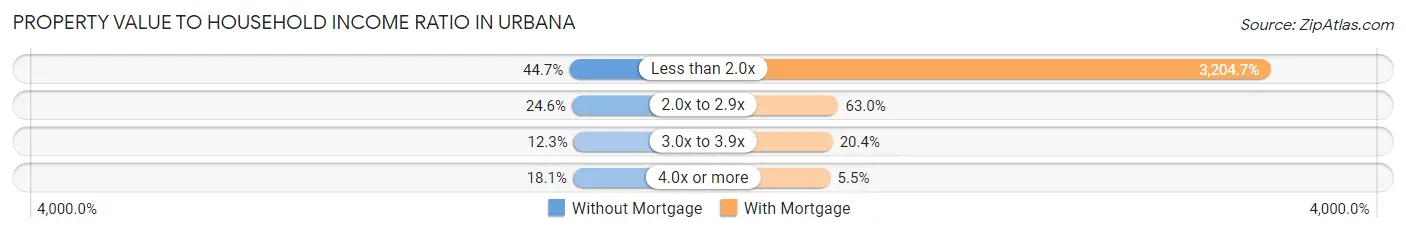
| Value-to-Income Ratio | Without Mortgage | With Mortgage |
| Less than 2.0x | 1,011 (44.7%) | 99,857 (3,204.7%) |
| 2.0x to 2.9x | 556 (24.6%) | 1,962 (63.0%) |
| 3.0x to 3.9x | 278 (12.3%) | 635 (20.4%) |
| 4.0x or more | 410 (18.1%) | 172 (5.5%) |
| Total | 2,262 (100.0%) | 3,116 (100.0%) |
Real Estate Taxes by Mortgage Status in Urbana
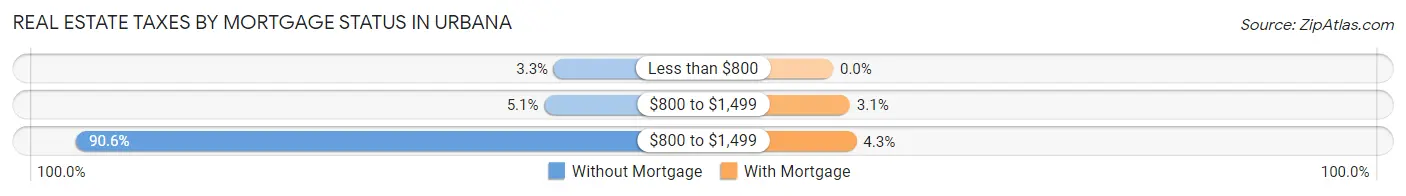
| Property Taxes | Without Mortgage | With Mortgage |
| Less than $800 | 75 (3.3%) | 0 (0.0%) |
| $800 to $1,499 | 115 (5.1%) | 96 (3.1%) |
| $800 to $1,499 | 2,049 (90.6%) | 133 (4.3%) |
| Total | 2,262 (100.0%) | 3,116 (100.0%) |
Health & Disability in Urbana
Health Insurance Coverage by Age in Urbana
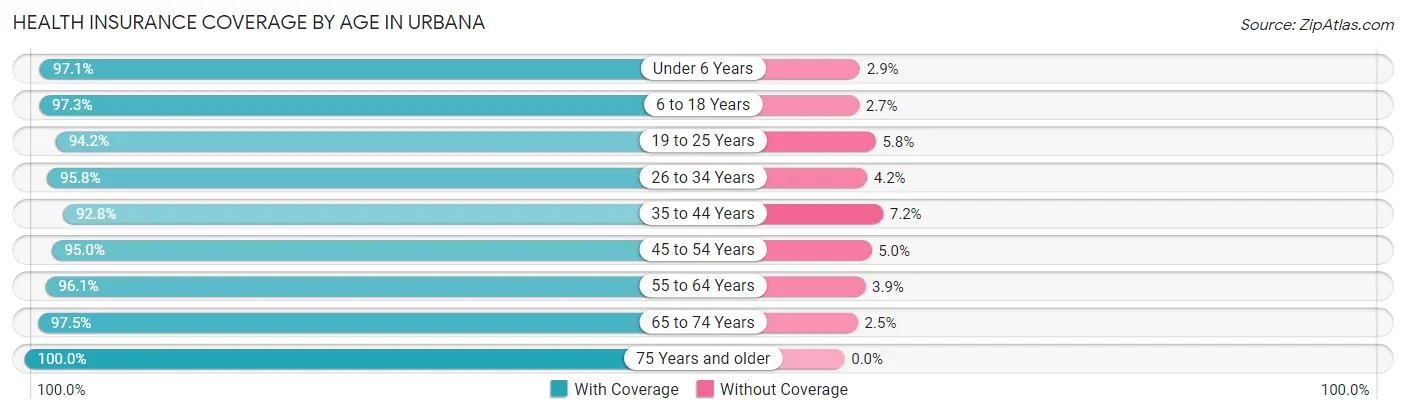
| Age Bracket | With Coverage | Without Coverage |
| Under 6 Years | 1,708 (97.1%) | 51 (2.9%) |
| 6 to 18 Years | 4,466 (97.3%) | 124 (2.7%) |
| 19 to 25 Years | 12,689 (94.2%) | 782 (5.8%) |
| 26 to 34 Years | 5,526 (95.8%) | 242 (4.2%) |
| 35 to 44 Years | 2,724 (92.8%) | 211 (7.2%) |
| 45 to 54 Years | 2,443 (95.0%) | 129 (5.0%) |
| 55 to 64 Years | 2,798 (96.1%) | 113 (3.9%) |
| 65 to 74 Years | 2,349 (97.5%) | 60 (2.5%) |
| 75 Years and older | 1,717 (100.0%) | 0 (0.0%) |
| Total | 36,420 (95.5%) | 1,712 (4.5%) |
Health Insurance Coverage by Citizenship Status in Urbana
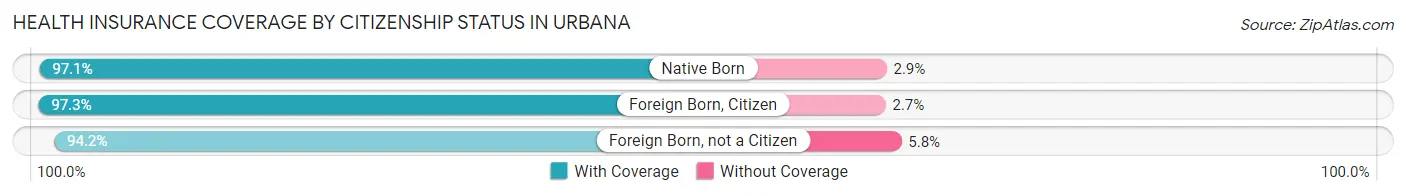
| Citizenship Status | With Coverage | Without Coverage |
| Native Born | 1,708 (97.1%) | 51 (2.9%) |
| Foreign Born, Citizen | 4,466 (97.3%) | 124 (2.7%) |
| Foreign Born, not a Citizen | 12,689 (94.2%) | 782 (5.8%) |
Health Insurance Coverage by Household Income in Urbana
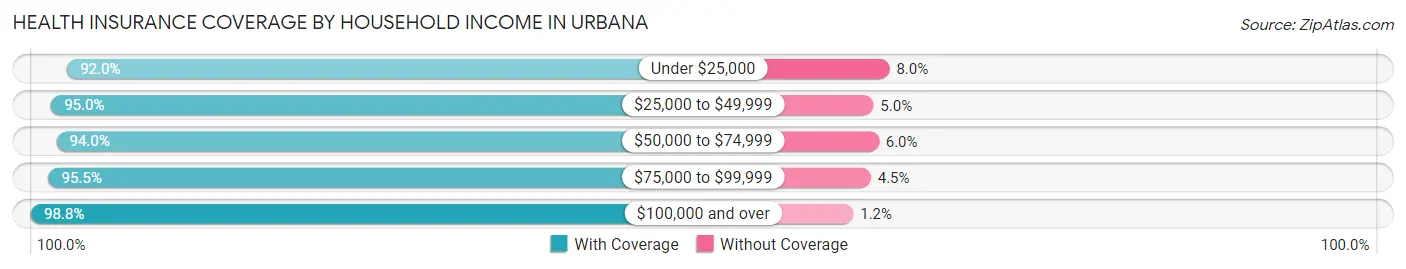
| Household Income | With Coverage | Without Coverage |
| Under $25,000 | 8,607 (92.0%) | 747 (8.0%) |
| $25,000 to $49,999 | 5,783 (95.0%) | 304 (5.0%) |
| $50,000 to $74,999 | 5,464 (94.0%) | 348 (6.0%) |
| $75,000 to $99,999 | 3,318 (95.5%) | 156 (4.5%) |
| $100,000 and over | 7,931 (98.8%) | 98 (1.2%) |
Public vs Private Health Insurance Coverage by Age in Urbana
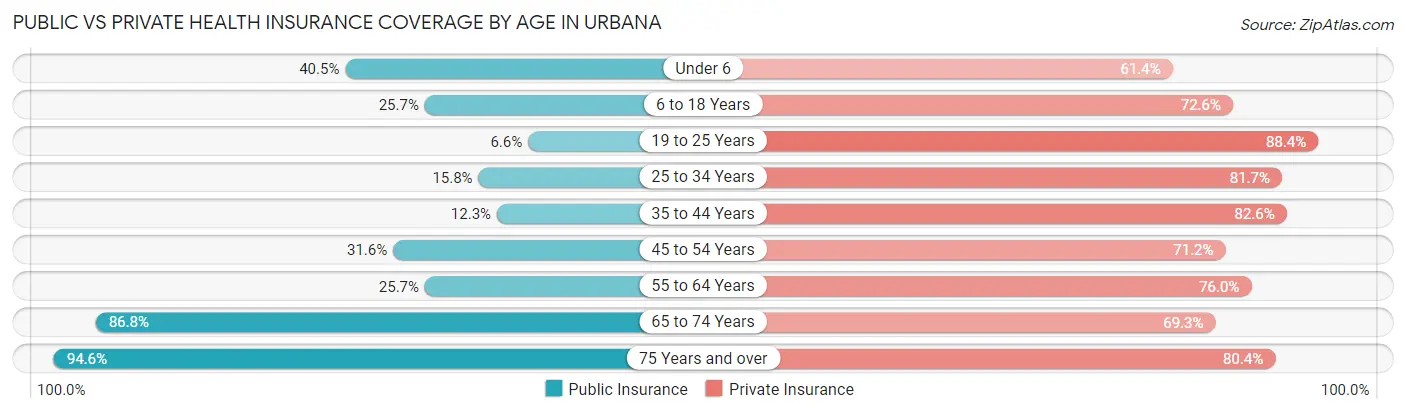
| Age Bracket | Public Insurance | Private Insurance |
| Under 6 | 712 (40.5%) | 1,080 (61.4%) |
| 6 to 18 Years | 1,181 (25.7%) | 3,331 (72.6%) |
| 19 to 25 Years | 883 (6.6%) | 11,908 (88.4%) |
| 25 to 34 Years | 909 (15.8%) | 4,710 (81.7%) |
| 35 to 44 Years | 362 (12.3%) | 2,423 (82.6%) |
| 45 to 54 Years | 813 (31.6%) | 1,831 (71.2%) |
| 55 to 64 Years | 748 (25.7%) | 2,212 (76.0%) |
| 65 to 74 Years | 2,091 (86.8%) | 1,670 (69.3%) |
| 75 Years and over | 1,624 (94.6%) | 1,381 (80.4%) |
| Total | 9,323 (24.4%) | 30,546 (80.1%) |
Disability Status by Sex by Age in Urbana
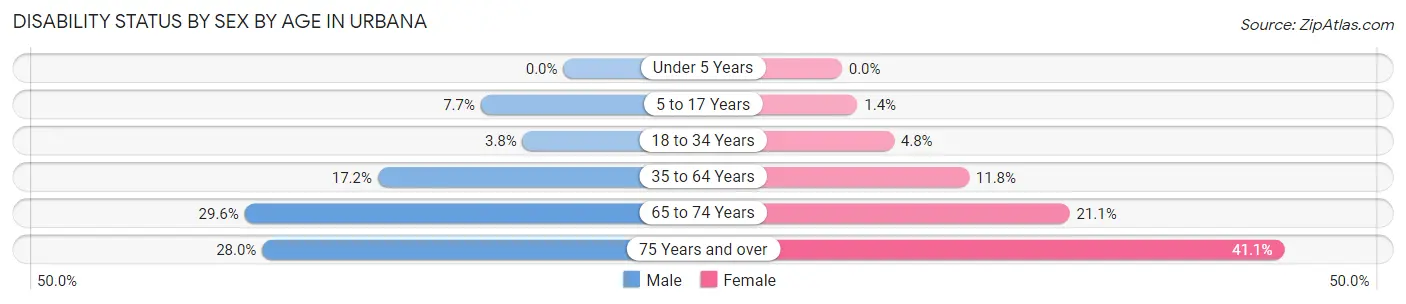
| Age Bracket | Male | Female |
| Under 5 Years | 0 (0.0%) | 0 (0.0%) |
| 5 to 17 Years | 103 (7.7%) | 18 (1.4%) |
| 18 to 34 Years | 415 (3.8%) | 506 (4.8%) |
| 35 to 64 Years | 677 (17.2%) | 529 (11.8%) |
| 65 to 74 Years | 360 (29.6%) | 252 (21.1%) |
| 75 Years and over | 192 (28.0%) | 423 (41.1%) |
Disability Class by Sex by Age in Urbana
Disability Class: Hearing Difficulty
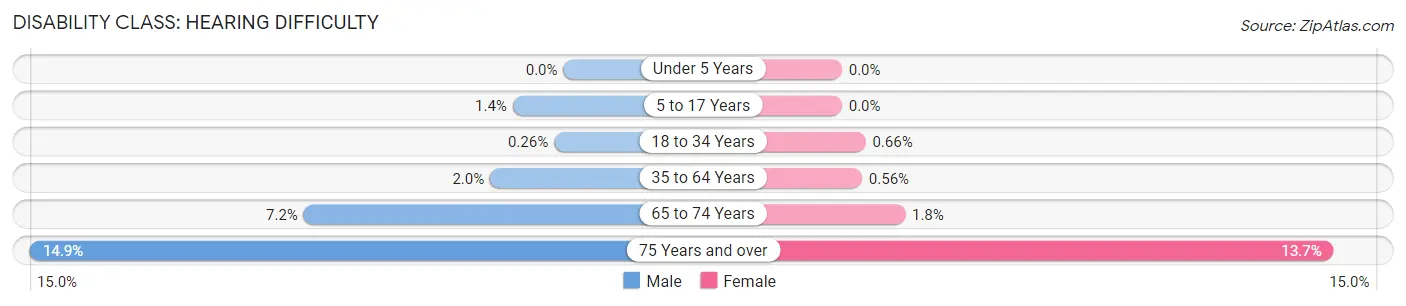
| Age Bracket | Male | Female |
| Under 5 Years | 0 (0.0%) | 0 (0.0%) |
| 5 to 17 Years | 19 (1.4%) | 0 (0.0%) |
| 18 to 34 Years | 28 (0.3%) | 69 (0.7%) |
| 35 to 64 Years | 80 (2.0%) | 25 (0.6%) |
| 65 to 74 Years | 88 (7.2%) | 21 (1.8%) |
| 75 Years and over | 102 (14.8%) | 141 (13.7%) |
Disability Class: Vision Difficulty
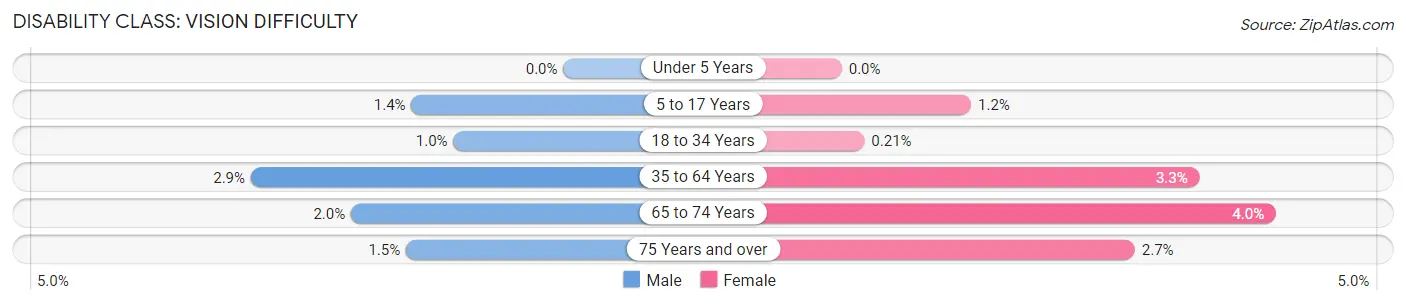
| Age Bracket | Male | Female |
| Under 5 Years | 0 (0.0%) | 0 (0.0%) |
| 5 to 17 Years | 19 (1.4%) | 15 (1.2%) |
| 18 to 34 Years | 112 (1.0%) | 22 (0.2%) |
| 35 to 64 Years | 114 (2.9%) | 149 (3.3%) |
| 65 to 74 Years | 24 (2.0%) | 48 (4.0%) |
| 75 Years and over | 10 (1.5%) | 28 (2.7%) |
Disability Class: Cognitive Difficulty
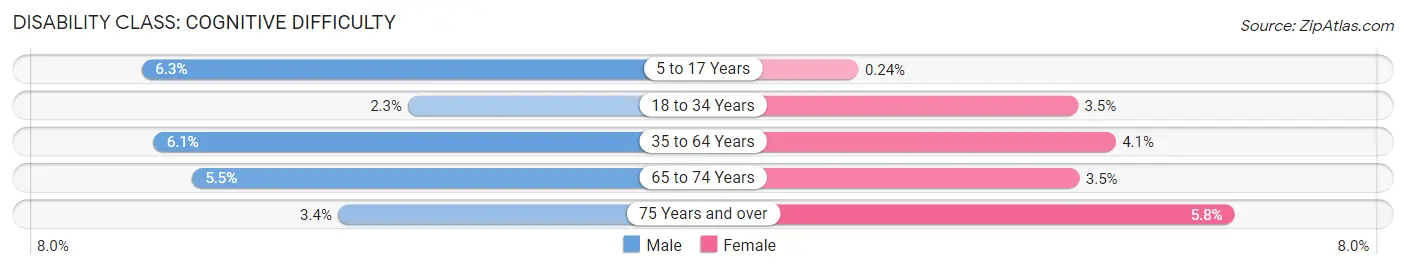
| Age Bracket | Male | Female |
| 5 to 17 Years | 84 (6.2%) | 3 (0.2%) |
| 18 to 34 Years | 253 (2.3%) | 367 (3.5%) |
| 35 to 64 Years | 239 (6.1%) | 182 (4.1%) |
| 65 to 74 Years | 67 (5.5%) | 42 (3.5%) |
| 75 Years and over | 23 (3.4%) | 60 (5.8%) |
Disability Class: Ambulatory Difficulty
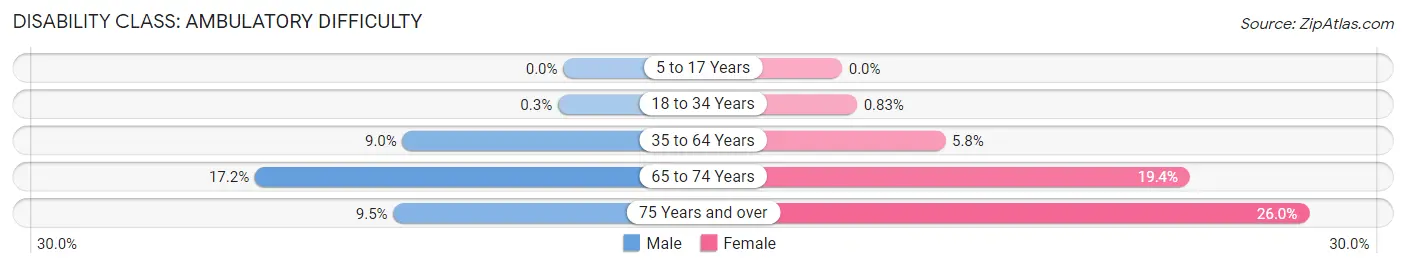
| Age Bracket | Male | Female |
| 5 to 17 Years | 0 (0.0%) | 0 (0.0%) |
| 18 to 34 Years | 33 (0.3%) | 87 (0.8%) |
| 35 to 64 Years | 352 (8.9%) | 258 (5.8%) |
| 65 to 74 Years | 209 (17.2%) | 231 (19.4%) |
| 75 Years and over | 65 (9.5%) | 268 (26.0%) |
Disability Class: Self-Care Difficulty
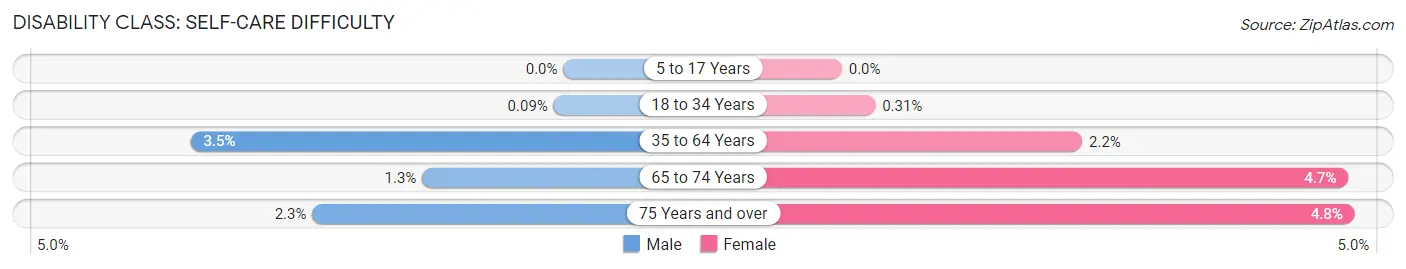
| Age Bracket | Male | Female |
| 5 to 17 Years | 0 (0.0%) | 0 (0.0%) |
| 18 to 34 Years | 10 (0.1%) | 33 (0.3%) |
| 35 to 64 Years | 136 (3.5%) | 100 (2.2%) |
| 65 to 74 Years | 16 (1.3%) | 56 (4.7%) |
| 75 Years and over | 16 (2.3%) | 49 (4.8%) |
Technology Access in Urbana
Computing Device Access in Urbana
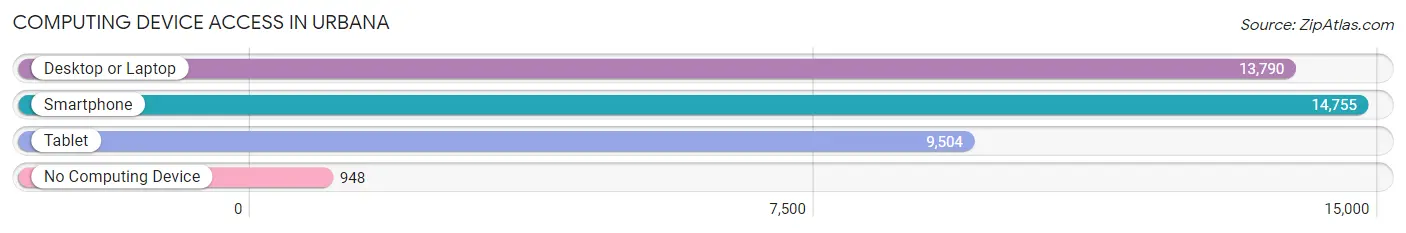
| Device Type | # Households | % Households |
| Desktop or Laptop | 13,790 | 84.2% |
| Smartphone | 14,755 | 90.1% |
| Tablet | 9,504 | 58.0% |
| No Computing Device | 948 | 5.8% |
| Total | 16,380 | 100.0% |
Internet Access in Urbana
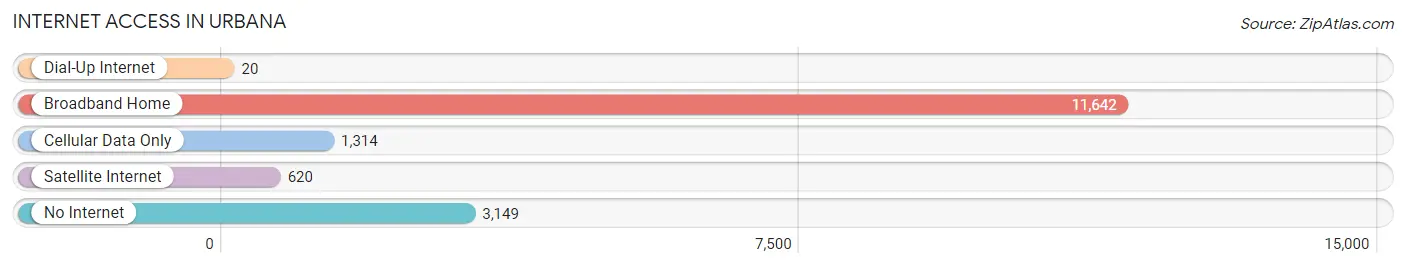
| Internet Type | # Households | % Households |
| Dial-Up Internet | 20 | 0.1% |
| Broadband Home | 11,642 | 71.1% |
| Cellular Data Only | 1,314 | 8.0% |
| Satellite Internet | 620 | 3.8% |
| No Internet | 3,149 | 19.2% |
| Total | 16,380 | 100.0% |
Urbana Summary
Urbana, Illinois is a city located in Champaign County, Illinois, United States. It is the county seat of Champaign County and the tenth-most populous city in Illinois. As of the 2010 census, the population was 41,250. Urbana is the principal city of the Champaign-Urbana metropolitan area, which had a population of 201,081 as of July 1, 2017.
History
The area of Urbana was first settled in 1822, when it was known as Big Grove. The town was officially founded in 1833, when it was named after the town of Urbana, Ohio. The town was incorporated in 1859.
In the late 19th century, Urbana was a center of the temperance movement. The town was home to the first temperance society in the state of Illinois, and the first temperance newspaper in the state.
In the early 20th century, Urbana was a center of the suffrage movement. The town was home to the first suffrage society in the state of Illinois, and the first suffrage newspaper in the state.
Geography
Urbana is located at 40°6′35″N 88°12′33″W (40.109722, -88.209167). According to the 2010 census, Urbana has a total area of 9.81 square miles (25.37 km2), of which 9.77 square miles (25.27 km2) (or 99.59%) is land and 0.04 square miles (0.10 km2) (or 0.41%) is water.
Economy
Urbana is home to the University of Illinois at Urbana-Champaign, which is the largest employer in the city. Other major employers include Carle Foundation Hospital, the Champaign-Urbana Mass Transit District, and the Urbana School District.
The city is also home to a number of technology companies, including Wolfram Research, the makers of Mathematica and Wolfram Alpha.
Demographics
As of the 2010 census, there were 41,250 people, 16,569 households, and 8,719 families residing in the city. The population density was 4,219.3 people per square mile (1,624.2/km2). There were 17,867 housing units at an average density of 1,822.7 per square mile (703.7/km2). The racial makeup of the city was 68.2% White, 15.3% African American, 0.3% Native American, 11.7% Asian, 0.1% Pacific Islander, 2.2% from other races, and 2.4% from two or more races. Hispanic or Latino of any race were 5.2% of the population.
There were 16,569 households, out of which 24.2% had children under the age of 18 living with them, 38.2% were married couples living together, 10.3% had a female householder with no husband present, and 47.7% were non-families. 33.2% of all households were made up of individuals, and 8.7% had someone living alone who was 65 years of age or older. The average household size was 2.30 and the average family size was 2.98.
In the city, the population was spread out, with 19.7% under the age of 18, 20.1% from 18 to 24, 28.5% from 25 to 44, 20.3% from 45 to 64, and 11.4% who were 65 years of age or older. The median age was 31 years. For every 100 females, there were 94.2 males. For every 100 females age 18 and over, there were 92.3 males.
The median income for a household in the city was $41,946, and the median income for a family was $58,921. Males had a median income of $41,944 versus $30,845 for females. The per capita income for the city was $22,945. About 8.2% of families and 17.2% of the population were below the poverty line, including 12.2% of those under age 18 and 6.7% of those age 65 or over.
Common Questions
What is Per Capita Income in Urbana?
Per Capita income in Urbana is $28,954.
What is the Median Family Income in Urbana?
Median Family Income in Urbana is $80,916.
What is the Median Household income in Urbana?
Median Household Income in Urbana is $41,115.
What is Income or Wage Gap in Urbana?
Income or Wage Gap in Urbana is 9.6%.
Women in Urbana earn 90.4 cents for every dollar earned by a man.
What is Family Income Deficit in Urbana?
Family Income Deficit in Urbana is $10,448.
Families that are below poverty line in Urbana earn $10,448 less on average than the poverty threshold level.
What is Inequality or Gini Index in Urbana?
Inequality or Gini Index in Urbana is 0.54.
What is the Total Population of Urbana?
Total Population of Urbana is 38,741.
What is the Total Male Population of Urbana?
Total Male Population of Urbana is 19,168.
What is the Total Female Population of Urbana?
Total Female Population of Urbana is 19,573.
What is the Ratio of Males per 100 Females in Urbana?
There are 97.93 Males per 100 Females in Urbana.
What is the Ratio of Females per 100 Males in Urbana?
There are 102.11 Females per 100 Males in Urbana.
What is the Median Population Age in Urbana?
Median Population Age in Urbana is 25.5 Years.
What is the Average Family Size in Urbana
Average Family Size in Urbana is 2.8 People.
What is the Average Household Size in Urbana
Average Household Size in Urbana is 2.0 People.
How Large is the Labor Force in Urbana?
There are 20,287 People in the Labor Forcein in Urbana.
What is the Percentage of People in the Labor Force in Urbana?
58.0% of People are in the Labor Force in Urbana.
What is the Unemployment Rate in Urbana?
Unemployment Rate in Urbana is 5.7%.