Zip Codes with the Highest Percentage of Population Employed in Life, Physical & Social Science in Plainfield, IL
RELATED REPORTS & OPTIONS
Life, Physical & Social Science
Plainfield
Compare Zip Codes
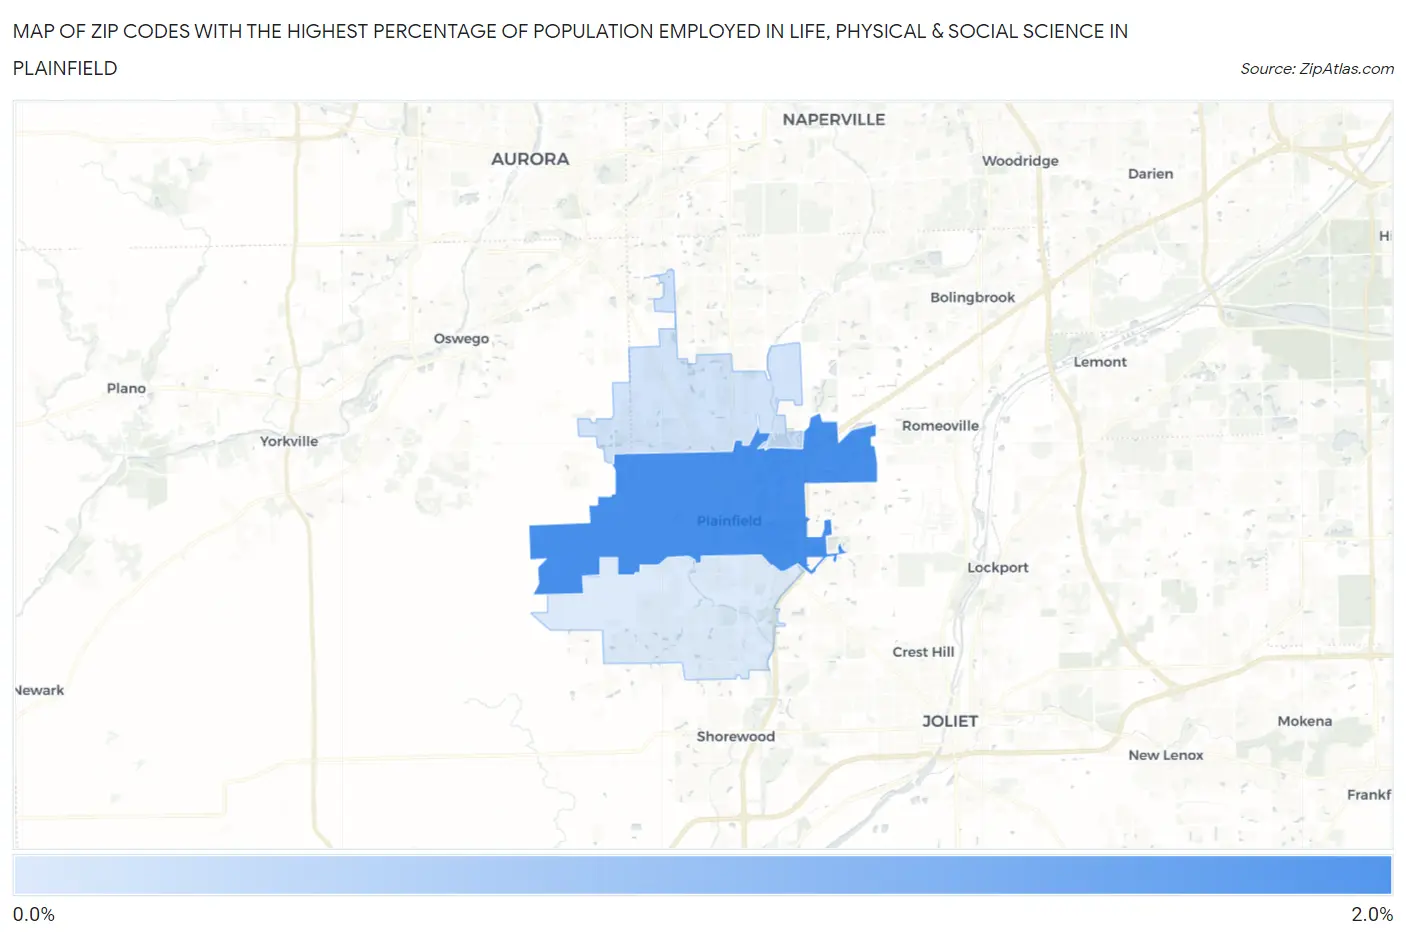
Map of Zip Codes with the Highest Percentage of Population Employed in Life, Physical & Social Science in Plainfield
0.28%
1.8%
Zip Codes with the Highest Percentage of Population Employed in Life, Physical & Social Science in Plainfield, IL
| Zip Code | % Employed | vs State | vs National | |
| 1. | 60544 | 1.8% | 0.98%(+0.864)#128 | 1.1%(+0.752)#4,168 |
| 2. | 60585 | 0.41% | 0.98%(-0.573)#633 | 1.1%(-0.685)#15,669 |
| 3. | 60586 | 0.28% | 0.98%(-0.696)#724 | 1.1%(-0.808)#17,257 |
1
Common Questions
What are the Top Zip Codes with the Highest Percentage of Population Employed in Life, Physical & Social Science in Plainfield, IL?
Top Zip Codes with the Highest Percentage of Population Employed in Life, Physical & Social Science in Plainfield, IL are:
What zip code has the Highest Percentage of Population Employed in Life, Physical & Social Science in Plainfield, IL?
60544 has the Highest Percentage of Population Employed in Life, Physical & Social Science in Plainfield, IL with 1.8%.
What is the Percentage of Population Employed in Life, Physical & Social Science in Plainfield, IL?
Percentage of Population Employed in Life, Physical & Social Science in Plainfield is 0.50%.
What is the Percentage of Population Employed in Life, Physical & Social Science in Illinois?
Percentage of Population Employed in Life, Physical & Social Science in Illinois is 0.98%.
What is the Percentage of Population Employed in Life, Physical & Social Science in the United States?
Percentage of Population Employed in Life, Physical & Social Science in the United States is 1.1%.