Souderton borough, PA Map & Demographics
Souderton borough Overview
$37,796
PER CAPITA INCOME
$96,521
AVG FAMILY INCOME
$77,342
AVG HOUSEHOLD INCOME
25.3%
WAGE / INCOME GAP [ % ]
74.7¢/ $1
WAGE / INCOME GAP [ $ ]
0.41
INEQUALITY / GINI INDEX
7,169
TOTAL POPULATION
3,346
MALE POPULATION
3,823
FEMALE POPULATION
87.52
MALES / 100 FEMALES
114.26
FEMALES / 100 MALES
36.6
MEDIAN AGE
3.1
AVG FAMILY SIZE
2.6
AVG HOUSEHOLD SIZE
4,230
LABOR FORCE [ PEOPLE ]
74.6%
PERCENT IN LABOR FORCE
4.4%
UNEMPLOYMENT RATE
Income in Souderton borough
Income Overview in Souderton borough
Per Capita Income in Souderton borough is $37,796, while median incomes of families and households are $96,521 and $77,342 respectively.
| Characteristic | Number | Measure |
| Per Capita Income | 7,169 | $37,796 |
| Median Family Income | 1,893 | $96,521 |
| Mean Family Income | 1,893 | $113,717 |
| Median Household Income | 2,754 | $77,342 |
| Mean Household Income | 2,754 | $98,572 |
| Income Deficit | 1,893 | $0 |
| Wage / Income Gap (%) | 7,169 | 25.32% |
| Wage / Income Gap ($) | 7,169 | 74.68¢ per $1 |
| Gini / Inequality Index | 7,169 | 0.41 |
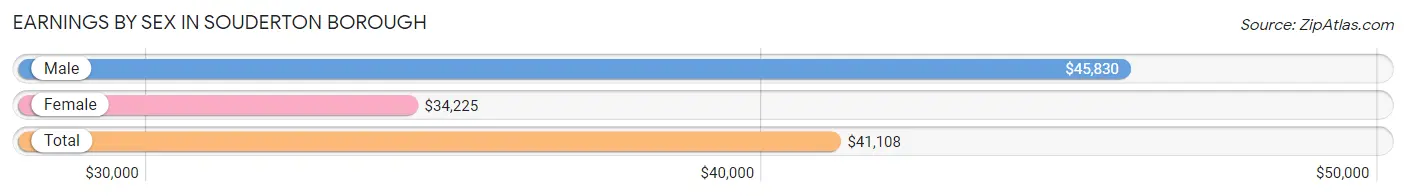
Earnings by Sex in Souderton borough
Average Earnings in Souderton borough are $41,108, $45,830 for men and $34,225 for women, a difference of 25.3%.
| Sex | Number | Average Earnings |
| Male | 2,337 (51.7%) | $45,830 |
| Female | 2,180 (48.3%) | $34,225 |
| Total | 4,517 (100.0%) | $41,108 |
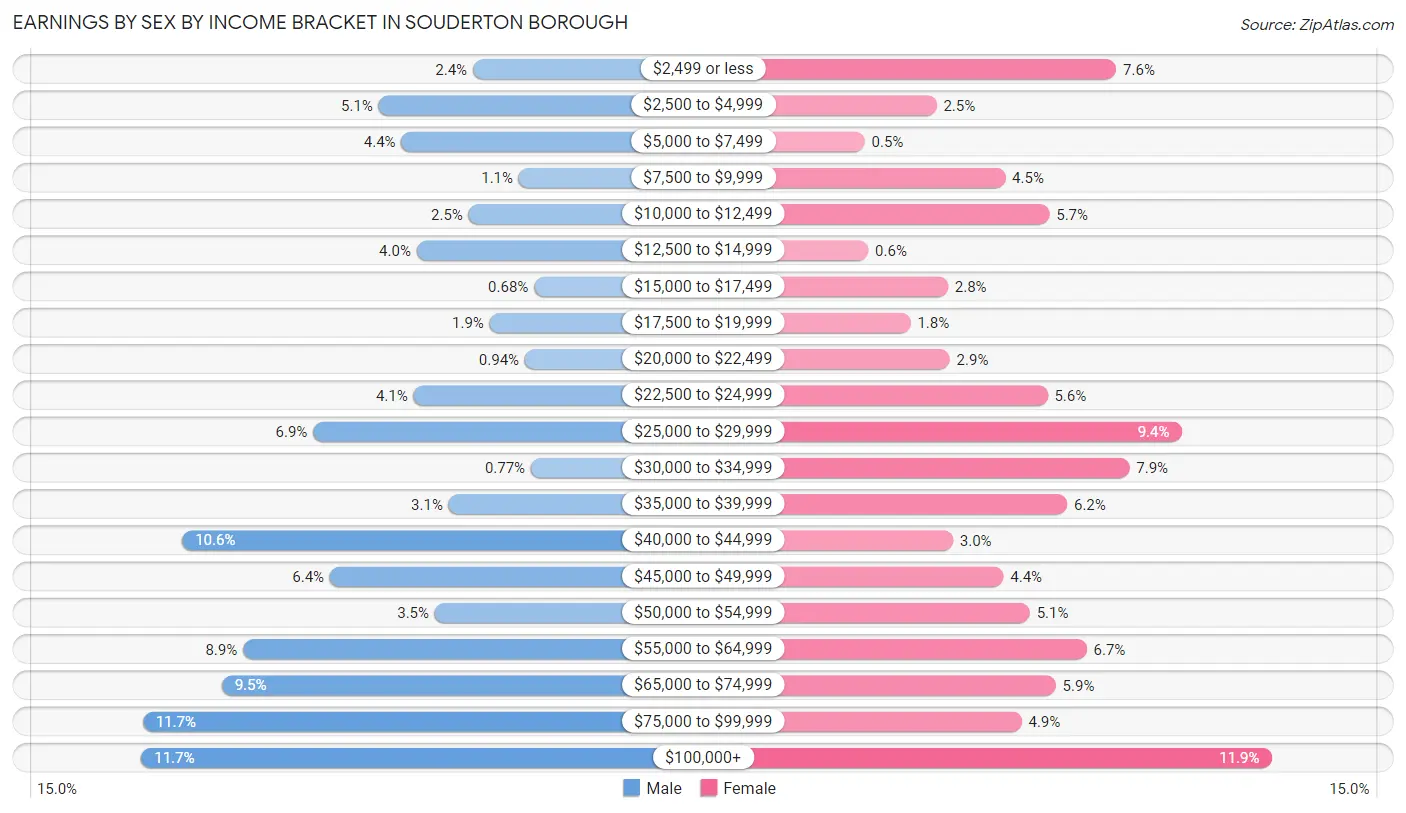
Earnings by Sex by Income Bracket in Souderton borough
The most common earnings brackets in Souderton borough are $100,000+ for men (274 | 11.7%) and $100,000+ for women (260 | 11.9%).
| Income | Male | Female |
| $2,499 or less | 56 (2.4%) | 165 (7.6%) |
| $2,500 to $4,999 | 118 (5.1%) | 55 (2.5%) |
| $5,000 to $7,499 | 103 (4.4%) | 11 (0.5%) |
| $7,500 to $9,999 | 26 (1.1%) | 97 (4.4%) |
| $10,000 to $12,499 | 59 (2.5%) | 124 (5.7%) |
| $12,500 to $14,999 | 93 (4.0%) | 13 (0.6%) |
| $15,000 to $17,499 | 16 (0.7%) | 62 (2.8%) |
| $17,500 to $19,999 | 45 (1.9%) | 39 (1.8%) |
| $20,000 to $22,499 | 22 (0.9%) | 63 (2.9%) |
| $22,500 to $24,999 | 95 (4.1%) | 123 (5.6%) |
| $25,000 to $29,999 | 161 (6.9%) | 205 (9.4%) |
| $30,000 to $34,999 | 18 (0.8%) | 173 (7.9%) |
| $35,000 to $39,999 | 72 (3.1%) | 135 (6.2%) |
| $40,000 to $44,999 | 247 (10.6%) | 65 (3.0%) |
| $45,000 to $49,999 | 150 (6.4%) | 96 (4.4%) |
| $50,000 to $54,999 | 81 (3.5%) | 112 (5.1%) |
| $55,000 to $64,999 | 207 (8.9%) | 147 (6.7%) |
| $65,000 to $74,999 | 221 (9.5%) | 128 (5.9%) |
| $75,000 to $99,999 | 273 (11.7%) | 107 (4.9%) |
| $100,000+ | 274 (11.7%) | 260 (11.9%) |
| Total | 2,337 (100.0%) | 2,180 (100.0%) |
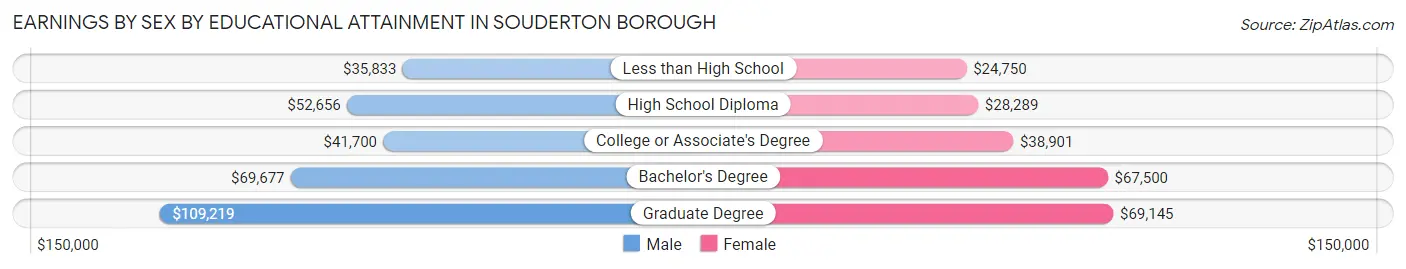
Earnings by Sex by Educational Attainment in Souderton borough
Average earnings in Souderton borough are $52,807 for men and $38,609 for women, a difference of 26.9%. Men with an educational attainment of graduate degree enjoy the highest average annual earnings of $109,219, while those with less than high school education earn the least with $35,833. Women with an educational attainment of graduate degree earn the most with the average annual earnings of $69,145, while those with less than high school education have the smallest earnings of $24,750.
| Educational Attainment | Male Income | Female Income |
| Less than High School | $35,833 | $24,750 |
| High School Diploma | $52,656 | $28,289 |
| College or Associate's Degree | $41,700 | $38,901 |
| Bachelor's Degree | $69,677 | $67,500 |
| Graduate Degree | $109,219 | $69,145 |
| Total | $52,807 | $38,609 |
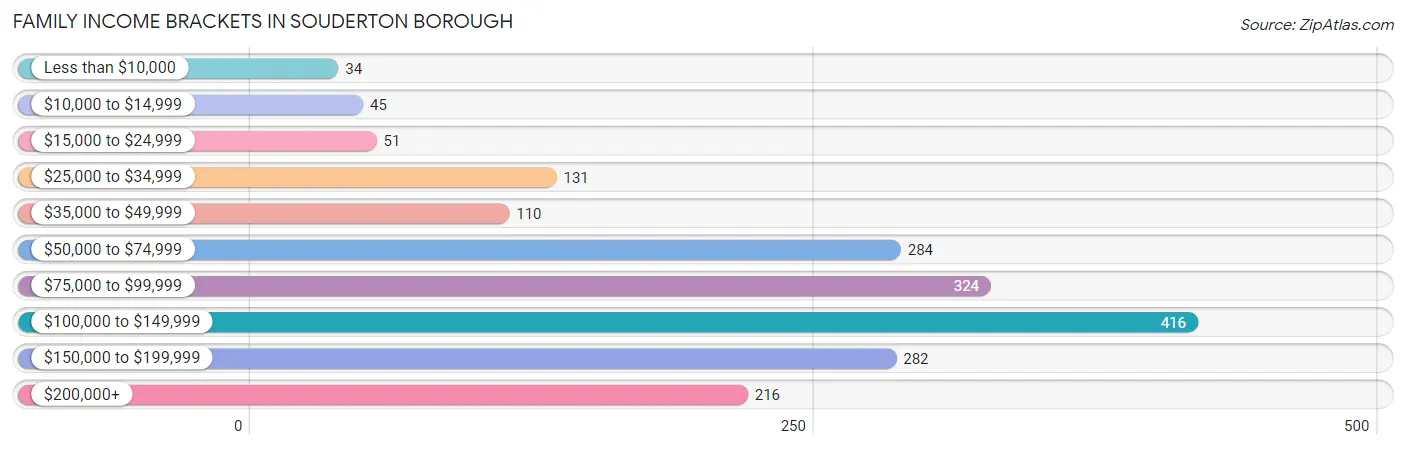
Family Income in Souderton borough
Family Income Brackets in Souderton borough
According to the Souderton borough family income data, there are 416 families falling into the $100,000 to $149,999 income range, which is the most common income bracket and makes up 22.0% of all families. Conversely, the less than $10,000 income bracket is the least frequent group with only 34 families (1.8%) belonging to this category.
| Income Bracket | # Families | % Families |
| Less than $10,000 | 34 | 1.8% |
| $10,000 to $14,999 | 45 | 2.4% |
| $15,000 to $24,999 | 51 | 2.7% |
| $25,000 to $34,999 | 131 | 6.9% |
| $35,000 to $49,999 | 110 | 5.8% |
| $50,000 to $74,999 | 284 | 15.0% |
| $75,000 to $99,999 | 324 | 17.1% |
| $100,000 to $149,999 | 416 | 22.0% |
| $150,000 to $199,999 | 282 | 14.9% |
| $200,000+ | 216 | 11.4% |
Family Income by Famaliy Size in Souderton borough
6-person families (37 | 1.9%) account for the highest median family income in Souderton borough with $167,083 per family, while 2-person families (858 | 45.3%) have the highest median income of $42,396 per family member.
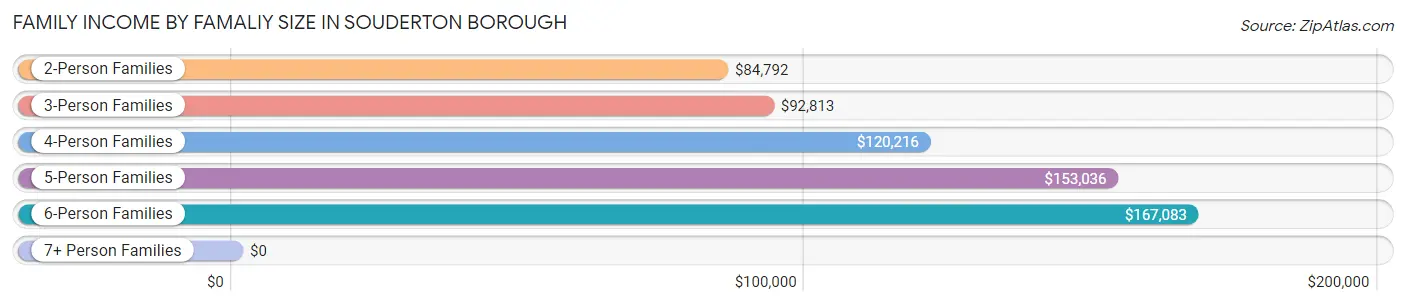
| Income Bracket | # Families | Median Income |
| 2-Person Families | 858 (45.3%) | $84,792 |
| 3-Person Families | 397 (21.0%) | $92,813 |
| 4-Person Families | 369 (19.5%) | $120,216 |
| 5-Person Families | 185 (9.8%) | $153,036 |
| 6-Person Families | 37 (1.9%) | $167,083 |
| 7+ Person Families | 47 (2.5%) | $0 |
| Total | 1,893 (100.0%) | $96,521 |
Family Income by Number of Earners in Souderton borough
The median family income in Souderton borough is $96,521, with families comprising 3+ earners (380) having the highest median family income of $150,250, while families with no earners (138) have the lowest median family income of $43,929, accounting for 20.1% and 7.3% of families, respectively.
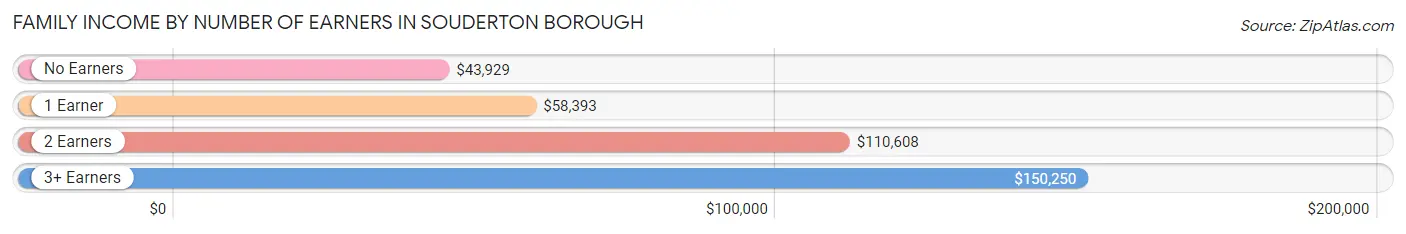
| Number of Earners | # Families | Median Income |
| No Earners | 138 (7.3%) | $43,929 |
| 1 Earner | 499 (26.4%) | $58,393 |
| 2 Earners | 876 (46.3%) | $110,608 |
| 3+ Earners | 380 (20.1%) | $150,250 |
| Total | 1,893 (100.0%) | $96,521 |
Household Income in Souderton borough
Household Income Brackets in Souderton borough
With 485 households falling in the category, the $100,000 to $149,999 income range is the most frequent in Souderton borough, accounting for 17.6% of all households. In contrast, only 55 households (2.0%) fall into the $10,000 to $14,999 income bracket, making it the least populous group.
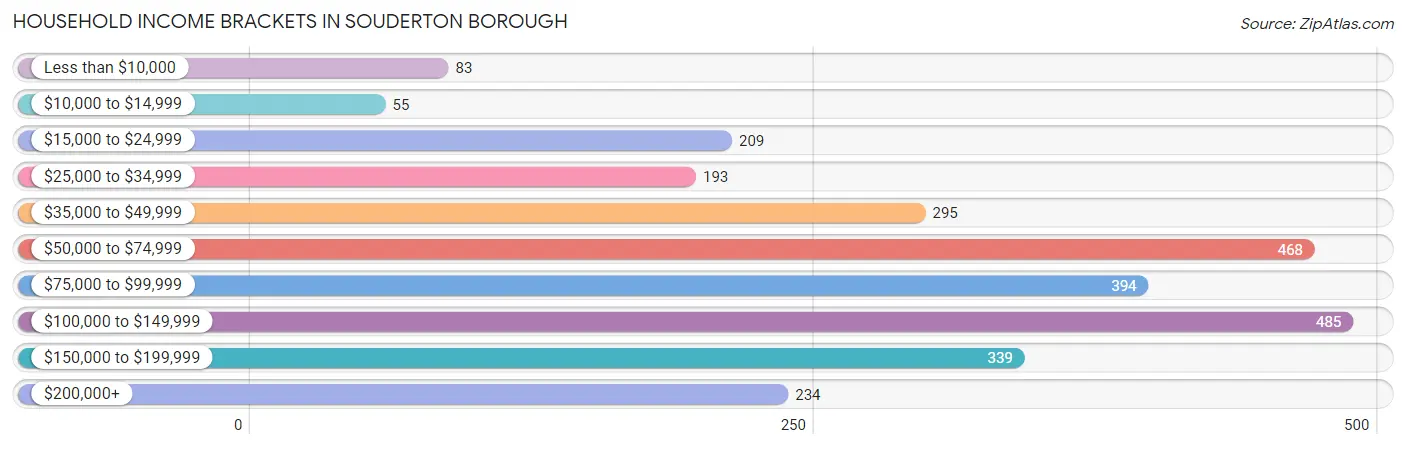
| Income Bracket | # Households | % Households |
| Less than $10,000 | 83 | 3.0% |
| $10,000 to $14,999 | 55 | 2.0% |
| $15,000 to $24,999 | 209 | 7.6% |
| $25,000 to $34,999 | 193 | 7.0% |
| $35,000 to $49,999 | 295 | 10.7% |
| $50,000 to $74,999 | 468 | 17.0% |
| $75,000 to $99,999 | 394 | 14.3% |
| $100,000 to $149,999 | 485 | 17.6% |
| $150,000 to $199,999 | 339 | 12.3% |
| $200,000+ | 234 | 8.5% |
Household Income by Householder Age in Souderton borough
The median household income in Souderton borough is $77,342, with the highest median household income of $94,808 found in the 45 to 64 years age bracket for the primary householder. A total of 1,148 households (41.7%) fall into this category. Meanwhile, the 15 to 24 years age bracket for the primary householder has the lowest median household income of $0, with 85 households (3.1%) in this group.
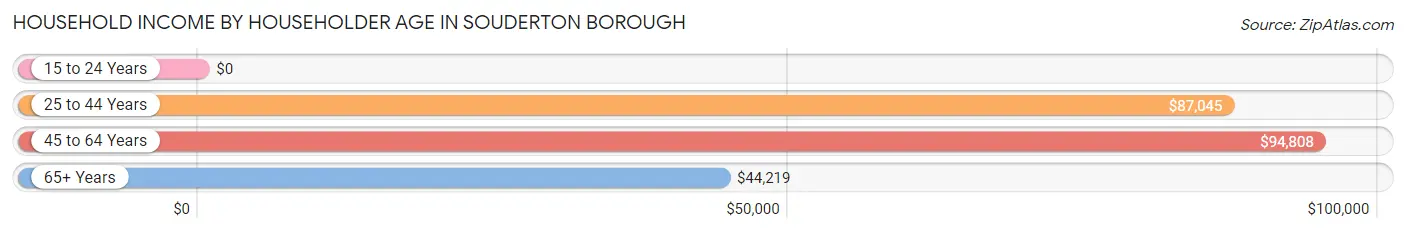
| Income Bracket | # Households | Median Income |
| 15 to 24 Years | 85 (3.1%) | $0 |
| 25 to 44 Years | 996 (36.2%) | $87,045 |
| 45 to 64 Years | 1,148 (41.7%) | $94,808 |
| 65+ Years | 525 (19.1%) | $44,219 |
| Total | 2,754 (100.0%) | $77,342 |
Poverty in Souderton borough
Income Below Poverty by Sex and Age in Souderton borough
With 9.5% poverty level for males and 9.4% for females among the residents of Souderton borough, 5 year old males and under 5 year old females are the most vulnerable to poverty, with 9 males (22.0%) and 44 females (18.8%) in their respective age groups living below the poverty level.
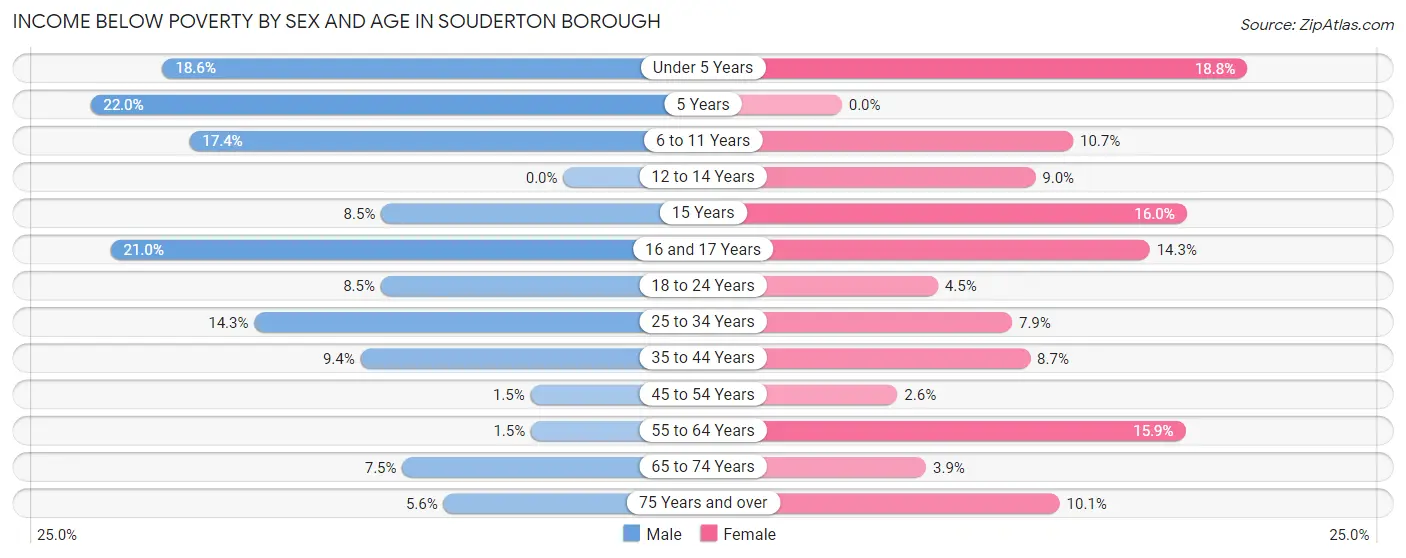
| Age Bracket | Male | Female |
| Under 5 Years | 48 (18.6%) | 44 (18.8%) |
| 5 Years | 9 (22.0%) | 0 (0.0%) |
| 6 to 11 Years | 38 (17.3%) | 31 (10.7%) |
| 12 to 14 Years | 0 (0.0%) | 15 (9.0%) |
| 15 Years | 6 (8.5%) | 20 (16.0%) |
| 16 and 17 Years | 29 (21.0%) | 11 (14.3%) |
| 18 to 24 Years | 21 (8.5%) | 12 (4.5%) |
| 25 to 34 Years | 81 (14.3%) | 47 (7.9%) |
| 35 to 44 Years | 45 (9.4%) | 39 (8.7%) |
| 45 to 54 Years | 6 (1.5%) | 13 (2.6%) |
| 55 to 64 Years | 7 (1.5%) | 88 (15.9%) |
| 65 to 74 Years | 18 (7.5%) | 11 (3.9%) |
| 75 Years and over | 7 (5.6%) | 27 (10.1%) |
| Total | 315 (9.5%) | 358 (9.4%) |
Income Above Poverty by Sex and Age in Souderton borough
According to the poverty statistics in Souderton borough, males aged 12 to 14 years and females aged 5 years are the age groups that are most secure financially, with 100.0% of males and 100.0% of females in these age groups living above the poverty line.
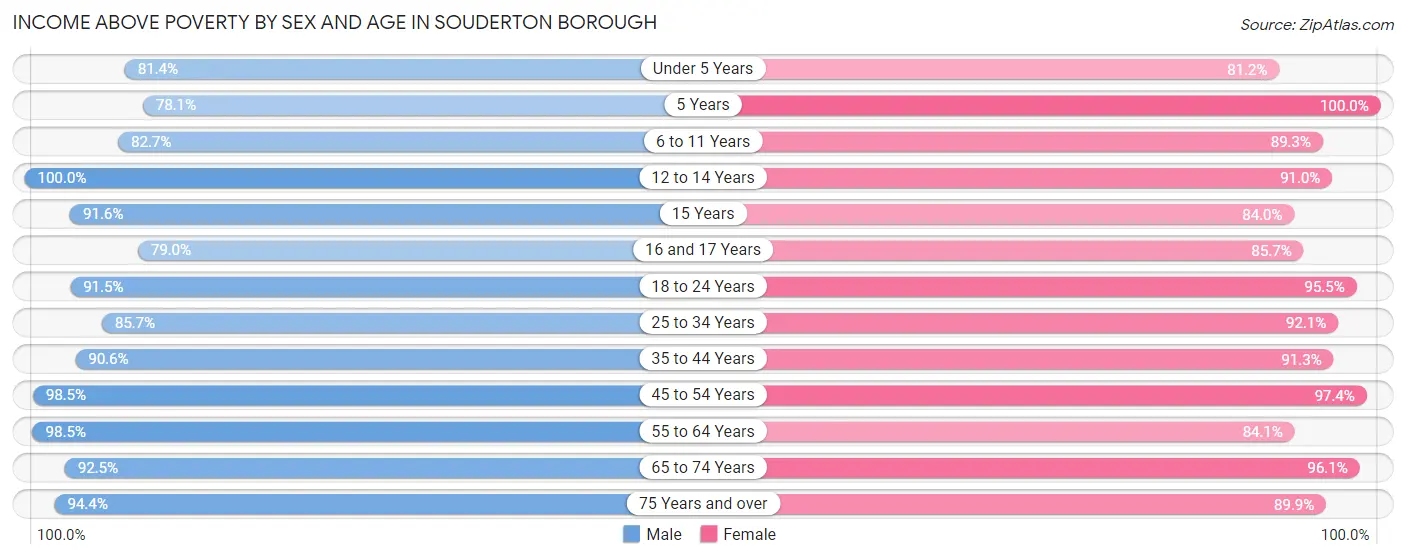
| Age Bracket | Male | Female |
| Under 5 Years | 210 (81.4%) | 190 (81.2%) |
| 5 Years | 32 (78.0%) | 7 (100.0%) |
| 6 to 11 Years | 181 (82.7%) | 258 (89.3%) |
| 12 to 14 Years | 76 (100.0%) | 152 (91.0%) |
| 15 Years | 65 (91.5%) | 105 (84.0%) |
| 16 and 17 Years | 109 (79.0%) | 66 (85.7%) |
| 18 to 24 Years | 227 (91.5%) | 257 (95.5%) |
| 25 to 34 Years | 484 (85.7%) | 548 (92.1%) |
| 35 to 44 Years | 433 (90.6%) | 407 (91.3%) |
| 45 to 54 Years | 389 (98.5%) | 490 (97.4%) |
| 55 to 64 Years | 460 (98.5%) | 464 (84.1%) |
| 65 to 74 Years | 223 (92.5%) | 270 (96.1%) |
| 75 Years and over | 119 (94.4%) | 240 (89.9%) |
| Total | 3,008 (90.5%) | 3,454 (90.6%) |
Income Below Poverty Among Married-Couple Families in Souderton borough
The poverty statistics for married-couple families in Souderton borough show that 0.8% or 11 of the total 1,403 families live below the poverty line. Families with no children have the highest poverty rate of 1.4%, comprising of 11 families. On the other hand, families with 1 or 2 children have the lowest poverty rate of 0.0%, which includes 0 families.
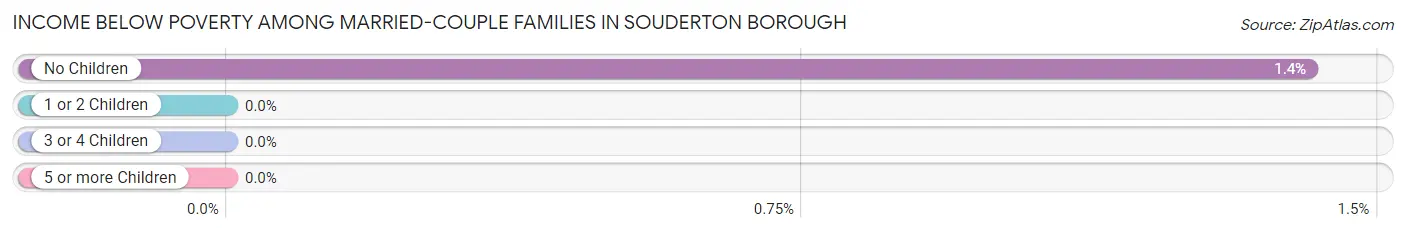
| Children | Above Poverty | Below Poverty |
| No Children | 770 (98.6%) | 11 (1.4%) |
| 1 or 2 Children | 513 (100.0%) | 0 (0.0%) |
| 3 or 4 Children | 109 (100.0%) | 0 (0.0%) |
| 5 or more Children | 0 (0.0%) | 0 (0.0%) |
| Total | 1,392 (99.2%) | 11 (0.8%) |
Income Below Poverty Among Single-Parent Households in Souderton borough
According to the poverty data in Souderton borough, 30.5% or 29 single-father households and 24.6% or 97 single-mother households are living below the poverty line. Among single-father households, those with 1 or 2 children have the highest poverty rate, with 29 households (42.6%) experiencing poverty. Likewise, among single-mother households, those with 1 or 2 children have the highest poverty rate, with 81 households (40.3%) falling below the poverty line.
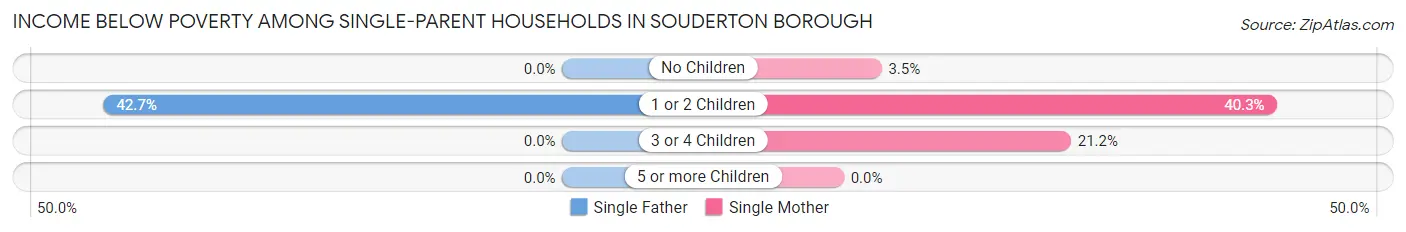
| Children | Single Father | Single Mother |
| No Children | 0 (0.0%) | 5 (3.5%) |
| 1 or 2 Children | 29 (42.6%) | 81 (40.3%) |
| 3 or 4 Children | 0 (0.0%) | 11 (21.1%) |
| 5 or more Children | 0 (0.0%) | 0 (0.0%) |
| Total | 29 (30.5%) | 97 (24.6%) |
Income Below Poverty Among Married-Couple vs Single-Parent Households in Souderton borough
The poverty data for Souderton borough shows that 11 of the married-couple family households (0.8%) and 126 of the single-parent households (25.7%) are living below the poverty level. Within the married-couple family households, those with no children have the highest poverty rate, with 11 households (1.4%) falling below the poverty line. Among the single-parent households, those with 1 or 2 children have the highest poverty rate, with 110 household (40.9%) living below poverty.
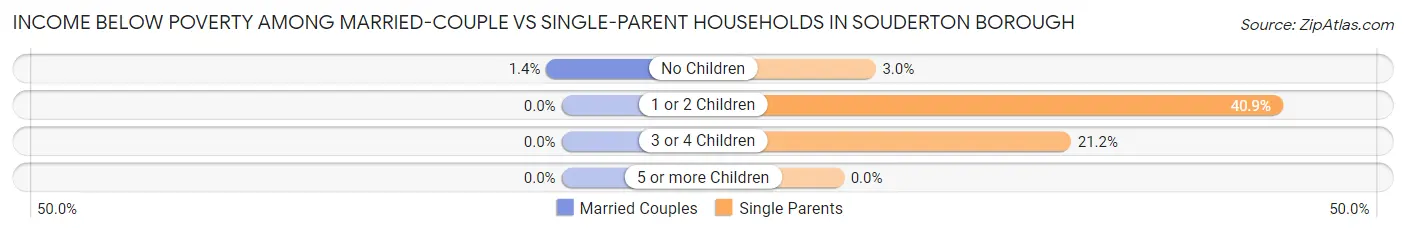
| Children | Married-Couple Families | Single-Parent Households |
| No Children | 11 (1.4%) | 5 (3.0%) |
| 1 or 2 Children | 0 (0.0%) | 110 (40.9%) |
| 3 or 4 Children | 0 (0.0%) | 11 (21.1%) |
| 5 or more Children | 0 (0.0%) | 0 (0.0%) |
| Total | 11 (0.8%) | 126 (25.7%) |
Race in Souderton borough
The most populous races in Souderton borough are White / Caucasian (5,911 | 82.5%), Hispanic or Latino (1,133 | 15.8%), and Some other Race (498 | 7.0%).
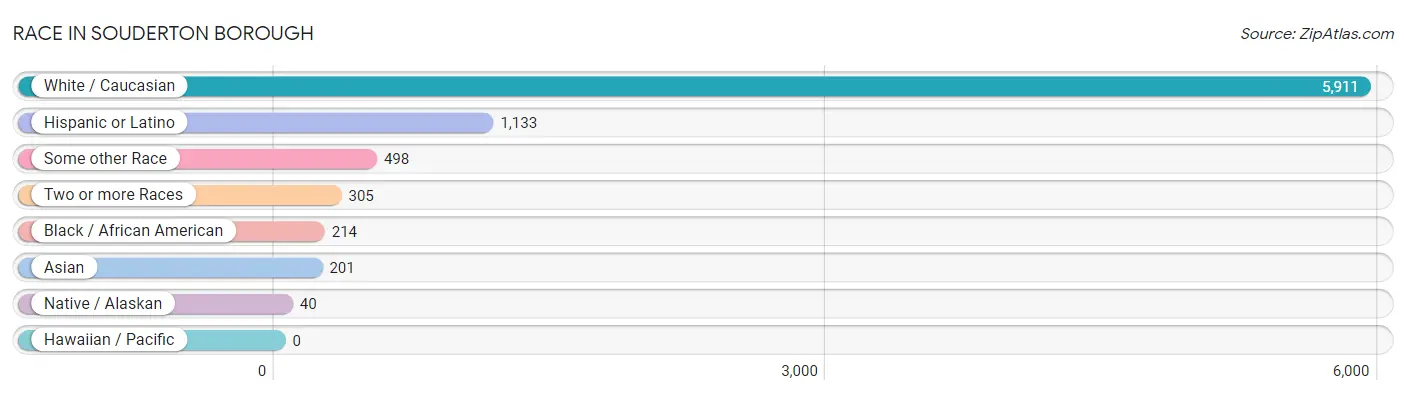
| Race | # Population | % Population |
| Asian | 201 | 2.8% |
| Black / African American | 214 | 3.0% |
| Hawaiian / Pacific | 0 | 0.0% |
| Hispanic or Latino | 1,133 | 15.8% |
| Native / Alaskan | 40 | 0.6% |
| White / Caucasian | 5,911 | 82.5% |
| Two or more Races | 305 | 4.3% |
| Some other Race | 498 | 7.0% |
| Total | 7,169 | 100.0% |
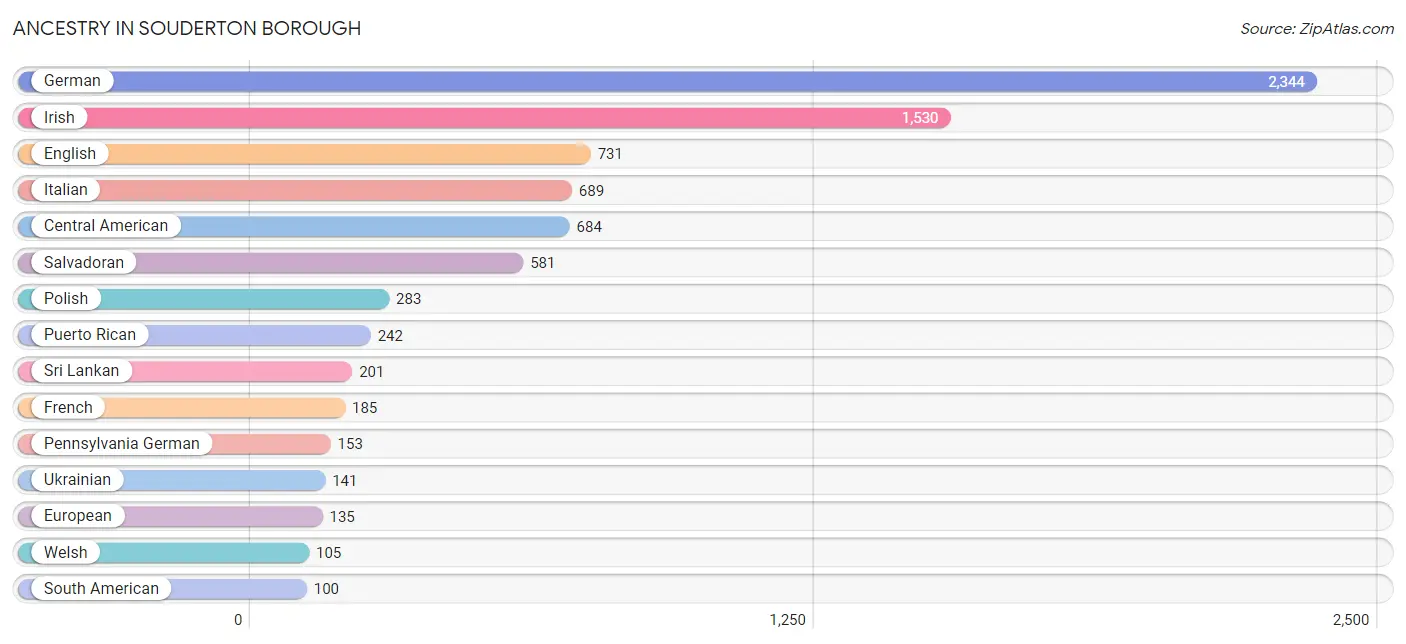
Ancestry in Souderton borough
The most populous ancestries reported in Souderton borough are German (2,344 | 32.7%), Irish (1,530 | 21.3%), English (731 | 10.2%), Italian (689 | 9.6%), and Central American (684 | 9.5%), together accounting for 83.4% of all Souderton borough residents.
| Ancestry | # Population | % Population |
| African | 13 | 0.2% |
| American | 67 | 0.9% |
| Austrian | 18 | 0.3% |
| Brazilian | 13 | 0.2% |
| British | 13 | 0.2% |
| Canadian | 15 | 0.2% |
| Central American | 684 | 9.5% |
| Central American Indian | 12 | 0.2% |
| Cherokee | 40 | 0.6% |
| Chilean | 11 | 0.2% |
| Choctaw | 8 | 0.1% |
| Colombian | 46 | 0.6% |
| Costa Rican | 7 | 0.1% |
| Cuban | 17 | 0.2% |
| Dominican | 76 | 1.1% |
| Dutch | 50 | 0.7% |
| Eastern European | 14 | 0.2% |
| Ecuadorian | 34 | 0.5% |
| English | 731 | 10.2% |
| Estonian | 9 | 0.1% |
| European | 135 | 1.9% |
| Finnish | 19 | 0.3% |
| French | 185 | 2.6% |
| French Canadian | 53 | 0.7% |
| German | 2,344 | 32.7% |
| Guatemalan | 20 | 0.3% |
| Honduran | 76 | 1.1% |
| Hungarian | 9 | 0.1% |
| Irish | 1,530 | 21.3% |
| Italian | 689 | 9.6% |
| Jamaican | 52 | 0.7% |
| Latvian | 12 | 0.2% |
| Lithuanian | 29 | 0.4% |
| Pennsylvania German | 153 | 2.1% |
| Polish | 283 | 4.0% |
| Puerto Rican | 242 | 3.4% |
| Russian | 31 | 0.4% |
| Salvadoran | 581 | 8.1% |
| Samoan | 7 | 0.1% |
| Scotch-Irish | 19 | 0.3% |
| Scottish | 77 | 1.1% |
| Slavic | 15 | 0.2% |
| Slovak | 25 | 0.4% |
| South American | 100 | 1.4% |
| Sri Lankan | 201 | 2.8% |
| Subsaharan African | 13 | 0.2% |
| Swedish | 38 | 0.5% |
| Swiss | 65 | 0.9% |
| Ukrainian | 141 | 2.0% |
| Welsh | 105 | 1.5% |
| West Indian | 7 | 0.1% | View All 51 Rows |
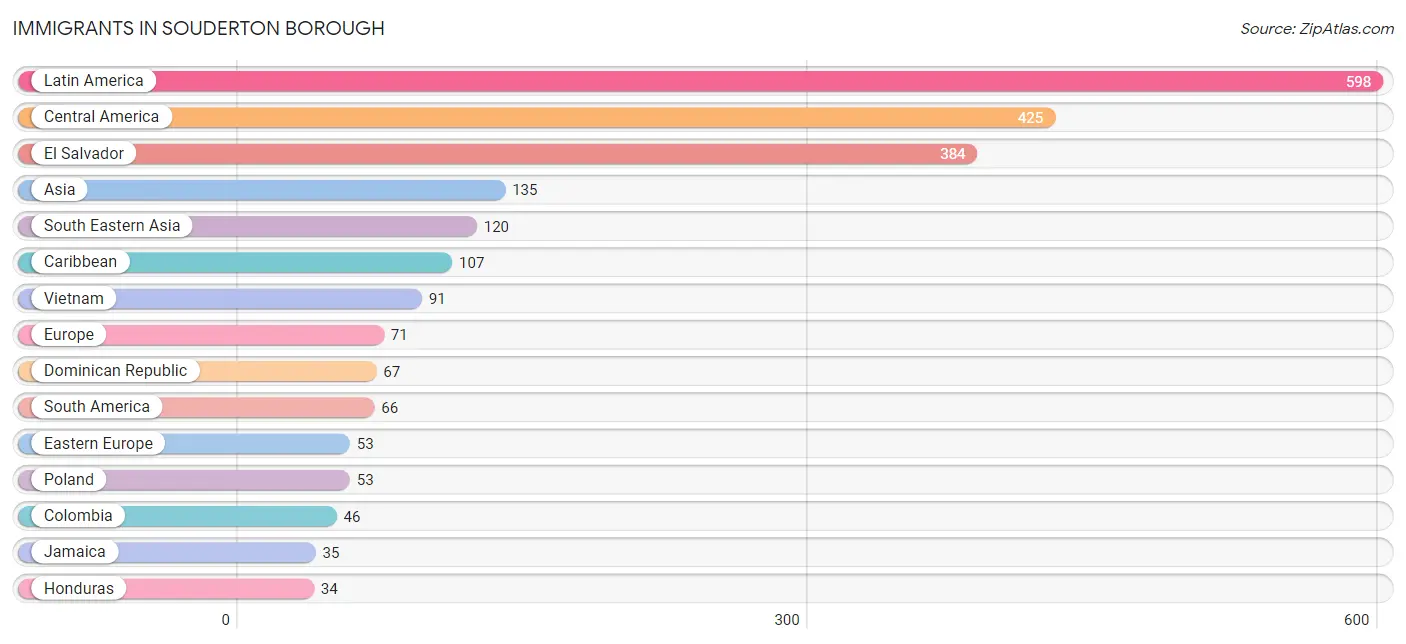
Immigrants in Souderton borough
The most numerous immigrant groups reported in Souderton borough came from Latin America (598 | 8.3%), Central America (425 | 5.9%), El Salvador (384 | 5.4%), Asia (135 | 1.9%), and South Eastern Asia (120 | 1.7%), together accounting for 23.2% of all Souderton borough residents.
| Immigration Origin | # Population | % Population |
| Africa | 18 | 0.3% |
| Asia | 135 | 1.9% |
| Brazil | 13 | 0.2% |
| Cambodia | 29 | 0.4% |
| Caribbean | 107 | 1.5% |
| Central America | 425 | 5.9% |
| Colombia | 46 | 0.6% |
| Costa Rica | 7 | 0.1% |
| Cuba | 5 | 0.1% |
| Dominican Republic | 67 | 0.9% |
| Eastern Africa | 5 | 0.1% |
| Eastern Europe | 53 | 0.7% |
| Ecuador | 7 | 0.1% |
| El Salvador | 384 | 5.4% |
| England | 4 | 0.1% |
| Europe | 71 | 1.0% |
| Germany | 14 | 0.2% |
| Honduras | 34 | 0.5% |
| India | 15 | 0.2% |
| Jamaica | 35 | 0.5% |
| Latin America | 598 | 8.3% |
| Middle Africa | 13 | 0.2% |
| Northern Europe | 4 | 0.1% |
| Poland | 53 | 0.7% |
| South America | 66 | 0.9% |
| South Central Asia | 15 | 0.2% |
| South Eastern Asia | 120 | 1.7% |
| Vietnam | 91 | 1.3% |
| Western Europe | 14 | 0.2% |
| Zaire | 13 | 0.2% |
| Zimbabwe | 5 | 0.1% | View All 31 Rows |
Sex and Age in Souderton borough
Sex and Age in Souderton borough
The most populous age groups in Souderton borough are 25 to 29 Years (309 | 9.2%) for men and 30 to 34 Years (341 | 8.9%) for women.
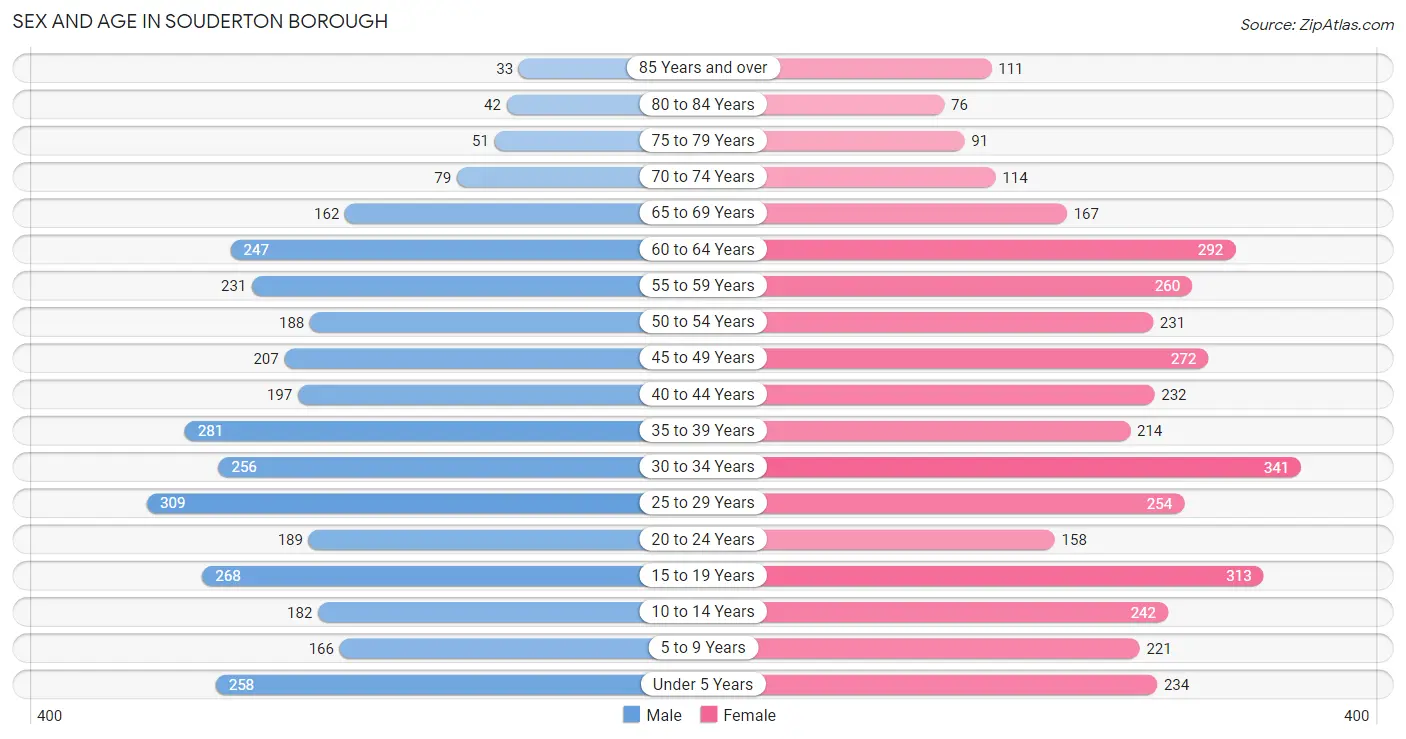
| Age Bracket | Male | Female |
| Under 5 Years | 258 (7.7%) | 234 (6.1%) |
| 5 to 9 Years | 166 (5.0%) | 221 (5.8%) |
| 10 to 14 Years | 182 (5.4%) | 242 (6.3%) |
| 15 to 19 Years | 268 (8.0%) | 313 (8.2%) |
| 20 to 24 Years | 189 (5.7%) | 158 (4.1%) |
| 25 to 29 Years | 309 (9.2%) | 254 (6.6%) |
| 30 to 34 Years | 256 (7.6%) | 341 (8.9%) |
| 35 to 39 Years | 281 (8.4%) | 214 (5.6%) |
| 40 to 44 Years | 197 (5.9%) | 232 (6.1%) |
| 45 to 49 Years | 207 (6.2%) | 272 (7.1%) |
| 50 to 54 Years | 188 (5.6%) | 231 (6.0%) |
| 55 to 59 Years | 231 (6.9%) | 260 (6.8%) |
| 60 to 64 Years | 247 (7.4%) | 292 (7.6%) |
| 65 to 69 Years | 162 (4.8%) | 167 (4.4%) |
| 70 to 74 Years | 79 (2.4%) | 114 (3.0%) |
| 75 to 79 Years | 51 (1.5%) | 91 (2.4%) |
| 80 to 84 Years | 42 (1.3%) | 76 (2.0%) |
| 85 Years and over | 33 (1.0%) | 111 (2.9%) |
| Total | 3,346 (100.0%) | 3,823 (100.0%) |
Families and Households in Souderton borough
Median Family Size in Souderton borough
The median family size in Souderton borough is 3.11 persons per family, with married-couple families (1,403 | 74.1%) accounting for the largest median family size of 3.16 persons per family. On the other hand, single male/father families (95 | 5.0%) represent the smallest median family size with 2.80 persons per family.
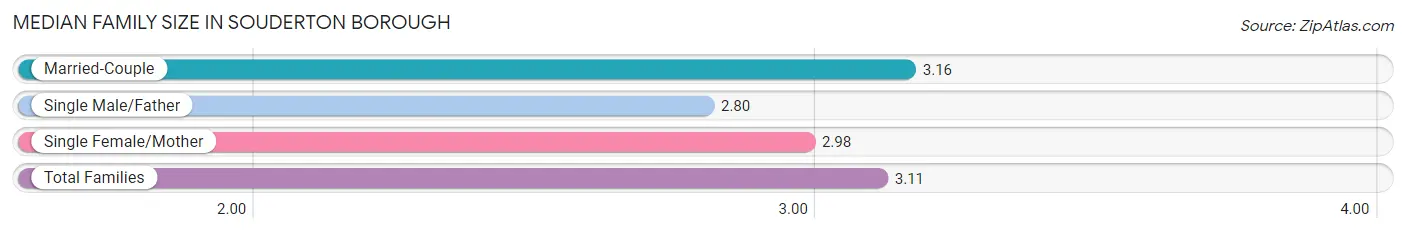
| Family Type | # Families | Family Size |
| Married-Couple | 1,403 (74.1%) | 3.16 |
| Single Male/Father | 95 (5.0%) | 2.80 |
| Single Female/Mother | 395 (20.9%) | 2.98 |
| Total Families | 1,893 (100.0%) | 3.11 |
Median Household Size in Souderton borough
The median household size in Souderton borough is 2.59 persons per household, with single male/father households (95 | 3.5%) accounting for the largest median household size of 3.31 persons per household. non-family households (861 | 31.3%) represent the smallest median household size with 1.23 persons per household.
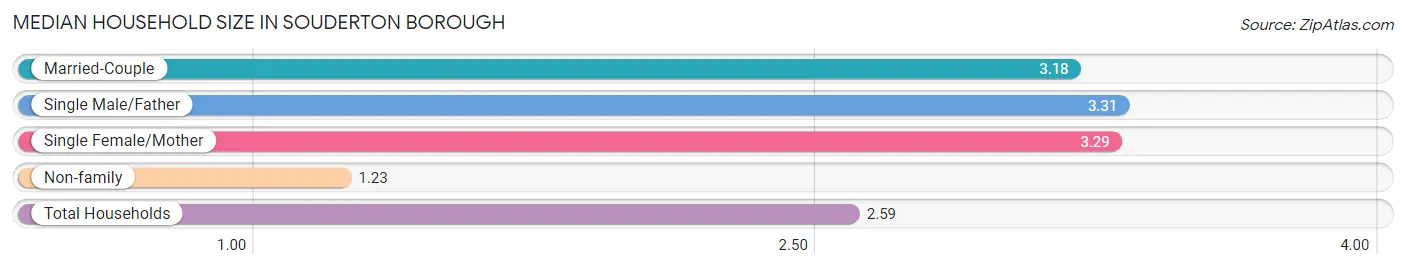
| Household Type | # Households | Household Size |
| Married-Couple | 1,403 (50.9%) | 3.18 |
| Single Male/Father | 95 (3.5%) | 3.31 |
| Single Female/Mother | 395 (14.3%) | 3.29 |
| Non-family | 861 (31.3%) | 1.23 |
| Total Households | 2,754 (100.0%) | 2.59 |
Household Size by Marriage Status in Souderton borough
Out of a total of 2,754 households in Souderton borough, 1,893 (68.7%) are family households, while 861 (31.3%) are nonfamily households. The most numerous type of family households are 2-person households, comprising 784, and the most common type of nonfamily households are 1-person households, comprising 697.
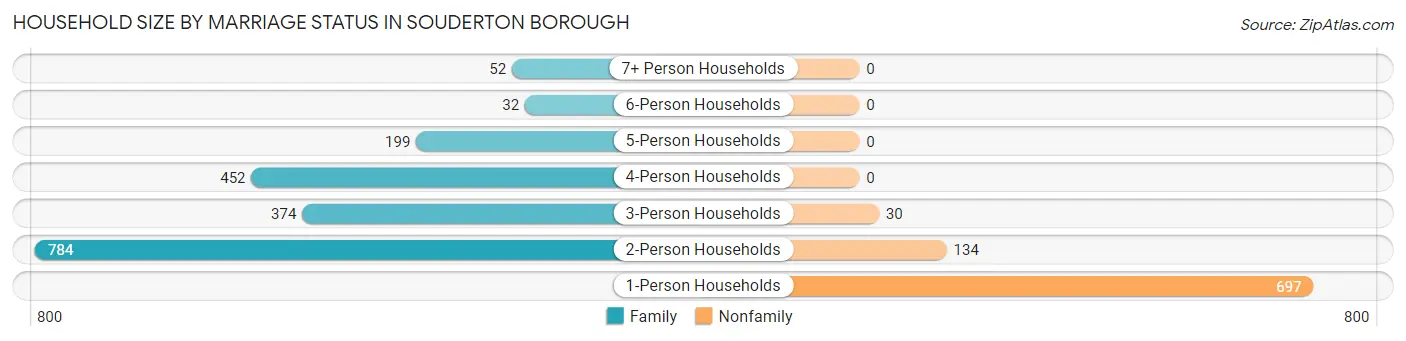
| Household Size | Family Households | Nonfamily Households |
| 1-Person Households | - | 697 (25.3%) |
| 2-Person Households | 784 (28.5%) | 134 (4.9%) |
| 3-Person Households | 374 (13.6%) | 30 (1.1%) |
| 4-Person Households | 452 (16.4%) | 0 (0.0%) |
| 5-Person Households | 199 (7.2%) | 0 (0.0%) |
| 6-Person Households | 32 (1.2%) | 0 (0.0%) |
| 7+ Person Households | 52 (1.9%) | 0 (0.0%) |
| Total | 1,893 (68.7%) | 861 (31.3%) |
Female Fertility in Souderton borough
Fertility by Age in Souderton borough
Average fertility rate in Souderton borough is 54.0 births per 1,000 women. Women in the age bracket of 20 to 34 years have the highest fertility rate with 126.0 births per 1,000 women. Women in the age bracket of 20 to 34 years acount for 96.0% of all women with births.
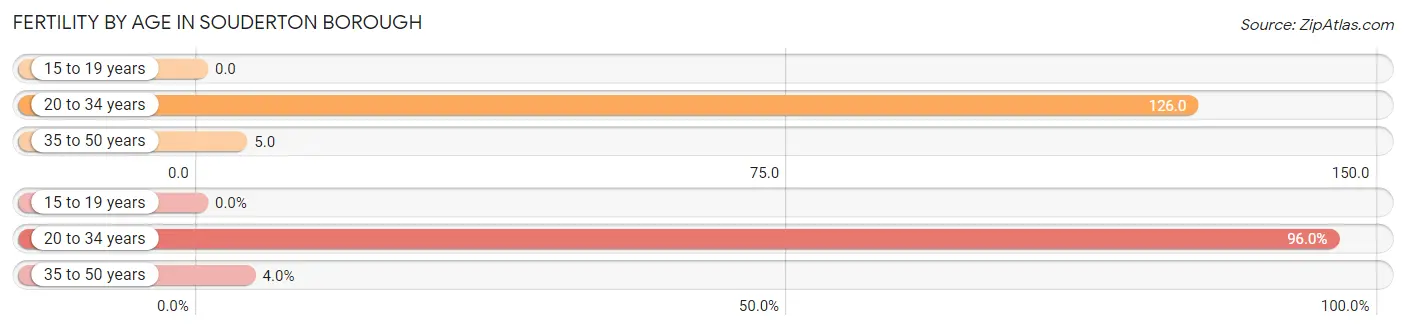
| Age Bracket | Women with Births | Births / 1,000 Women |
| 15 to 19 years | 0 (0.0%) | 0.0 |
| 20 to 34 years | 95 (96.0%) | 126.0 |
| 35 to 50 years | 4 (4.0%) | 5.0 |
| Total | 99 (100.0%) | 54.0 |
Fertility by Age by Marriage Status in Souderton borough
61.6% of women with births (99) in Souderton borough are married. The highest percentage of unmarried women with births falls into 20 to 34 years age bracket with 40.0% of them unmarried at the time of birth, while the lowest percentage of unmarried women with births belong to 35 to 50 years age bracket with 0.0% of them unmarried.
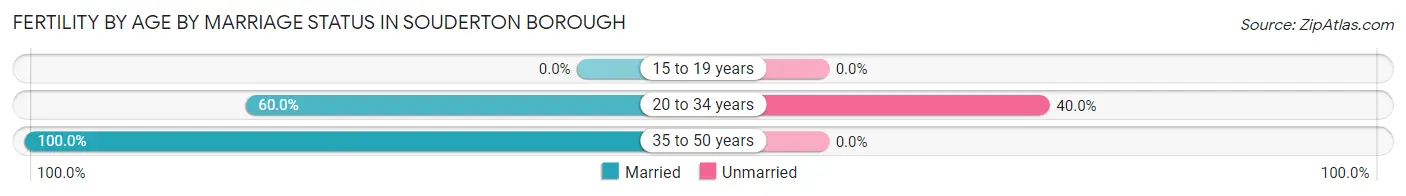
| Age Bracket | Married | Unmarried |
| 15 to 19 years | 0 (0.0%) | 0 (0.0%) |
| 20 to 34 years | 57 (60.0%) | 38 (40.0%) |
| 35 to 50 years | 4 (100.0%) | 0 (0.0%) |
| Total | 61 (61.6%) | 38 (38.4%) |
Fertility by Education in Souderton borough
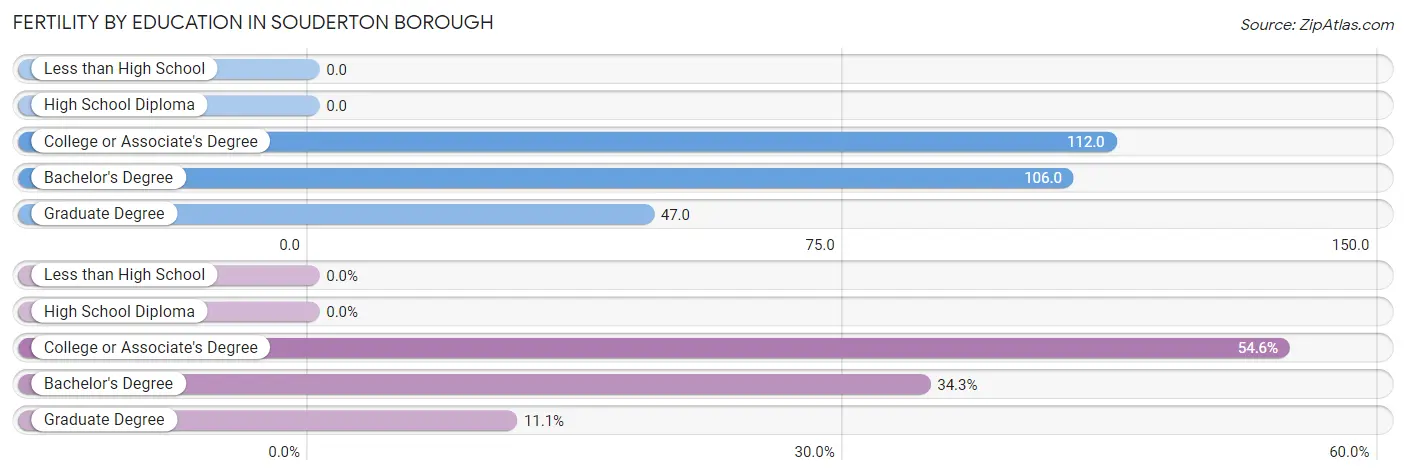
| Educational Attainment | Women with Births | Births / 1,000 Women |
| Less than High School | 0 (0.0%) | 0.0 |
| High School Diploma | 0 (0.0%) | 0.0 |
| College or Associate's Degree | 54 (54.5%) | 112.0 |
| Bachelor's Degree | 34 (34.3%) | 106.0 |
| Graduate Degree | 11 (11.1%) | 47.0 |
| Total | 99 (100.0%) | 54.0 |
Fertility by Education by Marriage Status in Souderton borough
38.4% of women with births in Souderton borough are unmarried. Women with the educational attainment of bachelor's degree are most likely to be married with 100.0% of them married at childbirth, while women with the educational attainment of college or associate's degree are least likely to be married with 70.4% of them unmarried at childbirth.
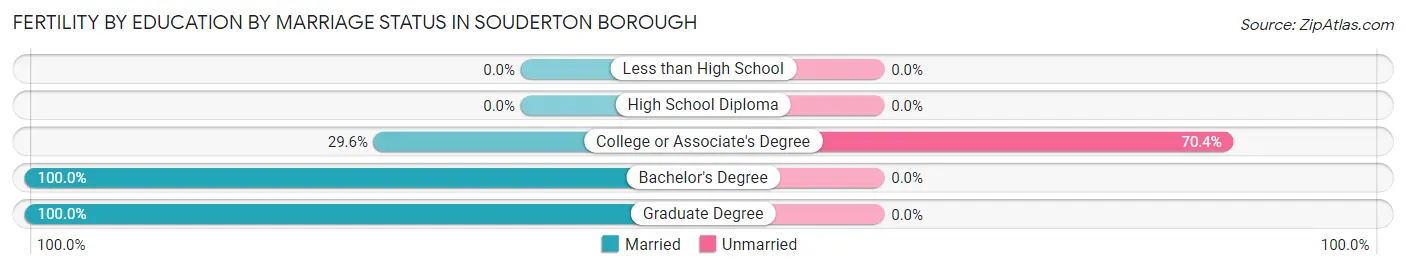
| Educational Attainment | Married | Unmarried |
| Less than High School | 0 (0.0%) | 0 (0.0%) |
| High School Diploma | 0 (0.0%) | 0 (0.0%) |
| College or Associate's Degree | 16 (29.6%) | 38 (70.4%) |
| Bachelor's Degree | 34 (100.0%) | 0 (0.0%) |
| Graduate Degree | 11 (100.0%) | 0 (0.0%) |
| Total | 61 (61.6%) | 38 (38.4%) |
Employment Characteristics in Souderton borough
Employment by Class of Employer in Souderton borough
Among the 3,940 employed individuals in Souderton borough, private company employees (3,133 | 79.5%), not-for-profit organizations (399 | 10.1%), and local government employees (285 | 7.2%) make up the most common classes of employment.
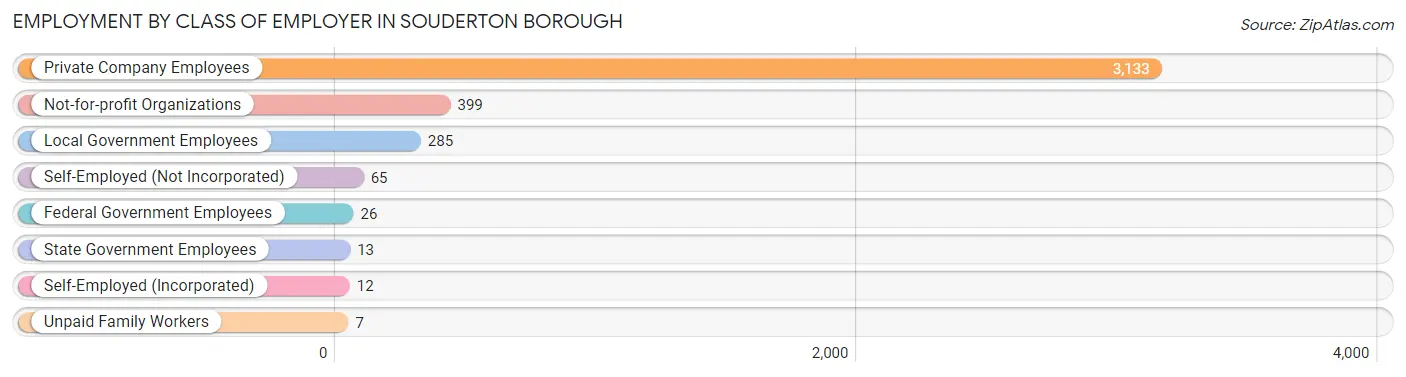
| Employer Class | # Employees | % Employees |
| Private Company Employees | 3,133 | 79.5% |
| Self-Employed (Incorporated) | 12 | 0.3% |
| Self-Employed (Not Incorporated) | 65 | 1.7% |
| Not-for-profit Organizations | 399 | 10.1% |
| Local Government Employees | 285 | 7.2% |
| State Government Employees | 13 | 0.3% |
| Federal Government Employees | 26 | 0.7% |
| Unpaid Family Workers | 7 | 0.2% |
| Total | 3,940 | 100.0% |
Employment Status by Age in Souderton borough
According to the labor force statistics for Souderton borough, out of the total population over 16 years of age (5,670), 74.6% or 4,230 individuals are in the labor force, with 4.4% or 186 of them unemployed. The age group with the highest labor force participation rate is 25 to 29 years, with 94.5% or 532 individuals in the labor force. Within the labor force, the 75 years and over age range has the highest percentage of unemployed individuals, with 25.8% or 8 of them being unemployed.
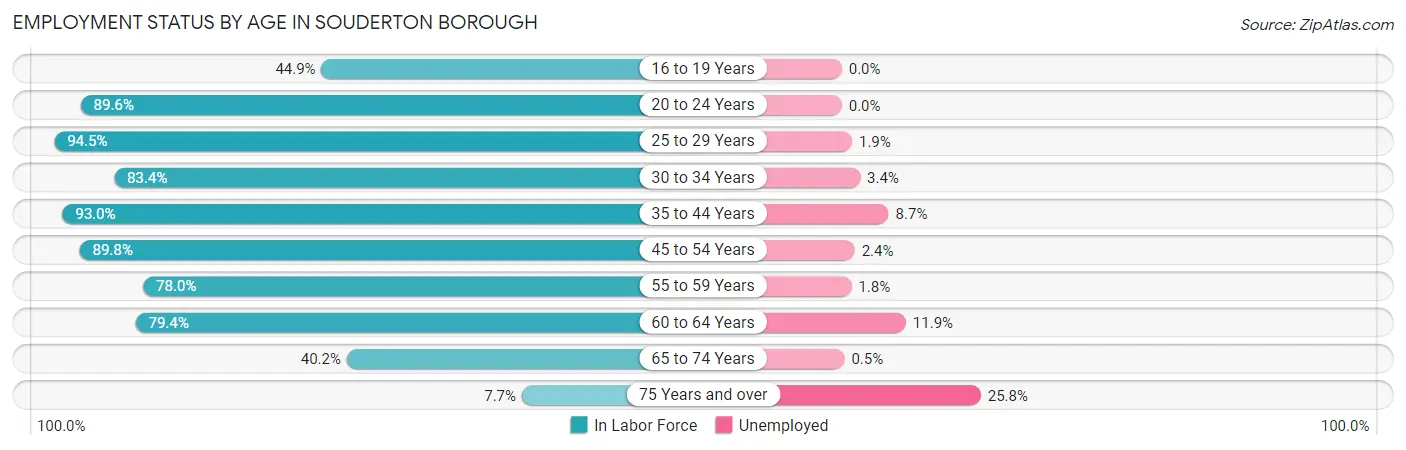
| Age Bracket | In Labor Force | Unemployed |
| 16 to 19 Years | 173 (44.9%) | 0 (0.0%) |
| 20 to 24 Years | 311 (89.6%) | 0 (0.0%) |
| 25 to 29 Years | 532 (94.5%) | 10 (1.9%) |
| 30 to 34 Years | 498 (83.4%) | 17 (3.4%) |
| 35 to 44 Years | 859 (93.0%) | 75 (8.7%) |
| 45 to 54 Years | 806 (89.8%) | 19 (2.4%) |
| 55 to 59 Years | 383 (78.0%) | 7 (1.8%) |
| 60 to 64 Years | 428 (79.4%) | 51 (11.9%) |
| 65 to 74 Years | 210 (40.2%) | 1 (0.5%) |
| 75 Years and over | 31 (7.7%) | 8 (25.8%) |
| Total | 4,230 (74.6%) | 186 (4.4%) |
Employment Status by Educational Attainment in Souderton borough
According to labor force statistics for Souderton borough, 87.4% of individuals (3,506) out of the total population between 25 and 64 years of age (4,012) are in the labor force, with 5.1% or 179 of them being unemployed. The group with the highest labor force participation rate are those with the educational attainment of bachelor's degree or higher, with 92.0% or 1,179 individuals in the labor force. Within the labor force, individuals with college / associate degree education have the highest percentage of unemployment, with 10.9% or 115 of them being unemployed.
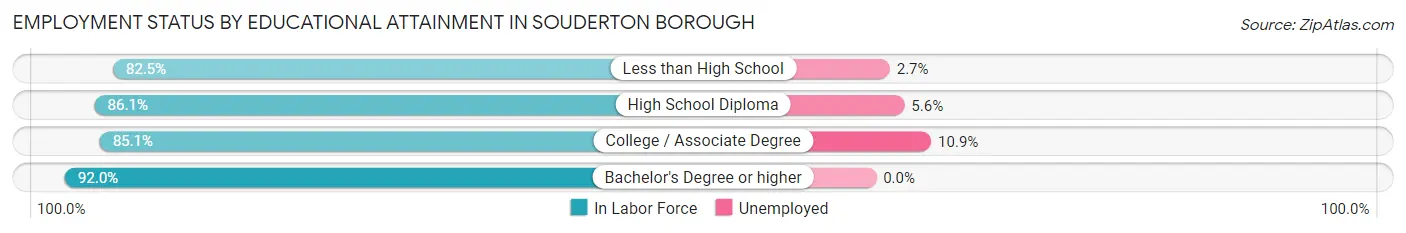
| Educational Attainment | In Labor Force | Unemployed |
| Less than High School | 292 (82.5%) | 10 (2.7%) |
| High School Diploma | 975 (86.1%) | 63 (5.6%) |
| College / Associate Degree | 1,059 (85.1%) | 136 (10.9%) |
| Bachelor's Degree or higher | 1,179 (92.0%) | 0 (0.0%) |
| Total | 3,506 (87.4%) | 205 (5.1%) |
Employment Occupations by Sex in Souderton borough
Management, Business, Science and Arts Occupations
The most common Management, Business, Science and Arts occupations in Souderton borough are Management (488 | 12.1%), Community & Social Service (331 | 8.2%), Health Diagnosing & Treating (325 | 8.0%), Computers, Engineering & Science (300 | 7.4%), and Business & Financial (207 | 5.1%).
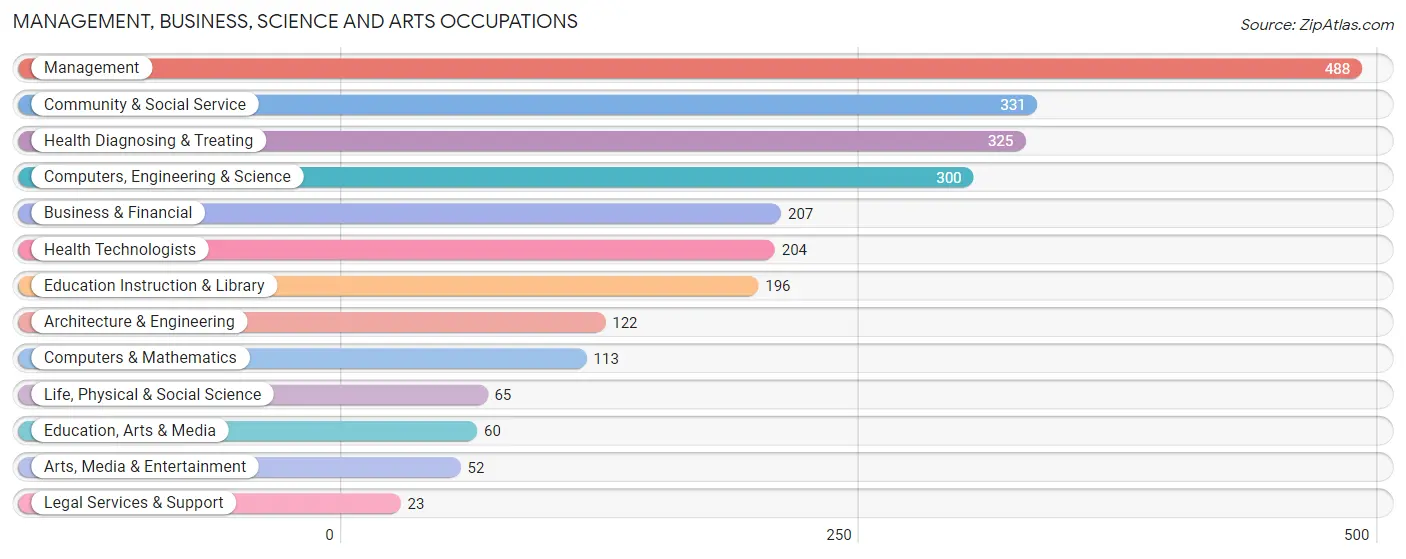
Management, Business, Science and Arts Occupations by Sex
Within the Management, Business, Science and Arts occupations in Souderton borough, the most male-oriented occupations are Architecture & Engineering (87.7%), Computers & Mathematics (87.6%), and Computers, Engineering & Science (74.7%), while the most female-oriented occupations are Arts, Media & Entertainment (100.0%), Health Technologists (100.0%), and Health Diagnosing & Treating (98.5%).
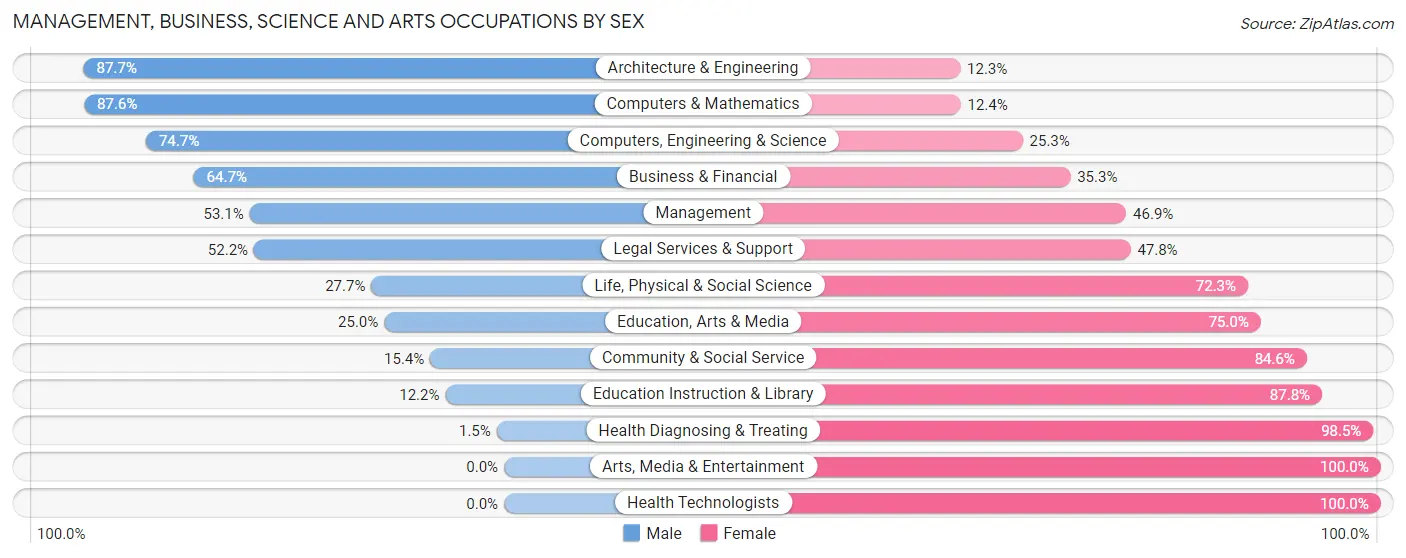
| Occupation | Male | Female |
| Management | 259 (53.1%) | 229 (46.9%) |
| Business & Financial | 134 (64.7%) | 73 (35.3%) |
| Computers, Engineering & Science | 224 (74.7%) | 76 (25.3%) |
| Computers & Mathematics | 99 (87.6%) | 14 (12.4%) |
| Architecture & Engineering | 107 (87.7%) | 15 (12.3%) |
| Life, Physical & Social Science | 18 (27.7%) | 47 (72.3%) |
| Community & Social Service | 51 (15.4%) | 280 (84.6%) |
| Education, Arts & Media | 15 (25.0%) | 45 (75.0%) |
| Legal Services & Support | 12 (52.2%) | 11 (47.8%) |
| Education Instruction & Library | 24 (12.2%) | 172 (87.8%) |
| Arts, Media & Entertainment | 0 (0.0%) | 52 (100.0%) |
| Health Diagnosing & Treating | 5 (1.5%) | 320 (98.5%) |
| Health Technologists | 0 (0.0%) | 204 (100.0%) |
| Total (Category) | 673 (40.8%) | 978 (59.2%) |
| Total (Overall) | 2,000 (49.5%) | 2,043 (50.5%) |
Services Occupations
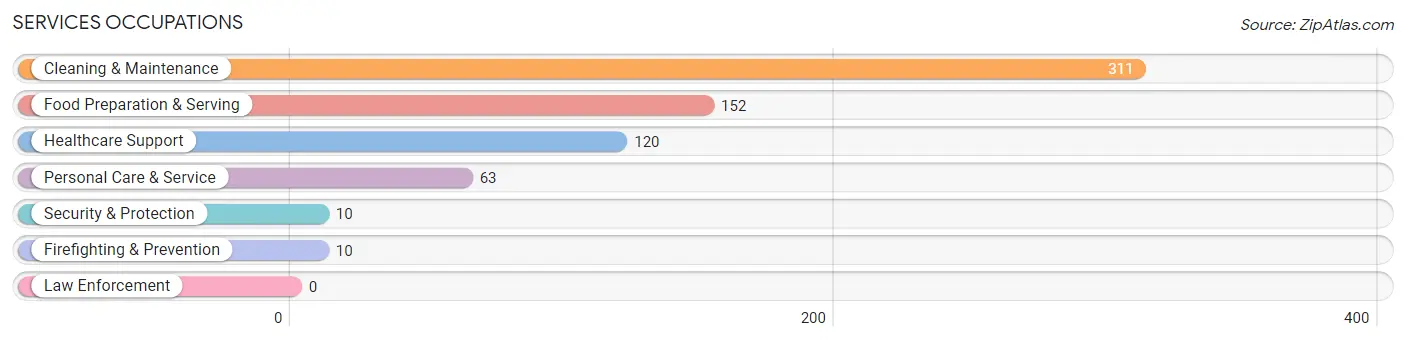
The most common Services occupations in Souderton borough are Cleaning & Maintenance (311 | 7.7%), Food Preparation & Serving (152 | 3.8%), Healthcare Support (120 | 3.0%), Personal Care & Service (63 | 1.6%), and Security & Protection (10 | 0.3%).
Services Occupations by Sex
Within the Services occupations in Souderton borough, the most male-oriented occupations are Security & Protection (60.0%), Firefighting & Prevention (60.0%), and Cleaning & Maintenance (52.7%), while the most female-oriented occupations are Healthcare Support (100.0%), Personal Care & Service (73.0%), and Food Preparation & Serving (50.0%).
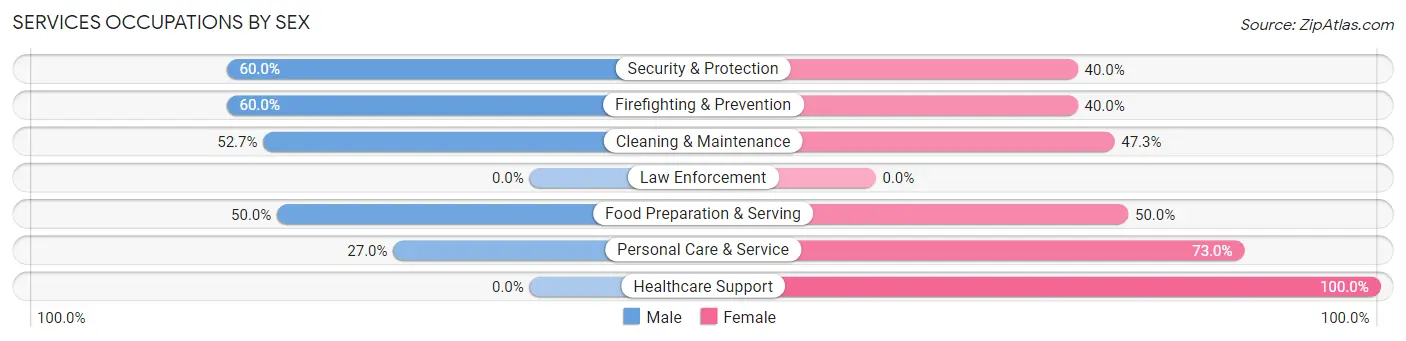
| Occupation | Male | Female |
| Healthcare Support | 0 (0.0%) | 120 (100.0%) |
| Security & Protection | 6 (60.0%) | 4 (40.0%) |
| Firefighting & Prevention | 6 (60.0%) | 4 (40.0%) |
| Law Enforcement | 0 (0.0%) | 0 (0.0%) |
| Food Preparation & Serving | 76 (50.0%) | 76 (50.0%) |
| Cleaning & Maintenance | 164 (52.7%) | 147 (47.3%) |
| Personal Care & Service | 17 (27.0%) | 46 (73.0%) |
| Total (Category) | 263 (40.1%) | 393 (59.9%) |
| Total (Overall) | 2,000 (49.5%) | 2,043 (50.5%) |
Sales and Office Occupations
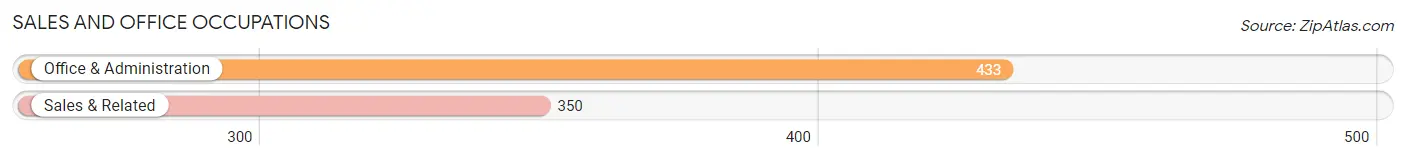
The most common Sales and Office occupations in Souderton borough are Office & Administration (433 | 10.7%), and Sales & Related (350 | 8.7%).
Sales and Office Occupations by Sex
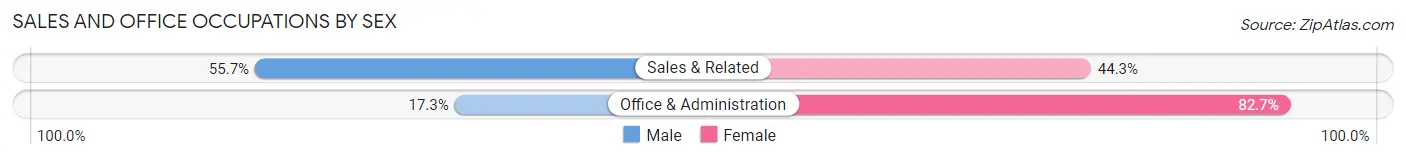
| Occupation | Male | Female |
| Sales & Related | 195 (55.7%) | 155 (44.3%) |
| Office & Administration | 75 (17.3%) | 358 (82.7%) |
| Total (Category) | 270 (34.5%) | 513 (65.5%) |
| Total (Overall) | 2,000 (49.5%) | 2,043 (50.5%) |
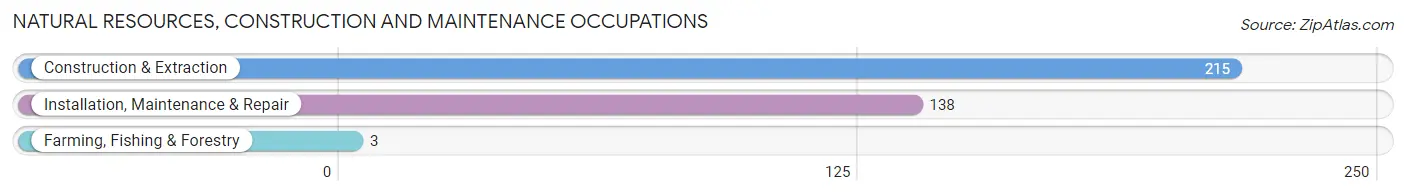
Natural Resources, Construction and Maintenance Occupations
The most common Natural Resources, Construction and Maintenance occupations in Souderton borough are Construction & Extraction (215 | 5.3%), Installation, Maintenance & Repair (138 | 3.4%), and Farming, Fishing & Forestry (3 | 0.1%).
Natural Resources, Construction and Maintenance Occupations by Sex
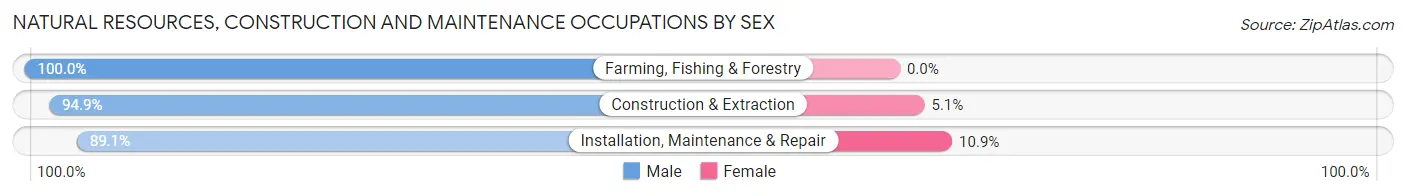
| Occupation | Male | Female |
| Farming, Fishing & Forestry | 3 (100.0%) | 0 (0.0%) |
| Construction & Extraction | 204 (94.9%) | 11 (5.1%) |
| Installation, Maintenance & Repair | 123 (89.1%) | 15 (10.9%) |
| Total (Category) | 330 (92.7%) | 26 (7.3%) |
| Total (Overall) | 2,000 (49.5%) | 2,043 (50.5%) |
Production, Transportation and Moving Occupations
The most common Production, Transportation and Moving occupations in Souderton borough are Production (293 | 7.2%), Material Moving (159 | 3.9%), and Transportation (145 | 3.6%).
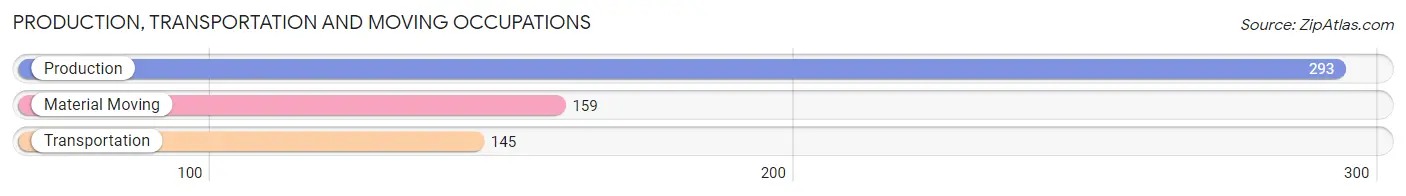
Production, Transportation and Moving Occupations by Sex
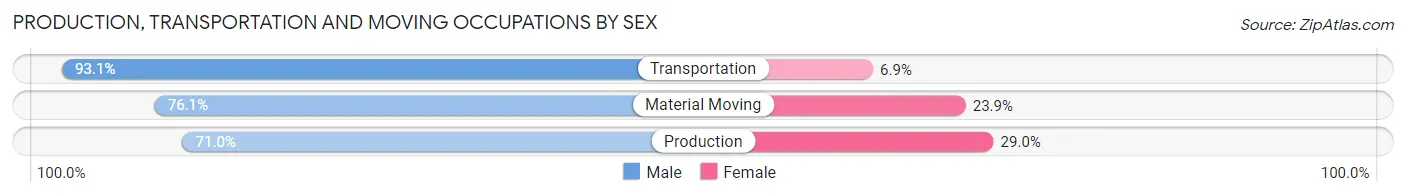
| Occupation | Male | Female |
| Production | 208 (71.0%) | 85 (29.0%) |
| Transportation | 135 (93.1%) | 10 (6.9%) |
| Material Moving | 121 (76.1%) | 38 (23.9%) |
| Total (Category) | 464 (77.7%) | 133 (22.3%) |
| Total (Overall) | 2,000 (49.5%) | 2,043 (50.5%) |
Employment Industries by Sex in Souderton borough
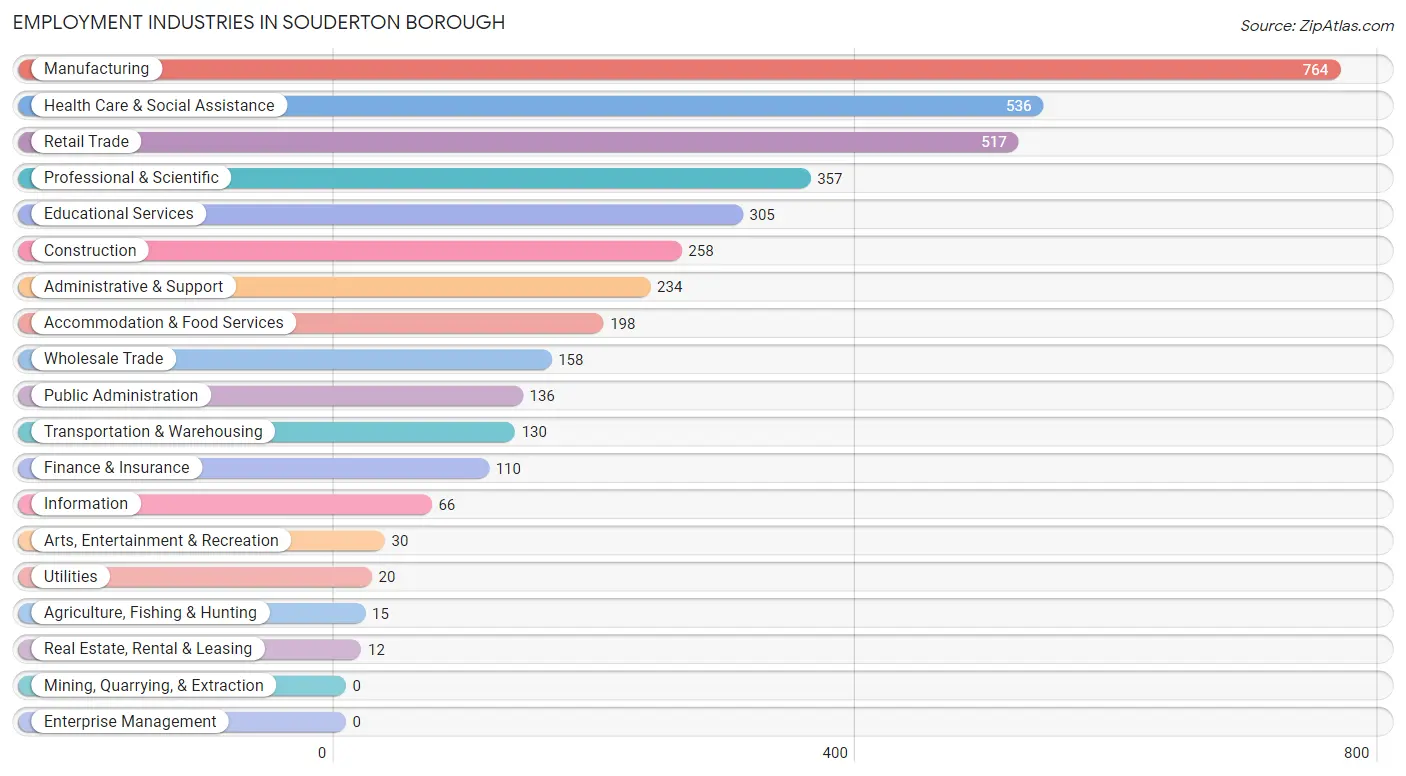
Employment Industries in Souderton borough
The major employment industries in Souderton borough include Manufacturing (764 | 18.9%), Health Care & Social Assistance (536 | 13.3%), Retail Trade (517 | 12.8%), Professional & Scientific (357 | 8.8%), and Educational Services (305 | 7.5%).
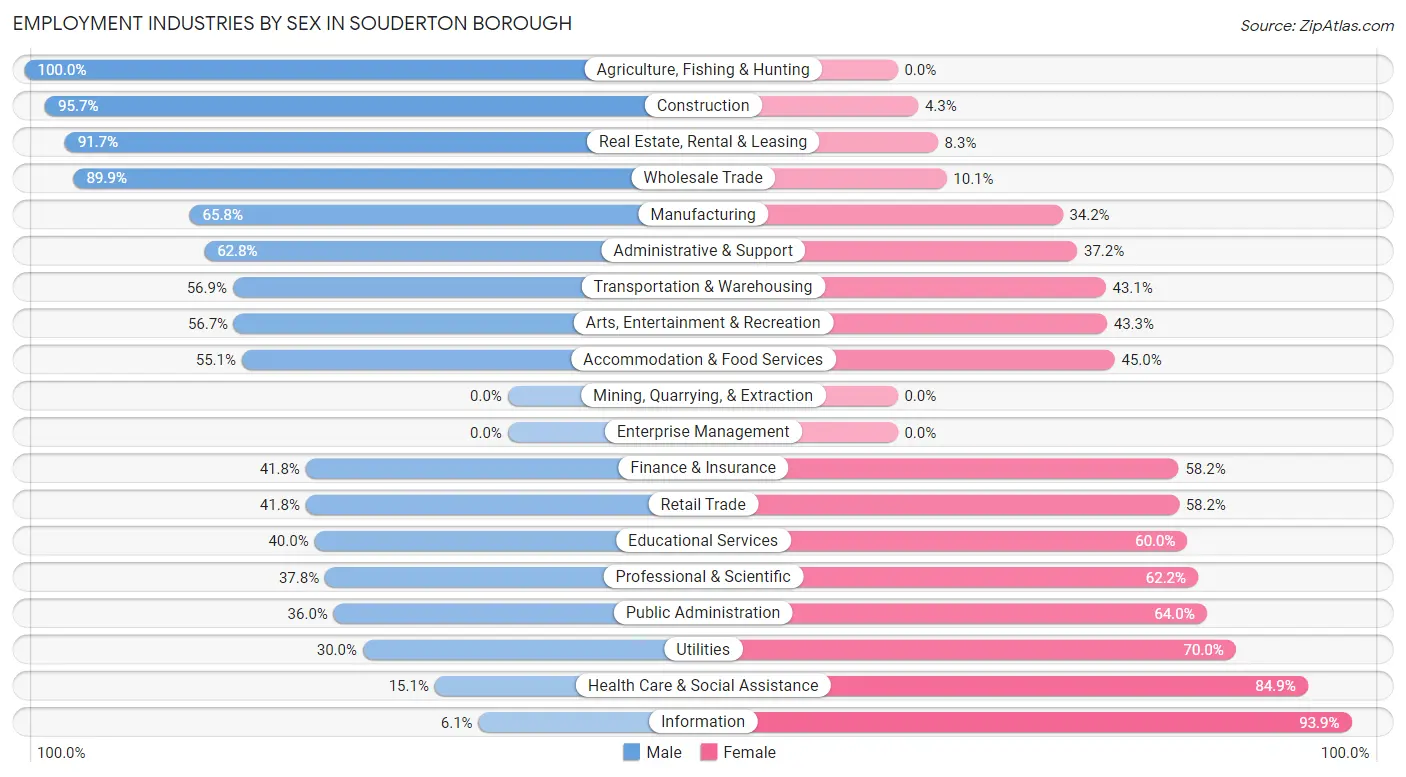
Employment Industries by Sex in Souderton borough
The Souderton borough industries that see more men than women are Agriculture, Fishing & Hunting (100.0%), Construction (95.7%), and Real Estate, Rental & Leasing (91.7%), whereas the industries that tend to have a higher number of women are Information (93.9%), Health Care & Social Assistance (84.9%), and Utilities (70.0%).
| Industry | Male | Female |
| Agriculture, Fishing & Hunting | 15 (100.0%) | 0 (0.0%) |
| Mining, Quarrying, & Extraction | 0 (0.0%) | 0 (0.0%) |
| Construction | 247 (95.7%) | 11 (4.3%) |
| Manufacturing | 503 (65.8%) | 261 (34.2%) |
| Wholesale Trade | 142 (89.9%) | 16 (10.1%) |
| Retail Trade | 216 (41.8%) | 301 (58.2%) |
| Transportation & Warehousing | 74 (56.9%) | 56 (43.1%) |
| Utilities | 6 (30.0%) | 14 (70.0%) |
| Information | 4 (6.1%) | 62 (93.9%) |
| Finance & Insurance | 46 (41.8%) | 64 (58.2%) |
| Real Estate, Rental & Leasing | 11 (91.7%) | 1 (8.3%) |
| Professional & Scientific | 135 (37.8%) | 222 (62.2%) |
| Enterprise Management | 0 (0.0%) | 0 (0.0%) |
| Administrative & Support | 147 (62.8%) | 87 (37.2%) |
| Educational Services | 122 (40.0%) | 183 (60.0%) |
| Health Care & Social Assistance | 81 (15.1%) | 455 (84.9%) |
| Arts, Entertainment & Recreation | 17 (56.7%) | 13 (43.3%) |
| Accommodation & Food Services | 109 (55.0%) | 89 (45.0%) |
| Public Administration | 49 (36.0%) | 87 (64.0%) |
| Total | 2,000 (49.5%) | 2,043 (50.5%) |
Education in Souderton borough
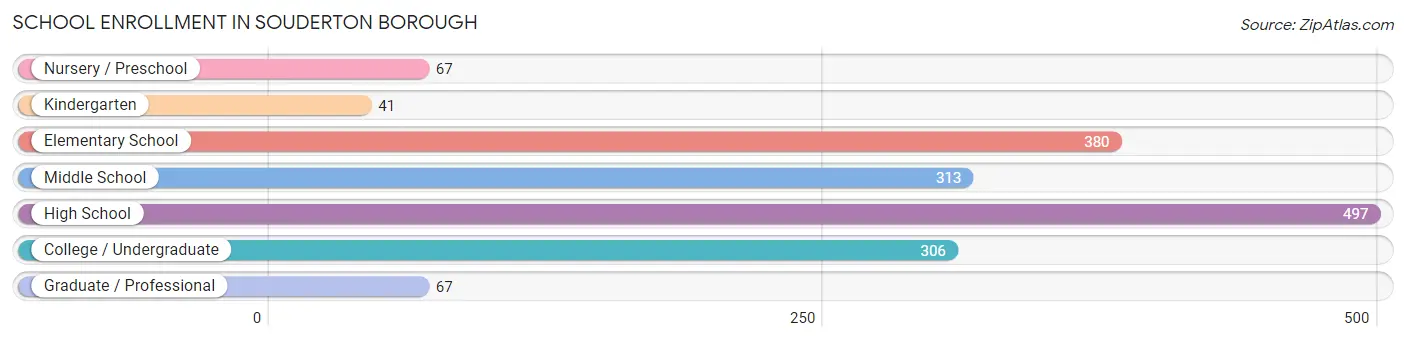
School Enrollment in Souderton borough
The most common levels of schooling among the 1,671 students in Souderton borough are high school (497 | 29.7%), elementary school (380 | 22.7%), and middle school (313 | 18.7%).
| School Level | # Students | % Students |
| Nursery / Preschool | 67 | 4.0% |
| Kindergarten | 41 | 2.5% |
| Elementary School | 380 | 22.7% |
| Middle School | 313 | 18.7% |
| High School | 497 | 29.7% |
| College / Undergraduate | 306 | 18.3% |
| Graduate / Professional | 67 | 4.0% |
| Total | 1,671 | 100.0% |
School Enrollment by Age by Funding Source in Souderton borough
Out of a total of 1,671 students who are enrolled in schools in Souderton borough, 316 (18.9%) attend a private institution, while the remaining 1,355 (81.1%) are enrolled in public schools. The age group of 3 to 4 year olds has the highest likelihood of being enrolled in private schools, with 56 (93.3% in the age bracket) enrolled. Conversely, the age group of 10 to 14 year olds has the lowest likelihood of being enrolled in a private school, with 396 (95.2% in the age bracket) attending a public institution.
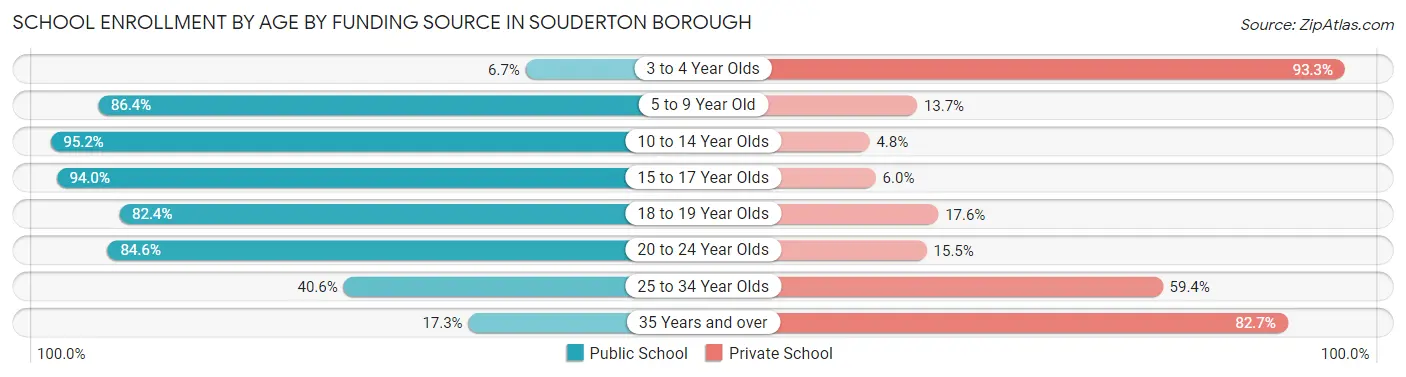
| Age Bracket | Public School | Private School |
| 3 to 4 Year Olds | 4 (6.7%) | 56 (93.3%) |
| 5 to 9 Year Old | 329 (86.4%) | 52 (13.7%) |
| 10 to 14 Year Olds | 396 (95.2%) | 20 (4.8%) |
| 15 to 17 Year Olds | 363 (94.0%) | 23 (6.0%) |
| 18 to 19 Year Olds | 117 (82.4%) | 25 (17.6%) |
| 20 to 24 Year Olds | 93 (84.6%) | 17 (15.4%) |
| 25 to 34 Year Olds | 41 (40.6%) | 60 (59.4%) |
| 35 Years and over | 13 (17.3%) | 62 (82.7%) |
| Total | 1,355 (81.1%) | 316 (18.9%) |
Educational Attainment by Field of Study in Souderton borough
Education (196 | 13.2%), communications (182 | 12.2%), business (159 | 10.7%), arts & humanities (126 | 8.5%), and science & technology (123 | 8.3%) are the most common fields of study among 1,491 individuals in Souderton borough who have obtained a bachelor's degree or higher.
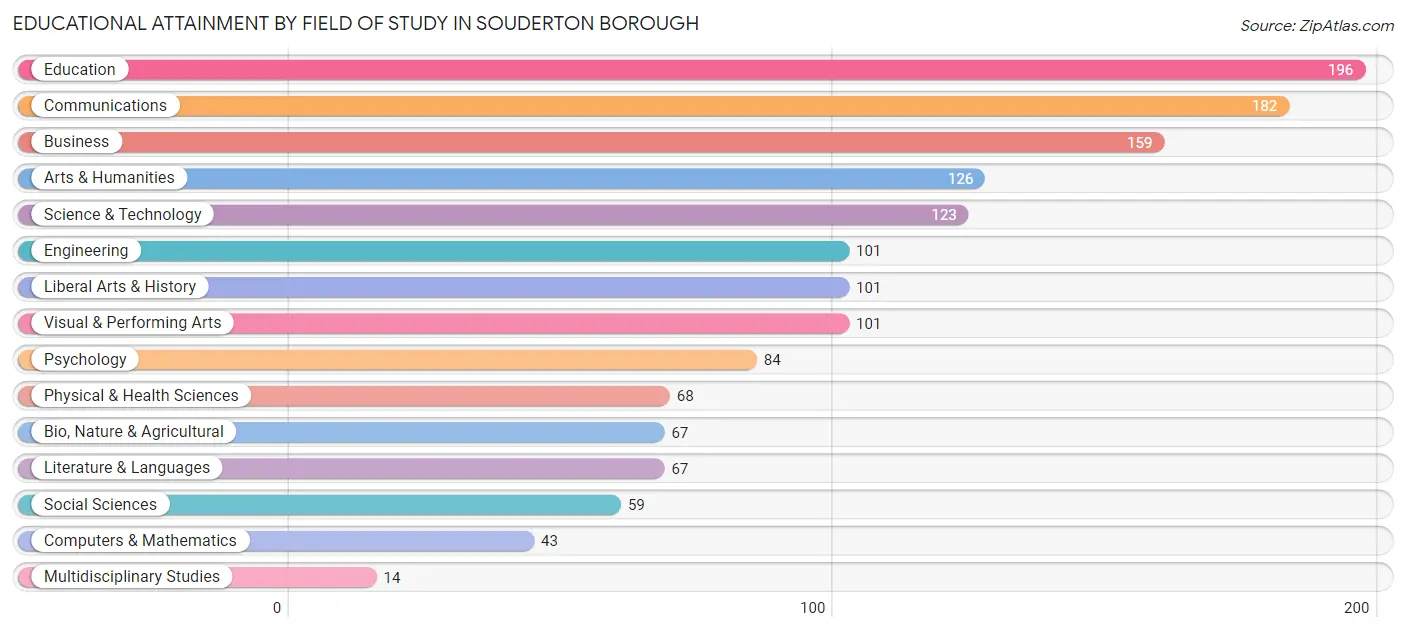
| Field of Study | # Graduates | % Graduates |
| Computers & Mathematics | 43 | 2.9% |
| Bio, Nature & Agricultural | 67 | 4.5% |
| Physical & Health Sciences | 68 | 4.6% |
| Psychology | 84 | 5.6% |
| Social Sciences | 59 | 4.0% |
| Engineering | 101 | 6.8% |
| Multidisciplinary Studies | 14 | 0.9% |
| Science & Technology | 123 | 8.3% |
| Business | 159 | 10.7% |
| Education | 196 | 13.2% |
| Literature & Languages | 67 | 4.5% |
| Liberal Arts & History | 101 | 6.8% |
| Visual & Performing Arts | 101 | 6.8% |
| Communications | 182 | 12.2% |
| Arts & Humanities | 126 | 8.5% |
| Total | 1,491 | 100.0% |
Transportation & Commute in Souderton borough
Vehicle Availability by Sex in Souderton borough
The most prevalent vehicle ownership categories in Souderton borough are males with 2 vehicles (929, accounting for 47.0%) and females with 2 vehicles (787, making up 47.6%).
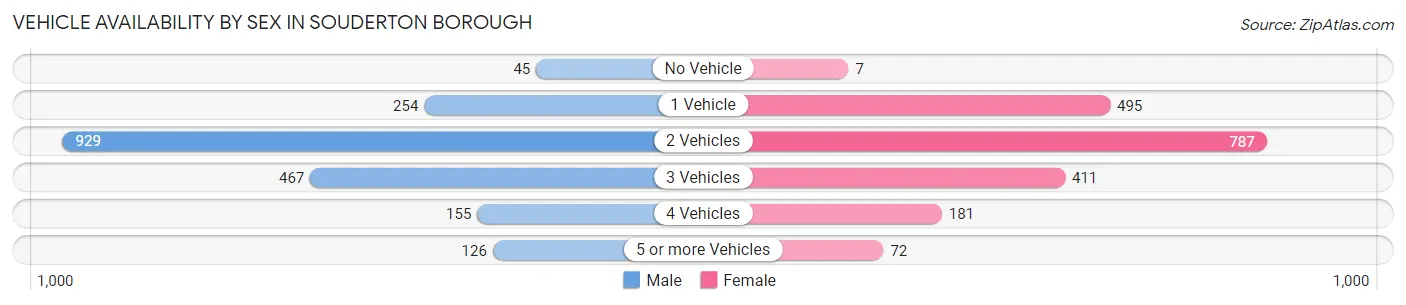
| Vehicles Available | Male | Female |
| No Vehicle | 45 (2.3%) | 7 (0.4%) |
| 1 Vehicle | 254 (12.9%) | 495 (25.4%) |
| 2 Vehicles | 929 (47.0%) | 787 (40.3%) |
| 3 Vehicles | 467 (23.6%) | 411 (21.0%) |
| 4 Vehicles | 155 (7.8%) | 181 (9.3%) |
| 5 or more Vehicles | 126 (6.4%) | 72 (3.7%) |
| Total | 1,976 (100.0%) | 1,953 (100.0%) |
Commute Time in Souderton borough
The most frequently occuring commute durations in Souderton borough are 15 to 19 minutes (659 commuters, 17.8%), 10 to 14 minutes (550 commuters, 14.8%), and 20 to 24 minutes (484 commuters, 13.1%).
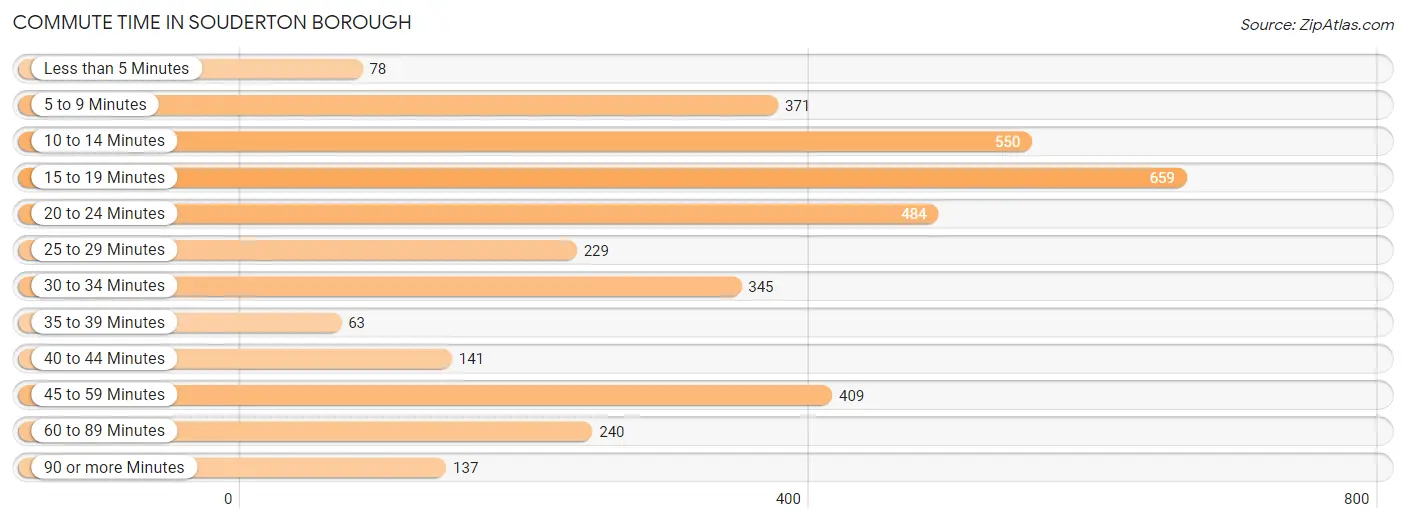
| Commute Time | # Commuters | % Commuters |
| Less than 5 Minutes | 78 | 2.1% |
| 5 to 9 Minutes | 371 | 10.0% |
| 10 to 14 Minutes | 550 | 14.8% |
| 15 to 19 Minutes | 659 | 17.8% |
| 20 to 24 Minutes | 484 | 13.1% |
| 25 to 29 Minutes | 229 | 6.2% |
| 30 to 34 Minutes | 345 | 9.3% |
| 35 to 39 Minutes | 63 | 1.7% |
| 40 to 44 Minutes | 141 | 3.8% |
| 45 to 59 Minutes | 409 | 11.0% |
| 60 to 89 Minutes | 240 | 6.5% |
| 90 or more Minutes | 137 | 3.7% |
Commute Time by Sex in Souderton borough
The most common commute times in Souderton borough are 15 to 19 minutes (317 commuters, 16.9%) for males and 15 to 19 minutes (342 commuters, 18.7%) for females.
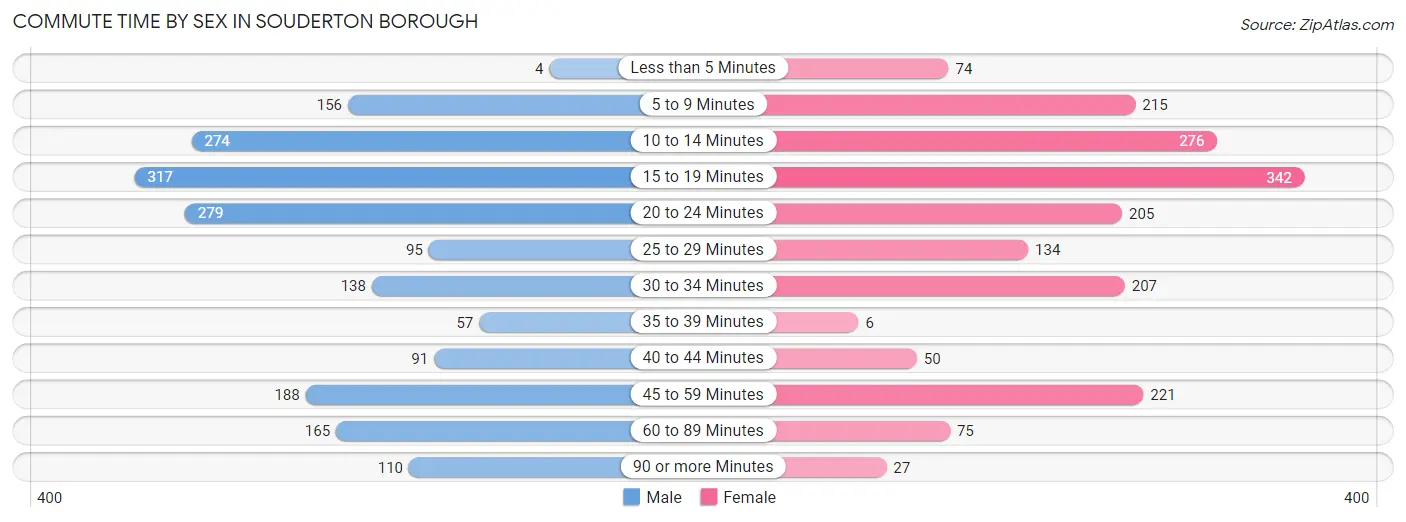
| Commute Time | Male | Female |
| Less than 5 Minutes | 4 (0.2%) | 74 (4.0%) |
| 5 to 9 Minutes | 156 (8.3%) | 215 (11.7%) |
| 10 to 14 Minutes | 274 (14.6%) | 276 (15.1%) |
| 15 to 19 Minutes | 317 (16.9%) | 342 (18.7%) |
| 20 to 24 Minutes | 279 (14.9%) | 205 (11.2%) |
| 25 to 29 Minutes | 95 (5.1%) | 134 (7.3%) |
| 30 to 34 Minutes | 138 (7.4%) | 207 (11.3%) |
| 35 to 39 Minutes | 57 (3.0%) | 6 (0.3%) |
| 40 to 44 Minutes | 91 (4.9%) | 50 (2.7%) |
| 45 to 59 Minutes | 188 (10.0%) | 221 (12.1%) |
| 60 to 89 Minutes | 165 (8.8%) | 75 (4.1%) |
| 90 or more Minutes | 110 (5.9%) | 27 (1.5%) |
Time of Departure to Work by Sex in Souderton borough
The most frequent times of departure to work in Souderton borough are 7:00 AM to 7:29 AM (278, 14.8%) for males and 8:00 AM to 8:29 AM (330, 18.0%) for females.
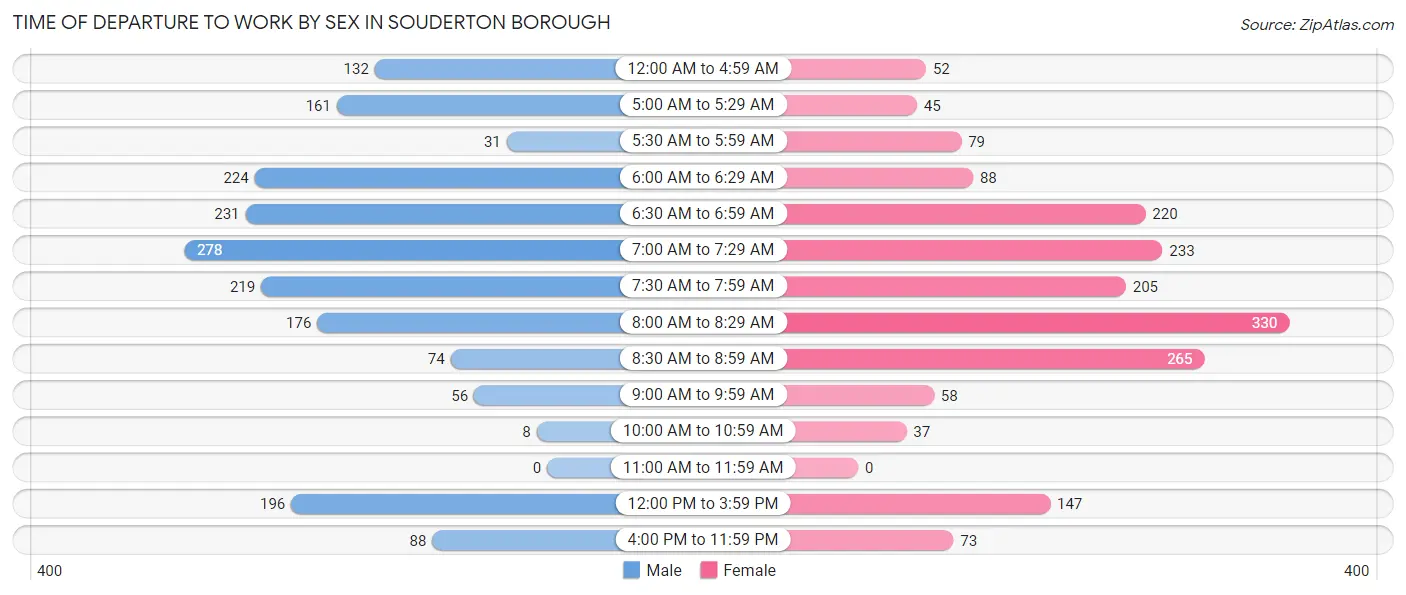
| Time of Departure | Male | Female |
| 12:00 AM to 4:59 AM | 132 (7.0%) | 52 (2.8%) |
| 5:00 AM to 5:29 AM | 161 (8.6%) | 45 (2.5%) |
| 5:30 AM to 5:59 AM | 31 (1.7%) | 79 (4.3%) |
| 6:00 AM to 6:29 AM | 224 (11.9%) | 88 (4.8%) |
| 6:30 AM to 6:59 AM | 231 (12.3%) | 220 (12.0%) |
| 7:00 AM to 7:29 AM | 278 (14.8%) | 233 (12.7%) |
| 7:30 AM to 7:59 AM | 219 (11.7%) | 205 (11.2%) |
| 8:00 AM to 8:29 AM | 176 (9.4%) | 330 (18.0%) |
| 8:30 AM to 8:59 AM | 74 (4.0%) | 265 (14.5%) |
| 9:00 AM to 9:59 AM | 56 (3.0%) | 58 (3.2%) |
| 10:00 AM to 10:59 AM | 8 (0.4%) | 37 (2.0%) |
| 11:00 AM to 11:59 AM | 0 (0.0%) | 0 (0.0%) |
| 12:00 PM to 3:59 PM | 196 (10.5%) | 147 (8.0%) |
| 4:00 PM to 11:59 PM | 88 (4.7%) | 73 (4.0%) |
| Total | 1,874 (100.0%) | 1,832 (100.0%) |
Housing Occupancy in Souderton borough
Occupancy by Ownership in Souderton borough
Of the total 2,754 dwellings in Souderton borough, owner-occupied units account for 1,593 (57.8%), while renter-occupied units make up 1,161 (42.2%).
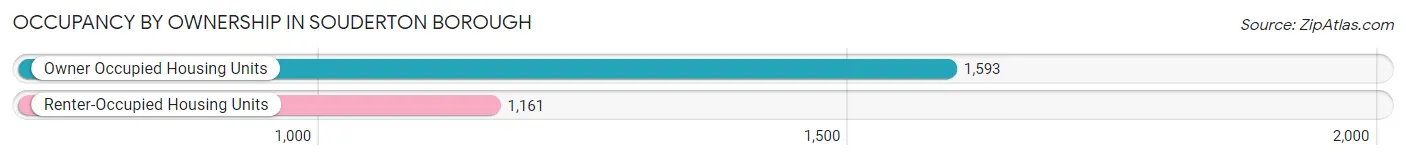
| Occupancy | # Housing Units | % Housing Units |
| Owner Occupied Housing Units | 1,593 | 57.8% |
| Renter-Occupied Housing Units | 1,161 | 42.2% |
| Total Occupied Housing Units | 2,754 | 100.0% |
Occupancy by Household Size in Souderton borough
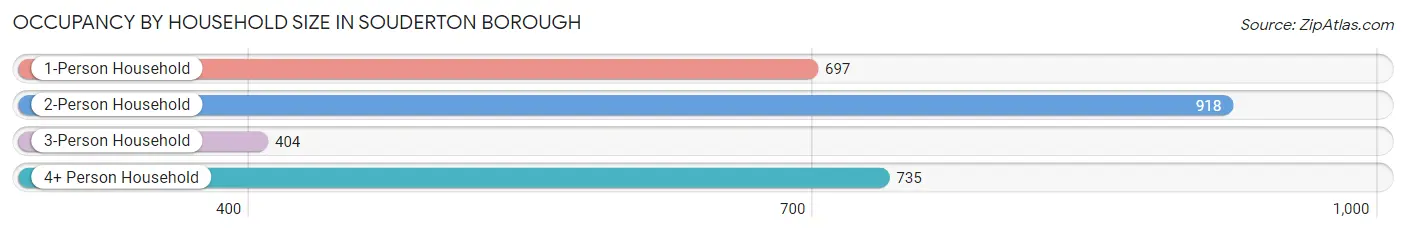
| Household Size | # Housing Units | % Housing Units |
| 1-Person Household | 697 | 25.3% |
| 2-Person Household | 918 | 33.3% |
| 3-Person Household | 404 | 14.7% |
| 4+ Person Household | 735 | 26.7% |
| Total Housing Units | 2,754 | 100.0% |
Occupancy by Ownership by Household Size in Souderton borough
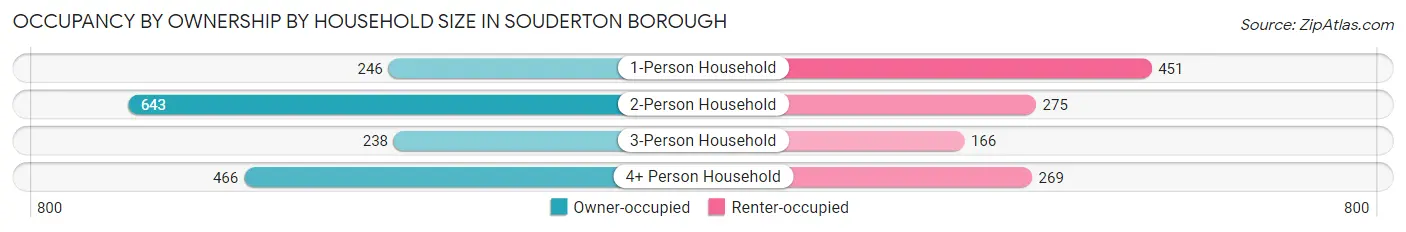
| Household Size | Owner-occupied | Renter-occupied |
| 1-Person Household | 246 (35.3%) | 451 (64.7%) |
| 2-Person Household | 643 (70.0%) | 275 (30.0%) |
| 3-Person Household | 238 (58.9%) | 166 (41.1%) |
| 4+ Person Household | 466 (63.4%) | 269 (36.6%) |
| Total Housing Units | 1,593 (57.8%) | 1,161 (42.2%) |
Occupancy by Educational Attainment in Souderton borough
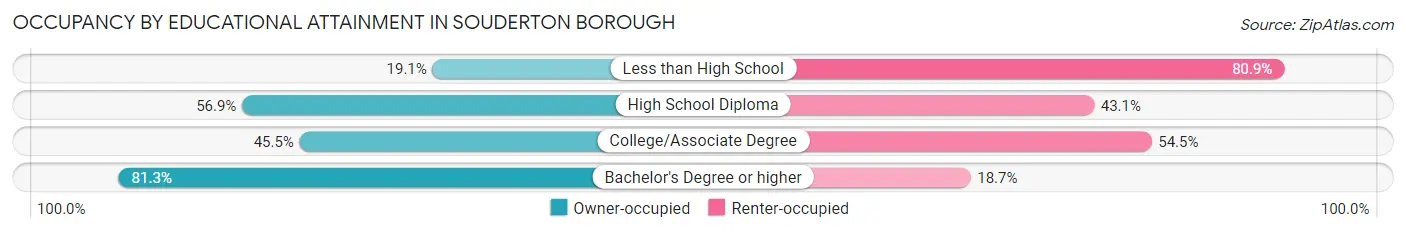
| Household Size | Owner-occupied | Renter-occupied |
| Less than High School | 43 (19.1%) | 182 (80.9%) |
| High School Diploma | 452 (56.9%) | 343 (43.1%) |
| College/Associate Degree | 396 (45.5%) | 475 (54.5%) |
| Bachelor's Degree or higher | 702 (81.3%) | 161 (18.7%) |
Occupancy by Age of Householder in Souderton borough
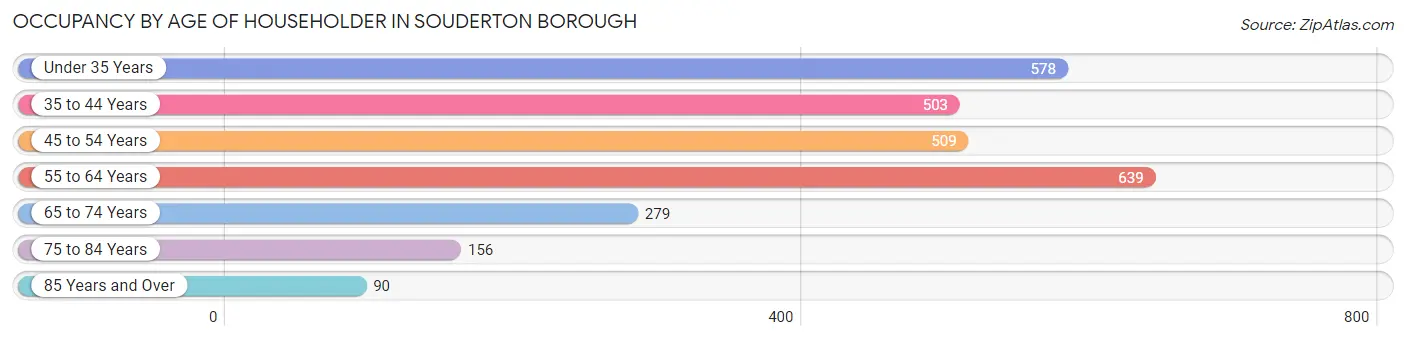
| Age Bracket | # Households | % Households |
| Under 35 Years | 578 | 21.0% |
| 35 to 44 Years | 503 | 18.3% |
| 45 to 54 Years | 509 | 18.5% |
| 55 to 64 Years | 639 | 23.2% |
| 65 to 74 Years | 279 | 10.1% |
| 75 to 84 Years | 156 | 5.7% |
| 85 Years and Over | 90 | 3.3% |
| Total | 2,754 | 100.0% |
Housing Finances in Souderton borough
Median Income by Occupancy in Souderton borough
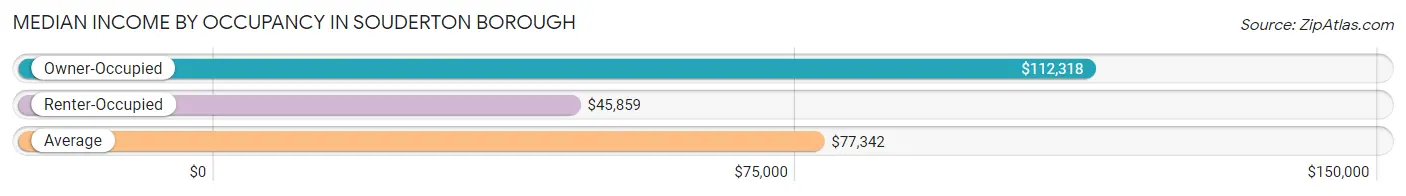
| Occupancy Type | # Households | Median Income |
| Owner-Occupied | 1,593 (57.8%) | $112,318 |
| Renter-Occupied | 1,161 (42.2%) | $45,859 |
| Average | 2,754 (100.0%) | $77,342 |
Occupancy by Householder Income Bracket in Souderton borough
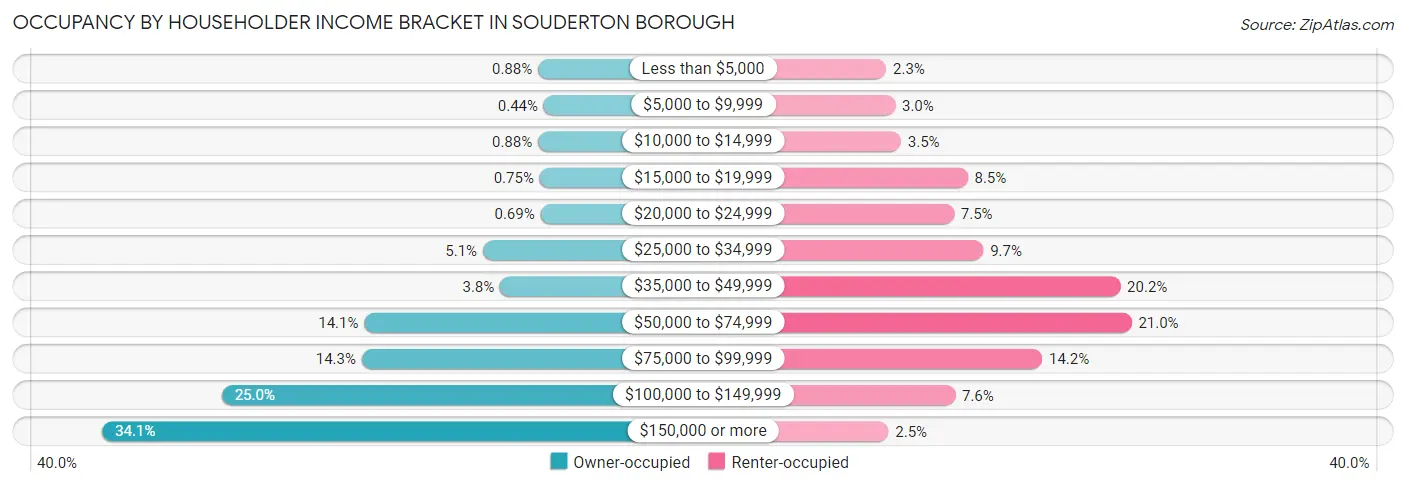
| Income Bracket | Owner-occupied | Renter-occupied |
| Less than $5,000 | 14 (0.9%) | 27 (2.3%) |
| $5,000 to $9,999 | 7 (0.4%) | 35 (3.0%) |
| $10,000 to $14,999 | 14 (0.9%) | 40 (3.5%) |
| $15,000 to $19,999 | 12 (0.7%) | 99 (8.5%) |
| $20,000 to $24,999 | 11 (0.7%) | 87 (7.5%) |
| $25,000 to $34,999 | 81 (5.1%) | 113 (9.7%) |
| $35,000 to $49,999 | 60 (3.8%) | 234 (20.2%) |
| $50,000 to $74,999 | 225 (14.1%) | 244 (21.0%) |
| $75,000 to $99,999 | 228 (14.3%) | 165 (14.2%) |
| $100,000 to $149,999 | 398 (25.0%) | 88 (7.6%) |
| $150,000 or more | 543 (34.1%) | 29 (2.5%) |
| Total | 1,593 (100.0%) | 1,161 (100.0%) |
Monthly Housing Cost Tiers in Souderton borough
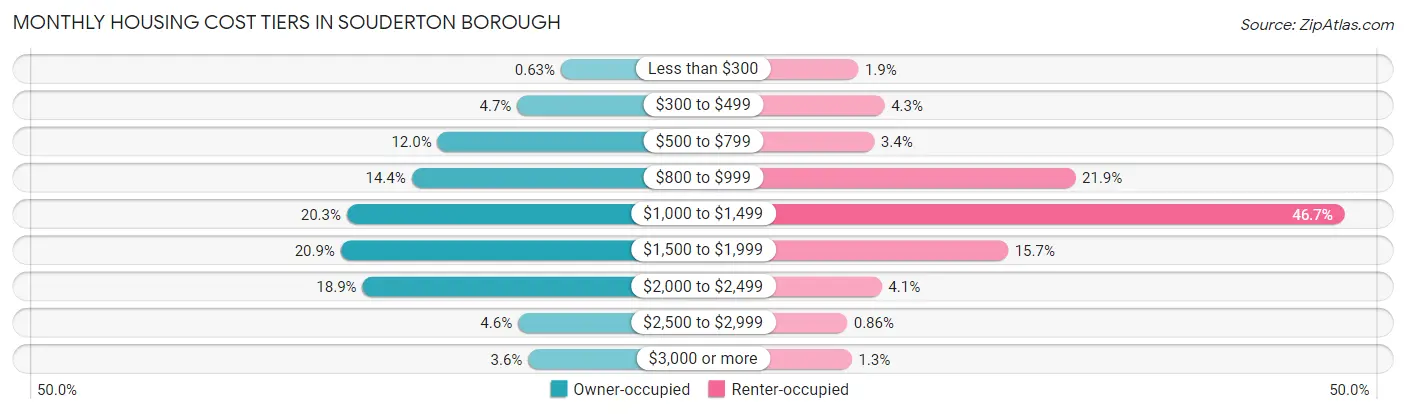
| Monthly Cost | Owner-occupied | Renter-occupied |
| Less than $300 | 10 (0.6%) | 22 (1.9%) |
| $300 to $499 | 74 (4.6%) | 50 (4.3%) |
| $500 to $799 | 191 (12.0%) | 39 (3.4%) |
| $800 to $999 | 229 (14.4%) | 254 (21.9%) |
| $1,000 to $1,499 | 324 (20.3%) | 542 (46.7%) |
| $1,500 to $1,999 | 333 (20.9%) | 182 (15.7%) |
| $2,000 to $2,499 | 301 (18.9%) | 47 (4.1%) |
| $2,500 to $2,999 | 73 (4.6%) | 10 (0.9%) |
| $3,000 or more | 58 (3.6%) | 15 (1.3%) |
| Total | 1,593 (100.0%) | 1,161 (100.0%) |
Physical Housing Characteristics in Souderton borough
Housing Structures in Souderton borough
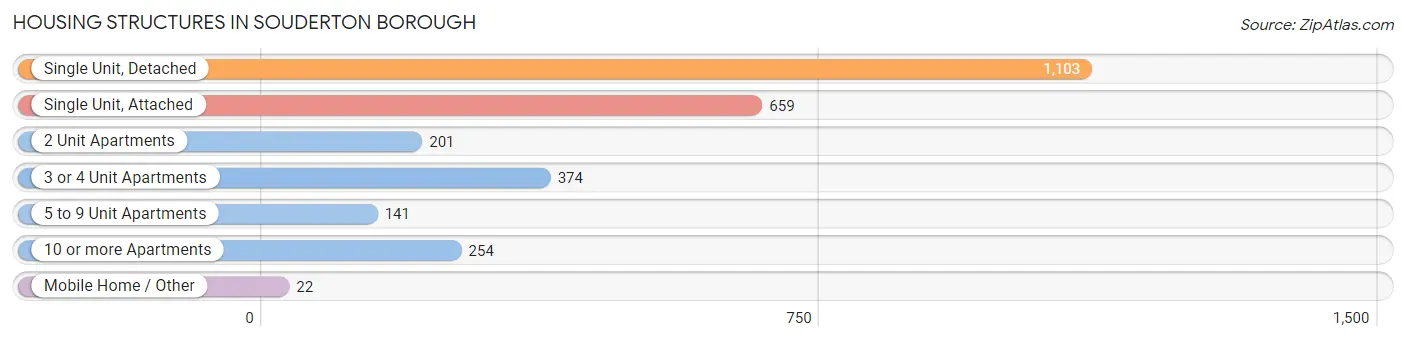
| Structure Type | # Housing Units | % Housing Units |
| Single Unit, Detached | 1,103 | 40.1% |
| Single Unit, Attached | 659 | 23.9% |
| 2 Unit Apartments | 201 | 7.3% |
| 3 or 4 Unit Apartments | 374 | 13.6% |
| 5 to 9 Unit Apartments | 141 | 5.1% |
| 10 or more Apartments | 254 | 9.2% |
| Mobile Home / Other | 22 | 0.8% |
| Total | 2,754 | 100.0% |
Housing Structures by Occupancy in Souderton borough
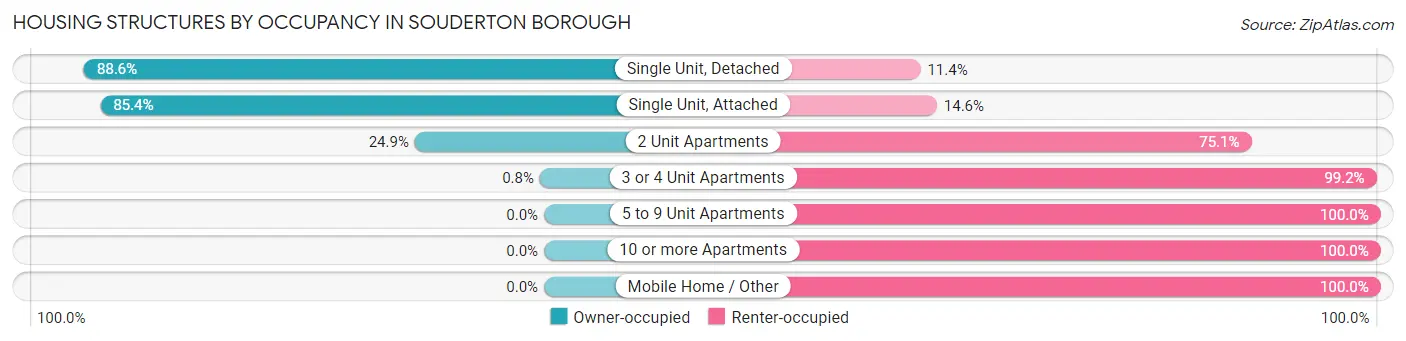
| Structure Type | Owner-occupied | Renter-occupied |
| Single Unit, Detached | 977 (88.6%) | 126 (11.4%) |
| Single Unit, Attached | 563 (85.4%) | 96 (14.6%) |
| 2 Unit Apartments | 50 (24.9%) | 151 (75.1%) |
| 3 or 4 Unit Apartments | 3 (0.8%) | 371 (99.2%) |
| 5 to 9 Unit Apartments | 0 (0.0%) | 141 (100.0%) |
| 10 or more Apartments | 0 (0.0%) | 254 (100.0%) |
| Mobile Home / Other | 0 (0.0%) | 22 (100.0%) |
| Total | 1,593 (57.8%) | 1,161 (42.2%) |
Housing Structures by Number of Rooms in Souderton borough
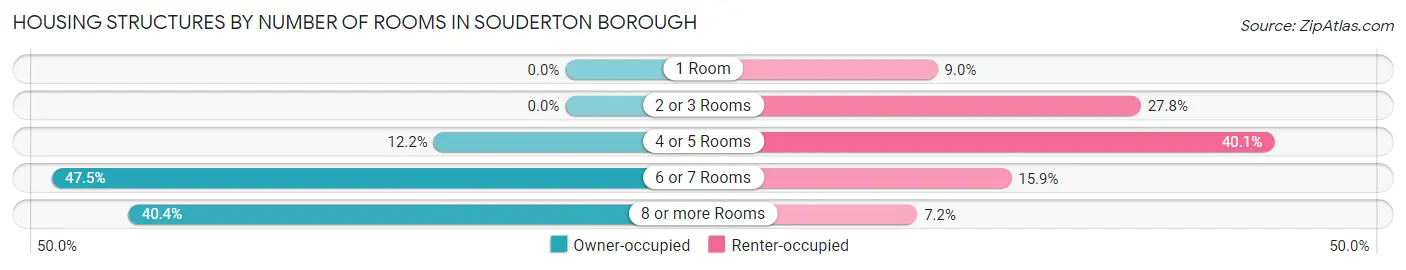
| Number of Rooms | Owner-occupied | Renter-occupied |
| 1 Room | 0 (0.0%) | 105 (9.0%) |
| 2 or 3 Rooms | 0 (0.0%) | 323 (27.8%) |
| 4 or 5 Rooms | 194 (12.2%) | 466 (40.1%) |
| 6 or 7 Rooms | 756 (47.5%) | 184 (15.9%) |
| 8 or more Rooms | 643 (40.4%) | 83 (7.1%) |
| Total | 1,593 (100.0%) | 1,161 (100.0%) |
Housing Structure by Heating Type in Souderton borough
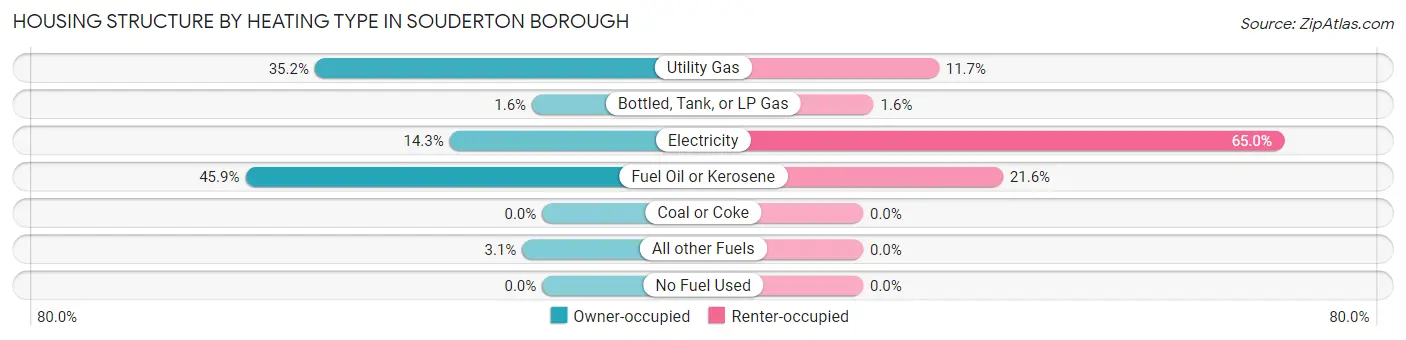
| Heating Type | Owner-occupied | Renter-occupied |
| Utility Gas | 560 (35.1%) | 136 (11.7%) |
| Bottled, Tank, or LP Gas | 25 (1.6%) | 19 (1.6%) |
| Electricity | 228 (14.3%) | 755 (65.0%) |
| Fuel Oil or Kerosene | 731 (45.9%) | 251 (21.6%) |
| Coal or Coke | 0 (0.0%) | 0 (0.0%) |
| All other Fuels | 49 (3.1%) | 0 (0.0%) |
| No Fuel Used | 0 (0.0%) | 0 (0.0%) |
| Total | 1,593 (100.0%) | 1,161 (100.0%) |
Household Vehicle Usage in Souderton borough
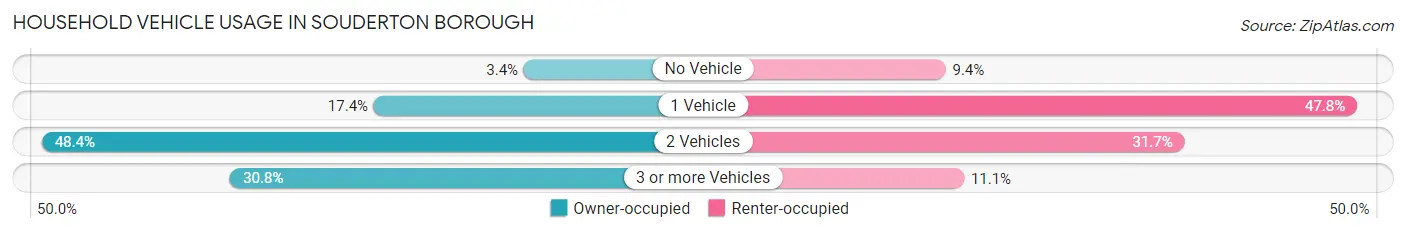
| Vehicles per Household | Owner-occupied | Renter-occupied |
| No Vehicle | 54 (3.4%) | 109 (9.4%) |
| 1 Vehicle | 277 (17.4%) | 555 (47.8%) |
| 2 Vehicles | 771 (48.4%) | 368 (31.7%) |
| 3 or more Vehicles | 491 (30.8%) | 129 (11.1%) |
| Total | 1,593 (100.0%) | 1,161 (100.0%) |
Real Estate & Mortgages in Souderton borough
Real Estate and Mortgage Overview in Souderton borough
| Characteristic | Without Mortgage | With Mortgage |
| Housing Units | 473 | 1,120 |
| Median Property Value | $260,400 | $286,100 |
| Median Household Income | $89,779 | $483 |
| Monthly Housing Costs | $763 | $58 |
| Real Estate Taxes | $4,697 | $77 |
Property Value by Mortgage Status in Souderton borough
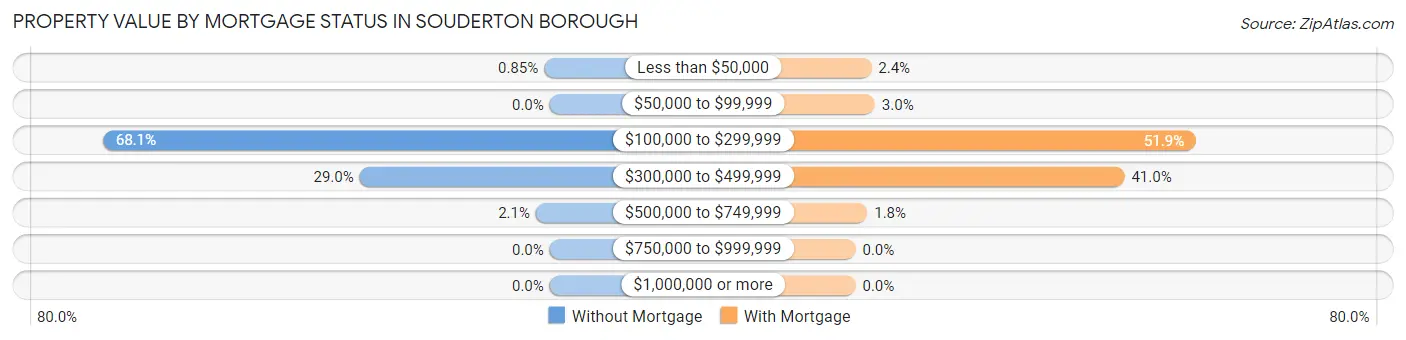
| Property Value | Without Mortgage | With Mortgage |
| Less than $50,000 | 4 (0.9%) | 27 (2.4%) |
| $50,000 to $99,999 | 0 (0.0%) | 33 (2.9%) |
| $100,000 to $299,999 | 322 (68.1%) | 581 (51.9%) |
| $300,000 to $499,999 | 137 (29.0%) | 459 (41.0%) |
| $500,000 to $749,999 | 10 (2.1%) | 20 (1.8%) |
| $750,000 to $999,999 | 0 (0.0%) | 0 (0.0%) |
| $1,000,000 or more | 0 (0.0%) | 0 (0.0%) |
| Total | 473 (100.0%) | 1,120 (100.0%) |
Household Income by Mortgage Status in Souderton borough
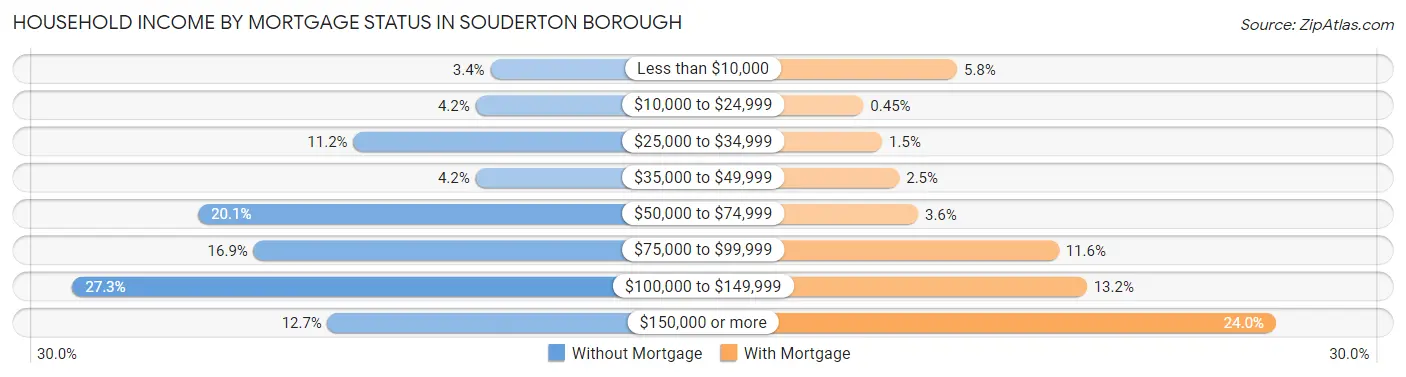
| Household Income | Without Mortgage | With Mortgage |
| Less than $10,000 | 16 (3.4%) | 65 (5.8%) |
| $10,000 to $24,999 | 20 (4.2%) | 5 (0.4%) |
| $25,000 to $34,999 | 53 (11.2%) | 17 (1.5%) |
| $35,000 to $49,999 | 20 (4.2%) | 28 (2.5%) |
| $50,000 to $74,999 | 95 (20.1%) | 40 (3.6%) |
| $75,000 to $99,999 | 80 (16.9%) | 130 (11.6%) |
| $100,000 to $149,999 | 129 (27.3%) | 148 (13.2%) |
| $150,000 or more | 60 (12.7%) | 269 (24.0%) |
| Total | 473 (100.0%) | 1,120 (100.0%) |
Property Value to Household Income Ratio in Souderton borough
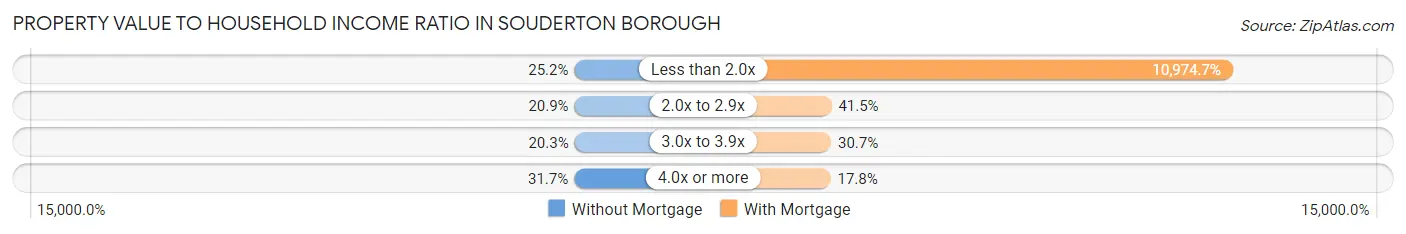
| Value-to-Income Ratio | Without Mortgage | With Mortgage |
| Less than 2.0x | 119 (25.2%) | 122,917 (10,974.7%) |
| 2.0x to 2.9x | 99 (20.9%) | 465 (41.5%) |
| 3.0x to 3.9x | 96 (20.3%) | 344 (30.7%) |
| 4.0x or more | 150 (31.7%) | 199 (17.8%) |
| Total | 473 (100.0%) | 1,120 (100.0%) |
Real Estate Taxes by Mortgage Status in Souderton borough
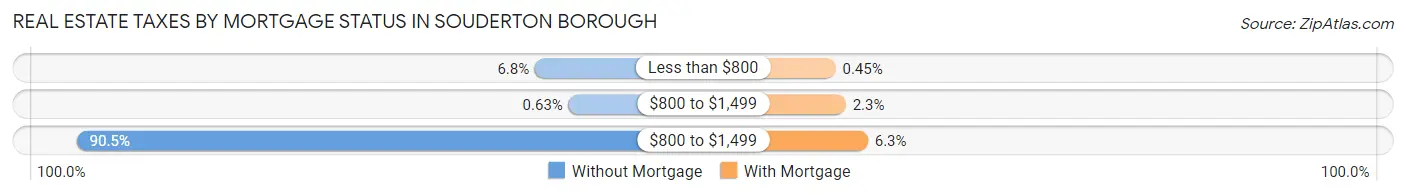
| Property Taxes | Without Mortgage | With Mortgage |
| Less than $800 | 32 (6.8%) | 5 (0.4%) |
| $800 to $1,499 | 3 (0.6%) | 26 (2.3%) |
| $800 to $1,499 | 428 (90.5%) | 71 (6.3%) |
| Total | 473 (100.0%) | 1,120 (100.0%) |
Health & Disability in Souderton borough
Health Insurance Coverage by Age in Souderton borough
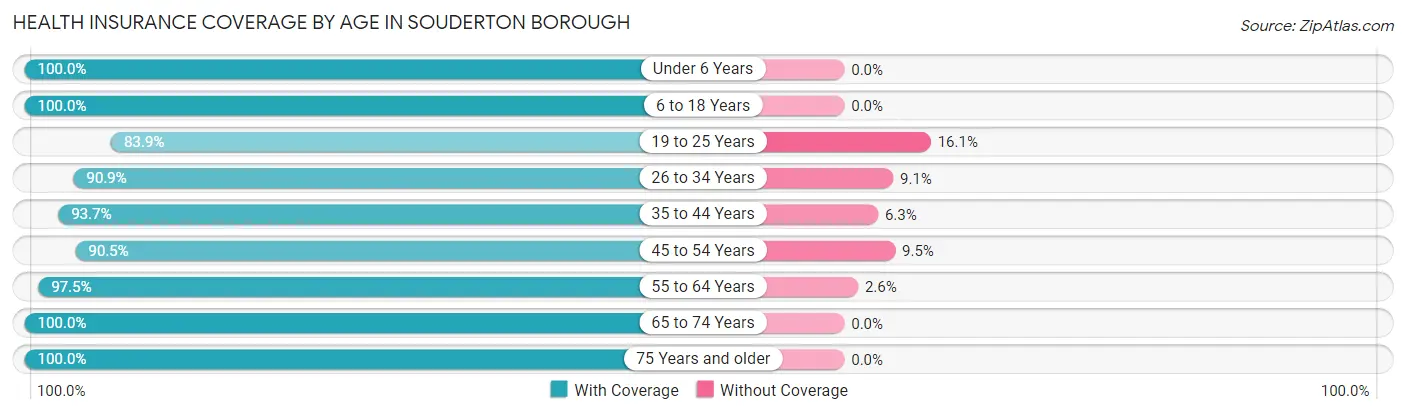
| Age Bracket | With Coverage | Without Coverage |
| Under 6 Years | 540 (100.0%) | 0 (0.0%) |
| 6 to 18 Years | 1,270 (100.0%) | 0 (0.0%) |
| 19 to 25 Years | 432 (83.9%) | 83 (16.1%) |
| 26 to 34 Years | 969 (90.9%) | 97 (9.1%) |
| 35 to 44 Years | 866 (93.7%) | 58 (6.3%) |
| 45 to 54 Years | 813 (90.5%) | 85 (9.5%) |
| 55 to 64 Years | 993 (97.5%) | 26 (2.5%) |
| 65 to 74 Years | 522 (100.0%) | 0 (0.0%) |
| 75 Years and older | 393 (100.0%) | 0 (0.0%) |
| Total | 6,798 (95.1%) | 349 (4.9%) |
Health Insurance Coverage by Citizenship Status in Souderton borough
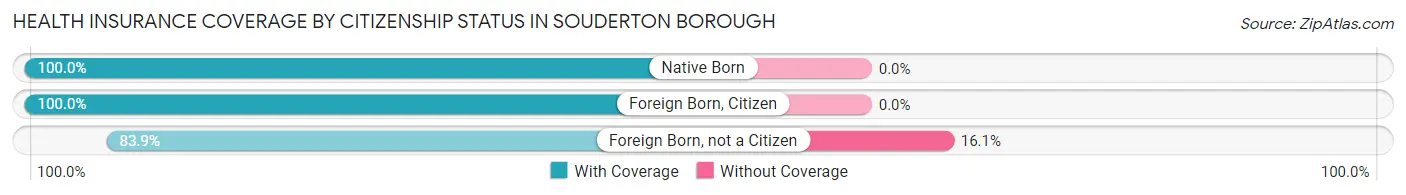
| Citizenship Status | With Coverage | Without Coverage |
| Native Born | 540 (100.0%) | 0 (0.0%) |
| Foreign Born, Citizen | 1,270 (100.0%) | 0 (0.0%) |
| Foreign Born, not a Citizen | 432 (83.9%) | 83 (16.1%) |
Health Insurance Coverage by Household Income in Souderton borough
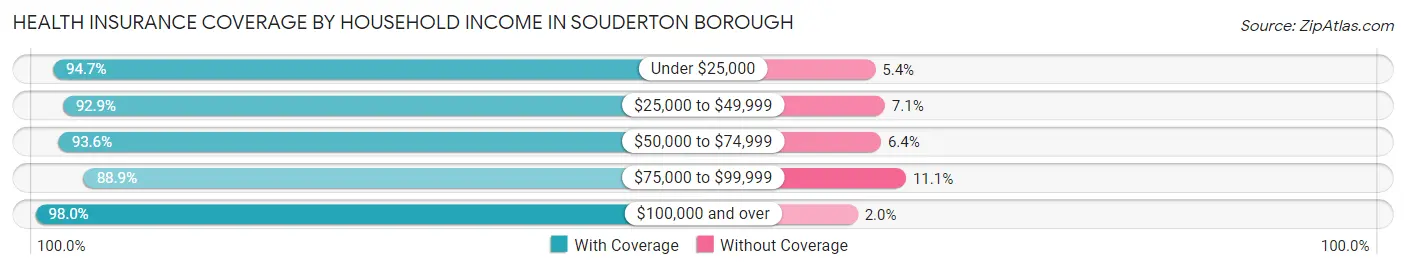
| Household Income | With Coverage | Without Coverage |
| Under $25,000 | 531 (94.7%) | 30 (5.3%) |
| $25,000 to $49,999 | 988 (92.9%) | 76 (7.1%) |
| $50,000 to $74,999 | 890 (93.6%) | 61 (6.4%) |
| $75,000 to $99,999 | 866 (88.9%) | 108 (11.1%) |
| $100,000 and over | 3,508 (98.0%) | 73 (2.0%) |
Public vs Private Health Insurance Coverage by Age in Souderton borough
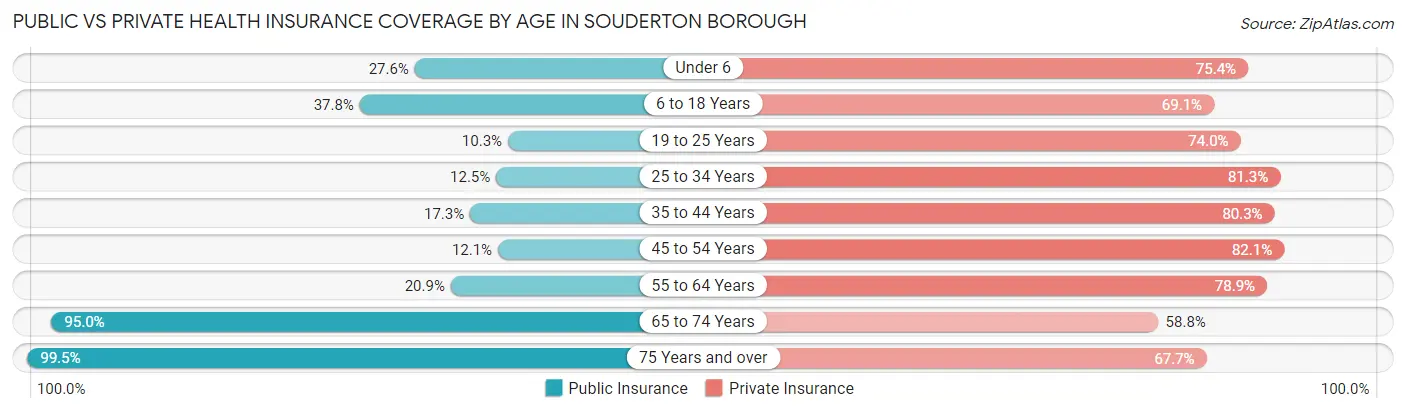
| Age Bracket | Public Insurance | Private Insurance |
| Under 6 | 149 (27.6%) | 407 (75.4%) |
| 6 to 18 Years | 480 (37.8%) | 877 (69.1%) |
| 19 to 25 Years | 53 (10.3%) | 381 (74.0%) |
| 25 to 34 Years | 133 (12.5%) | 867 (81.3%) |
| 35 to 44 Years | 160 (17.3%) | 742 (80.3%) |
| 45 to 54 Years | 109 (12.1%) | 737 (82.1%) |
| 55 to 64 Years | 213 (20.9%) | 804 (78.9%) |
| 65 to 74 Years | 496 (95.0%) | 307 (58.8%) |
| 75 Years and over | 391 (99.5%) | 266 (67.7%) |
| Total | 2,184 (30.6%) | 5,388 (75.4%) |
Disability Status by Sex by Age in Souderton borough
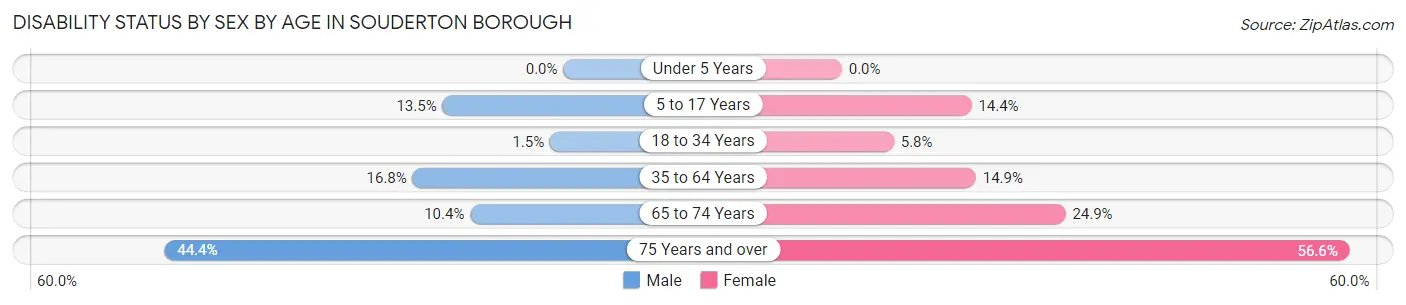
| Age Bracket | Male | Female |
| Under 5 Years | 0 (0.0%) | 0 (0.0%) |
| 5 to 17 Years | 75 (13.5%) | 96 (14.4%) |
| 18 to 34 Years | 12 (1.5%) | 50 (5.8%) |
| 35 to 64 Years | 225 (16.8%) | 224 (14.9%) |
| 65 to 74 Years | 25 (10.4%) | 70 (24.9%) |
| 75 Years and over | 56 (44.4%) | 151 (56.6%) |
Disability Class by Sex by Age in Souderton borough
Disability Class: Hearing Difficulty
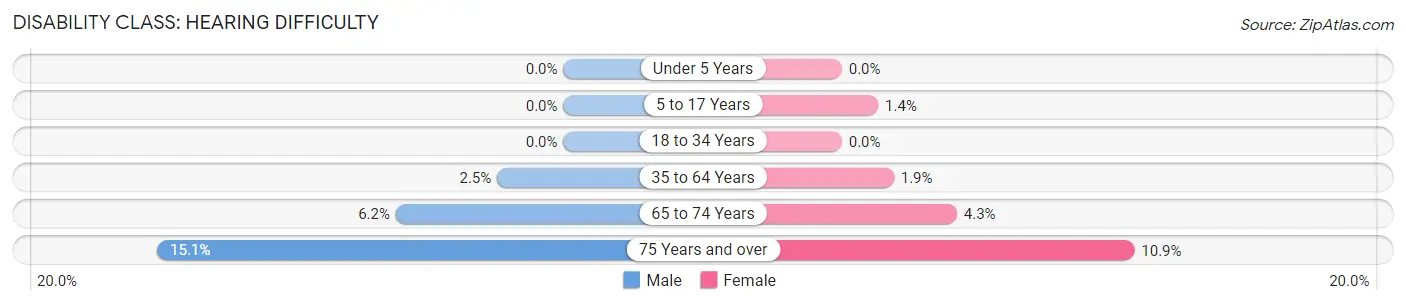
| Age Bracket | Male | Female |
| Under 5 Years | 0 (0.0%) | 0 (0.0%) |
| 5 to 17 Years | 0 (0.0%) | 9 (1.3%) |
| 18 to 34 Years | 0 (0.0%) | 0 (0.0%) |
| 35 to 64 Years | 33 (2.5%) | 29 (1.9%) |
| 65 to 74 Years | 15 (6.2%) | 12 (4.3%) |
| 75 Years and over | 19 (15.1%) | 29 (10.9%) |
Disability Class: Vision Difficulty
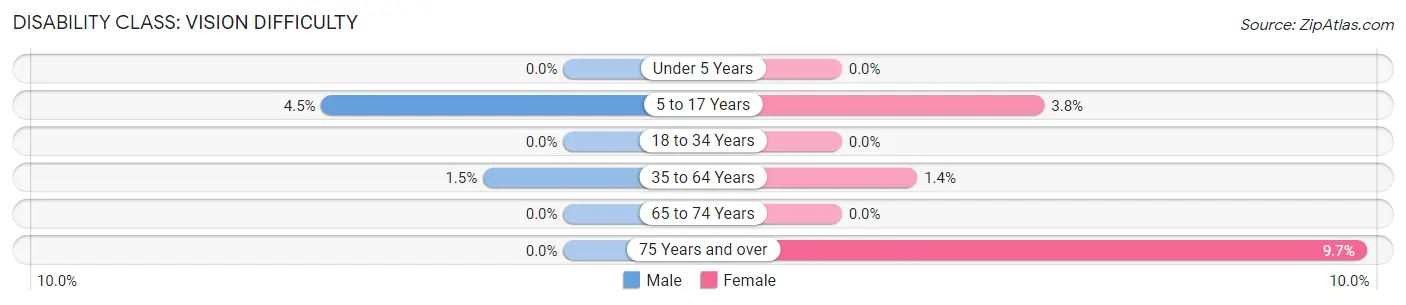
| Age Bracket | Male | Female |
| Under 5 Years | 0 (0.0%) | 0 (0.0%) |
| 5 to 17 Years | 25 (4.5%) | 25 (3.8%) |
| 18 to 34 Years | 0 (0.0%) | 0 (0.0%) |
| 35 to 64 Years | 20 (1.5%) | 21 (1.4%) |
| 65 to 74 Years | 0 (0.0%) | 0 (0.0%) |
| 75 Years and over | 0 (0.0%) | 26 (9.7%) |
Disability Class: Cognitive Difficulty
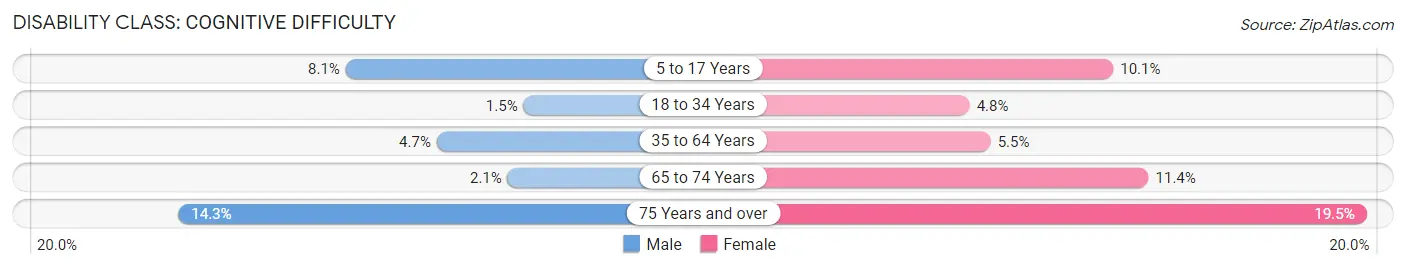
| Age Bracket | Male | Female |
| 5 to 17 Years | 45 (8.1%) | 67 (10.1%) |
| 18 to 34 Years | 12 (1.5%) | 41 (4.8%) |
| 35 to 64 Years | 63 (4.7%) | 83 (5.5%) |
| 65 to 74 Years | 5 (2.1%) | 32 (11.4%) |
| 75 Years and over | 18 (14.3%) | 52 (19.5%) |
Disability Class: Ambulatory Difficulty
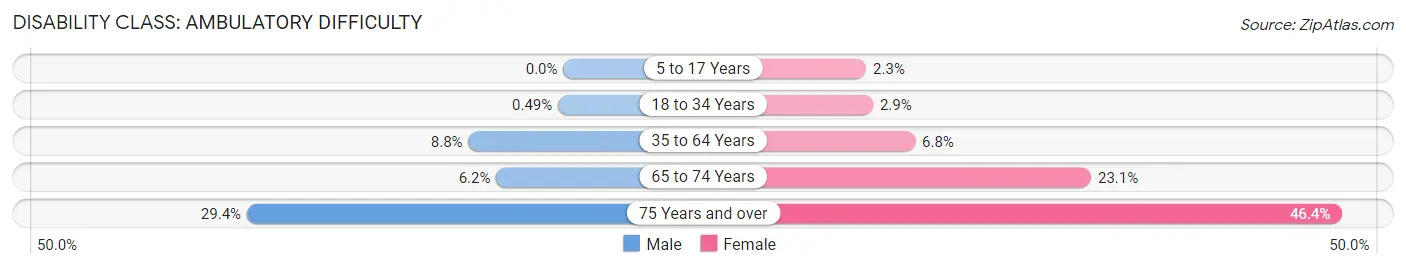
| Age Bracket | Male | Female |
| 5 to 17 Years | 0 (0.0%) | 15 (2.3%) |
| 18 to 34 Years | 4 (0.5%) | 25 (2.9%) |
| 35 to 64 Years | 118 (8.8%) | 102 (6.8%) |
| 65 to 74 Years | 15 (6.2%) | 65 (23.1%) |
| 75 Years and over | 37 (29.4%) | 124 (46.4%) |
Disability Class: Self-Care Difficulty
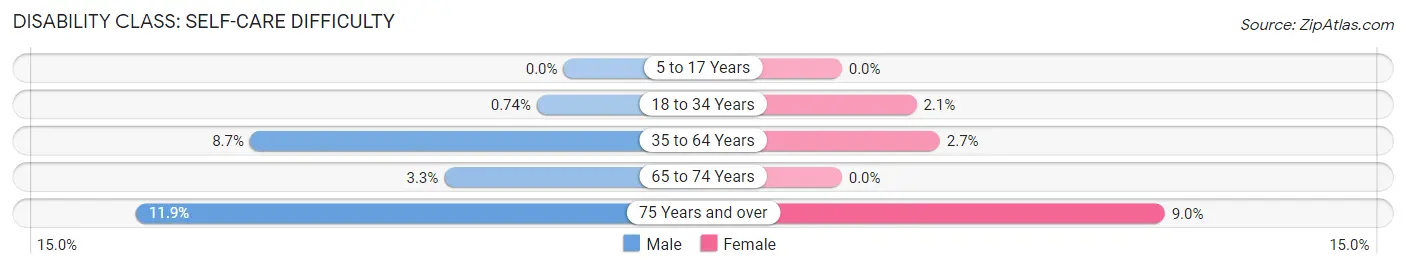
| Age Bracket | Male | Female |
| 5 to 17 Years | 0 (0.0%) | 0 (0.0%) |
| 18 to 34 Years | 6 (0.7%) | 18 (2.1%) |
| 35 to 64 Years | 117 (8.7%) | 41 (2.7%) |
| 65 to 74 Years | 8 (3.3%) | 0 (0.0%) |
| 75 Years and over | 15 (11.9%) | 24 (9.0%) |
Technology Access in Souderton borough
Computing Device Access in Souderton borough
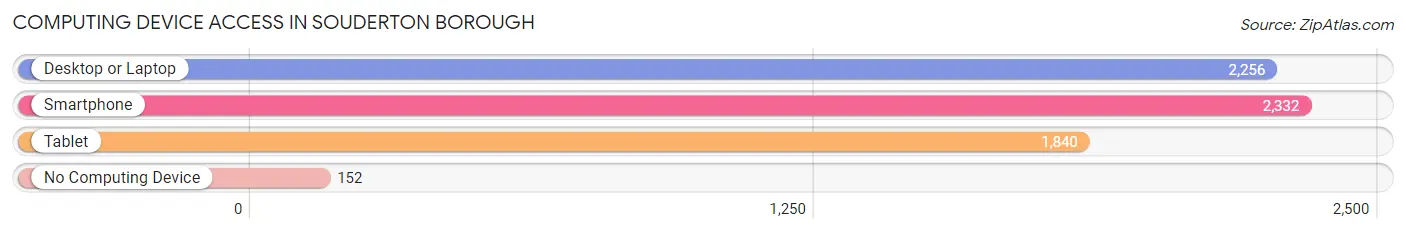
| Device Type | # Households | % Households |
| Desktop or Laptop | 2,256 | 81.9% |
| Smartphone | 2,332 | 84.7% |
| Tablet | 1,840 | 66.8% |
| No Computing Device | 152 | 5.5% |
| Total | 2,754 | 100.0% |
Internet Access in Souderton borough
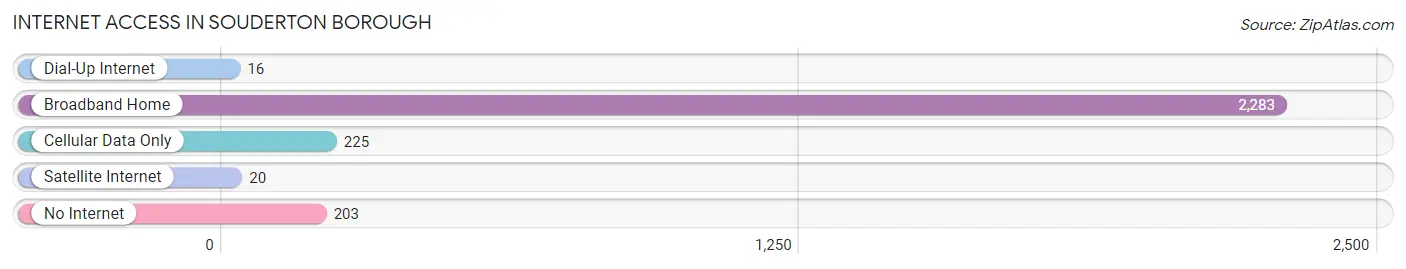
| Internet Type | # Households | % Households |
| Dial-Up Internet | 16 | 0.6% |
| Broadband Home | 2,283 | 82.9% |
| Cellular Data Only | 225 | 8.2% |
| Satellite Internet | 20 | 0.7% |
| No Internet | 203 | 7.4% |
| Total | 2,754 | 100.0% |
Souderton borough Summary
Souderton Borough is a small borough located in Montgomery County, Pennsylvania. It is situated approximately 25 miles north of Philadelphia and is part of the North Penn Valley region. The borough is home to a population of approximately 8,000 people and covers an area of 1.3 square miles.
History
Souderton Borough was founded in 1851 by a group of German settlers who had migrated from the Palatinate region of Germany. The settlers named the borough after their hometown of Souderton, Germany. The borough was officially incorporated in 1872.
In the late 19th century, Souderton was a thriving agricultural community. The borough was home to a number of farms, which produced a variety of crops, including wheat, corn, oats, and hay. The borough also had a number of small businesses, including a grist mill, a saw mill, a blacksmith shop, and a general store.
In the early 20th century, Souderton began to transition from an agricultural community to a more industrial one. The borough was home to a number of factories, including a silk mill, a paper mill, and a canning factory. The borough also had a number of small businesses, including a grocery store, a hardware store, and a drug store.
Geography
Souderton Borough is located in Montgomery County, Pennsylvania. It is situated approximately 25 miles north of Philadelphia and is part of the North Penn Valley region. The borough is bordered by Franconia Township to the north, Telford Borough to the east, Lower Salford Township to the south, and Harleysville Borough to the west.
The borough is located in the Souderton Valley, which is part of the Great Valley region of Pennsylvania. The valley is characterized by rolling hills and is home to a number of streams, including the Perkiomen Creek and the Skippack Creek.
Economy
Souderton Borough is home to a number of small businesses, including restaurants, retail stores, and professional services. The borough is also home to a number of industrial businesses, including a printing company, a plastics manufacturer, and a food processing plant.
The borough is home to a number of large employers, including Souderton Area School District, Souderton Mennonite Homes, and Souderton Community Hospital. The borough is also home to a number of small businesses, including restaurants, retail stores, and professional services.
Demographics
As of the 2010 census, Souderton Borough had a population of 8,072 people. The racial makeup of the borough was 87.3% White, 5.2% African American, 0.4% Native American, 2.2% Asian, 0.1% Pacific Islander, and 4.8% from other races. Hispanic or Latino of any race were 6.2% of the population.
The median household income in Souderton Borough was $62,917, and the median family income was $76,917. The per capita income was $30,917. About 4.2% of families and 5.7% of the population were below the poverty line, including 6.7% of those under age 18 and 4.2% of those age 65 or over.
Common Questions
What is Per Capita Income in Souderton borough?
Per Capita income in Souderton borough is $37,796.
What is the Median Family Income in Souderton borough?
Median Family Income in Souderton borough is $96,521.
What is the Median Household income in Souderton borough?
Median Household Income in Souderton borough is $77,342.
What is Income or Wage Gap in Souderton borough?
Income or Wage Gap in Souderton borough is 25.3%.
Women in Souderton borough earn 74.7 cents for every dollar earned by a man.
What is Inequality or Gini Index in Souderton borough?
Inequality or Gini Index in Souderton borough is 0.41.
What is the Total Population of Souderton borough?
Total Population of Souderton borough is 7,169.
What is the Total Male Population of Souderton borough?
Total Male Population of Souderton borough is 3,346.
What is the Total Female Population of Souderton borough?
Total Female Population of Souderton borough is 3,823.
What is the Ratio of Males per 100 Females in Souderton borough?
There are 87.52 Males per 100 Females in Souderton borough.
What is the Ratio of Females per 100 Males in Souderton borough?
There are 114.26 Females per 100 Males in Souderton borough.
What is the Median Population Age in Souderton borough?
Median Population Age in Souderton borough is 36.6 Years.
What is the Average Family Size in Souderton borough
Average Family Size in Souderton borough is 3.1 People.
What is the Average Household Size in Souderton borough
Average Household Size in Souderton borough is 2.6 People.
How Large is the Labor Force in Souderton borough?
There are 4,230 People in the Labor Forcein in Souderton borough.
What is the Percentage of People in the Labor Force in Souderton borough?
74.6% of People are in the Labor Force in Souderton borough.
What is the Unemployment Rate in Souderton borough?
Unemployment Rate in Souderton borough is 4.4%.