Red Hill borough, PA Map & Demographics
Red Hill borough Overview
$38,593
PER CAPITA INCOME
$112,083
AVG FAMILY INCOME
$75,188
AVG HOUSEHOLD INCOME
7.6%
WAGE / INCOME GAP [ % ]
92.4¢/ $1
WAGE / INCOME GAP [ $ ]
0.40
INEQUALITY / GINI INDEX
2,663
TOTAL POPULATION
1,327
MALE POPULATION
1,336
FEMALE POPULATION
99.33
MALES / 100 FEMALES
100.68
FEMALES / 100 MALES
42.6
MEDIAN AGE
3.3
AVG FAMILY SIZE
2.4
AVG HOUSEHOLD SIZE
1,448
LABOR FORCE [ PEOPLE ]
67.6%
PERCENT IN LABOR FORCE
5.4%
UNEMPLOYMENT RATE
Income in Red Hill borough
Income Overview in Red Hill borough
Per Capita Income in Red Hill borough is $38,593, while median incomes of families and households are $112,083 and $75,188 respectively.
| Characteristic | Number | Measure |
| Per Capita Income | 2,663 | $38,593 |
| Median Family Income | 632 | $112,083 |
| Mean Family Income | 632 | $121,090 |
| Median Household Income | 1,121 | $75,188 |
| Mean Household Income | 1,121 | $90,363 |
| Income Deficit | 632 | $0 |
| Wage / Income Gap (%) | 2,663 | 7.63% |
| Wage / Income Gap ($) | 2,663 | 92.37¢ per $1 |
| Gini / Inequality Index | 2,663 | 0.40 |
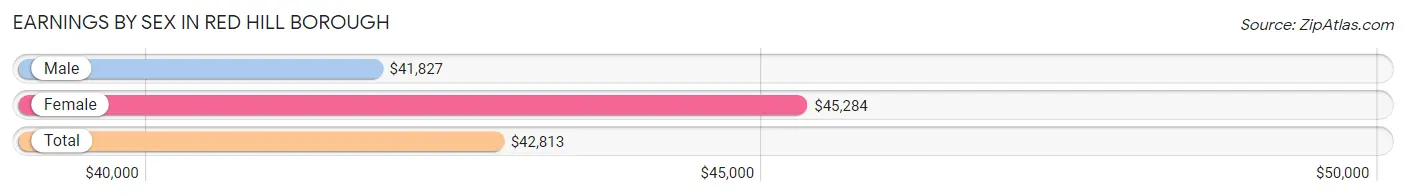
Earnings by Sex in Red Hill borough
Average Earnings in Red Hill borough are $42,813, $41,827 for men and $45,284 for women, a difference of 7.6%.
| Sex | Number | Average Earnings |
| Male | 889 (57.1%) | $41,827 |
| Female | 669 (42.9%) | $45,284 |
| Total | 1,558 (100.0%) | $42,813 |
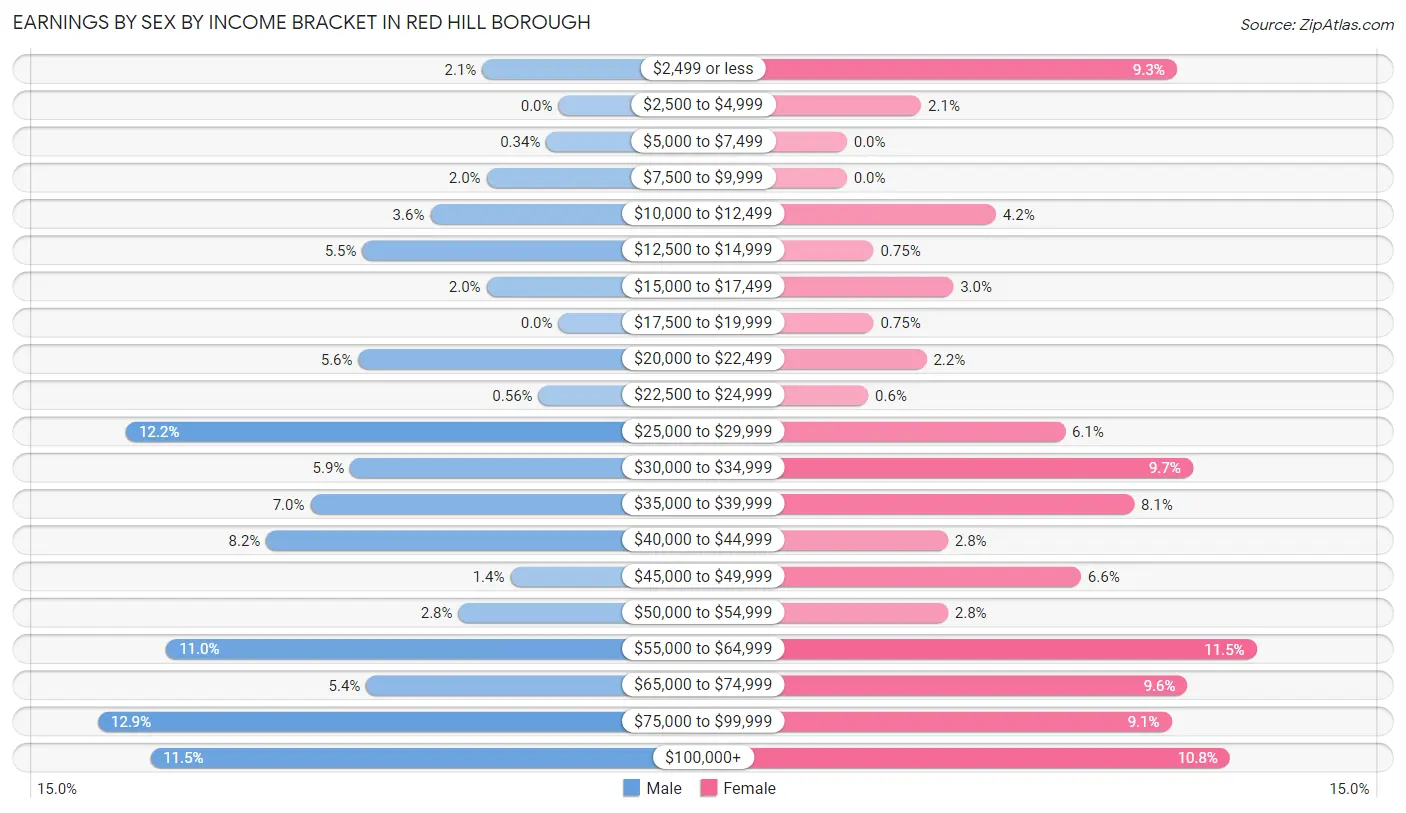
Earnings by Sex by Income Bracket in Red Hill borough
The most common earnings brackets in Red Hill borough are $75,000 to $99,999 for men (115 | 12.9%) and $55,000 to $64,999 for women (77 | 11.5%).
| Income | Male | Female |
| $2,499 or less | 19 (2.1%) | 62 (9.3%) |
| $2,500 to $4,999 | 0 (0.0%) | 14 (2.1%) |
| $5,000 to $7,499 | 3 (0.3%) | 0 (0.0%) |
| $7,500 to $9,999 | 18 (2.0%) | 0 (0.0%) |
| $10,000 to $12,499 | 32 (3.6%) | 28 (4.2%) |
| $12,500 to $14,999 | 49 (5.5%) | 5 (0.7%) |
| $15,000 to $17,499 | 18 (2.0%) | 20 (3.0%) |
| $17,500 to $19,999 | 0 (0.0%) | 5 (0.7%) |
| $20,000 to $22,499 | 50 (5.6%) | 15 (2.2%) |
| $22,500 to $24,999 | 5 (0.6%) | 4 (0.6%) |
| $25,000 to $29,999 | 108 (12.1%) | 41 (6.1%) |
| $30,000 to $34,999 | 52 (5.9%) | 65 (9.7%) |
| $35,000 to $39,999 | 62 (7.0%) | 54 (8.1%) |
| $40,000 to $44,999 | 73 (8.2%) | 19 (2.8%) |
| $45,000 to $49,999 | 12 (1.3%) | 44 (6.6%) |
| $50,000 to $54,999 | 25 (2.8%) | 19 (2.8%) |
| $55,000 to $64,999 | 98 (11.0%) | 77 (11.5%) |
| $65,000 to $74,999 | 48 (5.4%) | 64 (9.6%) |
| $75,000 to $99,999 | 115 (12.9%) | 61 (9.1%) |
| $100,000+ | 102 (11.5%) | 72 (10.8%) |
| Total | 889 (100.0%) | 669 (100.0%) |
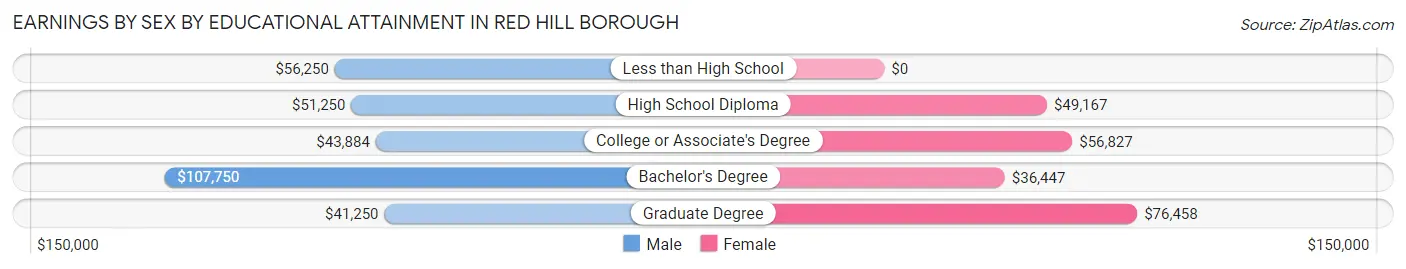
Earnings by Sex by Educational Attainment in Red Hill borough
Average earnings in Red Hill borough are $54,375 for men and $49,034 for women, a difference of 9.8%. Men with an educational attainment of bachelor's degree enjoy the highest average annual earnings of $107,750, while those with graduate degree education earn the least with $41,250. Women with an educational attainment of graduate degree earn the most with the average annual earnings of $76,458, while those with bachelor's degree education have the smallest earnings of $36,447.
| Educational Attainment | Male Income | Female Income |
| Less than High School | $56,250 | $0 |
| High School Diploma | $51,250 | $49,167 |
| College or Associate's Degree | $43,884 | $56,827 |
| Bachelor's Degree | $107,750 | $36,447 |
| Graduate Degree | $41,250 | $76,458 |
| Total | $54,375 | $49,034 |
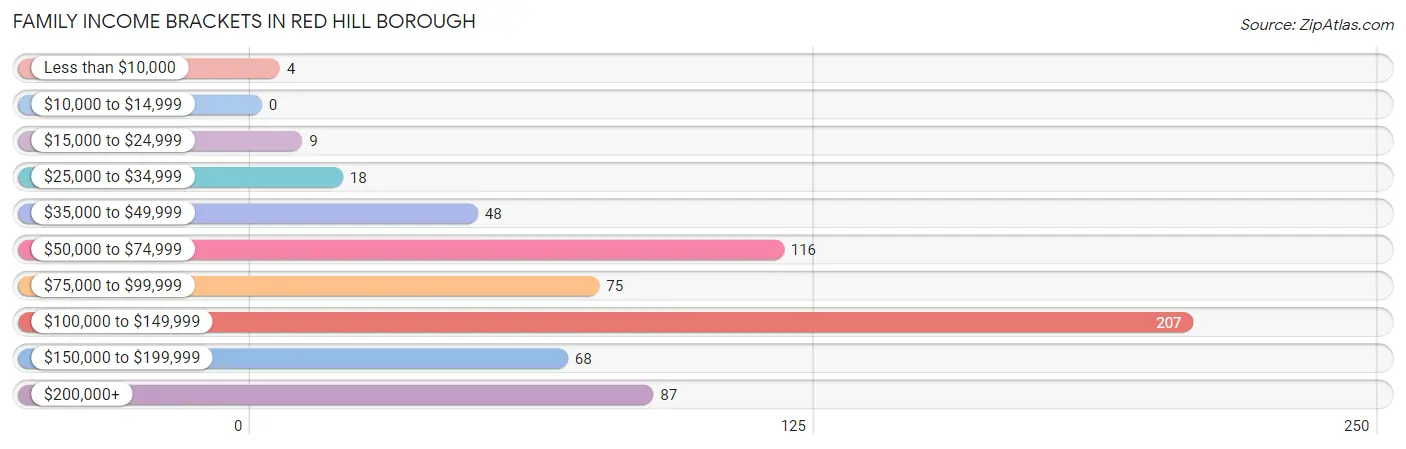
Family Income in Red Hill borough
Family Income Brackets in Red Hill borough
According to the Red Hill borough family income data, there are 207 families falling into the $100,000 to $149,999 income range, which is the most common income bracket and makes up 32.8% of all families.
| Income Bracket | # Families | % Families |
| Less than $10,000 | 4 | 0.6% |
| $10,000 to $14,999 | 0 | 0.0% |
| $15,000 to $24,999 | 9 | 1.4% |
| $25,000 to $34,999 | 18 | 2.8% |
| $35,000 to $49,999 | 48 | 7.6% |
| $50,000 to $74,999 | 116 | 18.4% |
| $75,000 to $99,999 | 75 | 11.9% |
| $100,000 to $149,999 | 207 | 32.8% |
| $150,000 to $199,999 | 68 | 10.8% |
| $200,000+ | 87 | 13.8% |
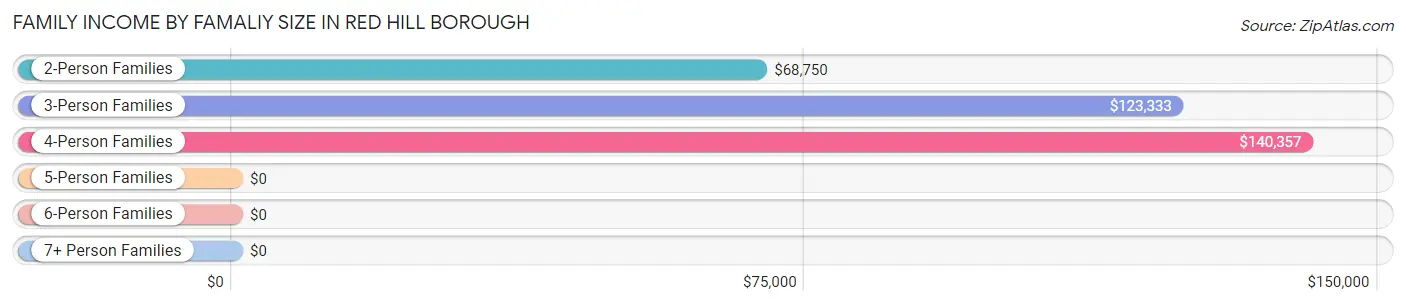
Family Income by Famaliy Size in Red Hill borough
4-person families (156 | 24.7%) account for the highest median family income in Red Hill borough with $140,357 per family, while 3-person families (158 | 25.0%) have the highest median income of $41,111 per family member.
| Income Bracket | # Families | Median Income |
| 2-Person Families | 249 (39.4%) | $68,750 |
| 3-Person Families | 158 (25.0%) | $123,333 |
| 4-Person Families | 156 (24.7%) | $140,357 |
| 5-Person Families | 16 (2.5%) | $0 |
| 6-Person Families | 22 (3.5%) | $0 |
| 7+ Person Families | 31 (4.9%) | $0 |
| Total | 632 (100.0%) | $112,083 |
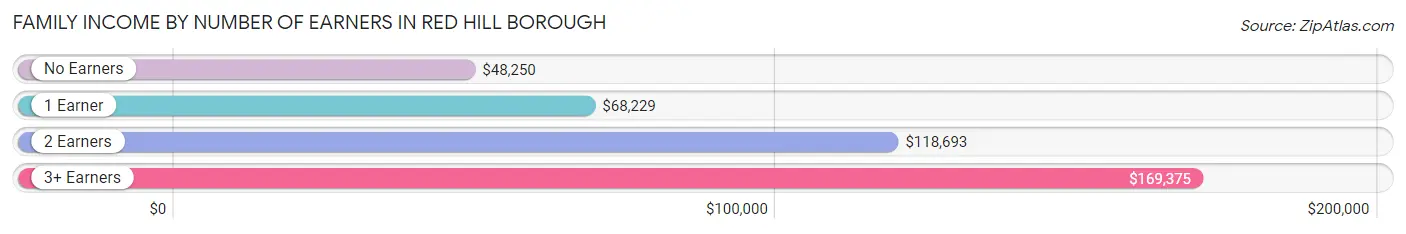
Family Income by Number of Earners in Red Hill borough
The median family income in Red Hill borough is $112,083, with families comprising 3+ earners (134) having the highest median family income of $169,375, while families with no earners (62) have the lowest median family income of $48,250, accounting for 21.2% and 9.8% of families, respectively.
| Number of Earners | # Families | Median Income |
| No Earners | 62 (9.8%) | $48,250 |
| 1 Earner | 139 (22.0%) | $68,229 |
| 2 Earners | 297 (47.0%) | $118,693 |
| 3+ Earners | 134 (21.2%) | $169,375 |
| Total | 632 (100.0%) | $112,083 |
Household Income in Red Hill borough
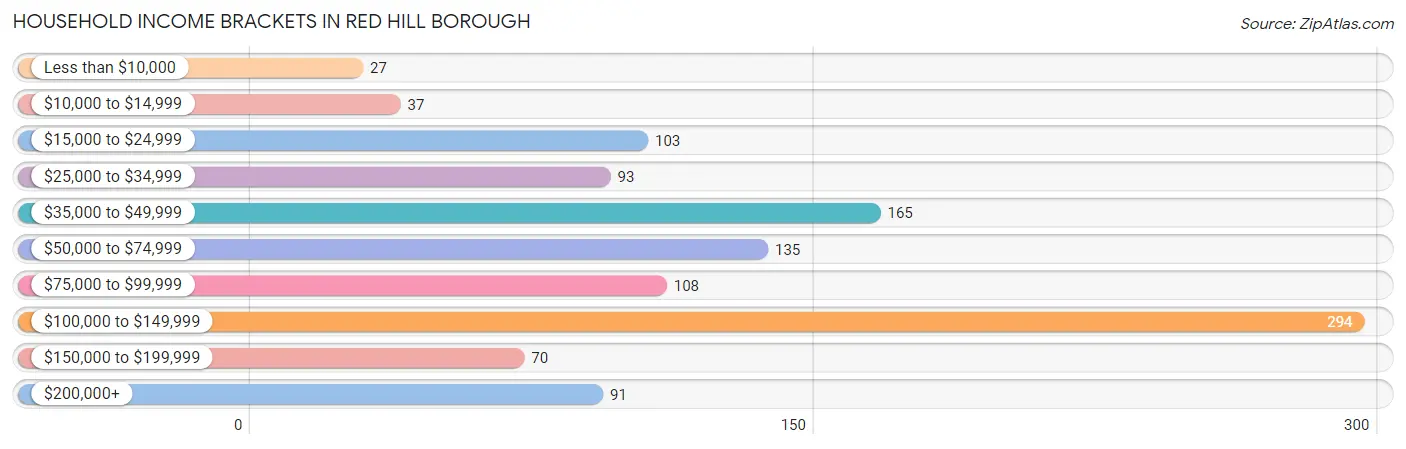
Household Income Brackets in Red Hill borough
With 294 households falling in the category, the $100,000 to $149,999 income range is the most frequent in Red Hill borough, accounting for 26.2% of all households. In contrast, only 27 households (2.4%) fall into the less than $10,000 income bracket, making it the least populous group.
| Income Bracket | # Households | % Households |
| Less than $10,000 | 27 | 2.4% |
| $10,000 to $14,999 | 37 | 3.3% |
| $15,000 to $24,999 | 103 | 9.2% |
| $25,000 to $34,999 | 93 | 8.3% |
| $35,000 to $49,999 | 165 | 14.7% |
| $50,000 to $74,999 | 135 | 12.0% |
| $75,000 to $99,999 | 108 | 9.6% |
| $100,000 to $149,999 | 294 | 26.2% |
| $150,000 to $199,999 | 70 | 6.2% |
| $200,000+ | 91 | 8.1% |
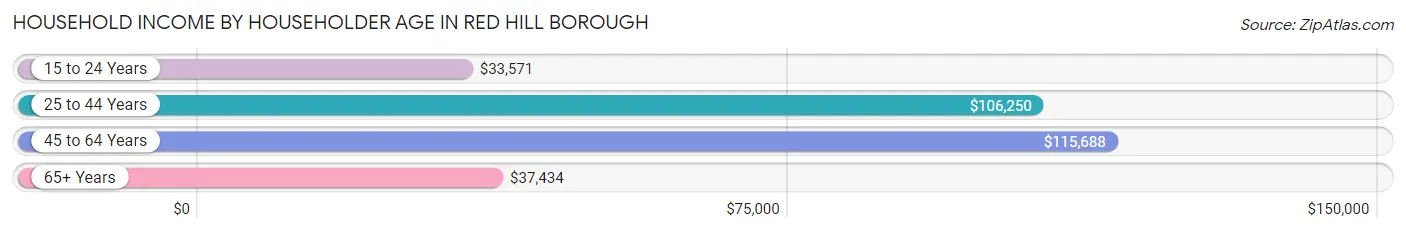
Household Income by Householder Age in Red Hill borough
The median household income in Red Hill borough is $75,188, with the highest median household income of $115,688 found in the 45 to 64 years age bracket for the primary householder. A total of 376 households (33.5%) fall into this category. Meanwhile, the 15 to 24 years age bracket for the primary householder has the lowest median household income of $33,571, with 52 households (4.6%) in this group.
| Income Bracket | # Households | Median Income |
| 15 to 24 Years | 52 (4.6%) | $33,571 |
| 25 to 44 Years | 256 (22.8%) | $106,250 |
| 45 to 64 Years | 376 (33.5%) | $115,688 |
| 65+ Years | 437 (39.0%) | $37,434 |
| Total | 1,121 (100.0%) | $75,188 |
Poverty in Red Hill borough
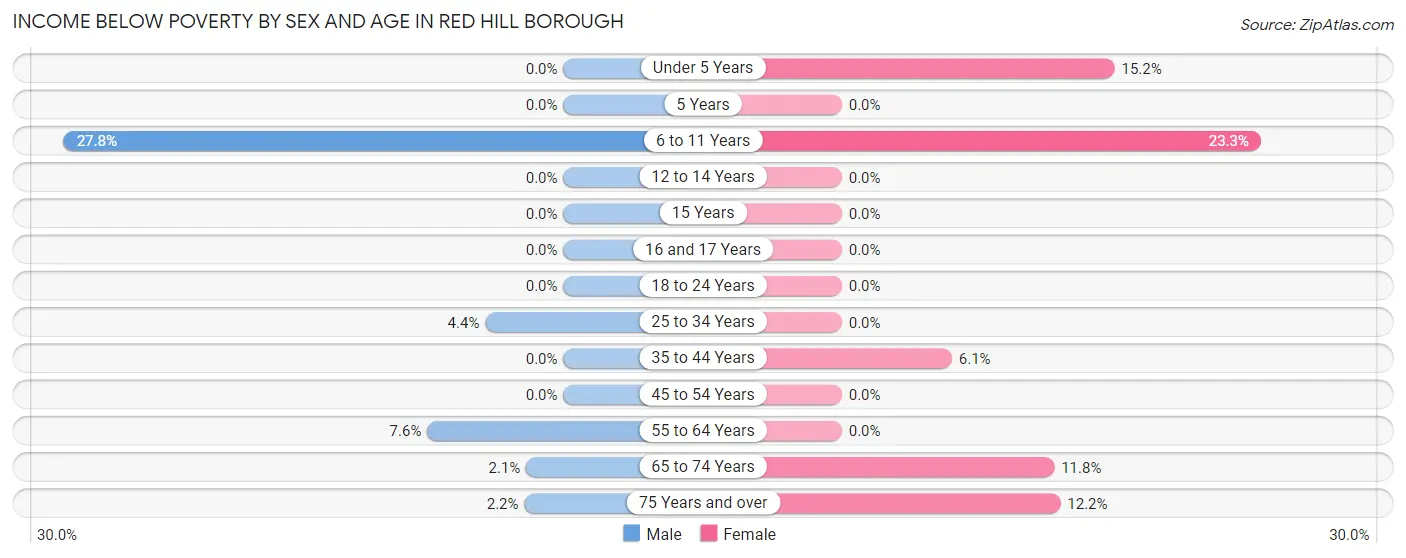
Income Below Poverty by Sex and Age in Red Hill borough
With 4.4% poverty level for males and 7.1% for females among the residents of Red Hill borough, 6 to 11 year old males and 6 to 11 year old females are the most vulnerable to poverty, with 37 males (27.8%) and 28 females (23.3%) in their respective age groups living below the poverty level.
| Age Bracket | Male | Female |
| Under 5 Years | 0 (0.0%) | 12 (15.2%) |
| 5 Years | 0 (0.0%) | 0 (0.0%) |
| 6 to 11 Years | 37 (27.8%) | 28 (23.3%) |
| 12 to 14 Years | 0 (0.0%) | 0 (0.0%) |
| 15 Years | 0 (0.0%) | 0 (0.0%) |
| 16 and 17 Years | 0 (0.0%) | 0 (0.0%) |
| 18 to 24 Years | 0 (0.0%) | 0 (0.0%) |
| 25 to 34 Years | 6 (4.3%) | 0 (0.0%) |
| 35 to 44 Years | 0 (0.0%) | 10 (6.1%) |
| 45 to 54 Years | 0 (0.0%) | 0 (0.0%) |
| 55 to 64 Years | 10 (7.6%) | 0 (0.0%) |
| 65 to 74 Years | 3 (2.1%) | 22 (11.8%) |
| 75 Years and over | 2 (2.2%) | 23 (12.2%) |
| Total | 58 (4.4%) | 95 (7.1%) |
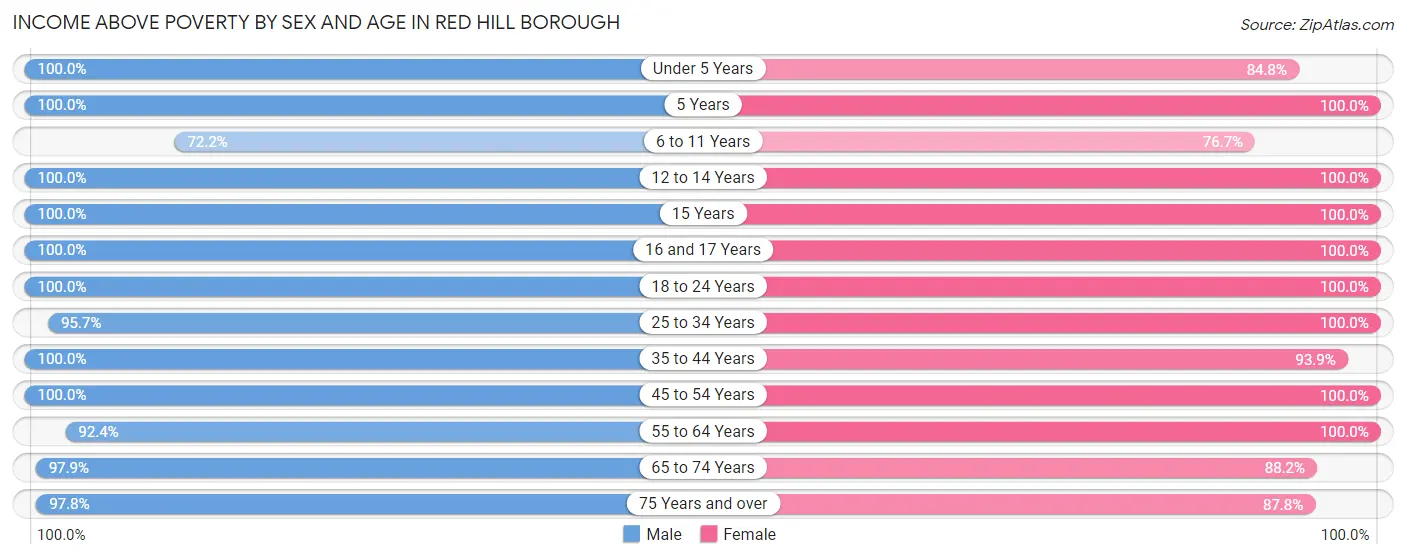
Income Above Poverty by Sex and Age in Red Hill borough
According to the poverty statistics in Red Hill borough, males aged under 5 years and females aged 5 years are the age groups that are most secure financially, with 100.0% of males and 100.0% of females in these age groups living above the poverty line.
| Age Bracket | Male | Female |
| Under 5 Years | 31 (100.0%) | 67 (84.8%) |
| 5 Years | 2 (100.0%) | 6 (100.0%) |
| 6 to 11 Years | 96 (72.2%) | 92 (76.7%) |
| 12 to 14 Years | 63 (100.0%) | 44 (100.0%) |
| 15 Years | 19 (100.0%) | 20 (100.0%) |
| 16 and 17 Years | 27 (100.0%) | 36 (100.0%) |
| 18 to 24 Years | 162 (100.0%) | 72 (100.0%) |
| 25 to 34 Years | 132 (95.7%) | 120 (100.0%) |
| 35 to 44 Years | 160 (100.0%) | 153 (93.9%) |
| 45 to 54 Years | 223 (100.0%) | 148 (100.0%) |
| 55 to 64 Years | 122 (92.4%) | 149 (100.0%) |
| 65 to 74 Years | 142 (97.9%) | 164 (88.2%) |
| 75 Years and over | 90 (97.8%) | 166 (87.8%) |
| Total | 1,269 (95.6%) | 1,237 (92.9%) |
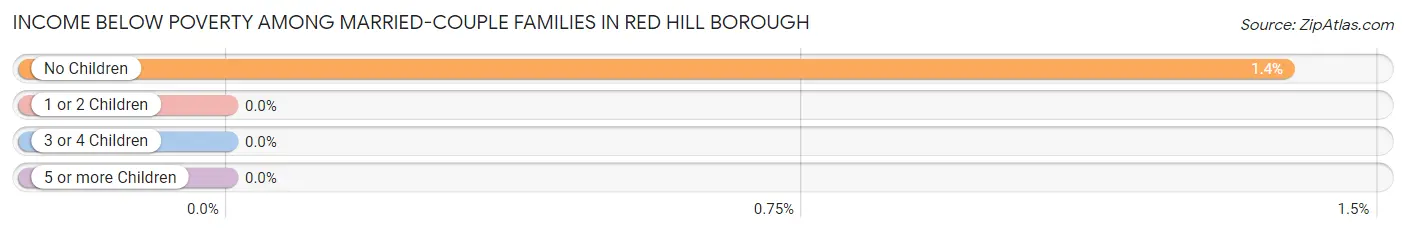
Income Below Poverty Among Married-Couple Families in Red Hill borough
The poverty statistics for married-couple families in Red Hill borough show that 0.8% or 4 of the total 505 families live below the poverty line. Families with no children have the highest poverty rate of 1.4%, comprising of 4 families. On the other hand, families with 1 or 2 children have the lowest poverty rate of 0.0%, which includes 0 families.
| Children | Above Poverty | Below Poverty |
| No Children | 285 (98.6%) | 4 (1.4%) |
| 1 or 2 Children | 172 (100.0%) | 0 (0.0%) |
| 3 or 4 Children | 41 (100.0%) | 0 (0.0%) |
| 5 or more Children | 3 (100.0%) | 0 (0.0%) |
| Total | 501 (99.2%) | 4 (0.8%) |
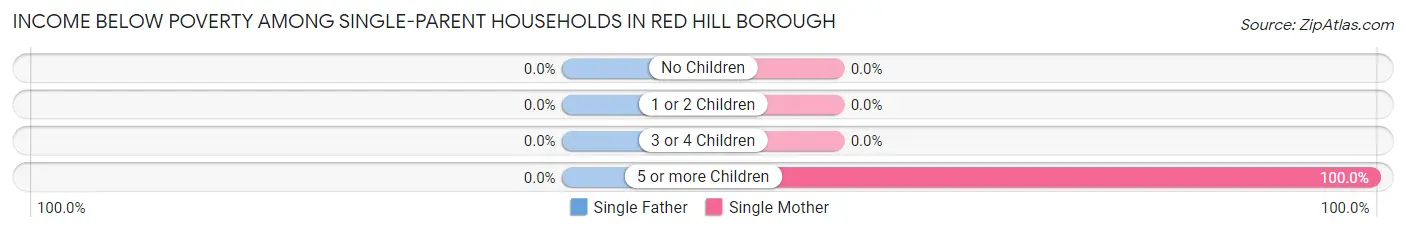
Income Below Poverty Among Single-Parent Households in Red Hill borough
| Children | Single Father | Single Mother |
| No Children | 0 (0.0%) | 0 (0.0%) |
| 1 or 2 Children | 0 (0.0%) | 0 (0.0%) |
| 3 or 4 Children | 0 (0.0%) | 0 (0.0%) |
| 5 or more Children | 0 (0.0%) | 9 (100.0%) |
| Total | 0 (0.0%) | 9 (14.5%) |
Income Below Poverty Among Married-Couple vs Single-Parent Households in Red Hill borough
The poverty data for Red Hill borough shows that 4 of the married-couple family households (0.8%) and 9 of the single-parent households (7.1%) are living below the poverty level. Within the married-couple family households, those with no children have the highest poverty rate, with 4 households (1.4%) falling below the poverty line. Among the single-parent households, those with 5 or more children have the highest poverty rate, with 9 household (100.0%) living below poverty.
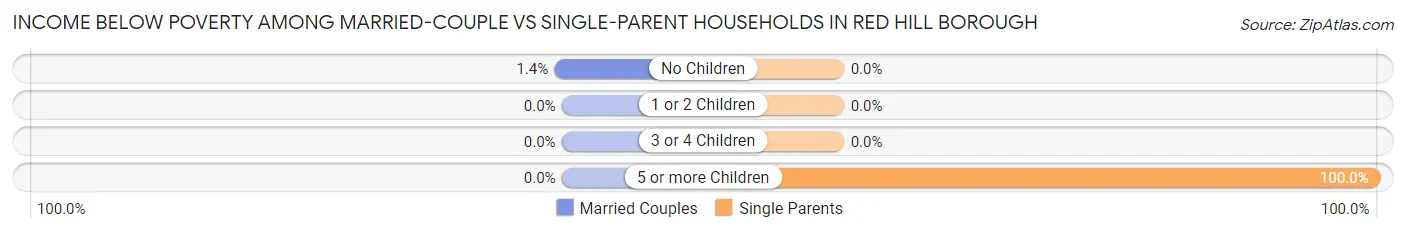
| Children | Married-Couple Families | Single-Parent Households |
| No Children | 4 (1.4%) | 0 (0.0%) |
| 1 or 2 Children | 0 (0.0%) | 0 (0.0%) |
| 3 or 4 Children | 0 (0.0%) | 0 (0.0%) |
| 5 or more Children | 0 (0.0%) | 9 (100.0%) |
| Total | 4 (0.8%) | 9 (7.1%) |
Race in Red Hill borough
The most populous races in Red Hill borough are White / Caucasian (2,287 | 85.9%), Black / African American (201 | 7.5%), and Hispanic or Latino (183 | 6.9%).
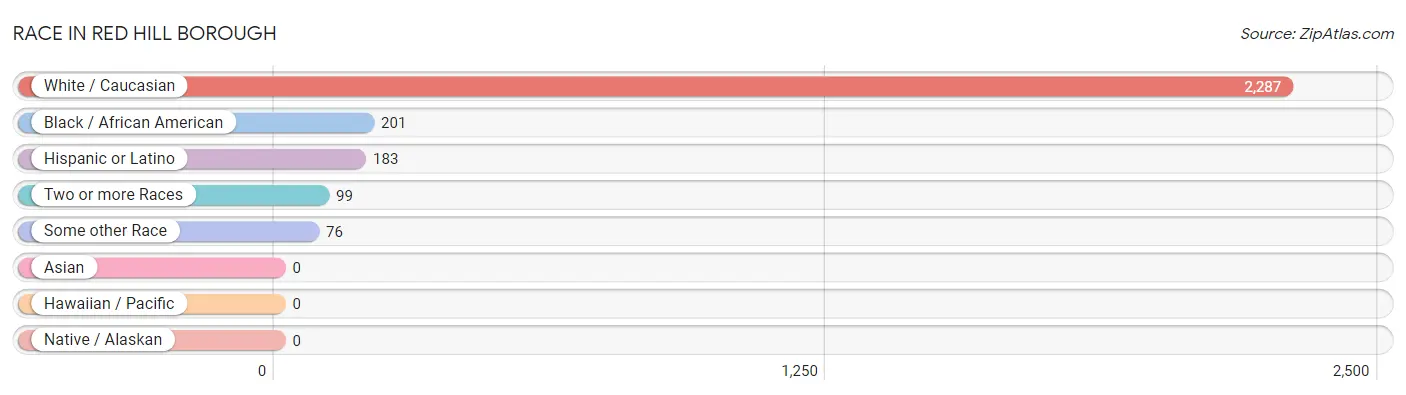
| Race | # Population | % Population |
| Asian | 0 | 0.0% |
| Black / African American | 201 | 7.5% |
| Hawaiian / Pacific | 0 | 0.0% |
| Hispanic or Latino | 183 | 6.9% |
| Native / Alaskan | 0 | 0.0% |
| White / Caucasian | 2,287 | 85.9% |
| Two or more Races | 99 | 3.7% |
| Some other Race | 76 | 2.9% |
| Total | 2,663 | 100.0% |
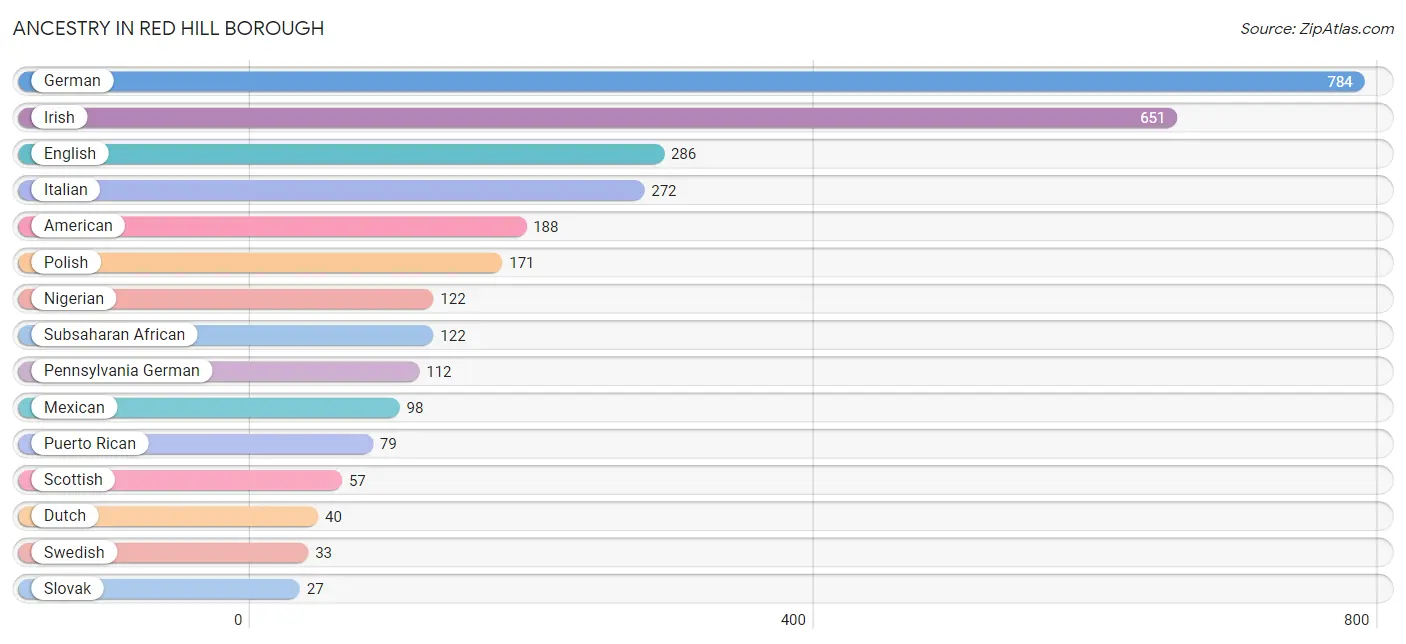
Ancestry in Red Hill borough
The most populous ancestries reported in Red Hill borough are German (784 | 29.4%), Irish (651 | 24.4%), English (286 | 10.7%), Italian (272 | 10.2%), and American (188 | 7.1%), together accounting for 81.9% of all Red Hill borough residents.
| Ancestry | # Population | % Population |
| American | 188 | 7.1% |
| Arab | 10 | 0.4% |
| Bhutanese | 6 | 0.2% |
| British | 6 | 0.2% |
| Central American | 6 | 0.2% |
| Cherokee | 8 | 0.3% |
| Czechoslovakian | 12 | 0.4% |
| Dutch | 40 | 1.5% |
| Eastern European | 13 | 0.5% |
| English | 286 | 10.7% |
| European | 4 | 0.2% |
| Finnish | 20 | 0.7% |
| French | 23 | 0.9% |
| French Canadian | 5 | 0.2% |
| German | 784 | 29.4% |
| Hungarian | 14 | 0.5% |
| Iraqi | 10 | 0.4% |
| Irish | 651 | 24.4% |
| Italian | 272 | 10.2% |
| Lithuanian | 5 | 0.2% |
| Mexican | 98 | 3.7% |
| Nigerian | 122 | 4.6% |
| Northern European | 4 | 0.2% |
| Pennsylvania German | 112 | 4.2% |
| Polish | 171 | 6.4% |
| Potawatomi | 6 | 0.2% |
| Puerto Rican | 79 | 3.0% |
| Salvadoran | 6 | 0.2% |
| Scandinavian | 14 | 0.5% |
| Scotch-Irish | 8 | 0.3% |
| Scottish | 57 | 2.1% |
| Slavic | 14 | 0.5% |
| Slovak | 27 | 1.0% |
| Subsaharan African | 122 | 4.6% |
| Swedish | 33 | 1.2% |
| Welsh | 14 | 0.5% | View All 36 Rows |
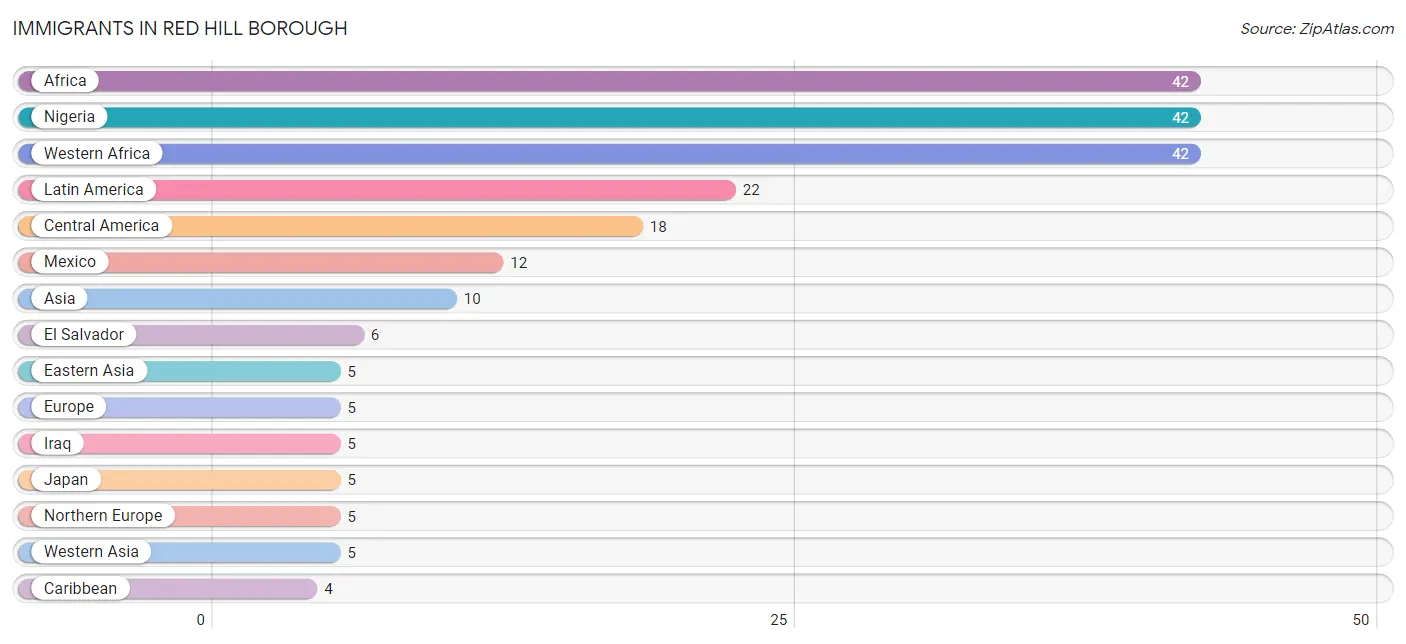
Immigrants in Red Hill borough
The most numerous immigrant groups reported in Red Hill borough came from Africa (42 | 1.6%), Nigeria (42 | 1.6%), Western Africa (42 | 1.6%), Latin America (22 | 0.8%), and Central America (18 | 0.7%), together accounting for 6.2% of all Red Hill borough residents.
| Immigration Origin | # Population | % Population |
| Africa | 42 | 1.6% |
| Asia | 10 | 0.4% |
| Caribbean | 4 | 0.2% |
| Central America | 18 | 0.7% |
| Eastern Asia | 5 | 0.2% |
| El Salvador | 6 | 0.2% |
| Europe | 5 | 0.2% |
| Iraq | 5 | 0.2% |
| Jamaica | 4 | 0.2% |
| Japan | 5 | 0.2% |
| Latin America | 22 | 0.8% |
| Mexico | 12 | 0.4% |
| Nigeria | 42 | 1.6% |
| Northern Europe | 5 | 0.2% |
| Western Africa | 42 | 1.6% |
| Western Asia | 5 | 0.2% | View All 16 Rows |
Sex and Age in Red Hill borough
Sex and Age in Red Hill borough
The most populous age groups in Red Hill borough are 15 to 19 Years (132 | 10.0%) for men and 40 to 44 Years (112 | 8.4%) for women.
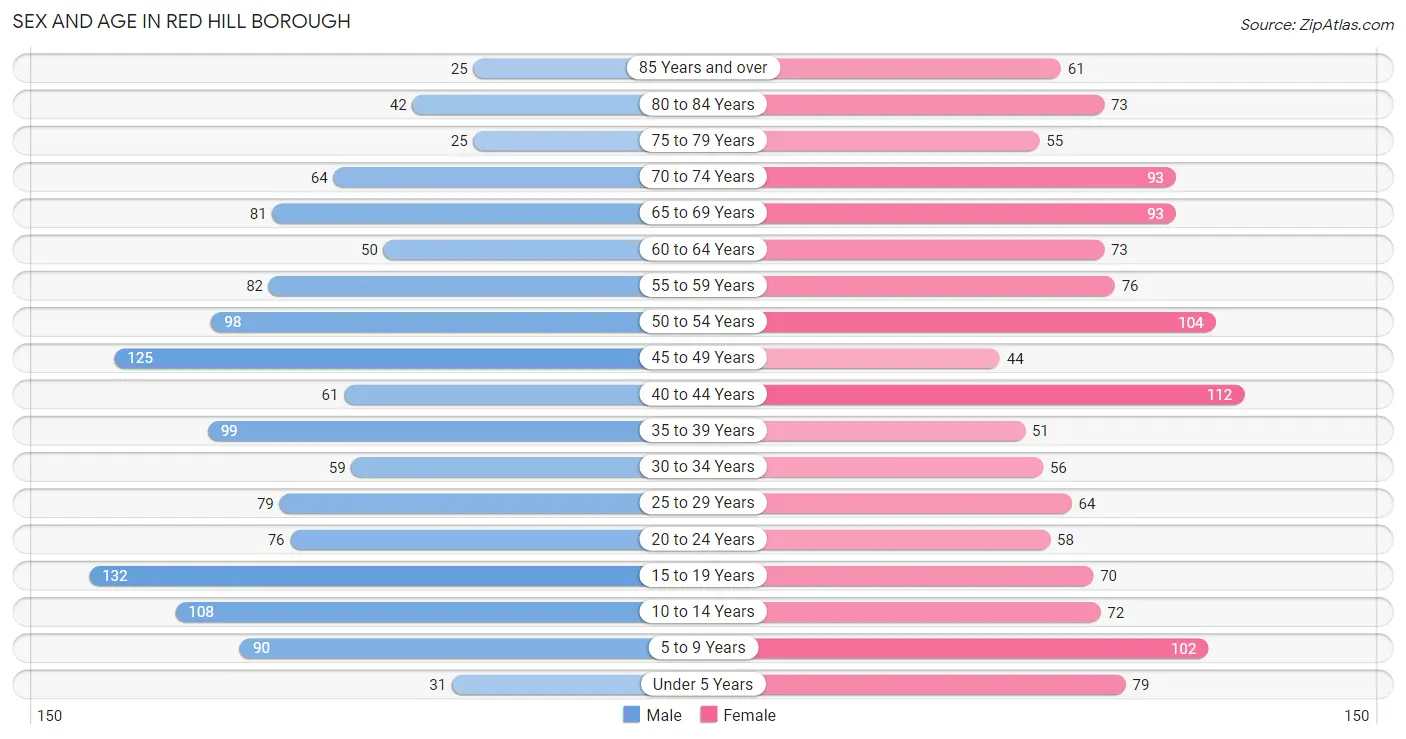
| Age Bracket | Male | Female |
| Under 5 Years | 31 (2.3%) | 79 (5.9%) |
| 5 to 9 Years | 90 (6.8%) | 102 (7.6%) |
| 10 to 14 Years | 108 (8.1%) | 72 (5.4%) |
| 15 to 19 Years | 132 (10.0%) | 70 (5.2%) |
| 20 to 24 Years | 76 (5.7%) | 58 (4.3%) |
| 25 to 29 Years | 79 (5.9%) | 64 (4.8%) |
| 30 to 34 Years | 59 (4.4%) | 56 (4.2%) |
| 35 to 39 Years | 99 (7.5%) | 51 (3.8%) |
| 40 to 44 Years | 61 (4.6%) | 112 (8.4%) |
| 45 to 49 Years | 125 (9.4%) | 44 (3.3%) |
| 50 to 54 Years | 98 (7.4%) | 104 (7.8%) |
| 55 to 59 Years | 82 (6.2%) | 76 (5.7%) |
| 60 to 64 Years | 50 (3.8%) | 73 (5.5%) |
| 65 to 69 Years | 81 (6.1%) | 93 (7.0%) |
| 70 to 74 Years | 64 (4.8%) | 93 (7.0%) |
| 75 to 79 Years | 25 (1.9%) | 55 (4.1%) |
| 80 to 84 Years | 42 (3.2%) | 73 (5.5%) |
| 85 Years and over | 25 (1.9%) | 61 (4.6%) |
| Total | 1,327 (100.0%) | 1,336 (100.0%) |
Families and Households in Red Hill borough
Median Family Size in Red Hill borough
The median family size in Red Hill borough is 3.29 persons per family, with single female/mother families (62 | 9.8%) accounting for the largest median family size of 4.73 persons per family. On the other hand, single male/father families (65 | 10.3%) represent the smallest median family size with 2.31 persons per family.
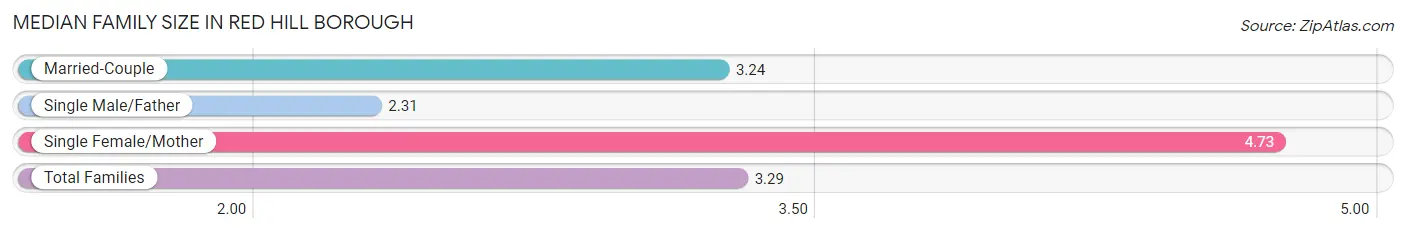
| Family Type | # Families | Family Size |
| Married-Couple | 505 (79.9%) | 3.24 |
| Single Male/Father | 65 (10.3%) | 2.31 |
| Single Female/Mother | 62 (9.8%) | 4.73 |
| Total Families | 632 (100.0%) | 3.29 |
Median Household Size in Red Hill borough
The median household size in Red Hill borough is 2.37 persons per household, with single female/mother households (62 | 5.5%) accounting for the largest median household size of 4.98 persons per household. non-family households (489 | 43.6%) represent the smallest median household size with 1.12 persons per household.
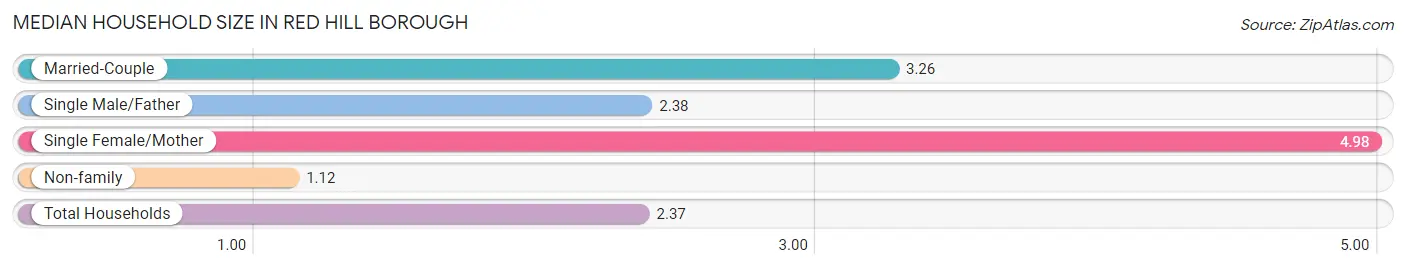
| Household Type | # Households | Household Size |
| Married-Couple | 505 (45.1%) | 3.26 |
| Single Male/Father | 65 (5.8%) | 2.38 |
| Single Female/Mother | 62 (5.5%) | 4.98 |
| Non-family | 489 (43.6%) | 1.12 |
| Total Households | 1,121 (100.0%) | 2.37 |
Household Size by Marriage Status in Red Hill borough
Out of a total of 1,121 households in Red Hill borough, 632 (56.4%) are family households, while 489 (43.6%) are nonfamily households. The most numerous type of family households are 2-person households, comprising 244, and the most common type of nonfamily households are 1-person households, comprising 432.
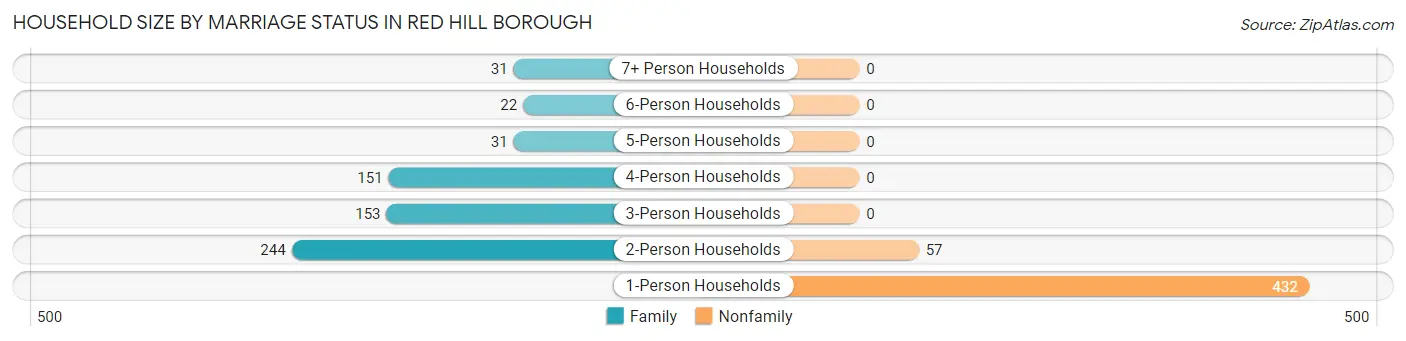
| Household Size | Family Households | Nonfamily Households |
| 1-Person Households | - | 432 (38.5%) |
| 2-Person Households | 244 (21.8%) | 57 (5.1%) |
| 3-Person Households | 153 (13.7%) | 0 (0.0%) |
| 4-Person Households | 151 (13.5%) | 0 (0.0%) |
| 5-Person Households | 31 (2.8%) | 0 (0.0%) |
| 6-Person Households | 22 (2.0%) | 0 (0.0%) |
| 7+ Person Households | 31 (2.8%) | 0 (0.0%) |
| Total | 632 (56.4%) | 489 (43.6%) |
Female Fertility in Red Hill borough
Fertility by Age in Red Hill borough
| Age Bracket | Women with Births | Births / 1,000 Women |
| 15 to 19 years | 0 (0.0%) | 0.0 |
| 20 to 34 years | 0 (0.0%) | 0.0 |
| 35 to 50 years | 0 (0.0%) | 0.0 |
| Total | 0 (0.0%) | 0.0 |
Fertility by Age by Marriage Status in Red Hill borough
| Age Bracket | Married | Unmarried |
| 15 to 19 years | 0 (0.0%) | 0 (0.0%) |
| 20 to 34 years | 0 (0.0%) | 0 (0.0%) |
| 35 to 50 years | 0 (0.0%) | 0 (0.0%) |
| Total | 0 (0.0%) | 0 (0.0%) |
Fertility by Education in Red Hill borough
| Educational Attainment | Women with Births | Births / 1,000 Women |
| Less than High School | 0 (0.0%) | 0.0 |
| High School Diploma | 0 (0.0%) | 0.0 |
| College or Associate's Degree | 0 (0.0%) | 0.0 |
| Bachelor's Degree | 0 (0.0%) | 0.0 |
| Graduate Degree | 0 (0.0%) | 0.0 |
| Total | 0 (0.0%) | 0.0 |
Fertility by Education by Marriage Status in Red Hill borough
| Educational Attainment | Married | Unmarried |
| Less than High School | 0 (0.0%) | 0 (0.0%) |
| High School Diploma | 0 (0.0%) | 0 (0.0%) |
| College or Associate's Degree | 0 (0.0%) | 0 (0.0%) |
| Bachelor's Degree | 0 (0.0%) | 0 (0.0%) |
| Graduate Degree | 0 (0.0%) | 0 (0.0%) |
| Total | 0 (0.0%) | 0 (0.0%) |
Employment Characteristics in Red Hill borough
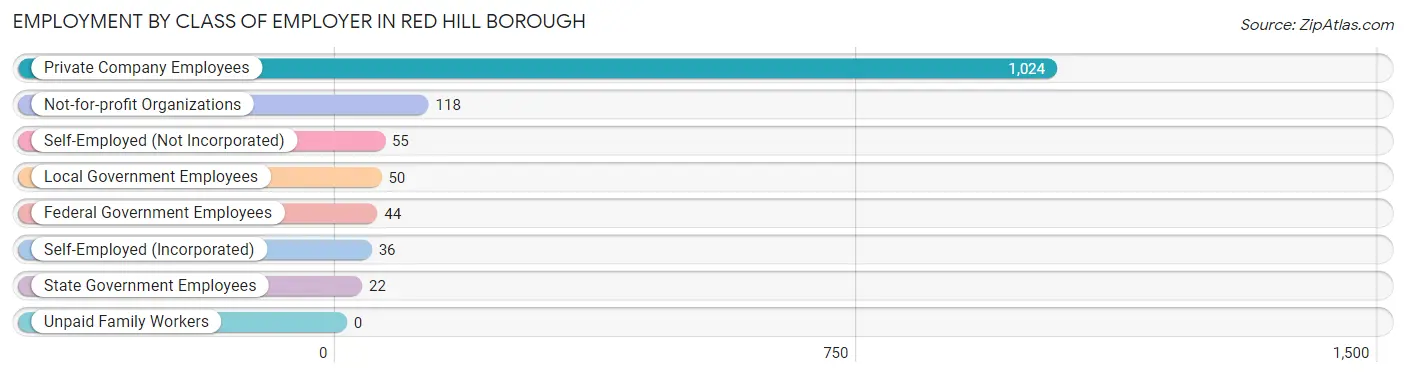
Employment by Class of Employer in Red Hill borough
Among the 1,349 employed individuals in Red Hill borough, private company employees (1,024 | 75.9%), not-for-profit organizations (118 | 8.7%), and self-employed (not incorporated) (55 | 4.1%) make up the most common classes of employment.
| Employer Class | # Employees | % Employees |
| Private Company Employees | 1,024 | 75.9% |
| Self-Employed (Incorporated) | 36 | 2.7% |
| Self-Employed (Not Incorporated) | 55 | 4.1% |
| Not-for-profit Organizations | 118 | 8.7% |
| Local Government Employees | 50 | 3.7% |
| State Government Employees | 22 | 1.6% |
| Federal Government Employees | 44 | 3.3% |
| Unpaid Family Workers | 0 | 0.0% |
| Total | 1,349 | 100.0% |
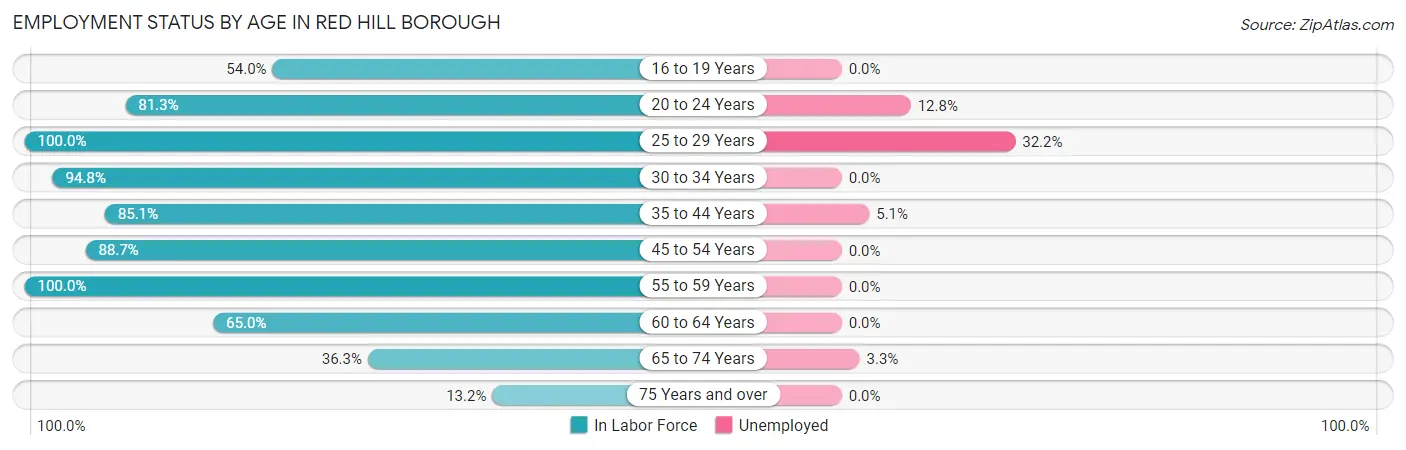
Employment Status by Age in Red Hill borough
According to the labor force statistics for Red Hill borough, out of the total population over 16 years of age (2,142), 67.6% or 1,448 individuals are in the labor force, with 5.4% or 78 of them unemployed. The age group with the highest labor force participation rate is 25 to 29 years, with 100.0% or 143 individuals in the labor force. Within the labor force, the 25 to 29 years age range has the highest percentage of unemployed individuals, with 32.2% or 46 of them being unemployed.
| Age Bracket | In Labor Force | Unemployed |
| 16 to 19 Years | 88 (54.0%) | 0 (0.0%) |
| 20 to 24 Years | 109 (81.3%) | 14 (12.8%) |
| 25 to 29 Years | 143 (100.0%) | 46 (32.2%) |
| 30 to 34 Years | 109 (94.8%) | 0 (0.0%) |
| 35 to 44 Years | 275 (85.1%) | 14 (5.1%) |
| 45 to 54 Years | 329 (88.7%) | 0 (0.0%) |
| 55 to 59 Years | 158 (100.0%) | 0 (0.0%) |
| 60 to 64 Years | 80 (65.0%) | 0 (0.0%) |
| 65 to 74 Years | 120 (36.3%) | 4 (3.3%) |
| 75 Years and over | 37 (13.2%) | 0 (0.0%) |
| Total | 1,448 (67.6%) | 78 (5.4%) |
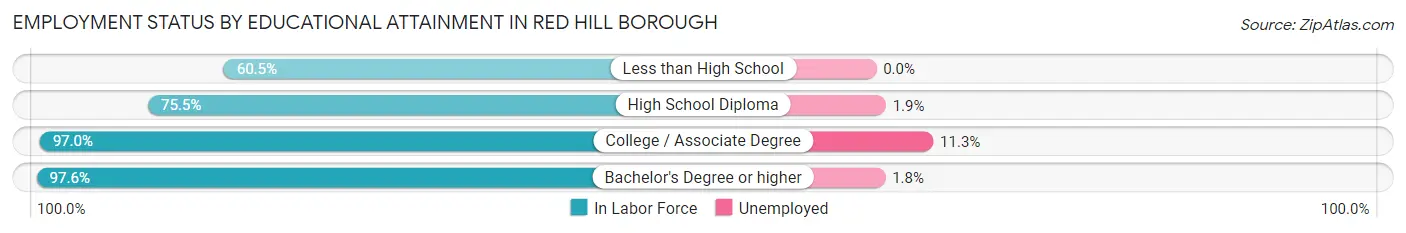
Employment Status by Educational Attainment in Red Hill borough
According to labor force statistics for Red Hill borough, 88.7% of individuals (1,094) out of the total population between 25 and 64 years of age (1,233) are in the labor force, with 5.5% or 60 of them being unemployed. The group with the highest labor force participation rate are those with the educational attainment of bachelor's degree or higher, with 97.6% or 329 individuals in the labor force. Within the labor force, individuals with college / associate degree education have the highest percentage of unemployment, with 11.3% or 48 of them being unemployed.
| Educational Attainment | In Labor Force | Unemployed |
| Less than High School | 23 (60.5%) | 0 (0.0%) |
| High School Diploma | 318 (75.5%) | 8 (1.9%) |
| College / Associate Degree | 424 (97.0%) | 49 (11.3%) |
| Bachelor's Degree or higher | 329 (97.6%) | 6 (1.8%) |
| Total | 1,094 (88.7%) | 68 (5.5%) |
Employment Occupations by Sex in Red Hill borough
Management, Business, Science and Arts Occupations
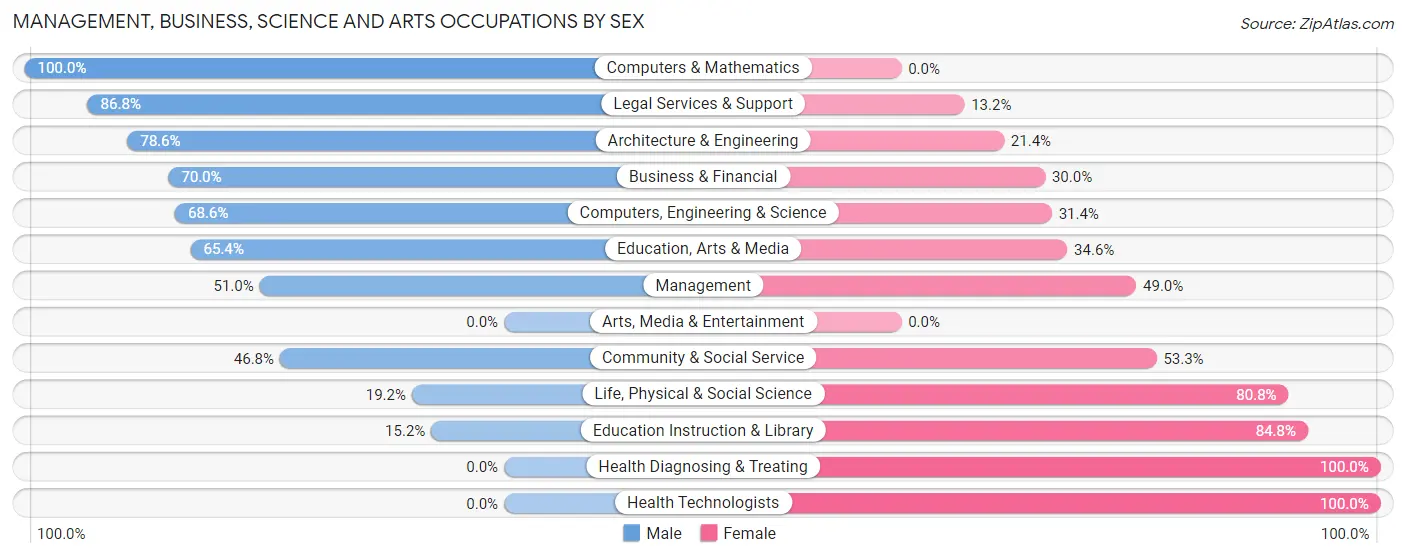
The most common Management, Business, Science and Arts occupations in Red Hill borough are Management (202 | 14.7%), Community & Social Service (169 | 12.3%), Computers, Engineering & Science (86 | 6.3%), Education Instruction & Library (79 | 5.8%), and Health Diagnosing & Treating (60 | 4.4%).
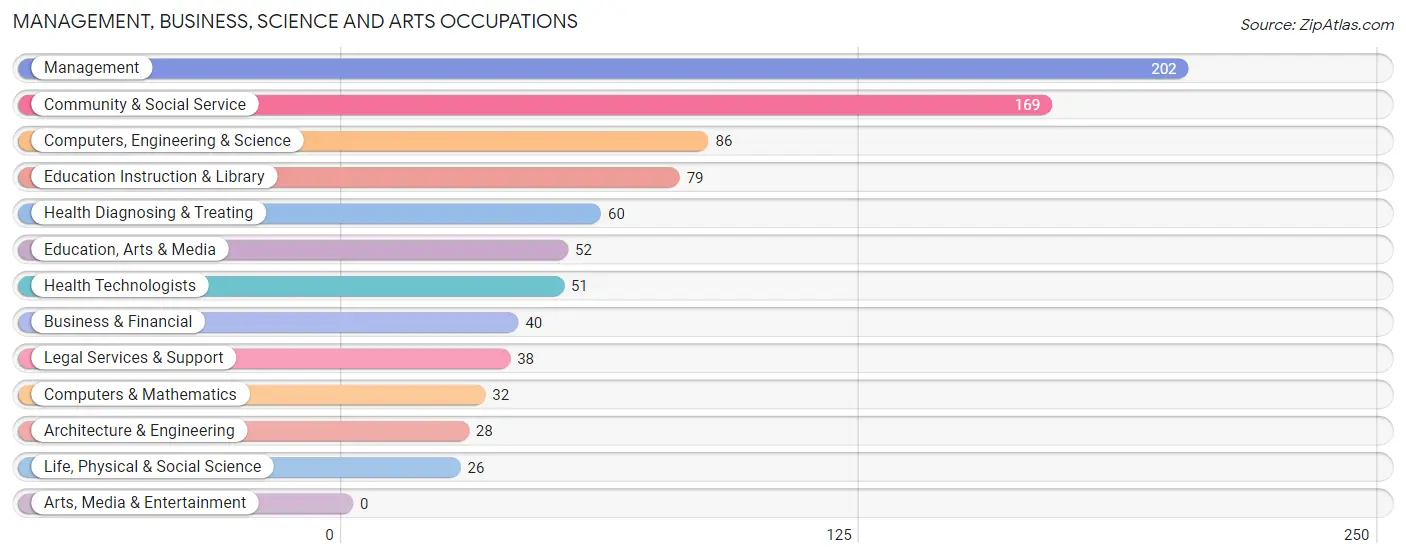
Management, Business, Science and Arts Occupations by Sex
Within the Management, Business, Science and Arts occupations in Red Hill borough, the most male-oriented occupations are Computers & Mathematics (100.0%), Legal Services & Support (86.8%), and Architecture & Engineering (78.6%), while the most female-oriented occupations are Health Diagnosing & Treating (100.0%), Health Technologists (100.0%), and Education Instruction & Library (84.8%).
| Occupation | Male | Female |
| Management | 103 (51.0%) | 99 (49.0%) |
| Business & Financial | 28 (70.0%) | 12 (30.0%) |
| Computers, Engineering & Science | 59 (68.6%) | 27 (31.4%) |
| Computers & Mathematics | 32 (100.0%) | 0 (0.0%) |
| Architecture & Engineering | 22 (78.6%) | 6 (21.4%) |
| Life, Physical & Social Science | 5 (19.2%) | 21 (80.8%) |
| Community & Social Service | 79 (46.8%) | 90 (53.2%) |
| Education, Arts & Media | 34 (65.4%) | 18 (34.6%) |
| Legal Services & Support | 33 (86.8%) | 5 (13.2%) |
| Education Instruction & Library | 12 (15.2%) | 67 (84.8%) |
| Arts, Media & Entertainment | 0 (0.0%) | 0 (0.0%) |
| Health Diagnosing & Treating | 0 (0.0%) | 60 (100.0%) |
| Health Technologists | 0 (0.0%) | 51 (100.0%) |
| Total (Category) | 269 (48.3%) | 288 (51.7%) |
| Total (Overall) | 756 (55.2%) | 614 (44.8%) |
Services Occupations
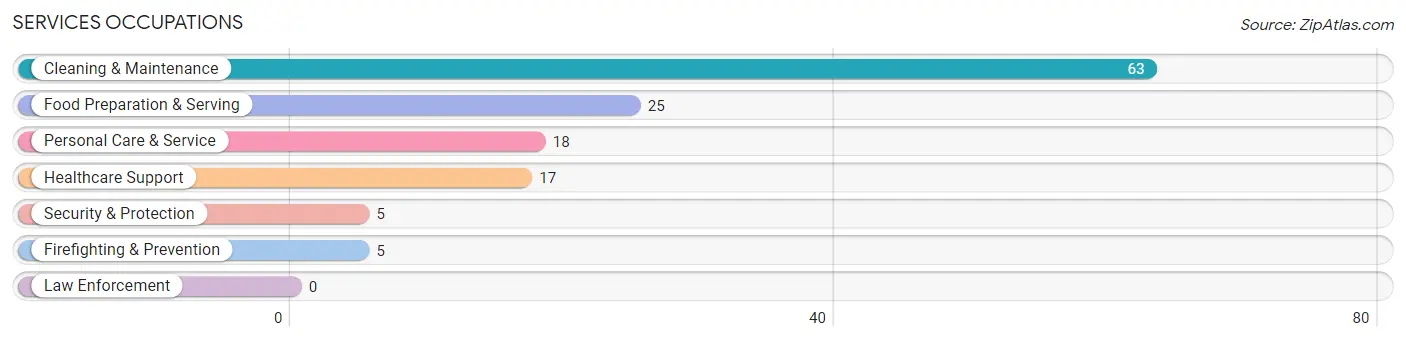
The most common Services occupations in Red Hill borough are Cleaning & Maintenance (63 | 4.6%), Food Preparation & Serving (25 | 1.8%), Personal Care & Service (18 | 1.3%), Healthcare Support (17 | 1.2%), and Security & Protection (5 | 0.4%).
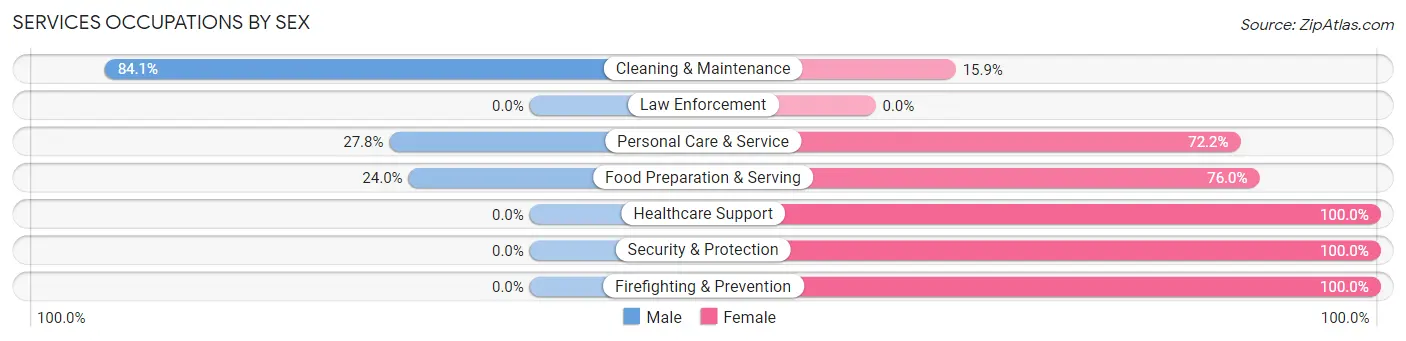
Services Occupations by Sex
Within the Services occupations in Red Hill borough, the most male-oriented occupations are Cleaning & Maintenance (84.1%), Personal Care & Service (27.8%), and Food Preparation & Serving (24.0%), while the most female-oriented occupations are Healthcare Support (100.0%), Security & Protection (100.0%), and Firefighting & Prevention (100.0%).
| Occupation | Male | Female |
| Healthcare Support | 0 (0.0%) | 17 (100.0%) |
| Security & Protection | 0 (0.0%) | 5 (100.0%) |
| Firefighting & Prevention | 0 (0.0%) | 5 (100.0%) |
| Law Enforcement | 0 (0.0%) | 0 (0.0%) |
| Food Preparation & Serving | 6 (24.0%) | 19 (76.0%) |
| Cleaning & Maintenance | 53 (84.1%) | 10 (15.9%) |
| Personal Care & Service | 5 (27.8%) | 13 (72.2%) |
| Total (Category) | 64 (50.0%) | 64 (50.0%) |
| Total (Overall) | 756 (55.2%) | 614 (44.8%) |
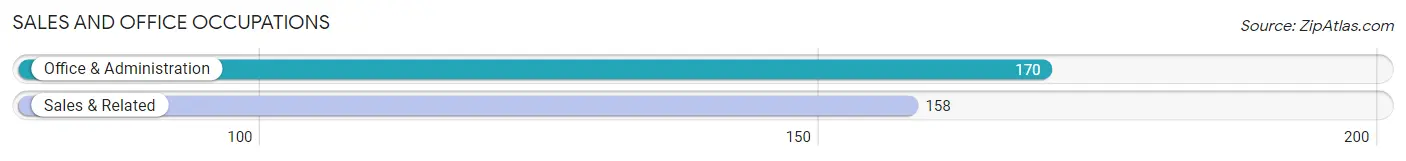
Sales and Office Occupations
The most common Sales and Office occupations in Red Hill borough are Office & Administration (170 | 12.4%), and Sales & Related (158 | 11.5%).
Sales and Office Occupations by Sex
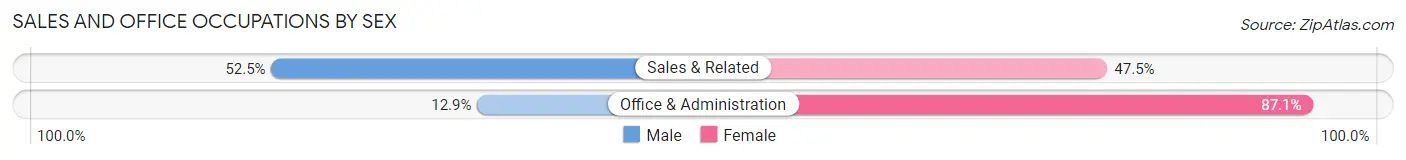
| Occupation | Male | Female |
| Sales & Related | 83 (52.5%) | 75 (47.5%) |
| Office & Administration | 22 (12.9%) | 148 (87.1%) |
| Total (Category) | 105 (32.0%) | 223 (68.0%) |
| Total (Overall) | 756 (55.2%) | 614 (44.8%) |
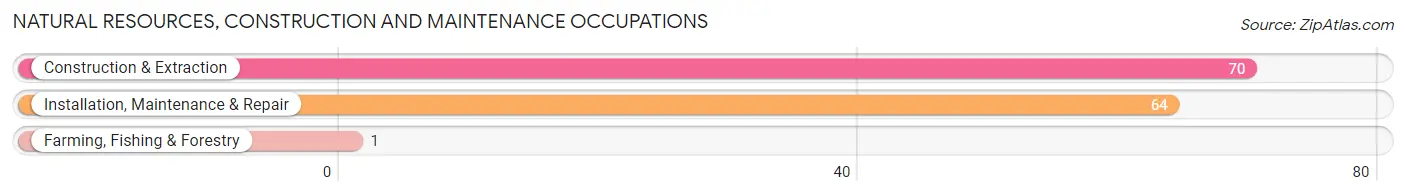
Natural Resources, Construction and Maintenance Occupations
The most common Natural Resources, Construction and Maintenance occupations in Red Hill borough are Construction & Extraction (70 | 5.1%), Installation, Maintenance & Repair (64 | 4.7%), and Farming, Fishing & Forestry (1 | 0.1%).
Natural Resources, Construction and Maintenance Occupations by Sex
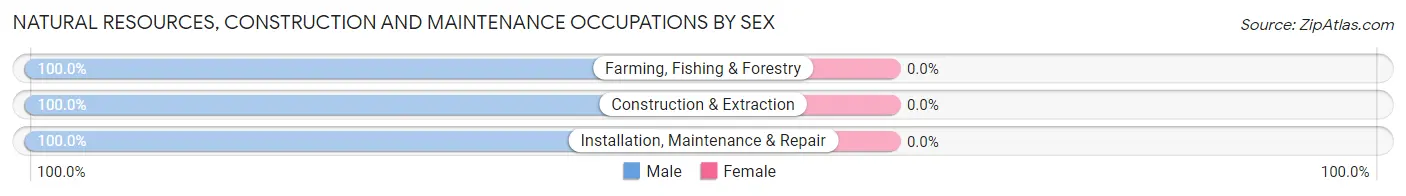
| Occupation | Male | Female |
| Farming, Fishing & Forestry | 1 (100.0%) | 0 (0.0%) |
| Construction & Extraction | 70 (100.0%) | 0 (0.0%) |
| Installation, Maintenance & Repair | 64 (100.0%) | 0 (0.0%) |
| Total (Category) | 135 (100.0%) | 0 (0.0%) |
| Total (Overall) | 756 (55.2%) | 614 (44.8%) |
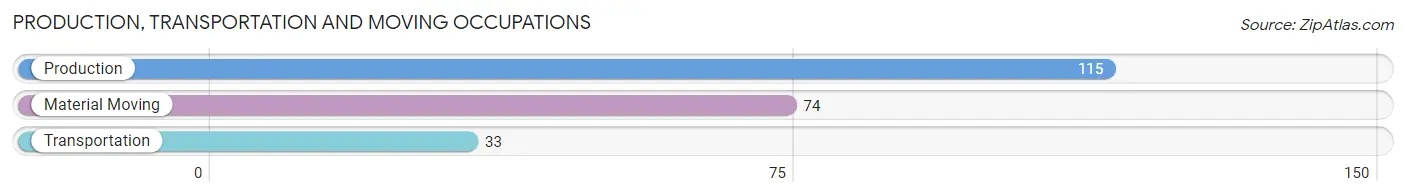
Production, Transportation and Moving Occupations
The most common Production, Transportation and Moving occupations in Red Hill borough are Production (115 | 8.4%), Material Moving (74 | 5.4%), and Transportation (33 | 2.4%).
Production, Transportation and Moving Occupations by Sex
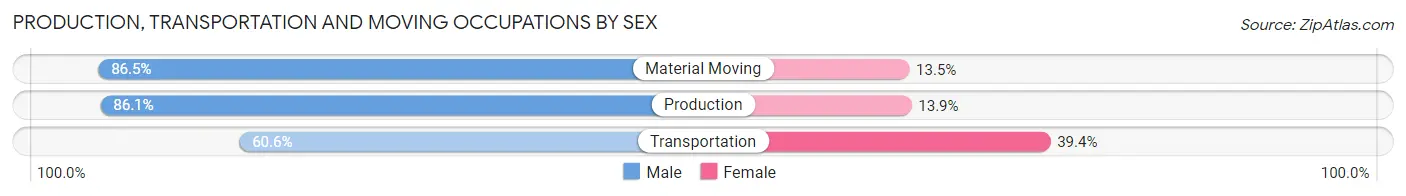
| Occupation | Male | Female |
| Production | 99 (86.1%) | 16 (13.9%) |
| Transportation | 20 (60.6%) | 13 (39.4%) |
| Material Moving | 64 (86.5%) | 10 (13.5%) |
| Total (Category) | 183 (82.4%) | 39 (17.6%) |
| Total (Overall) | 756 (55.2%) | 614 (44.8%) |
Employment Industries by Sex in Red Hill borough
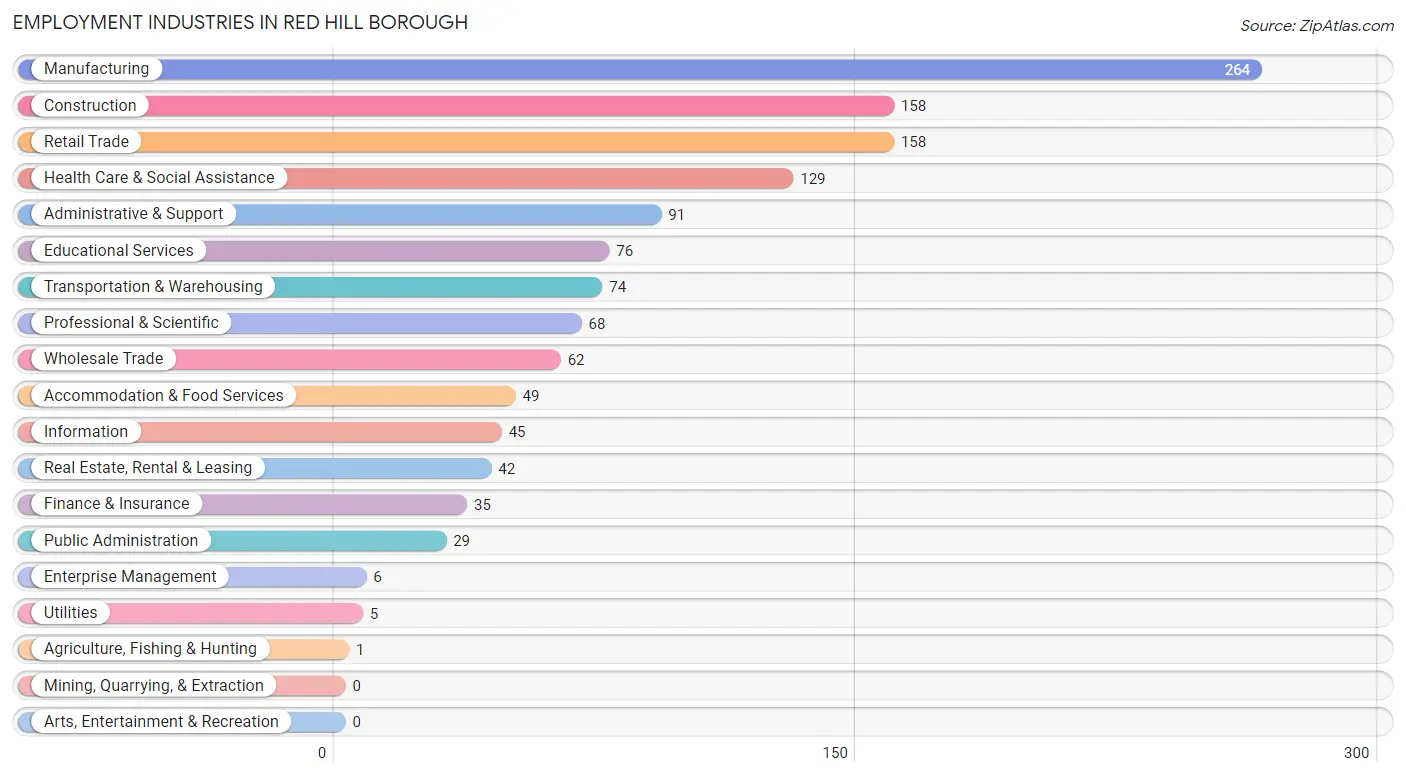
Employment Industries in Red Hill borough
The major employment industries in Red Hill borough include Manufacturing (264 | 19.3%), Construction (158 | 11.5%), Retail Trade (158 | 11.5%), Health Care & Social Assistance (129 | 9.4%), and Administrative & Support (91 | 6.6%).
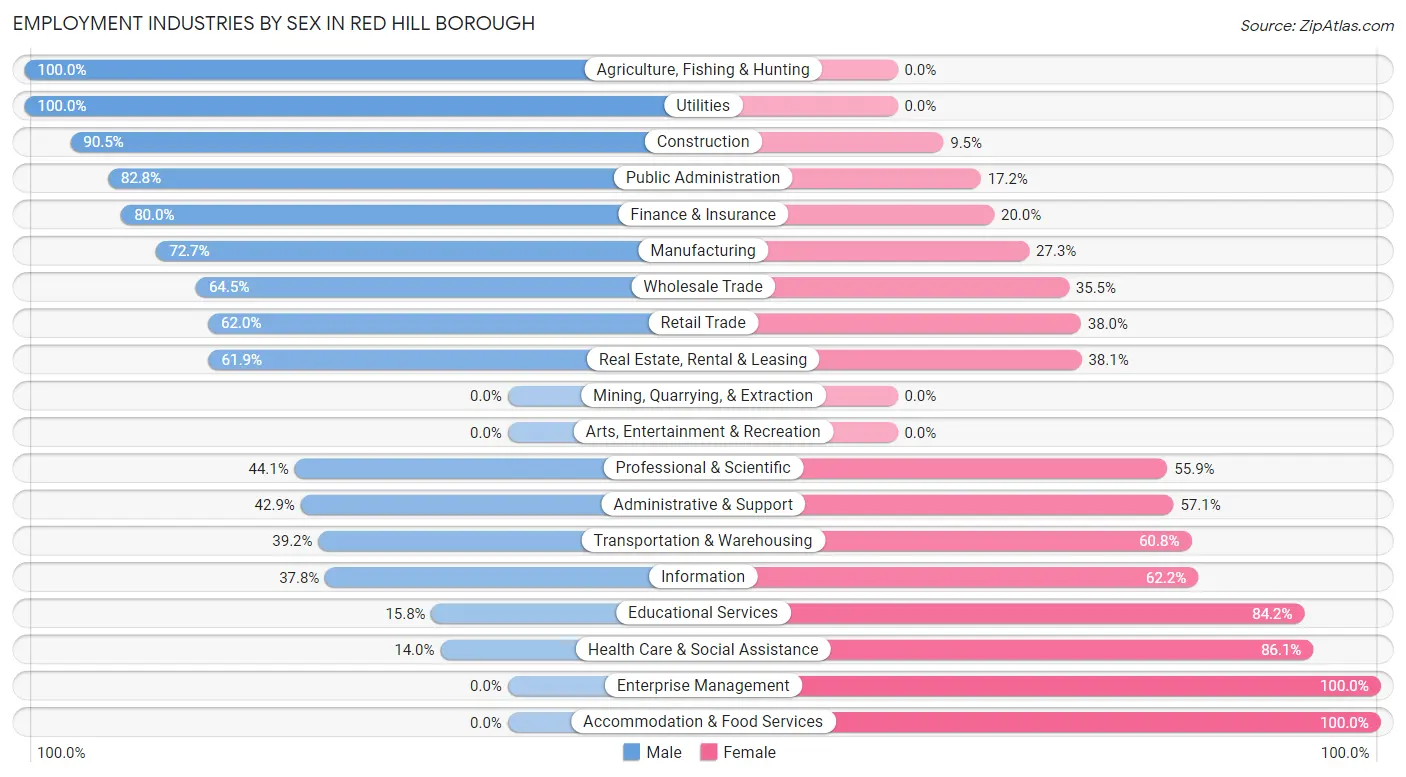
Employment Industries by Sex in Red Hill borough
The Red Hill borough industries that see more men than women are Agriculture, Fishing & Hunting (100.0%), Utilities (100.0%), and Construction (90.5%), whereas the industries that tend to have a higher number of women are Enterprise Management (100.0%), Accommodation & Food Services (100.0%), and Health Care & Social Assistance (86.1%).
| Industry | Male | Female |
| Agriculture, Fishing & Hunting | 1 (100.0%) | 0 (0.0%) |
| Mining, Quarrying, & Extraction | 0 (0.0%) | 0 (0.0%) |
| Construction | 143 (90.5%) | 15 (9.5%) |
| Manufacturing | 192 (72.7%) | 72 (27.3%) |
| Wholesale Trade | 40 (64.5%) | 22 (35.5%) |
| Retail Trade | 98 (62.0%) | 60 (38.0%) |
| Transportation & Warehousing | 29 (39.2%) | 45 (60.8%) |
| Utilities | 5 (100.0%) | 0 (0.0%) |
| Information | 17 (37.8%) | 28 (62.2%) |
| Finance & Insurance | 28 (80.0%) | 7 (20.0%) |
| Real Estate, Rental & Leasing | 26 (61.9%) | 16 (38.1%) |
| Professional & Scientific | 30 (44.1%) | 38 (55.9%) |
| Enterprise Management | 0 (0.0%) | 6 (100.0%) |
| Administrative & Support | 39 (42.9%) | 52 (57.1%) |
| Educational Services | 12 (15.8%) | 64 (84.2%) |
| Health Care & Social Assistance | 18 (14.0%) | 111 (86.1%) |
| Arts, Entertainment & Recreation | 0 (0.0%) | 0 (0.0%) |
| Accommodation & Food Services | 0 (0.0%) | 49 (100.0%) |
| Public Administration | 24 (82.8%) | 5 (17.2%) |
| Total | 756 (55.2%) | 614 (44.8%) |
Education in Red Hill borough
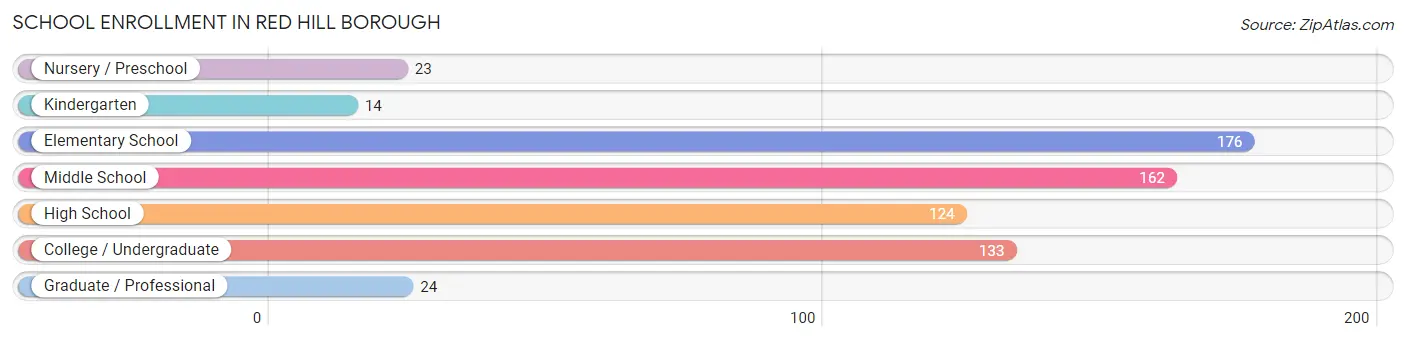
School Enrollment in Red Hill borough
The most common levels of schooling among the 656 students in Red Hill borough are elementary school (176 | 26.8%), middle school (162 | 24.7%), and college / undergraduate (133 | 20.3%).
| School Level | # Students | % Students |
| Nursery / Preschool | 23 | 3.5% |
| Kindergarten | 14 | 2.1% |
| Elementary School | 176 | 26.8% |
| Middle School | 162 | 24.7% |
| High School | 124 | 18.9% |
| College / Undergraduate | 133 | 20.3% |
| Graduate / Professional | 24 | 3.7% |
| Total | 656 | 100.0% |
School Enrollment by Age by Funding Source in Red Hill borough
Out of a total of 656 students who are enrolled in schools in Red Hill borough, 186 (28.4%) attend a private institution, while the remaining 470 (71.6%) are enrolled in public schools. The age group of 35 years and over has the highest likelihood of being enrolled in private schools, with 47 (90.4% in the age bracket) enrolled. Conversely, the age group of 10 to 14 year olds has the lowest likelihood of being enrolled in a private school, with 170 (94.4% in the age bracket) attending a public institution.
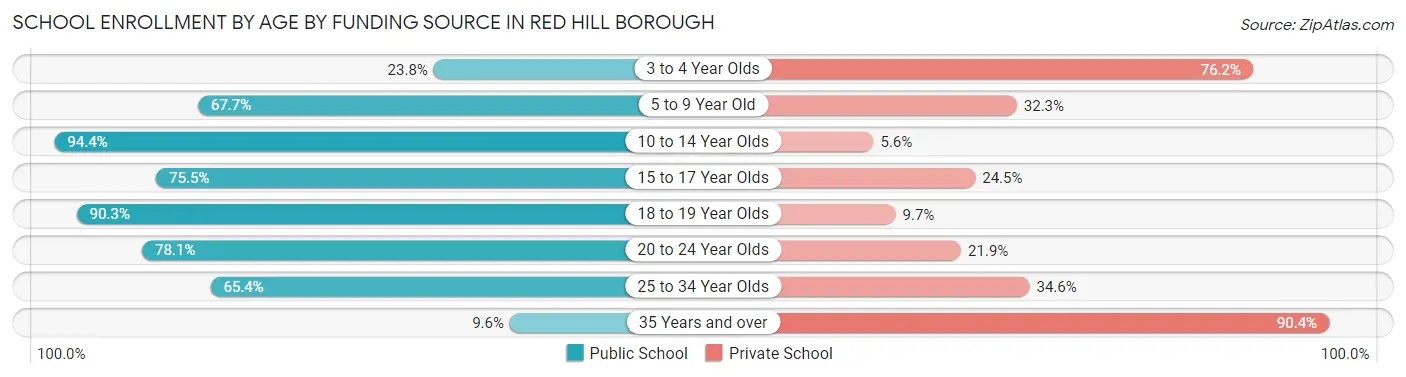
| Age Bracket | Public School | Private School |
| 3 to 4 Year Olds | 5 (23.8%) | 16 (76.2%) |
| 5 to 9 Year Old | 126 (67.7%) | 60 (32.3%) |
| 10 to 14 Year Olds | 170 (94.4%) | 10 (5.6%) |
| 15 to 17 Year Olds | 77 (75.5%) | 25 (24.5%) |
| 18 to 19 Year Olds | 28 (90.3%) | 3 (9.7%) |
| 20 to 24 Year Olds | 25 (78.1%) | 7 (21.9%) |
| 25 to 34 Year Olds | 34 (65.4%) | 18 (34.6%) |
| 35 Years and over | 5 (9.6%) | 47 (90.4%) |
| Total | 470 (71.6%) | 186 (28.4%) |
Educational Attainment by Field of Study in Red Hill borough
Business (101 | 21.6%), education (74 | 15.8%), social sciences (62 | 13.3%), psychology (57 | 12.2%), and bio, nature & agricultural (43 | 9.2%) are the most common fields of study among 468 individuals in Red Hill borough who have obtained a bachelor's degree or higher.
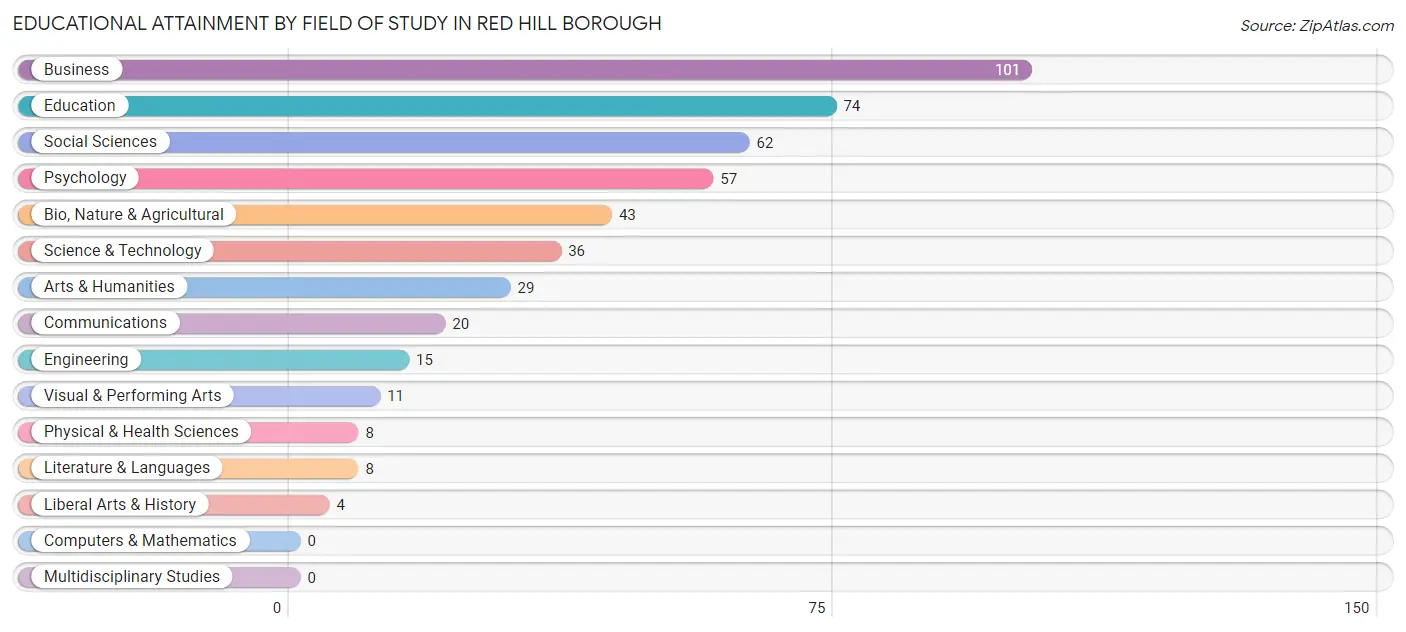
| Field of Study | # Graduates | % Graduates |
| Computers & Mathematics | 0 | 0.0% |
| Bio, Nature & Agricultural | 43 | 9.2% |
| Physical & Health Sciences | 8 | 1.7% |
| Psychology | 57 | 12.2% |
| Social Sciences | 62 | 13.3% |
| Engineering | 15 | 3.2% |
| Multidisciplinary Studies | 0 | 0.0% |
| Science & Technology | 36 | 7.7% |
| Business | 101 | 21.6% |
| Education | 74 | 15.8% |
| Literature & Languages | 8 | 1.7% |
| Liberal Arts & History | 4 | 0.9% |
| Visual & Performing Arts | 11 | 2.4% |
| Communications | 20 | 4.3% |
| Arts & Humanities | 29 | 6.2% |
| Total | 468 | 100.0% |
Transportation & Commute in Red Hill borough
Vehicle Availability by Sex in Red Hill borough
The most prevalent vehicle ownership categories in Red Hill borough are males with 2 vehicles (373, accounting for 49.9%) and females with 2 vehicles (301, making up 62.2%).
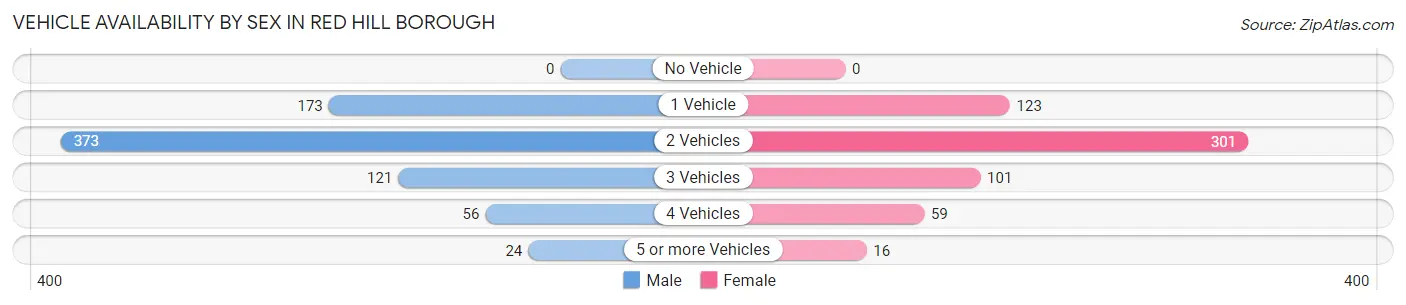
| Vehicles Available | Male | Female |
| No Vehicle | 0 (0.0%) | 0 (0.0%) |
| 1 Vehicle | 173 (23.2%) | 123 (20.5%) |
| 2 Vehicles | 373 (49.9%) | 301 (50.2%) |
| 3 Vehicles | 121 (16.2%) | 101 (16.8%) |
| 4 Vehicles | 56 (7.5%) | 59 (9.8%) |
| 5 or more Vehicles | 24 (3.2%) | 16 (2.7%) |
| Total | 747 (100.0%) | 600 (100.0%) |
Commute Time in Red Hill borough
The most frequently occuring commute durations in Red Hill borough are 30 to 34 minutes (243 commuters, 20.8%), 5 to 9 minutes (163 commuters, 14.0%), and 25 to 29 minutes (137 commuters, 11.7%).
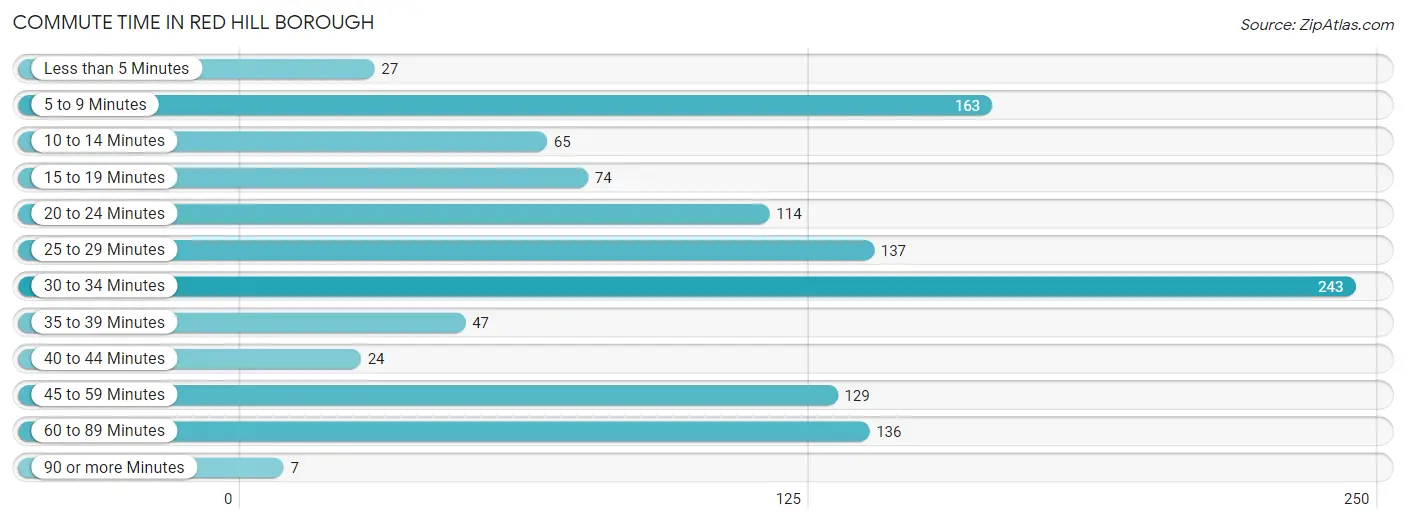
| Commute Time | # Commuters | % Commuters |
| Less than 5 Minutes | 27 | 2.3% |
| 5 to 9 Minutes | 163 | 14.0% |
| 10 to 14 Minutes | 65 | 5.6% |
| 15 to 19 Minutes | 74 | 6.4% |
| 20 to 24 Minutes | 114 | 9.8% |
| 25 to 29 Minutes | 137 | 11.7% |
| 30 to 34 Minutes | 243 | 20.8% |
| 35 to 39 Minutes | 47 | 4.0% |
| 40 to 44 Minutes | 24 | 2.1% |
| 45 to 59 Minutes | 129 | 11.1% |
| 60 to 89 Minutes | 136 | 11.7% |
| 90 or more Minutes | 7 | 0.6% |
Commute Time by Sex in Red Hill borough
The most common commute times in Red Hill borough are 30 to 34 minutes (190 commuters, 27.7%) for males and 5 to 9 minutes (83 commuters, 17.3%) for females.
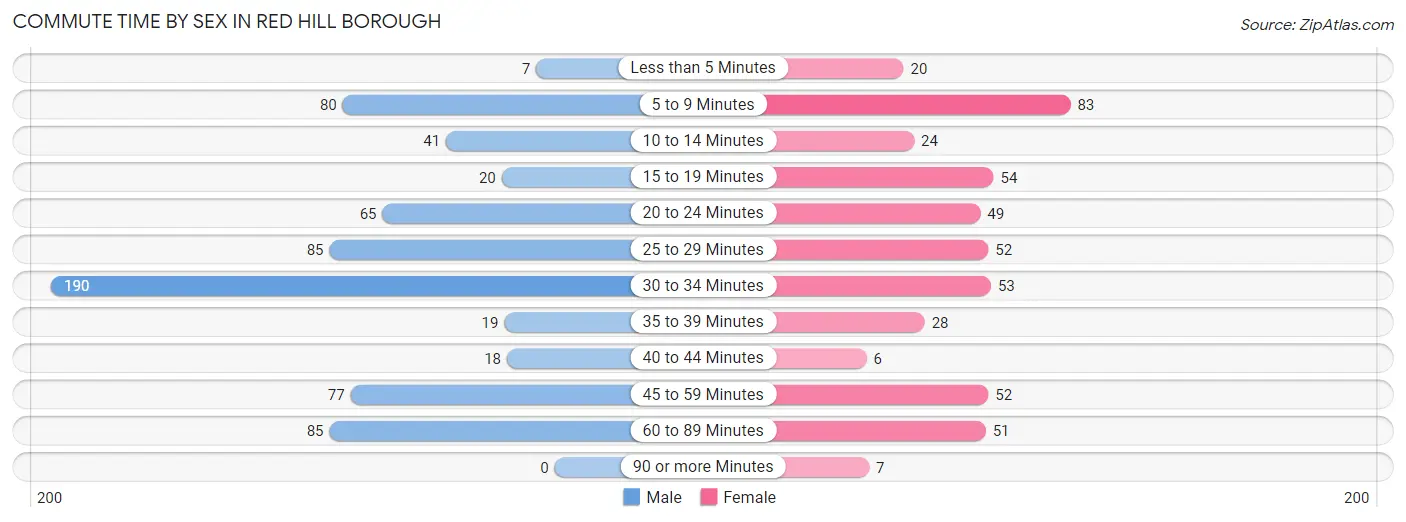
| Commute Time | Male | Female |
| Less than 5 Minutes | 7 (1.0%) | 20 (4.2%) |
| 5 to 9 Minutes | 80 (11.6%) | 83 (17.3%) |
| 10 to 14 Minutes | 41 (6.0%) | 24 (5.0%) |
| 15 to 19 Minutes | 20 (2.9%) | 54 (11.3%) |
| 20 to 24 Minutes | 65 (9.5%) | 49 (10.2%) |
| 25 to 29 Minutes | 85 (12.4%) | 52 (10.9%) |
| 30 to 34 Minutes | 190 (27.7%) | 53 (11.1%) |
| 35 to 39 Minutes | 19 (2.8%) | 28 (5.9%) |
| 40 to 44 Minutes | 18 (2.6%) | 6 (1.3%) |
| 45 to 59 Minutes | 77 (11.2%) | 52 (10.9%) |
| 60 to 89 Minutes | 85 (12.4%) | 51 (10.6%) |
| 90 or more Minutes | 0 (0.0%) | 7 (1.5%) |
Time of Departure to Work by Sex in Red Hill borough
The most frequent times of departure to work in Red Hill borough are 6:00 AM to 6:29 AM (115, 16.7%) for males and 8:00 AM to 8:29 AM (78, 16.3%) for females.
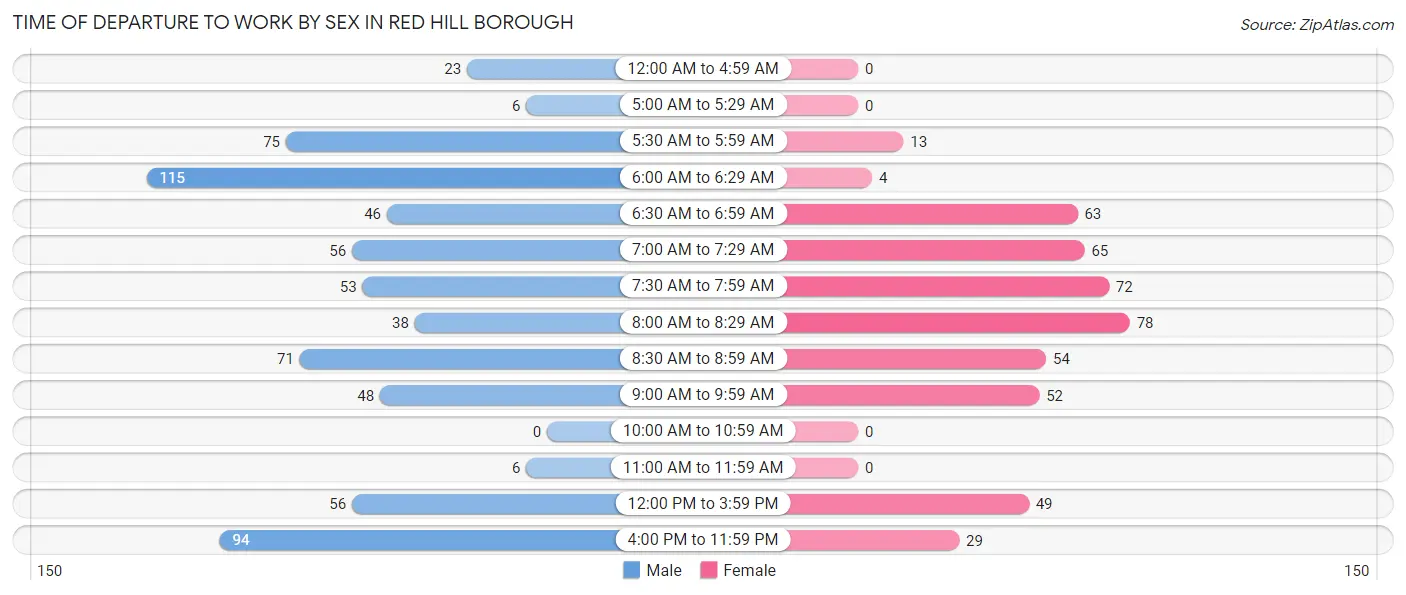
| Time of Departure | Male | Female |
| 12:00 AM to 4:59 AM | 23 (3.4%) | 0 (0.0%) |
| 5:00 AM to 5:29 AM | 6 (0.9%) | 0 (0.0%) |
| 5:30 AM to 5:59 AM | 75 (10.9%) | 13 (2.7%) |
| 6:00 AM to 6:29 AM | 115 (16.7%) | 4 (0.8%) |
| 6:30 AM to 6:59 AM | 46 (6.7%) | 63 (13.2%) |
| 7:00 AM to 7:29 AM | 56 (8.2%) | 65 (13.6%) |
| 7:30 AM to 7:59 AM | 53 (7.7%) | 72 (15.0%) |
| 8:00 AM to 8:29 AM | 38 (5.5%) | 78 (16.3%) |
| 8:30 AM to 8:59 AM | 71 (10.3%) | 54 (11.3%) |
| 9:00 AM to 9:59 AM | 48 (7.0%) | 52 (10.9%) |
| 10:00 AM to 10:59 AM | 0 (0.0%) | 0 (0.0%) |
| 11:00 AM to 11:59 AM | 6 (0.9%) | 0 (0.0%) |
| 12:00 PM to 3:59 PM | 56 (8.2%) | 49 (10.2%) |
| 4:00 PM to 11:59 PM | 94 (13.7%) | 29 (6.0%) |
| Total | 687 (100.0%) | 479 (100.0%) |
Housing Occupancy in Red Hill borough
Occupancy by Ownership in Red Hill borough
Of the total 1,121 dwellings in Red Hill borough, owner-occupied units account for 764 (68.1%), while renter-occupied units make up 357 (31.9%).
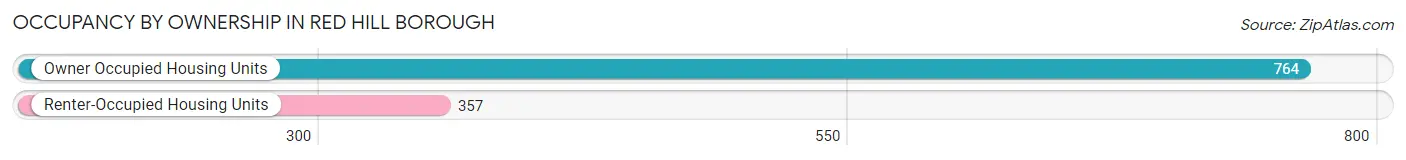
| Occupancy | # Housing Units | % Housing Units |
| Owner Occupied Housing Units | 764 | 68.1% |
| Renter-Occupied Housing Units | 357 | 31.9% |
| Total Occupied Housing Units | 1,121 | 100.0% |
Occupancy by Household Size in Red Hill borough
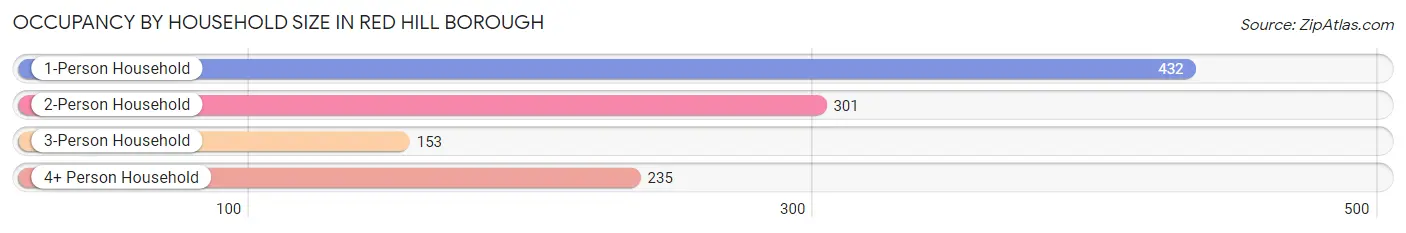
| Household Size | # Housing Units | % Housing Units |
| 1-Person Household | 432 | 38.5% |
| 2-Person Household | 301 | 26.9% |
| 3-Person Household | 153 | 13.7% |
| 4+ Person Household | 235 | 21.0% |
| Total Housing Units | 1,121 | 100.0% |
Occupancy by Ownership by Household Size in Red Hill borough
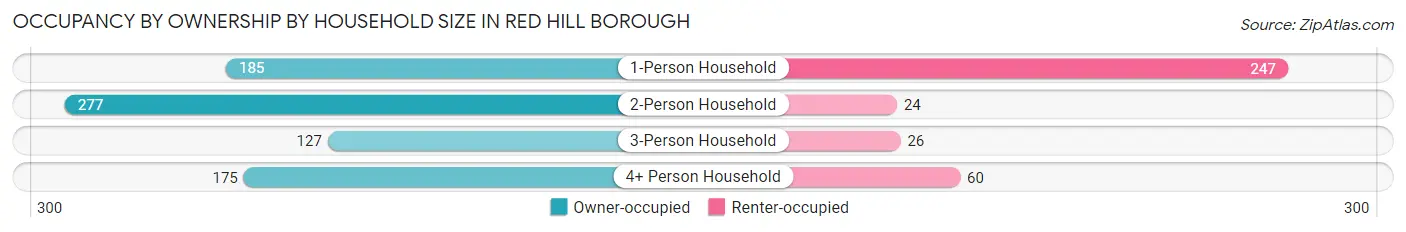
| Household Size | Owner-occupied | Renter-occupied |
| 1-Person Household | 185 (42.8%) | 247 (57.2%) |
| 2-Person Household | 277 (92.0%) | 24 (8.0%) |
| 3-Person Household | 127 (83.0%) | 26 (17.0%) |
| 4+ Person Household | 175 (74.5%) | 60 (25.5%) |
| Total Housing Units | 764 (68.1%) | 357 (31.9%) |
Occupancy by Educational Attainment in Red Hill borough
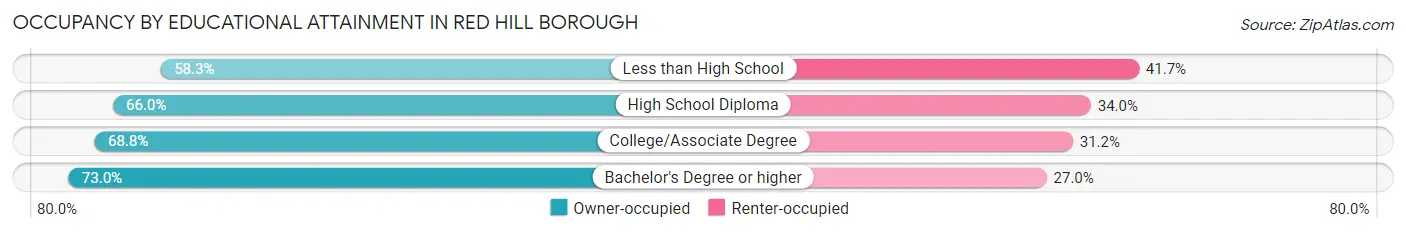
| Household Size | Owner-occupied | Renter-occupied |
| Less than High School | 35 (58.3%) | 25 (41.7%) |
| High School Diploma | 310 (66.0%) | 160 (34.0%) |
| College/Associate Degree | 203 (68.8%) | 92 (31.2%) |
| Bachelor's Degree or higher | 216 (73.0%) | 80 (27.0%) |
Occupancy by Age of Householder in Red Hill borough
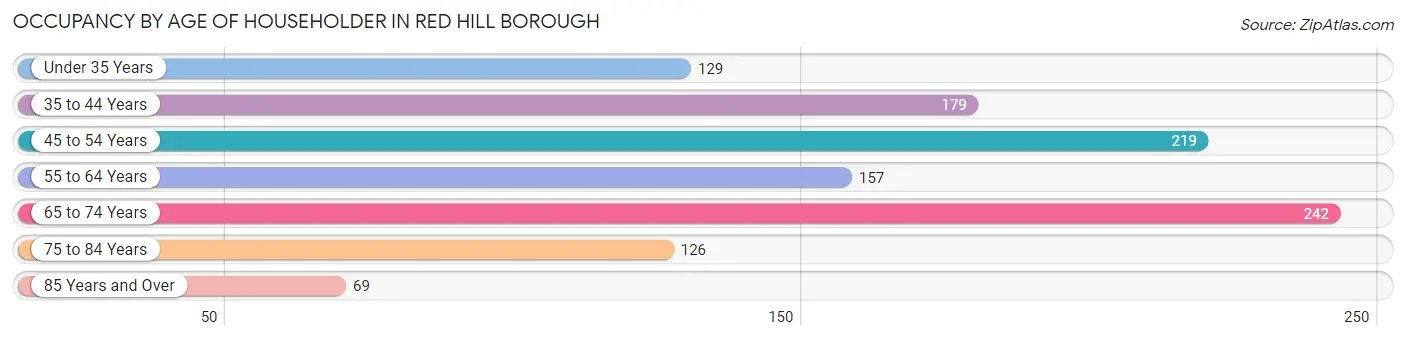
| Age Bracket | # Households | % Households |
| Under 35 Years | 129 | 11.5% |
| 35 to 44 Years | 179 | 16.0% |
| 45 to 54 Years | 219 | 19.5% |
| 55 to 64 Years | 157 | 14.0% |
| 65 to 74 Years | 242 | 21.6% |
| 75 to 84 Years | 126 | 11.2% |
| 85 Years and Over | 69 | 6.2% |
| Total | 1,121 | 100.0% |
Housing Finances in Red Hill borough
Median Income by Occupancy in Red Hill borough
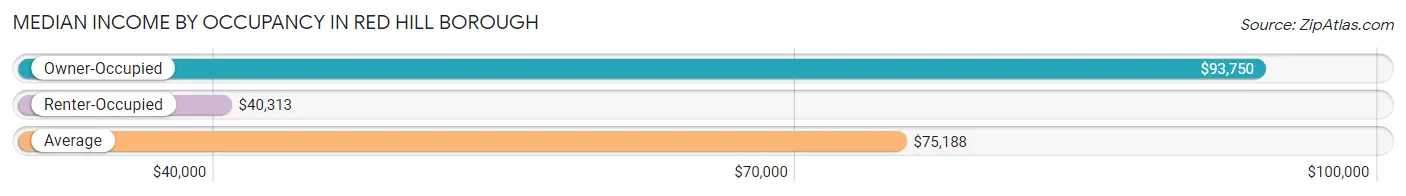
| Occupancy Type | # Households | Median Income |
| Owner-Occupied | 764 (68.1%) | $93,750 |
| Renter-Occupied | 357 (31.9%) | $40,313 |
| Average | 1,121 (100.0%) | $75,188 |
Occupancy by Householder Income Bracket in Red Hill borough
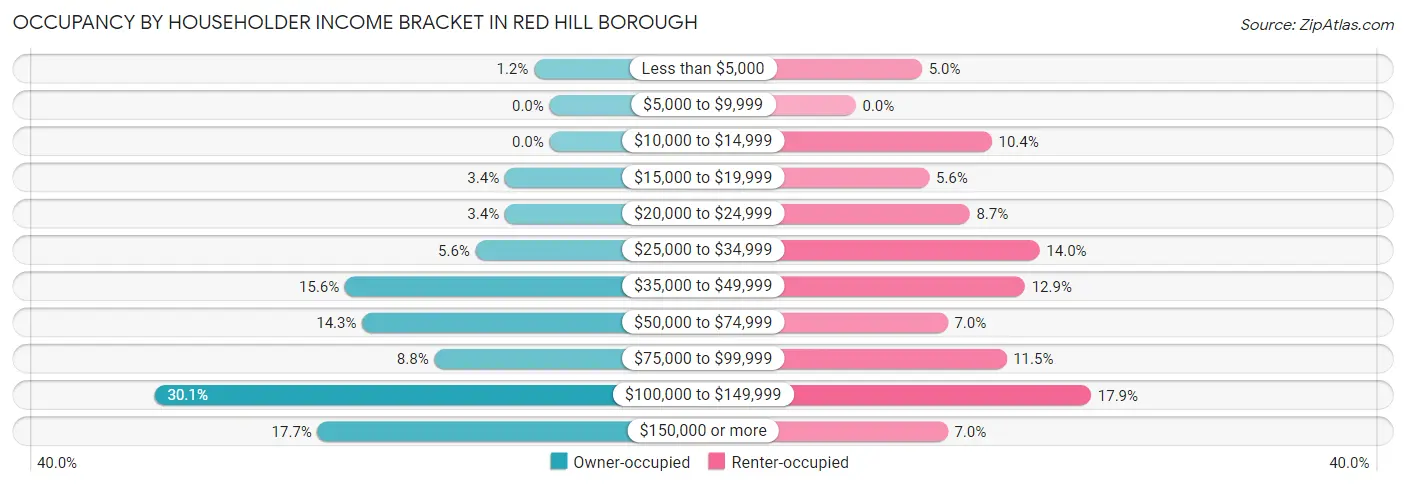
| Income Bracket | Owner-occupied | Renter-occupied |
| Less than $5,000 | 9 (1.2%) | 18 (5.0%) |
| $5,000 to $9,999 | 0 (0.0%) | 0 (0.0%) |
| $10,000 to $14,999 | 0 (0.0%) | 37 (10.4%) |
| $15,000 to $19,999 | 26 (3.4%) | 20 (5.6%) |
| $20,000 to $24,999 | 26 (3.4%) | 31 (8.7%) |
| $25,000 to $34,999 | 43 (5.6%) | 50 (14.0%) |
| $35,000 to $49,999 | 119 (15.6%) | 46 (12.9%) |
| $50,000 to $74,999 | 109 (14.3%) | 25 (7.0%) |
| $75,000 to $99,999 | 67 (8.8%) | 41 (11.5%) |
| $100,000 to $149,999 | 230 (30.1%) | 64 (17.9%) |
| $150,000 or more | 135 (17.7%) | 25 (7.0%) |
| Total | 764 (100.0%) | 357 (100.0%) |
Monthly Housing Cost Tiers in Red Hill borough
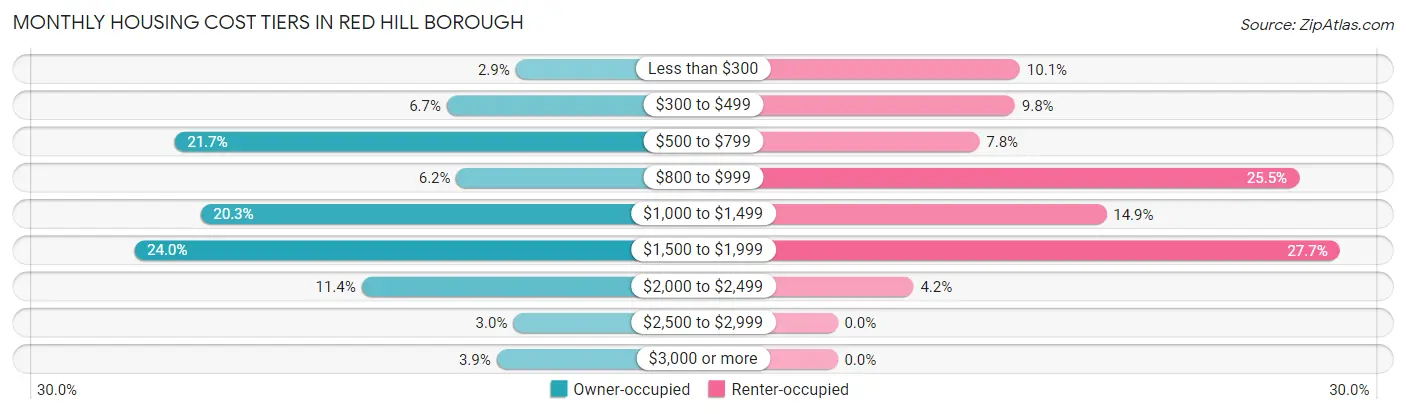
| Monthly Cost | Owner-occupied | Renter-occupied |
| Less than $300 | 22 (2.9%) | 36 (10.1%) |
| $300 to $499 | 51 (6.7%) | 35 (9.8%) |
| $500 to $799 | 166 (21.7%) | 28 (7.8%) |
| $800 to $999 | 47 (6.1%) | 91 (25.5%) |
| $1,000 to $1,499 | 155 (20.3%) | 53 (14.8%) |
| $1,500 to $1,999 | 183 (23.9%) | 99 (27.7%) |
| $2,000 to $2,499 | 87 (11.4%) | 15 (4.2%) |
| $2,500 to $2,999 | 23 (3.0%) | 0 (0.0%) |
| $3,000 or more | 30 (3.9%) | 0 (0.0%) |
| Total | 764 (100.0%) | 357 (100.0%) |
Physical Housing Characteristics in Red Hill borough
Housing Structures in Red Hill borough
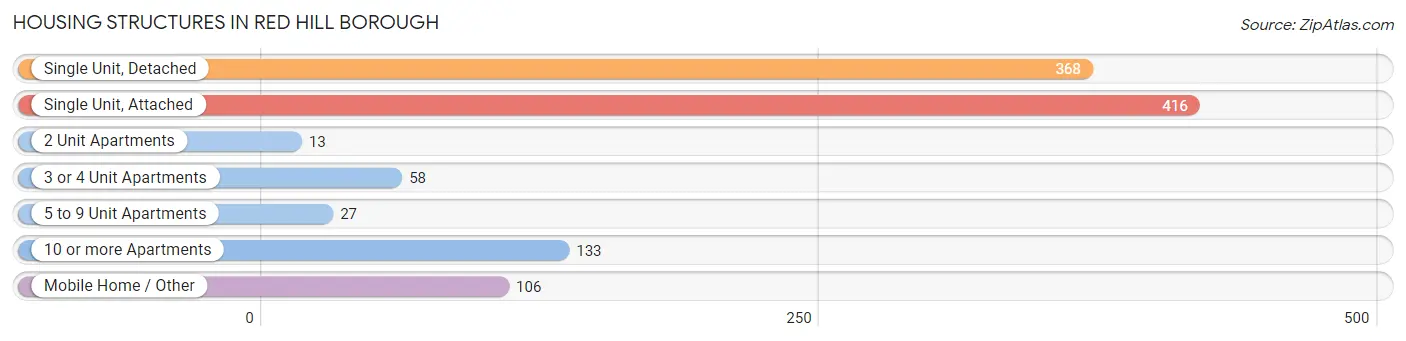
| Structure Type | # Housing Units | % Housing Units |
| Single Unit, Detached | 368 | 32.8% |
| Single Unit, Attached | 416 | 37.1% |
| 2 Unit Apartments | 13 | 1.2% |
| 3 or 4 Unit Apartments | 58 | 5.2% |
| 5 to 9 Unit Apartments | 27 | 2.4% |
| 10 or more Apartments | 133 | 11.9% |
| Mobile Home / Other | 106 | 9.5% |
| Total | 1,121 | 100.0% |
Housing Structures by Occupancy in Red Hill borough
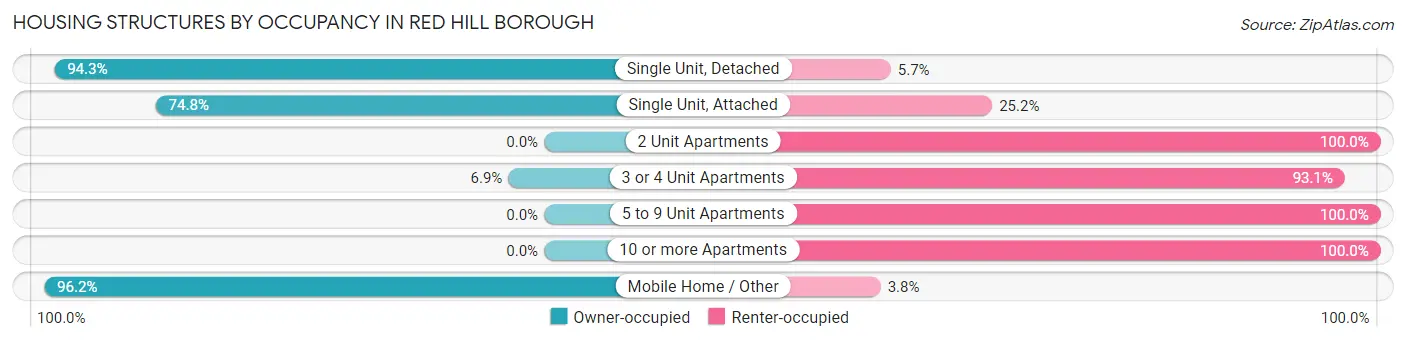
| Structure Type | Owner-occupied | Renter-occupied |
| Single Unit, Detached | 347 (94.3%) | 21 (5.7%) |
| Single Unit, Attached | 311 (74.8%) | 105 (25.2%) |
| 2 Unit Apartments | 0 (0.0%) | 13 (100.0%) |
| 3 or 4 Unit Apartments | 4 (6.9%) | 54 (93.1%) |
| 5 to 9 Unit Apartments | 0 (0.0%) | 27 (100.0%) |
| 10 or more Apartments | 0 (0.0%) | 133 (100.0%) |
| Mobile Home / Other | 102 (96.2%) | 4 (3.8%) |
| Total | 764 (68.1%) | 357 (31.9%) |
Housing Structures by Number of Rooms in Red Hill borough
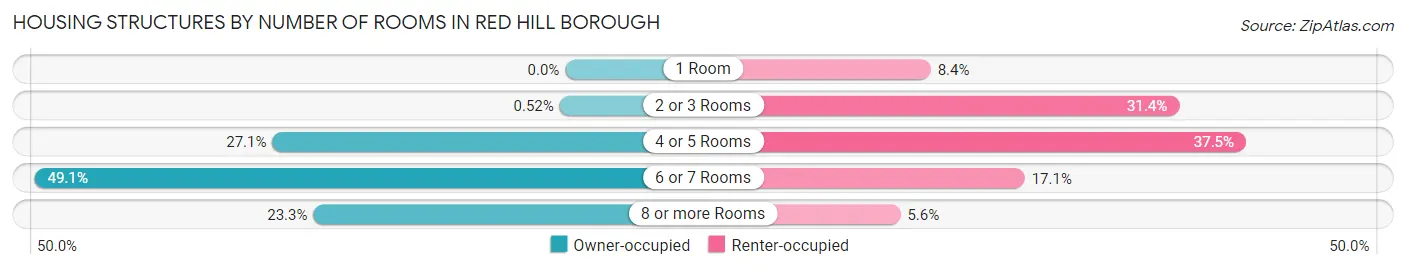
| Number of Rooms | Owner-occupied | Renter-occupied |
| 1 Room | 0 (0.0%) | 30 (8.4%) |
| 2 or 3 Rooms | 4 (0.5%) | 112 (31.4%) |
| 4 or 5 Rooms | 207 (27.1%) | 134 (37.5%) |
| 6 or 7 Rooms | 375 (49.1%) | 61 (17.1%) |
| 8 or more Rooms | 178 (23.3%) | 20 (5.6%) |
| Total | 764 (100.0%) | 357 (100.0%) |
Housing Structure by Heating Type in Red Hill borough
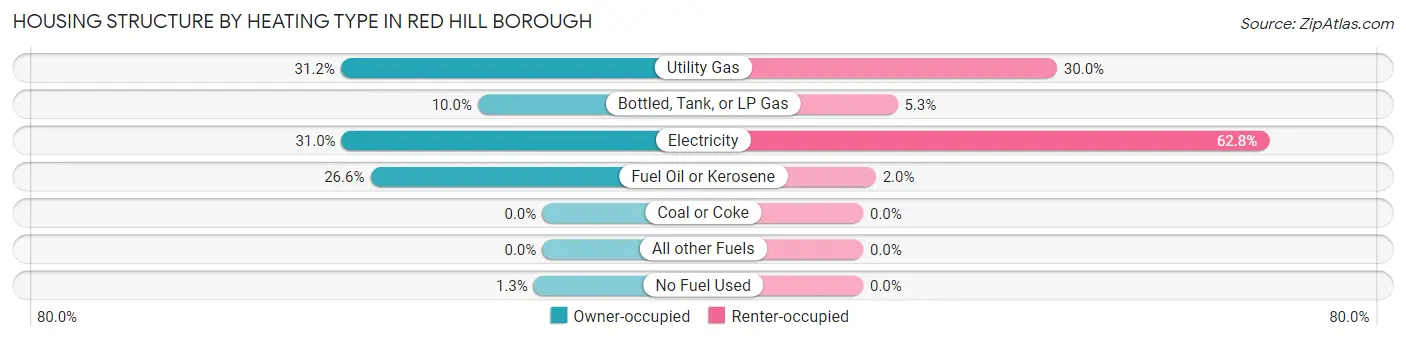
| Heating Type | Owner-occupied | Renter-occupied |
| Utility Gas | 238 (31.1%) | 107 (30.0%) |
| Bottled, Tank, or LP Gas | 76 (10.0%) | 19 (5.3%) |
| Electricity | 237 (31.0%) | 224 (62.7%) |
| Fuel Oil or Kerosene | 203 (26.6%) | 7 (2.0%) |
| Coal or Coke | 0 (0.0%) | 0 (0.0%) |
| All other Fuels | 0 (0.0%) | 0 (0.0%) |
| No Fuel Used | 10 (1.3%) | 0 (0.0%) |
| Total | 764 (100.0%) | 357 (100.0%) |
Household Vehicle Usage in Red Hill borough
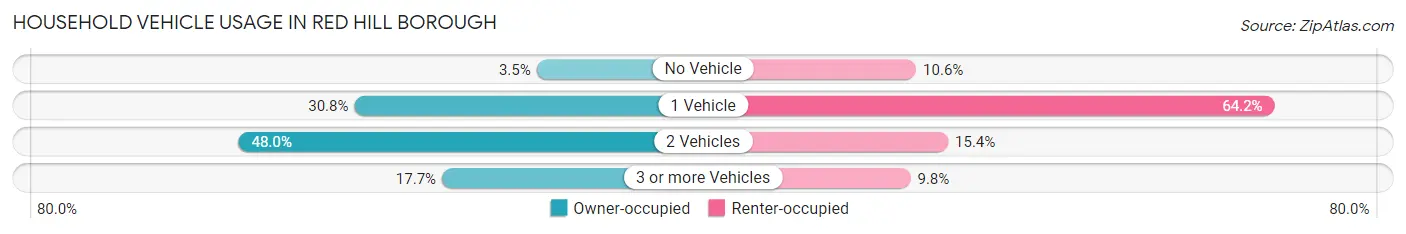
| Vehicles per Household | Owner-occupied | Renter-occupied |
| No Vehicle | 27 (3.5%) | 38 (10.6%) |
| 1 Vehicle | 235 (30.8%) | 229 (64.1%) |
| 2 Vehicles | 367 (48.0%) | 55 (15.4%) |
| 3 or more Vehicles | 135 (17.7%) | 35 (9.8%) |
| Total | 764 (100.0%) | 357 (100.0%) |
Real Estate & Mortgages in Red Hill borough
Real Estate and Mortgage Overview in Red Hill borough
| Characteristic | Without Mortgage | With Mortgage |
| Housing Units | 327 | 437 |
| Median Property Value | $163,400 | $244,700 |
| Median Household Income | $48,693 | $109 |
| Monthly Housing Costs | $604 | $30 |
| Real Estate Taxes | $2,630 | $5 |
Property Value by Mortgage Status in Red Hill borough
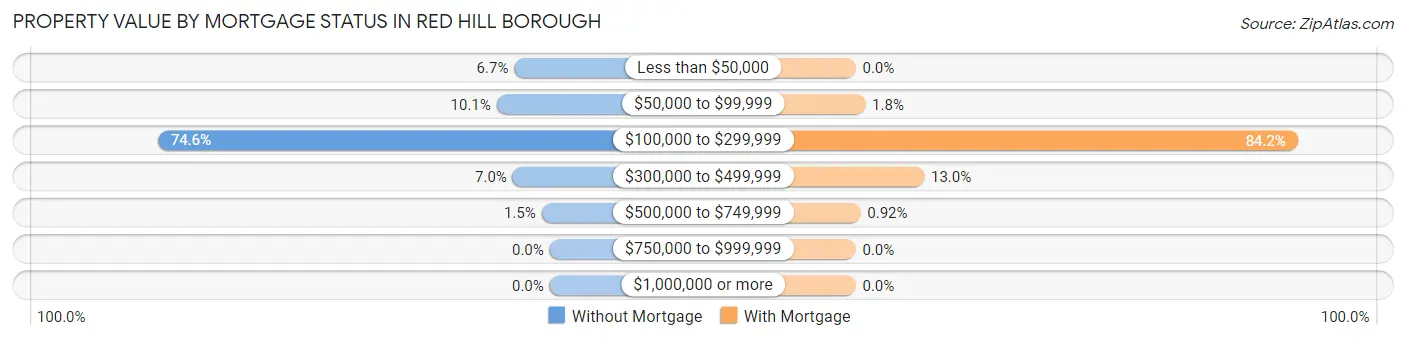
| Property Value | Without Mortgage | With Mortgage |
| Less than $50,000 | 22 (6.7%) | 0 (0.0%) |
| $50,000 to $99,999 | 33 (10.1%) | 8 (1.8%) |
| $100,000 to $299,999 | 244 (74.6%) | 368 (84.2%) |
| $300,000 to $499,999 | 23 (7.0%) | 57 (13.0%) |
| $500,000 to $749,999 | 5 (1.5%) | 4 (0.9%) |
| $750,000 to $999,999 | 0 (0.0%) | 0 (0.0%) |
| $1,000,000 or more | 0 (0.0%) | 0 (0.0%) |
| Total | 327 (100.0%) | 437 (100.0%) |
Household Income by Mortgage Status in Red Hill borough
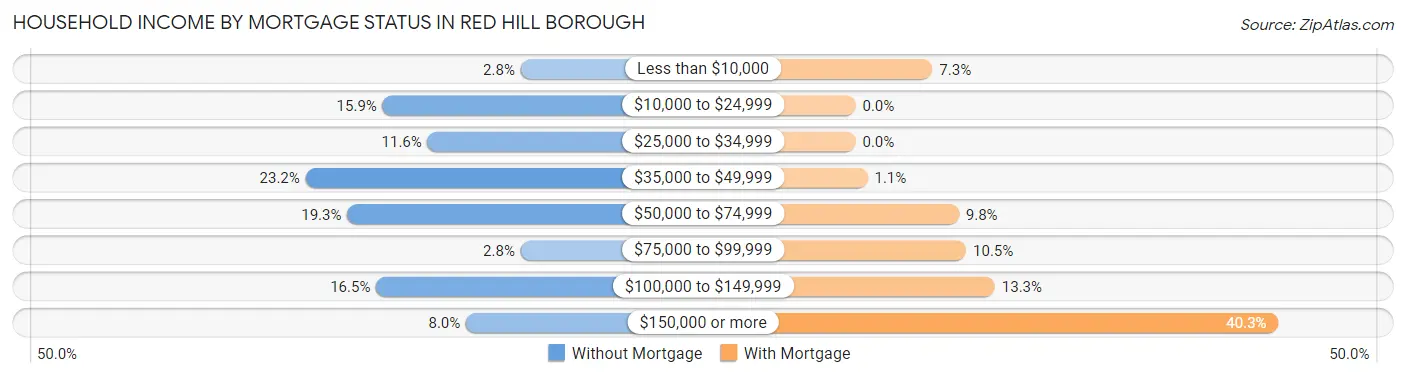
| Household Income | Without Mortgage | With Mortgage |
| Less than $10,000 | 9 (2.8%) | 32 (7.3%) |
| $10,000 to $24,999 | 52 (15.9%) | 0 (0.0%) |
| $25,000 to $34,999 | 38 (11.6%) | 0 (0.0%) |
| $35,000 to $49,999 | 76 (23.2%) | 5 (1.1%) |
| $50,000 to $74,999 | 63 (19.3%) | 43 (9.8%) |
| $75,000 to $99,999 | 9 (2.8%) | 46 (10.5%) |
| $100,000 to $149,999 | 54 (16.5%) | 58 (13.3%) |
| $150,000 or more | 26 (8.0%) | 176 (40.3%) |
| Total | 327 (100.0%) | 437 (100.0%) |
Property Value to Household Income Ratio in Red Hill borough
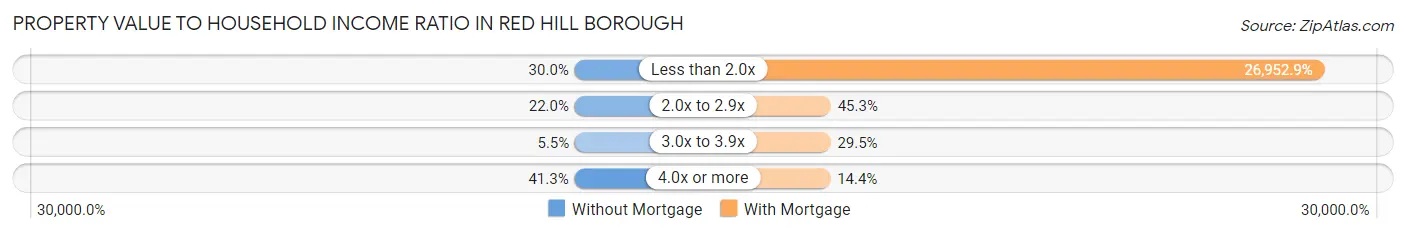
| Value-to-Income Ratio | Without Mortgage | With Mortgage |
| Less than 2.0x | 98 (30.0%) | 117,784 (26,952.9%) |
| 2.0x to 2.9x | 72 (22.0%) | 198 (45.3%) |
| 3.0x to 3.9x | 18 (5.5%) | 129 (29.5%) |
| 4.0x or more | 135 (41.3%) | 63 (14.4%) |
| Total | 327 (100.0%) | 437 (100.0%) |
Real Estate Taxes by Mortgage Status in Red Hill borough
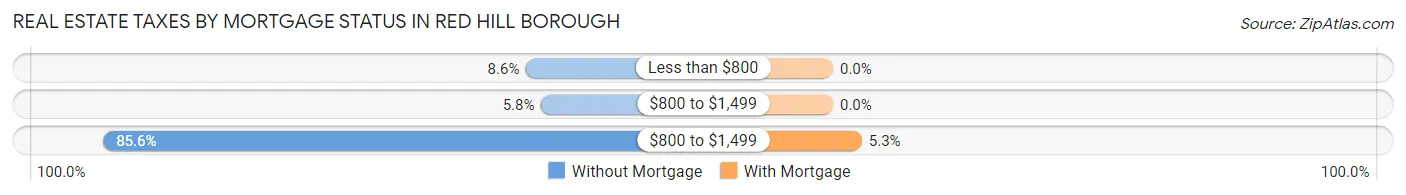
| Property Taxes | Without Mortgage | With Mortgage |
| Less than $800 | 28 (8.6%) | 0 (0.0%) |
| $800 to $1,499 | 19 (5.8%) | 0 (0.0%) |
| $800 to $1,499 | 280 (85.6%) | 23 (5.3%) |
| Total | 327 (100.0%) | 437 (100.0%) |
Health & Disability in Red Hill borough
Health Insurance Coverage by Age in Red Hill borough
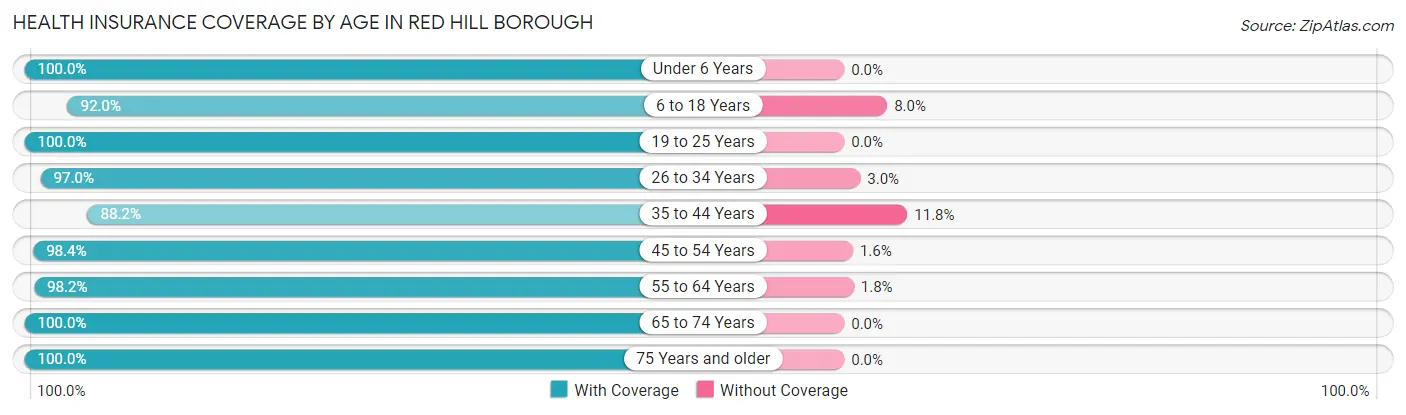
| Age Bracket | With Coverage | Without Coverage |
| Under 6 Years | 118 (100.0%) | 0 (0.0%) |
| 6 to 18 Years | 448 (92.0%) | 39 (8.0%) |
| 19 to 25 Years | 237 (100.0%) | 0 (0.0%) |
| 26 to 34 Years | 227 (97.0%) | 7 (3.0%) |
| 35 to 44 Years | 285 (88.2%) | 38 (11.8%) |
| 45 to 54 Years | 365 (98.4%) | 6 (1.6%) |
| 55 to 64 Years | 276 (98.2%) | 5 (1.8%) |
| 65 to 74 Years | 331 (100.0%) | 0 (0.0%) |
| 75 Years and older | 281 (100.0%) | 0 (0.0%) |
| Total | 2,568 (96.4%) | 95 (3.6%) |
Health Insurance Coverage by Citizenship Status in Red Hill borough
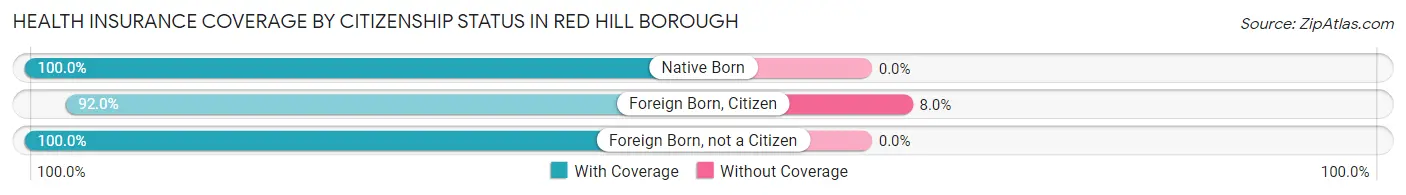
| Citizenship Status | With Coverage | Without Coverage |
| Native Born | 118 (100.0%) | 0 (0.0%) |
| Foreign Born, Citizen | 448 (92.0%) | 39 (8.0%) |
| Foreign Born, not a Citizen | 237 (100.0%) | 0 (0.0%) |
Health Insurance Coverage by Household Income in Red Hill borough
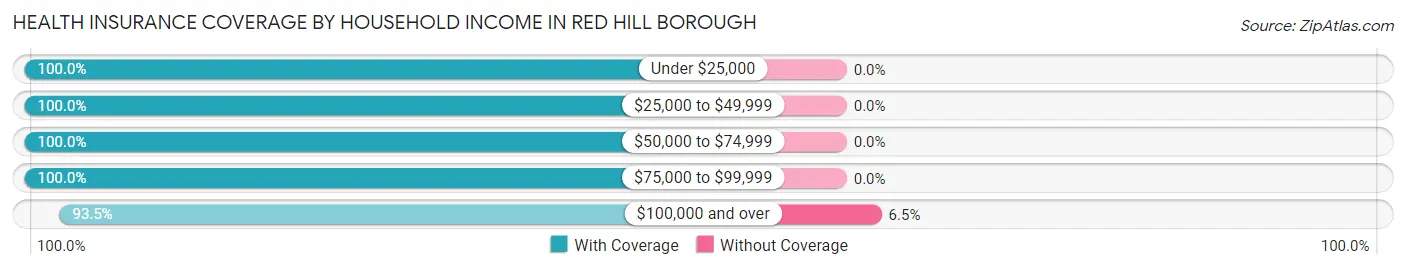
| Household Income | With Coverage | Without Coverage |
| Under $25,000 | 256 (100.0%) | 0 (0.0%) |
| $25,000 to $49,999 | 350 (100.0%) | 0 (0.0%) |
| $50,000 to $74,999 | 378 (100.0%) | 0 (0.0%) |
| $75,000 to $99,999 | 236 (100.0%) | 0 (0.0%) |
| $100,000 and over | 1,345 (93.5%) | 94 (6.5%) |
Public vs Private Health Insurance Coverage by Age in Red Hill borough
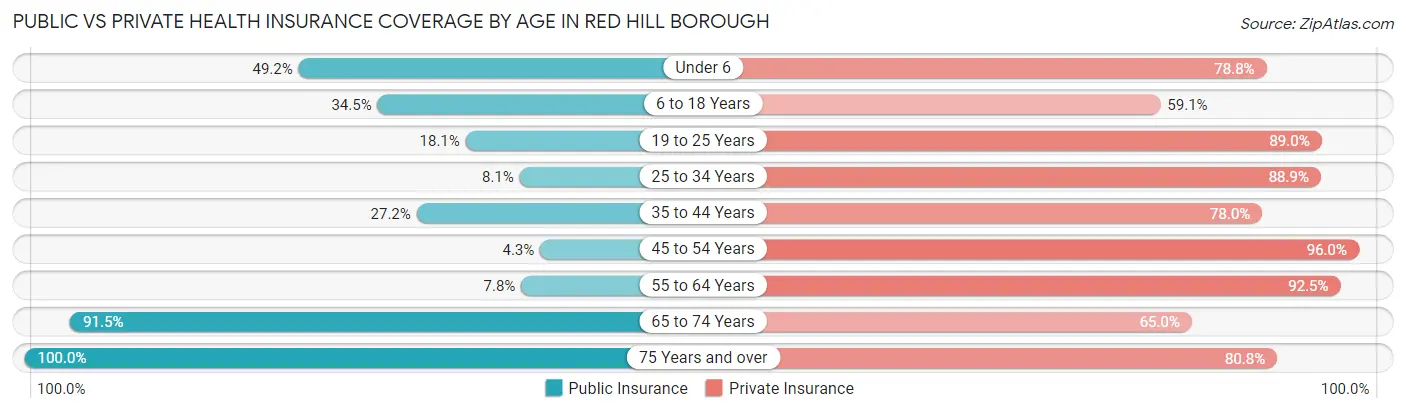
| Age Bracket | Public Insurance | Private Insurance |
| Under 6 | 58 (49.1%) | 93 (78.8%) |
| 6 to 18 Years | 168 (34.5%) | 288 (59.1%) |
| 19 to 25 Years | 43 (18.1%) | 211 (89.0%) |
| 25 to 34 Years | 19 (8.1%) | 208 (88.9%) |
| 35 to 44 Years | 88 (27.2%) | 252 (78.0%) |
| 45 to 54 Years | 16 (4.3%) | 356 (96.0%) |
| 55 to 64 Years | 22 (7.8%) | 260 (92.5%) |
| 65 to 74 Years | 303 (91.5%) | 215 (64.9%) |
| 75 Years and over | 281 (100.0%) | 227 (80.8%) |
| Total | 998 (37.5%) | 2,110 (79.2%) |
Disability Status by Sex by Age in Red Hill borough
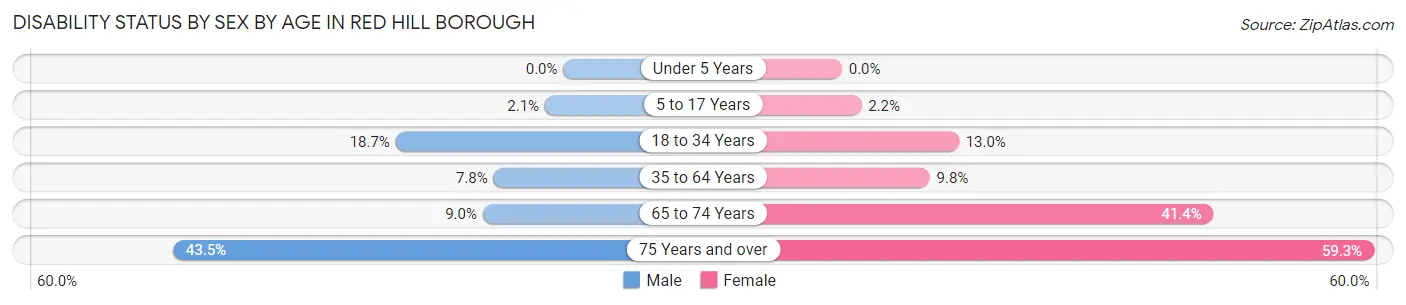
| Age Bracket | Male | Female |
| Under 5 Years | 0 (0.0%) | 0 (0.0%) |
| 5 to 17 Years | 5 (2.1%) | 5 (2.2%) |
| 18 to 34 Years | 56 (18.7%) | 25 (13.0%) |
| 35 to 64 Years | 40 (7.8%) | 45 (9.8%) |
| 65 to 74 Years | 13 (9.0%) | 77 (41.4%) |
| 75 Years and over | 40 (43.5%) | 112 (59.3%) |
Disability Class by Sex by Age in Red Hill borough
Disability Class: Hearing Difficulty
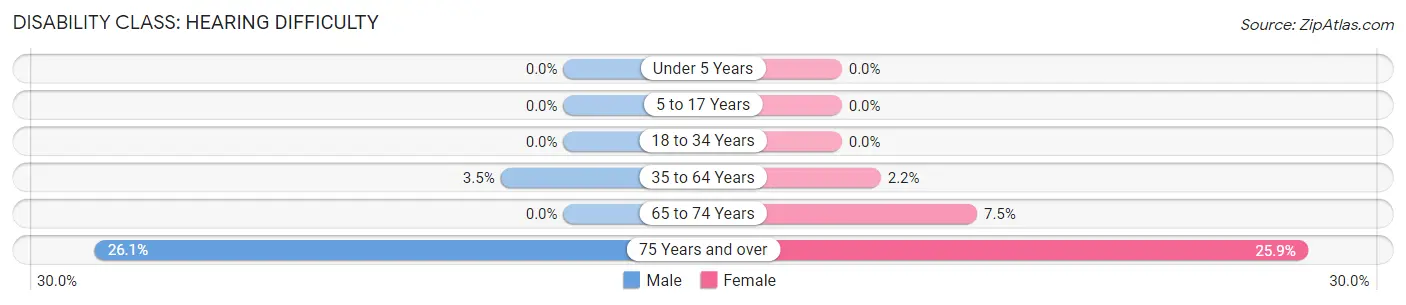
| Age Bracket | Male | Female |
| Under 5 Years | 0 (0.0%) | 0 (0.0%) |
| 5 to 17 Years | 0 (0.0%) | 0 (0.0%) |
| 18 to 34 Years | 0 (0.0%) | 0 (0.0%) |
| 35 to 64 Years | 18 (3.5%) | 10 (2.2%) |
| 65 to 74 Years | 0 (0.0%) | 14 (7.5%) |
| 75 Years and over | 24 (26.1%) | 49 (25.9%) |
Disability Class: Vision Difficulty
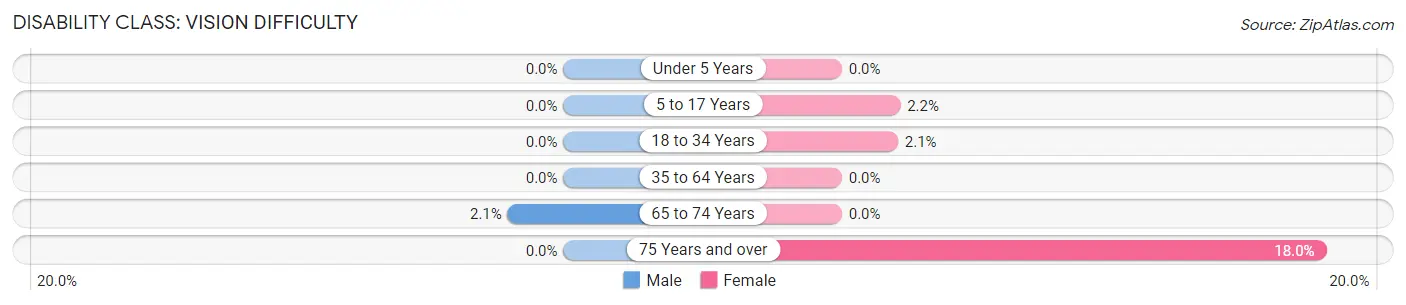
| Age Bracket | Male | Female |
| Under 5 Years | 0 (0.0%) | 0 (0.0%) |
| 5 to 17 Years | 0 (0.0%) | 5 (2.2%) |
| 18 to 34 Years | 0 (0.0%) | 4 (2.1%) |
| 35 to 64 Years | 0 (0.0%) | 0 (0.0%) |
| 65 to 74 Years | 3 (2.1%) | 0 (0.0%) |
| 75 Years and over | 0 (0.0%) | 34 (18.0%) |
Disability Class: Cognitive Difficulty
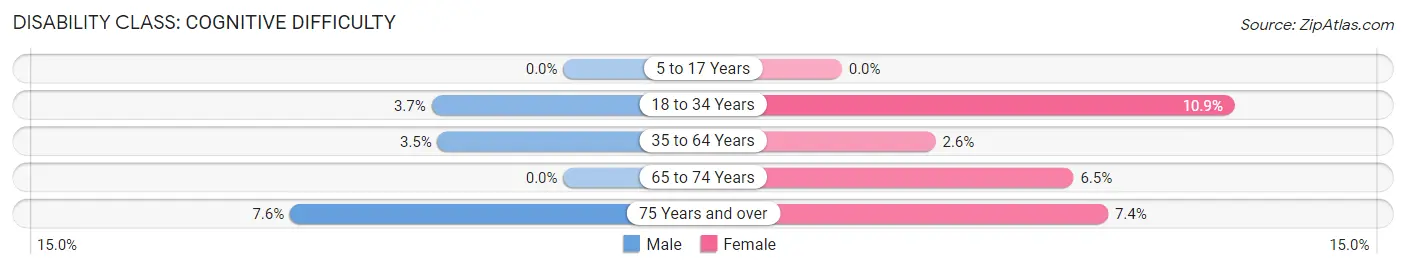
| Age Bracket | Male | Female |
| 5 to 17 Years | 0 (0.0%) | 0 (0.0%) |
| 18 to 34 Years | 11 (3.7%) | 21 (10.9%) |
| 35 to 64 Years | 18 (3.5%) | 12 (2.6%) |
| 65 to 74 Years | 0 (0.0%) | 12 (6.5%) |
| 75 Years and over | 7 (7.6%) | 14 (7.4%) |
Disability Class: Ambulatory Difficulty
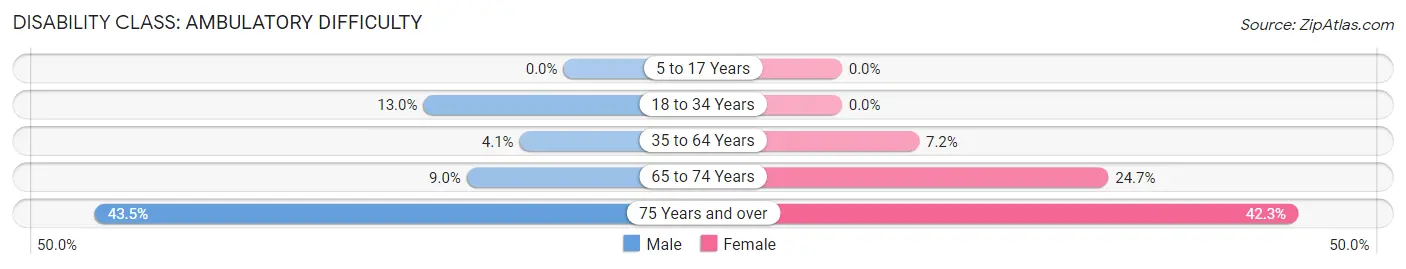
| Age Bracket | Male | Female |
| 5 to 17 Years | 0 (0.0%) | 0 (0.0%) |
| 18 to 34 Years | 39 (13.0%) | 0 (0.0%) |
| 35 to 64 Years | 21 (4.1%) | 33 (7.2%) |
| 65 to 74 Years | 13 (9.0%) | 46 (24.7%) |
| 75 Years and over | 40 (43.5%) | 80 (42.3%) |
Disability Class: Self-Care Difficulty
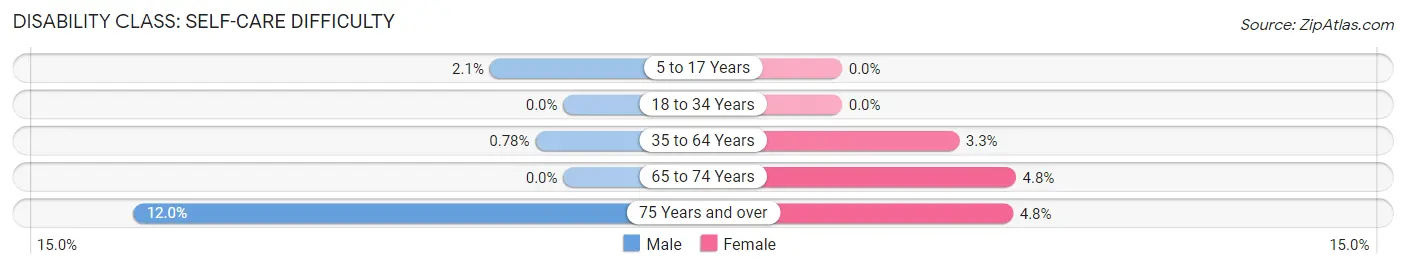
| Age Bracket | Male | Female |
| 5 to 17 Years | 5 (2.1%) | 0 (0.0%) |
| 18 to 34 Years | 0 (0.0%) | 0 (0.0%) |
| 35 to 64 Years | 4 (0.8%) | 15 (3.3%) |
| 65 to 74 Years | 0 (0.0%) | 9 (4.8%) |
| 75 Years and over | 11 (12.0%) | 9 (4.8%) |
Technology Access in Red Hill borough
Computing Device Access in Red Hill borough
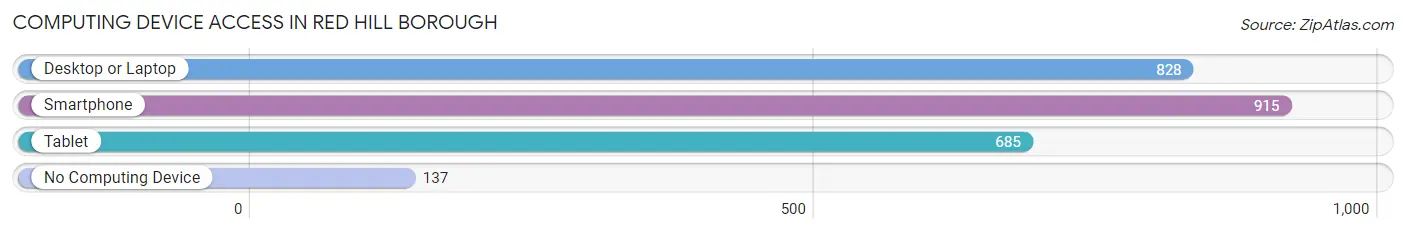
| Device Type | # Households | % Households |
| Desktop or Laptop | 828 | 73.9% |
| Smartphone | 915 | 81.6% |
| Tablet | 685 | 61.1% |
| No Computing Device | 137 | 12.2% |
| Total | 1,121 | 100.0% |
Internet Access in Red Hill borough
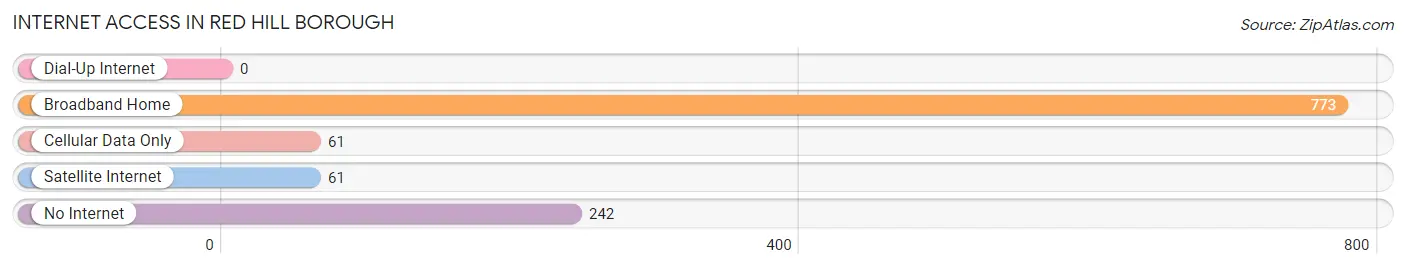
| Internet Type | # Households | % Households |
| Dial-Up Internet | 0 | 0.0% |
| Broadband Home | 773 | 69.0% |
| Cellular Data Only | 61 | 5.4% |
| Satellite Internet | 61 | 5.4% |
| No Internet | 242 | 21.6% |
| Total | 1,121 | 100.0% |
Red Hill borough Summary
Introduction
Red Hill Borough is a small borough located in Montgomery County, Pennsylvania. It is situated in the southeastern part of the county, approximately 25 miles northwest of Philadelphia. The borough is home to a population of approximately 2,500 people and covers an area of 0.8 square miles. Red Hill Borough is a rural community with a rich history and a vibrant economy.
History
Red Hill Borough was founded in 1845 by a group of settlers from the nearby town of Red Hill. The settlers were looking for a place to call home and found the area to be ideal for farming and other agricultural activities. The town was named after the red clay soil found in the area.
The first settlers in Red Hill Borough were mostly of German descent. They established a small farming community and built a church, a school, and a post office. The town grew slowly but steadily over the years, and by the early 1900s, it had become a thriving community.
In the early 1900s, the town was home to a variety of businesses, including a general store, a blacksmith shop, a sawmill, and a gristmill. The town also had a hotel, a bank, and a movie theater.
The town continued to grow and prosper until the 1950s, when the population began to decline. This was due to the decline of the local economy and the rise of suburbanization. By the 1970s, the population had dropped to just over 1,000 people.
Geography
Red Hill Borough is located in southeastern Montgomery County, Pennsylvania. It is situated in the Perkiomen Valley, which is a part of the Great Valley region of Pennsylvania. The borough is bordered by Upper Hanover Township to the north, Pennsburg Borough to the east, East Greenville Borough to the south, and Marlborough Township to the west.
The borough is located at an elevation of approximately 500 feet above sea level. The terrain is mostly flat, with some rolling hills. The climate is humid continental, with hot summers and cold winters.
Economy
Red Hill Borough has a vibrant economy that is largely based on agriculture and light manufacturing. The borough is home to several small businesses, including a general store, a hardware store, a bakery, and a restaurant.
The borough also has a number of light manufacturing businesses, including a plastics factory, a printing company, and a machine shop. The borough is also home to a number of farms, which produce a variety of crops, including corn, soybeans, and hay.
Demographics
As of the 2010 census, Red Hill Borough had a population of 2,521 people. The racial makeup of the borough was 94.3% White, 2.2% African American, 0.3% Native American, 0.7% Asian, 0.1% Pacific Islander, and 2.4% from other races. Hispanic or Latino of any race were 2.7% of the population.
The median household income in Red Hill Borough was $50,938, and the median family income was $60,938. The per capita income was $25,938. About 4.3% of families and 5.7% of the population were below the poverty line, including 8.3% of those under age 18 and 4.3% of those age 65 or over.
Conclusion
Red Hill Borough is a small borough located in southeastern Montgomery County, Pennsylvania. It is a rural community with a rich history and a vibrant economy. The borough is home to a population of approximately 2,500 people and covers an area of 0.8 square miles. The economy of Red Hill Borough is largely based on agriculture and light manufacturing, and the population is mostly White with a small percentage of African American, Native American, Asian, and Pacific Islander residents.
Common Questions
What is Per Capita Income in Red Hill borough?
Per Capita income in Red Hill borough is $38,593.
What is the Median Family Income in Red Hill borough?
Median Family Income in Red Hill borough is $112,083.
What is the Median Household income in Red Hill borough?
Median Household Income in Red Hill borough is $75,188.
What is Income or Wage Gap in Red Hill borough?
Income or Wage Gap in Red Hill borough is 7.6%.
Women in Red Hill borough earn 92.4 cents for every dollar earned by a man.
What is Inequality or Gini Index in Red Hill borough?
Inequality or Gini Index in Red Hill borough is 0.40.
What is the Total Population of Red Hill borough?
Total Population of Red Hill borough is 2,663.
What is the Total Male Population of Red Hill borough?
Total Male Population of Red Hill borough is 1,327.
What is the Total Female Population of Red Hill borough?
Total Female Population of Red Hill borough is 1,336.
What is the Ratio of Males per 100 Females in Red Hill borough?
There are 99.33 Males per 100 Females in Red Hill borough.
What is the Ratio of Females per 100 Males in Red Hill borough?
There are 100.68 Females per 100 Males in Red Hill borough.
What is the Median Population Age in Red Hill borough?
Median Population Age in Red Hill borough is 42.6 Years.
What is the Average Family Size in Red Hill borough
Average Family Size in Red Hill borough is 3.3 People.
What is the Average Household Size in Red Hill borough
Average Household Size in Red Hill borough is 2.4 People.
How Large is the Labor Force in Red Hill borough?
There are 1,448 People in the Labor Forcein in Red Hill borough.
What is the Percentage of People in the Labor Force in Red Hill borough?
67.6% of People are in the Labor Force in Red Hill borough.
What is the Unemployment Rate in Red Hill borough?
Unemployment Rate in Red Hill borough is 5.4%.