Shiremanstown borough, PA Map & Demographics
Shiremanstown borough Overview
$33,757
PER CAPITA INCOME
$90,078
AVG FAMILY INCOME
$67,368
AVG HOUSEHOLD INCOME
7.4%
WAGE / INCOME GAP [ % ]
92.6¢/ $1
WAGE / INCOME GAP [ $ ]
0.33
INEQUALITY / GINI INDEX
1,751
TOTAL POPULATION
887
MALE POPULATION
864
FEMALE POPULATION
102.66
MALES / 100 FEMALES
97.41
FEMALES / 100 MALES
39.3
MEDIAN AGE
3.2
AVG FAMILY SIZE
2.3
AVG HOUSEHOLD SIZE
943
LABOR FORCE [ PEOPLE ]
64.3%
PERCENT IN LABOR FORCE
10.5%
UNEMPLOYMENT RATE
Income in Shiremanstown borough
Income Overview in Shiremanstown borough
Per Capita Income in Shiremanstown borough is $33,757, while median incomes of families and households are $90,078 and $67,368 respectively.
| Characteristic | Number | Measure |
| Per Capita Income | 1,751 | $33,757 |
| Median Family Income | 415 | $90,078 |
| Mean Family Income | 415 | $91,637 |
| Median Household Income | 748 | $67,368 |
| Mean Household Income | 748 | $75,681 |
| Income Deficit | 415 | $0 |
| Wage / Income Gap (%) | 1,751 | 7.41% |
| Wage / Income Gap ($) | 1,751 | 92.59¢ per $1 |
| Gini / Inequality Index | 1,751 | 0.33 |
Earnings by Sex in Shiremanstown borough
Average Earnings in Shiremanstown borough are $39,303, $41,563 for men and $38,482 for women, a difference of 7.4%.
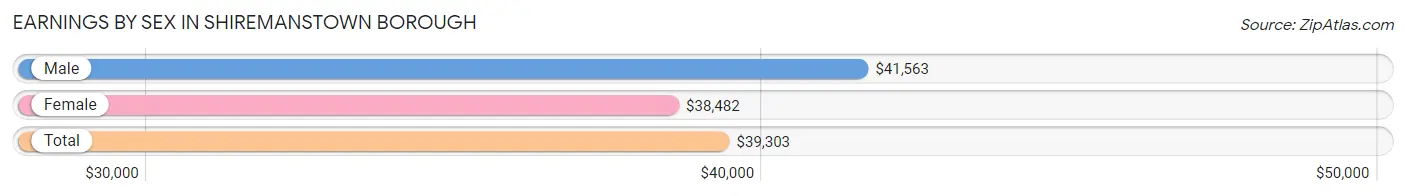
| Sex | Number | Average Earnings |
| Male | 585 (59.4%) | $41,563 |
| Female | 400 (40.6%) | $38,482 |
| Total | 985 (100.0%) | $39,303 |
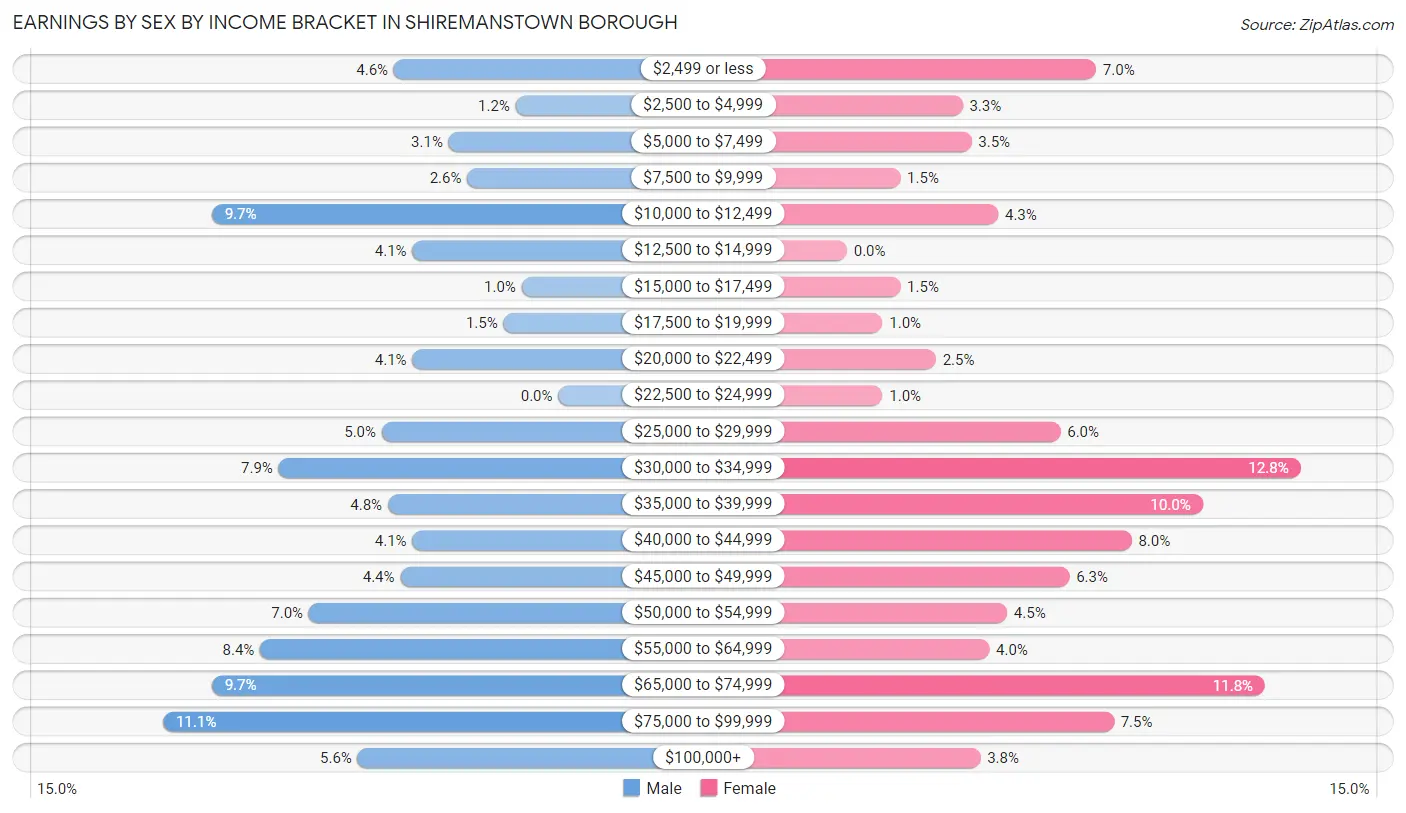
Earnings by Sex by Income Bracket in Shiremanstown borough
The most common earnings brackets in Shiremanstown borough are $75,000 to $99,999 for men (65 | 11.1%) and $30,000 to $34,999 for women (51 | 12.8%).
| Income | Male | Female |
| $2,499 or less | 27 (4.6%) | 28 (7.0%) |
| $2,500 to $4,999 | 7 (1.2%) | 13 (3.3%) |
| $5,000 to $7,499 | 18 (3.1%) | 14 (3.5%) |
| $7,500 to $9,999 | 15 (2.6%) | 6 (1.5%) |
| $10,000 to $12,499 | 57 (9.7%) | 17 (4.3%) |
| $12,500 to $14,999 | 24 (4.1%) | 0 (0.0%) |
| $15,000 to $17,499 | 6 (1.0%) | 6 (1.5%) |
| $17,500 to $19,999 | 9 (1.5%) | 4 (1.0%) |
| $20,000 to $22,499 | 24 (4.1%) | 10 (2.5%) |
| $22,500 to $24,999 | 0 (0.0%) | 4 (1.0%) |
| $25,000 to $29,999 | 29 (5.0%) | 24 (6.0%) |
| $30,000 to $34,999 | 46 (7.9%) | 51 (12.8%) |
| $35,000 to $39,999 | 28 (4.8%) | 40 (10.0%) |
| $40,000 to $44,999 | 24 (4.1%) | 32 (8.0%) |
| $45,000 to $49,999 | 26 (4.4%) | 25 (6.2%) |
| $50,000 to $54,999 | 41 (7.0%) | 18 (4.5%) |
| $55,000 to $64,999 | 49 (8.4%) | 16 (4.0%) |
| $65,000 to $74,999 | 57 (9.7%) | 47 (11.7%) |
| $75,000 to $99,999 | 65 (11.1%) | 30 (7.5%) |
| $100,000+ | 33 (5.6%) | 15 (3.7%) |
| Total | 585 (100.0%) | 400 (100.0%) |
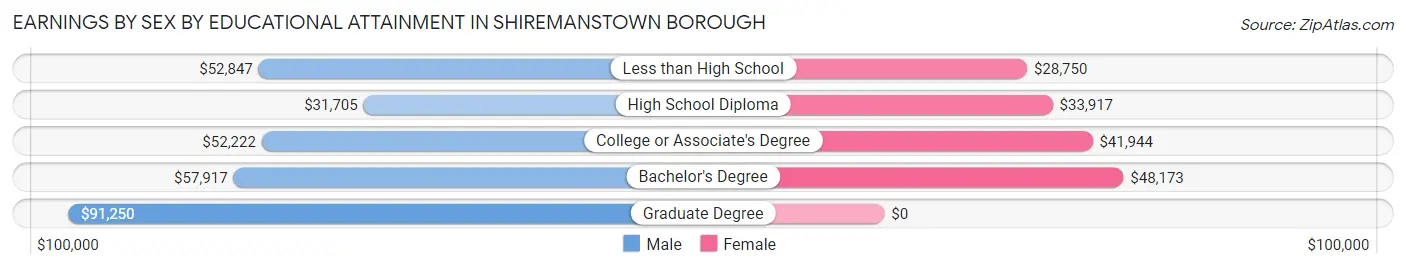
Earnings by Sex by Educational Attainment in Shiremanstown borough
Average earnings in Shiremanstown borough are $52,500 for men and $40,673 for women, a difference of 22.5%. Men with an educational attainment of graduate degree enjoy the highest average annual earnings of $91,250, while those with high school diploma education earn the least with $31,705. Women with an educational attainment of bachelor's degree earn the most with the average annual earnings of $48,173, while those with less than high school education have the smallest earnings of $28,750.
| Educational Attainment | Male Income | Female Income |
| Less than High School | $52,847 | $28,750 |
| High School Diploma | $31,705 | $33,917 |
| College or Associate's Degree | $52,222 | $41,944 |
| Bachelor's Degree | $57,917 | $48,173 |
| Graduate Degree | $91,250 | $0 |
| Total | $52,500 | $40,673 |
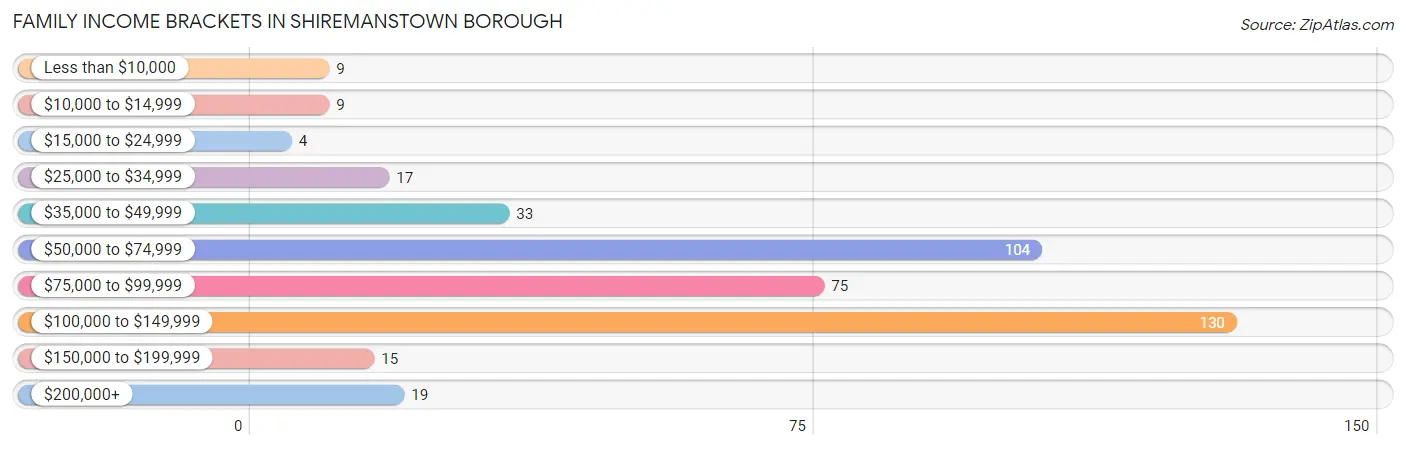
Family Income in Shiremanstown borough
Family Income Brackets in Shiremanstown borough
According to the Shiremanstown borough family income data, there are 130 families falling into the $100,000 to $149,999 income range, which is the most common income bracket and makes up 31.3% of all families. Conversely, the $15,000 to $24,999 income bracket is the least frequent group with only 4 families (1.0%) belonging to this category.
| Income Bracket | # Families | % Families |
| Less than $10,000 | 9 | 2.2% |
| $10,000 to $14,999 | 9 | 2.2% |
| $15,000 to $24,999 | 4 | 1.0% |
| $25,000 to $34,999 | 17 | 4.1% |
| $35,000 to $49,999 | 33 | 8.0% |
| $50,000 to $74,999 | 104 | 25.1% |
| $75,000 to $99,999 | 75 | 18.1% |
| $100,000 to $149,999 | 130 | 31.3% |
| $150,000 to $199,999 | 15 | 3.6% |
| $200,000+ | 19 | 4.6% |
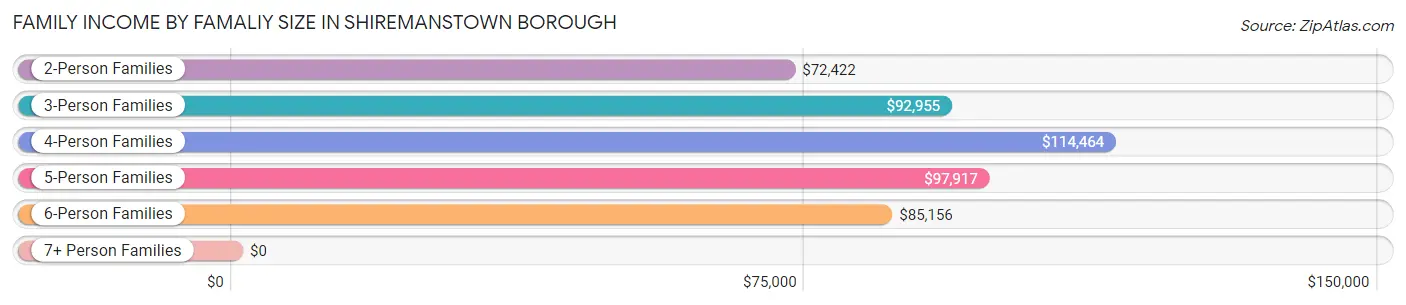
Family Income by Famaliy Size in Shiremanstown borough
4-person families (63 | 15.2%) account for the highest median family income in Shiremanstown borough with $114,464 per family, while 2-person families (179 | 43.1%) have the highest median income of $36,211 per family member.
| Income Bracket | # Families | Median Income |
| 2-Person Families | 179 (43.1%) | $72,422 |
| 3-Person Families | 120 (28.9%) | $92,955 |
| 4-Person Families | 63 (15.2%) | $114,464 |
| 5-Person Families | 36 (8.7%) | $97,917 |
| 6-Person Families | 17 (4.1%) | $85,156 |
| 7+ Person Families | 0 (0.0%) | $0 |
| Total | 415 (100.0%) | $90,078 |
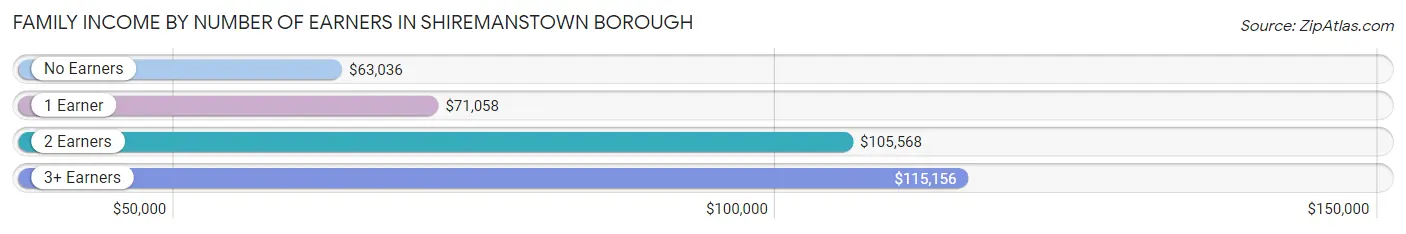
Family Income by Number of Earners in Shiremanstown borough
The median family income in Shiremanstown borough is $90,078, with families comprising 3+ earners (49) having the highest median family income of $115,156, while families with no earners (83) have the lowest median family income of $63,036, accounting for 11.8% and 20.0% of families, respectively.
| Number of Earners | # Families | Median Income |
| No Earners | 83 (20.0%) | $63,036 |
| 1 Earner | 119 (28.7%) | $71,058 |
| 2 Earners | 164 (39.5%) | $105,568 |
| 3+ Earners | 49 (11.8%) | $115,156 |
| Total | 415 (100.0%) | $90,078 |
Household Income in Shiremanstown borough
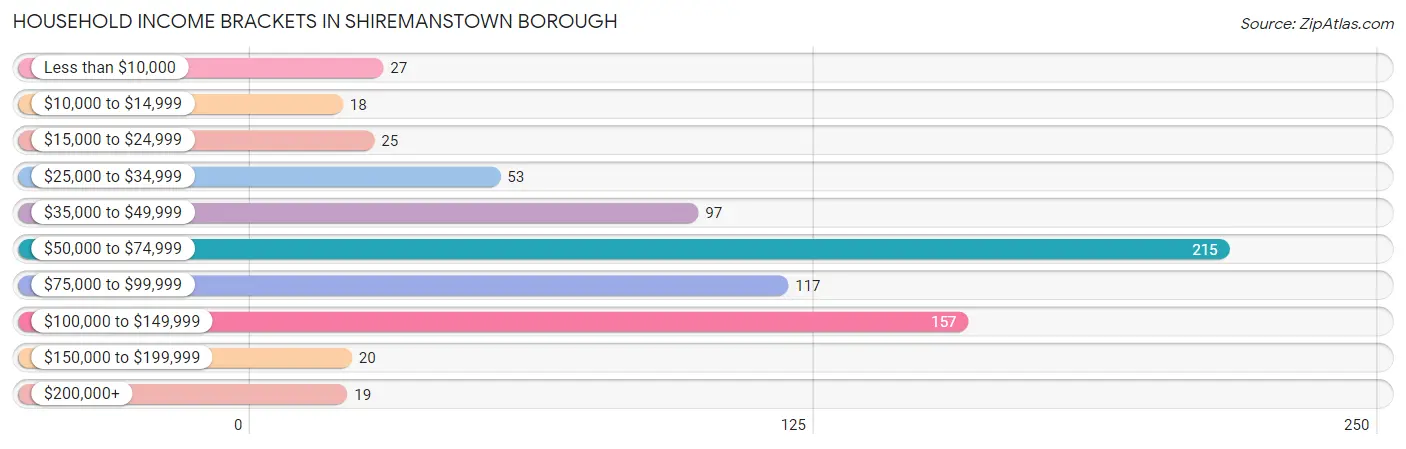
Household Income Brackets in Shiremanstown borough
With 215 households falling in the category, the $50,000 to $74,999 income range is the most frequent in Shiremanstown borough, accounting for 28.7% of all households. In contrast, only 18 households (2.4%) fall into the $10,000 to $14,999 income bracket, making it the least populous group.
| Income Bracket | # Households | % Households |
| Less than $10,000 | 27 | 3.6% |
| $10,000 to $14,999 | 18 | 2.4% |
| $15,000 to $24,999 | 25 | 3.3% |
| $25,000 to $34,999 | 53 | 7.1% |
| $35,000 to $49,999 | 97 | 13.0% |
| $50,000 to $74,999 | 215 | 28.7% |
| $75,000 to $99,999 | 117 | 15.6% |
| $100,000 to $149,999 | 157 | 21.0% |
| $150,000 to $199,999 | 20 | 2.7% |
| $200,000+ | 19 | 2.5% |
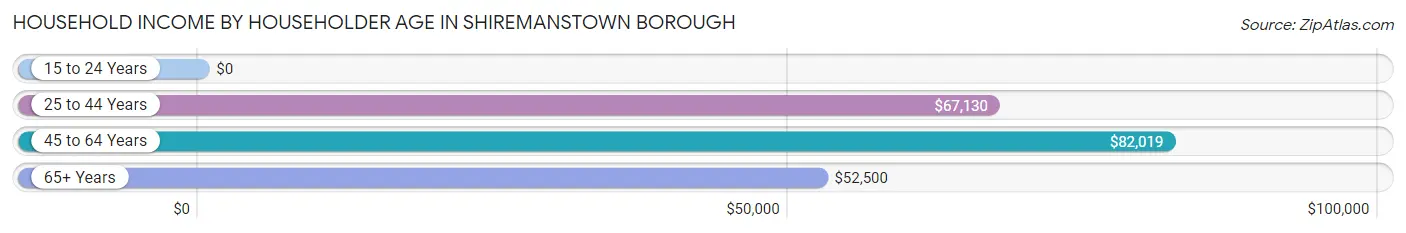
Household Income by Householder Age in Shiremanstown borough
The median household income in Shiremanstown borough is $67,368, with the highest median household income of $82,019 found in the 45 to 64 years age bracket for the primary householder. A total of 289 households (38.6%) fall into this category. Meanwhile, the 15 to 24 years age bracket for the primary householder has the lowest median household income of $0, with 23 households (3.1%) in this group.
| Income Bracket | # Households | Median Income |
| 15 to 24 Years | 23 (3.1%) | $0 |
| 25 to 44 Years | 244 (32.6%) | $67,130 |
| 45 to 64 Years | 289 (38.6%) | $82,019 |
| 65+ Years | 192 (25.7%) | $52,500 |
| Total | 748 (100.0%) | $67,368 |
Poverty in Shiremanstown borough
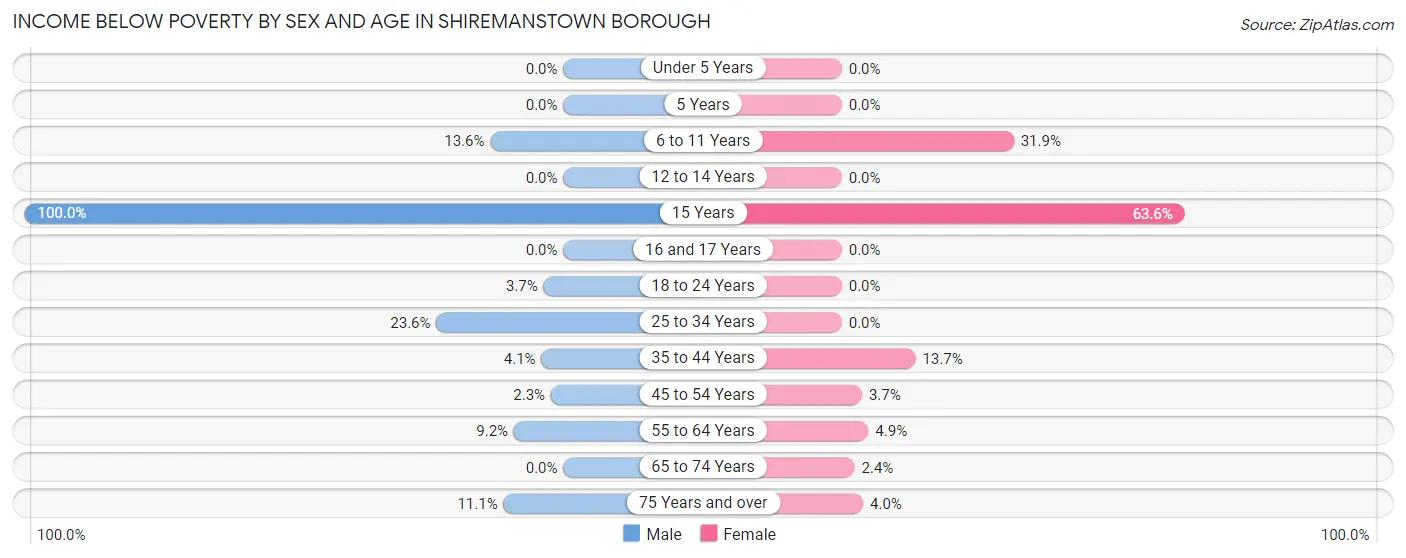
Income Below Poverty by Sex and Age in Shiremanstown borough
With 8.1% poverty level for males and 6.9% for females among the residents of Shiremanstown borough, 15 year old males and 15 year old females are the most vulnerable to poverty, with 4 males (100.0%) and 14 females (63.6%) in their respective age groups living below the poverty level.
| Age Bracket | Male | Female |
| Under 5 Years | 0 (0.0%) | 0 (0.0%) |
| 5 Years | 0 (0.0%) | 0 (0.0%) |
| 6 to 11 Years | 8 (13.6%) | 15 (31.9%) |
| 12 to 14 Years | 0 (0.0%) | 0 (0.0%) |
| 15 Years | 4 (100.0%) | 14 (63.6%) |
| 16 and 17 Years | 0 (0.0%) | 0 (0.0%) |
| 18 to 24 Years | 5 (3.7%) | 0 (0.0%) |
| 25 to 34 Years | 33 (23.6%) | 0 (0.0%) |
| 35 to 44 Years | 5 (4.1%) | 16 (13.7%) |
| 45 to 54 Years | 3 (2.3%) | 4 (3.7%) |
| 55 to 64 Years | 10 (9.2%) | 4 (4.9%) |
| 65 to 74 Years | 0 (0.0%) | 3 (2.4%) |
| 75 Years and over | 4 (11.1%) | 4 (4.0%) |
| Total | 72 (8.1%) | 60 (6.9%) |
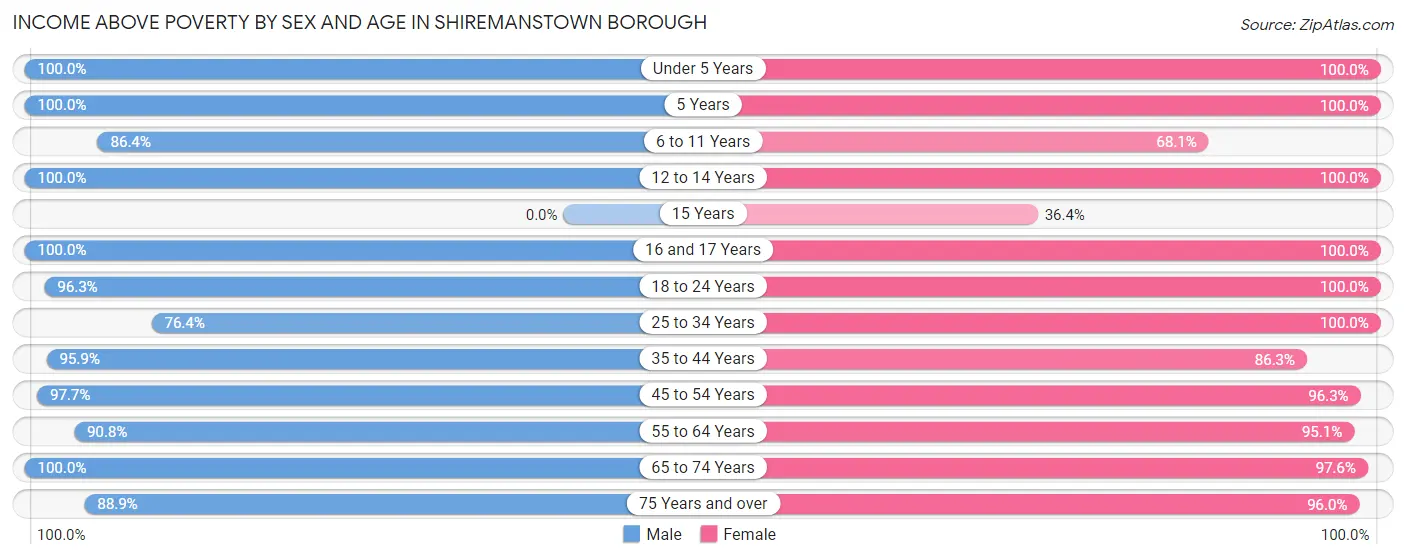
Income Above Poverty by Sex and Age in Shiremanstown borough
According to the poverty statistics in Shiremanstown borough, males aged under 5 years and females aged under 5 years are the age groups that are most secure financially, with 100.0% of males and 100.0% of females in these age groups living above the poverty line.
| Age Bracket | Male | Female |
| Under 5 Years | 39 (100.0%) | 36 (100.0%) |
| 5 Years | 3 (100.0%) | 6 (100.0%) |
| 6 to 11 Years | 51 (86.4%) | 32 (68.1%) |
| 12 to 14 Years | 16 (100.0%) | 52 (100.0%) |
| 15 Years | 0 (0.0%) | 8 (36.4%) |
| 16 and 17 Years | 15 (100.0%) | 27 (100.0%) |
| 18 to 24 Years | 131 (96.3%) | 29 (100.0%) |
| 25 to 34 Years | 107 (76.4%) | 113 (100.0%) |
| 35 to 44 Years | 118 (95.9%) | 101 (86.3%) |
| 45 to 54 Years | 127 (97.7%) | 103 (96.3%) |
| 55 to 64 Years | 99 (90.8%) | 77 (95.1%) |
| 65 to 74 Years | 77 (100.0%) | 123 (97.6%) |
| 75 Years and over | 32 (88.9%) | 97 (96.0%) |
| Total | 815 (91.9%) | 804 (93.1%) |
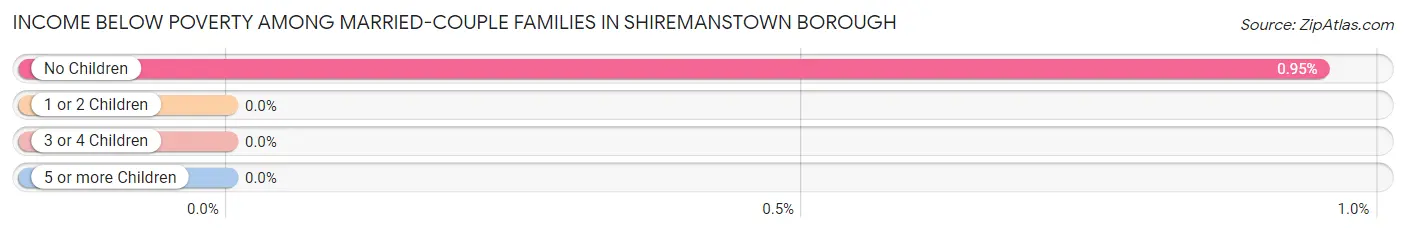
Income Below Poverty Among Married-Couple Families in Shiremanstown borough
The poverty statistics for married-couple families in Shiremanstown borough show that 0.6% or 2 of the total 337 families live below the poverty line. Families with no children have the highest poverty rate of 0.9%, comprising of 2 families. On the other hand, families with 1 or 2 children have the lowest poverty rate of 0.0%, which includes 0 families.
| Children | Above Poverty | Below Poverty |
| No Children | 208 (99.1%) | 2 (0.9%) |
| 1 or 2 Children | 94 (100.0%) | 0 (0.0%) |
| 3 or 4 Children | 33 (100.0%) | 0 (0.0%) |
| 5 or more Children | 0 (0.0%) | 0 (0.0%) |
| Total | 335 (99.4%) | 2 (0.6%) |
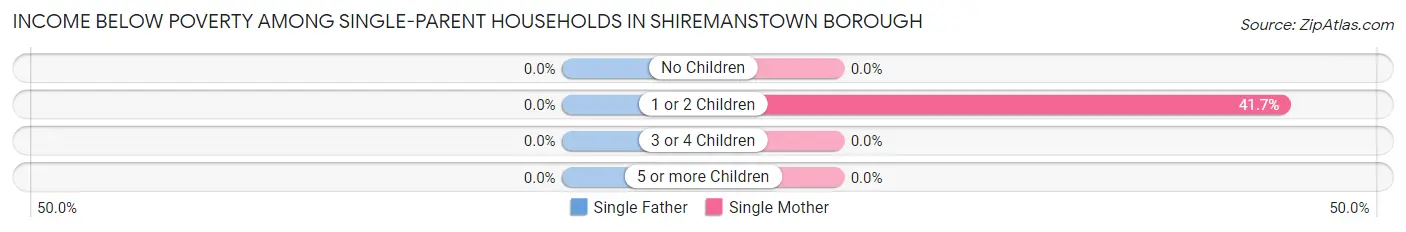
Income Below Poverty Among Single-Parent Households in Shiremanstown borough
| Children | Single Father | Single Mother |
| No Children | 0 (0.0%) | 0 (0.0%) |
| 1 or 2 Children | 0 (0.0%) | 20 (41.7%) |
| 3 or 4 Children | 0 (0.0%) | 0 (0.0%) |
| 5 or more Children | 0 (0.0%) | 0 (0.0%) |
| Total | 0 (0.0%) | 20 (27.4%) |
Income Below Poverty Among Married-Couple vs Single-Parent Households in Shiremanstown borough
The poverty data for Shiremanstown borough shows that 2 of the married-couple family households (0.6%) and 20 of the single-parent households (25.6%) are living below the poverty level. Within the married-couple family households, those with no children have the highest poverty rate, with 2 households (0.9%) falling below the poverty line. Among the single-parent households, those with 1 or 2 children have the highest poverty rate, with 20 household (37.7%) living below poverty.
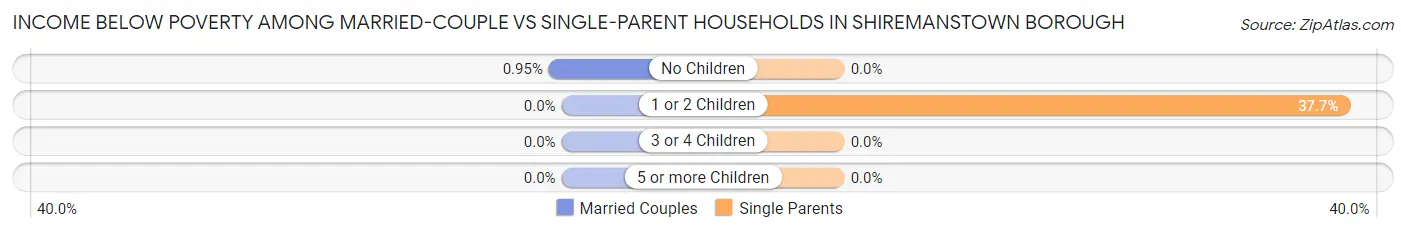
| Children | Married-Couple Families | Single-Parent Households |
| No Children | 2 (0.9%) | 0 (0.0%) |
| 1 or 2 Children | 0 (0.0%) | 20 (37.7%) |
| 3 or 4 Children | 0 (0.0%) | 0 (0.0%) |
| 5 or more Children | 0 (0.0%) | 0 (0.0%) |
| Total | 2 (0.6%) | 20 (25.6%) |
Race in Shiremanstown borough
The most populous races in Shiremanstown borough are White / Caucasian (1,464 | 83.6%), Hispanic or Latino (135 | 7.7%), and Two or more Races (99 | 5.7%).
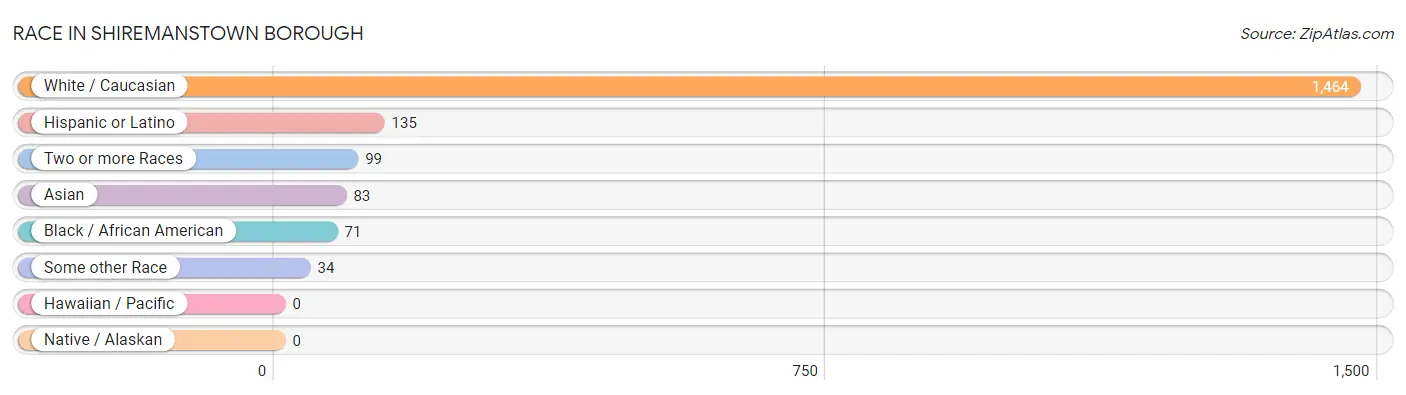
| Race | # Population | % Population |
| Asian | 83 | 4.7% |
| Black / African American | 71 | 4.1% |
| Hawaiian / Pacific | 0 | 0.0% |
| Hispanic or Latino | 135 | 7.7% |
| Native / Alaskan | 0 | 0.0% |
| White / Caucasian | 1,464 | 83.6% |
| Two or more Races | 99 | 5.7% |
| Some other Race | 34 | 1.9% |
| Total | 1,751 | 100.0% |
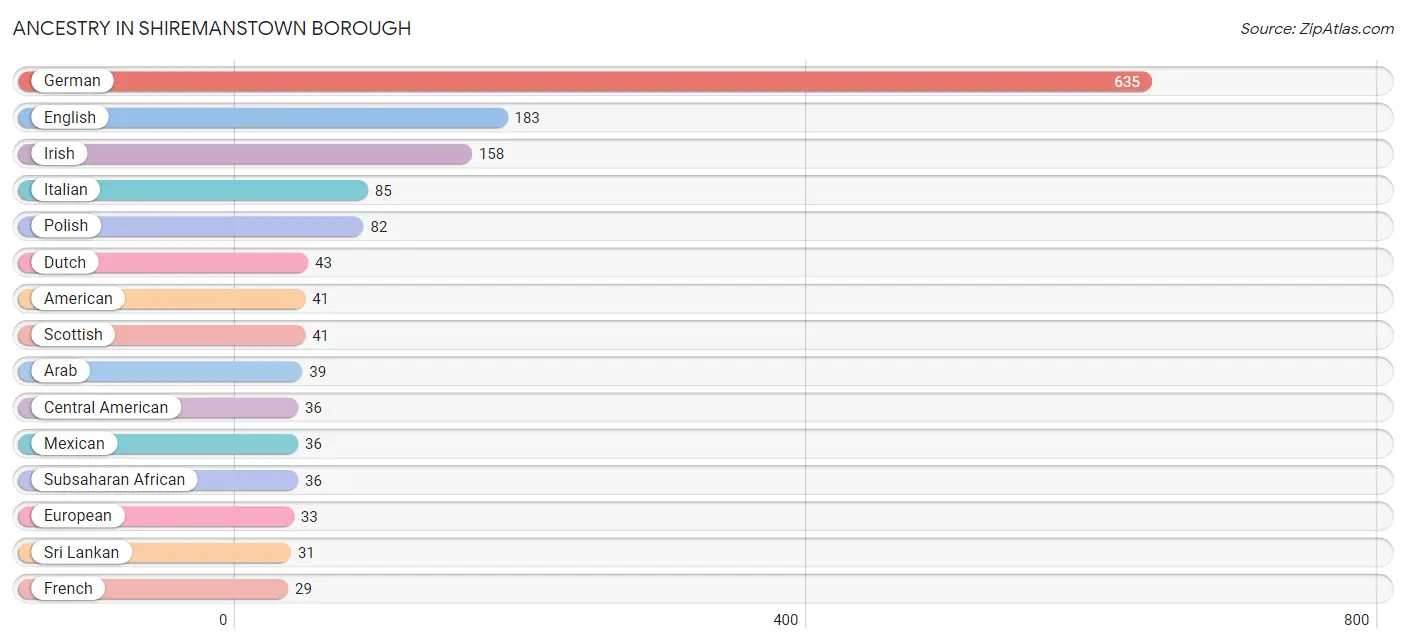
Ancestry in Shiremanstown borough
The most populous ancestries reported in Shiremanstown borough are German (635 | 36.3%), English (183 | 10.4%), Irish (158 | 9.0%), Italian (85 | 4.9%), and Polish (82 | 4.7%), together accounting for 65.3% of all Shiremanstown borough residents.
| Ancestry | # Population | % Population |
| African | 23 | 1.3% |
| American | 41 | 2.3% |
| Arab | 39 | 2.2% |
| Armenian | 4 | 0.2% |
| Brazilian | 8 | 0.5% |
| British | 4 | 0.2% |
| Burmese | 6 | 0.3% |
| Canadian | 9 | 0.5% |
| Central American | 36 | 2.1% |
| Croatian | 6 | 0.3% |
| Cuban | 3 | 0.2% |
| Czech | 15 | 0.9% |
| Dutch | 43 | 2.5% |
| Eastern European | 4 | 0.2% |
| Ecuadorian | 14 | 0.8% |
| Egyptian | 10 | 0.6% |
| English | 183 | 10.4% |
| European | 33 | 1.9% |
| French | 29 | 1.7% |
| French Canadian | 27 | 1.5% |
| German | 635 | 36.3% |
| Greek | 16 | 0.9% |
| Honduran | 19 | 1.1% |
| Hungarian | 9 | 0.5% |
| Indian (Asian) | 10 | 0.6% |
| Irish | 158 | 9.0% |
| Italian | 85 | 4.9% |
| Japanese | 7 | 0.4% |
| Korean | 6 | 0.3% |
| Laotian | 7 | 0.4% |
| Latvian | 3 | 0.2% |
| Lebanese | 3 | 0.2% |
| Mexican | 36 | 2.1% |
| Moroccan | 12 | 0.7% |
| Northern European | 4 | 0.2% |
| Norwegian | 9 | 0.5% |
| Pakistani | 2 | 0.1% |
| Pennsylvania German | 10 | 0.6% |
| Polish | 82 | 4.7% |
| Puerto Rican | 29 | 1.7% |
| Russian | 3 | 0.2% |
| Salvadoran | 17 | 1.0% |
| Scotch-Irish | 28 | 1.6% |
| Scottish | 41 | 2.3% |
| Serbian | 11 | 0.6% |
| Slovak | 7 | 0.4% |
| Somali | 13 | 0.7% |
| South American | 14 | 0.8% |
| Spanish | 8 | 0.5% |
| Sri Lankan | 31 | 1.8% |
| Subsaharan African | 36 | 2.1% |
| Swedish | 4 | 0.2% |
| Swiss | 7 | 0.4% |
| Thai | 24 | 1.4% |
| Ukrainian | 3 | 0.2% |
| Welsh | 6 | 0.3% |
| Yugoslavian | 22 | 1.3% | View All 57 Rows |
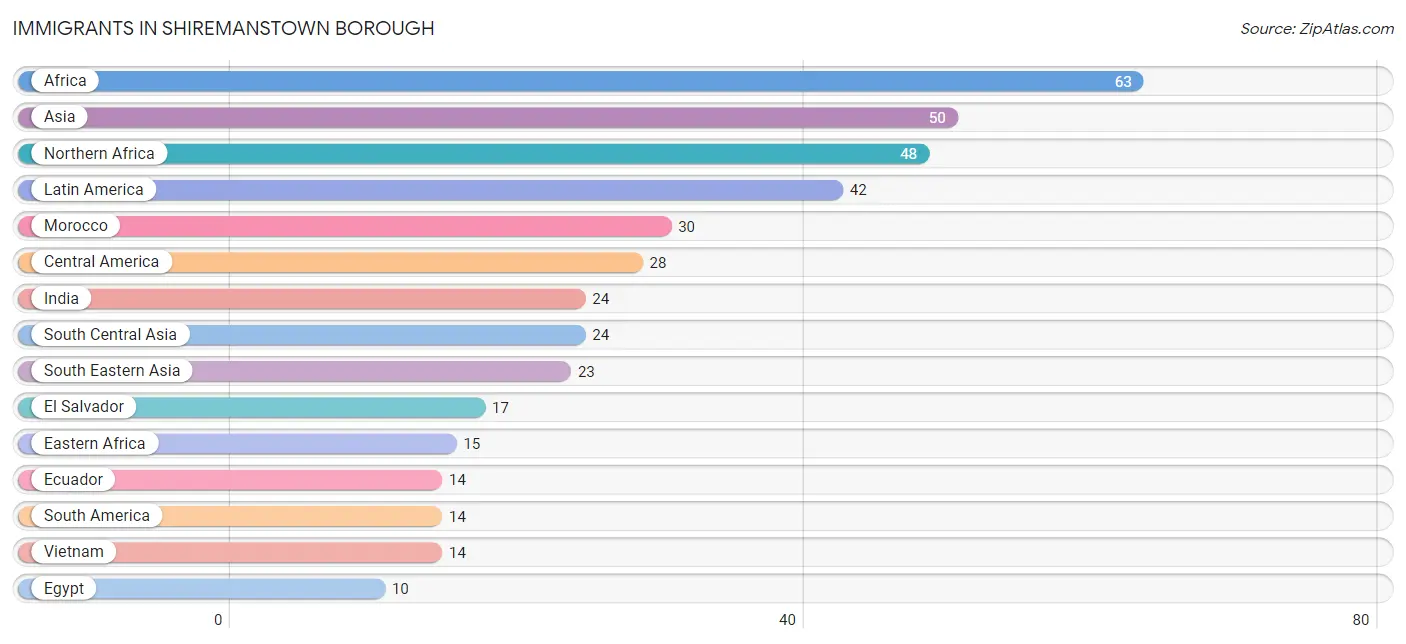
Immigrants in Shiremanstown borough
The most numerous immigrant groups reported in Shiremanstown borough came from Africa (63 | 3.6%), Asia (50 | 2.9%), Northern Africa (48 | 2.7%), Latin America (42 | 2.4%), and Morocco (30 | 1.7%), together accounting for 13.3% of all Shiremanstown borough residents.
| Immigration Origin | # Population | % Population |
| Africa | 63 | 3.6% |
| Asia | 50 | 2.9% |
| Bosnia and Herzegovina | 9 | 0.5% |
| Cambodia | 2 | 0.1% |
| Canada | 9 | 0.5% |
| Central America | 28 | 1.6% |
| Eastern Africa | 15 | 0.9% |
| Eastern Asia | 3 | 0.2% |
| Eastern Europe | 9 | 0.5% |
| Ecuador | 14 | 0.8% |
| Egypt | 10 | 0.6% |
| El Salvador | 17 | 1.0% |
| Ethiopia | 8 | 0.5% |
| Europe | 9 | 0.5% |
| Honduras | 7 | 0.4% |
| India | 24 | 1.4% |
| Indonesia | 2 | 0.1% |
| Kenya | 5 | 0.3% |
| Korea | 3 | 0.2% |
| Latin America | 42 | 2.4% |
| Mexico | 4 | 0.2% |
| Morocco | 30 | 1.7% |
| Northern Africa | 48 | 2.7% |
| Philippines | 3 | 0.2% |
| South America | 14 | 0.8% |
| South Central Asia | 24 | 1.4% |
| South Eastern Asia | 23 | 1.3% |
| Thailand | 2 | 0.1% |
| Vietnam | 14 | 0.8% |
| Zimbabwe | 2 | 0.1% | View All 30 Rows |
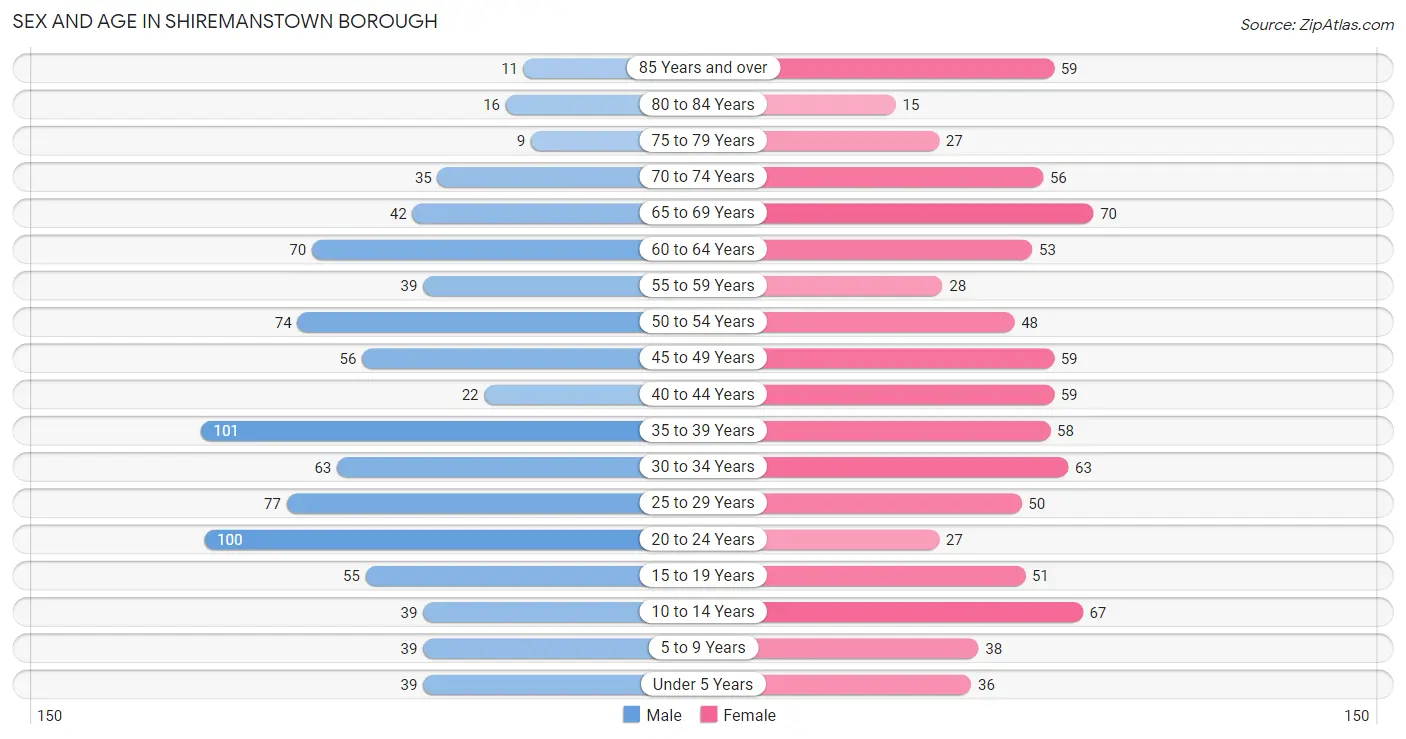
Sex and Age in Shiremanstown borough
Sex and Age in Shiremanstown borough
The most populous age groups in Shiremanstown borough are 35 to 39 Years (101 | 11.4%) for men and 65 to 69 Years (70 | 8.1%) for women.
| Age Bracket | Male | Female |
| Under 5 Years | 39 (4.4%) | 36 (4.2%) |
| 5 to 9 Years | 39 (4.4%) | 38 (4.4%) |
| 10 to 14 Years | 39 (4.4%) | 67 (7.7%) |
| 15 to 19 Years | 55 (6.2%) | 51 (5.9%) |
| 20 to 24 Years | 100 (11.3%) | 27 (3.1%) |
| 25 to 29 Years | 77 (8.7%) | 50 (5.8%) |
| 30 to 34 Years | 63 (7.1%) | 63 (7.3%) |
| 35 to 39 Years | 101 (11.4%) | 58 (6.7%) |
| 40 to 44 Years | 22 (2.5%) | 59 (6.8%) |
| 45 to 49 Years | 56 (6.3%) | 59 (6.8%) |
| 50 to 54 Years | 74 (8.3%) | 48 (5.6%) |
| 55 to 59 Years | 39 (4.4%) | 28 (3.2%) |
| 60 to 64 Years | 70 (7.9%) | 53 (6.1%) |
| 65 to 69 Years | 42 (4.7%) | 70 (8.1%) |
| 70 to 74 Years | 35 (4.0%) | 56 (6.5%) |
| 75 to 79 Years | 9 (1.0%) | 27 (3.1%) |
| 80 to 84 Years | 16 (1.8%) | 15 (1.7%) |
| 85 Years and over | 11 (1.2%) | 59 (6.8%) |
| Total | 887 (100.0%) | 864 (100.0%) |
Families and Households in Shiremanstown borough
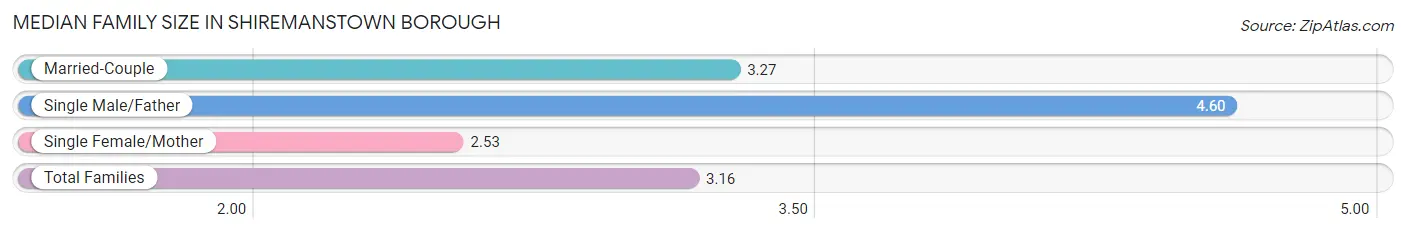
Median Family Size in Shiremanstown borough
The median family size in Shiremanstown borough is 3.16 persons per family, with single male/father families (5 | 1.2%) accounting for the largest median family size of 4.6 persons per family. On the other hand, single female/mother families (73 | 17.6%) represent the smallest median family size with 2.53 persons per family.
| Family Type | # Families | Family Size |
| Married-Couple | 337 (81.2%) | 3.27 |
| Single Male/Father | 5 (1.2%) | 4.60 |
| Single Female/Mother | 73 (17.6%) | 2.53 |
| Total Families | 415 (100.0%) | 3.16 |
Median Household Size in Shiremanstown borough
The median household size in Shiremanstown borough is 2.33 persons per household, with single male/father households (5 | 0.7%) accounting for the largest median household size of 4.6 persons per household. non-family households (333 | 44.5%) represent the smallest median household size with 1.23 persons per household.

| Household Type | # Households | Household Size |
| Married-Couple | 337 (45.1%) | 3.29 |
| Single Male/Father | 5 (0.7%) | 4.60 |
| Single Female/Mother | 73 (9.8%) | 2.74 |
| Non-family | 333 (44.5%) | 1.23 |
| Total Households | 748 (100.0%) | 2.33 |
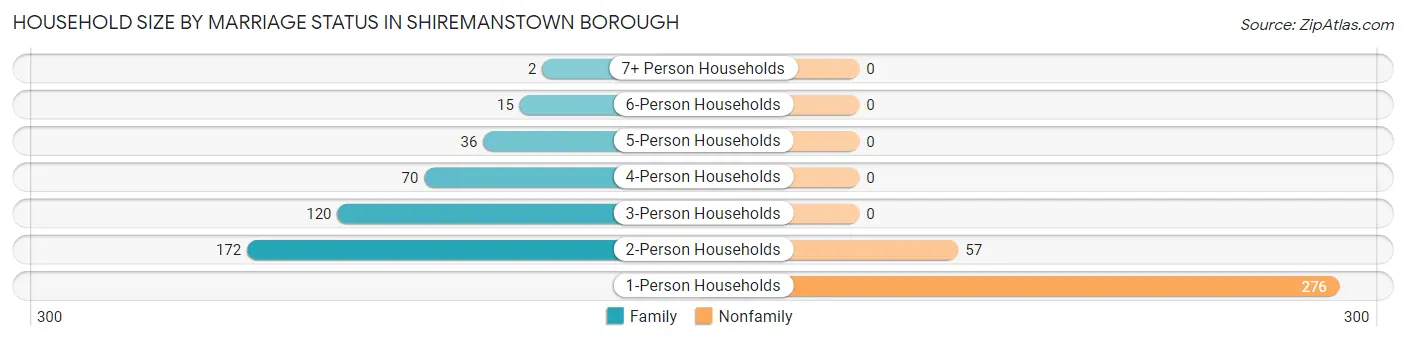
Household Size by Marriage Status in Shiremanstown borough
Out of a total of 748 households in Shiremanstown borough, 415 (55.5%) are family households, while 333 (44.5%) are nonfamily households. The most numerous type of family households are 2-person households, comprising 172, and the most common type of nonfamily households are 1-person households, comprising 276.
| Household Size | Family Households | Nonfamily Households |
| 1-Person Households | - | 276 (36.9%) |
| 2-Person Households | 172 (23.0%) | 57 (7.6%) |
| 3-Person Households | 120 (16.0%) | 0 (0.0%) |
| 4-Person Households | 70 (9.4%) | 0 (0.0%) |
| 5-Person Households | 36 (4.8%) | 0 (0.0%) |
| 6-Person Households | 15 (2.0%) | 0 (0.0%) |
| 7+ Person Households | 2 (0.3%) | 0 (0.0%) |
| Total | 415 (55.5%) | 333 (44.5%) |
Female Fertility in Shiremanstown borough
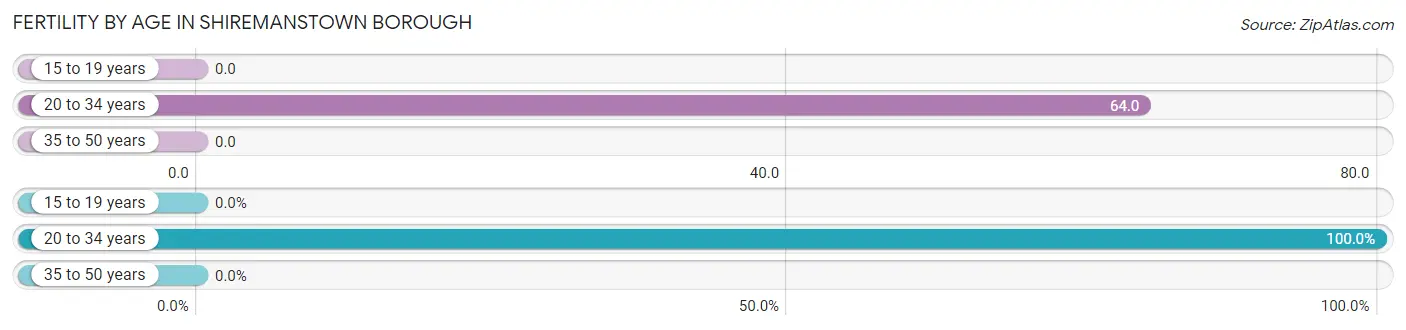
Fertility by Age in Shiremanstown borough
Average fertility rate in Shiremanstown borough is 24.0 births per 1,000 women. Women in the age bracket of 20 to 34 years have the highest fertility rate with 64.0 births per 1,000 women. Women in the age bracket of 20 to 34 years acount for 100.0% of all women with births.
| Age Bracket | Women with Births | Births / 1,000 Women |
| 15 to 19 years | 0 (0.0%) | 0.0 |
| 20 to 34 years | 9 (100.0%) | 64.0 |
| 35 to 50 years | 0 (0.0%) | 0.0 |
| Total | 9 (100.0%) | 24.0 |
Fertility by Age by Marriage Status in Shiremanstown borough
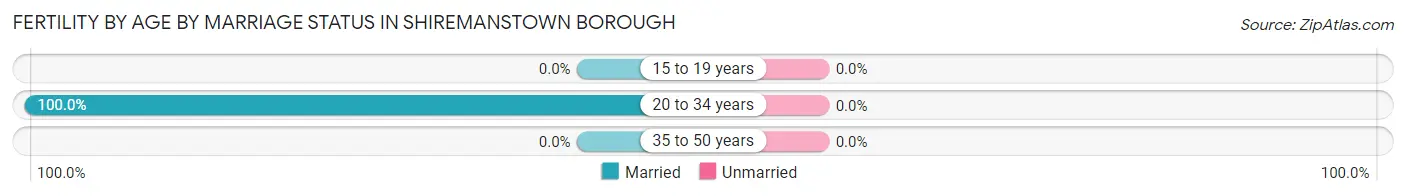
| Age Bracket | Married | Unmarried |
| 15 to 19 years | 0 (0.0%) | 0 (0.0%) |
| 20 to 34 years | 9 (100.0%) | 0 (0.0%) |
| 35 to 50 years | 0 (0.0%) | 0 (0.0%) |
| Total | 9 (100.0%) | 0 (0.0%) |
Fertility by Education in Shiremanstown borough
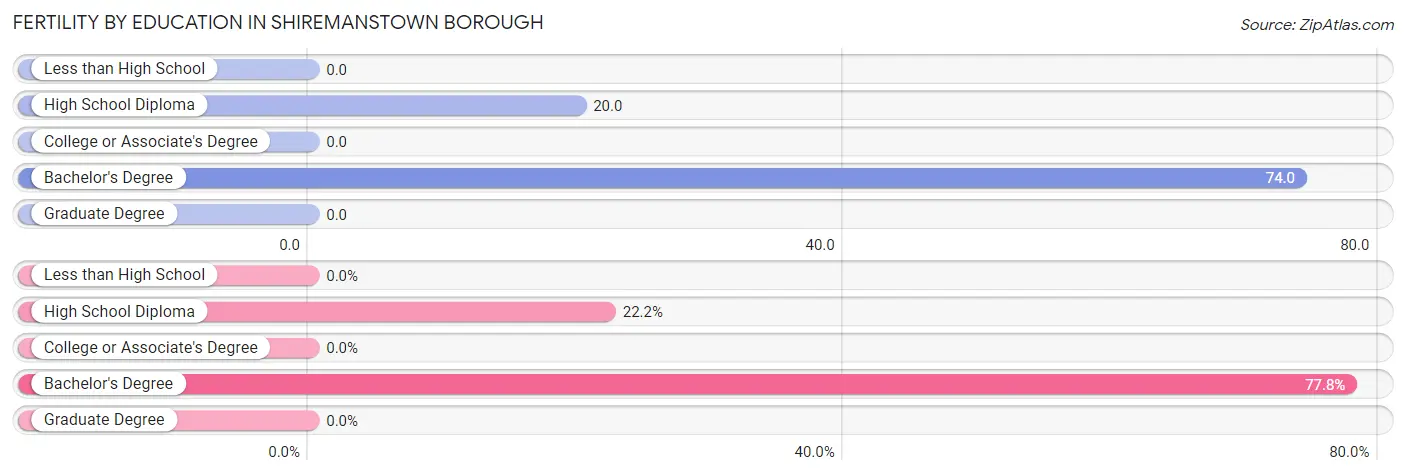
| Educational Attainment | Women with Births | Births / 1,000 Women |
| Less than High School | 0 (0.0%) | 0.0 |
| High School Diploma | 2 (22.2%) | 20.0 |
| College or Associate's Degree | 0 (0.0%) | 0.0 |
| Bachelor's Degree | 7 (77.8%) | 74.0 |
| Graduate Degree | 0 (0.0%) | 0.0 |
| Total | 9 (100.0%) | 24.0 |
Fertility by Education by Marriage Status in Shiremanstown borough
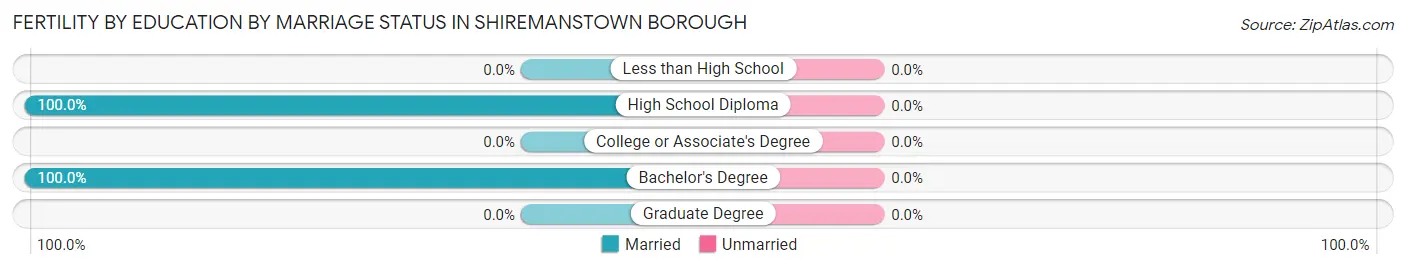
| Educational Attainment | Married | Unmarried |
| Less than High School | 0 (0.0%) | 0 (0.0%) |
| High School Diploma | 2 (100.0%) | 0 (0.0%) |
| College or Associate's Degree | 0 (0.0%) | 0 (0.0%) |
| Bachelor's Degree | 7 (100.0%) | 0 (0.0%) |
| Graduate Degree | 0 (0.0%) | 0 (0.0%) |
| Total | 9 (100.0%) | 0 (0.0%) |
Employment Characteristics in Shiremanstown borough
Employment by Class of Employer in Shiremanstown borough
Among the 825 employed individuals in Shiremanstown borough, private company employees (587 | 71.2%), state government employees (86 | 10.4%), and not-for-profit organizations (69 | 8.4%) make up the most common classes of employment.
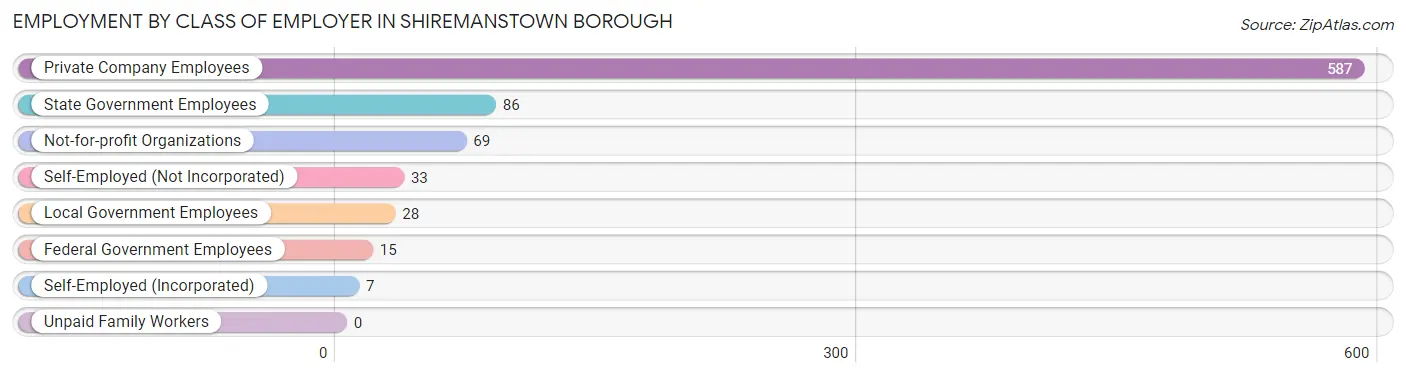
| Employer Class | # Employees | % Employees |
| Private Company Employees | 587 | 71.2% |
| Self-Employed (Incorporated) | 7 | 0.9% |
| Self-Employed (Not Incorporated) | 33 | 4.0% |
| Not-for-profit Organizations | 69 | 8.4% |
| Local Government Employees | 28 | 3.4% |
| State Government Employees | 86 | 10.4% |
| Federal Government Employees | 15 | 1.8% |
| Unpaid Family Workers | 0 | 0.0% |
| Total | 825 | 100.0% |
Employment Status by Age in Shiremanstown borough
According to the labor force statistics for Shiremanstown borough, out of the total population over 16 years of age (1,467), 64.3% or 943 individuals are in the labor force, with 10.5% or 99 of them unemployed. The age group with the highest labor force participation rate is 20 to 24 years, with 100.0% or 127 individuals in the labor force. Within the labor force, the 20 to 24 years age range has the highest percentage of unemployed individuals, with 44.9% or 57 of them being unemployed.
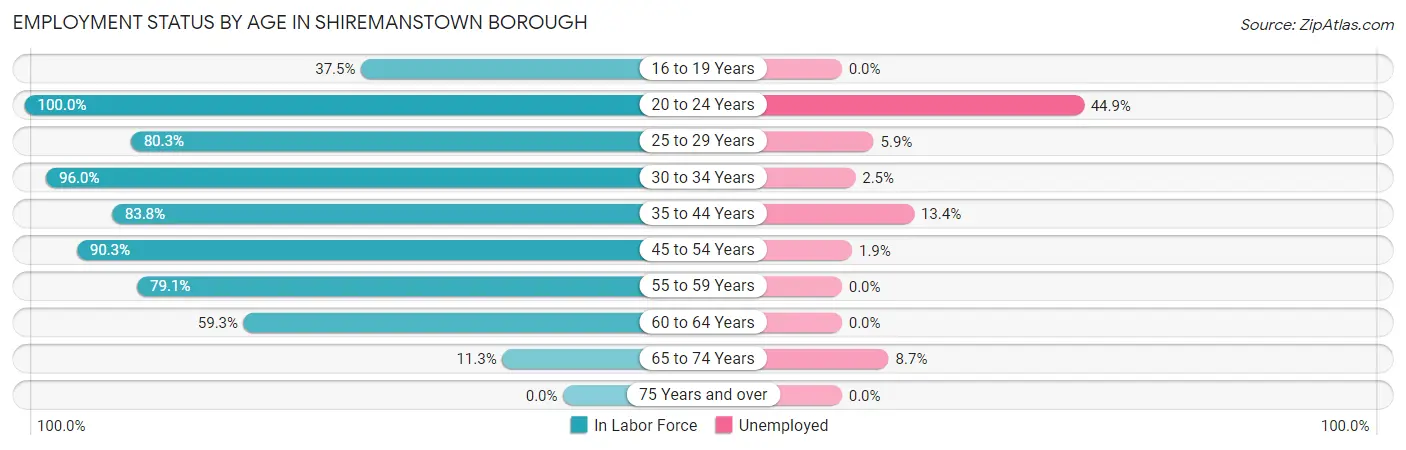
| Age Bracket | In Labor Force | Unemployed |
| 16 to 19 Years | 30 (37.5%) | 0 (0.0%) |
| 20 to 24 Years | 127 (100.0%) | 57 (44.9%) |
| 25 to 29 Years | 102 (80.3%) | 6 (5.9%) |
| 30 to 34 Years | 121 (96.0%) | 3 (2.5%) |
| 35 to 44 Years | 201 (83.8%) | 27 (13.4%) |
| 45 to 54 Years | 214 (90.3%) | 4 (1.9%) |
| 55 to 59 Years | 53 (79.1%) | 0 (0.0%) |
| 60 to 64 Years | 73 (59.3%) | 0 (0.0%) |
| 65 to 74 Years | 23 (11.3%) | 2 (8.7%) |
| 75 Years and over | 0 (0.0%) | 0 (0.0%) |
| Total | 943 (64.3%) | 99 (10.5%) |
Employment Status by Educational Attainment in Shiremanstown borough
According to labor force statistics for Shiremanstown borough, 83.0% of individuals (764) out of the total population between 25 and 64 years of age (920) are in the labor force, with 5.2% or 40 of them being unemployed. The group with the highest labor force participation rate are those with the educational attainment of bachelor's degree or higher, with 90.7% or 313 individuals in the labor force. Within the labor force, individuals with less than high school education have the highest percentage of unemployment, with 43.9% or 18 of them being unemployed.
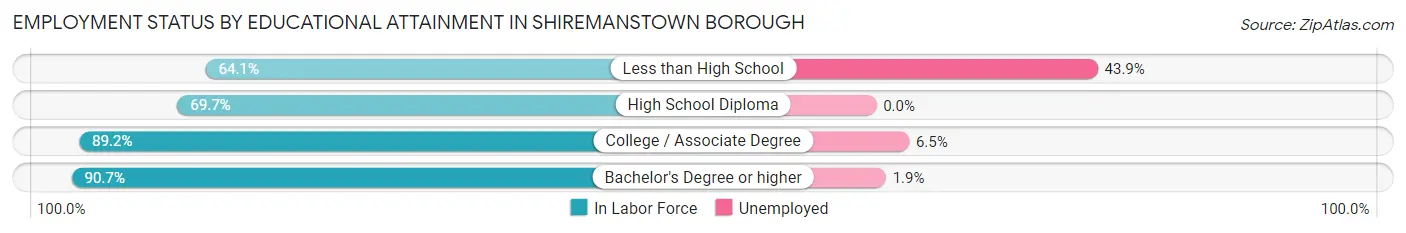
| Educational Attainment | In Labor Force | Unemployed |
| Less than High School | 41 (64.1%) | 28 (43.9%) |
| High School Diploma | 163 (69.7%) | 0 (0.0%) |
| College / Associate Degree | 247 (89.2%) | 18 (6.5%) |
| Bachelor's Degree or higher | 313 (90.7%) | 7 (1.9%) |
| Total | 764 (83.0%) | 48 (5.2%) |
Employment Occupations by Sex in Shiremanstown borough
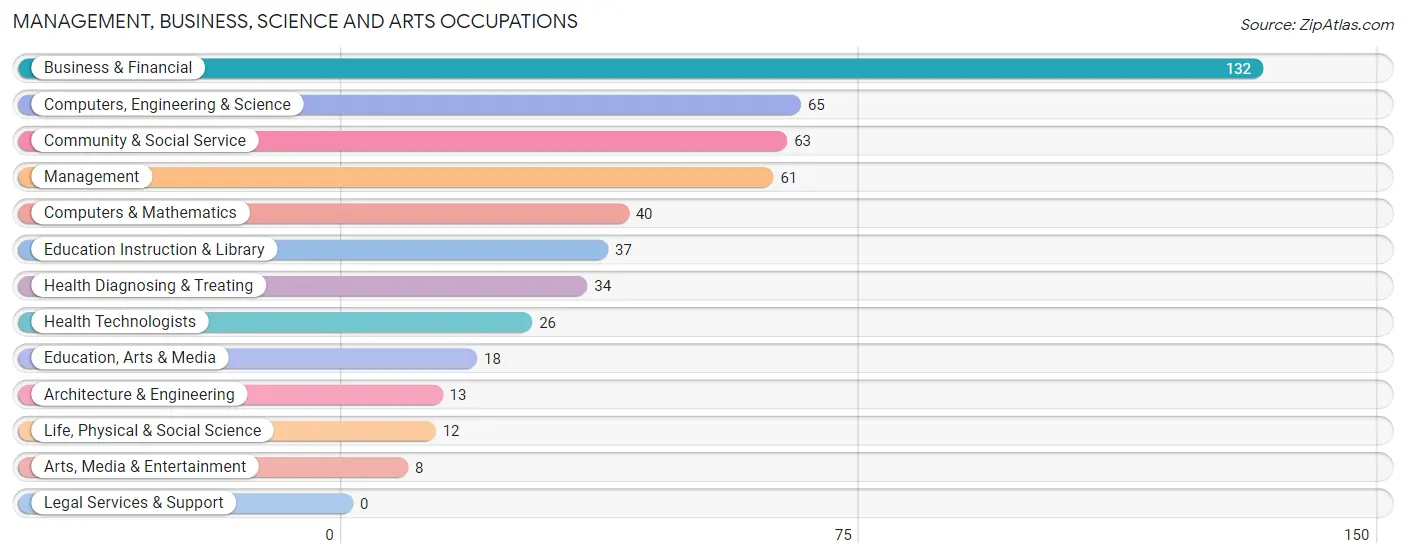
Management, Business, Science and Arts Occupations
The most common Management, Business, Science and Arts occupations in Shiremanstown borough are Business & Financial (132 | 15.6%), Computers, Engineering & Science (65 | 7.7%), Community & Social Service (63 | 7.5%), Management (61 | 7.2%), and Computers & Mathematics (40 | 4.7%).
Management, Business, Science and Arts Occupations by Sex
Within the Management, Business, Science and Arts occupations in Shiremanstown borough, the most male-oriented occupations are Education, Arts & Media (83.3%), Architecture & Engineering (76.9%), and Life, Physical & Social Science (58.3%), while the most female-oriented occupations are Health Diagnosing & Treating (100.0%), Health Technologists (100.0%), and Education Instruction & Library (86.5%).
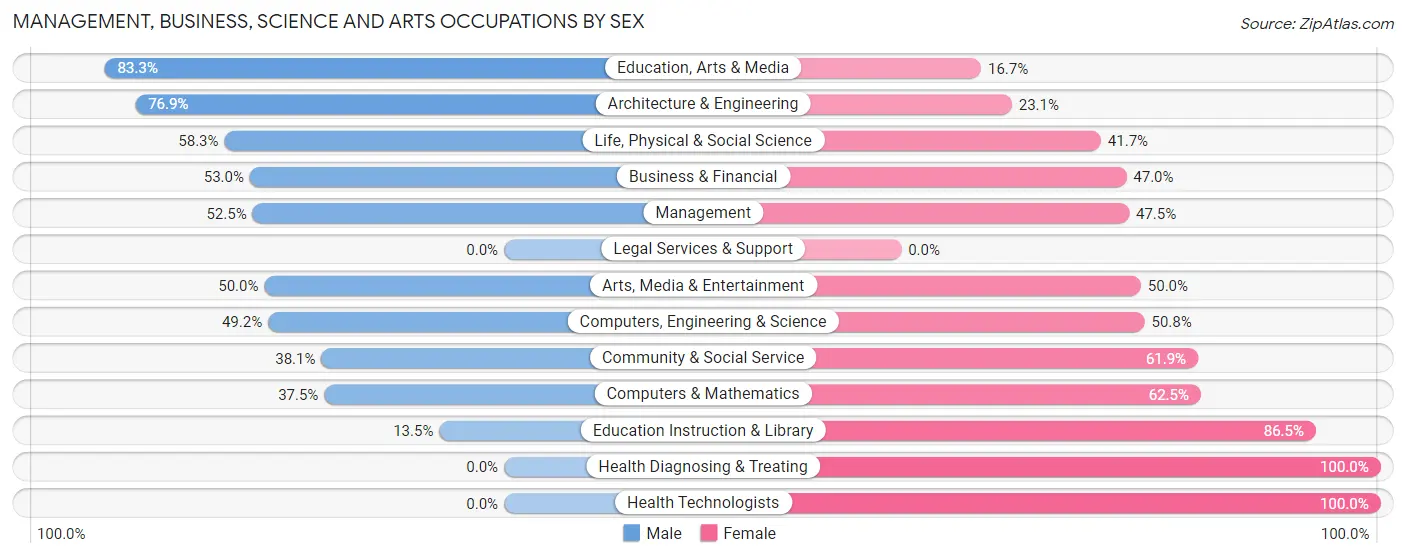
| Occupation | Male | Female |
| Management | 32 (52.5%) | 29 (47.5%) |
| Business & Financial | 70 (53.0%) | 62 (47.0%) |
| Computers, Engineering & Science | 32 (49.2%) | 33 (50.8%) |
| Computers & Mathematics | 15 (37.5%) | 25 (62.5%) |
| Architecture & Engineering | 10 (76.9%) | 3 (23.1%) |
| Life, Physical & Social Science | 7 (58.3%) | 5 (41.7%) |
| Community & Social Service | 24 (38.1%) | 39 (61.9%) |
| Education, Arts & Media | 15 (83.3%) | 3 (16.7%) |
| Legal Services & Support | 0 (0.0%) | 0 (0.0%) |
| Education Instruction & Library | 5 (13.5%) | 32 (86.5%) |
| Arts, Media & Entertainment | 4 (50.0%) | 4 (50.0%) |
| Health Diagnosing & Treating | 0 (0.0%) | 34 (100.0%) |
| Health Technologists | 0 (0.0%) | 26 (100.0%) |
| Total (Category) | 158 (44.5%) | 197 (55.5%) |
| Total (Overall) | 479 (56.7%) | 366 (43.3%) |
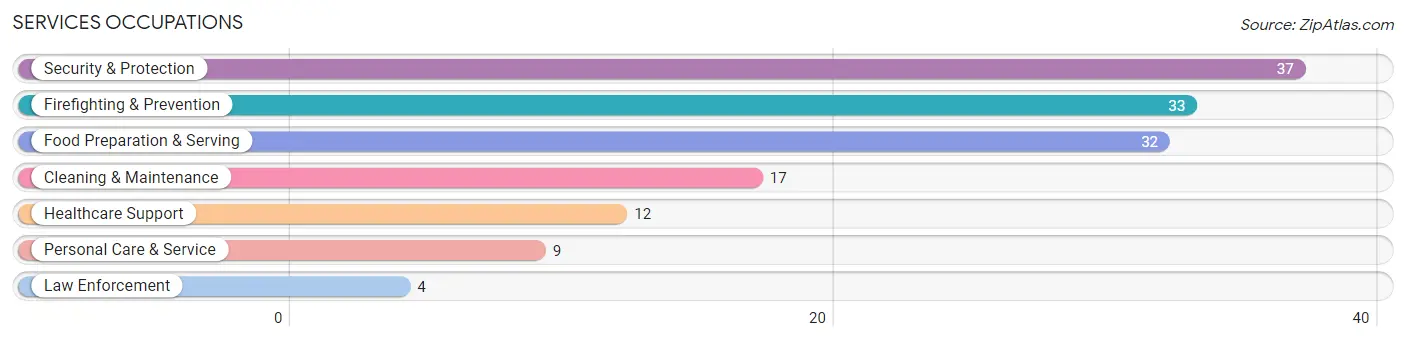
Services Occupations
The most common Services occupations in Shiremanstown borough are Security & Protection (37 | 4.4%), Firefighting & Prevention (33 | 3.9%), Food Preparation & Serving (32 | 3.8%), Cleaning & Maintenance (17 | 2.0%), and Healthcare Support (12 | 1.4%).
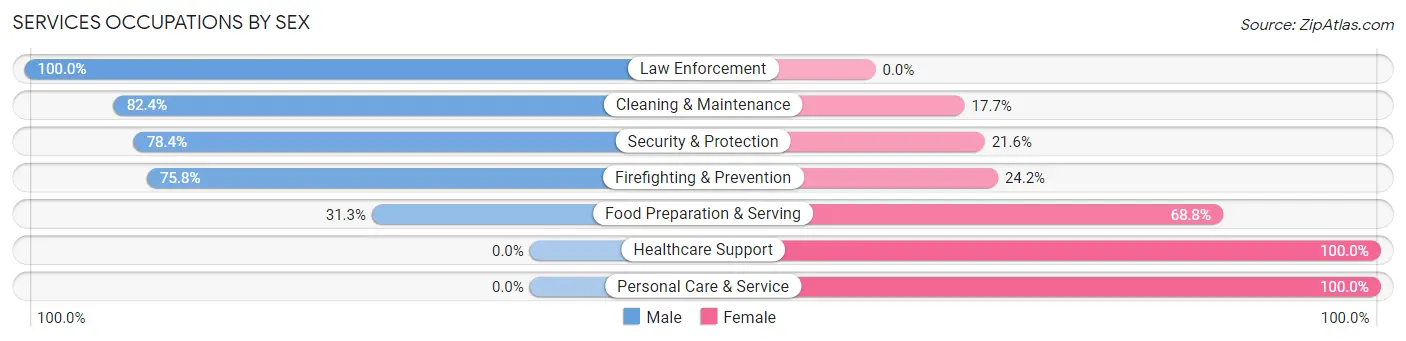
Services Occupations by Sex
Within the Services occupations in Shiremanstown borough, the most male-oriented occupations are Law Enforcement (100.0%), Cleaning & Maintenance (82.4%), and Security & Protection (78.4%), while the most female-oriented occupations are Healthcare Support (100.0%), Personal Care & Service (100.0%), and Food Preparation & Serving (68.8%).
| Occupation | Male | Female |
| Healthcare Support | 0 (0.0%) | 12 (100.0%) |
| Security & Protection | 29 (78.4%) | 8 (21.6%) |
| Firefighting & Prevention | 25 (75.8%) | 8 (24.2%) |
| Law Enforcement | 4 (100.0%) | 0 (0.0%) |
| Food Preparation & Serving | 10 (31.2%) | 22 (68.8%) |
| Cleaning & Maintenance | 14 (82.4%) | 3 (17.6%) |
| Personal Care & Service | 0 (0.0%) | 9 (100.0%) |
| Total (Category) | 53 (49.5%) | 54 (50.5%) |
| Total (Overall) | 479 (56.7%) | 366 (43.3%) |
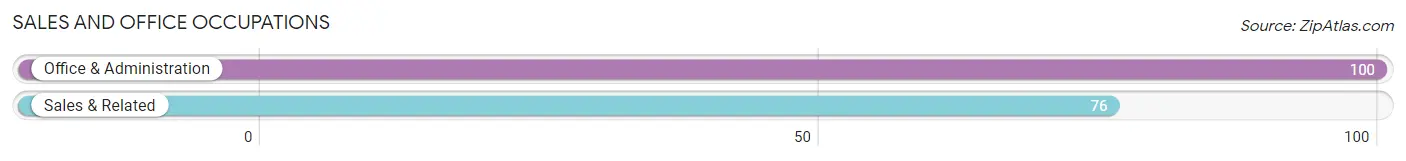
Sales and Office Occupations
The most common Sales and Office occupations in Shiremanstown borough are Office & Administration (100 | 11.8%), and Sales & Related (76 | 9.0%).
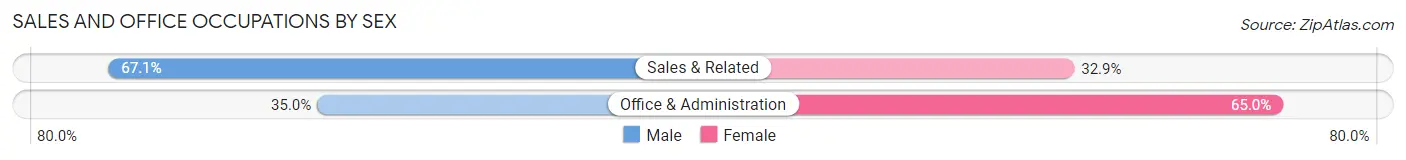
Sales and Office Occupations by Sex
| Occupation | Male | Female |
| Sales & Related | 51 (67.1%) | 25 (32.9%) |
| Office & Administration | 35 (35.0%) | 65 (65.0%) |
| Total (Category) | 86 (48.9%) | 90 (51.1%) |
| Total (Overall) | 479 (56.7%) | 366 (43.3%) |
Natural Resources, Construction and Maintenance Occupations
The most common Natural Resources, Construction and Maintenance occupations in Shiremanstown borough are Construction & Extraction (44 | 5.2%), and Installation, Maintenance & Repair (33 | 3.9%).
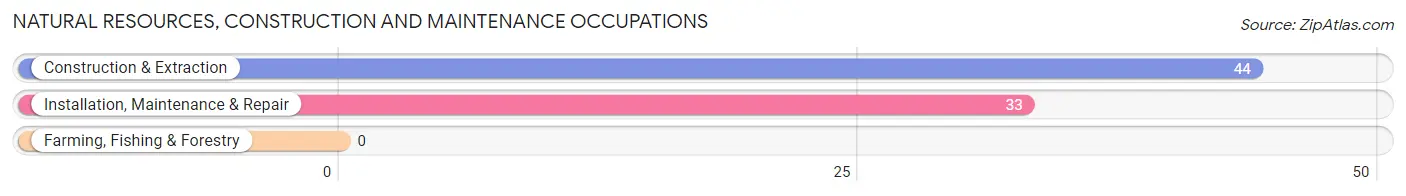
Natural Resources, Construction and Maintenance Occupations by Sex
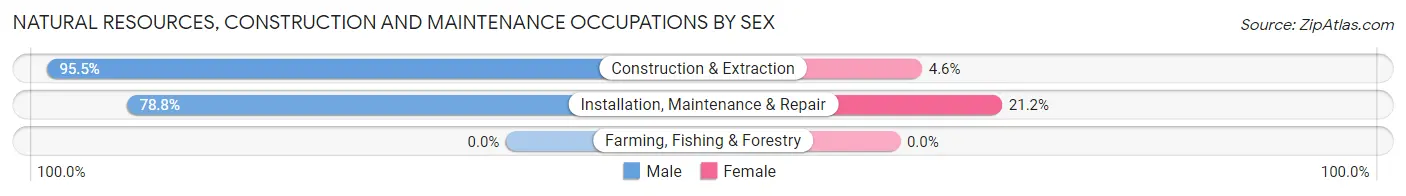
| Occupation | Male | Female |
| Farming, Fishing & Forestry | 0 (0.0%) | 0 (0.0%) |
| Construction & Extraction | 42 (95.5%) | 2 (4.5%) |
| Installation, Maintenance & Repair | 26 (78.8%) | 7 (21.2%) |
| Total (Category) | 68 (88.3%) | 9 (11.7%) |
| Total (Overall) | 479 (56.7%) | 366 (43.3%) |
Production, Transportation and Moving Occupations
The most common Production, Transportation and Moving occupations in Shiremanstown borough are Material Moving (71 | 8.4%), Production (33 | 3.9%), and Transportation (26 | 3.1%).
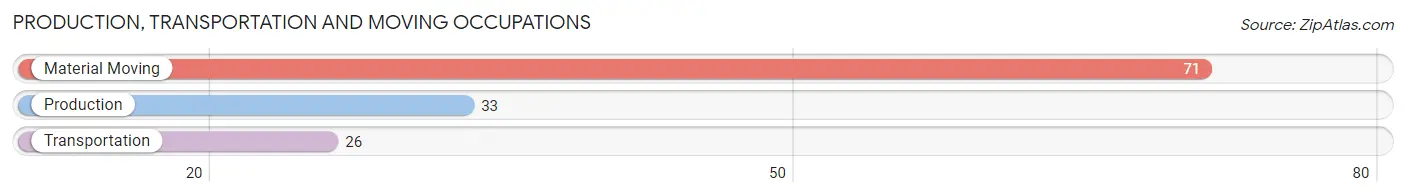
Production, Transportation and Moving Occupations by Sex
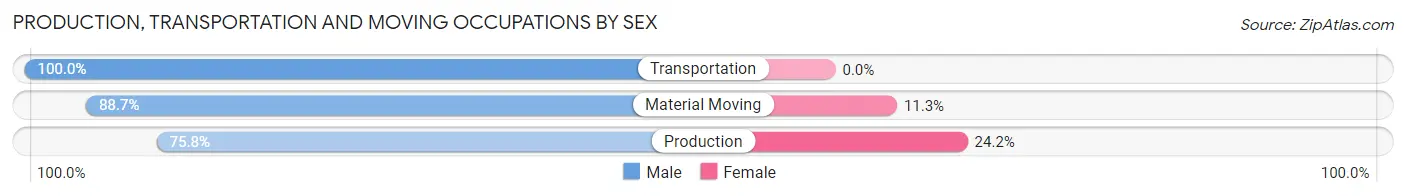
| Occupation | Male | Female |
| Production | 25 (75.8%) | 8 (24.2%) |
| Transportation | 26 (100.0%) | 0 (0.0%) |
| Material Moving | 63 (88.7%) | 8 (11.3%) |
| Total (Category) | 114 (87.7%) | 16 (12.3%) |
| Total (Overall) | 479 (56.7%) | 366 (43.3%) |
Employment Industries by Sex in Shiremanstown borough
Employment Industries in Shiremanstown borough
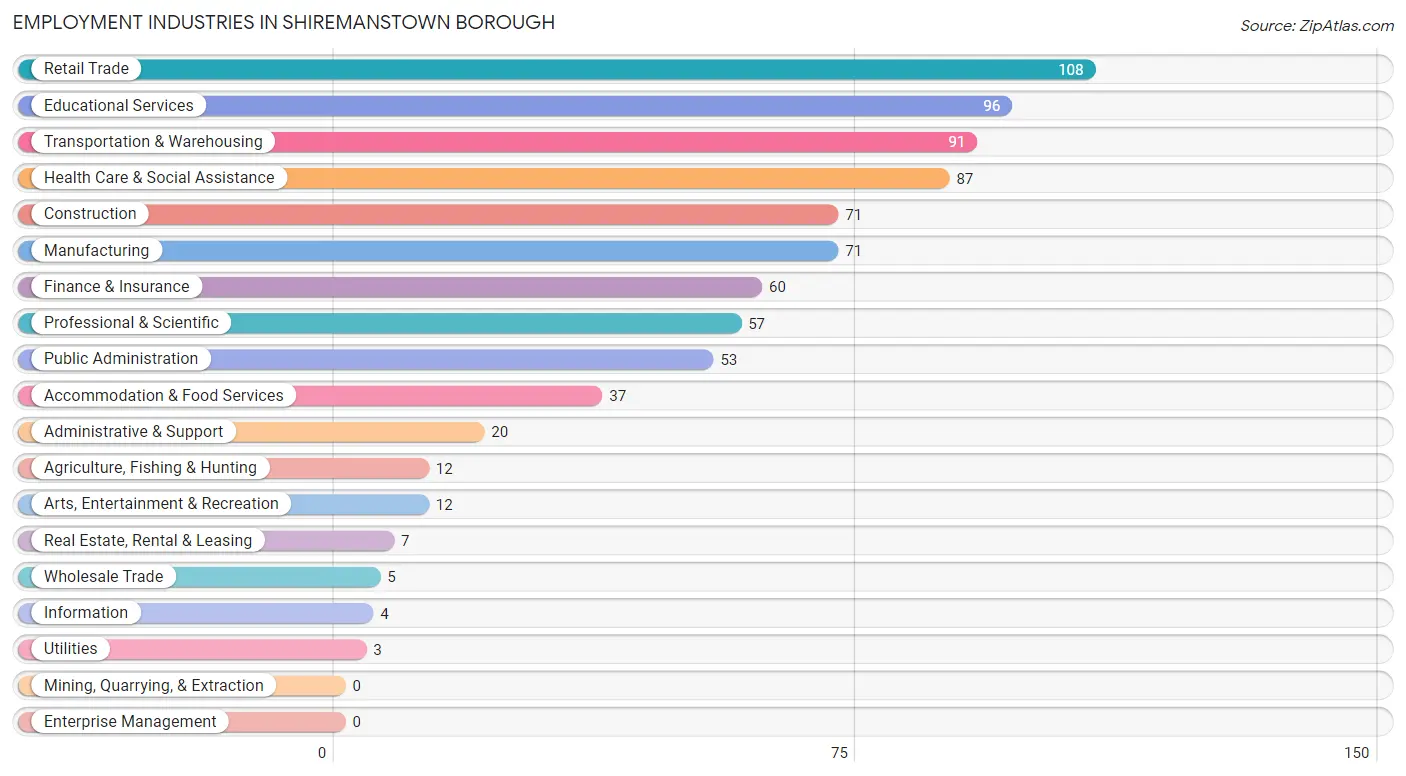
The major employment industries in Shiremanstown borough include Retail Trade (108 | 12.8%), Educational Services (96 | 11.4%), Transportation & Warehousing (91 | 10.8%), Health Care & Social Assistance (87 | 10.3%), and Construction (71 | 8.4%).
Employment Industries by Sex in Shiremanstown borough
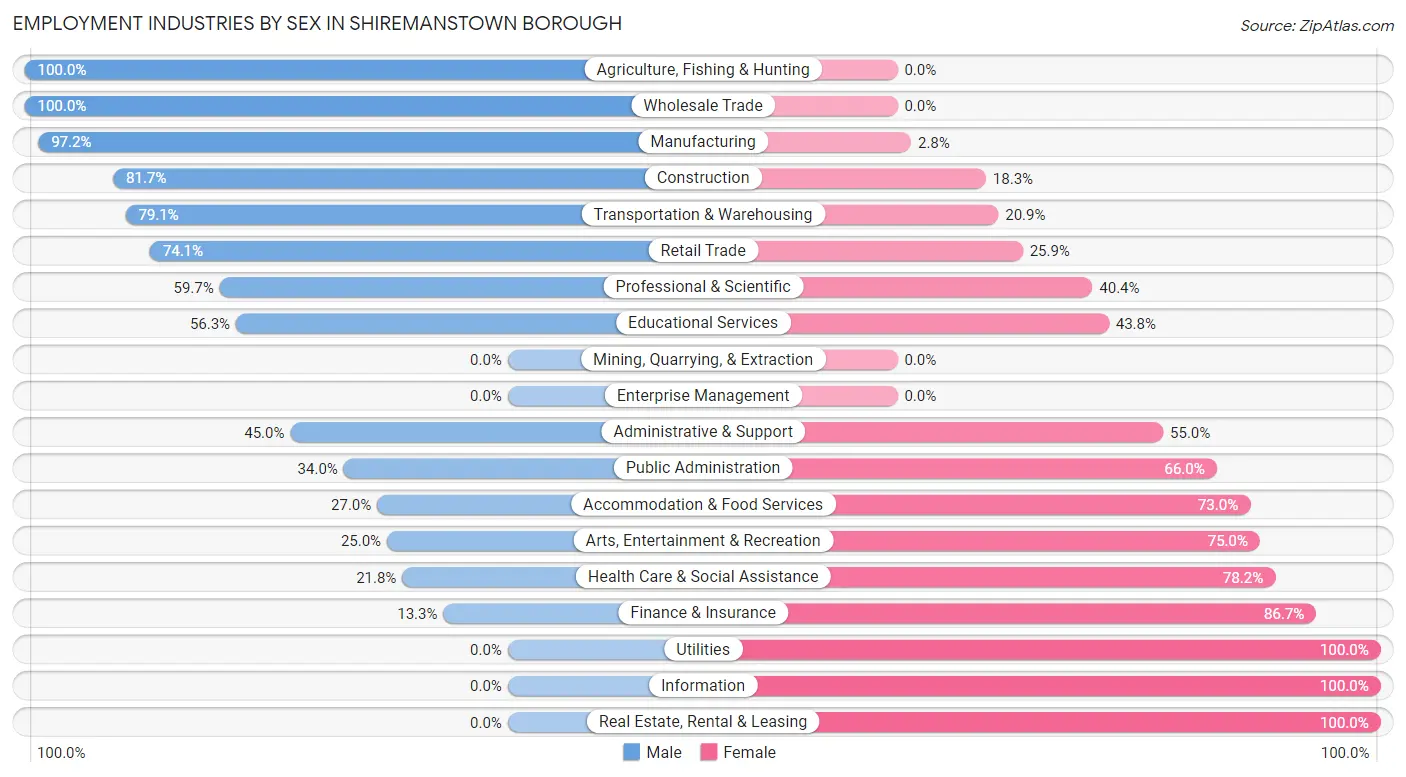
The Shiremanstown borough industries that see more men than women are Agriculture, Fishing & Hunting (100.0%), Wholesale Trade (100.0%), and Manufacturing (97.2%), whereas the industries that tend to have a higher number of women are Utilities (100.0%), Information (100.0%), and Real Estate, Rental & Leasing (100.0%).
| Industry | Male | Female |
| Agriculture, Fishing & Hunting | 12 (100.0%) | 0 (0.0%) |
| Mining, Quarrying, & Extraction | 0 (0.0%) | 0 (0.0%) |
| Construction | 58 (81.7%) | 13 (18.3%) |
| Manufacturing | 69 (97.2%) | 2 (2.8%) |
| Wholesale Trade | 5 (100.0%) | 0 (0.0%) |
| Retail Trade | 80 (74.1%) | 28 (25.9%) |
| Transportation & Warehousing | 72 (79.1%) | 19 (20.9%) |
| Utilities | 0 (0.0%) | 3 (100.0%) |
| Information | 0 (0.0%) | 4 (100.0%) |
| Finance & Insurance | 8 (13.3%) | 52 (86.7%) |
| Real Estate, Rental & Leasing | 0 (0.0%) | 7 (100.0%) |
| Professional & Scientific | 34 (59.7%) | 23 (40.4%) |
| Enterprise Management | 0 (0.0%) | 0 (0.0%) |
| Administrative & Support | 9 (45.0%) | 11 (55.0%) |
| Educational Services | 54 (56.2%) | 42 (43.8%) |
| Health Care & Social Assistance | 19 (21.8%) | 68 (78.2%) |
| Arts, Entertainment & Recreation | 3 (25.0%) | 9 (75.0%) |
| Accommodation & Food Services | 10 (27.0%) | 27 (73.0%) |
| Public Administration | 18 (34.0%) | 35 (66.0%) |
| Total | 479 (56.7%) | 366 (43.3%) |
Education in Shiremanstown borough
School Enrollment in Shiremanstown borough
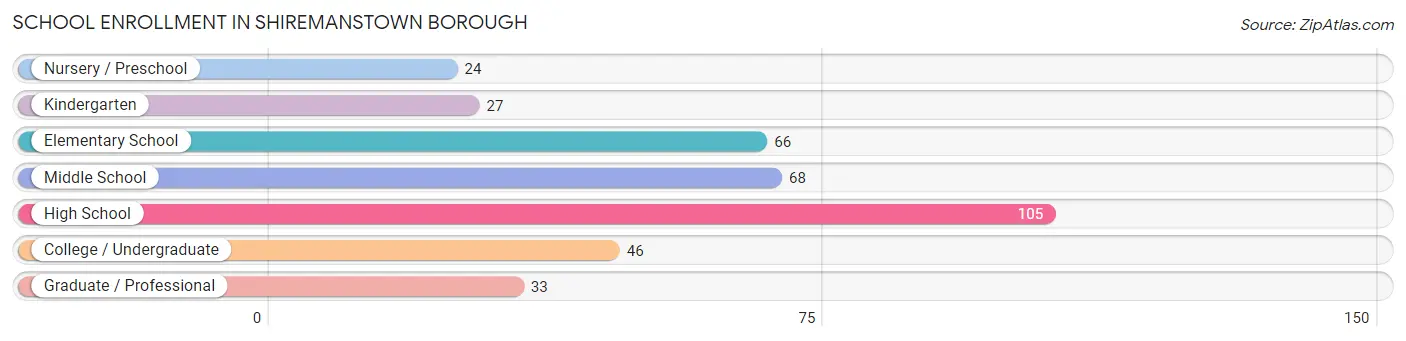
The most common levels of schooling among the 369 students in Shiremanstown borough are high school (105 | 28.5%), middle school (68 | 18.4%), and elementary school (66 | 17.9%).
| School Level | # Students | % Students |
| Nursery / Preschool | 24 | 6.5% |
| Kindergarten | 27 | 7.3% |
| Elementary School | 66 | 17.9% |
| Middle School | 68 | 18.4% |
| High School | 105 | 28.5% |
| College / Undergraduate | 46 | 12.5% |
| Graduate / Professional | 33 | 8.9% |
| Total | 369 | 100.0% |
School Enrollment by Age by Funding Source in Shiremanstown borough
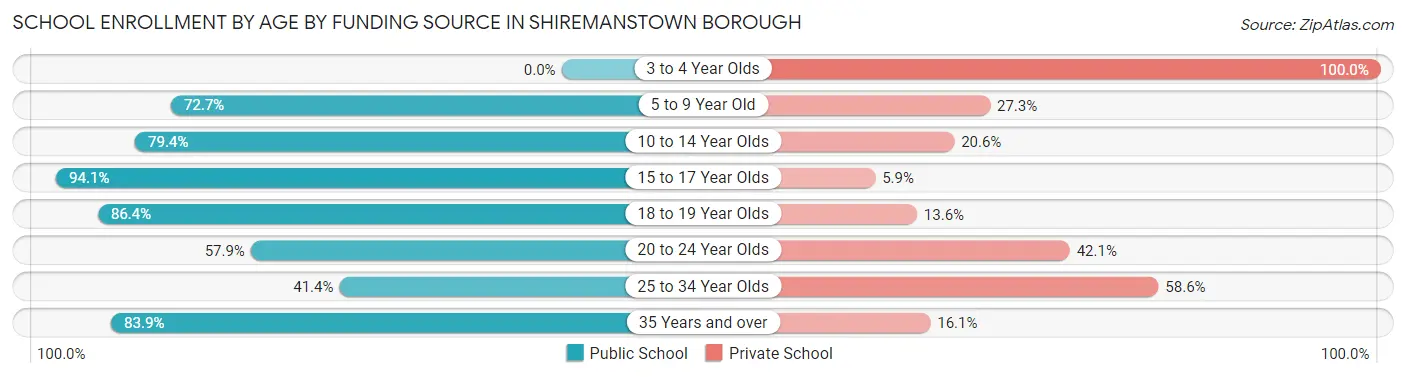
Out of a total of 369 students who are enrolled in schools in Shiremanstown borough, 100 (27.1%) attend a private institution, while the remaining 269 (72.9%) are enrolled in public schools. The age group of 3 to 4 year olds has the highest likelihood of being enrolled in private schools, with 21 (100.0% in the age bracket) enrolled. Conversely, the age group of 15 to 17 year olds has the lowest likelihood of being enrolled in a private school, with 64 (94.1% in the age bracket) attending a public institution.
| Age Bracket | Public School | Private School |
| 3 to 4 Year Olds | 0 (0.0%) | 21 (100.0%) |
| 5 to 9 Year Old | 56 (72.7%) | 21 (27.3%) |
| 10 to 14 Year Olds | 81 (79.4%) | 21 (20.6%) |
| 15 to 17 Year Olds | 64 (94.1%) | 4 (5.9%) |
| 18 to 19 Year Olds | 19 (86.4%) | 3 (13.6%) |
| 20 to 24 Year Olds | 11 (57.9%) | 8 (42.1%) |
| 25 to 34 Year Olds | 12 (41.4%) | 17 (58.6%) |
| 35 Years and over | 26 (83.9%) | 5 (16.1%) |
| Total | 269 (72.9%) | 100 (27.1%) |
Educational Attainment by Field of Study in Shiremanstown borough
Business (132 | 29.3%), science & technology (54 | 12.0%), education (50 | 11.1%), arts & humanities (43 | 9.5%), and social sciences (34 | 7.5%) are the most common fields of study among 451 individuals in Shiremanstown borough who have obtained a bachelor's degree or higher.
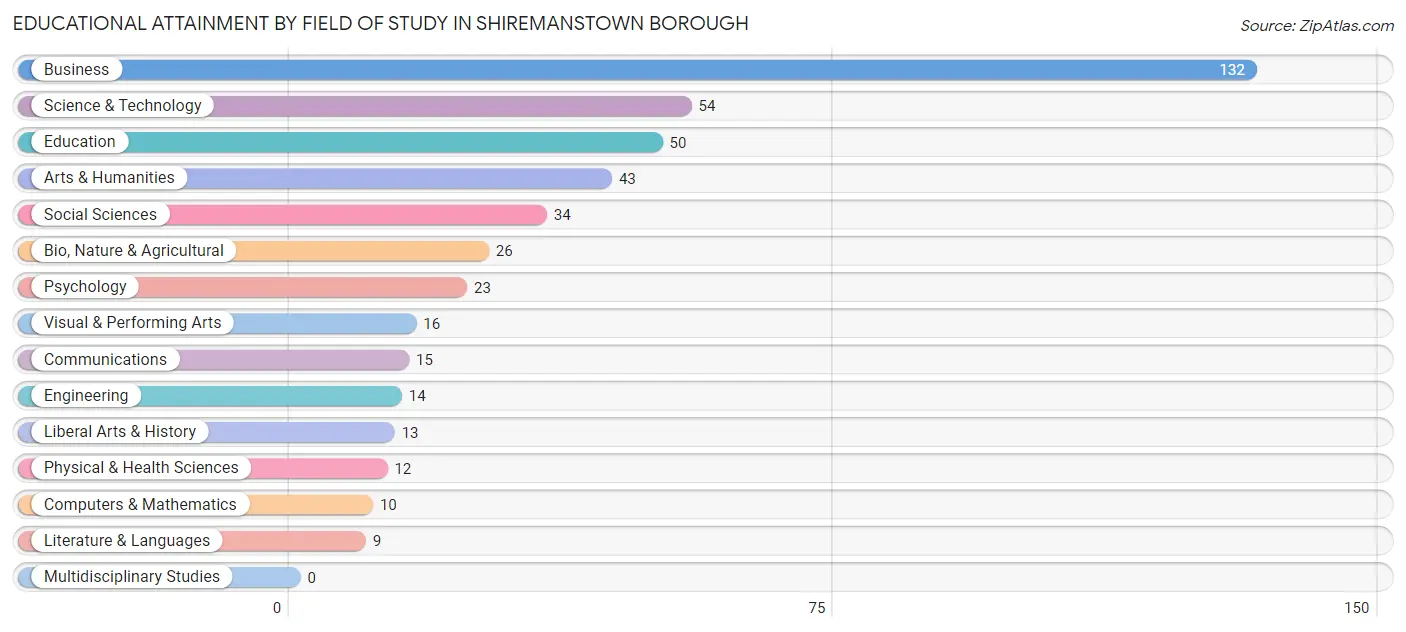
| Field of Study | # Graduates | % Graduates |
| Computers & Mathematics | 10 | 2.2% |
| Bio, Nature & Agricultural | 26 | 5.8% |
| Physical & Health Sciences | 12 | 2.7% |
| Psychology | 23 | 5.1% |
| Social Sciences | 34 | 7.5% |
| Engineering | 14 | 3.1% |
| Multidisciplinary Studies | 0 | 0.0% |
| Science & Technology | 54 | 12.0% |
| Business | 132 | 29.3% |
| Education | 50 | 11.1% |
| Literature & Languages | 9 | 2.0% |
| Liberal Arts & History | 13 | 2.9% |
| Visual & Performing Arts | 16 | 3.5% |
| Communications | 15 | 3.3% |
| Arts & Humanities | 43 | 9.5% |
| Total | 451 | 100.0% |
Transportation & Commute in Shiremanstown borough
Vehicle Availability by Sex in Shiremanstown borough
The most prevalent vehicle ownership categories in Shiremanstown borough are males with 2 vehicles (212, accounting for 44.7%) and females with 2 vehicles (167, making up 60.9%).
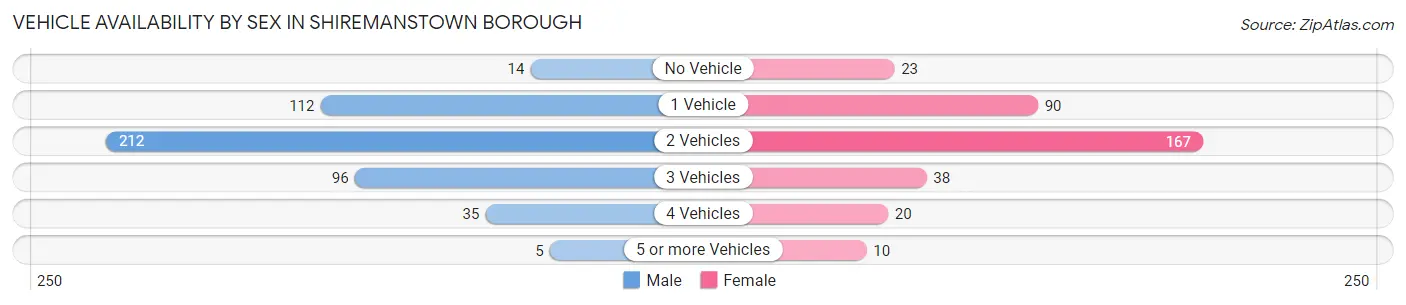
| Vehicles Available | Male | Female |
| No Vehicle | 14 (2.9%) | 23 (6.6%) |
| 1 Vehicle | 112 (23.6%) | 90 (25.9%) |
| 2 Vehicles | 212 (44.7%) | 167 (48.0%) |
| 3 Vehicles | 96 (20.3%) | 38 (10.9%) |
| 4 Vehicles | 35 (7.4%) | 20 (5.8%) |
| 5 or more Vehicles | 5 (1.1%) | 10 (2.9%) |
| Total | 474 (100.0%) | 348 (100.0%) |
Commute Time in Shiremanstown borough
The most frequently occuring commute durations in Shiremanstown borough are 15 to 19 minutes (151 commuters, 20.0%), 10 to 14 minutes (143 commuters, 18.9%), and 20 to 24 minutes (118 commuters, 15.6%).
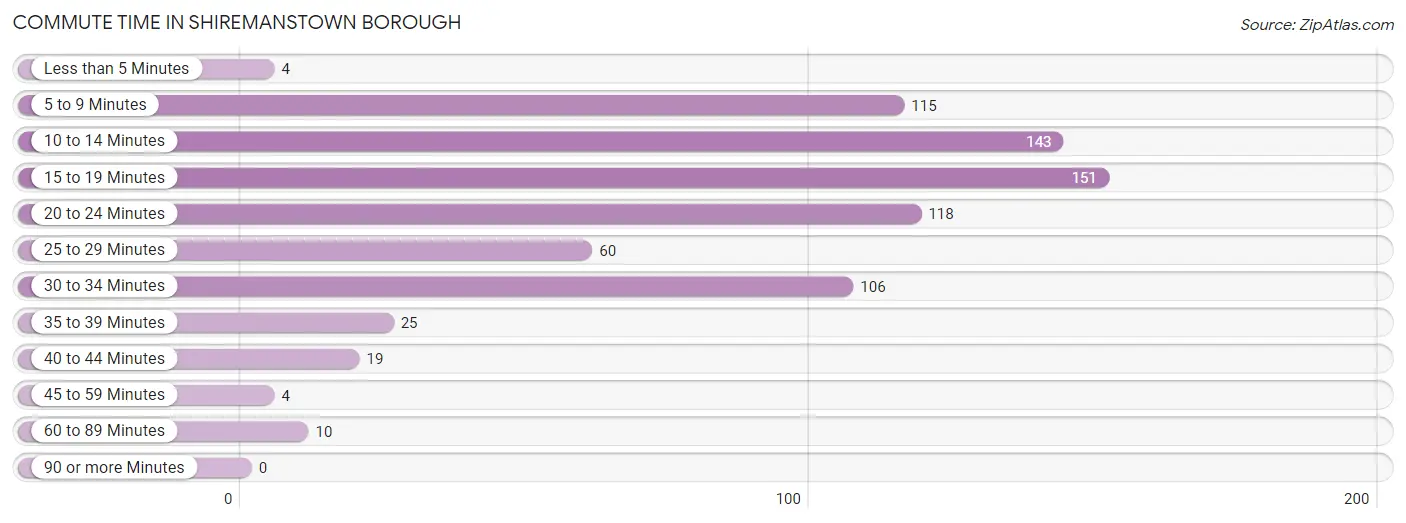
| Commute Time | # Commuters | % Commuters |
| Less than 5 Minutes | 4 | 0.5% |
| 5 to 9 Minutes | 115 | 15.2% |
| 10 to 14 Minutes | 143 | 18.9% |
| 15 to 19 Minutes | 151 | 20.0% |
| 20 to 24 Minutes | 118 | 15.6% |
| 25 to 29 Minutes | 60 | 8.0% |
| 30 to 34 Minutes | 106 | 14.0% |
| 35 to 39 Minutes | 25 | 3.3% |
| 40 to 44 Minutes | 19 | 2.5% |
| 45 to 59 Minutes | 4 | 0.5% |
| 60 to 89 Minutes | 10 | 1.3% |
| 90 or more Minutes | 0 | 0.0% |
Commute Time by Sex in Shiremanstown borough
The most common commute times in Shiremanstown borough are 10 to 14 minutes (105 commuters, 23.7%) for males and 15 to 19 minutes (84 commuters, 26.9%) for females.
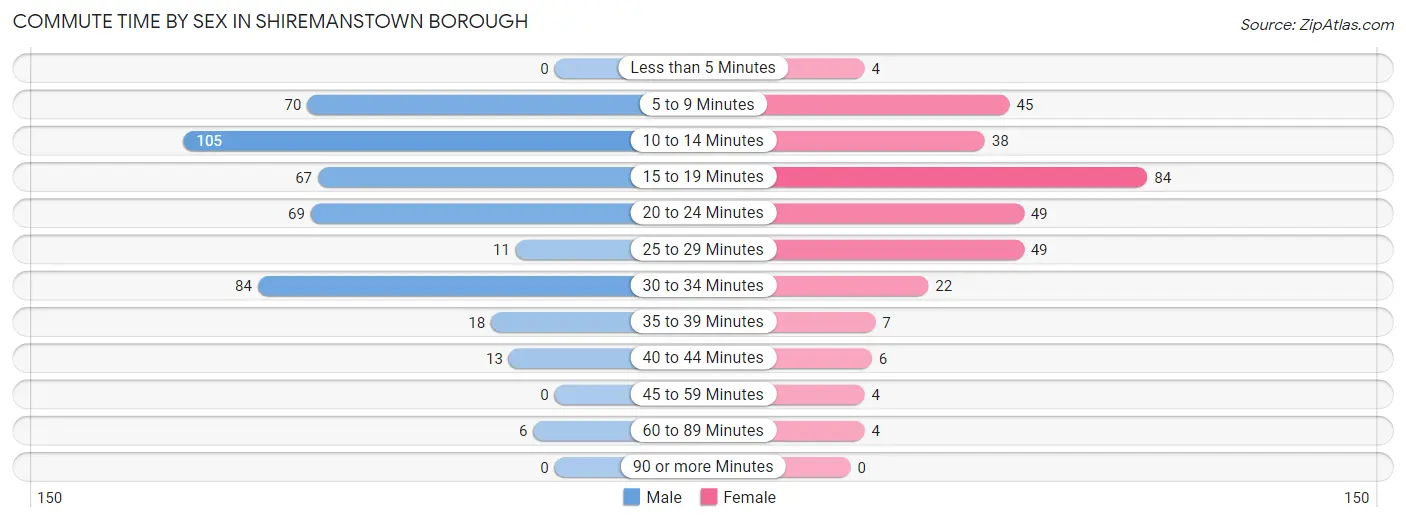
| Commute Time | Male | Female |
| Less than 5 Minutes | 0 (0.0%) | 4 (1.3%) |
| 5 to 9 Minutes | 70 (15.8%) | 45 (14.4%) |
| 10 to 14 Minutes | 105 (23.7%) | 38 (12.2%) |
| 15 to 19 Minutes | 67 (15.1%) | 84 (26.9%) |
| 20 to 24 Minutes | 69 (15.6%) | 49 (15.7%) |
| 25 to 29 Minutes | 11 (2.5%) | 49 (15.7%) |
| 30 to 34 Minutes | 84 (19.0%) | 22 (7.0%) |
| 35 to 39 Minutes | 18 (4.1%) | 7 (2.2%) |
| 40 to 44 Minutes | 13 (2.9%) | 6 (1.9%) |
| 45 to 59 Minutes | 0 (0.0%) | 4 (1.3%) |
| 60 to 89 Minutes | 6 (1.3%) | 4 (1.3%) |
| 90 or more Minutes | 0 (0.0%) | 0 (0.0%) |
Time of Departure to Work by Sex in Shiremanstown borough
The most frequent times of departure to work in Shiremanstown borough are 4:00 PM to 11:59 PM (88, 19.9%) for males and 7:30 AM to 7:59 AM (80, 25.6%) for females.
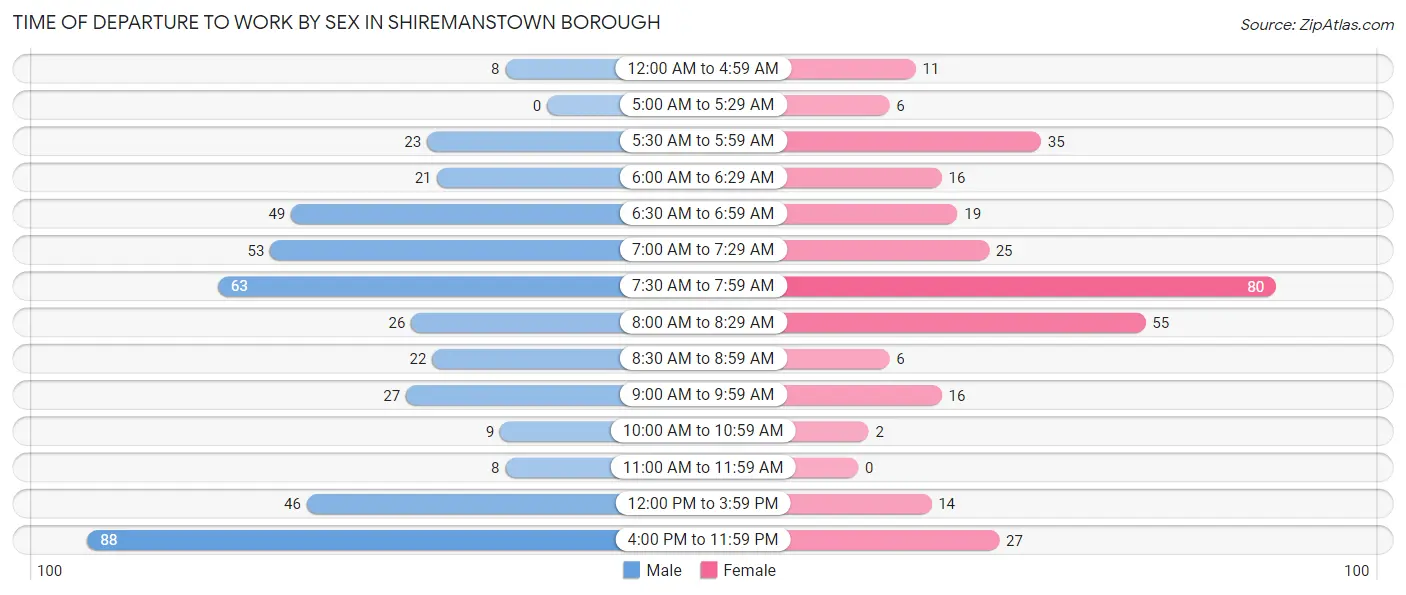
| Time of Departure | Male | Female |
| 12:00 AM to 4:59 AM | 8 (1.8%) | 11 (3.5%) |
| 5:00 AM to 5:29 AM | 0 (0.0%) | 6 (1.9%) |
| 5:30 AM to 5:59 AM | 23 (5.2%) | 35 (11.2%) |
| 6:00 AM to 6:29 AM | 21 (4.7%) | 16 (5.1%) |
| 6:30 AM to 6:59 AM | 49 (11.1%) | 19 (6.1%) |
| 7:00 AM to 7:29 AM | 53 (12.0%) | 25 (8.0%) |
| 7:30 AM to 7:59 AM | 63 (14.2%) | 80 (25.6%) |
| 8:00 AM to 8:29 AM | 26 (5.9%) | 55 (17.6%) |
| 8:30 AM to 8:59 AM | 22 (5.0%) | 6 (1.9%) |
| 9:00 AM to 9:59 AM | 27 (6.1%) | 16 (5.1%) |
| 10:00 AM to 10:59 AM | 9 (2.0%) | 2 (0.6%) |
| 11:00 AM to 11:59 AM | 8 (1.8%) | 0 (0.0%) |
| 12:00 PM to 3:59 PM | 46 (10.4%) | 14 (4.5%) |
| 4:00 PM to 11:59 PM | 88 (19.9%) | 27 (8.6%) |
| Total | 443 (100.0%) | 312 (100.0%) |
Housing Occupancy in Shiremanstown borough
Occupancy by Ownership in Shiremanstown borough
Of the total 748 dwellings in Shiremanstown borough, owner-occupied units account for 488 (65.2%), while renter-occupied units make up 260 (34.8%).
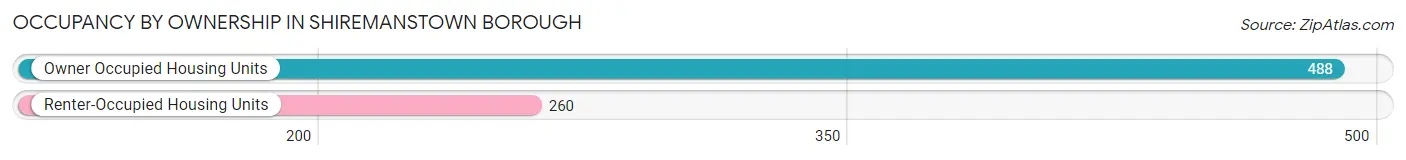
| Occupancy | # Housing Units | % Housing Units |
| Owner Occupied Housing Units | 488 | 65.2% |
| Renter-Occupied Housing Units | 260 | 34.8% |
| Total Occupied Housing Units | 748 | 100.0% |
Occupancy by Household Size in Shiremanstown borough
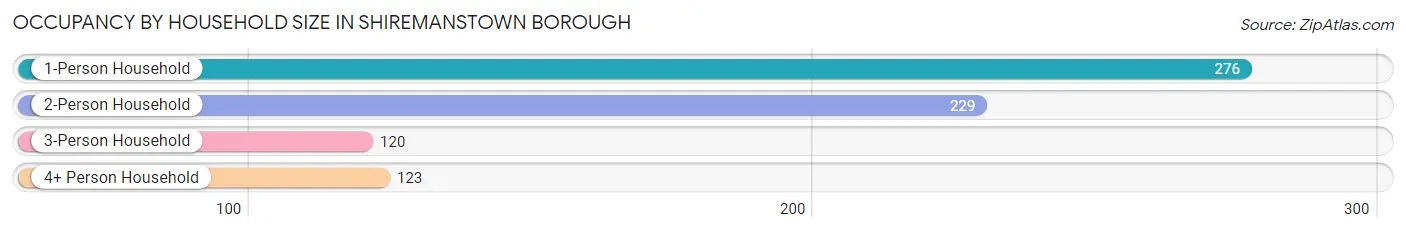
| Household Size | # Housing Units | % Housing Units |
| 1-Person Household | 276 | 36.9% |
| 2-Person Household | 229 | 30.6% |
| 3-Person Household | 120 | 16.0% |
| 4+ Person Household | 123 | 16.4% |
| Total Housing Units | 748 | 100.0% |
Occupancy by Ownership by Household Size in Shiremanstown borough
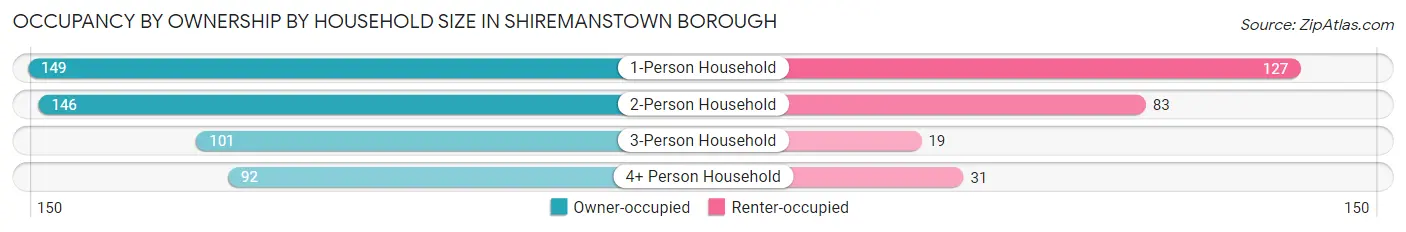
| Household Size | Owner-occupied | Renter-occupied |
| 1-Person Household | 149 (54.0%) | 127 (46.0%) |
| 2-Person Household | 146 (63.8%) | 83 (36.2%) |
| 3-Person Household | 101 (84.2%) | 19 (15.8%) |
| 4+ Person Household | 92 (74.8%) | 31 (25.2%) |
| Total Housing Units | 488 (65.2%) | 260 (34.8%) |
Occupancy by Educational Attainment in Shiremanstown borough
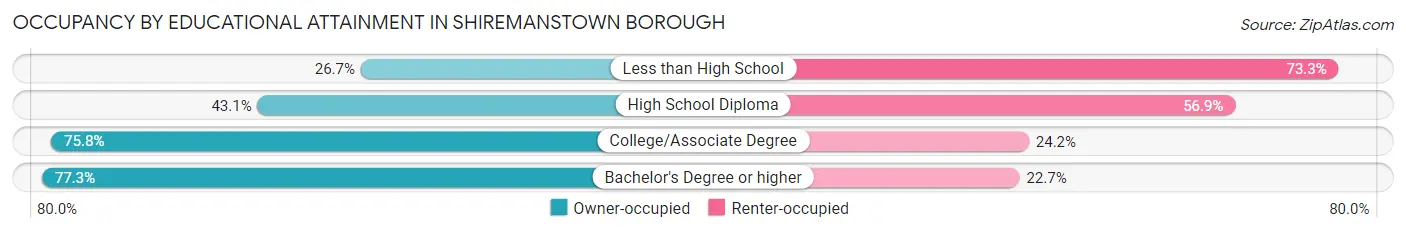
| Household Size | Owner-occupied | Renter-occupied |
| Less than High School | 8 (26.7%) | 22 (73.3%) |
| High School Diploma | 90 (43.1%) | 119 (56.9%) |
| College/Associate Degree | 169 (75.8%) | 54 (24.2%) |
| Bachelor's Degree or higher | 221 (77.3%) | 65 (22.7%) |
Occupancy by Age of Householder in Shiremanstown borough
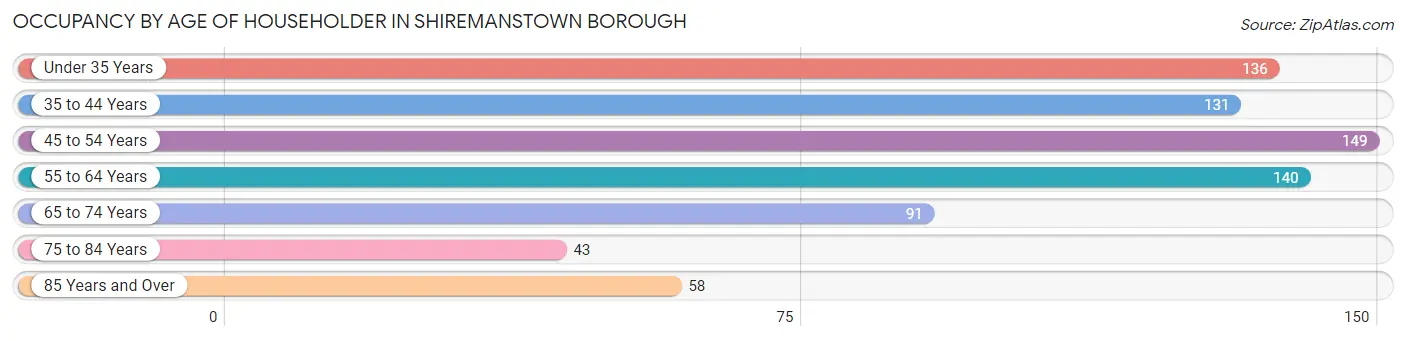
| Age Bracket | # Households | % Households |
| Under 35 Years | 136 | 18.2% |
| 35 to 44 Years | 131 | 17.5% |
| 45 to 54 Years | 149 | 19.9% |
| 55 to 64 Years | 140 | 18.7% |
| 65 to 74 Years | 91 | 12.2% |
| 75 to 84 Years | 43 | 5.8% |
| 85 Years and Over | 58 | 7.7% |
| Total | 748 | 100.0% |
Housing Finances in Shiremanstown borough
Median Income by Occupancy in Shiremanstown borough
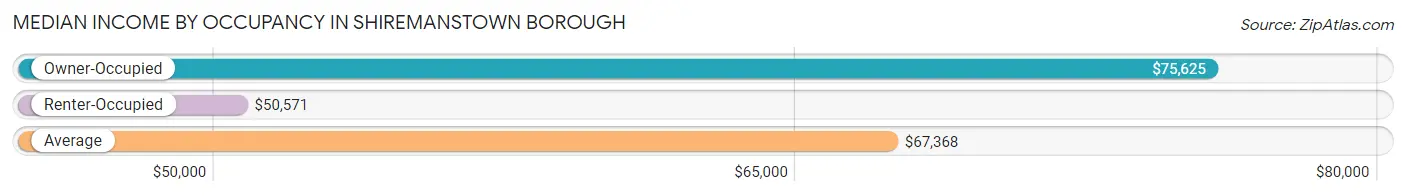
| Occupancy Type | # Households | Median Income |
| Owner-Occupied | 488 (65.2%) | $75,625 |
| Renter-Occupied | 260 (34.8%) | $50,571 |
| Average | 748 (100.0%) | $67,368 |
Occupancy by Householder Income Bracket in Shiremanstown borough
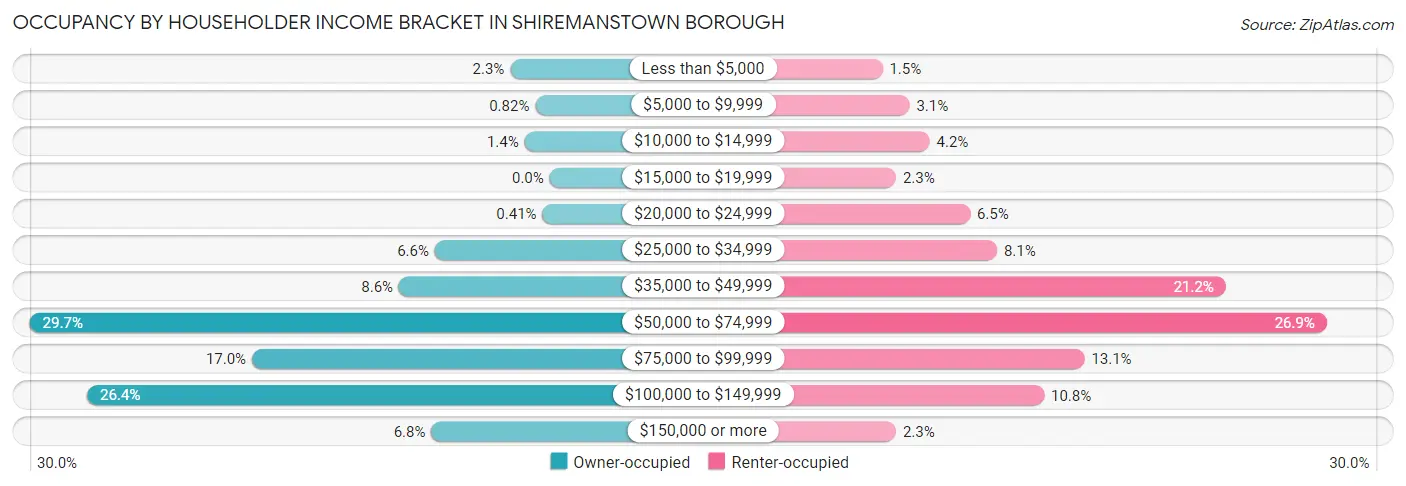
| Income Bracket | Owner-occupied | Renter-occupied |
| Less than $5,000 | 11 (2.2%) | 4 (1.5%) |
| $5,000 to $9,999 | 4 (0.8%) | 8 (3.1%) |
| $10,000 to $14,999 | 7 (1.4%) | 11 (4.2%) |
| $15,000 to $19,999 | 0 (0.0%) | 6 (2.3%) |
| $20,000 to $24,999 | 2 (0.4%) | 17 (6.5%) |
| $25,000 to $34,999 | 32 (6.6%) | 21 (8.1%) |
| $35,000 to $49,999 | 42 (8.6%) | 55 (21.1%) |
| $50,000 to $74,999 | 145 (29.7%) | 70 (26.9%) |
| $75,000 to $99,999 | 83 (17.0%) | 34 (13.1%) |
| $100,000 to $149,999 | 129 (26.4%) | 28 (10.8%) |
| $150,000 or more | 33 (6.8%) | 6 (2.3%) |
| Total | 488 (100.0%) | 260 (100.0%) |
Monthly Housing Cost Tiers in Shiremanstown borough
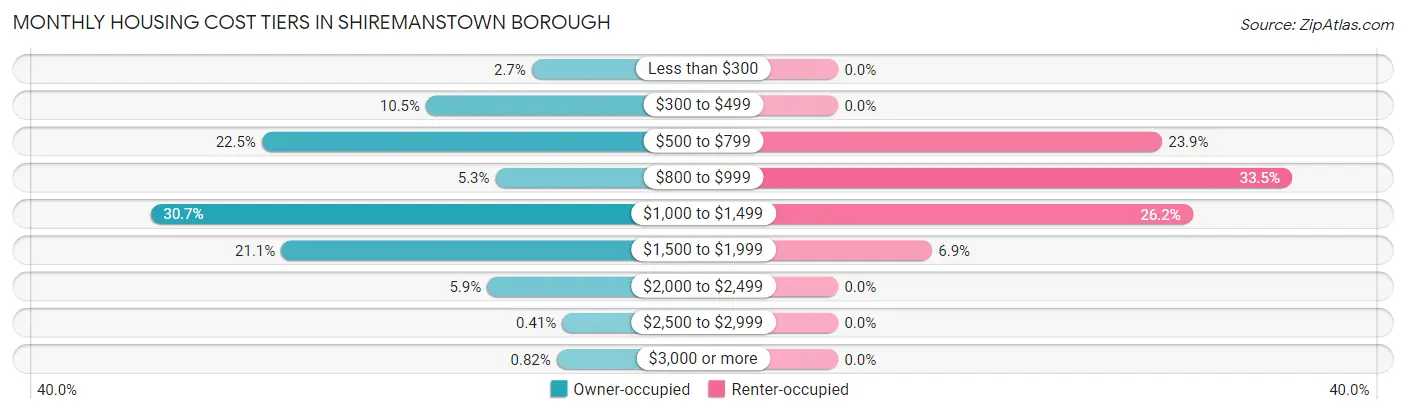
| Monthly Cost | Owner-occupied | Renter-occupied |
| Less than $300 | 13 (2.7%) | 0 (0.0%) |
| $300 to $499 | 51 (10.4%) | 0 (0.0%) |
| $500 to $799 | 110 (22.5%) | 62 (23.8%) |
| $800 to $999 | 26 (5.3%) | 87 (33.5%) |
| $1,000 to $1,499 | 150 (30.7%) | 68 (26.2%) |
| $1,500 to $1,999 | 103 (21.1%) | 18 (6.9%) |
| $2,000 to $2,499 | 29 (5.9%) | 0 (0.0%) |
| $2,500 to $2,999 | 2 (0.4%) | 0 (0.0%) |
| $3,000 or more | 4 (0.8%) | 0 (0.0%) |
| Total | 488 (100.0%) | 260 (100.0%) |
Physical Housing Characteristics in Shiremanstown borough
Housing Structures in Shiremanstown borough
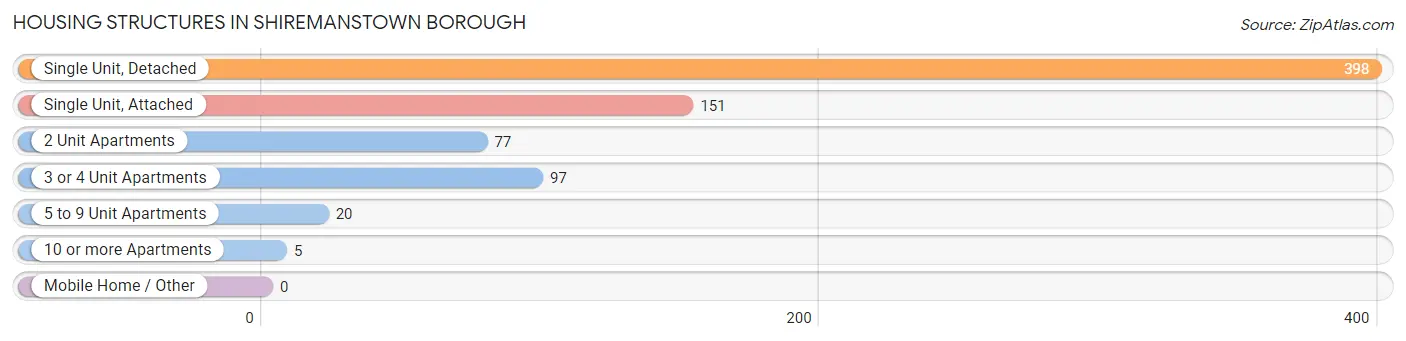
| Structure Type | # Housing Units | % Housing Units |
| Single Unit, Detached | 398 | 53.2% |
| Single Unit, Attached | 151 | 20.2% |
| 2 Unit Apartments | 77 | 10.3% |
| 3 or 4 Unit Apartments | 97 | 13.0% |
| 5 to 9 Unit Apartments | 20 | 2.7% |
| 10 or more Apartments | 5 | 0.7% |
| Mobile Home / Other | 0 | 0.0% |
| Total | 748 | 100.0% |
Housing Structures by Occupancy in Shiremanstown borough
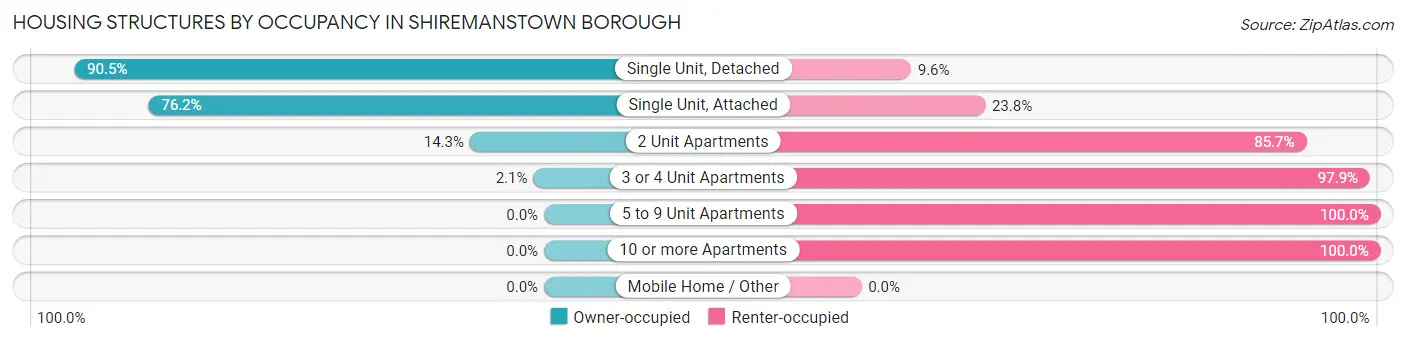
| Structure Type | Owner-occupied | Renter-occupied |
| Single Unit, Detached | 360 (90.4%) | 38 (9.6%) |
| Single Unit, Attached | 115 (76.2%) | 36 (23.8%) |
| 2 Unit Apartments | 11 (14.3%) | 66 (85.7%) |
| 3 or 4 Unit Apartments | 2 (2.1%) | 95 (97.9%) |
| 5 to 9 Unit Apartments | 0 (0.0%) | 20 (100.0%) |
| 10 or more Apartments | 0 (0.0%) | 5 (100.0%) |
| Mobile Home / Other | 0 (0.0%) | 0 (0.0%) |
| Total | 488 (65.2%) | 260 (34.8%) |
Housing Structures by Number of Rooms in Shiremanstown borough
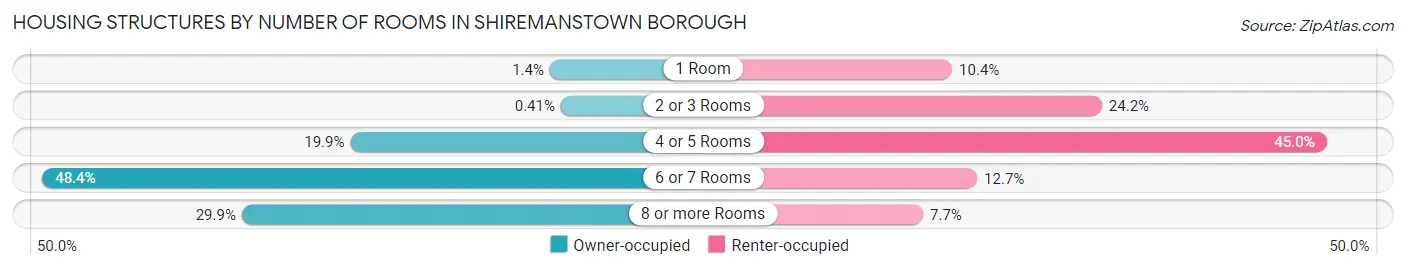
| Number of Rooms | Owner-occupied | Renter-occupied |
| 1 Room | 7 (1.4%) | 27 (10.4%) |
| 2 or 3 Rooms | 2 (0.4%) | 63 (24.2%) |
| 4 or 5 Rooms | 97 (19.9%) | 117 (45.0%) |
| 6 or 7 Rooms | 236 (48.4%) | 33 (12.7%) |
| 8 or more Rooms | 146 (29.9%) | 20 (7.7%) |
| Total | 488 (100.0%) | 260 (100.0%) |
Housing Structure by Heating Type in Shiremanstown borough
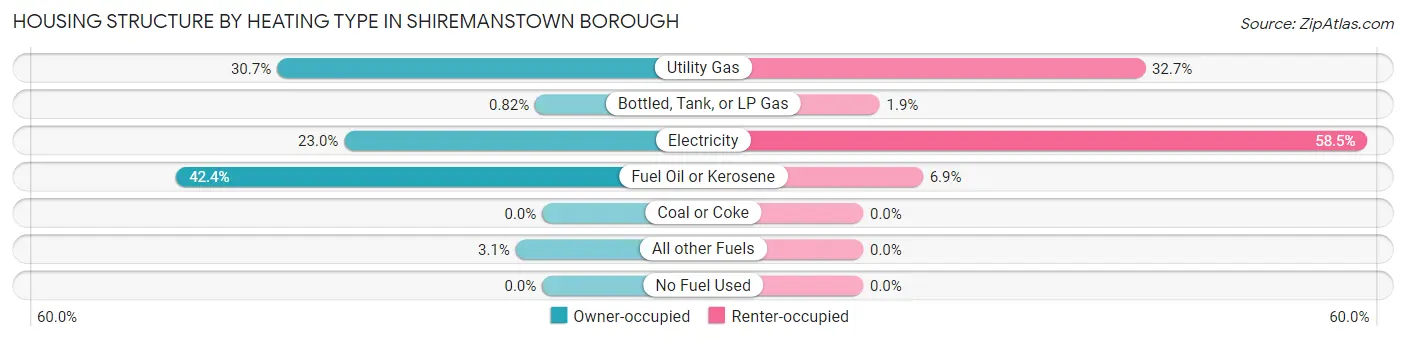
| Heating Type | Owner-occupied | Renter-occupied |
| Utility Gas | 150 (30.7%) | 85 (32.7%) |
| Bottled, Tank, or LP Gas | 4 (0.8%) | 5 (1.9%) |
| Electricity | 112 (23.0%) | 152 (58.5%) |
| Fuel Oil or Kerosene | 207 (42.4%) | 18 (6.9%) |
| Coal or Coke | 0 (0.0%) | 0 (0.0%) |
| All other Fuels | 15 (3.1%) | 0 (0.0%) |
| No Fuel Used | 0 (0.0%) | 0 (0.0%) |
| Total | 488 (100.0%) | 260 (100.0%) |
Household Vehicle Usage in Shiremanstown borough
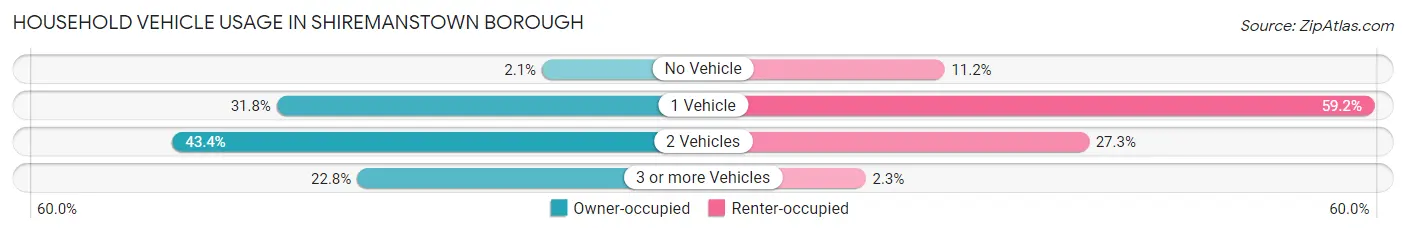
| Vehicles per Household | Owner-occupied | Renter-occupied |
| No Vehicle | 10 (2.1%) | 29 (11.2%) |
| 1 Vehicle | 155 (31.8%) | 154 (59.2%) |
| 2 Vehicles | 212 (43.4%) | 71 (27.3%) |
| 3 or more Vehicles | 111 (22.8%) | 6 (2.3%) |
| Total | 488 (100.0%) | 260 (100.0%) |
Real Estate & Mortgages in Shiremanstown borough
Real Estate and Mortgage Overview in Shiremanstown borough
| Characteristic | Without Mortgage | With Mortgage |
| Housing Units | 175 | 313 |
| Median Property Value | $195,700 | $191,000 |
| Median Household Income | $55,250 | $22 |
| Monthly Housing Costs | $581 | $4 |
| Real Estate Taxes | $2,779 | $2 |
Property Value by Mortgage Status in Shiremanstown borough
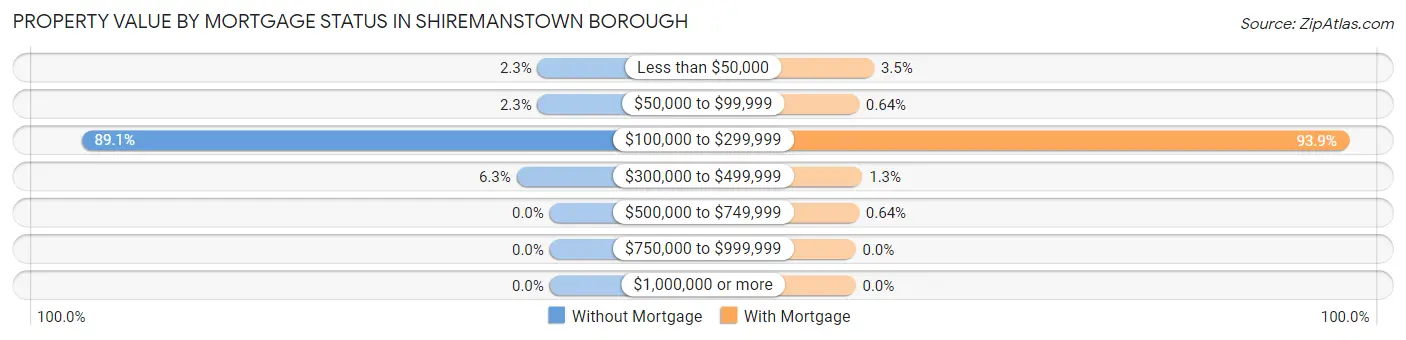
| Property Value | Without Mortgage | With Mortgage |
| Less than $50,000 | 4 (2.3%) | 11 (3.5%) |
| $50,000 to $99,999 | 4 (2.3%) | 2 (0.6%) |
| $100,000 to $299,999 | 156 (89.1%) | 294 (93.9%) |
| $300,000 to $499,999 | 11 (6.3%) | 4 (1.3%) |
| $500,000 to $749,999 | 0 (0.0%) | 2 (0.6%) |
| $750,000 to $999,999 | 0 (0.0%) | 0 (0.0%) |
| $1,000,000 or more | 0 (0.0%) | 0 (0.0%) |
| Total | 175 (100.0%) | 313 (100.0%) |
Household Income by Mortgage Status in Shiremanstown borough
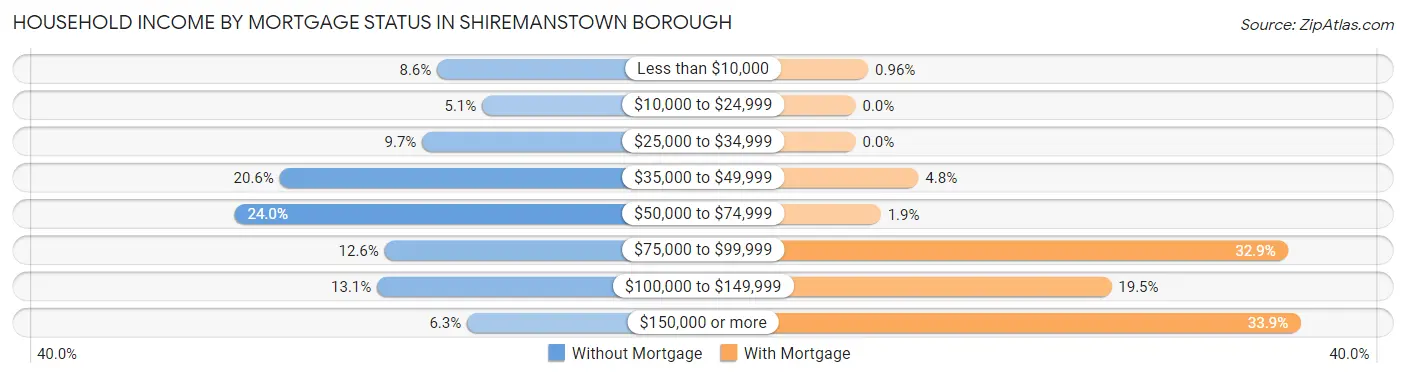
| Household Income | Without Mortgage | With Mortgage |
| Less than $10,000 | 15 (8.6%) | 3 (1.0%) |
| $10,000 to $24,999 | 9 (5.1%) | 0 (0.0%) |
| $25,000 to $34,999 | 17 (9.7%) | 0 (0.0%) |
| $35,000 to $49,999 | 36 (20.6%) | 15 (4.8%) |
| $50,000 to $74,999 | 42 (24.0%) | 6 (1.9%) |
| $75,000 to $99,999 | 22 (12.6%) | 103 (32.9%) |
| $100,000 to $149,999 | 23 (13.1%) | 61 (19.5%) |
| $150,000 or more | 11 (6.3%) | 106 (33.9%) |
| Total | 175 (100.0%) | 313 (100.0%) |
Property Value to Household Income Ratio in Shiremanstown borough
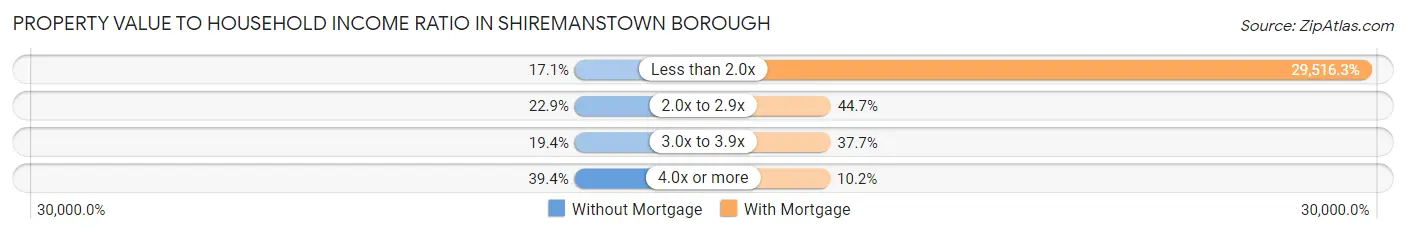
| Value-to-Income Ratio | Without Mortgage | With Mortgage |
| Less than 2.0x | 30 (17.1%) | 92,386 (29,516.3%) |
| 2.0x to 2.9x | 40 (22.9%) | 140 (44.7%) |
| 3.0x to 3.9x | 34 (19.4%) | 118 (37.7%) |
| 4.0x or more | 69 (39.4%) | 32 (10.2%) |
| Total | 175 (100.0%) | 313 (100.0%) |
Real Estate Taxes by Mortgage Status in Shiremanstown borough
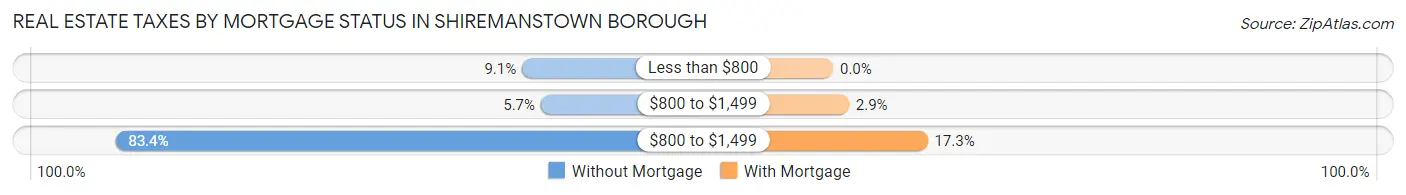
| Property Taxes | Without Mortgage | With Mortgage |
| Less than $800 | 16 (9.1%) | 0 (0.0%) |
| $800 to $1,499 | 10 (5.7%) | 9 (2.9%) |
| $800 to $1,499 | 146 (83.4%) | 54 (17.2%) |
| Total | 175 (100.0%) | 313 (100.0%) |
Health & Disability in Shiremanstown borough
Health Insurance Coverage by Age in Shiremanstown borough
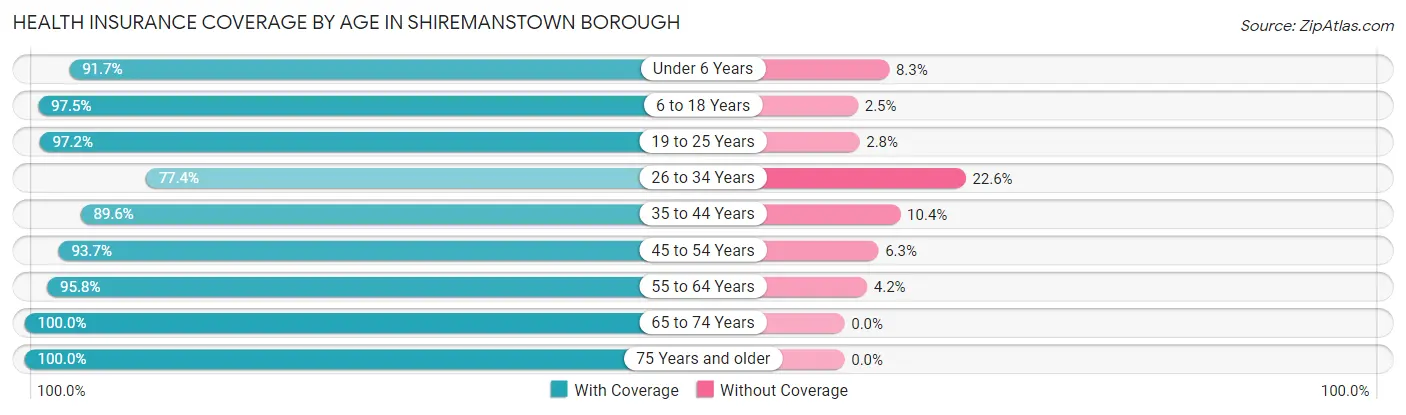
| Age Bracket | With Coverage | Without Coverage |
| Under 6 Years | 77 (91.7%) | 7 (8.3%) |
| 6 to 18 Years | 271 (97.5%) | 7 (2.5%) |
| 19 to 25 Years | 139 (97.2%) | 4 (2.8%) |
| 26 to 34 Years | 185 (77.4%) | 54 (22.6%) |
| 35 to 44 Years | 215 (89.6%) | 25 (10.4%) |
| 45 to 54 Years | 222 (93.7%) | 15 (6.3%) |
| 55 to 64 Years | 182 (95.8%) | 8 (4.2%) |
| 65 to 74 Years | 203 (100.0%) | 0 (0.0%) |
| 75 Years and older | 137 (100.0%) | 0 (0.0%) |
| Total | 1,631 (93.1%) | 120 (6.9%) |
Health Insurance Coverage by Citizenship Status in Shiremanstown borough
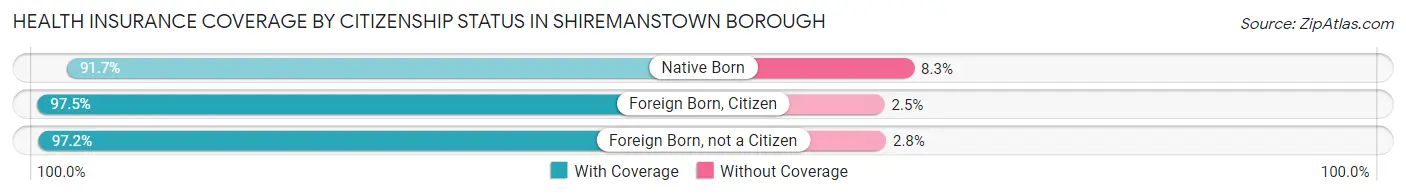
| Citizenship Status | With Coverage | Without Coverage |
| Native Born | 77 (91.7%) | 7 (8.3%) |
| Foreign Born, Citizen | 271 (97.5%) | 7 (2.5%) |
| Foreign Born, not a Citizen | 139 (97.2%) | 4 (2.8%) |
Health Insurance Coverage by Household Income in Shiremanstown borough
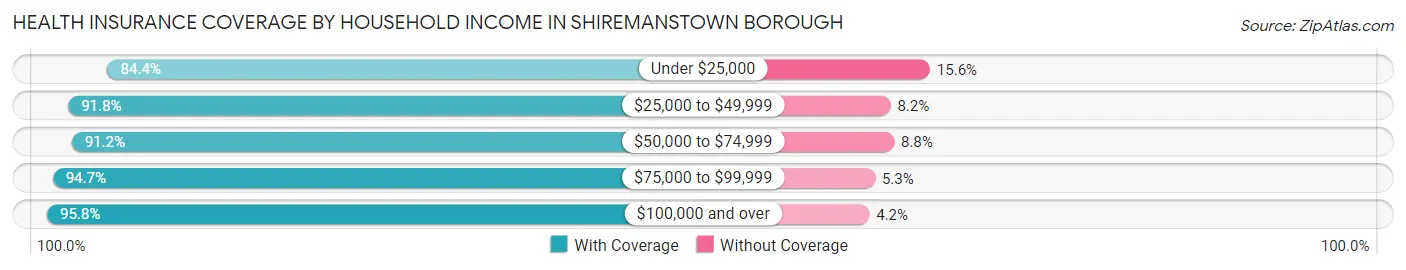
| Household Income | With Coverage | Without Coverage |
| Under $25,000 | 103 (84.4%) | 19 (15.6%) |
| $25,000 to $49,999 | 202 (91.8%) | 18 (8.2%) |
| $50,000 to $74,999 | 402 (91.2%) | 39 (8.8%) |
| $75,000 to $99,999 | 323 (94.7%) | 18 (5.3%) |
| $100,000 and over | 592 (95.8%) | 26 (4.2%) |
Public vs Private Health Insurance Coverage by Age in Shiremanstown borough
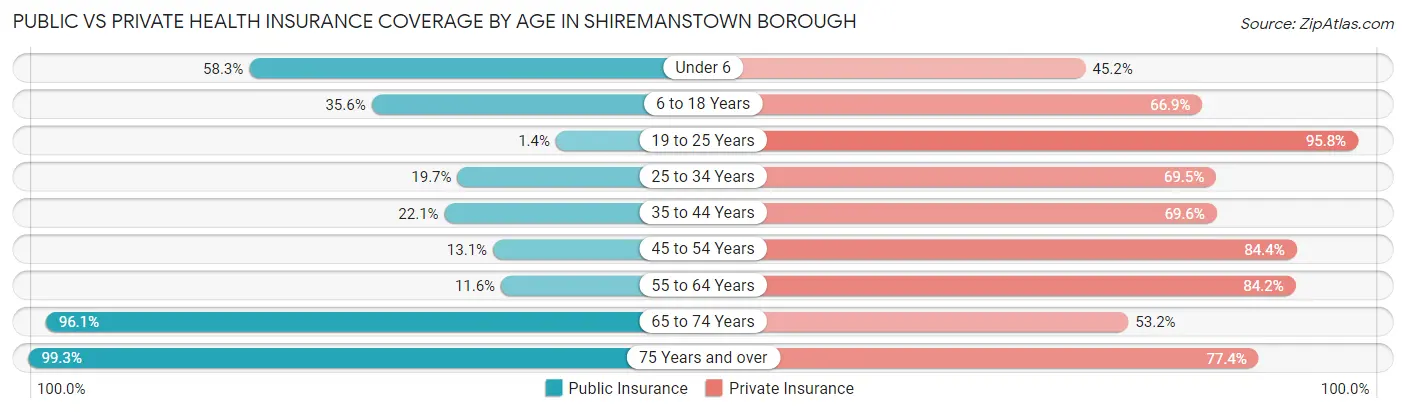
| Age Bracket | Public Insurance | Private Insurance |
| Under 6 | 49 (58.3%) | 38 (45.2%) |
| 6 to 18 Years | 99 (35.6%) | 186 (66.9%) |
| 19 to 25 Years | 2 (1.4%) | 137 (95.8%) |
| 25 to 34 Years | 47 (19.7%) | 166 (69.5%) |
| 35 to 44 Years | 53 (22.1%) | 167 (69.6%) |
| 45 to 54 Years | 31 (13.1%) | 200 (84.4%) |
| 55 to 64 Years | 22 (11.6%) | 160 (84.2%) |
| 65 to 74 Years | 195 (96.1%) | 108 (53.2%) |
| 75 Years and over | 136 (99.3%) | 106 (77.4%) |
| Total | 634 (36.2%) | 1,268 (72.4%) |
Disability Status by Sex by Age in Shiremanstown borough
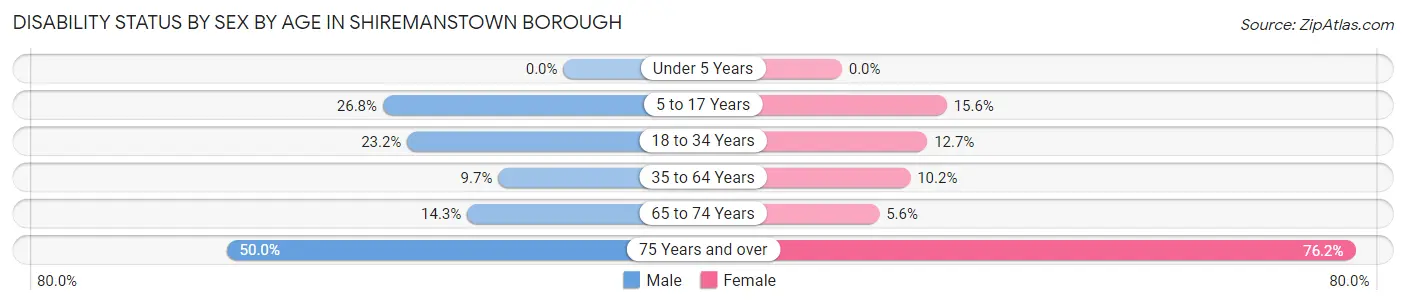
| Age Bracket | Male | Female |
| Under 5 Years | 0 (0.0%) | 0 (0.0%) |
| 5 to 17 Years | 26 (26.8%) | 24 (15.6%) |
| 18 to 34 Years | 64 (23.2%) | 18 (12.7%) |
| 35 to 64 Years | 35 (9.7%) | 31 (10.2%) |
| 65 to 74 Years | 11 (14.3%) | 7 (5.6%) |
| 75 Years and over | 18 (50.0%) | 77 (76.2%) |
Disability Class by Sex by Age in Shiremanstown borough
Disability Class: Hearing Difficulty
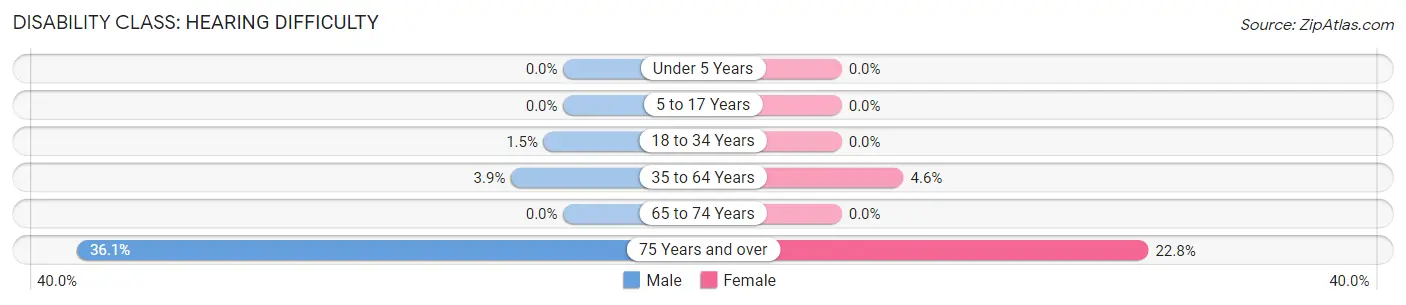
| Age Bracket | Male | Female |
| Under 5 Years | 0 (0.0%) | 0 (0.0%) |
| 5 to 17 Years | 0 (0.0%) | 0 (0.0%) |
| 18 to 34 Years | 4 (1.5%) | 0 (0.0%) |
| 35 to 64 Years | 14 (3.9%) | 14 (4.6%) |
| 65 to 74 Years | 0 (0.0%) | 0 (0.0%) |
| 75 Years and over | 13 (36.1%) | 23 (22.8%) |
Disability Class: Vision Difficulty
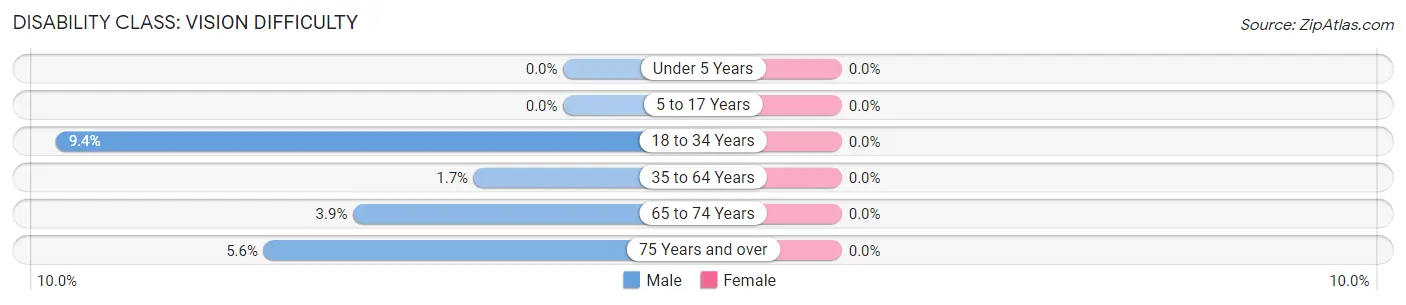
| Age Bracket | Male | Female |
| Under 5 Years | 0 (0.0%) | 0 (0.0%) |
| 5 to 17 Years | 0 (0.0%) | 0 (0.0%) |
| 18 to 34 Years | 26 (9.4%) | 0 (0.0%) |
| 35 to 64 Years | 6 (1.7%) | 0 (0.0%) |
| 65 to 74 Years | 3 (3.9%) | 0 (0.0%) |
| 75 Years and over | 2 (5.6%) | 0 (0.0%) |
Disability Class: Cognitive Difficulty
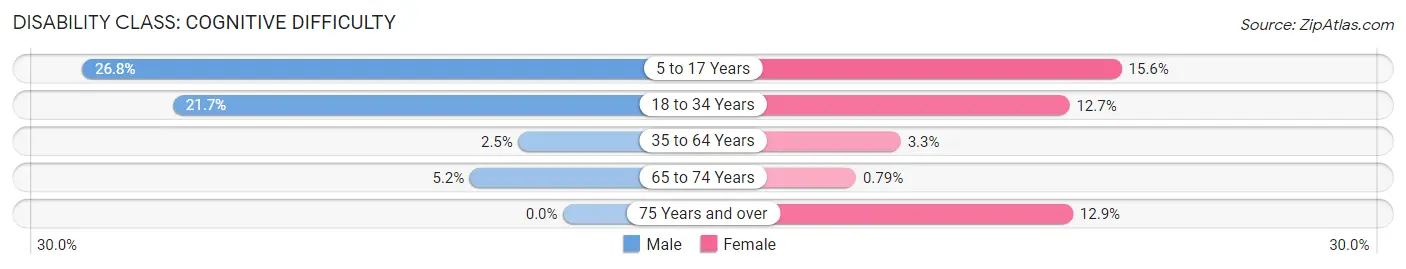
| Age Bracket | Male | Female |
| 5 to 17 Years | 26 (26.8%) | 24 (15.6%) |
| 18 to 34 Years | 60 (21.7%) | 18 (12.7%) |
| 35 to 64 Years | 9 (2.5%) | 10 (3.3%) |
| 65 to 74 Years | 4 (5.2%) | 1 (0.8%) |
| 75 Years and over | 0 (0.0%) | 13 (12.9%) |
Disability Class: Ambulatory Difficulty
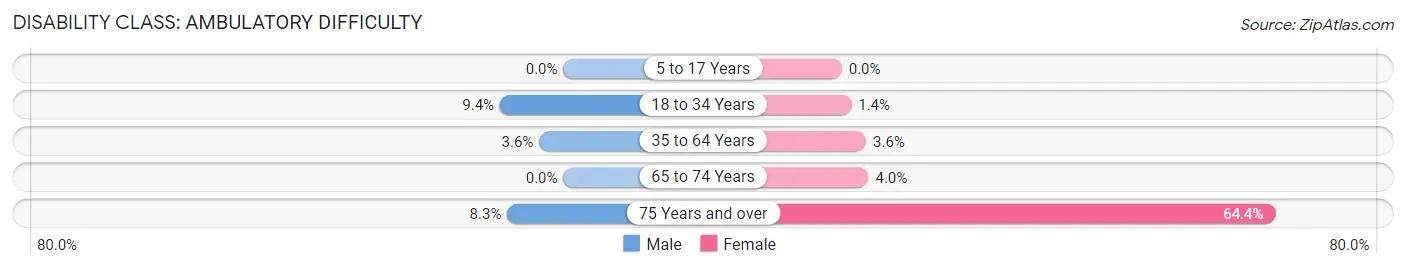
| Age Bracket | Male | Female |
| 5 to 17 Years | 0 (0.0%) | 0 (0.0%) |
| 18 to 34 Years | 26 (9.4%) | 2 (1.4%) |
| 35 to 64 Years | 13 (3.6%) | 11 (3.6%) |
| 65 to 74 Years | 0 (0.0%) | 5 (4.0%) |
| 75 Years and over | 3 (8.3%) | 65 (64.4%) |
Disability Class: Self-Care Difficulty
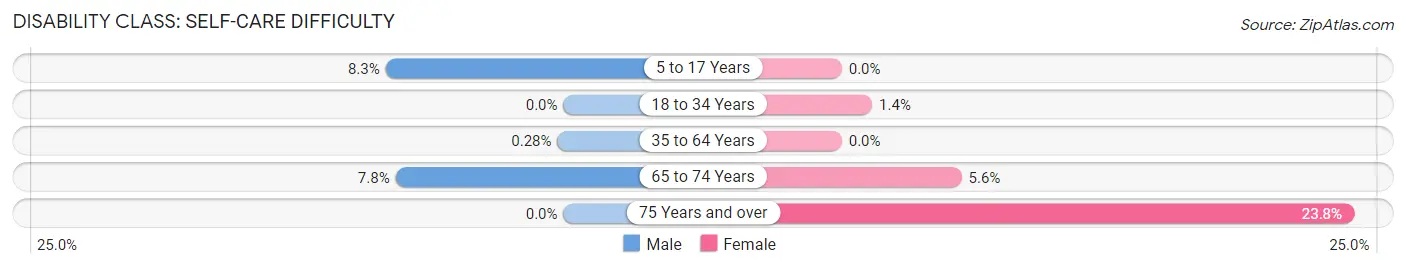
| Age Bracket | Male | Female |
| 5 to 17 Years | 8 (8.3%) | 0 (0.0%) |
| 18 to 34 Years | 0 (0.0%) | 2 (1.4%) |
| 35 to 64 Years | 1 (0.3%) | 0 (0.0%) |
| 65 to 74 Years | 6 (7.8%) | 7 (5.6%) |
| 75 Years and over | 0 (0.0%) | 24 (23.8%) |
Technology Access in Shiremanstown borough
Computing Device Access in Shiremanstown borough
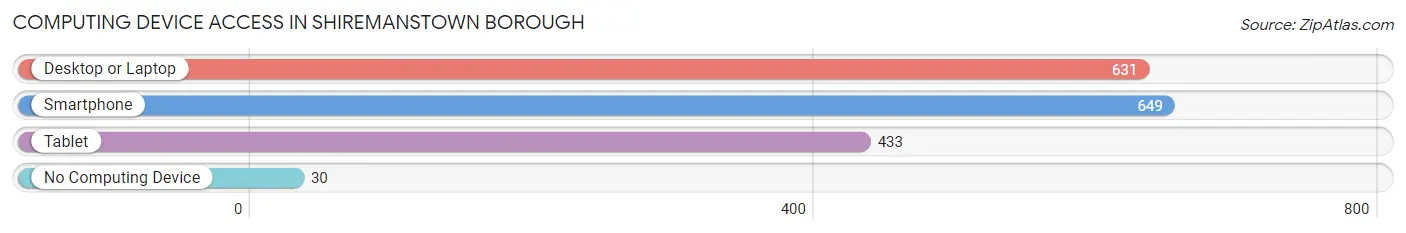
| Device Type | # Households | % Households |
| Desktop or Laptop | 631 | 84.4% |
| Smartphone | 649 | 86.8% |
| Tablet | 433 | 57.9% |
| No Computing Device | 30 | 4.0% |
| Total | 748 | 100.0% |
Internet Access in Shiremanstown borough
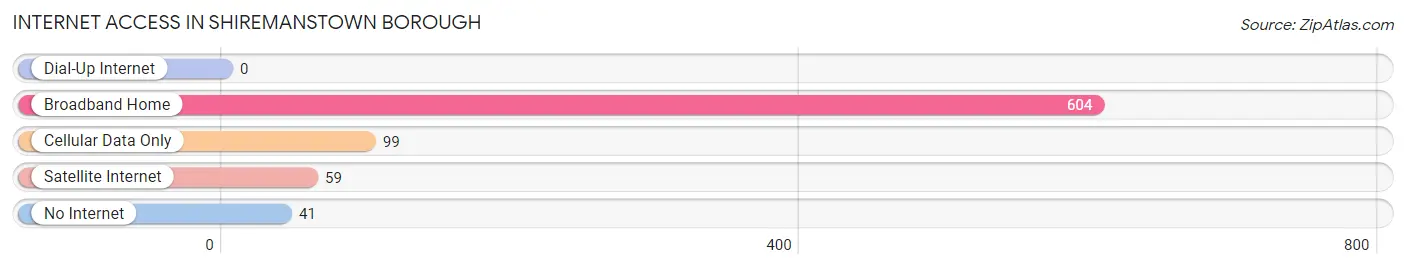
| Internet Type | # Households | % Households |
| Dial-Up Internet | 0 | 0.0% |
| Broadband Home | 604 | 80.7% |
| Cellular Data Only | 99 | 13.2% |
| Satellite Internet | 59 | 7.9% |
| No Internet | 41 | 5.5% |
| Total | 748 | 100.0% |
Shiremanstown borough Summary
Shiremanstown Borough is a small borough located in Cumberland County, Pennsylvania. It is situated in the Susquehanna Valley, approximately 10 miles south of Harrisburg, the state capital. The borough is bordered by Hampden Township to the north, Lower Allen Township to the east, and Upper Allen Township to the south and west. The population of Shiremanstown Borough was 2,845 at the 2010 census.
History
Shiremanstown was founded in 1764 by John Shireman, a German immigrant who had settled in the area in 1760. The town was originally known as Shireman's Town, but the name was eventually shortened to Shiremanstown. The town was incorporated as a borough in 1851.
Shiremanstown was a small farming community until the late 19th century, when the Pennsylvania Railroad built a line through the town. This brought an influx of new residents and businesses, and the town began to grow. In the early 20th century, Shiremanstown was a popular summer resort destination, with several hotels and resorts located in the area.
Geography
Shiremanstown Borough is located at 40°14'N 76°54'W (40.23, -76.90). It has a total area of 0.9 square miles, all of which is land. The borough is situated in the Susquehanna Valley, approximately 10 miles south of Harrisburg, the state capital. The borough is bordered by Hampden Township to the north, Lower Allen Township to the east, and Upper Allen Township to the south and west.
Economy
Shiremanstown Borough has a diverse economy, with a mix of retail, manufacturing, and service businesses. The largest employers in the borough are the Shiremanstown Shopping Center, the Shiremanstown Medical Center, and the Shiremanstown Fire Department. Other businesses in the borough include restaurants, banks, auto repair shops, and a variety of other retail stores.
Demographics
As of the 2010 census, there were 2,845 people, 1,093 households, and 745 families residing in the borough. The population density was 3,093.3 people per square mile. The racial makeup of the borough was 94.2% White, 1.7% African American, 0.2% Native American, 1.2% Asian, 0.1% Pacific Islander, 1.2% from other races, and 1.6% from two or more races. Hispanic or Latino of any race were 3.2% of the population.
The median income for a household in the borough was $50,938, and the median income for a family was $60,938. Males had a median income of $41,938 versus $30,938 for females. The per capita income for the borough was $24,938. About 4.2% of families and 5.2% of the population were below the poverty line, including 6.2% of those under age 18 and 4.2% of those age 65 or over.
Common Questions
What is Per Capita Income in Shiremanstown borough?
Per Capita income in Shiremanstown borough is $33,757.
What is the Median Family Income in Shiremanstown borough?
Median Family Income in Shiremanstown borough is $90,078.
What is the Median Household income in Shiremanstown borough?
Median Household Income in Shiremanstown borough is $67,368.
What is Income or Wage Gap in Shiremanstown borough?
Income or Wage Gap in Shiremanstown borough is 7.4%.
Women in Shiremanstown borough earn 92.6 cents for every dollar earned by a man.
What is Inequality or Gini Index in Shiremanstown borough?
Inequality or Gini Index in Shiremanstown borough is 0.33.
What is the Total Population of Shiremanstown borough?
Total Population of Shiremanstown borough is 1,751.
What is the Total Male Population of Shiremanstown borough?
Total Male Population of Shiremanstown borough is 887.
What is the Total Female Population of Shiremanstown borough?
Total Female Population of Shiremanstown borough is 864.
What is the Ratio of Males per 100 Females in Shiremanstown borough?
There are 102.66 Males per 100 Females in Shiremanstown borough.
What is the Ratio of Females per 100 Males in Shiremanstown borough?
There are 97.41 Females per 100 Males in Shiremanstown borough.
What is the Median Population Age in Shiremanstown borough?
Median Population Age in Shiremanstown borough is 39.3 Years.
What is the Average Family Size in Shiremanstown borough
Average Family Size in Shiremanstown borough is 3.2 People.
What is the Average Household Size in Shiremanstown borough
Average Household Size in Shiremanstown borough is 2.3 People.
How Large is the Labor Force in Shiremanstown borough?
There are 943 People in the Labor Forcein in Shiremanstown borough.
What is the Percentage of People in the Labor Force in Shiremanstown borough?
64.3% of People are in the Labor Force in Shiremanstown borough.
What is the Unemployment Rate in Shiremanstown borough?
Unemployment Rate in Shiremanstown borough is 10.5%.