Dauphin borough, PA Map & Demographics
Dauphin borough Overview
$33,794
PER CAPITA INCOME
$92,917
AVG FAMILY INCOME
$57,000
AVG HOUSEHOLD INCOME
42.8%
WAGE / INCOME GAP [ % ]
57.2¢/ $1
WAGE / INCOME GAP [ $ ]
0.50
INEQUALITY / GINI INDEX
1,123
TOTAL POPULATION
433
MALE POPULATION
690
FEMALE POPULATION
62.75
MALES / 100 FEMALES
159.35
FEMALES / 100 MALES
34.3
MEDIAN AGE
3.2
AVG FAMILY SIZE
2.1
AVG HOUSEHOLD SIZE
550
LABOR FORCE [ PEOPLE ]
62.1%
PERCENT IN LABOR FORCE
3.5%
UNEMPLOYMENT RATE
Income in Dauphin borough
Income Overview in Dauphin borough
Per Capita Income in Dauphin borough is $33,794, while median incomes of families and households are $92,917 and $57,000 respectively.
| Characteristic | Number | Measure |
| Per Capita Income | 1,123 | $33,794 |
| Median Family Income | 256 | $92,917 |
| Mean Family Income | 256 | $97,364 |
| Median Household Income | 522 | $57,000 |
| Mean Household Income | 522 | $71,397 |
| Income Deficit | 256 | $0 |
| Wage / Income Gap (%) | 1,123 | 42.83% |
| Wage / Income Gap ($) | 1,123 | 57.17¢ per $1 |
| Gini / Inequality Index | 1,123 | 0.50 |
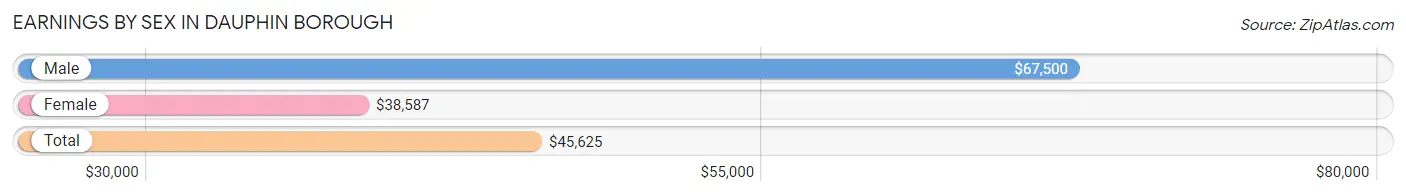
Earnings by Sex in Dauphin borough
Average Earnings in Dauphin borough are $45,625, $67,500 for men and $38,587 for women, a difference of 42.8%.
| Sex | Number | Average Earnings |
| Male | 236 (42.3%) | $67,500 |
| Female | 322 (57.7%) | $38,587 |
| Total | 558 (100.0%) | $45,625 |
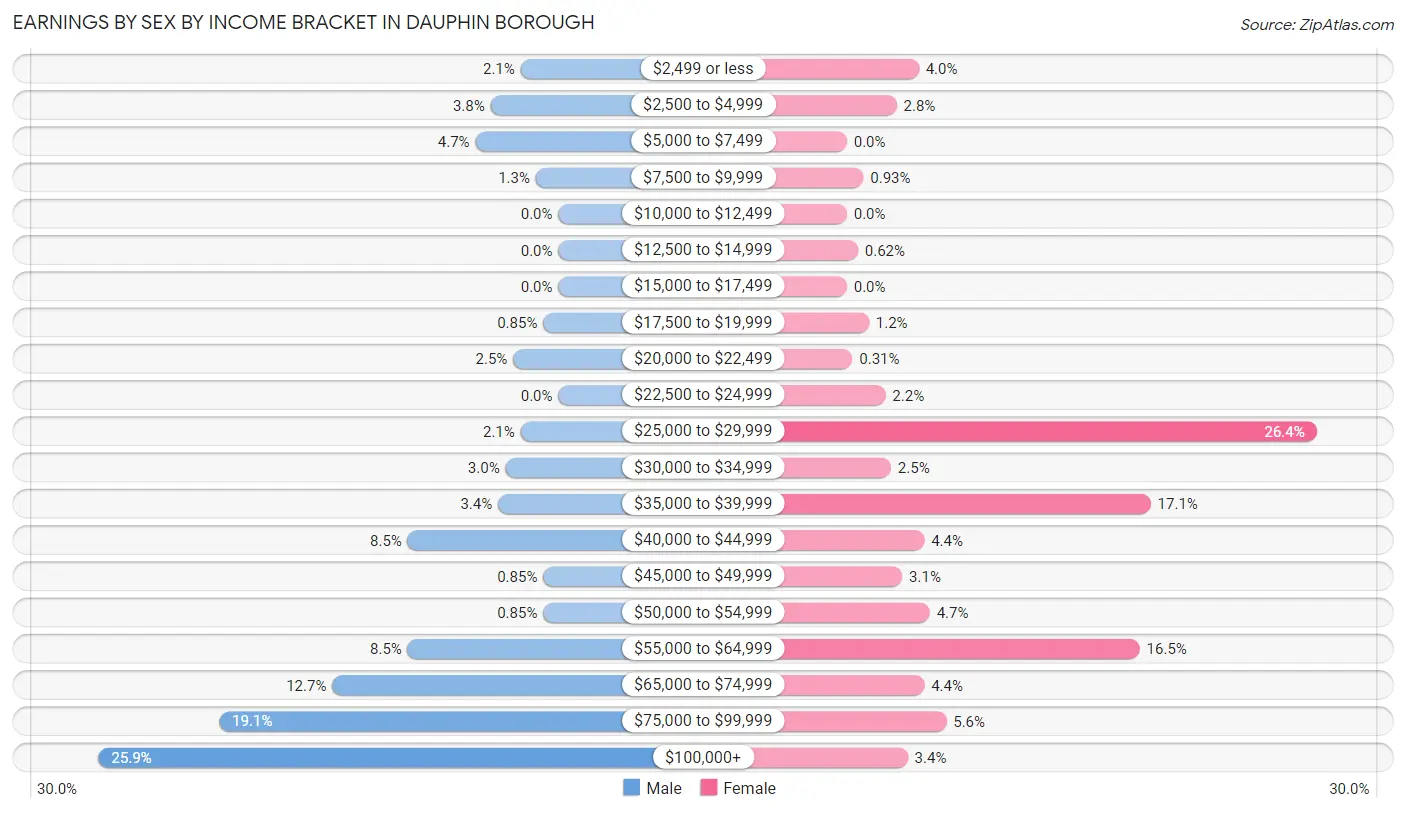
Earnings by Sex by Income Bracket in Dauphin borough
The most common earnings brackets in Dauphin borough are $100,000+ for men (61 | 25.9%) and $25,000 to $29,999 for women (85 | 26.4%).
| Income | Male | Female |
| $2,499 or less | 5 (2.1%) | 13 (4.0%) |
| $2,500 to $4,999 | 9 (3.8%) | 9 (2.8%) |
| $5,000 to $7,499 | 11 (4.7%) | 0 (0.0%) |
| $7,500 to $9,999 | 3 (1.3%) | 3 (0.9%) |
| $10,000 to $12,499 | 0 (0.0%) | 0 (0.0%) |
| $12,500 to $14,999 | 0 (0.0%) | 2 (0.6%) |
| $15,000 to $17,499 | 0 (0.0%) | 0 (0.0%) |
| $17,500 to $19,999 | 2 (0.9%) | 4 (1.2%) |
| $20,000 to $22,499 | 6 (2.5%) | 1 (0.3%) |
| $22,500 to $24,999 | 0 (0.0%) | 7 (2.2%) |
| $25,000 to $29,999 | 5 (2.1%) | 85 (26.4%) |
| $30,000 to $34,999 | 7 (3.0%) | 8 (2.5%) |
| $35,000 to $39,999 | 8 (3.4%) | 55 (17.1%) |
| $40,000 to $44,999 | 20 (8.5%) | 14 (4.3%) |
| $45,000 to $49,999 | 2 (0.9%) | 10 (3.1%) |
| $50,000 to $54,999 | 2 (0.9%) | 15 (4.7%) |
| $55,000 to $64,999 | 20 (8.5%) | 53 (16.5%) |
| $65,000 to $74,999 | 30 (12.7%) | 14 (4.3%) |
| $75,000 to $99,999 | 45 (19.1%) | 18 (5.6%) |
| $100,000+ | 61 (25.9%) | 11 (3.4%) |
| Total | 236 (100.0%) | 322 (100.0%) |
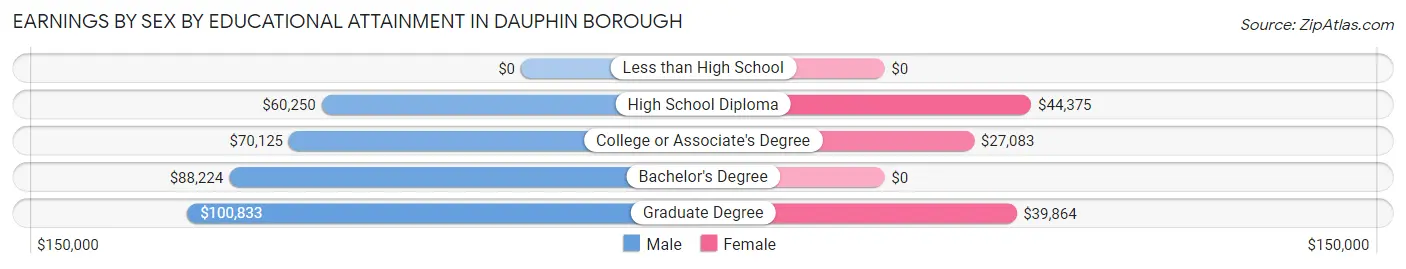
Earnings by Sex by Educational Attainment in Dauphin borough
Average earnings in Dauphin borough are $70,875 for men and $38,967 for women, a difference of 45.0%. Men with an educational attainment of graduate degree enjoy the highest average annual earnings of $100,833, while those with high school diploma education earn the least with $60,250. Women with an educational attainment of high school diploma earn the most with the average annual earnings of $44,375, while those with college or associate's degree education have the smallest earnings of $27,083.
| Educational Attainment | Male Income | Female Income |
| Less than High School | - | - |
| High School Diploma | $60,250 | $44,375 |
| College or Associate's Degree | $70,125 | $27,083 |
| Bachelor's Degree | $88,224 | $0 |
| Graduate Degree | $100,833 | $39,864 |
| Total | $70,875 | $38,967 |
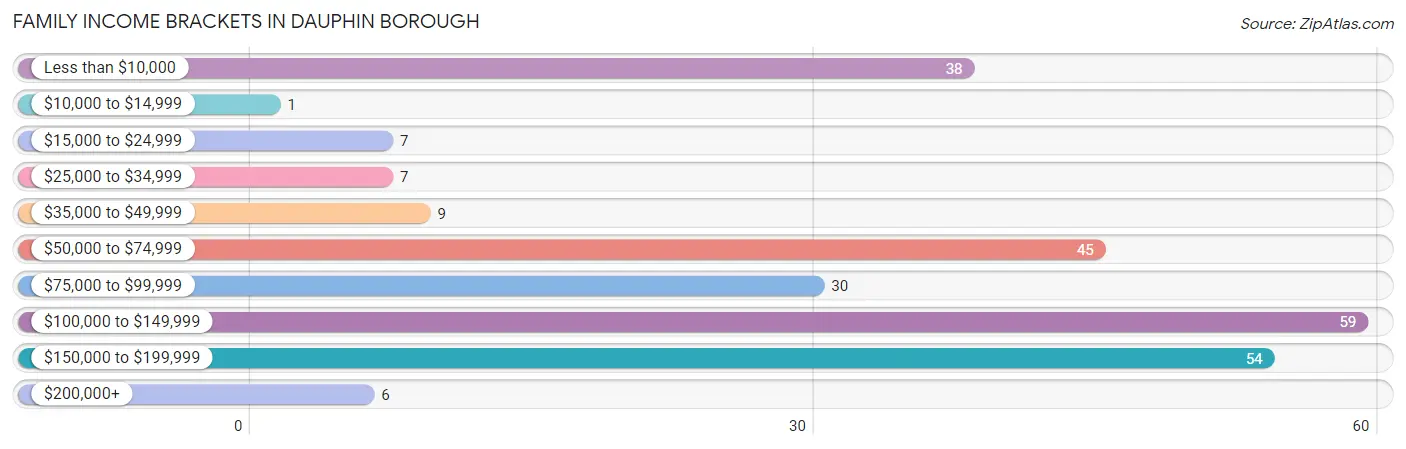
Family Income in Dauphin borough
Family Income Brackets in Dauphin borough
According to the Dauphin borough family income data, there are 59 families falling into the $100,000 to $149,999 income range, which is the most common income bracket and makes up 23.1% of all families. Conversely, the $10,000 to $14,999 income bracket is the least frequent group with only 1 families (0.4%) belonging to this category.
| Income Bracket | # Families | % Families |
| Less than $10,000 | 38 | 14.8% |
| $10,000 to $14,999 | 1 | 0.4% |
| $15,000 to $24,999 | 7 | 2.7% |
| $25,000 to $34,999 | 7 | 2.7% |
| $35,000 to $49,999 | 9 | 3.5% |
| $50,000 to $74,999 | 45 | 17.6% |
| $75,000 to $99,999 | 30 | 11.7% |
| $100,000 to $149,999 | 59 | 23.0% |
| $150,000 to $199,999 | 54 | 21.1% |
| $200,000+ | 6 | 2.3% |
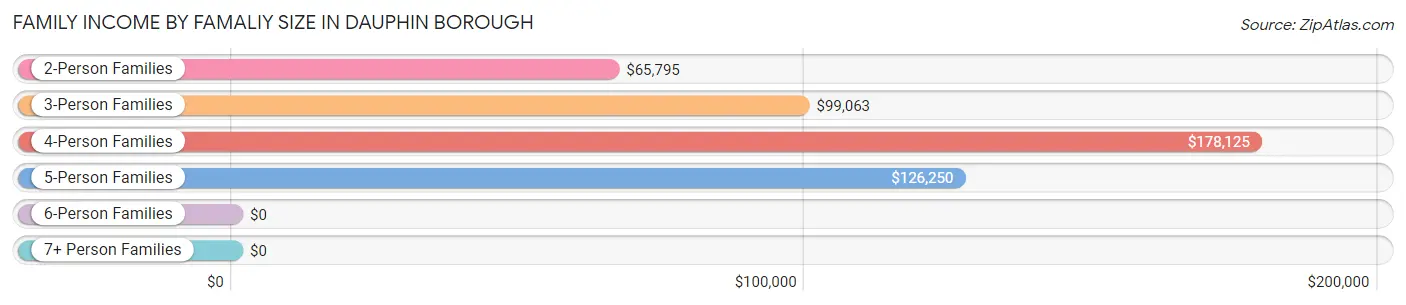
Family Income by Famaliy Size in Dauphin borough
4-person families (54 | 21.1%) account for the highest median family income in Dauphin borough with $178,125 per family, while 4-person families (54 | 21.1%) have the highest median income of $44,531 per family member.
| Income Bracket | # Families | Median Income |
| 2-Person Families | 119 (46.5%) | $65,795 |
| 3-Person Families | 61 (23.8%) | $99,063 |
| 4-Person Families | 54 (21.1%) | $178,125 |
| 5-Person Families | 17 (6.6%) | $126,250 |
| 6-Person Families | 0 (0.0%) | $0 |
| 7+ Person Families | 5 (1.9%) | $0 |
| Total | 256 (100.0%) | $92,917 |
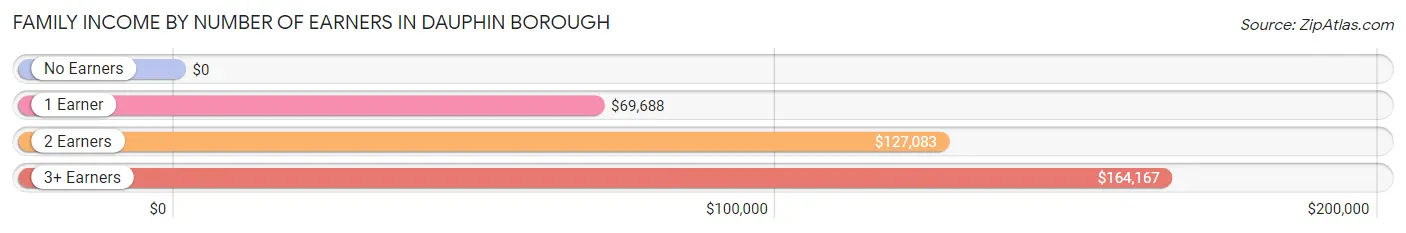
Family Income by Number of Earners in Dauphin borough
| Number of Earners | # Families | Median Income |
| No Earners | 54 (21.1%) | $0 |
| 1 Earner | 49 (19.1%) | $69,688 |
| 2 Earners | 147 (57.4%) | $127,083 |
| 3+ Earners | 6 (2.3%) | $164,167 |
| Total | 256 (100.0%) | $92,917 |
Household Income in Dauphin borough
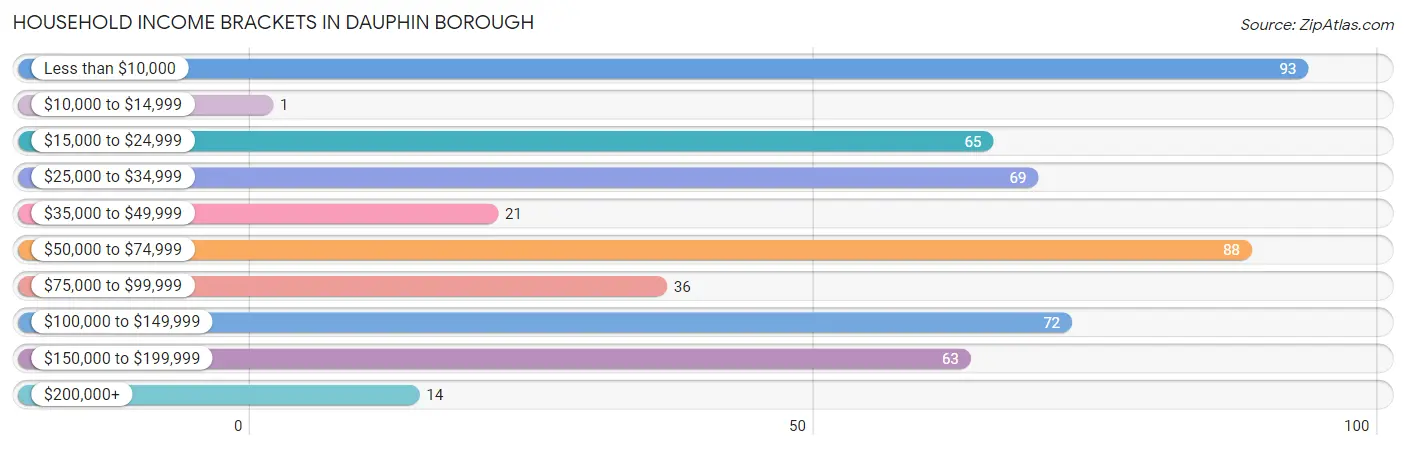
Household Income Brackets in Dauphin borough
With 93 households falling in the category, the less than $10,000 income range is the most frequent in Dauphin borough, accounting for 17.8% of all households. In contrast, only 1 households (0.2%) fall into the $10,000 to $14,999 income bracket, making it the least populous group.
| Income Bracket | # Households | % Households |
| Less than $10,000 | 93 | 17.8% |
| $10,000 to $14,999 | 1 | 0.2% |
| $15,000 to $24,999 | 65 | 12.5% |
| $25,000 to $34,999 | 69 | 13.2% |
| $35,000 to $49,999 | 21 | 4.0% |
| $50,000 to $74,999 | 88 | 16.9% |
| $75,000 to $99,999 | 36 | 6.9% |
| $100,000 to $149,999 | 72 | 13.8% |
| $150,000 to $199,999 | 63 | 12.1% |
| $200,000+ | 14 | 2.7% |
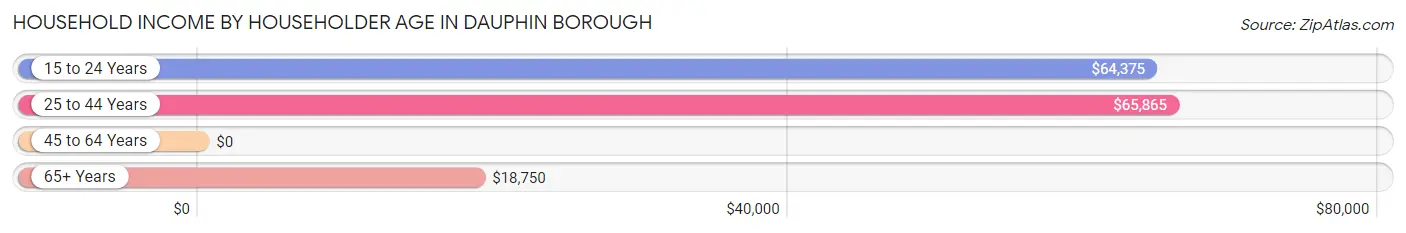
Household Income by Householder Age in Dauphin borough
The median household income in Dauphin borough is $57,000, with the highest median household income of $65,865 found in the 25 to 44 years age bracket for the primary householder. A total of 227 households (43.5%) fall into this category. Meanwhile, the 45 to 64 years age bracket for the primary householder has the lowest median household income of $0, with 122 households (23.4%) in this group.
| Income Bracket | # Households | Median Income |
| 15 to 24 Years | 18 (3.5%) | $64,375 |
| 25 to 44 Years | 227 (43.5%) | $65,865 |
| 45 to 64 Years | 122 (23.4%) | $0 |
| 65+ Years | 155 (29.7%) | $18,750 |
| Total | 522 (100.0%) | $57,000 |
Poverty in Dauphin borough
Income Below Poverty by Sex and Age in Dauphin borough
With 5.8% poverty level for males and 13.6% for females among the residents of Dauphin borough, 25 to 34 year old males and 75 year old and over females are the most vulnerable to poverty, with 23 males (25.8%) and 55 females (69.6%) in their respective age groups living below the poverty level.
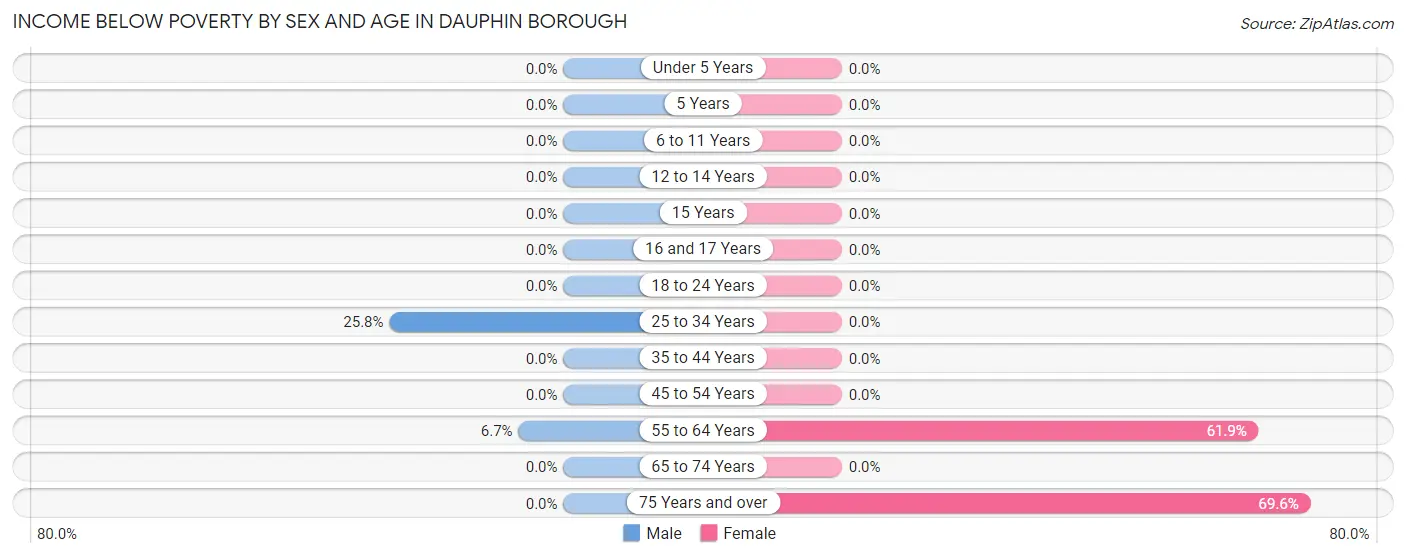
| Age Bracket | Male | Female |
| Under 5 Years | 0 (0.0%) | 0 (0.0%) |
| 5 Years | 0 (0.0%) | 0 (0.0%) |
| 6 to 11 Years | 0 (0.0%) | 0 (0.0%) |
| 12 to 14 Years | 0 (0.0%) | 0 (0.0%) |
| 15 Years | 0 (0.0%) | 0 (0.0%) |
| 16 and 17 Years | 0 (0.0%) | 0 (0.0%) |
| 18 to 24 Years | 0 (0.0%) | 0 (0.0%) |
| 25 to 34 Years | 23 (25.8%) | 0 (0.0%) |
| 35 to 44 Years | 0 (0.0%) | 0 (0.0%) |
| 45 to 54 Years | 0 (0.0%) | 0 (0.0%) |
| 55 to 64 Years | 2 (6.7%) | 39 (61.9%) |
| 65 to 74 Years | 0 (0.0%) | 0 (0.0%) |
| 75 Years and over | 0 (0.0%) | 55 (69.6%) |
| Total | 25 (5.8%) | 94 (13.6%) |
Income Above Poverty by Sex and Age in Dauphin borough
According to the poverty statistics in Dauphin borough, males aged under 5 years and females aged under 5 years are the age groups that are most secure financially, with 100.0% of males and 100.0% of females in these age groups living above the poverty line.
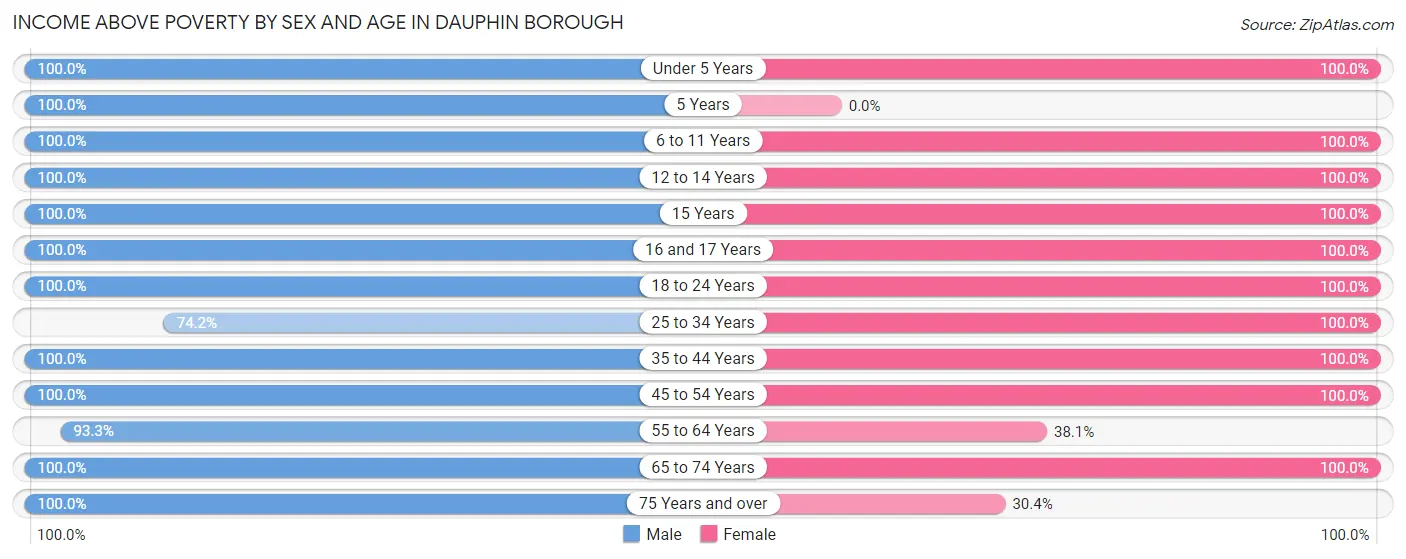
| Age Bracket | Male | Female |
| Under 5 Years | 33 (100.0%) | 27 (100.0%) |
| 5 Years | 17 (100.0%) | 0 (0.0%) |
| 6 to 11 Years | 37 (100.0%) | 30 (100.0%) |
| 12 to 14 Years | 21 (100.0%) | 61 (100.0%) |
| 15 Years | 8 (100.0%) | 4 (100.0%) |
| 16 and 17 Years | 13 (100.0%) | 50 (100.0%) |
| 18 to 24 Years | 11 (100.0%) | 20 (100.0%) |
| 25 to 34 Years | 66 (74.2%) | 148 (100.0%) |
| 35 to 44 Years | 76 (100.0%) | 74 (100.0%) |
| 45 to 54 Years | 47 (100.0%) | 76 (100.0%) |
| 55 to 64 Years | 28 (93.3%) | 24 (38.1%) |
| 65 to 74 Years | 23 (100.0%) | 58 (100.0%) |
| 75 Years and over | 28 (100.0%) | 24 (30.4%) |
| Total | 408 (94.2%) | 596 (86.4%) |
Income Below Poverty Among Married-Couple Families in Dauphin borough
The poverty statistics for married-couple families in Dauphin borough show that 0.5% or 1 of the total 183 families live below the poverty line. Families with no children have the highest poverty rate of 1.4%, comprising of 1 families. On the other hand, families with 1 or 2 children have the lowest poverty rate of 0.0%, which includes 0 families.
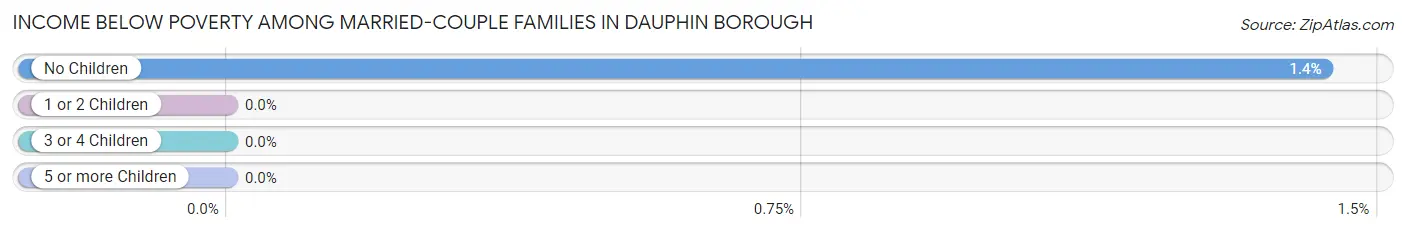
| Children | Above Poverty | Below Poverty |
| No Children | 69 (98.6%) | 1 (1.4%) |
| 1 or 2 Children | 96 (100.0%) | 0 (0.0%) |
| 3 or 4 Children | 12 (100.0%) | 0 (0.0%) |
| 5 or more Children | 5 (100.0%) | 0 (0.0%) |
| Total | 182 (99.5%) | 1 (0.5%) |
Income Below Poverty Among Single-Parent Households in Dauphin borough
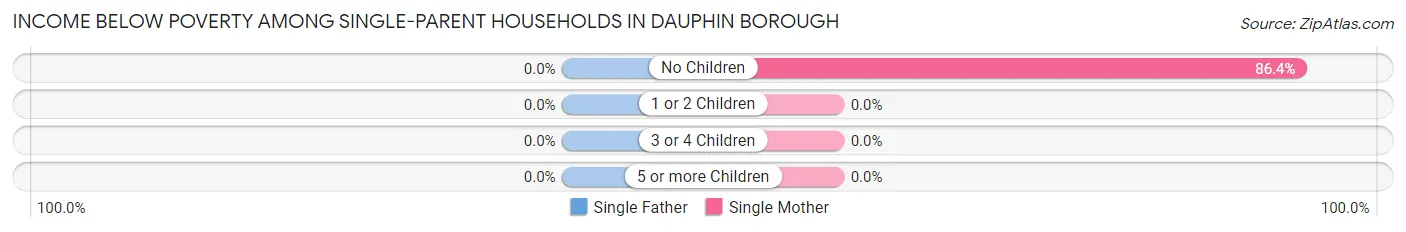
| Children | Single Father | Single Mother |
| No Children | 0 (0.0%) | 38 (86.4%) |
| 1 or 2 Children | 0 (0.0%) | 0 (0.0%) |
| 3 or 4 Children | 0 (0.0%) | 0 (0.0%) |
| 5 or more Children | 0 (0.0%) | 0 (0.0%) |
| Total | 0 (0.0%) | 38 (61.3%) |
Income Below Poverty Among Married-Couple vs Single-Parent Households in Dauphin borough
The poverty data for Dauphin borough shows that 1 of the married-couple family households (0.5%) and 38 of the single-parent households (52.0%) are living below the poverty level. Within the married-couple family households, those with no children have the highest poverty rate, with 1 households (1.4%) falling below the poverty line. Among the single-parent households, those with no children have the highest poverty rate, with 38 household (86.4%) living below poverty.
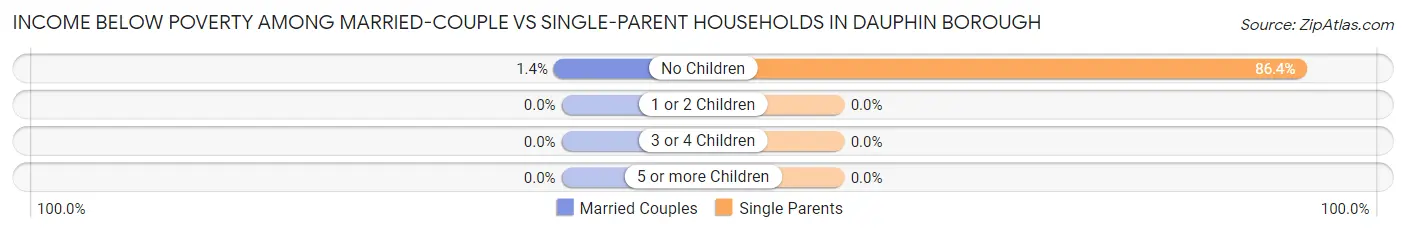
| Children | Married-Couple Families | Single-Parent Households |
| No Children | 1 (1.4%) | 38 (86.4%) |
| 1 or 2 Children | 0 (0.0%) | 0 (0.0%) |
| 3 or 4 Children | 0 (0.0%) | 0 (0.0%) |
| 5 or more Children | 0 (0.0%) | 0 (0.0%) |
| Total | 1 (0.5%) | 38 (52.0%) |
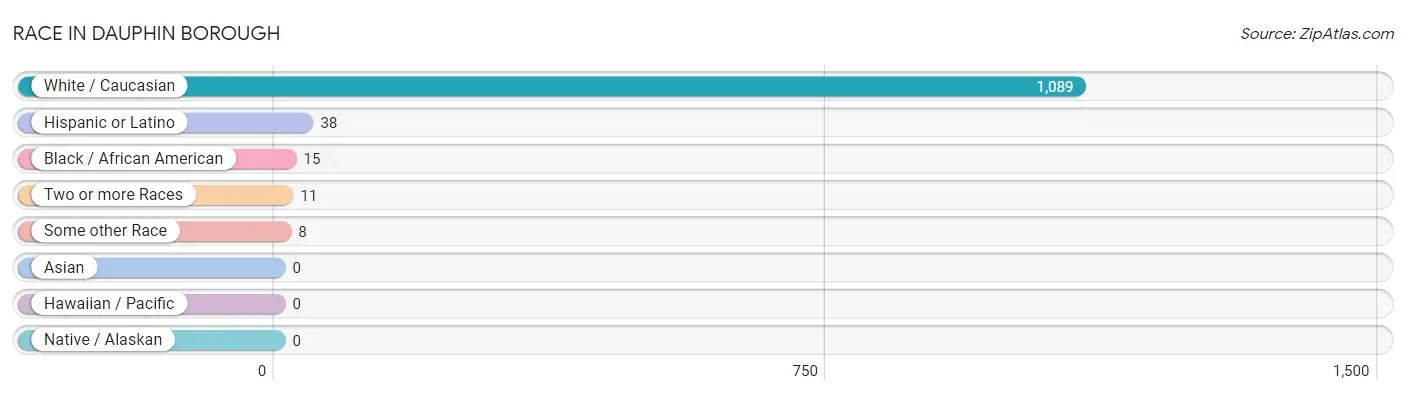
Race in Dauphin borough
The most populous races in Dauphin borough are White / Caucasian (1,089 | 97.0%), Hispanic or Latino (38 | 3.4%), and Black / African American (15 | 1.3%).
| Race | # Population | % Population |
| Asian | 0 | 0.0% |
| Black / African American | 15 | 1.3% |
| Hawaiian / Pacific | 0 | 0.0% |
| Hispanic or Latino | 38 | 3.4% |
| Native / Alaskan | 0 | 0.0% |
| White / Caucasian | 1,089 | 97.0% |
| Two or more Races | 11 | 1.0% |
| Some other Race | 8 | 0.7% |
| Total | 1,123 | 100.0% |
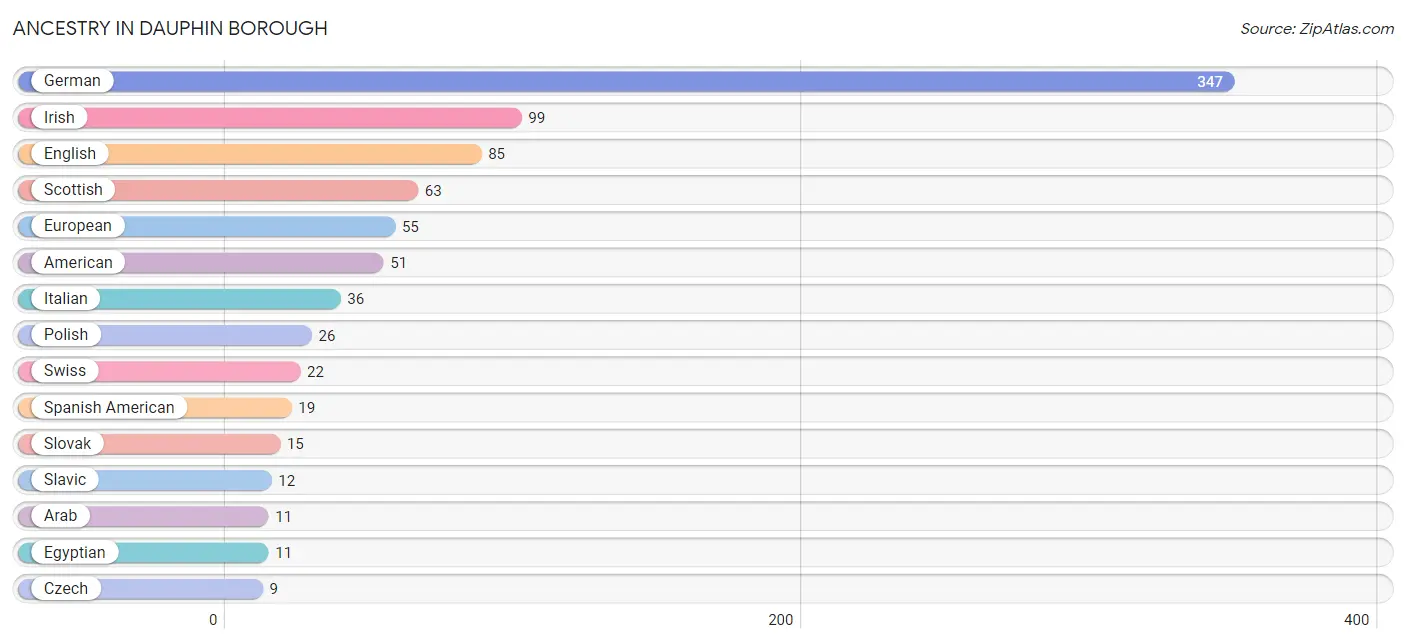
Ancestry in Dauphin borough
The most populous ancestries reported in Dauphin borough are German (347 | 30.9%), Irish (99 | 8.8%), English (85 | 7.6%), Scottish (63 | 5.6%), and European (55 | 4.9%), together accounting for 57.8% of all Dauphin borough residents.
| Ancestry | # Population | % Population |
| American | 51 | 4.5% |
| Arab | 11 | 1.0% |
| British | 4 | 0.4% |
| Burmese | 2 | 0.2% |
| Central American | 8 | 0.7% |
| Croatian | 5 | 0.4% |
| Czech | 9 | 0.8% |
| Danish | 3 | 0.3% |
| Eastern European | 3 | 0.3% |
| Egyptian | 11 | 1.0% |
| English | 85 | 7.6% |
| European | 55 | 4.9% |
| French | 6 | 0.5% |
| French Canadian | 2 | 0.2% |
| German | 347 | 30.9% |
| Hungarian | 7 | 0.6% |
| Irish | 99 | 8.8% |
| Italian | 36 | 3.2% |
| Lithuanian | 4 | 0.4% |
| Panamanian | 8 | 0.7% |
| Pennsylvania German | 2 | 0.2% |
| Polish | 26 | 2.3% |
| Puerto Rican | 4 | 0.4% |
| Scotch-Irish | 8 | 0.7% |
| Scottish | 63 | 5.6% |
| Serbian | 2 | 0.2% |
| Slavic | 12 | 1.1% |
| Slovak | 15 | 1.3% |
| Spanish | 7 | 0.6% |
| Spanish American | 19 | 1.7% |
| Swedish | 8 | 0.7% |
| Swiss | 22 | 2.0% |
| Ukrainian | 8 | 0.7% |
| Welsh | 6 | 0.5% | View All 34 Rows |
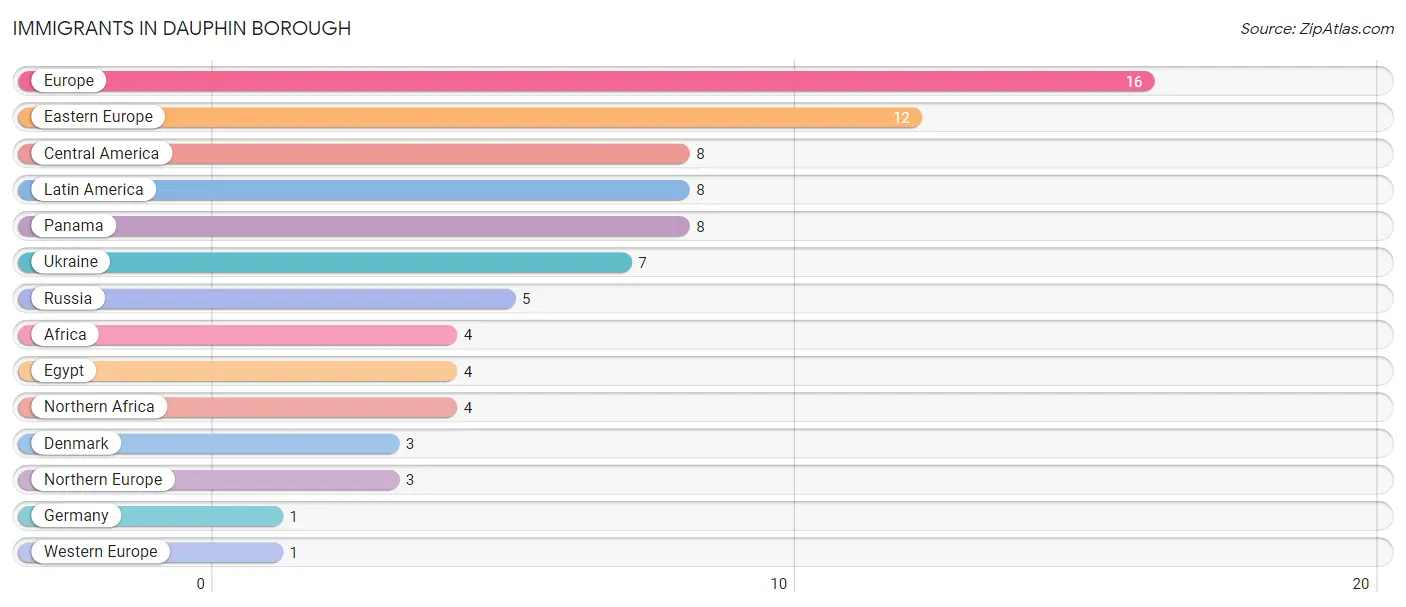
Immigrants in Dauphin borough
The most numerous immigrant groups reported in Dauphin borough came from Europe (16 | 1.4%), Eastern Europe (12 | 1.1%), Central America (8 | 0.7%), Latin America (8 | 0.7%), and Panama (8 | 0.7%), together accounting for 4.6% of all Dauphin borough residents.
| Immigration Origin | # Population | % Population |
| Africa | 4 | 0.4% |
| Central America | 8 | 0.7% |
| Denmark | 3 | 0.3% |
| Eastern Europe | 12 | 1.1% |
| Egypt | 4 | 0.4% |
| Europe | 16 | 1.4% |
| Germany | 1 | 0.1% |
| Latin America | 8 | 0.7% |
| Northern Africa | 4 | 0.4% |
| Northern Europe | 3 | 0.3% |
| Panama | 8 | 0.7% |
| Russia | 5 | 0.4% |
| Ukraine | 7 | 0.6% |
| Western Europe | 1 | 0.1% | View All 14 Rows |
Sex and Age in Dauphin borough
Sex and Age in Dauphin borough
The most populous age groups in Dauphin borough are 30 to 34 Years (50 | 11.6%) for men and 25 to 29 Years (88 | 12.8%) for women.
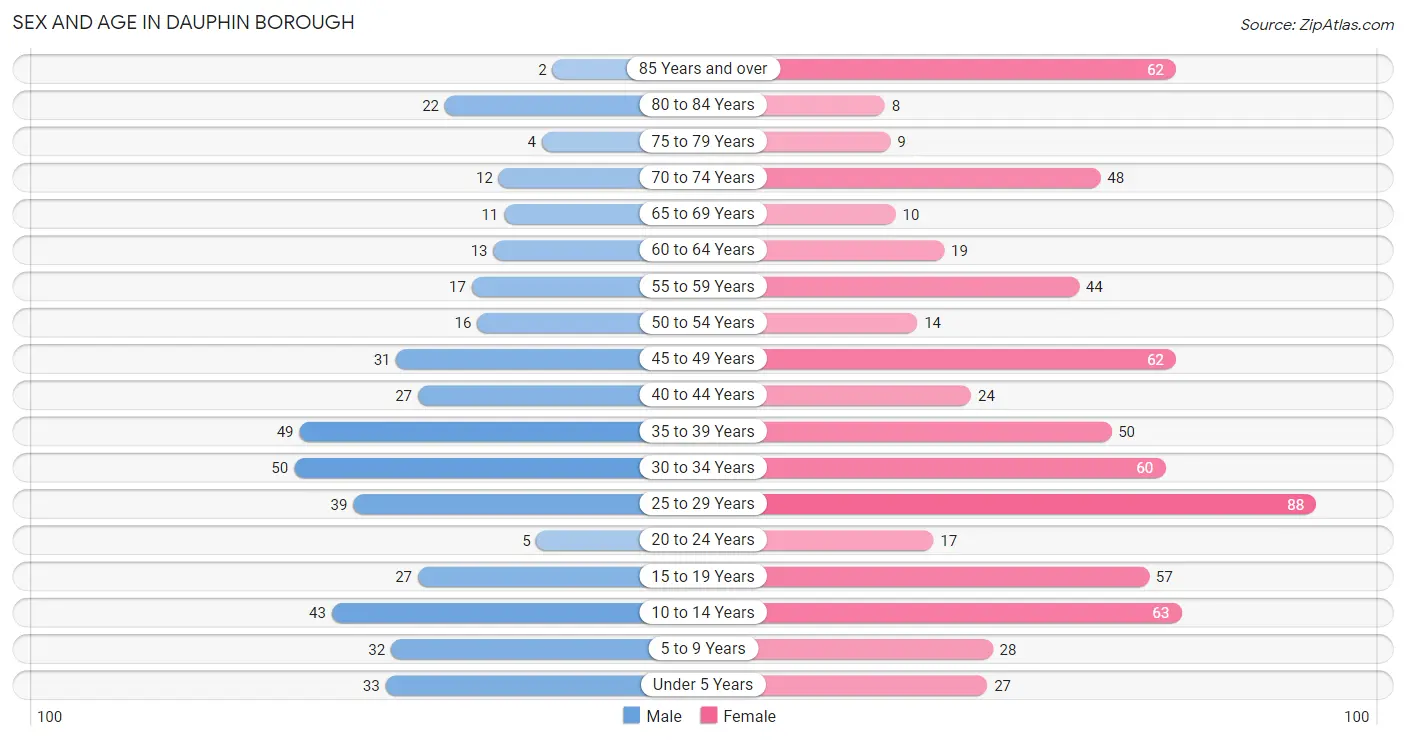
| Age Bracket | Male | Female |
| Under 5 Years | 33 (7.6%) | 27 (3.9%) |
| 5 to 9 Years | 32 (7.4%) | 28 (4.1%) |
| 10 to 14 Years | 43 (9.9%) | 63 (9.1%) |
| 15 to 19 Years | 27 (6.2%) | 57 (8.3%) |
| 20 to 24 Years | 5 (1.1%) | 17 (2.5%) |
| 25 to 29 Years | 39 (9.0%) | 88 (12.8%) |
| 30 to 34 Years | 50 (11.6%) | 60 (8.7%) |
| 35 to 39 Years | 49 (11.3%) | 50 (7.2%) |
| 40 to 44 Years | 27 (6.2%) | 24 (3.5%) |
| 45 to 49 Years | 31 (7.2%) | 62 (9.0%) |
| 50 to 54 Years | 16 (3.7%) | 14 (2.0%) |
| 55 to 59 Years | 17 (3.9%) | 44 (6.4%) |
| 60 to 64 Years | 13 (3.0%) | 19 (2.8%) |
| 65 to 69 Years | 11 (2.5%) | 10 (1.5%) |
| 70 to 74 Years | 12 (2.8%) | 48 (7.0%) |
| 75 to 79 Years | 4 (0.9%) | 9 (1.3%) |
| 80 to 84 Years | 22 (5.1%) | 8 (1.2%) |
| 85 Years and over | 2 (0.5%) | 62 (9.0%) |
| Total | 433 (100.0%) | 690 (100.0%) |
Families and Households in Dauphin borough
Median Family Size in Dauphin borough
The median family size in Dauphin borough is 3.20 persons per family, with married-couple families (183 | 71.5%) accounting for the largest median family size of 3.68 persons per family. On the other hand, single female/mother families (62 | 24.2%) represent the smallest median family size with 1.95 persons per family.
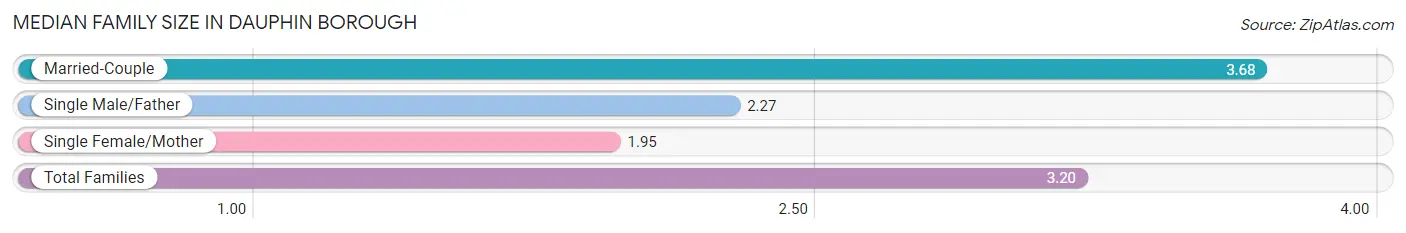
| Family Type | # Families | Family Size |
| Married-Couple | 183 (71.5%) | 3.68 |
| Single Male/Father | 11 (4.3%) | 2.27 |
| Single Female/Mother | 62 (24.2%) | 1.95 |
| Total Families | 256 (100.0%) | 3.20 |
Median Household Size in Dauphin borough
The median household size in Dauphin borough is 2.15 persons per household, with married-couple households (183 | 35.1%) accounting for the largest median household size of 3.68 persons per household. non-family households (266 | 51.0%) represent the smallest median household size with 1.09 persons per household.
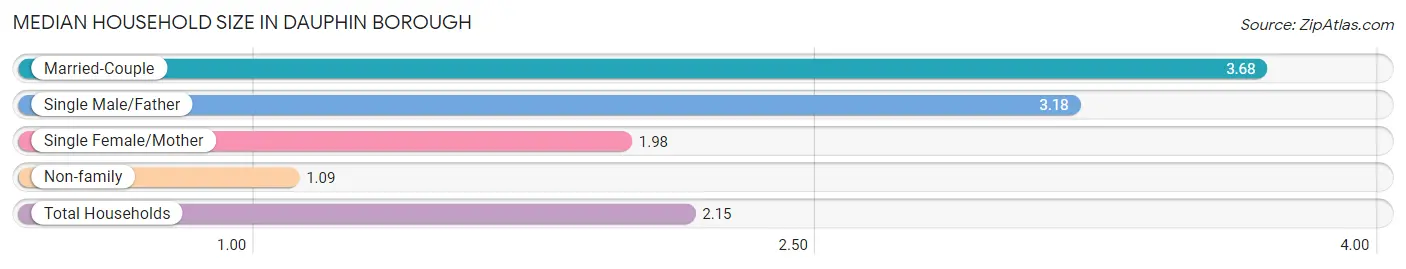
| Household Type | # Households | Household Size |
| Married-Couple | 183 (35.1%) | 3.68 |
| Single Male/Father | 11 (2.1%) | 3.18 |
| Single Female/Mother | 62 (11.9%) | 1.98 |
| Non-family | 266 (51.0%) | 1.09 |
| Total Households | 522 (100.0%) | 2.15 |
Household Size by Marriage Status in Dauphin borough
Out of a total of 522 households in Dauphin borough, 256 (49.0%) are family households, while 266 (51.0%) are nonfamily households. The most numerous type of family households are 2-person households, comprising 108, and the most common type of nonfamily households are 1-person households, comprising 242.
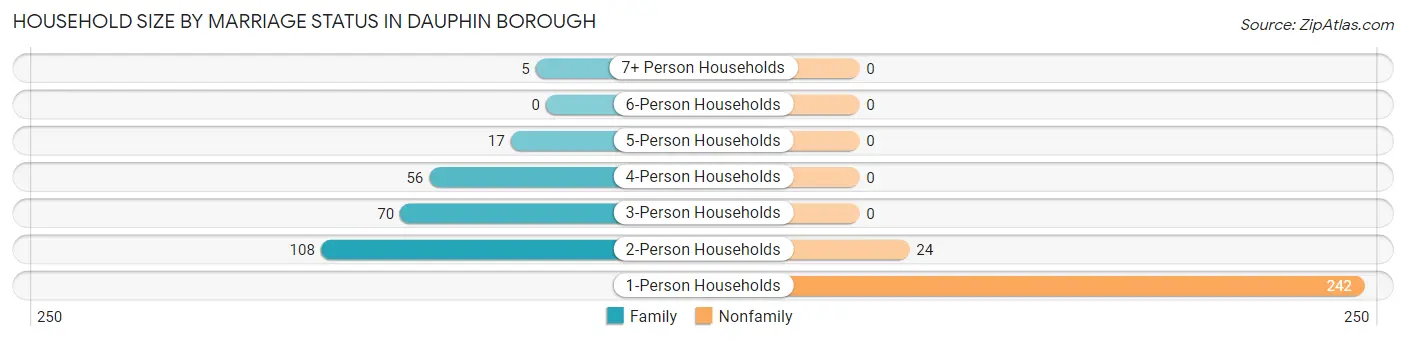
| Household Size | Family Households | Nonfamily Households |
| 1-Person Households | - | 242 (46.4%) |
| 2-Person Households | 108 (20.7%) | 24 (4.6%) |
| 3-Person Households | 70 (13.4%) | 0 (0.0%) |
| 4-Person Households | 56 (10.7%) | 0 (0.0%) |
| 5-Person Households | 17 (3.3%) | 0 (0.0%) |
| 6-Person Households | 0 (0.0%) | 0 (0.0%) |
| 7+ Person Households | 5 (1.0%) | 0 (0.0%) |
| Total | 256 (49.0%) | 266 (51.0%) |
Female Fertility in Dauphin borough
Fertility by Age in Dauphin borough
Average fertility rate in Dauphin borough is 61.0 births per 1,000 women. Women in the age bracket of 20 to 34 years have the highest fertility rate with 91.0 births per 1,000 women. Women in the age bracket of 20 to 34 years acount for 68.2% of all women with births.
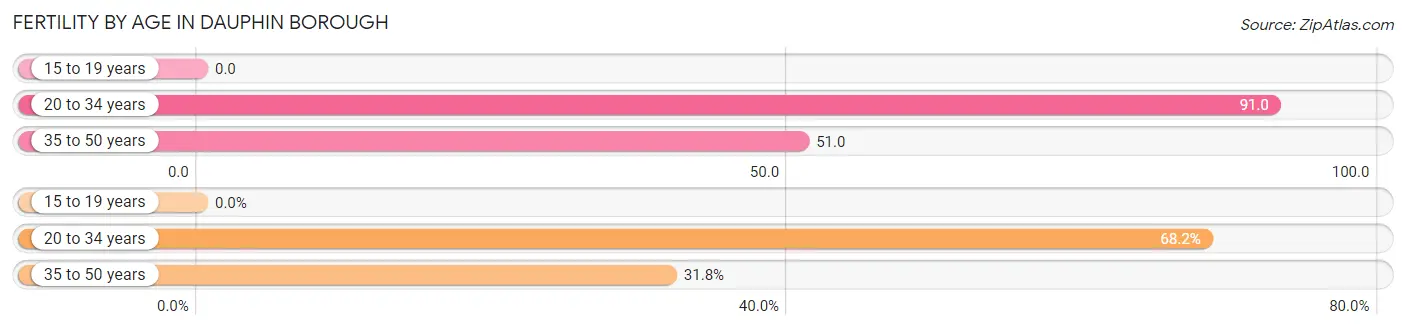
| Age Bracket | Women with Births | Births / 1,000 Women |
| 15 to 19 years | 0 (0.0%) | 0.0 |
| 20 to 34 years | 15 (68.2%) | 91.0 |
| 35 to 50 years | 7 (31.8%) | 51.0 |
| Total | 22 (100.0%) | 61.0 |
Fertility by Age by Marriage Status in Dauphin borough
95.5% of women with births (22) in Dauphin borough are married. The highest percentage of unmarried women with births falls into 20 to 34 years age bracket with 6.7% of them unmarried at the time of birth, while the lowest percentage of unmarried women with births belong to 35 to 50 years age bracket with 0.0% of them unmarried.
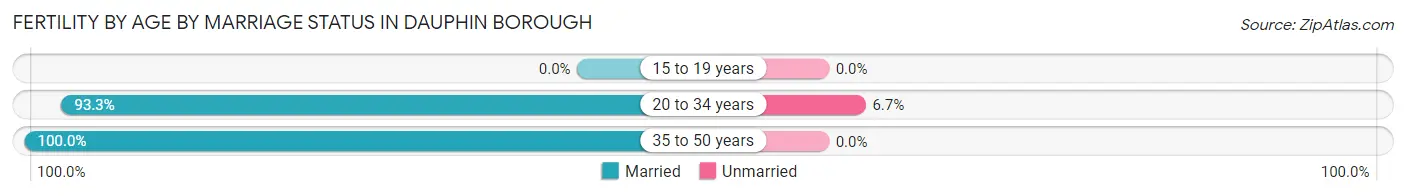
| Age Bracket | Married | Unmarried |
| 15 to 19 years | 0 (0.0%) | 0 (0.0%) |
| 20 to 34 years | 14 (93.3%) | 1 (6.7%) |
| 35 to 50 years | 7 (100.0%) | 0 (0.0%) |
| Total | 21 (95.5%) | 1 (4.5%) |
Fertility by Education in Dauphin borough
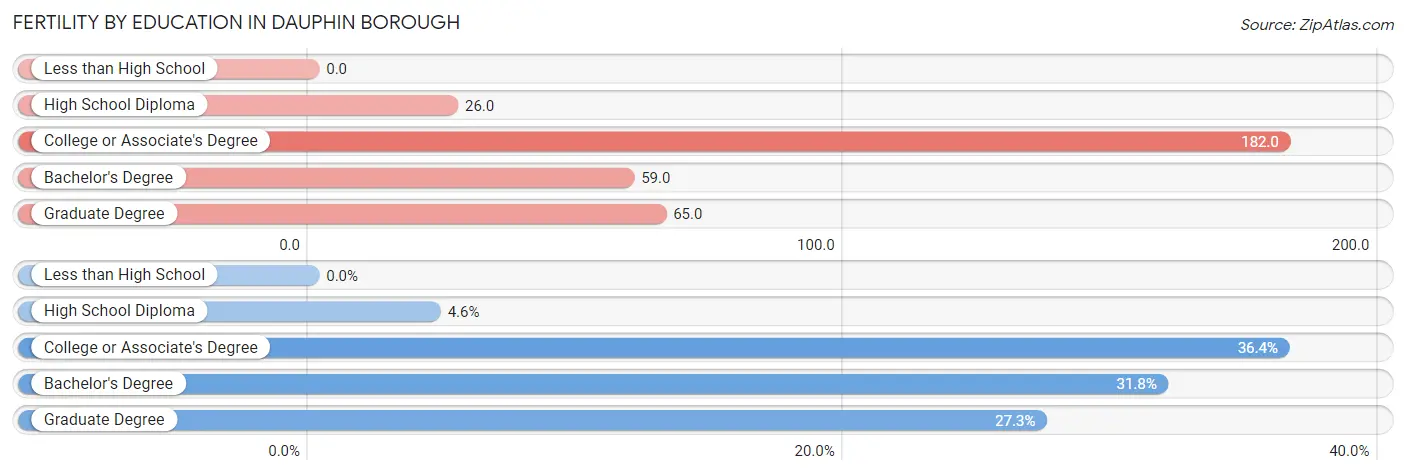
| Educational Attainment | Women with Births | Births / 1,000 Women |
| Less than High School | 0 (0.0%) | 0.0 |
| High School Diploma | 1 (4.5%) | 26.0 |
| College or Associate's Degree | 8 (36.4%) | 182.0 |
| Bachelor's Degree | 7 (31.8%) | 59.0 |
| Graduate Degree | 6 (27.3%) | 65.0 |
| Total | 22 (100.0%) | 61.0 |
Fertility by Education by Marriage Status in Dauphin borough
4.5% of women with births in Dauphin borough are unmarried. Women with the educational attainment of college or associate's degree are most likely to be married with 100.0% of them married at childbirth, while women with the educational attainment of high school diploma are least likely to be married with 100.0% of them unmarried at childbirth.
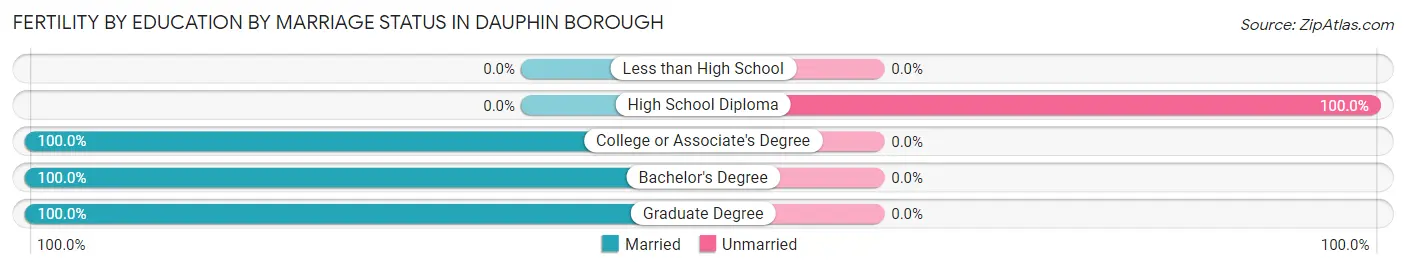
| Educational Attainment | Married | Unmarried |
| Less than High School | 0 (0.0%) | 0 (0.0%) |
| High School Diploma | 0 (0.0%) | 1 (100.0%) |
| College or Associate's Degree | 8 (100.0%) | 0 (0.0%) |
| Bachelor's Degree | 7 (100.0%) | 0 (0.0%) |
| Graduate Degree | 6 (100.0%) | 0 (0.0%) |
| Total | 21 (95.5%) | 1 (4.5%) |
Employment Characteristics in Dauphin borough
Employment by Class of Employer in Dauphin borough
Among the 521 employed individuals in Dauphin borough, private company employees (317 | 60.8%), state government employees (78 | 15.0%), and not-for-profit organizations (71 | 13.6%) make up the most common classes of employment.
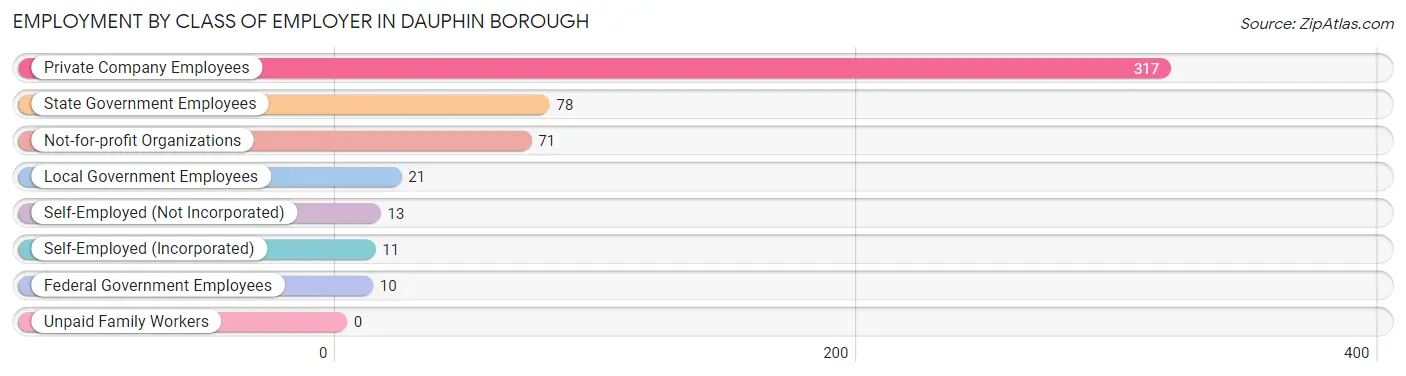
| Employer Class | # Employees | % Employees |
| Private Company Employees | 317 | 60.8% |
| Self-Employed (Incorporated) | 11 | 2.1% |
| Self-Employed (Not Incorporated) | 13 | 2.5% |
| Not-for-profit Organizations | 71 | 13.6% |
| Local Government Employees | 21 | 4.0% |
| State Government Employees | 78 | 15.0% |
| Federal Government Employees | 10 | 1.9% |
| Unpaid Family Workers | 0 | 0.0% |
| Total | 521 | 100.0% |
Employment Status by Age in Dauphin borough
According to the labor force statistics for Dauphin borough, out of the total population over 16 years of age (885), 62.1% or 550 individuals are in the labor force, with 3.5% or 19 of them unemployed. The age group with the highest labor force participation rate is 25 to 29 years, with 100.0% or 127 individuals in the labor force. Within the labor force, the 16 to 19 years age range has the highest percentage of unemployed individuals, with 40.0% or 4 of them being unemployed.
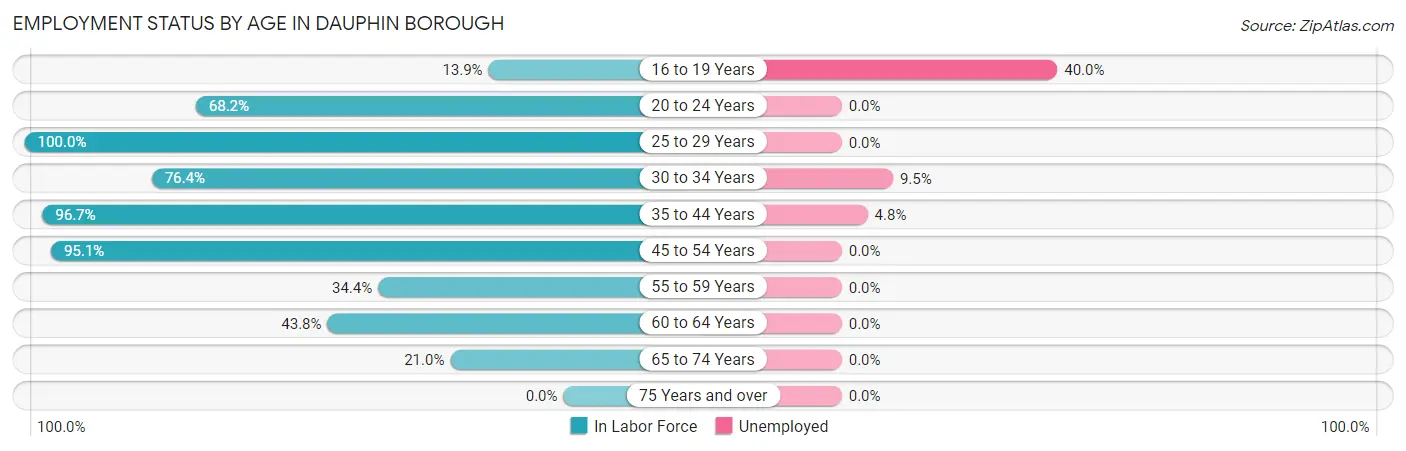
| Age Bracket | In Labor Force | Unemployed |
| 16 to 19 Years | 10 (13.9%) | 4 (40.0%) |
| 20 to 24 Years | 15 (68.2%) | 0 (0.0%) |
| 25 to 29 Years | 127 (100.0%) | 0 (0.0%) |
| 30 to 34 Years | 84 (76.4%) | 8 (9.5%) |
| 35 to 44 Years | 145 (96.7%) | 7 (4.8%) |
| 45 to 54 Years | 117 (95.1%) | 0 (0.0%) |
| 55 to 59 Years | 21 (34.4%) | 0 (0.0%) |
| 60 to 64 Years | 14 (43.8%) | 0 (0.0%) |
| 65 to 74 Years | 17 (21.0%) | 0 (0.0%) |
| 75 Years and over | 0 (0.0%) | 0 (0.0%) |
| Total | 550 (62.1%) | 19 (3.5%) |
Employment Status by Educational Attainment in Dauphin borough
According to labor force statistics for Dauphin borough, 84.2% of individuals (508) out of the total population between 25 and 64 years of age (603) are in the labor force, with 3.0% or 15 of them being unemployed. The group with the highest labor force participation rate are those with the educational attainment of college / associate degree, with 97.3% or 107 individuals in the labor force. Within the labor force, individuals with less than high school education have the highest percentage of unemployment, with 100.0% or 8 of them being unemployed.
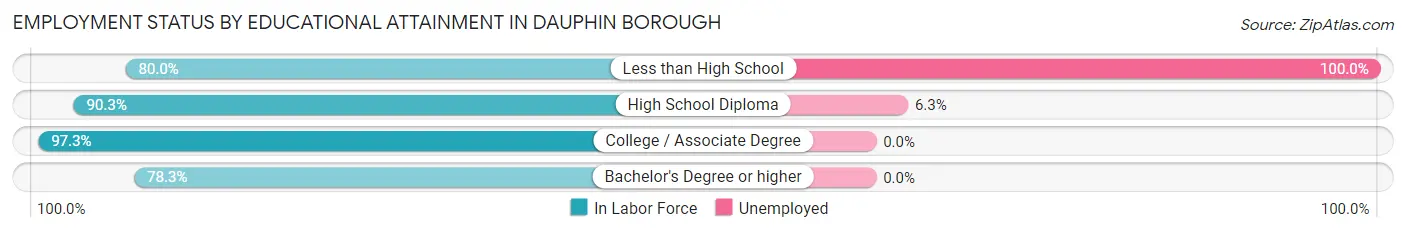
| Educational Attainment | In Labor Force | Unemployed |
| Less than High School | 8 (80.0%) | 10 (100.0%) |
| High School Diploma | 112 (90.3%) | 8 (6.3%) |
| College / Associate Degree | 107 (97.3%) | 0 (0.0%) |
| Bachelor's Degree or higher | 281 (78.3%) | 0 (0.0%) |
| Total | 508 (84.2%) | 18 (3.0%) |
Employment Occupations by Sex in Dauphin borough
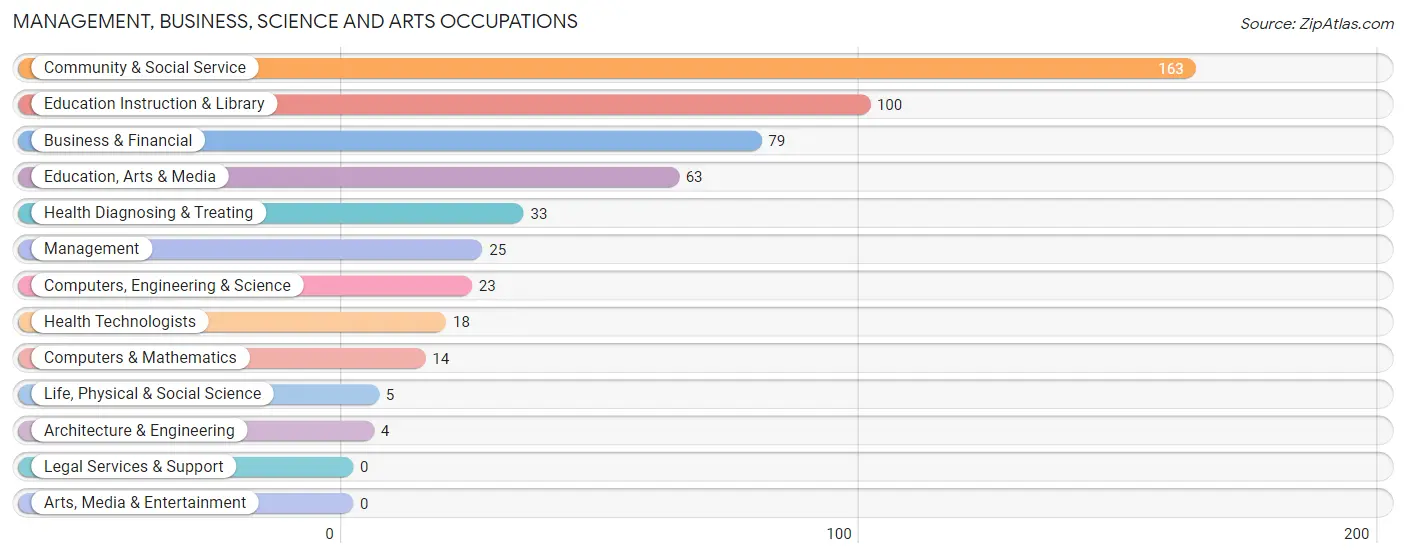
Management, Business, Science and Arts Occupations
The most common Management, Business, Science and Arts occupations in Dauphin borough are Community & Social Service (163 | 30.7%), Education Instruction & Library (100 | 18.8%), Business & Financial (79 | 14.9%), Education, Arts & Media (63 | 11.9%), and Health Diagnosing & Treating (33 | 6.2%).
Management, Business, Science and Arts Occupations by Sex
Within the Management, Business, Science and Arts occupations in Dauphin borough, the most male-oriented occupations are Computers, Engineering & Science (100.0%), Computers & Mathematics (100.0%), and Architecture & Engineering (100.0%), while the most female-oriented occupations are Education, Arts & Media (100.0%), Community & Social Service (98.8%), and Education Instruction & Library (98.0%).
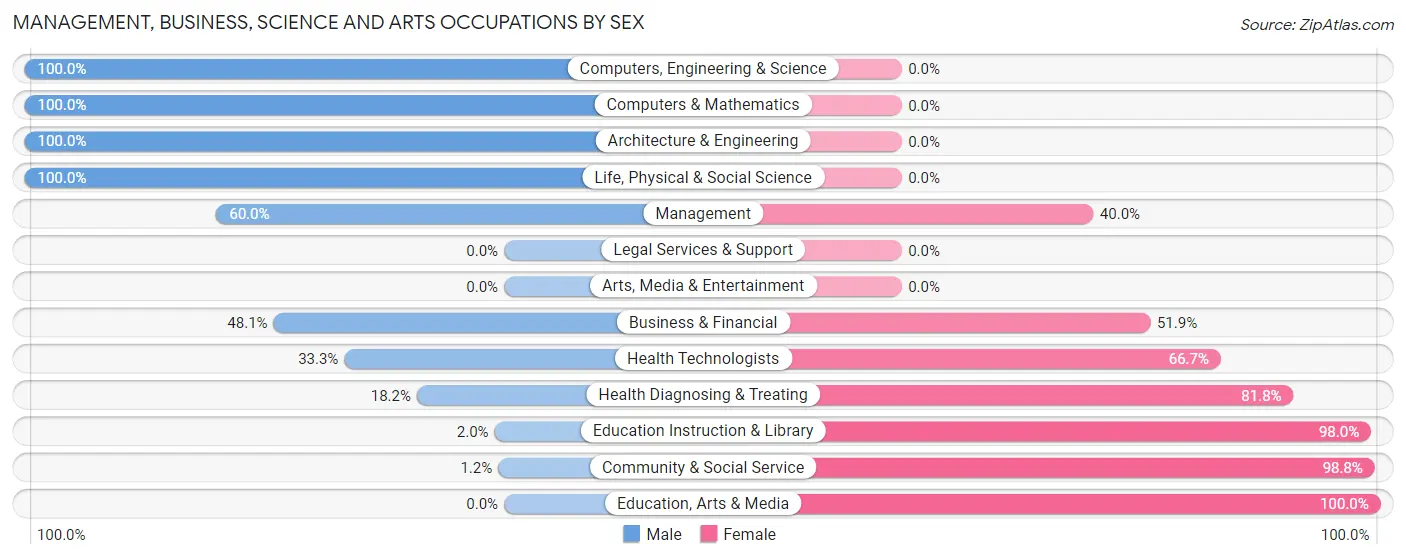
| Occupation | Male | Female |
| Management | 15 (60.0%) | 10 (40.0%) |
| Business & Financial | 38 (48.1%) | 41 (51.9%) |
| Computers, Engineering & Science | 23 (100.0%) | 0 (0.0%) |
| Computers & Mathematics | 14 (100.0%) | 0 (0.0%) |
| Architecture & Engineering | 4 (100.0%) | 0 (0.0%) |
| Life, Physical & Social Science | 5 (100.0%) | 0 (0.0%) |
| Community & Social Service | 2 (1.2%) | 161 (98.8%) |
| Education, Arts & Media | 0 (0.0%) | 63 (100.0%) |
| Legal Services & Support | 0 (0.0%) | 0 (0.0%) |
| Education Instruction & Library | 2 (2.0%) | 98 (98.0%) |
| Arts, Media & Entertainment | 0 (0.0%) | 0 (0.0%) |
| Health Diagnosing & Treating | 6 (18.2%) | 27 (81.8%) |
| Health Technologists | 6 (33.3%) | 12 (66.7%) |
| Total (Category) | 84 (26.0%) | 239 (74.0%) |
| Total (Overall) | 224 (42.2%) | 307 (57.8%) |
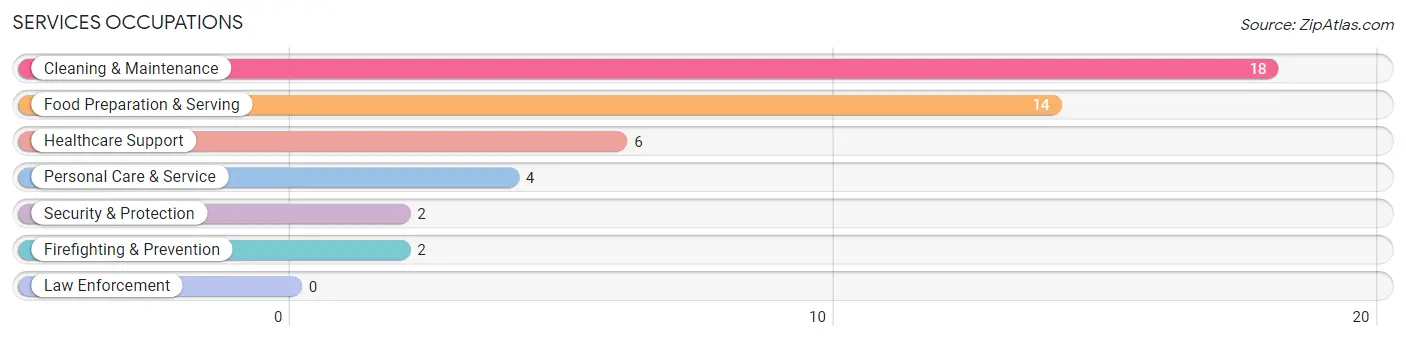
Services Occupations
The most common Services occupations in Dauphin borough are Cleaning & Maintenance (18 | 3.4%), Food Preparation & Serving (14 | 2.6%), Healthcare Support (6 | 1.1%), Personal Care & Service (4 | 0.7%), and Security & Protection (2 | 0.4%).
Services Occupations by Sex
Within the Services occupations in Dauphin borough, the most male-oriented occupations are Cleaning & Maintenance (100.0%), Food Preparation & Serving (57.1%), and Healthcare Support (33.3%), while the most female-oriented occupations are Security & Protection (100.0%), Firefighting & Prevention (100.0%), and Personal Care & Service (100.0%).
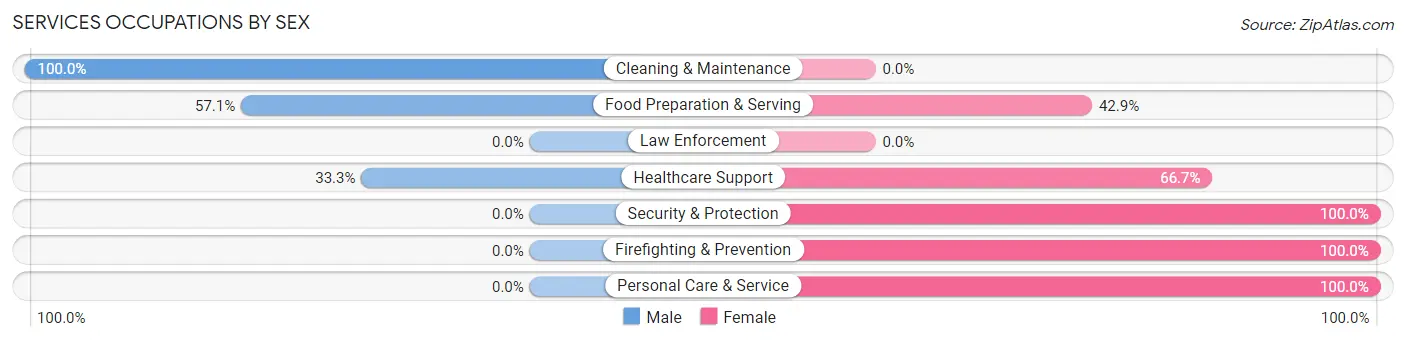
| Occupation | Male | Female |
| Healthcare Support | 2 (33.3%) | 4 (66.7%) |
| Security & Protection | 0 (0.0%) | 2 (100.0%) |
| Firefighting & Prevention | 0 (0.0%) | 2 (100.0%) |
| Law Enforcement | 0 (0.0%) | 0 (0.0%) |
| Food Preparation & Serving | 8 (57.1%) | 6 (42.9%) |
| Cleaning & Maintenance | 18 (100.0%) | 0 (0.0%) |
| Personal Care & Service | 0 (0.0%) | 4 (100.0%) |
| Total (Category) | 28 (63.6%) | 16 (36.4%) |
| Total (Overall) | 224 (42.2%) | 307 (57.8%) |
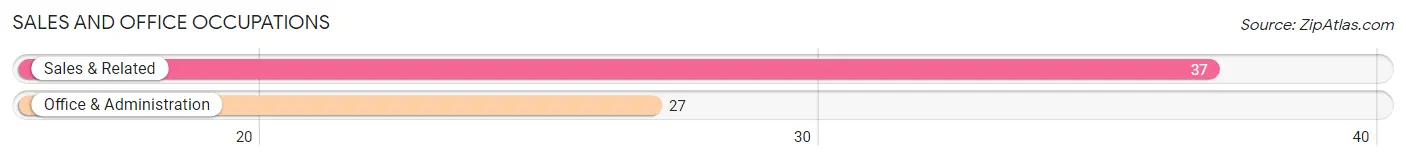
Sales and Office Occupations
The most common Sales and Office occupations in Dauphin borough are Sales & Related (37 | 7.0%), and Office & Administration (27 | 5.1%).
Sales and Office Occupations by Sex
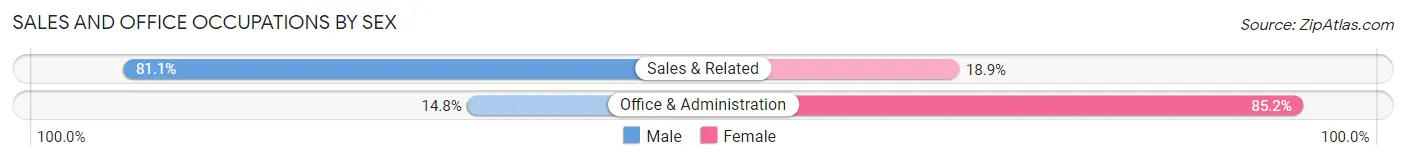
| Occupation | Male | Female |
| Sales & Related | 30 (81.1%) | 7 (18.9%) |
| Office & Administration | 4 (14.8%) | 23 (85.2%) |
| Total (Category) | 34 (53.1%) | 30 (46.9%) |
| Total (Overall) | 224 (42.2%) | 307 (57.8%) |
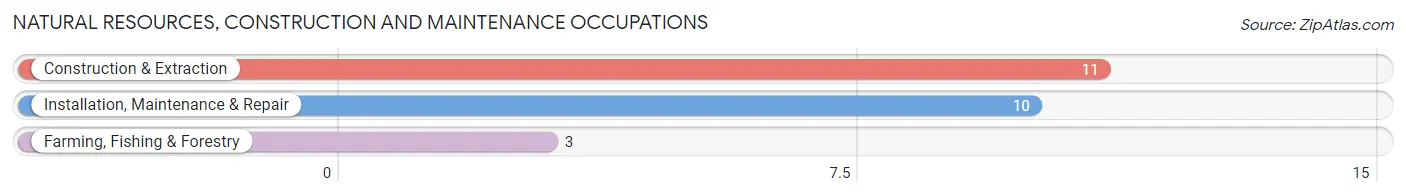
Natural Resources, Construction and Maintenance Occupations
The most common Natural Resources, Construction and Maintenance occupations in Dauphin borough are Construction & Extraction (11 | 2.1%), Installation, Maintenance & Repair (10 | 1.9%), and Farming, Fishing & Forestry (3 | 0.6%).
Natural Resources, Construction and Maintenance Occupations by Sex
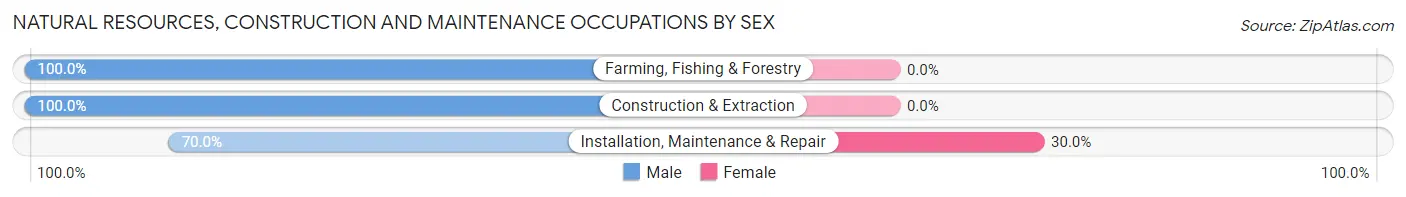
| Occupation | Male | Female |
| Farming, Fishing & Forestry | 3 (100.0%) | 0 (0.0%) |
| Construction & Extraction | 11 (100.0%) | 0 (0.0%) |
| Installation, Maintenance & Repair | 7 (70.0%) | 3 (30.0%) |
| Total (Category) | 21 (87.5%) | 3 (12.5%) |
| Total (Overall) | 224 (42.2%) | 307 (57.8%) |
Production, Transportation and Moving Occupations
The most common Production, Transportation and Moving occupations in Dauphin borough are Production (40 | 7.5%), Transportation (30 | 5.7%), and Material Moving (6 | 1.1%).
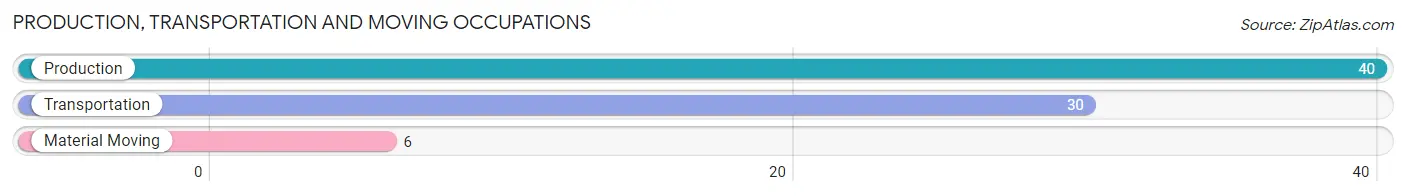
Production, Transportation and Moving Occupations by Sex
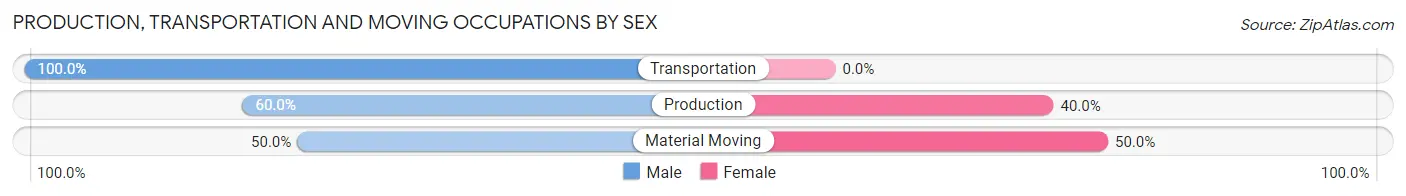
| Occupation | Male | Female |
| Production | 24 (60.0%) | 16 (40.0%) |
| Transportation | 30 (100.0%) | 0 (0.0%) |
| Material Moving | 3 (50.0%) | 3 (50.0%) |
| Total (Category) | 57 (75.0%) | 19 (25.0%) |
| Total (Overall) | 224 (42.2%) | 307 (57.8%) |
Employment Industries by Sex in Dauphin borough
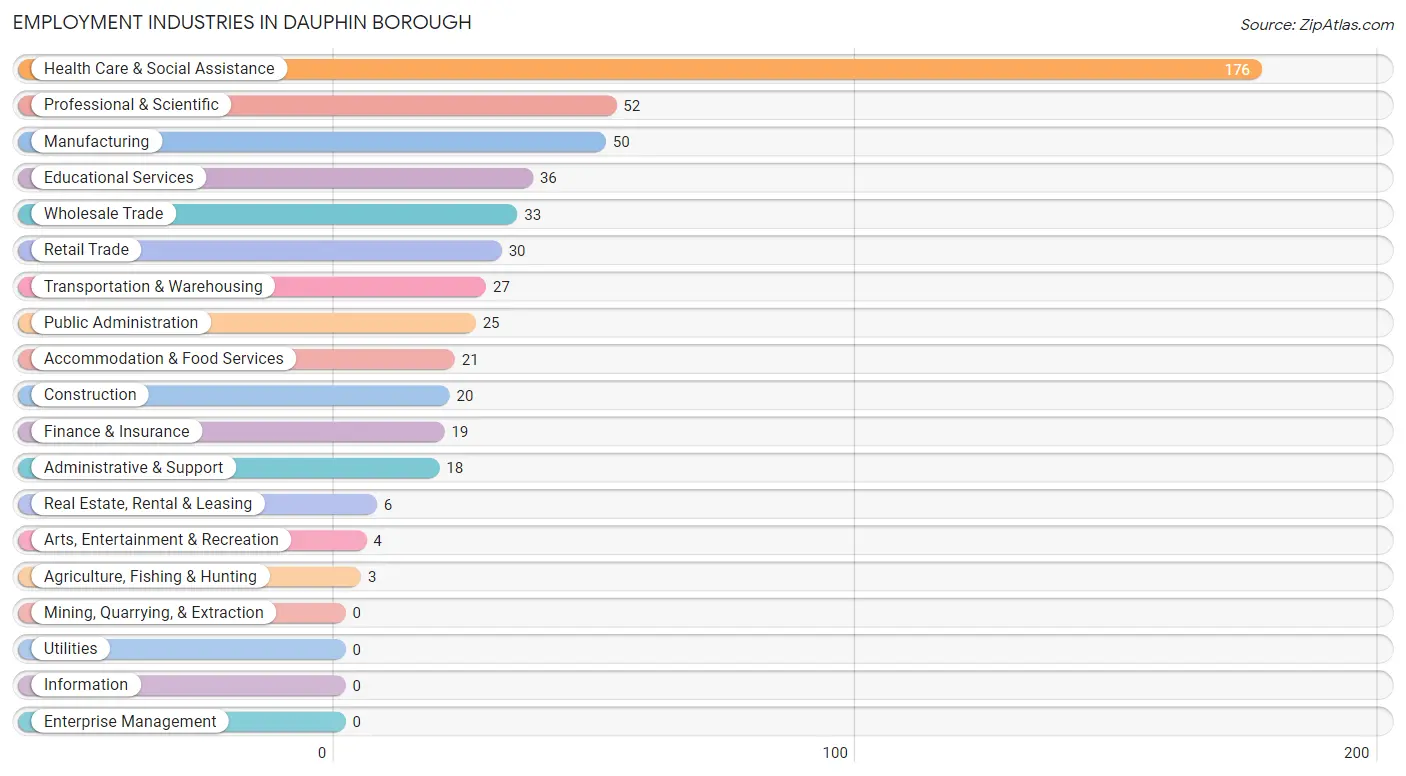
Employment Industries in Dauphin borough
The major employment industries in Dauphin borough include Health Care & Social Assistance (176 | 33.2%), Professional & Scientific (52 | 9.8%), Manufacturing (50 | 9.4%), Educational Services (36 | 6.8%), and Wholesale Trade (33 | 6.2%).
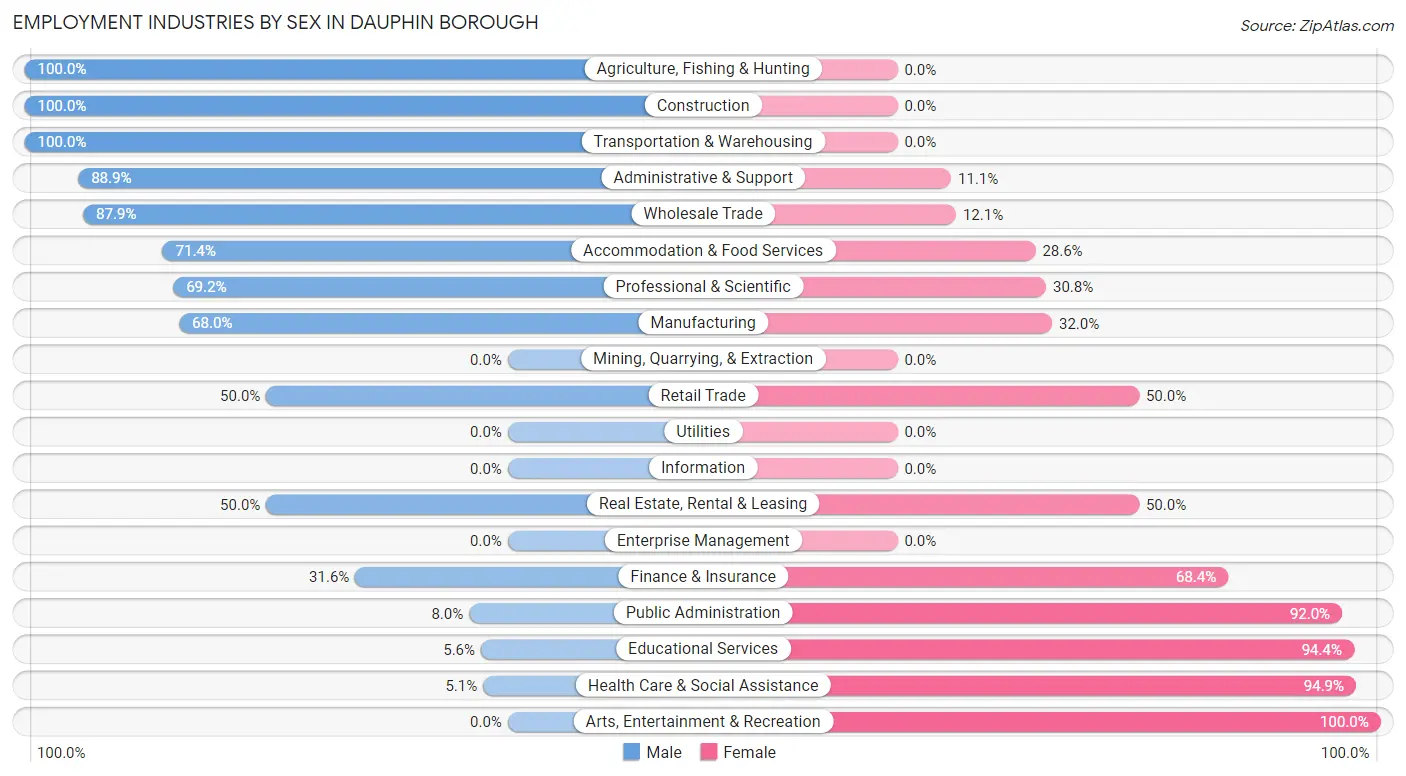
Employment Industries by Sex in Dauphin borough
The Dauphin borough industries that see more men than women are Agriculture, Fishing & Hunting (100.0%), Construction (100.0%), and Transportation & Warehousing (100.0%), whereas the industries that tend to have a higher number of women are Arts, Entertainment & Recreation (100.0%), Health Care & Social Assistance (94.9%), and Educational Services (94.4%).
| Industry | Male | Female |
| Agriculture, Fishing & Hunting | 3 (100.0%) | 0 (0.0%) |
| Mining, Quarrying, & Extraction | 0 (0.0%) | 0 (0.0%) |
| Construction | 20 (100.0%) | 0 (0.0%) |
| Manufacturing | 34 (68.0%) | 16 (32.0%) |
| Wholesale Trade | 29 (87.9%) | 4 (12.1%) |
| Retail Trade | 15 (50.0%) | 15 (50.0%) |
| Transportation & Warehousing | 27 (100.0%) | 0 (0.0%) |
| Utilities | 0 (0.0%) | 0 (0.0%) |
| Information | 0 (0.0%) | 0 (0.0%) |
| Finance & Insurance | 6 (31.6%) | 13 (68.4%) |
| Real Estate, Rental & Leasing | 3 (50.0%) | 3 (50.0%) |
| Professional & Scientific | 36 (69.2%) | 16 (30.8%) |
| Enterprise Management | 0 (0.0%) | 0 (0.0%) |
| Administrative & Support | 16 (88.9%) | 2 (11.1%) |
| Educational Services | 2 (5.6%) | 34 (94.4%) |
| Health Care & Social Assistance | 9 (5.1%) | 167 (94.9%) |
| Arts, Entertainment & Recreation | 0 (0.0%) | 4 (100.0%) |
| Accommodation & Food Services | 15 (71.4%) | 6 (28.6%) |
| Public Administration | 2 (8.0%) | 23 (92.0%) |
| Total | 224 (42.2%) | 307 (57.8%) |
Education in Dauphin borough
School Enrollment in Dauphin borough
The most common levels of schooling among the 319 students in Dauphin borough are middle school (97 | 30.4%), high school (79 | 24.8%), and college / undergraduate (68 | 21.3%).
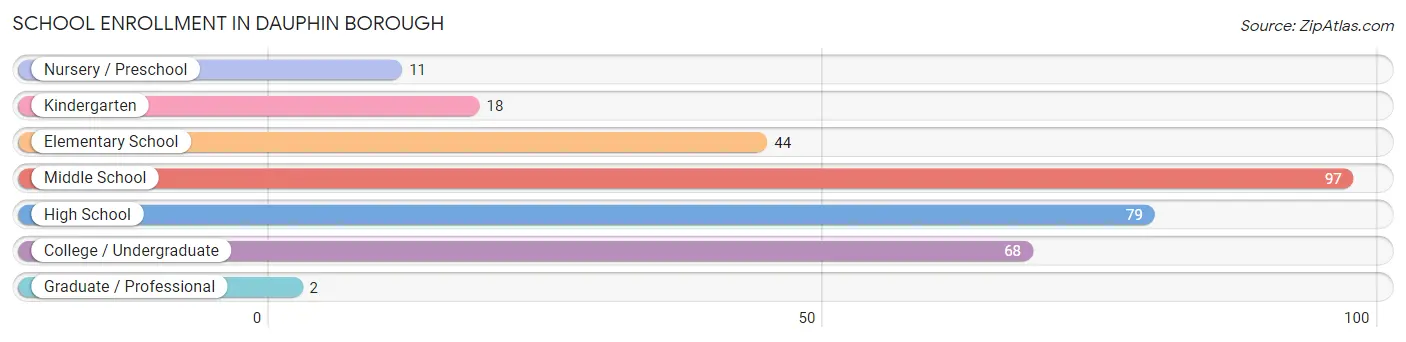
| School Level | # Students | % Students |
| Nursery / Preschool | 11 | 3.5% |
| Kindergarten | 18 | 5.6% |
| Elementary School | 44 | 13.8% |
| Middle School | 97 | 30.4% |
| High School | 79 | 24.8% |
| College / Undergraduate | 68 | 21.3% |
| Graduate / Professional | 2 | 0.6% |
| Total | 319 | 100.0% |
School Enrollment by Age by Funding Source in Dauphin borough
Out of a total of 319 students who are enrolled in schools in Dauphin borough, 19 (6.0%) attend a private institution, while the remaining 300 (94.0%) are enrolled in public schools. The age group of 18 to 19 year olds has the highest likelihood of being enrolled in private schools, with 3 (100.0% in the age bracket) enrolled. Conversely, the age group of 15 to 17 year olds has the lowest likelihood of being enrolled in a private school, with 75 (100.0% in the age bracket) attending a public institution.
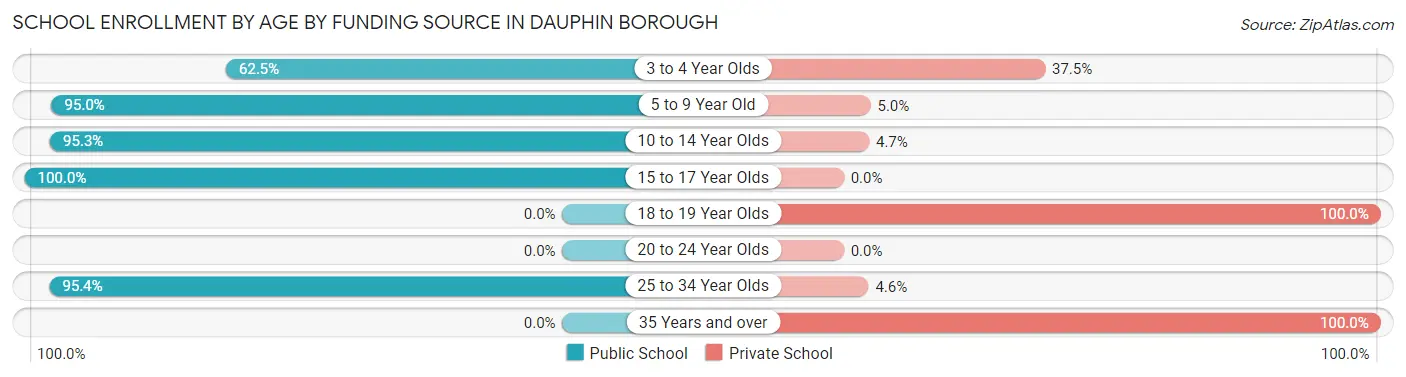
| Age Bracket | Public School | Private School |
| 3 to 4 Year Olds | 5 (62.5%) | 3 (37.5%) |
| 5 to 9 Year Old | 57 (95.0%) | 3 (5.0%) |
| 10 to 14 Year Olds | 101 (95.3%) | 5 (4.7%) |
| 15 to 17 Year Olds | 75 (100.0%) | 0 (0.0%) |
| 18 to 19 Year Olds | 0 (0.0%) | 3 (100.0%) |
| 20 to 24 Year Olds | 0 (0.0%) | 0 (0.0%) |
| 25 to 34 Year Olds | 62 (95.4%) | 3 (4.6%) |
| 35 Years and over | 0 (0.0%) | 2 (100.0%) |
| Total | 300 (94.0%) | 19 (6.0%) |
Educational Attainment by Field of Study in Dauphin borough
Psychology (86 | 20.4%), business (72 | 17.1%), visual & performing arts (62 | 14.7%), physical & health sciences (42 | 10.0%), and education (42 | 10.0%) are the most common fields of study among 421 individuals in Dauphin borough who have obtained a bachelor's degree or higher.
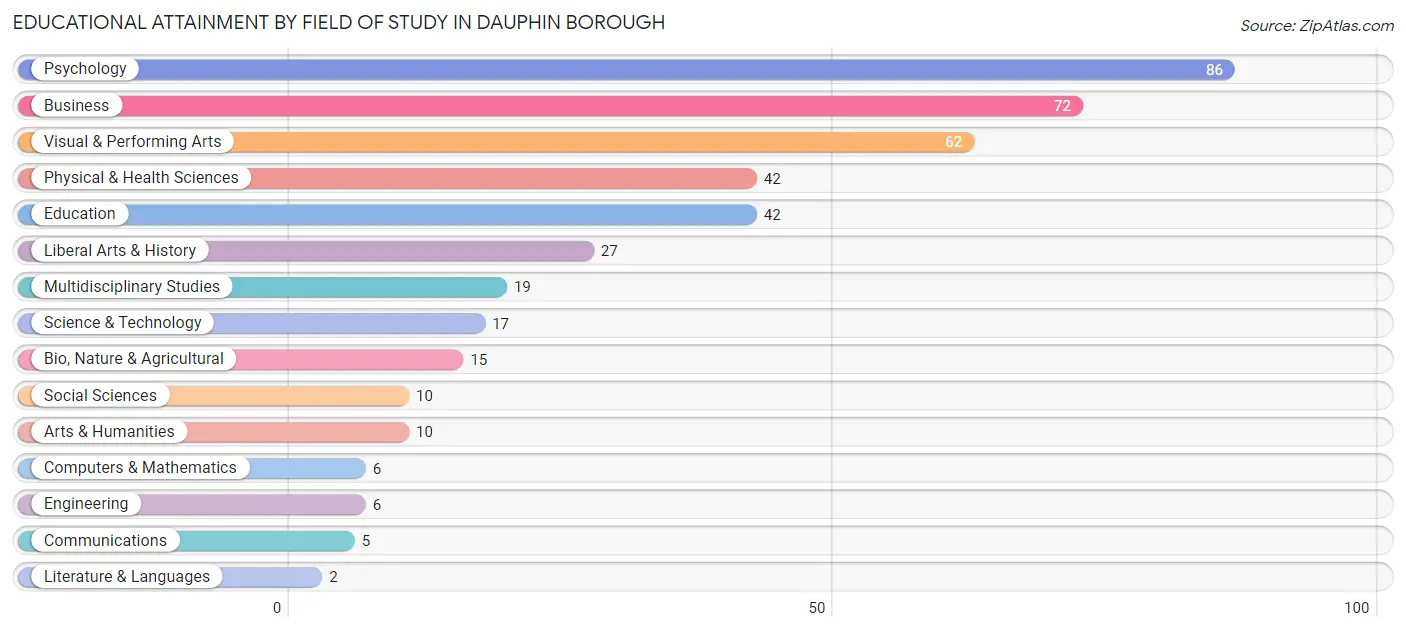
| Field of Study | # Graduates | % Graduates |
| Computers & Mathematics | 6 | 1.4% |
| Bio, Nature & Agricultural | 15 | 3.6% |
| Physical & Health Sciences | 42 | 10.0% |
| Psychology | 86 | 20.4% |
| Social Sciences | 10 | 2.4% |
| Engineering | 6 | 1.4% |
| Multidisciplinary Studies | 19 | 4.5% |
| Science & Technology | 17 | 4.0% |
| Business | 72 | 17.1% |
| Education | 42 | 10.0% |
| Literature & Languages | 2 | 0.5% |
| Liberal Arts & History | 27 | 6.4% |
| Visual & Performing Arts | 62 | 14.7% |
| Communications | 5 | 1.2% |
| Arts & Humanities | 10 | 2.4% |
| Total | 421 | 100.0% |
Transportation & Commute in Dauphin borough
Vehicle Availability by Sex in Dauphin borough
The most prevalent vehicle ownership categories in Dauphin borough are males with 2 vehicles (141, accounting for 62.9%) and females with 2 vehicles (124, making up 47.5%).
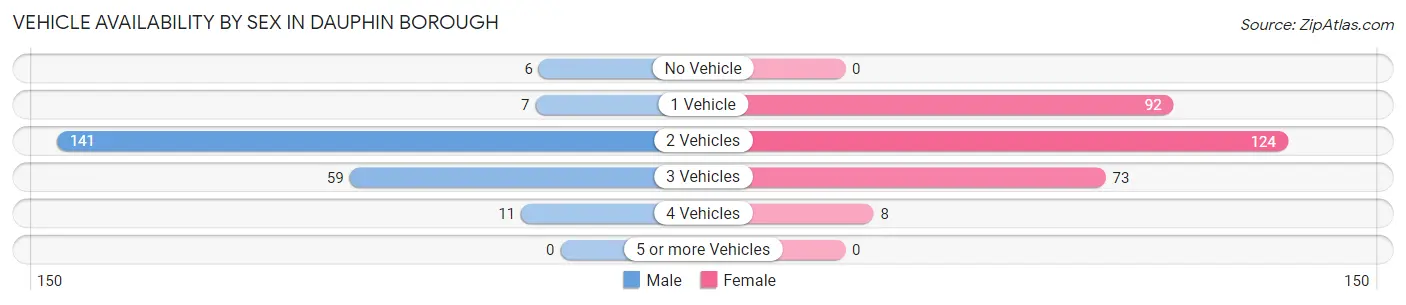
| Vehicles Available | Male | Female |
| No Vehicle | 6 (2.7%) | 0 (0.0%) |
| 1 Vehicle | 7 (3.1%) | 92 (31.0%) |
| 2 Vehicles | 141 (62.9%) | 124 (41.7%) |
| 3 Vehicles | 59 (26.3%) | 73 (24.6%) |
| 4 Vehicles | 11 (4.9%) | 8 (2.7%) |
| 5 or more Vehicles | 0 (0.0%) | 0 (0.0%) |
| Total | 224 (100.0%) | 297 (100.0%) |
Commute Time in Dauphin borough
The most frequently occuring commute durations in Dauphin borough are 15 to 19 minutes (152 commuters, 34.2%), 20 to 24 minutes (98 commuters, 22.1%), and 10 to 14 minutes (61 commuters, 13.7%).
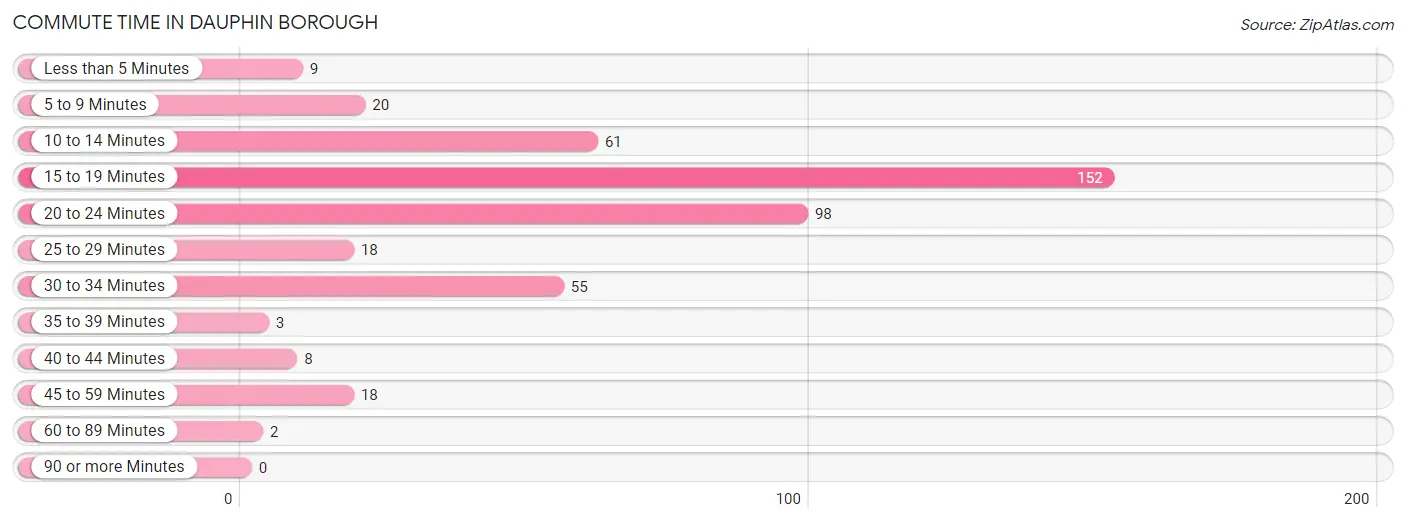
| Commute Time | # Commuters | % Commuters |
| Less than 5 Minutes | 9 | 2.0% |
| 5 to 9 Minutes | 20 | 4.5% |
| 10 to 14 Minutes | 61 | 13.7% |
| 15 to 19 Minutes | 152 | 34.2% |
| 20 to 24 Minutes | 98 | 22.1% |
| 25 to 29 Minutes | 18 | 4.1% |
| 30 to 34 Minutes | 55 | 12.4% |
| 35 to 39 Minutes | 3 | 0.7% |
| 40 to 44 Minutes | 8 | 1.8% |
| 45 to 59 Minutes | 18 | 4.1% |
| 60 to 89 Minutes | 2 | 0.4% |
| 90 or more Minutes | 0 | 0.0% |
Commute Time by Sex in Dauphin borough
The most common commute times in Dauphin borough are 15 to 19 minutes (55 commuters, 29.4%) for males and 15 to 19 minutes (97 commuters, 37.7%) for females.
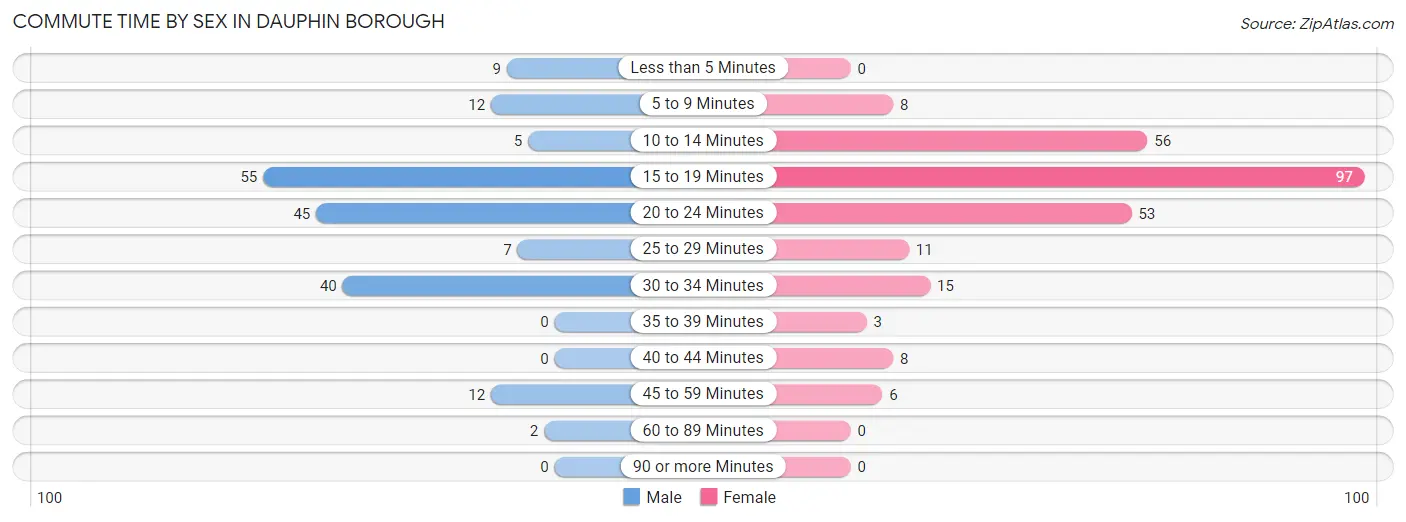
| Commute Time | Male | Female |
| Less than 5 Minutes | 9 (4.8%) | 0 (0.0%) |
| 5 to 9 Minutes | 12 (6.4%) | 8 (3.1%) |
| 10 to 14 Minutes | 5 (2.7%) | 56 (21.8%) |
| 15 to 19 Minutes | 55 (29.4%) | 97 (37.7%) |
| 20 to 24 Minutes | 45 (24.1%) | 53 (20.6%) |
| 25 to 29 Minutes | 7 (3.7%) | 11 (4.3%) |
| 30 to 34 Minutes | 40 (21.4%) | 15 (5.8%) |
| 35 to 39 Minutes | 0 (0.0%) | 3 (1.2%) |
| 40 to 44 Minutes | 0 (0.0%) | 8 (3.1%) |
| 45 to 59 Minutes | 12 (6.4%) | 6 (2.3%) |
| 60 to 89 Minutes | 2 (1.1%) | 0 (0.0%) |
| 90 or more Minutes | 0 (0.0%) | 0 (0.0%) |
Time of Departure to Work by Sex in Dauphin borough
The most frequent times of departure to work in Dauphin borough are 7:00 AM to 7:29 AM (38, 20.3%) for males and 8:00 AM to 8:29 AM (93, 36.2%) for females.
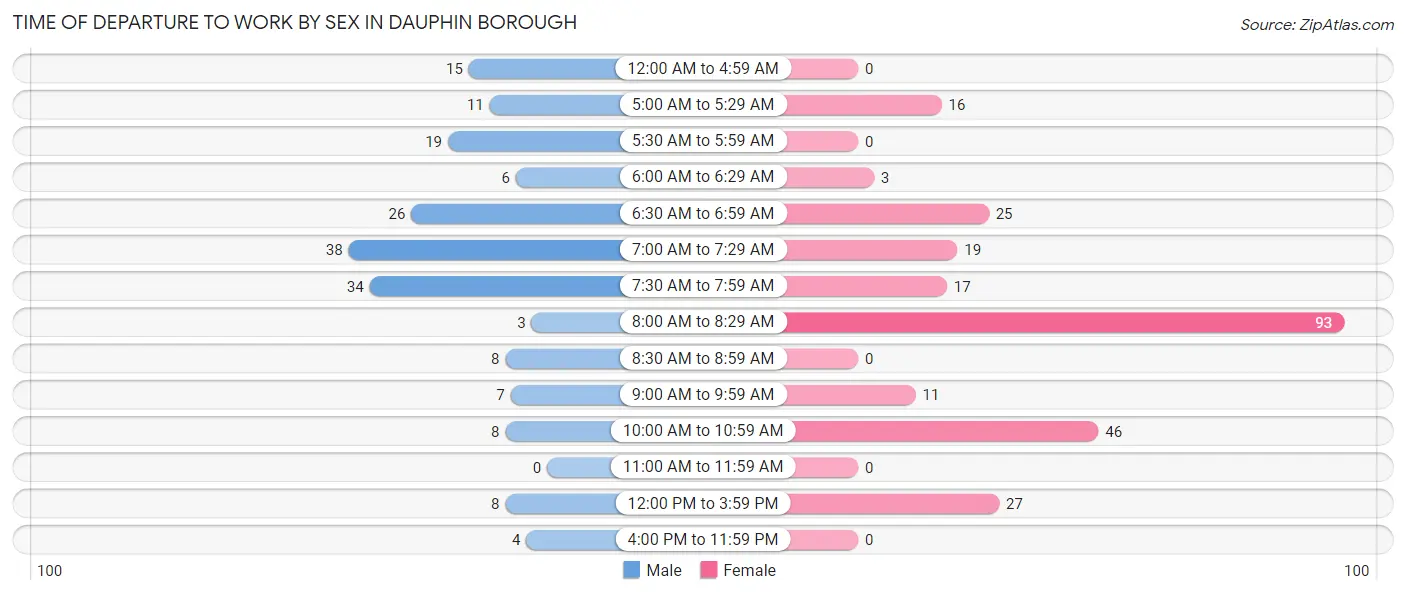
| Time of Departure | Male | Female |
| 12:00 AM to 4:59 AM | 15 (8.0%) | 0 (0.0%) |
| 5:00 AM to 5:29 AM | 11 (5.9%) | 16 (6.2%) |
| 5:30 AM to 5:59 AM | 19 (10.2%) | 0 (0.0%) |
| 6:00 AM to 6:29 AM | 6 (3.2%) | 3 (1.2%) |
| 6:30 AM to 6:59 AM | 26 (13.9%) | 25 (9.7%) |
| 7:00 AM to 7:29 AM | 38 (20.3%) | 19 (7.4%) |
| 7:30 AM to 7:59 AM | 34 (18.2%) | 17 (6.6%) |
| 8:00 AM to 8:29 AM | 3 (1.6%) | 93 (36.2%) |
| 8:30 AM to 8:59 AM | 8 (4.3%) | 0 (0.0%) |
| 9:00 AM to 9:59 AM | 7 (3.7%) | 11 (4.3%) |
| 10:00 AM to 10:59 AM | 8 (4.3%) | 46 (17.9%) |
| 11:00 AM to 11:59 AM | 0 (0.0%) | 0 (0.0%) |
| 12:00 PM to 3:59 PM | 8 (4.3%) | 27 (10.5%) |
| 4:00 PM to 11:59 PM | 4 (2.1%) | 0 (0.0%) |
| Total | 187 (100.0%) | 257 (100.0%) |
Housing Occupancy in Dauphin borough
Occupancy by Ownership in Dauphin borough
Of the total 522 dwellings in Dauphin borough, owner-occupied units account for 406 (77.8%), while renter-occupied units make up 116 (22.2%).
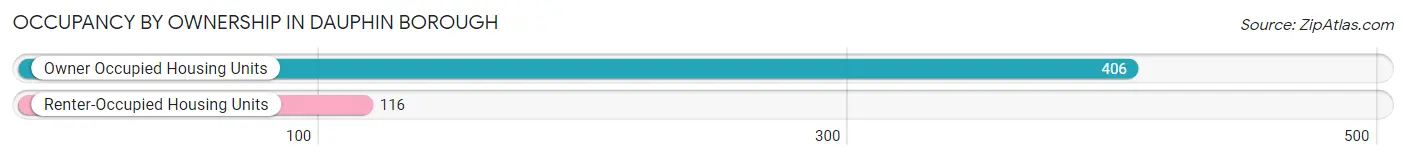
| Occupancy | # Housing Units | % Housing Units |
| Owner Occupied Housing Units | 406 | 77.8% |
| Renter-Occupied Housing Units | 116 | 22.2% |
| Total Occupied Housing Units | 522 | 100.0% |
Occupancy by Household Size in Dauphin borough
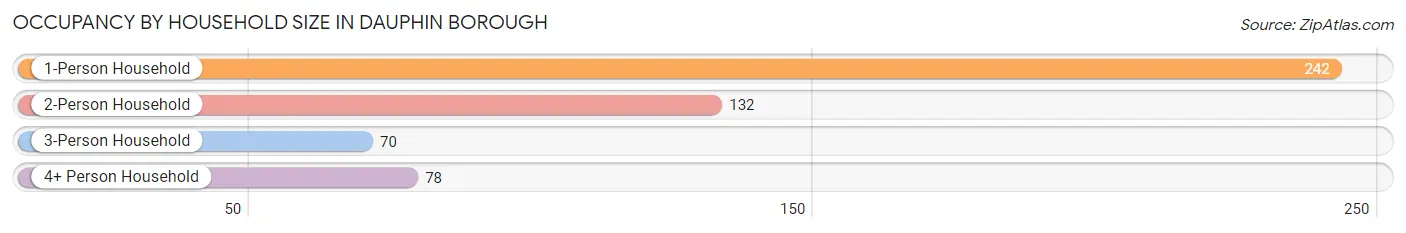
| Household Size | # Housing Units | % Housing Units |
| 1-Person Household | 242 | 46.4% |
| 2-Person Household | 132 | 25.3% |
| 3-Person Household | 70 | 13.4% |
| 4+ Person Household | 78 | 14.9% |
| Total Housing Units | 522 | 100.0% |
Occupancy by Ownership by Household Size in Dauphin borough
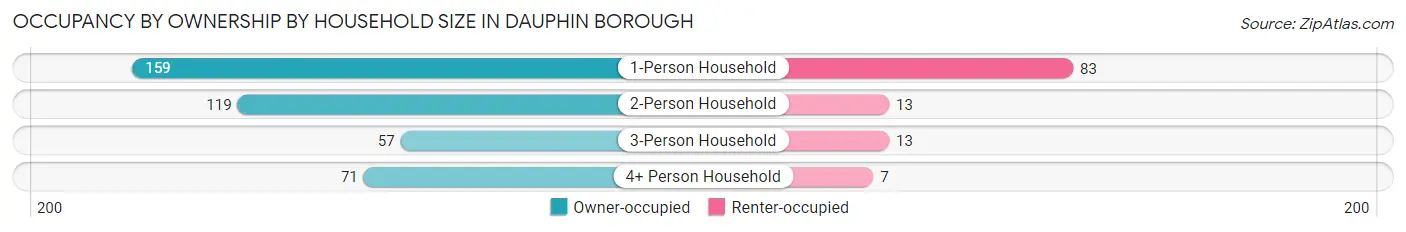
| Household Size | Owner-occupied | Renter-occupied |
| 1-Person Household | 159 (65.7%) | 83 (34.3%) |
| 2-Person Household | 119 (90.1%) | 13 (9.9%) |
| 3-Person Household | 57 (81.4%) | 13 (18.6%) |
| 4+ Person Household | 71 (91.0%) | 7 (9.0%) |
| Total Housing Units | 406 (77.8%) | 116 (22.2%) |
Occupancy by Educational Attainment in Dauphin borough
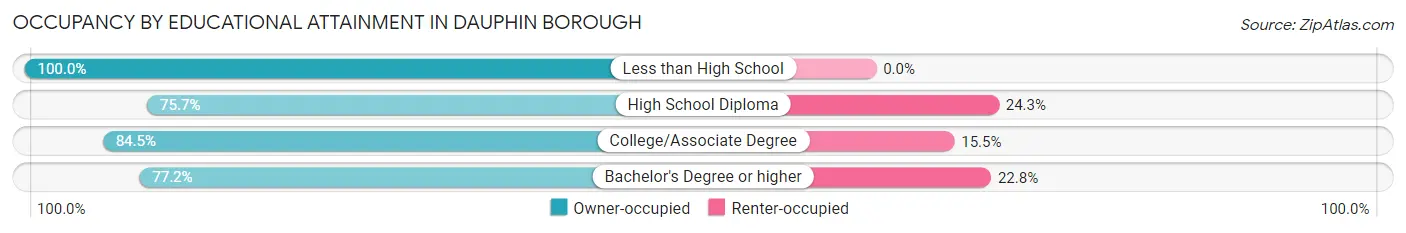
| Household Size | Owner-occupied | Renter-occupied |
| Less than High School | 2 (100.0%) | 0 (0.0%) |
| High School Diploma | 137 (75.7%) | 44 (24.3%) |
| College/Associate Degree | 60 (84.5%) | 11 (15.5%) |
| Bachelor's Degree or higher | 207 (77.2%) | 61 (22.8%) |
Occupancy by Age of Householder in Dauphin borough
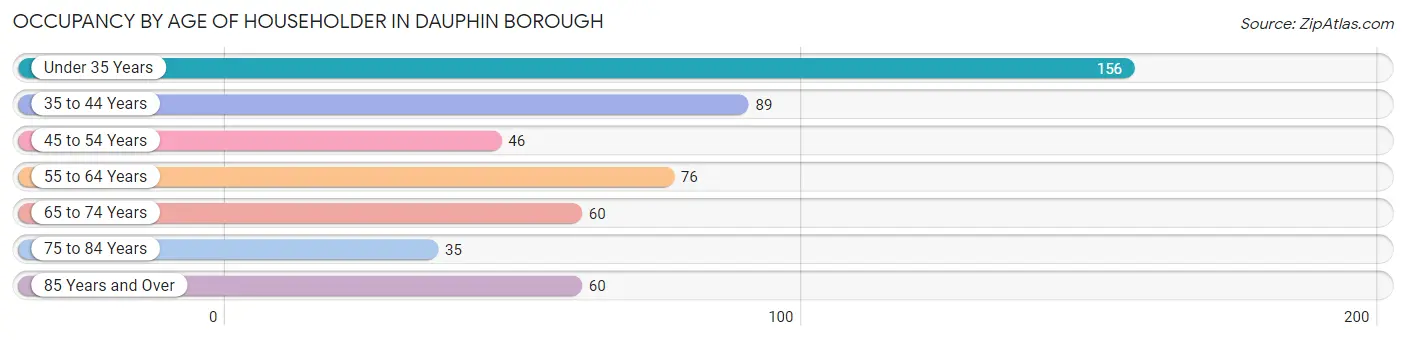
| Age Bracket | # Households | % Households |
| Under 35 Years | 156 | 29.9% |
| 35 to 44 Years | 89 | 17.1% |
| 45 to 54 Years | 46 | 8.8% |
| 55 to 64 Years | 76 | 14.6% |
| 65 to 74 Years | 60 | 11.5% |
| 75 to 84 Years | 35 | 6.7% |
| 85 Years and Over | 60 | 11.5% |
| Total | 522 | 100.0% |
Housing Finances in Dauphin borough
Median Income by Occupancy in Dauphin borough
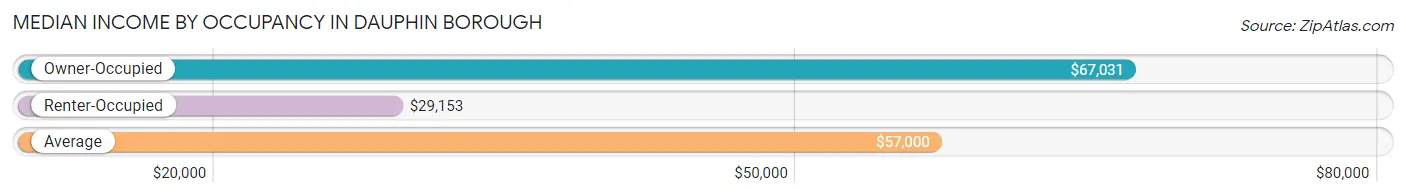
| Occupancy Type | # Households | Median Income |
| Owner-Occupied | 406 (77.8%) | $67,031 |
| Renter-Occupied | 116 (22.2%) | $29,153 |
| Average | 522 (100.0%) | $57,000 |
Occupancy by Householder Income Bracket in Dauphin borough
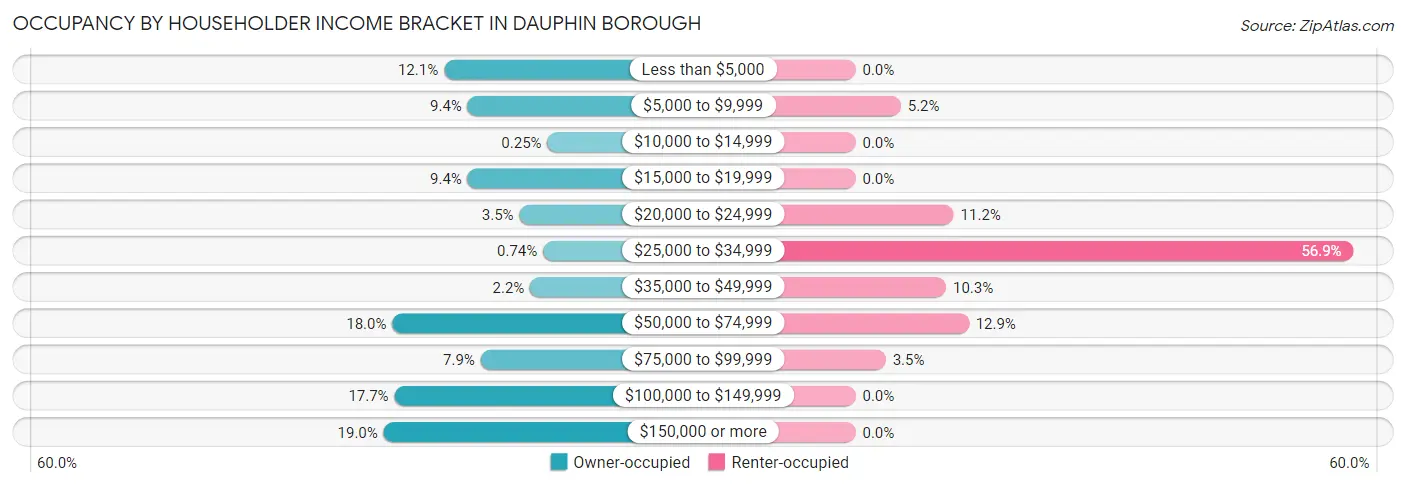
| Income Bracket | Owner-occupied | Renter-occupied |
| Less than $5,000 | 49 (12.1%) | 0 (0.0%) |
| $5,000 to $9,999 | 38 (9.4%) | 6 (5.2%) |
| $10,000 to $14,999 | 1 (0.3%) | 0 (0.0%) |
| $15,000 to $19,999 | 38 (9.4%) | 0 (0.0%) |
| $20,000 to $24,999 | 14 (3.5%) | 13 (11.2%) |
| $25,000 to $34,999 | 3 (0.7%) | 66 (56.9%) |
| $35,000 to $49,999 | 9 (2.2%) | 12 (10.3%) |
| $50,000 to $74,999 | 73 (18.0%) | 15 (12.9%) |
| $75,000 to $99,999 | 32 (7.9%) | 4 (3.5%) |
| $100,000 to $149,999 | 72 (17.7%) | 0 (0.0%) |
| $150,000 or more | 77 (19.0%) | 0 (0.0%) |
| Total | 406 (100.0%) | 116 (100.0%) |
Monthly Housing Cost Tiers in Dauphin borough
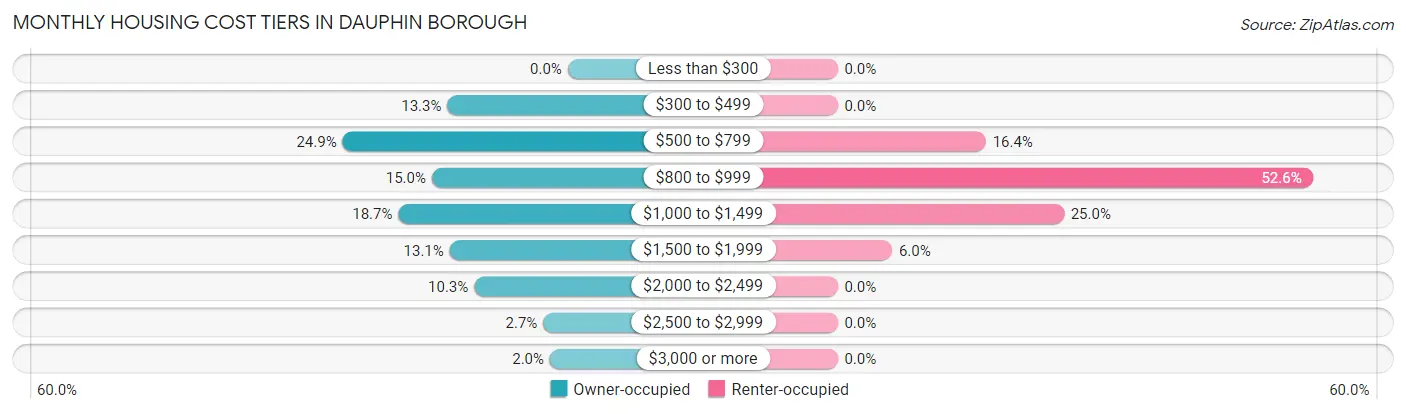
| Monthly Cost | Owner-occupied | Renter-occupied |
| Less than $300 | 0 (0.0%) | 0 (0.0%) |
| $300 to $499 | 54 (13.3%) | 0 (0.0%) |
| $500 to $799 | 101 (24.9%) | 19 (16.4%) |
| $800 to $999 | 61 (15.0%) | 61 (52.6%) |
| $1,000 to $1,499 | 76 (18.7%) | 29 (25.0%) |
| $1,500 to $1,999 | 53 (13.1%) | 7 (6.0%) |
| $2,000 to $2,499 | 42 (10.3%) | 0 (0.0%) |
| $2,500 to $2,999 | 11 (2.7%) | 0 (0.0%) |
| $3,000 or more | 8 (2.0%) | 0 (0.0%) |
| Total | 406 (100.0%) | 116 (100.0%) |
Physical Housing Characteristics in Dauphin borough
Housing Structures in Dauphin borough
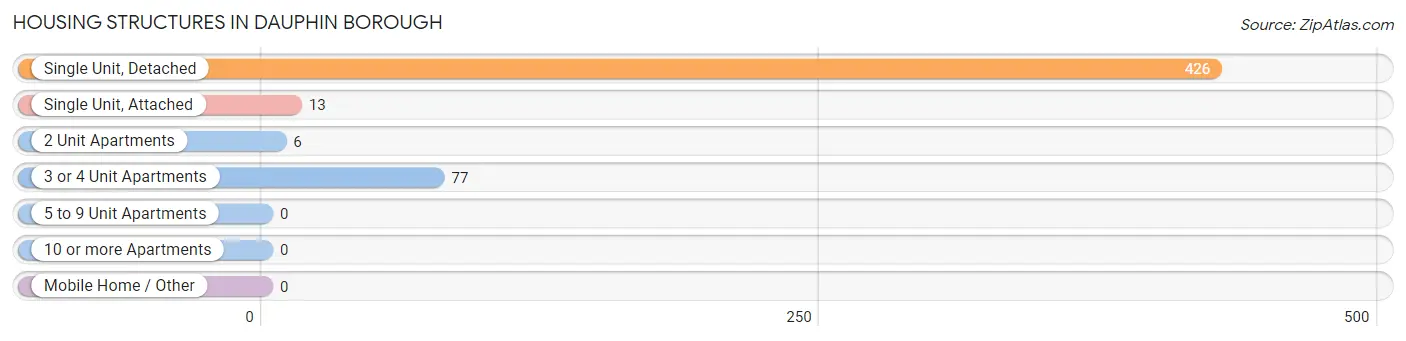
| Structure Type | # Housing Units | % Housing Units |
| Single Unit, Detached | 426 | 81.6% |
| Single Unit, Attached | 13 | 2.5% |
| 2 Unit Apartments | 6 | 1.1% |
| 3 or 4 Unit Apartments | 77 | 14.7% |
| 5 to 9 Unit Apartments | 0 | 0.0% |
| 10 or more Apartments | 0 | 0.0% |
| Mobile Home / Other | 0 | 0.0% |
| Total | 522 | 100.0% |
Housing Structures by Occupancy in Dauphin borough
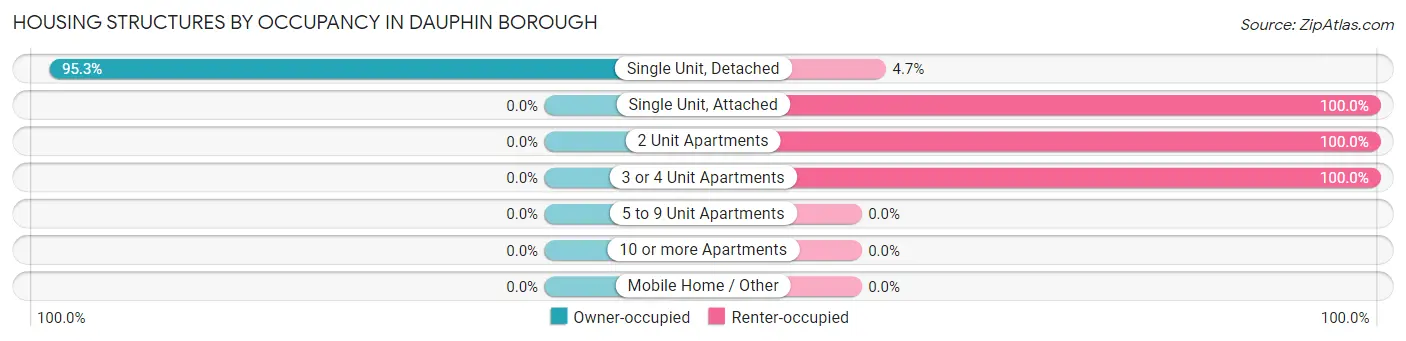
| Structure Type | Owner-occupied | Renter-occupied |
| Single Unit, Detached | 406 (95.3%) | 20 (4.7%) |
| Single Unit, Attached | 0 (0.0%) | 13 (100.0%) |
| 2 Unit Apartments | 0 (0.0%) | 6 (100.0%) |
| 3 or 4 Unit Apartments | 0 (0.0%) | 77 (100.0%) |
| 5 to 9 Unit Apartments | 0 (0.0%) | 0 (0.0%) |
| 10 or more Apartments | 0 (0.0%) | 0 (0.0%) |
| Mobile Home / Other | 0 (0.0%) | 0 (0.0%) |
| Total | 406 (77.8%) | 116 (22.2%) |
Housing Structures by Number of Rooms in Dauphin borough
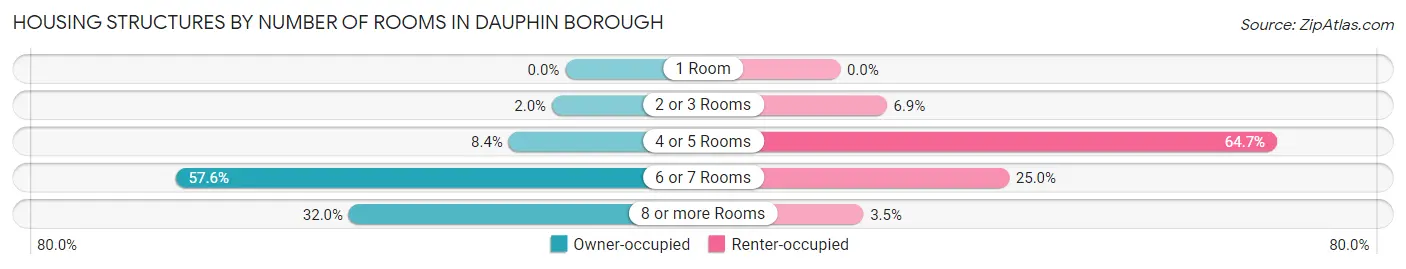
| Number of Rooms | Owner-occupied | Renter-occupied |
| 1 Room | 0 (0.0%) | 0 (0.0%) |
| 2 or 3 Rooms | 8 (2.0%) | 8 (6.9%) |
| 4 or 5 Rooms | 34 (8.4%) | 75 (64.7%) |
| 6 or 7 Rooms | 234 (57.6%) | 29 (25.0%) |
| 8 or more Rooms | 130 (32.0%) | 4 (3.5%) |
| Total | 406 (100.0%) | 116 (100.0%) |
Housing Structure by Heating Type in Dauphin borough
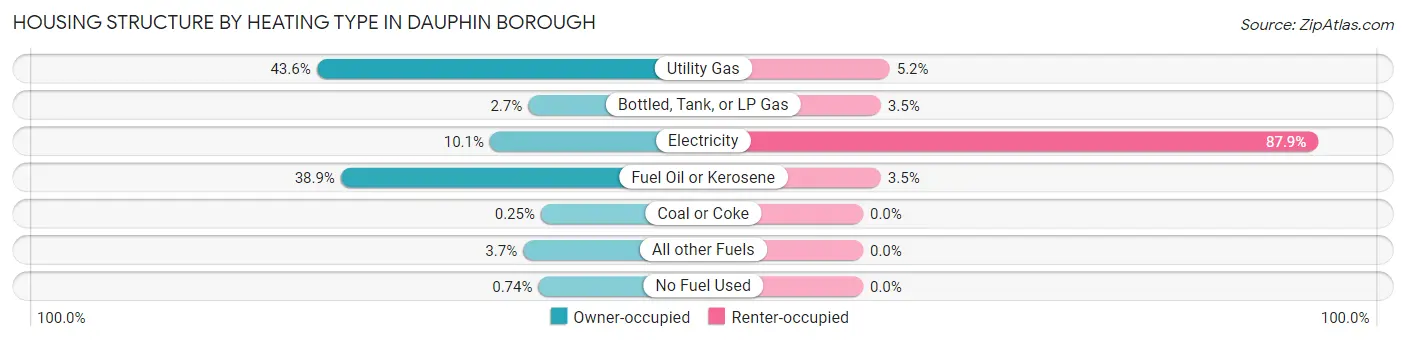
| Heating Type | Owner-occupied | Renter-occupied |
| Utility Gas | 177 (43.6%) | 6 (5.2%) |
| Bottled, Tank, or LP Gas | 11 (2.7%) | 4 (3.5%) |
| Electricity | 41 (10.1%) | 102 (87.9%) |
| Fuel Oil or Kerosene | 158 (38.9%) | 4 (3.5%) |
| Coal or Coke | 1 (0.3%) | 0 (0.0%) |
| All other Fuels | 15 (3.7%) | 0 (0.0%) |
| No Fuel Used | 3 (0.7%) | 0 (0.0%) |
| Total | 406 (100.0%) | 116 (100.0%) |
Household Vehicle Usage in Dauphin borough
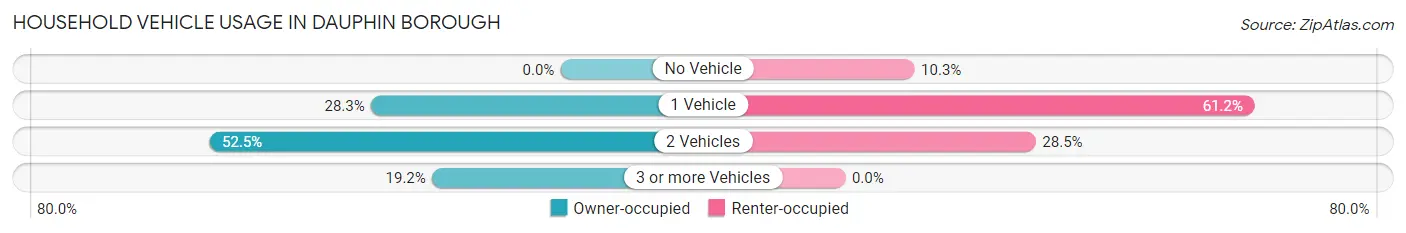
| Vehicles per Household | Owner-occupied | Renter-occupied |
| No Vehicle | 0 (0.0%) | 12 (10.3%) |
| 1 Vehicle | 115 (28.3%) | 71 (61.2%) |
| 2 Vehicles | 213 (52.5%) | 33 (28.4%) |
| 3 or more Vehicles | 78 (19.2%) | 0 (0.0%) |
| Total | 406 (100.0%) | 116 (100.0%) |
Real Estate & Mortgages in Dauphin borough
Real Estate and Mortgage Overview in Dauphin borough
| Characteristic | Without Mortgage | With Mortgage |
| Housing Units | 198 | 208 |
| Median Property Value | $152,600 | $201,300 |
| Median Household Income | - | - |
| Monthly Housing Costs | $576 | $8 |
| Real Estate Taxes | $2,897 | $5 |
Property Value by Mortgage Status in Dauphin borough
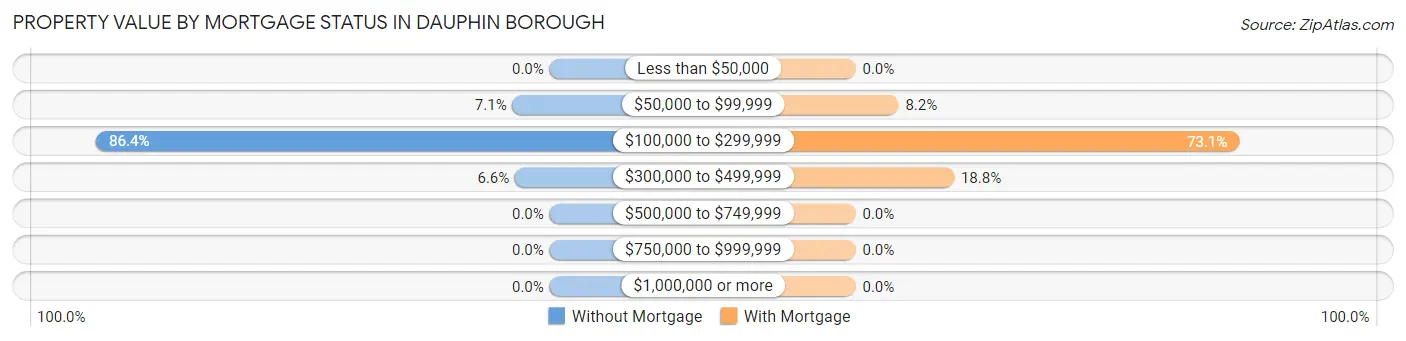
| Property Value | Without Mortgage | With Mortgage |
| Less than $50,000 | 0 (0.0%) | 0 (0.0%) |
| $50,000 to $99,999 | 14 (7.1%) | 17 (8.2%) |
| $100,000 to $299,999 | 171 (86.4%) | 152 (73.1%) |
| $300,000 to $499,999 | 13 (6.6%) | 39 (18.8%) |
| $500,000 to $749,999 | 0 (0.0%) | 0 (0.0%) |
| $750,000 to $999,999 | 0 (0.0%) | 0 (0.0%) |
| $1,000,000 or more | 0 (0.0%) | 0 (0.0%) |
| Total | 198 (100.0%) | 208 (100.0%) |
Household Income by Mortgage Status in Dauphin borough
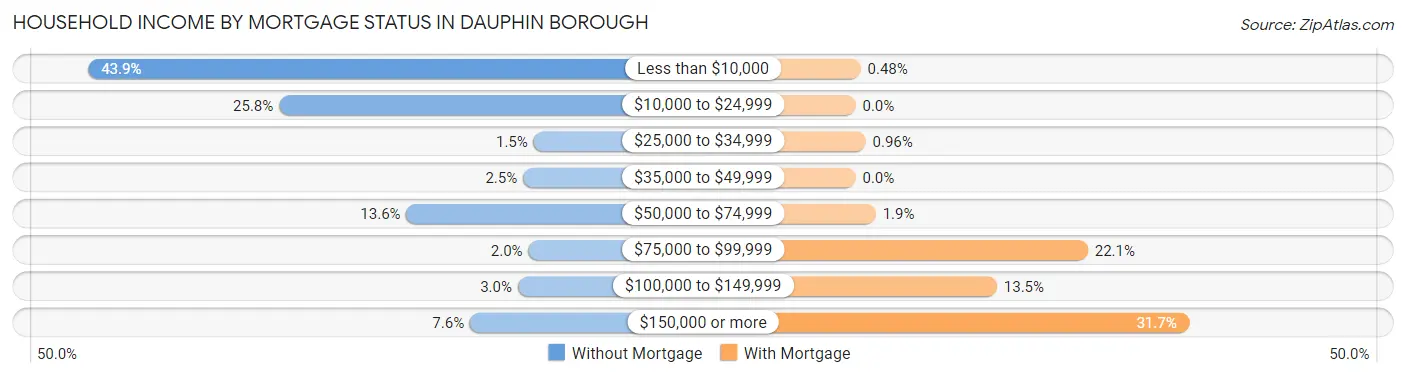
| Household Income | Without Mortgage | With Mortgage |
| Less than $10,000 | 87 (43.9%) | 1 (0.5%) |
| $10,000 to $24,999 | 51 (25.8%) | 0 (0.0%) |
| $25,000 to $34,999 | 3 (1.5%) | 2 (1.0%) |
| $35,000 to $49,999 | 5 (2.5%) | 0 (0.0%) |
| $50,000 to $74,999 | 27 (13.6%) | 4 (1.9%) |
| $75,000 to $99,999 | 4 (2.0%) | 46 (22.1%) |
| $100,000 to $149,999 | 6 (3.0%) | 28 (13.5%) |
| $150,000 or more | 15 (7.6%) | 66 (31.7%) |
| Total | 198 (100.0%) | 208 (100.0%) |
Property Value to Household Income Ratio in Dauphin borough
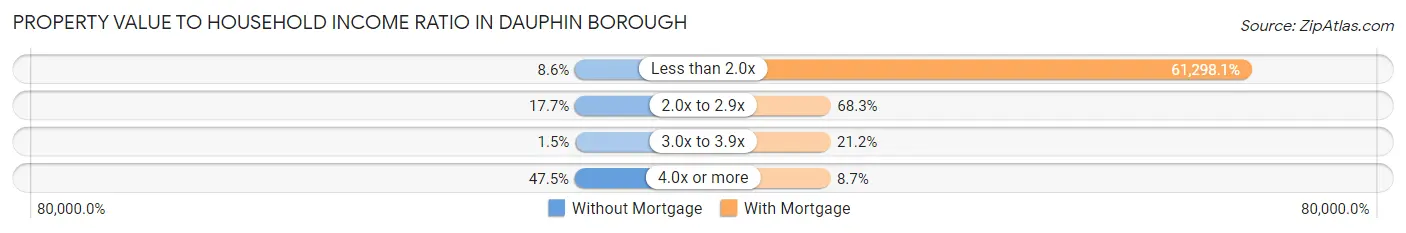
| Value-to-Income Ratio | Without Mortgage | With Mortgage |
| Less than 2.0x | 17 (8.6%) | 127,500 (61,298.1%) |
| 2.0x to 2.9x | 35 (17.7%) | 142 (68.3%) |
| 3.0x to 3.9x | 3 (1.5%) | 44 (21.1%) |
| 4.0x or more | 94 (47.5%) | 18 (8.6%) |
| Total | 198 (100.0%) | 208 (100.0%) |
Real Estate Taxes by Mortgage Status in Dauphin borough
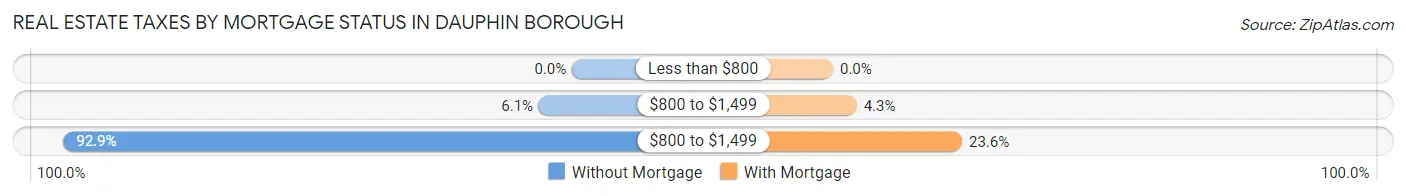
| Property Taxes | Without Mortgage | With Mortgage |
| Less than $800 | 0 (0.0%) | 0 (0.0%) |
| $800 to $1,499 | 12 (6.1%) | 9 (4.3%) |
| $800 to $1,499 | 184 (92.9%) | 49 (23.6%) |
| Total | 198 (100.0%) | 208 (100.0%) |
Health & Disability in Dauphin borough
Health Insurance Coverage by Age in Dauphin borough
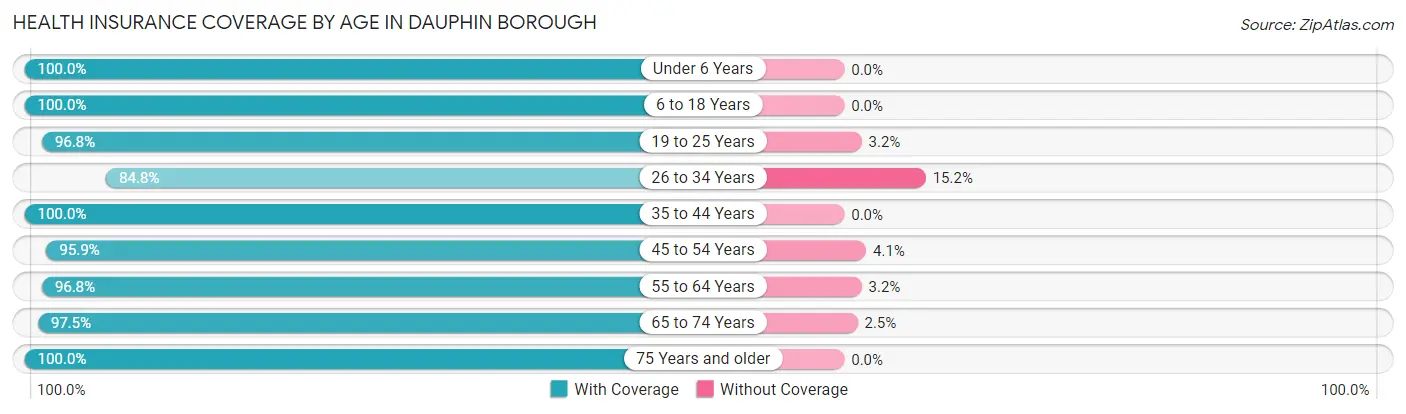
| Age Bracket | With Coverage | Without Coverage |
| Under 6 Years | 77 (100.0%) | 0 (0.0%) |
| 6 to 18 Years | 224 (100.0%) | 0 (0.0%) |
| 19 to 25 Years | 30 (96.8%) | 1 (3.2%) |
| 26 to 34 Years | 201 (84.8%) | 36 (15.2%) |
| 35 to 44 Years | 150 (100.0%) | 0 (0.0%) |
| 45 to 54 Years | 118 (95.9%) | 5 (4.1%) |
| 55 to 64 Years | 90 (96.8%) | 3 (3.2%) |
| 65 to 74 Years | 79 (97.5%) | 2 (2.5%) |
| 75 Years and older | 107 (100.0%) | 0 (0.0%) |
| Total | 1,076 (95.8%) | 47 (4.2%) |
Health Insurance Coverage by Citizenship Status in Dauphin borough
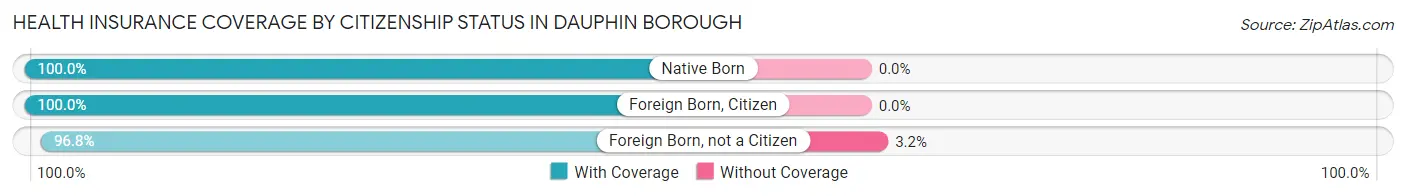
| Citizenship Status | With Coverage | Without Coverage |
| Native Born | 77 (100.0%) | 0 (0.0%) |
| Foreign Born, Citizen | 224 (100.0%) | 0 (0.0%) |
| Foreign Born, not a Citizen | 30 (96.8%) | 1 (3.2%) |
Health Insurance Coverage by Household Income in Dauphin borough
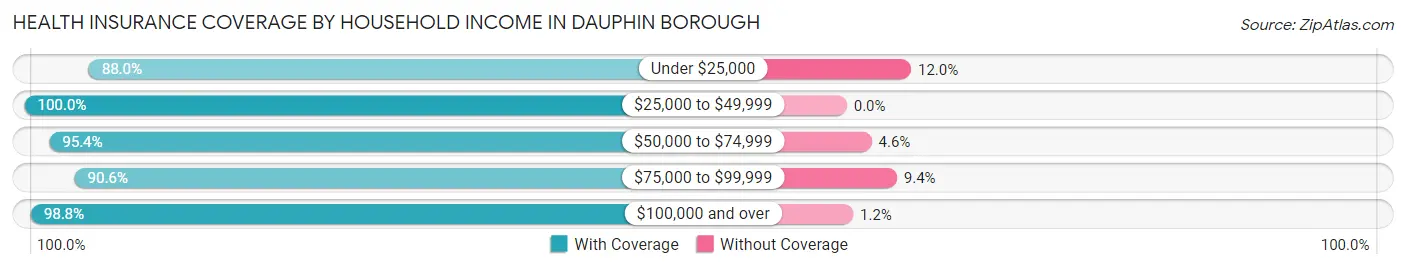
| Household Income | With Coverage | Without Coverage |
| Under $25,000 | 168 (88.0%) | 23 (12.0%) |
| $25,000 to $49,999 | 134 (100.0%) | 0 (0.0%) |
| $50,000 to $74,999 | 185 (95.4%) | 9 (4.6%) |
| $75,000 to $99,999 | 87 (90.6%) | 9 (9.4%) |
| $100,000 and over | 502 (98.8%) | 6 (1.2%) |
Public vs Private Health Insurance Coverage by Age in Dauphin borough
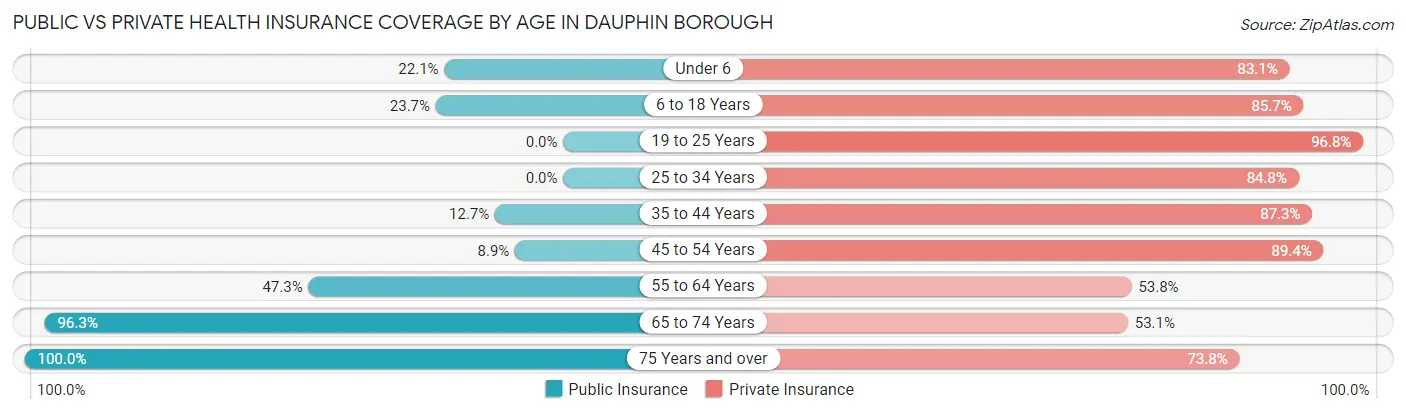
| Age Bracket | Public Insurance | Private Insurance |
| Under 6 | 17 (22.1%) | 64 (83.1%) |
| 6 to 18 Years | 53 (23.7%) | 192 (85.7%) |
| 19 to 25 Years | 0 (0.0%) | 30 (96.8%) |
| 25 to 34 Years | 0 (0.0%) | 201 (84.8%) |
| 35 to 44 Years | 19 (12.7%) | 131 (87.3%) |
| 45 to 54 Years | 11 (8.9%) | 110 (89.4%) |
| 55 to 64 Years | 44 (47.3%) | 50 (53.8%) |
| 65 to 74 Years | 78 (96.3%) | 43 (53.1%) |
| 75 Years and over | 107 (100.0%) | 79 (73.8%) |
| Total | 329 (29.3%) | 900 (80.1%) |
Disability Status by Sex by Age in Dauphin borough
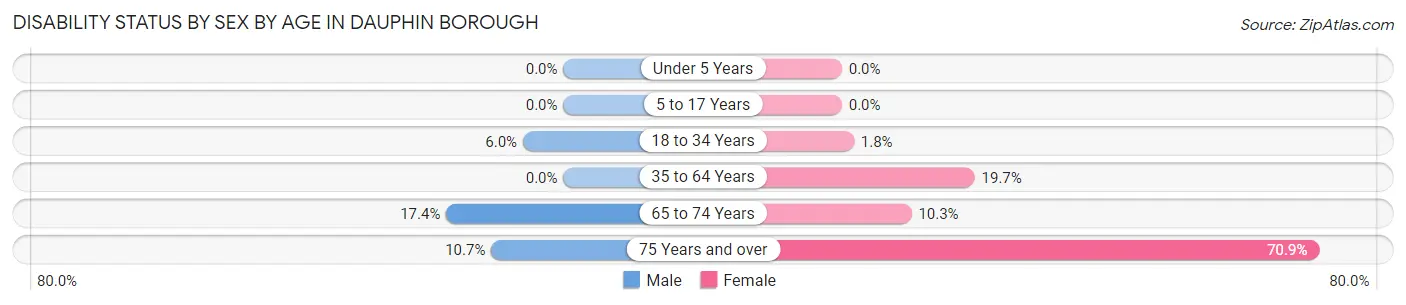
| Age Bracket | Male | Female |
| Under 5 Years | 0 (0.0%) | 0 (0.0%) |
| 5 to 17 Years | 0 (0.0%) | 0 (0.0%) |
| 18 to 34 Years | 6 (6.0%) | 3 (1.8%) |
| 35 to 64 Years | 0 (0.0%) | 42 (19.7%) |
| 65 to 74 Years | 4 (17.4%) | 6 (10.3%) |
| 75 Years and over | 3 (10.7%) | 56 (70.9%) |
Disability Class by Sex by Age in Dauphin borough
Disability Class: Hearing Difficulty
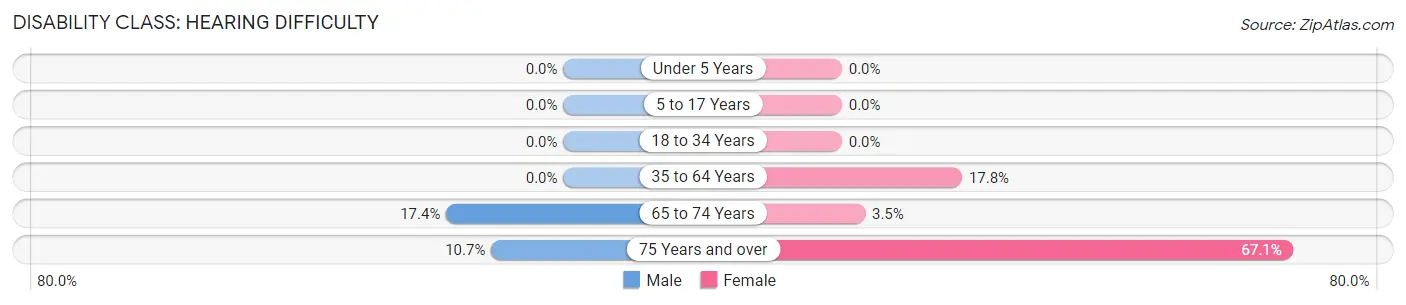
| Age Bracket | Male | Female |
| Under 5 Years | 0 (0.0%) | 0 (0.0%) |
| 5 to 17 Years | 0 (0.0%) | 0 (0.0%) |
| 18 to 34 Years | 0 (0.0%) | 0 (0.0%) |
| 35 to 64 Years | 0 (0.0%) | 38 (17.8%) |
| 65 to 74 Years | 4 (17.4%) | 2 (3.5%) |
| 75 Years and over | 3 (10.7%) | 53 (67.1%) |
Disability Class: Vision Difficulty
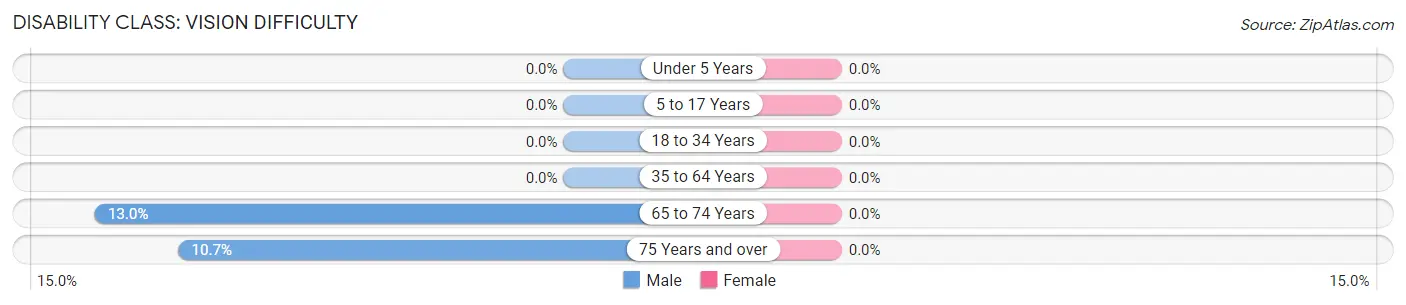
| Age Bracket | Male | Female |
| Under 5 Years | 0 (0.0%) | 0 (0.0%) |
| 5 to 17 Years | 0 (0.0%) | 0 (0.0%) |
| 18 to 34 Years | 0 (0.0%) | 0 (0.0%) |
| 35 to 64 Years | 0 (0.0%) | 0 (0.0%) |
| 65 to 74 Years | 3 (13.0%) | 0 (0.0%) |
| 75 Years and over | 3 (10.7%) | 0 (0.0%) |
Disability Class: Cognitive Difficulty
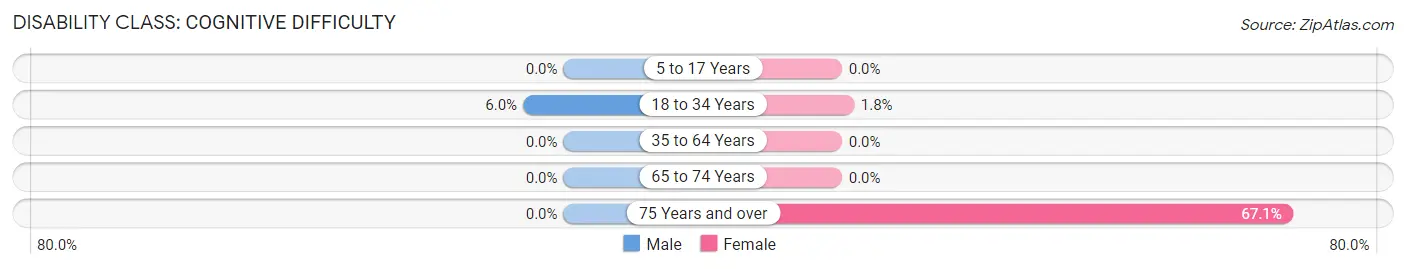
| Age Bracket | Male | Female |
| 5 to 17 Years | 0 (0.0%) | 0 (0.0%) |
| 18 to 34 Years | 6 (6.0%) | 3 (1.8%) |
| 35 to 64 Years | 0 (0.0%) | 0 (0.0%) |
| 65 to 74 Years | 0 (0.0%) | 0 (0.0%) |
| 75 Years and over | 0 (0.0%) | 53 (67.1%) |
Disability Class: Ambulatory Difficulty
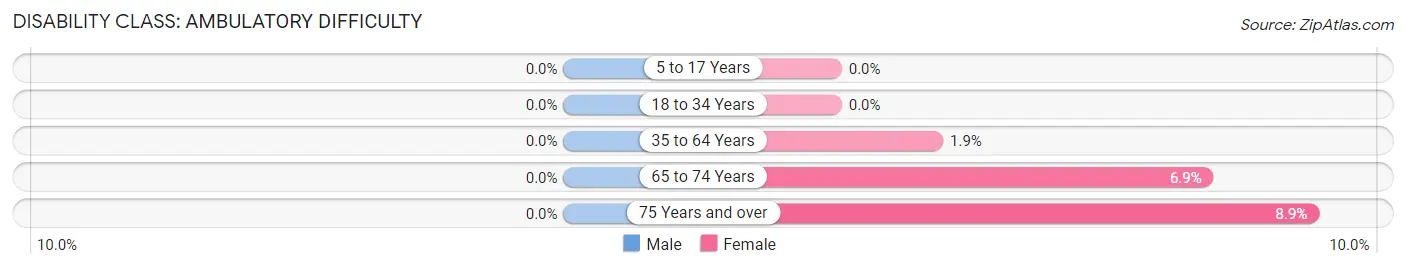
| Age Bracket | Male | Female |
| 5 to 17 Years | 0 (0.0%) | 0 (0.0%) |
| 18 to 34 Years | 0 (0.0%) | 0 (0.0%) |
| 35 to 64 Years | 0 (0.0%) | 4 (1.9%) |
| 65 to 74 Years | 0 (0.0%) | 4 (6.9%) |
| 75 Years and over | 0 (0.0%) | 7 (8.9%) |
Disability Class: Self-Care Difficulty
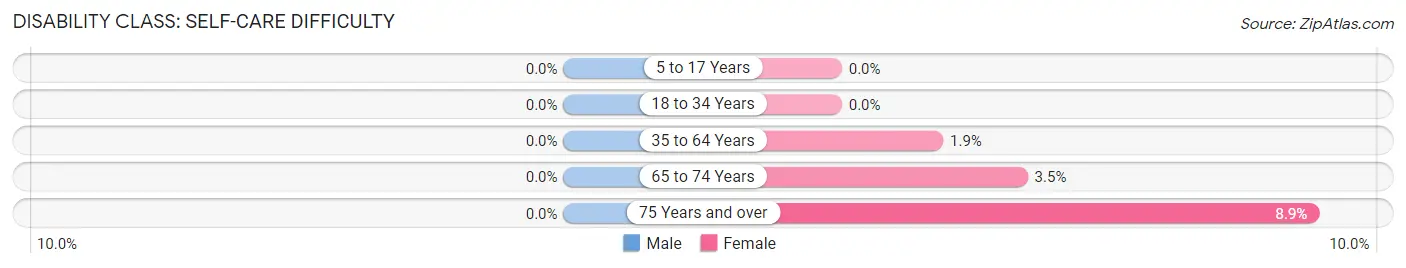
| Age Bracket | Male | Female |
| 5 to 17 Years | 0 (0.0%) | 0 (0.0%) |
| 18 to 34 Years | 0 (0.0%) | 0 (0.0%) |
| 35 to 64 Years | 0 (0.0%) | 4 (1.9%) |
| 65 to 74 Years | 0 (0.0%) | 2 (3.5%) |
| 75 Years and over | 0 (0.0%) | 7 (8.9%) |
Technology Access in Dauphin borough
Computing Device Access in Dauphin borough
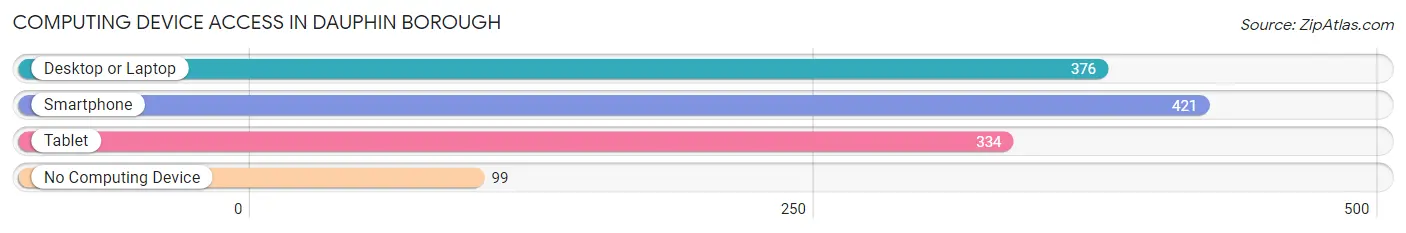
| Device Type | # Households | % Households |
| Desktop or Laptop | 376 | 72.0% |
| Smartphone | 421 | 80.6% |
| Tablet | 334 | 64.0% |
| No Computing Device | 99 | 19.0% |
| Total | 522 | 100.0% |
Internet Access in Dauphin borough
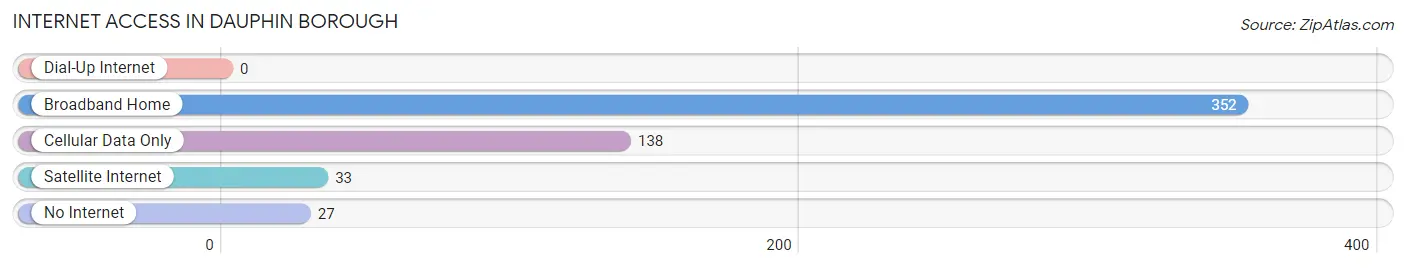
| Internet Type | # Households | % Households |
| Dial-Up Internet | 0 | 0.0% |
| Broadband Home | 352 | 67.4% |
| Cellular Data Only | 138 | 26.4% |
| Satellite Internet | 33 | 6.3% |
| No Internet | 27 | 5.2% |
| Total | 522 | 100.0% |
Dauphin borough Summary
Dauphin Borough is a borough located in Dauphin County, Pennsylvania, United States. The population was 1,945 at the 2010 census. It is part of the Harrisburg–Carlisle Metropolitan Statistical Area.
History
Dauphin Borough was founded in 1785 and was named after Louis-Joseph, Dauphin of France, the son of King Louis XVI. The borough was originally part of Derry Township, which was divided into two parts in 1785. The part that became Dauphin Borough was known as Dauphin Borough until 1827, when it was renamed Dauphin Borough.
Geography
Dauphin Borough is located at 40°17'45" North, 76°52'45" West (40.295833, -76.879167). According to the United States Census Bureau, the borough has a total area of 0.6 square miles (1.6 km2), all of it land.
Demographics
As of the census of 2000, there were 1,945 people, 817 households, and 517 families residing in the borough. The population density was 3,093.3 people per square mile (1,192.2/km2). There were 860 housing units at an average density of 1,364.2 per square mile (526.7/km2). The racial makeup of the borough was 97.44% White, 0.77% African American, 0.31% Native American, 0.36% Asian, 0.05% Pacific Islander, 0.31% from other races, and 0.77% from two or more races. Hispanic or Latino of any race were 0.77% of the population.
Economy
Dauphin Borough is home to a variety of businesses, including retail stores, restaurants, and professional services. The borough is also home to a number of manufacturing companies, including a plastics manufacturer, a metal fabricator, and a machine shop.
The borough is served by the Dauphin County Transit Authority, which provides public transportation to the borough and surrounding areas. The borough is also served by the Dauphin County Library System, which provides library services to the borough and surrounding areas.
Education
Dauphin Borough is served by the Dauphin County School District, which provides public education to the borough and surrounding areas. The district operates two elementary schools, one middle school, and one high school. The borough is also served by the Dauphin County Technical School, which provides vocational and technical education to the borough and surrounding areas.
Conclusion
Dauphin Borough is a small borough located in Dauphin County, Pennsylvania. The borough has a population of 1,945 and is part of the Harrisburg–Carlisle Metropolitan Statistical Area. The borough is home to a variety of businesses, including retail stores, restaurants, and professional services. The borough is served by the Dauphin County Transit Authority, the Dauphin County Library System, and the Dauphin County School District. The borough is also served by the Dauphin County Technical School, which provides vocational and technical education to the borough and surrounding areas.
Common Questions
What is Per Capita Income in Dauphin borough?
Per Capita income in Dauphin borough is $33,794.
What is the Median Family Income in Dauphin borough?
Median Family Income in Dauphin borough is $92,917.
What is the Median Household income in Dauphin borough?
Median Household Income in Dauphin borough is $57,000.
What is Income or Wage Gap in Dauphin borough?
Income or Wage Gap in Dauphin borough is 42.8%.
Women in Dauphin borough earn 57.2 cents for every dollar earned by a man.
What is Inequality or Gini Index in Dauphin borough?
Inequality or Gini Index in Dauphin borough is 0.50.
What is the Total Population of Dauphin borough?
Total Population of Dauphin borough is 1,123.
What is the Total Male Population of Dauphin borough?
Total Male Population of Dauphin borough is 433.
What is the Total Female Population of Dauphin borough?
Total Female Population of Dauphin borough is 690.
What is the Ratio of Males per 100 Females in Dauphin borough?
There are 62.75 Males per 100 Females in Dauphin borough.
What is the Ratio of Females per 100 Males in Dauphin borough?
There are 159.35 Females per 100 Males in Dauphin borough.
What is the Median Population Age in Dauphin borough?
Median Population Age in Dauphin borough is 34.3 Years.
What is the Average Family Size in Dauphin borough
Average Family Size in Dauphin borough is 3.2 People.
What is the Average Household Size in Dauphin borough
Average Household Size in Dauphin borough is 2.1 People.
How Large is the Labor Force in Dauphin borough?
There are 550 People in the Labor Forcein in Dauphin borough.
What is the Percentage of People in the Labor Force in Dauphin borough?
62.1% of People are in the Labor Force in Dauphin borough.
What is the Unemployment Rate in Dauphin borough?
Unemployment Rate in Dauphin borough is 3.5%.