Greenville borough, PA Map & Demographics
Greenville borough Overview
$23,510
PER CAPITA INCOME
$69,364
AVG FAMILY INCOME
$54,237
AVG HOUSEHOLD INCOME
31.4%
WAGE / INCOME GAP [ % ]
68.6¢/ $1
WAGE / INCOME GAP [ $ ]
0.41
INEQUALITY / GINI INDEX
5,568
TOTAL POPULATION
2,632
MALE POPULATION
2,936
FEMALE POPULATION
89.65
MALES / 100 FEMALES
111.55
FEMALES / 100 MALES
28.4
MEDIAN AGE
3.1
AVG FAMILY SIZE
2.4
AVG HOUSEHOLD SIZE
2,723
LABOR FORCE [ PEOPLE ]
62.4%
PERCENT IN LABOR FORCE
2.8%
UNEMPLOYMENT RATE
Income in Greenville borough
Income Overview in Greenville borough
Per Capita Income in Greenville borough is $23,510, while median incomes of families and households are $69,364 and $54,237 respectively.
| Characteristic | Number | Measure |
| Per Capita Income | 5,568 | $23,510 |
| Median Family Income | 1,150 | $69,364 |
| Mean Family Income | 1,150 | $82,052 |
| Median Household Income | 1,992 | $54,237 |
| Mean Household Income | 1,992 | $62,924 |
| Income Deficit | 1,150 | $0 |
| Wage / Income Gap (%) | 5,568 | 31.39% |
| Wage / Income Gap ($) | 5,568 | 68.61¢ per $1 |
| Gini / Inequality Index | 5,568 | 0.41 |
Earnings by Sex in Greenville borough
Average Earnings in Greenville borough are $28,041, $32,358 for men and $22,202 for women, a difference of 31.4%.
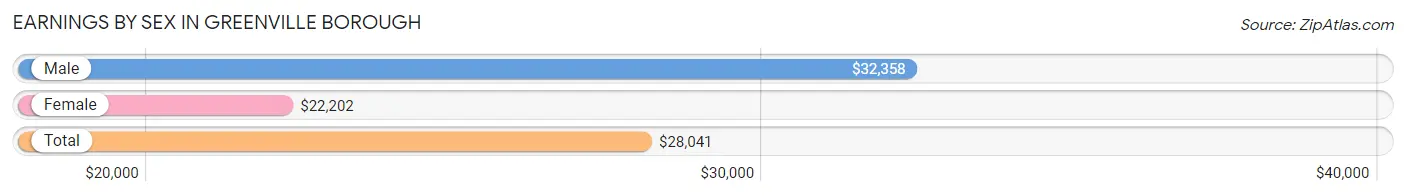
| Sex | Number | Average Earnings |
| Male | 1,542 (49.4%) | $32,358 |
| Female | 1,581 (50.6%) | $22,202 |
| Total | 3,123 (100.0%) | $28,041 |
Earnings by Sex by Income Bracket in Greenville borough
The most common earnings brackets in Greenville borough are $55,000 to $64,999 for men (156 | 10.1%) and $2,500 to $4,999 for women (197 | 12.5%).
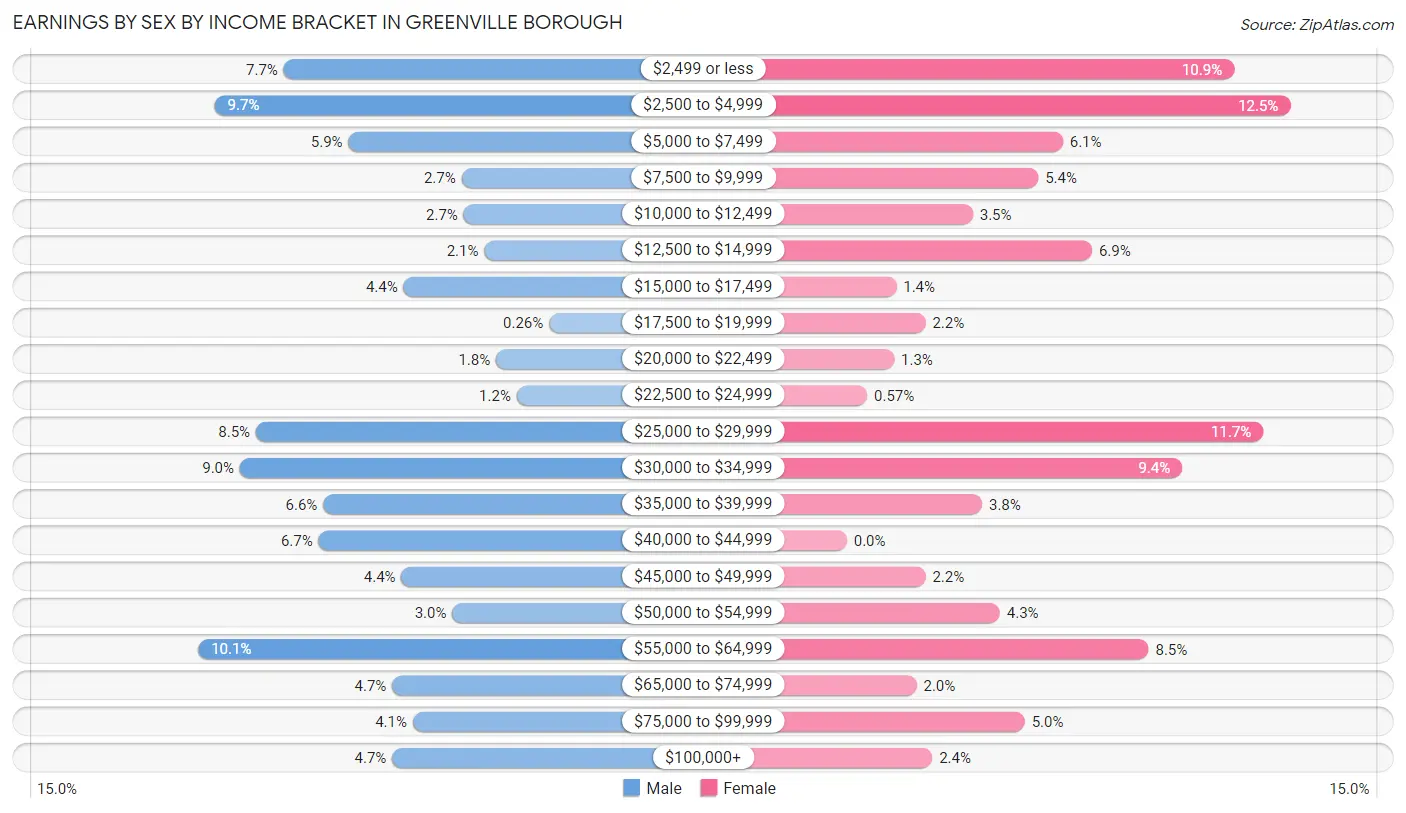
| Income | Male | Female |
| $2,499 or less | 119 (7.7%) | 172 (10.9%) |
| $2,500 to $4,999 | 149 (9.7%) | 197 (12.5%) |
| $5,000 to $7,499 | 91 (5.9%) | 96 (6.1%) |
| $7,500 to $9,999 | 42 (2.7%) | 85 (5.4%) |
| $10,000 to $12,499 | 41 (2.7%) | 56 (3.5%) |
| $12,500 to $14,999 | 32 (2.1%) | 109 (6.9%) |
| $15,000 to $17,499 | 67 (4.3%) | 22 (1.4%) |
| $17,500 to $19,999 | 4 (0.3%) | 35 (2.2%) |
| $20,000 to $22,499 | 27 (1.8%) | 21 (1.3%) |
| $22,500 to $24,999 | 18 (1.2%) | 9 (0.6%) |
| $25,000 to $29,999 | 131 (8.5%) | 185 (11.7%) |
| $30,000 to $34,999 | 138 (8.9%) | 149 (9.4%) |
| $35,000 to $39,999 | 102 (6.6%) | 60 (3.8%) |
| $40,000 to $44,999 | 104 (6.7%) | 0 (0.0%) |
| $45,000 to $49,999 | 68 (4.4%) | 35 (2.2%) |
| $50,000 to $54,999 | 46 (3.0%) | 68 (4.3%) |
| $55,000 to $64,999 | 156 (10.1%) | 134 (8.5%) |
| $65,000 to $74,999 | 72 (4.7%) | 31 (2.0%) |
| $75,000 to $99,999 | 63 (4.1%) | 79 (5.0%) |
| $100,000+ | 72 (4.7%) | 38 (2.4%) |
| Total | 1,542 (100.0%) | 1,581 (100.0%) |
Earnings by Sex by Educational Attainment in Greenville borough
Average earnings in Greenville borough are $42,018 for men and $31,250 for women, a difference of 25.6%. Men with an educational attainment of graduate degree enjoy the highest average annual earnings of $101,250, while those with less than high school education earn the least with $27,468. Women with an educational attainment of graduate degree earn the most with the average annual earnings of $58,929, while those with less than high school education have the smallest earnings of $2,499.
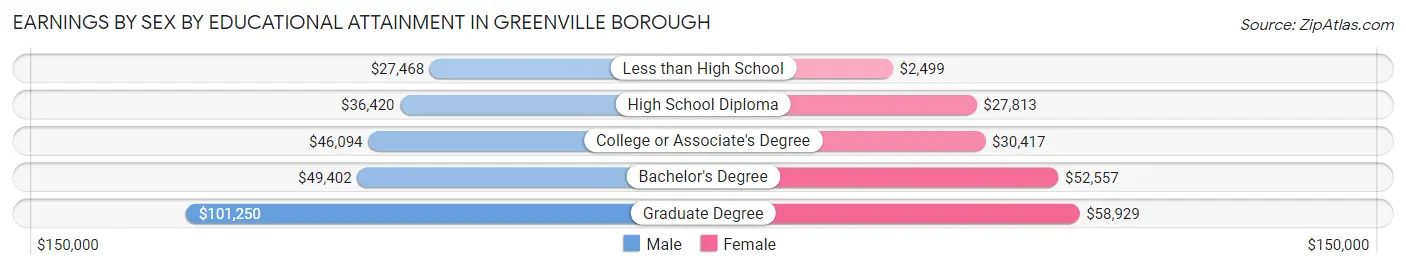
| Educational Attainment | Male Income | Female Income |
| Less than High School | $27,468 | $2,499 |
| High School Diploma | $36,420 | $27,813 |
| College or Associate's Degree | $46,094 | $30,417 |
| Bachelor's Degree | $49,402 | $52,557 |
| Graduate Degree | $101,250 | $58,929 |
| Total | $42,018 | $31,250 |
Family Income in Greenville borough
Family Income Brackets in Greenville borough
According to the Greenville borough family income data, there are 290 families falling into the $50,000 to $74,999 income range, which is the most common income bracket and makes up 25.2% of all families. Conversely, the $10,000 to $14,999 income bracket is the least frequent group with only 20 families (1.7%) belonging to this category.
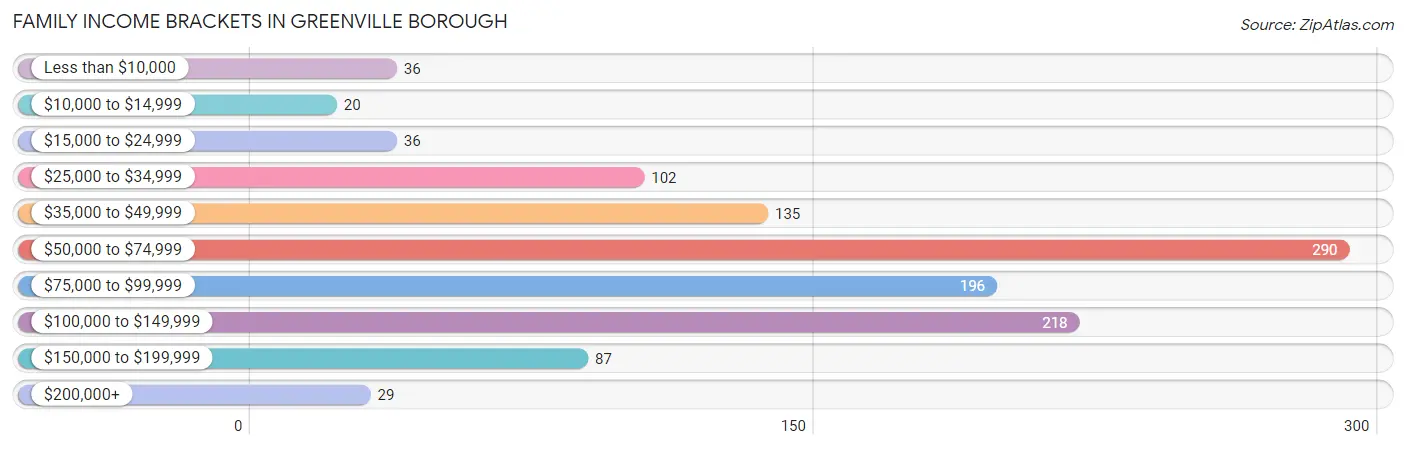
| Income Bracket | # Families | % Families |
| Less than $10,000 | 36 | 3.1% |
| $10,000 to $14,999 | 20 | 1.7% |
| $15,000 to $24,999 | 36 | 3.1% |
| $25,000 to $34,999 | 102 | 8.9% |
| $35,000 to $49,999 | 135 | 11.7% |
| $50,000 to $74,999 | 290 | 25.2% |
| $75,000 to $99,999 | 196 | 17.0% |
| $100,000 to $149,999 | 218 | 19.0% |
| $150,000 to $199,999 | 87 | 7.6% |
| $200,000+ | 29 | 2.5% |
Family Income by Famaliy Size in Greenville borough
6-person families (44 | 3.8%) account for the highest median family income in Greenville borough with $142,500 per family, while 2-person families (487 | 42.3%) have the highest median income of $29,514 per family member.
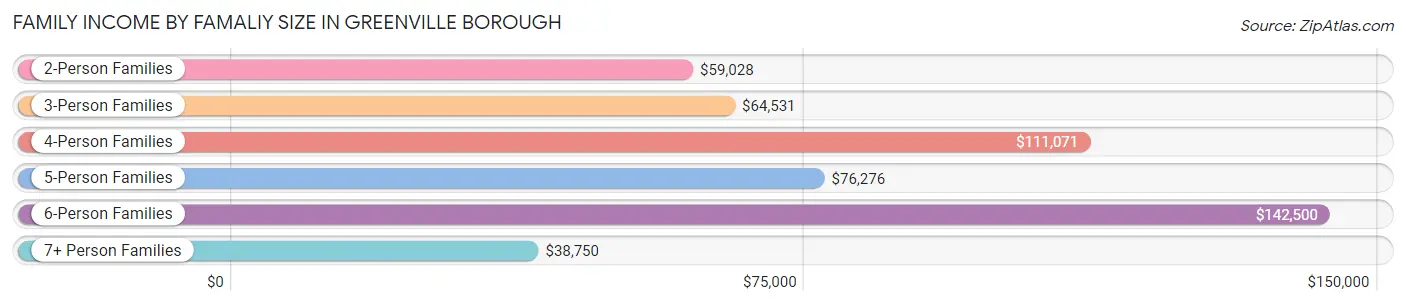
| Income Bracket | # Families | Median Income |
| 2-Person Families | 487 (42.3%) | $59,028 |
| 3-Person Families | 257 (22.4%) | $64,531 |
| 4-Person Families | 242 (21.0%) | $111,071 |
| 5-Person Families | 84 (7.3%) | $76,276 |
| 6-Person Families | 44 (3.8%) | $142,500 |
| 7+ Person Families | 36 (3.1%) | $38,750 |
| Total | 1,150 (100.0%) | $69,364 |
Family Income by Number of Earners in Greenville borough
The median family income in Greenville borough is $69,364, with families comprising 3+ earners (118) having the highest median family income of $103,438, while families with 1 earner (383) have the lowest median family income of $44,653, accounting for 10.3% and 33.3% of families, respectively.
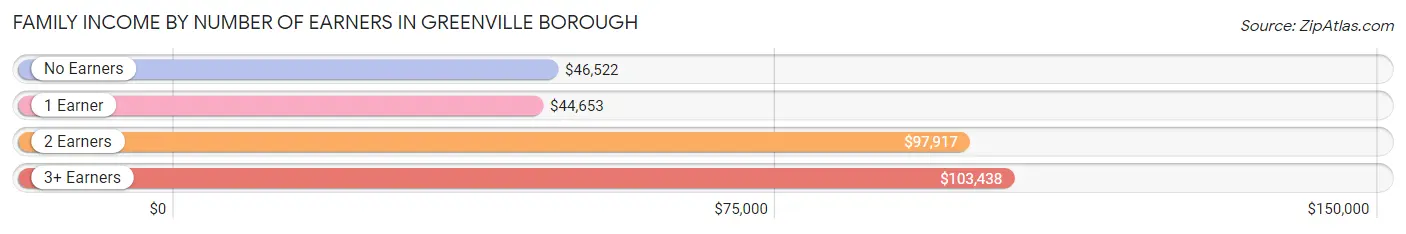
| Number of Earners | # Families | Median Income |
| No Earners | 164 (14.3%) | $46,522 |
| 1 Earner | 383 (33.3%) | $44,653 |
| 2 Earners | 485 (42.2%) | $97,917 |
| 3+ Earners | 118 (10.3%) | $103,438 |
| Total | 1,150 (100.0%) | $69,364 |
Household Income in Greenville borough
Household Income Brackets in Greenville borough
With 490 households falling in the category, the $50,000 to $74,999 income range is the most frequent in Greenville borough, accounting for 24.6% of all households. In contrast, only 30 households (1.5%) fall into the $200,000+ income bracket, making it the least populous group.
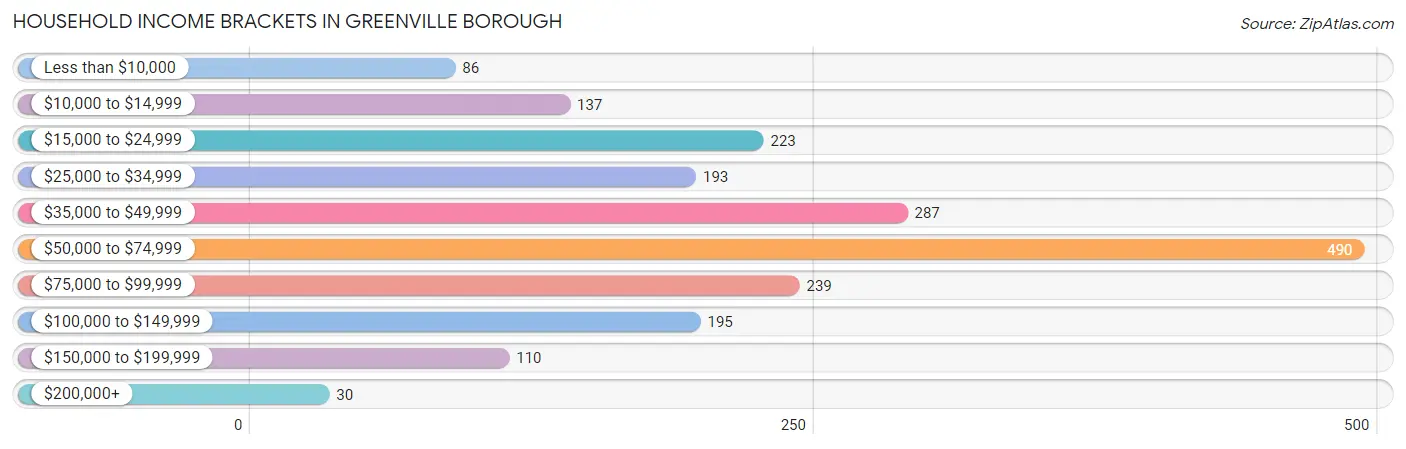
| Income Bracket | # Households | % Households |
| Less than $10,000 | 86 | 4.3% |
| $10,000 to $14,999 | 137 | 6.9% |
| $15,000 to $24,999 | 223 | 11.2% |
| $25,000 to $34,999 | 193 | 9.7% |
| $35,000 to $49,999 | 287 | 14.4% |
| $50,000 to $74,999 | 490 | 24.6% |
| $75,000 to $99,999 | 239 | 12.0% |
| $100,000 to $149,999 | 195 | 9.8% |
| $150,000 to $199,999 | 110 | 5.5% |
| $200,000+ | 30 | 1.5% |
Household Income by Householder Age in Greenville borough
The median household income in Greenville borough is $54,237, with the highest median household income of $63,207 found in the 45 to 64 years age bracket for the primary householder. A total of 676 households (33.9%) fall into this category. Meanwhile, the 65+ years age bracket for the primary householder has the lowest median household income of $31,250, with 508 households (25.5%) in this group.
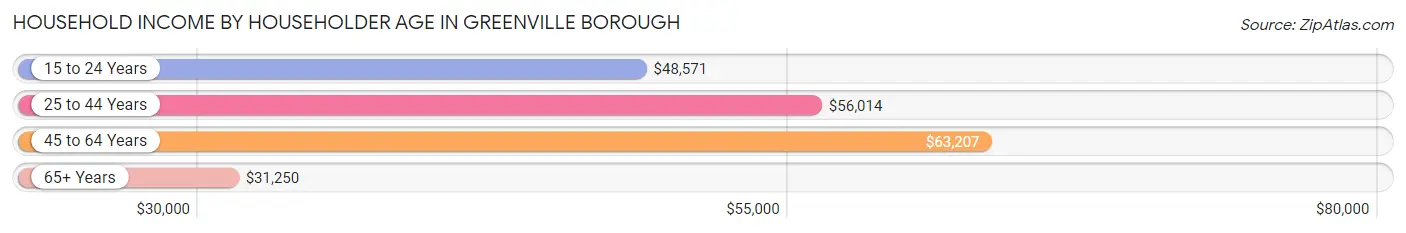
| Income Bracket | # Households | Median Income |
| 15 to 24 Years | 184 (9.2%) | $48,571 |
| 25 to 44 Years | 624 (31.3%) | $56,014 |
| 45 to 64 Years | 676 (33.9%) | $63,207 |
| 65+ Years | 508 (25.5%) | $31,250 |
| Total | 1,992 (100.0%) | $54,237 |
Poverty in Greenville borough
Income Below Poverty by Sex and Age in Greenville borough
With 12.0% poverty level for males and 15.0% for females among the residents of Greenville borough, 5 year old males and 16 and 17 year old females are the most vulnerable to poverty, with 19 males (100.0%) and 13 females (37.1%) in their respective age groups living below the poverty level.
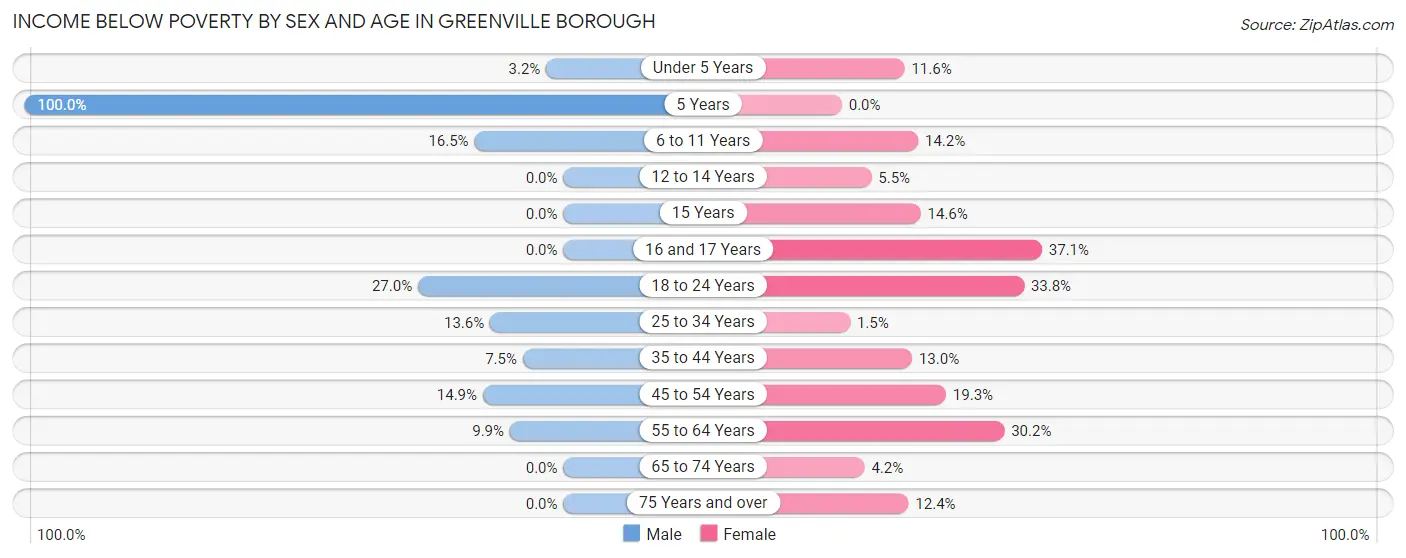
| Age Bracket | Male | Female |
| Under 5 Years | 9 (3.2%) | 32 (11.6%) |
| 5 Years | 19 (100.0%) | 0 (0.0%) |
| 6 to 11 Years | 33 (16.5%) | 30 (14.1%) |
| 12 to 14 Years | 0 (0.0%) | 5 (5.5%) |
| 15 Years | 0 (0.0%) | 6 (14.6%) |
| 16 and 17 Years | 0 (0.0%) | 13 (37.1%) |
| 18 to 24 Years | 75 (27.0%) | 71 (33.8%) |
| 25 to 34 Years | 49 (13.6%) | 6 (1.5%) |
| 35 to 44 Years | 18 (7.5%) | 31 (13.0%) |
| 45 to 54 Years | 46 (14.9%) | 51 (19.3%) |
| 55 to 64 Years | 15 (9.9%) | 101 (30.1%) |
| 65 to 74 Years | 0 (0.0%) | 9 (4.2%) |
| 75 Years and over | 0 (0.0%) | 22 (12.4%) |
| Total | 264 (12.0%) | 377 (15.0%) |
Income Above Poverty by Sex and Age in Greenville borough
According to the poverty statistics in Greenville borough, males aged 12 to 14 years and females aged 5 years are the age groups that are most secure financially, with 100.0% of males and 100.0% of females in these age groups living above the poverty line.
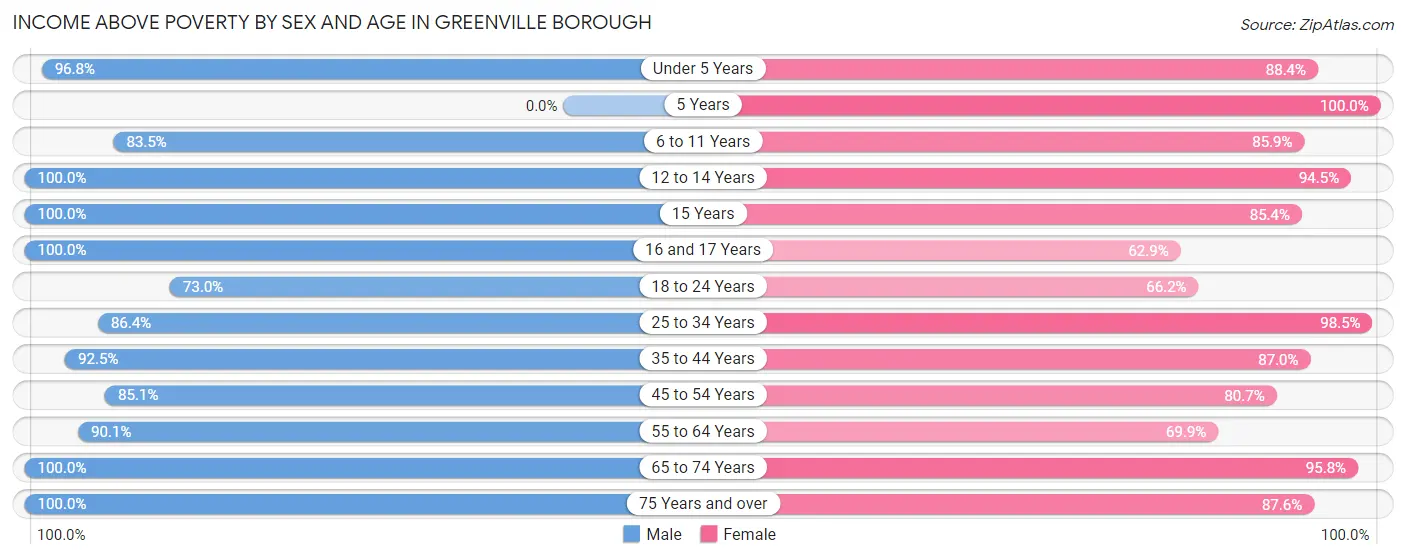
| Age Bracket | Male | Female |
| Under 5 Years | 274 (96.8%) | 243 (88.4%) |
| 5 Years | 0 (0.0%) | 19 (100.0%) |
| 6 to 11 Years | 167 (83.5%) | 182 (85.9%) |
| 12 to 14 Years | 19 (100.0%) | 86 (94.5%) |
| 15 Years | 4 (100.0%) | 35 (85.4%) |
| 16 and 17 Years | 28 (100.0%) | 22 (62.9%) |
| 18 to 24 Years | 203 (73.0%) | 139 (66.2%) |
| 25 to 34 Years | 311 (86.4%) | 390 (98.5%) |
| 35 to 44 Years | 221 (92.5%) | 207 (87.0%) |
| 45 to 54 Years | 262 (85.1%) | 213 (80.7%) |
| 55 to 64 Years | 136 (90.1%) | 234 (69.9%) |
| 65 to 74 Years | 177 (100.0%) | 205 (95.8%) |
| 75 Years and over | 139 (100.0%) | 156 (87.6%) |
| Total | 1,941 (88.0%) | 2,131 (85.0%) |
Income Below Poverty Among Married-Couple Families in Greenville borough
The poverty statistics for married-couple families in Greenville borough show that 1.0% or 8 of the total 791 families live below the poverty line. Families with no children have the highest poverty rate of 2.1%, comprising of 8 families. On the other hand, families with 1 or 2 children have the lowest poverty rate of 0.0%, which includes 0 families.
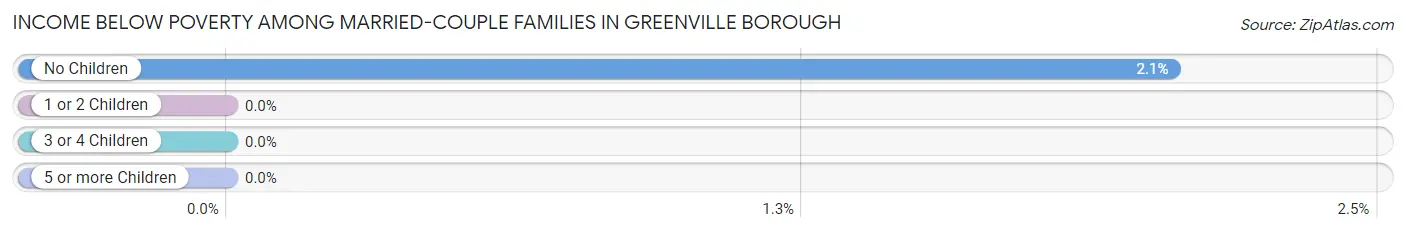
| Children | Above Poverty | Below Poverty |
| No Children | 383 (98.0%) | 8 (2.1%) |
| 1 or 2 Children | 347 (100.0%) | 0 (0.0%) |
| 3 or 4 Children | 46 (100.0%) | 0 (0.0%) |
| 5 or more Children | 7 (100.0%) | 0 (0.0%) |
| Total | 783 (99.0%) | 8 (1.0%) |
Income Below Poverty Among Single-Parent Households in Greenville borough
According to the poverty data in Greenville borough, 23.4% or 34 single-father households and 23.4% or 50 single-mother households are living below the poverty line. Among single-father households, those with 5 or more children have the highest poverty rate, with 18 households (100.0%) experiencing poverty. Likewise, among single-mother households, those with no children have the highest poverty rate, with 24 households (37.5%) falling below the poverty line.
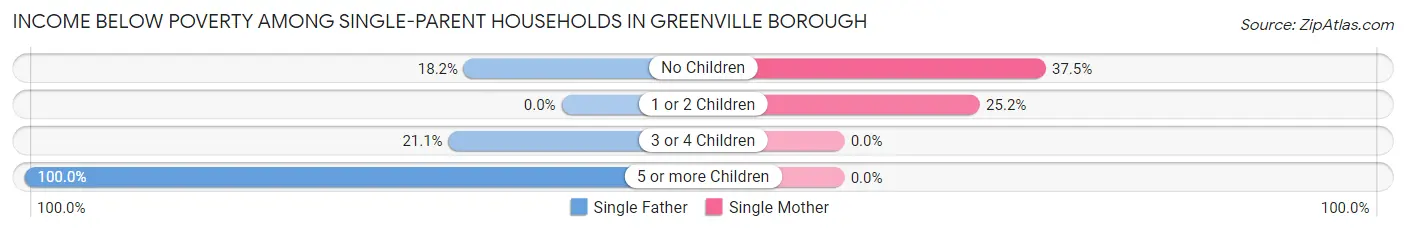
| Children | Single Father | Single Mother |
| No Children | 12 (18.2%) | 24 (37.5%) |
| 1 or 2 Children | 0 (0.0%) | 26 (25.2%) |
| 3 or 4 Children | 4 (21.0%) | 0 (0.0%) |
| 5 or more Children | 18 (100.0%) | 0 (0.0%) |
| Total | 34 (23.4%) | 50 (23.4%) |
Income Below Poverty Among Married-Couple vs Single-Parent Households in Greenville borough
The poverty data for Greenville borough shows that 8 of the married-couple family households (1.0%) and 84 of the single-parent households (23.4%) are living below the poverty level. Within the married-couple family households, those with no children have the highest poverty rate, with 8 households (2.1%) falling below the poverty line. Among the single-parent households, those with 5 or more children have the highest poverty rate, with 18 household (62.1%) living below poverty.
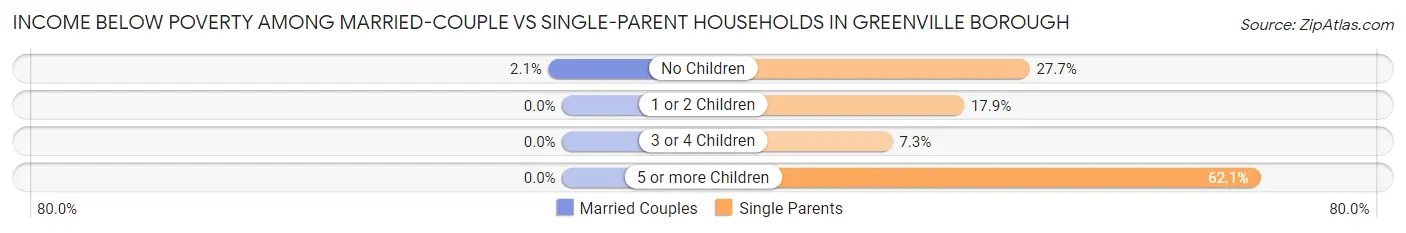
| Children | Married-Couple Families | Single-Parent Households |
| No Children | 8 (2.1%) | 36 (27.7%) |
| 1 or 2 Children | 0 (0.0%) | 26 (17.9%) |
| 3 or 4 Children | 0 (0.0%) | 4 (7.3%) |
| 5 or more Children | 0 (0.0%) | 18 (62.1%) |
| Total | 8 (1.0%) | 84 (23.4%) |
Race in Greenville borough
The most populous races in Greenville borough are White / Caucasian (5,303 | 95.2%), Two or more Races (181 | 3.3%), and Hispanic or Latino (73 | 1.3%).
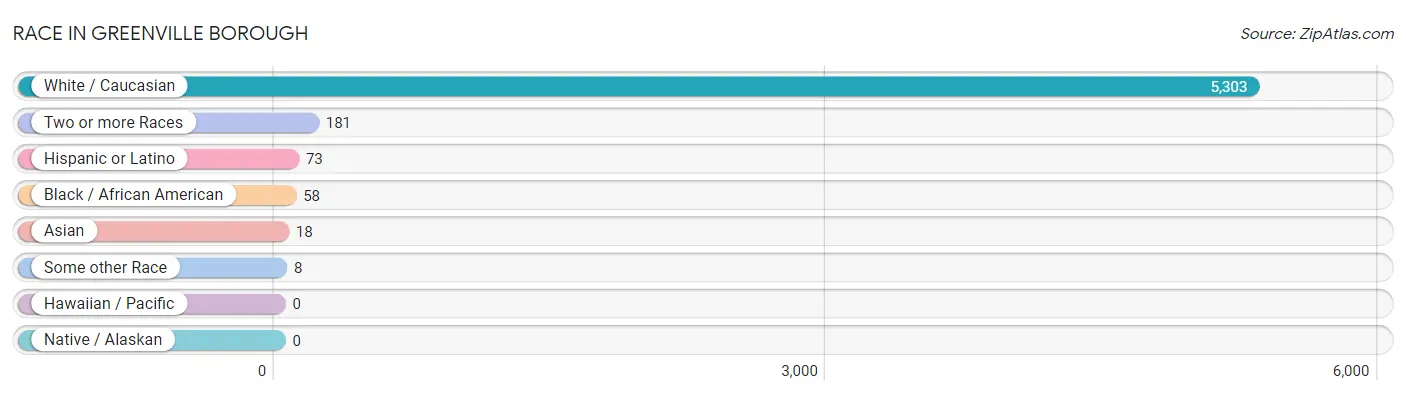
| Race | # Population | % Population |
| Asian | 18 | 0.3% |
| Black / African American | 58 | 1.0% |
| Hawaiian / Pacific | 0 | 0.0% |
| Hispanic or Latino | 73 | 1.3% |
| Native / Alaskan | 0 | 0.0% |
| White / Caucasian | 5,303 | 95.2% |
| Two or more Races | 181 | 3.3% |
| Some other Race | 8 | 0.1% |
| Total | 5,568 | 100.0% |
Ancestry in Greenville borough
The most populous ancestries reported in Greenville borough are German (1,672 | 30.0%), Irish (842 | 15.1%), Italian (584 | 10.5%), English (510 | 9.2%), and Polish (323 | 5.8%), together accounting for 70.6% of all Greenville borough residents.
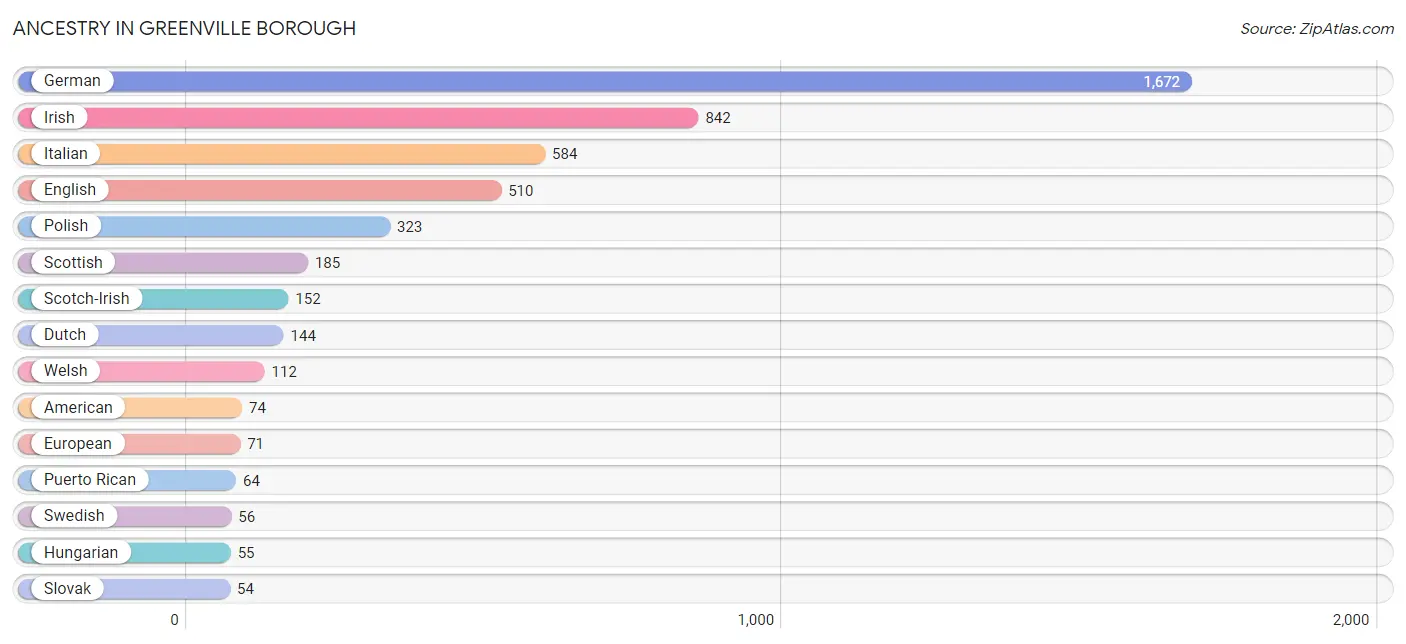
| Ancestry | # Population | % Population |
| American | 74 | 1.3% |
| Armenian | 3 | 0.1% |
| Austrian | 2 | 0.0% |
| Belgian | 7 | 0.1% |
| British | 24 | 0.4% |
| Burmese | 14 | 0.3% |
| Carpatho Rusyn | 39 | 0.7% |
| Central American | 2 | 0.0% |
| Cherokee | 7 | 0.1% |
| Croatian | 16 | 0.3% |
| Czech | 8 | 0.1% |
| Dutch | 144 | 2.6% |
| English | 510 | 9.2% |
| European | 71 | 1.3% |
| Finnish | 39 | 0.7% |
| French | 31 | 0.6% |
| French Canadian | 9 | 0.2% |
| German | 1,672 | 30.0% |
| Greek | 34 | 0.6% |
| Hungarian | 55 | 1.0% |
| Indian (Asian) | 5 | 0.1% |
| Irish | 842 | 15.1% |
| Iroquois | 2 | 0.0% |
| Israeli | 7 | 0.1% |
| Italian | 584 | 10.5% |
| Jamaican | 13 | 0.2% |
| Korean | 27 | 0.5% |
| Lithuanian | 7 | 0.1% |
| Mexican | 6 | 0.1% |
| Norwegian | 11 | 0.2% |
| Polish | 323 | 5.8% |
| Puerto Rican | 64 | 1.1% |
| Romanian | 10 | 0.2% |
| Russian | 21 | 0.4% |
| Salvadoran | 2 | 0.0% |
| Scandinavian | 10 | 0.2% |
| Scotch-Irish | 152 | 2.7% |
| Scottish | 185 | 3.3% |
| Serbian | 15 | 0.3% |
| Slavic | 15 | 0.3% |
| Slovak | 54 | 1.0% |
| Sri Lankan | 8 | 0.1% |
| Swedish | 56 | 1.0% |
| Welsh | 112 | 2.0% |
| Yugoslavian | 8 | 0.1% | View All 45 Rows |
Immigrants in Greenville borough
The most numerous immigrant groups reported in Greenville borough came from Asia (37 | 0.7%), Philippines (23 | 0.4%), South Eastern Asia (23 | 0.4%), Eastern Asia (14 | 0.3%), and Korea (14 | 0.3%), together accounting for 2.0% of all Greenville borough residents.
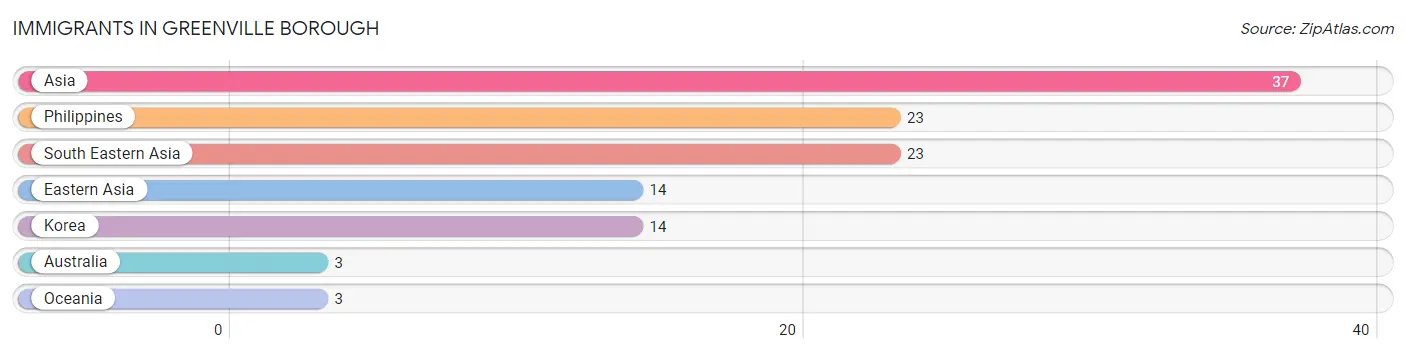
| Immigration Origin | # Population | % Population |
| Asia | 37 | 0.7% |
| Australia | 3 | 0.1% |
| Eastern Asia | 14 | 0.3% |
| Korea | 14 | 0.3% |
| Oceania | 3 | 0.1% |
| Philippines | 23 | 0.4% |
| South Eastern Asia | 23 | 0.4% | View All 7 Rows |
Sex and Age in Greenville borough
Sex and Age in Greenville borough
The most populous age groups in Greenville borough are 20 to 24 Years (432 | 16.4%) for men and 20 to 24 Years (451 | 15.4%) for women.
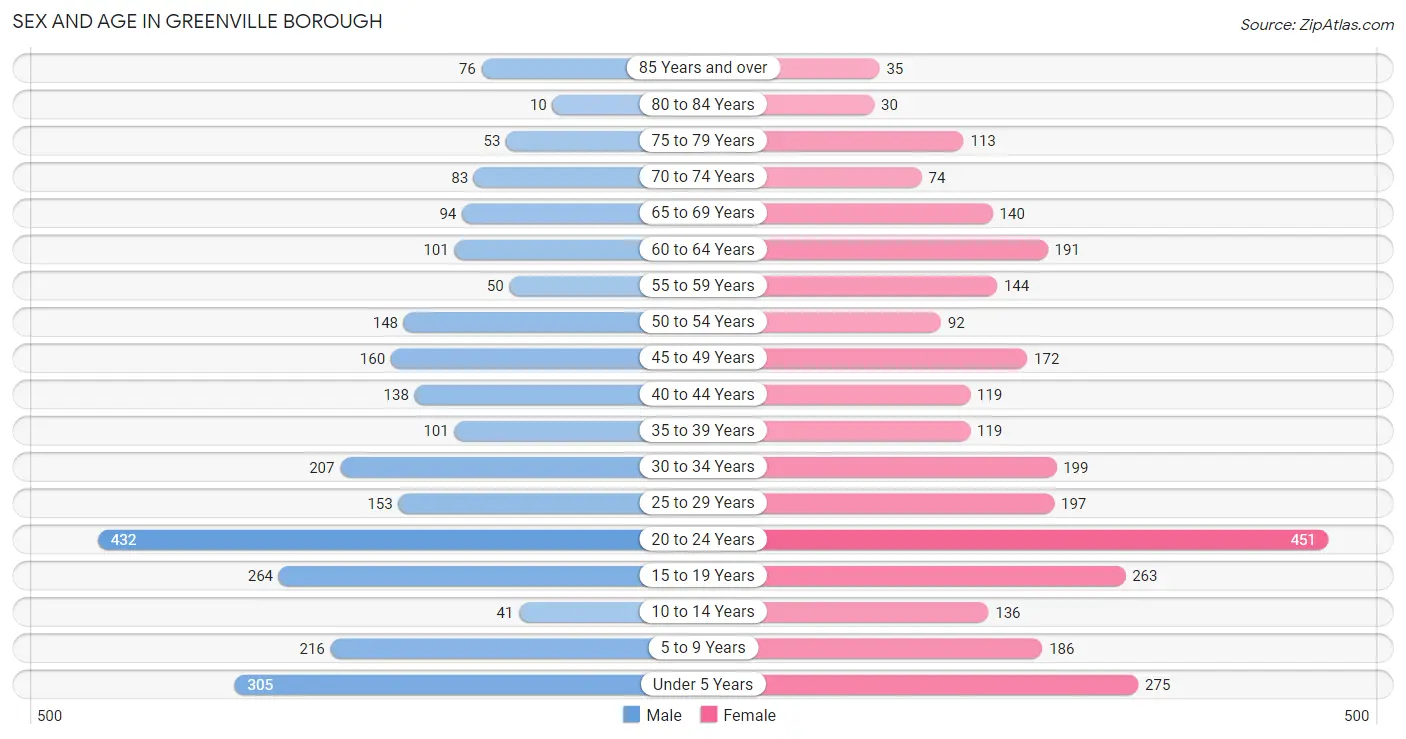
| Age Bracket | Male | Female |
| Under 5 Years | 305 (11.6%) | 275 (9.4%) |
| 5 to 9 Years | 216 (8.2%) | 186 (6.3%) |
| 10 to 14 Years | 41 (1.6%) | 136 (4.6%) |
| 15 to 19 Years | 264 (10.0%) | 263 (9.0%) |
| 20 to 24 Years | 432 (16.4%) | 451 (15.4%) |
| 25 to 29 Years | 153 (5.8%) | 197 (6.7%) |
| 30 to 34 Years | 207 (7.9%) | 199 (6.8%) |
| 35 to 39 Years | 101 (3.8%) | 119 (4.1%) |
| 40 to 44 Years | 138 (5.2%) | 119 (4.1%) |
| 45 to 49 Years | 160 (6.1%) | 172 (5.9%) |
| 50 to 54 Years | 148 (5.6%) | 92 (3.1%) |
| 55 to 59 Years | 50 (1.9%) | 144 (4.9%) |
| 60 to 64 Years | 101 (3.8%) | 191 (6.5%) |
| 65 to 69 Years | 94 (3.6%) | 140 (4.8%) |
| 70 to 74 Years | 83 (3.2%) | 74 (2.5%) |
| 75 to 79 Years | 53 (2.0%) | 113 (3.8%) |
| 80 to 84 Years | 10 (0.4%) | 30 (1.0%) |
| 85 Years and over | 76 (2.9%) | 35 (1.2%) |
| Total | 2,632 (100.0%) | 2,936 (100.0%) |
Families and Households in Greenville borough
Median Family Size in Greenville borough
The median family size in Greenville borough is 3.15 persons per family, with married-couple families (791 | 68.8%) accounting for the largest median family size of 3.22 persons per family. On the other hand, single female/mother families (214 | 18.6%) represent the smallest median family size with 2.97 persons per family.
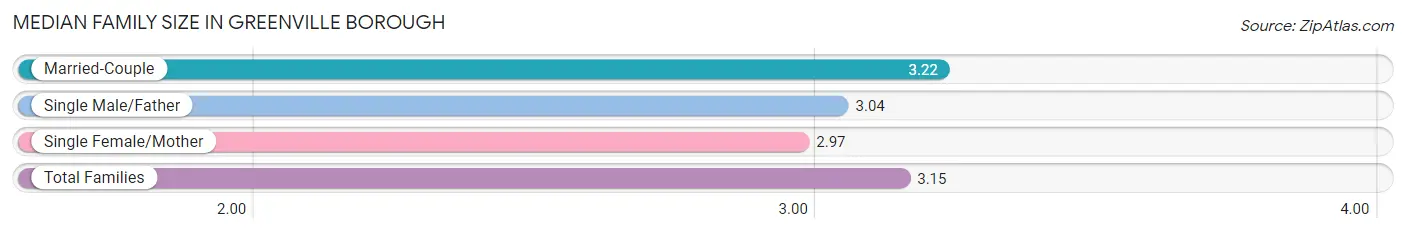
| Family Type | # Families | Family Size |
| Married-Couple | 791 (68.8%) | 3.22 |
| Single Male/Father | 145 (12.6%) | 3.04 |
| Single Female/Mother | 214 (18.6%) | 2.97 |
| Total Families | 1,150 (100.0%) | 3.15 |
Median Household Size in Greenville borough
The median household size in Greenville borough is 2.38 persons per household, with single male/father households (145 | 7.3%) accounting for the largest median household size of 3.54 persons per household. non-family households (842 | 42.3%) represent the smallest median household size with 1.18 persons per household.
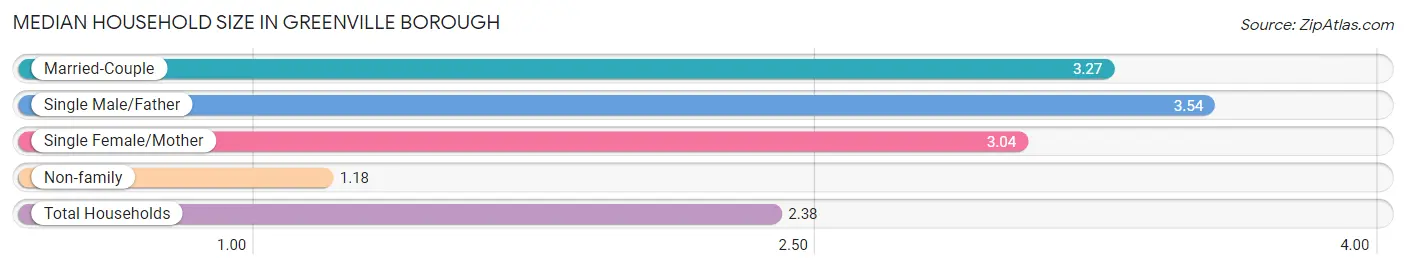
| Household Type | # Households | Household Size |
| Married-Couple | 791 (39.7%) | 3.27 |
| Single Male/Father | 145 (7.3%) | 3.54 |
| Single Female/Mother | 214 (10.7%) | 3.04 |
| Non-family | 842 (42.3%) | 1.18 |
| Total Households | 1,992 (100.0%) | 2.38 |
Household Size by Marriage Status in Greenville borough
Out of a total of 1,992 households in Greenville borough, 1,150 (57.7%) are family households, while 842 (42.3%) are nonfamily households. The most numerous type of family households are 2-person households, comprising 461, and the most common type of nonfamily households are 1-person households, comprising 728.
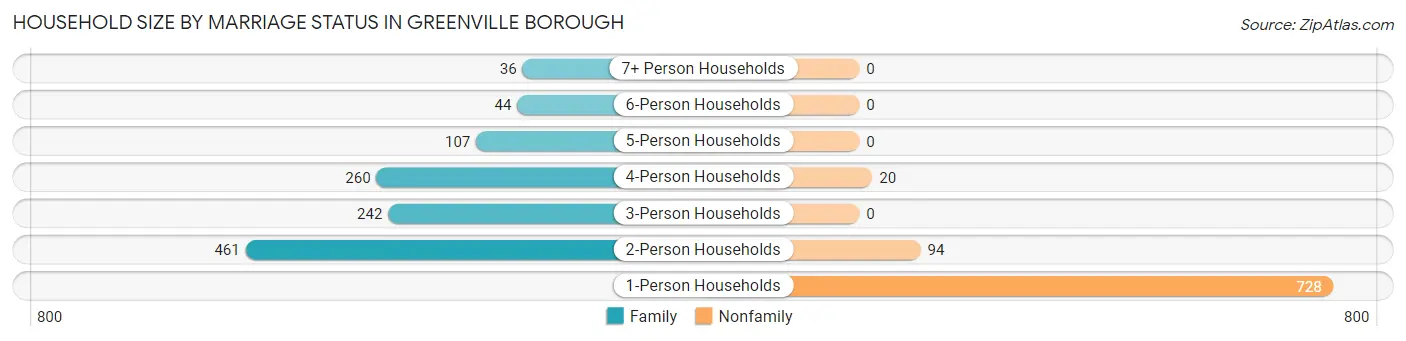
| Household Size | Family Households | Nonfamily Households |
| 1-Person Households | - | 728 (36.5%) |
| 2-Person Households | 461 (23.1%) | 94 (4.7%) |
| 3-Person Households | 242 (12.1%) | 0 (0.0%) |
| 4-Person Households | 260 (13.1%) | 20 (1.0%) |
| 5-Person Households | 107 (5.4%) | 0 (0.0%) |
| 6-Person Households | 44 (2.2%) | 0 (0.0%) |
| 7+ Person Households | 36 (1.8%) | 0 (0.0%) |
| Total | 1,150 (57.7%) | 842 (42.3%) |
Female Fertility in Greenville borough
Fertility by Age in Greenville borough
Average fertility rate in Greenville borough is 59.0 births per 1,000 women. Women in the age bracket of 20 to 34 years have the highest fertility rate with 109.0 births per 1,000 women. Women in the age bracket of 20 to 34 years acount for 100.0% of all women with births.
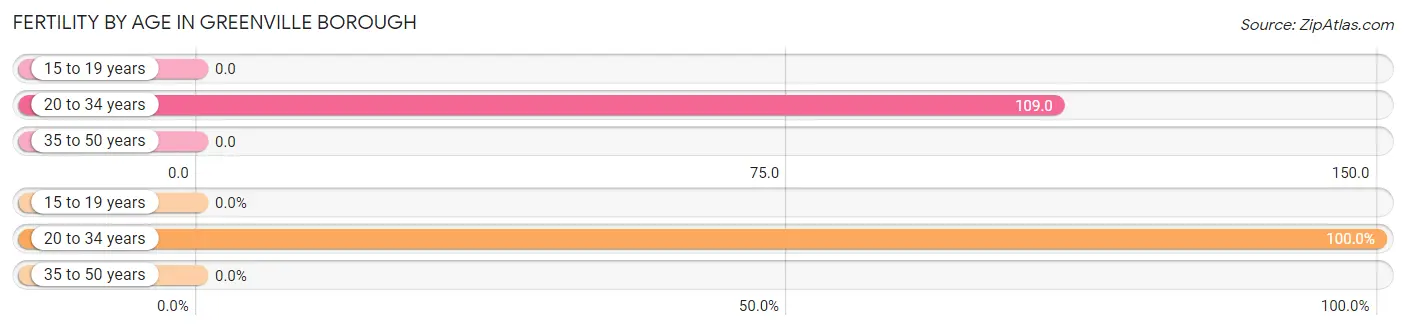
| Age Bracket | Women with Births | Births / 1,000 Women |
| 15 to 19 years | 0 (0.0%) | 0.0 |
| 20 to 34 years | 92 (100.0%) | 109.0 |
| 35 to 50 years | 0 (0.0%) | 0.0 |
| Total | 92 (100.0%) | 59.0 |
Fertility by Age by Marriage Status in Greenville borough
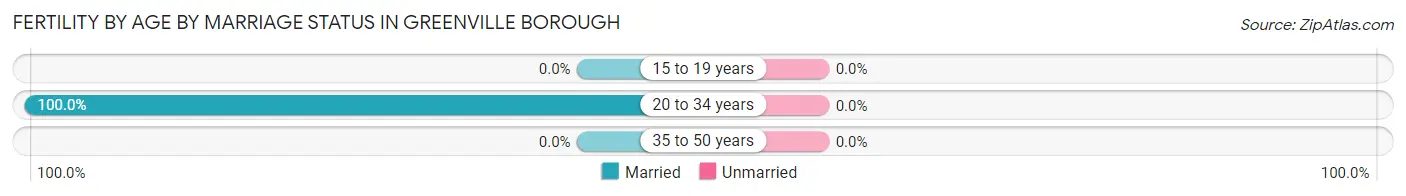
| Age Bracket | Married | Unmarried |
| 15 to 19 years | 0 (0.0%) | 0 (0.0%) |
| 20 to 34 years | 92 (100.0%) | 0 (0.0%) |
| 35 to 50 years | 0 (0.0%) | 0 (0.0%) |
| Total | 92 (100.0%) | 0 (0.0%) |
Fertility by Education in Greenville borough
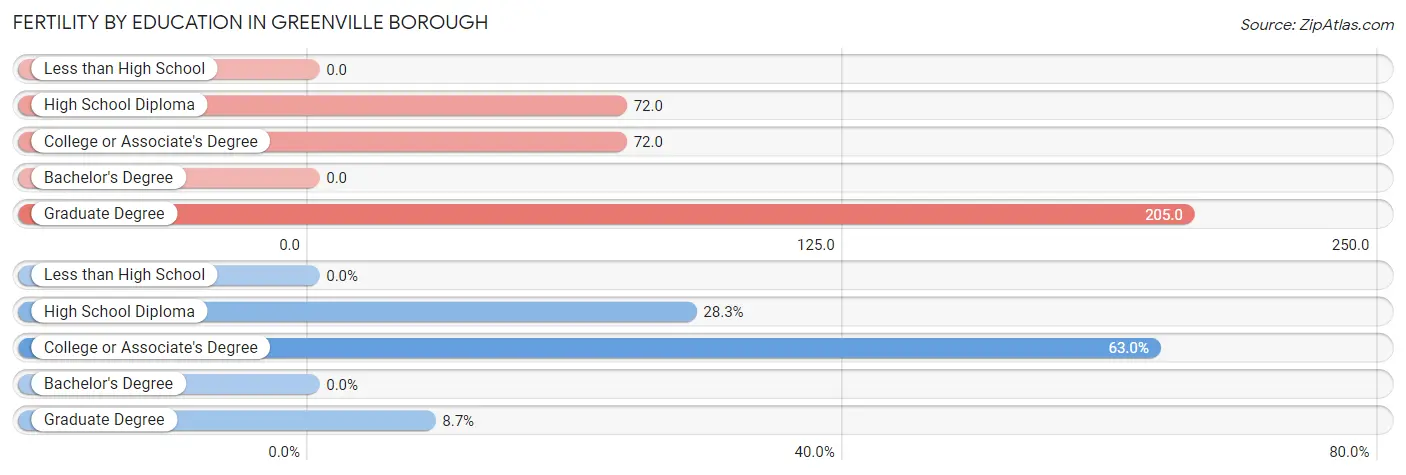
| Educational Attainment | Women with Births | Births / 1,000 Women |
| Less than High School | 0 (0.0%) | 0.0 |
| High School Diploma | 26 (28.3%) | 72.0 |
| College or Associate's Degree | 58 (63.0%) | 72.0 |
| Bachelor's Degree | 0 (0.0%) | 0.0 |
| Graduate Degree | 8 (8.7%) | 205.0 |
| Total | 92 (100.0%) | 59.0 |
Fertility by Education by Marriage Status in Greenville borough
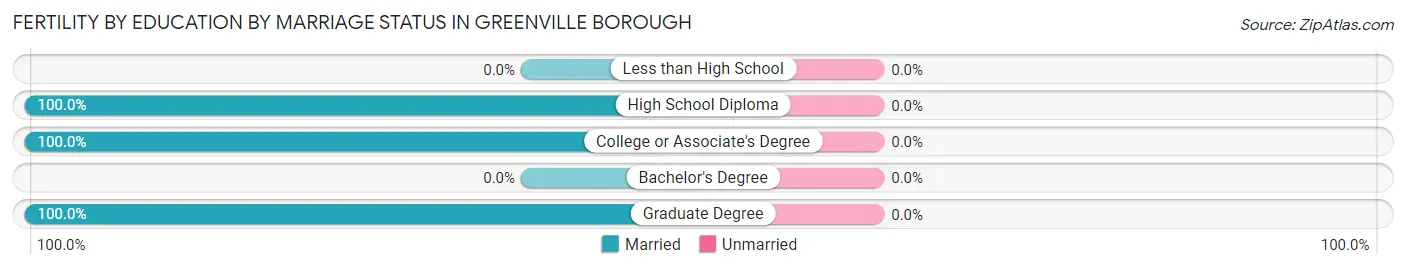
| Educational Attainment | Married | Unmarried |
| Less than High School | 0 (0.0%) | 0 (0.0%) |
| High School Diploma | 26 (100.0%) | 0 (0.0%) |
| College or Associate's Degree | 58 (100.0%) | 0 (0.0%) |
| Bachelor's Degree | 0 (0.0%) | 0 (0.0%) |
| Graduate Degree | 8 (100.0%) | 0 (0.0%) |
| Total | 92 (100.0%) | 0 (0.0%) |
Employment Characteristics in Greenville borough
Employment by Class of Employer in Greenville borough
Among the 2,529 employed individuals in Greenville borough, private company employees (1,587 | 62.7%), not-for-profit organizations (417 | 16.5%), and local government employees (195 | 7.7%) make up the most common classes of employment.
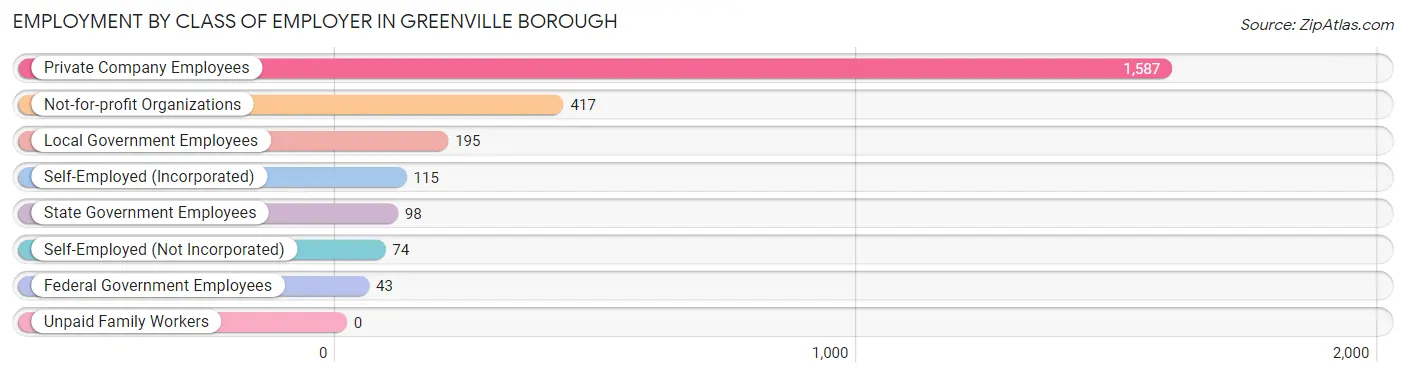
| Employer Class | # Employees | % Employees |
| Private Company Employees | 1,587 | 62.7% |
| Self-Employed (Incorporated) | 115 | 4.5% |
| Self-Employed (Not Incorporated) | 74 | 2.9% |
| Not-for-profit Organizations | 417 | 16.5% |
| Local Government Employees | 195 | 7.7% |
| State Government Employees | 98 | 3.9% |
| Federal Government Employees | 43 | 1.7% |
| Unpaid Family Workers | 0 | 0.0% |
| Total | 2,529 | 100.0% |
Employment Status by Age in Greenville borough
According to the labor force statistics for Greenville borough, out of the total population over 16 years of age (4,364), 62.4% or 2,723 individuals are in the labor force, with 2.8% or 76 of them unemployed. The age group with the highest labor force participation rate is 35 to 44 years, with 93.9% or 448 individuals in the labor force. Within the labor force, the 16 to 19 years age range has the highest percentage of unemployed individuals, with 17.0% or 41 of them being unemployed.
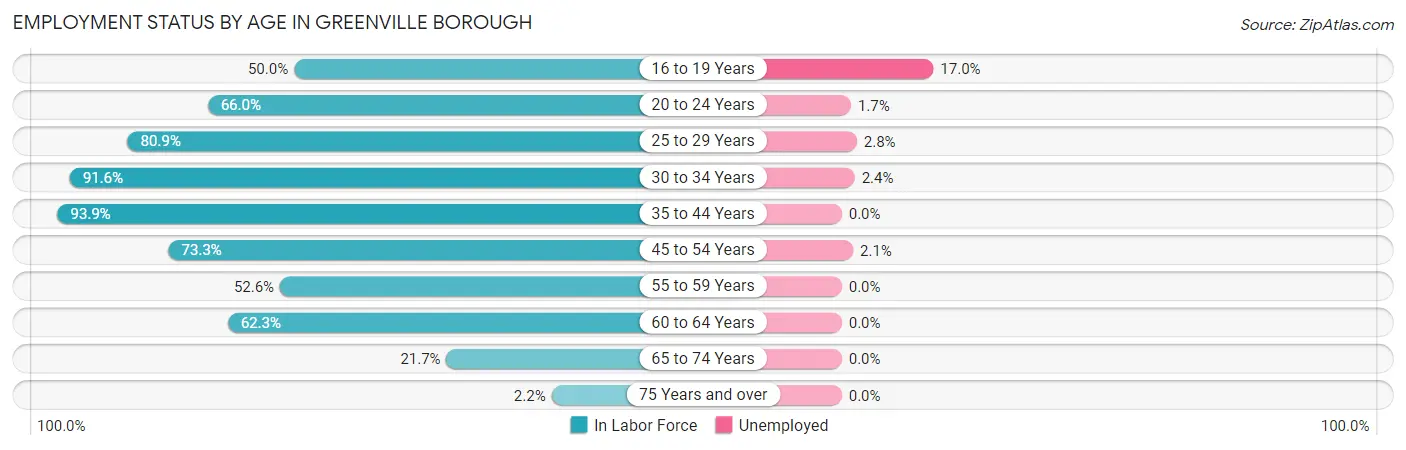
| Age Bracket | In Labor Force | Unemployed |
| 16 to 19 Years | 241 (50.0%) | 41 (17.0%) |
| 20 to 24 Years | 583 (66.0%) | 10 (1.7%) |
| 25 to 29 Years | 283 (80.9%) | 8 (2.8%) |
| 30 to 34 Years | 372 (91.6%) | 9 (2.4%) |
| 35 to 44 Years | 448 (93.9%) | 0 (0.0%) |
| 45 to 54 Years | 419 (73.3%) | 9 (2.1%) |
| 55 to 59 Years | 102 (52.6%) | 0 (0.0%) |
| 60 to 64 Years | 182 (62.3%) | 0 (0.0%) |
| 65 to 74 Years | 85 (21.7%) | 0 (0.0%) |
| 75 Years and over | 7 (2.2%) | 0 (0.0%) |
| Total | 2,723 (62.4%) | 76 (2.8%) |
Employment Status by Educational Attainment in Greenville borough
According to labor force statistics for Greenville borough, 78.8% of individuals (1,805) out of the total population between 25 and 64 years of age (2,291) are in the labor force, with 1.4% or 25 of them being unemployed. The group with the highest labor force participation rate are those with the educational attainment of bachelor's degree or higher, with 93.2% or 606 individuals in the labor force. Within the labor force, individuals with college / associate degree education have the highest percentage of unemployment, with 3.0% or 18 of them being unemployed.
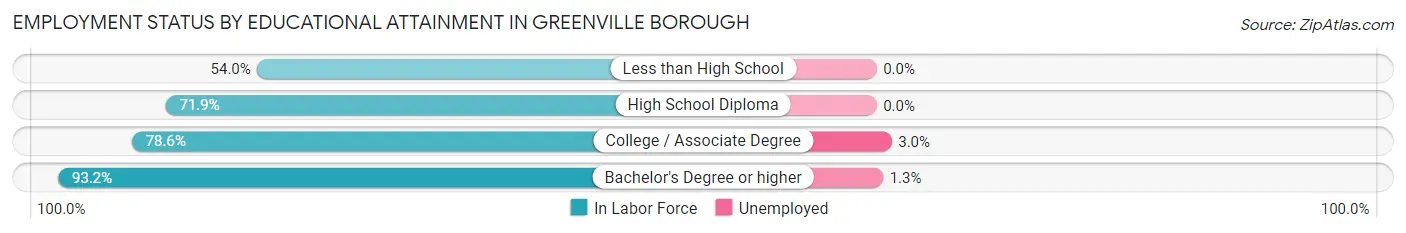
| Educational Attainment | In Labor Force | Unemployed |
| Less than High School | 94 (54.0%) | 0 (0.0%) |
| High School Diploma | 504 (71.9%) | 0 (0.0%) |
| College / Associate Degree | 602 (78.6%) | 23 (3.0%) |
| Bachelor's Degree or higher | 606 (93.2%) | 8 (1.3%) |
| Total | 1,805 (78.8%) | 32 (1.4%) |
Employment Occupations by Sex in Greenville borough
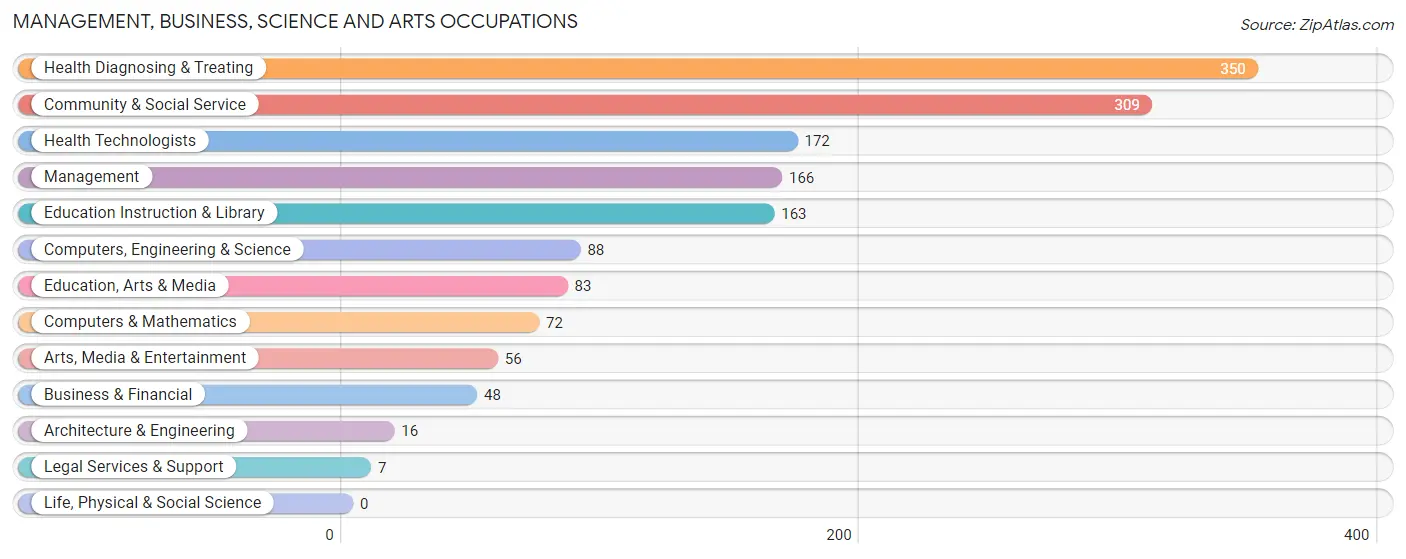
Management, Business, Science and Arts Occupations
The most common Management, Business, Science and Arts occupations in Greenville borough are Health Diagnosing & Treating (350 | 13.3%), Community & Social Service (309 | 11.7%), Health Technologists (172 | 6.5%), Management (166 | 6.3%), and Education Instruction & Library (163 | 6.2%).
Management, Business, Science and Arts Occupations by Sex
Within the Management, Business, Science and Arts occupations in Greenville borough, the most male-oriented occupations are Computers, Engineering & Science (100.0%), Computers & Mathematics (100.0%), and Architecture & Engineering (100.0%), while the most female-oriented occupations are Health Technologists (86.1%), Education Instruction & Library (85.9%), and Arts, Media & Entertainment (85.7%).
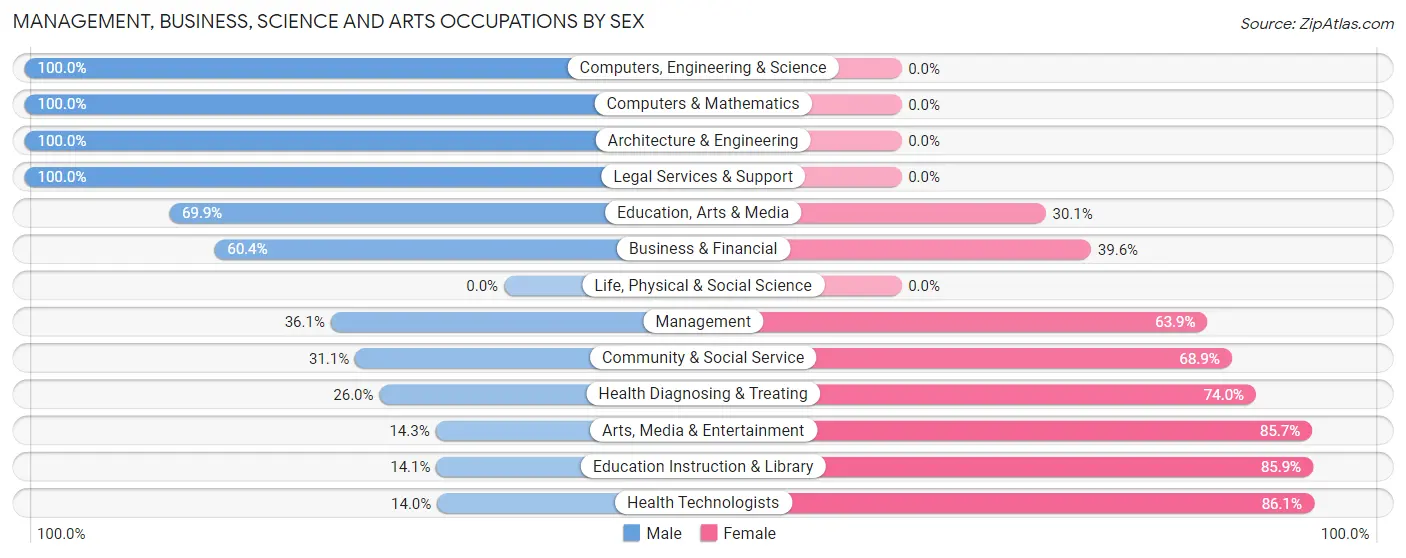
| Occupation | Male | Female |
| Management | 60 (36.1%) | 106 (63.9%) |
| Business & Financial | 29 (60.4%) | 19 (39.6%) |
| Computers, Engineering & Science | 88 (100.0%) | 0 (0.0%) |
| Computers & Mathematics | 72 (100.0%) | 0 (0.0%) |
| Architecture & Engineering | 16 (100.0%) | 0 (0.0%) |
| Life, Physical & Social Science | 0 (0.0%) | 0 (0.0%) |
| Community & Social Service | 96 (31.1%) | 213 (68.9%) |
| Education, Arts & Media | 58 (69.9%) | 25 (30.1%) |
| Legal Services & Support | 7 (100.0%) | 0 (0.0%) |
| Education Instruction & Library | 23 (14.1%) | 140 (85.9%) |
| Arts, Media & Entertainment | 8 (14.3%) | 48 (85.7%) |
| Health Diagnosing & Treating | 91 (26.0%) | 259 (74.0%) |
| Health Technologists | 24 (14.0%) | 148 (86.1%) |
| Total (Category) | 364 (37.9%) | 597 (62.1%) |
| Total (Overall) | 1,272 (48.2%) | 1,366 (51.8%) |
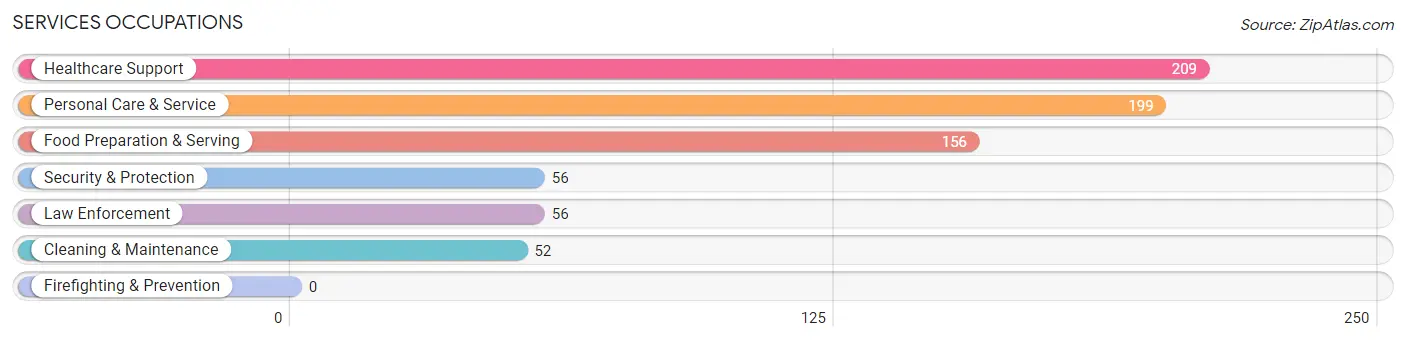
Services Occupations
The most common Services occupations in Greenville borough are Healthcare Support (209 | 7.9%), Personal Care & Service (199 | 7.5%), Food Preparation & Serving (156 | 5.9%), Security & Protection (56 | 2.1%), and Law Enforcement (56 | 2.1%).
Services Occupations by Sex
Within the Services occupations in Greenville borough, the most male-oriented occupations are Personal Care & Service (50.7%), Cleaning & Maintenance (30.8%), and Food Preparation & Serving (26.9%), while the most female-oriented occupations are Security & Protection (85.7%), Law Enforcement (85.7%), and Healthcare Support (81.3%).
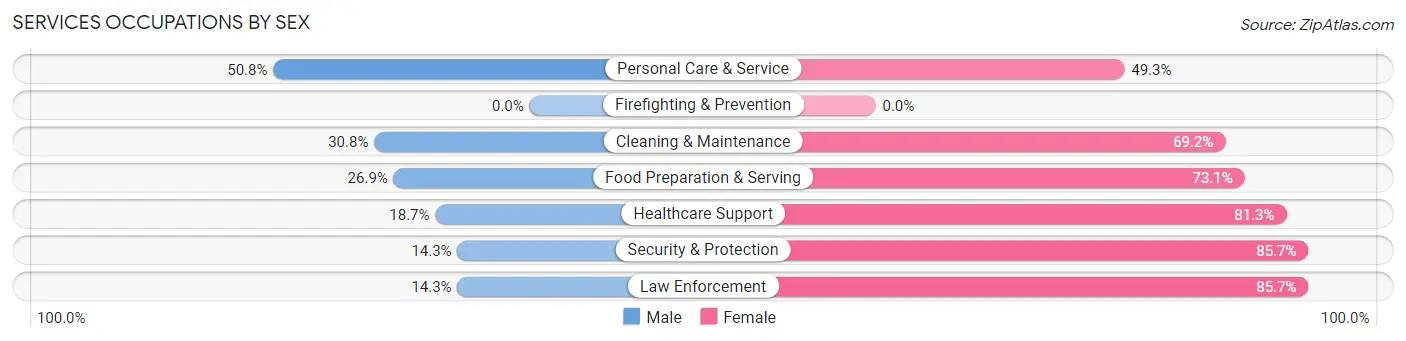
| Occupation | Male | Female |
| Healthcare Support | 39 (18.7%) | 170 (81.3%) |
| Security & Protection | 8 (14.3%) | 48 (85.7%) |
| Firefighting & Prevention | 0 (0.0%) | 0 (0.0%) |
| Law Enforcement | 8 (14.3%) | 48 (85.7%) |
| Food Preparation & Serving | 42 (26.9%) | 114 (73.1%) |
| Cleaning & Maintenance | 16 (30.8%) | 36 (69.2%) |
| Personal Care & Service | 101 (50.7%) | 98 (49.2%) |
| Total (Category) | 206 (30.6%) | 466 (69.4%) |
| Total (Overall) | 1,272 (48.2%) | 1,366 (51.8%) |
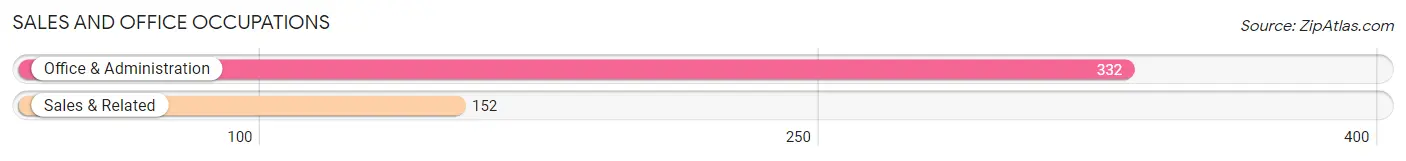
Sales and Office Occupations
The most common Sales and Office occupations in Greenville borough are Office & Administration (332 | 12.6%), and Sales & Related (152 | 5.8%).
Sales and Office Occupations by Sex
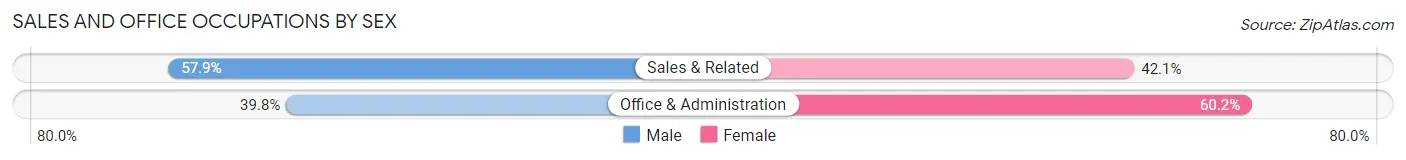
| Occupation | Male | Female |
| Sales & Related | 88 (57.9%) | 64 (42.1%) |
| Office & Administration | 132 (39.8%) | 200 (60.2%) |
| Total (Category) | 220 (45.5%) | 264 (54.5%) |
| Total (Overall) | 1,272 (48.2%) | 1,366 (51.8%) |
Natural Resources, Construction and Maintenance Occupations
The most common Natural Resources, Construction and Maintenance occupations in Greenville borough are Installation, Maintenance & Repair (75 | 2.8%), and Construction & Extraction (48 | 1.8%).

Natural Resources, Construction and Maintenance Occupations by Sex
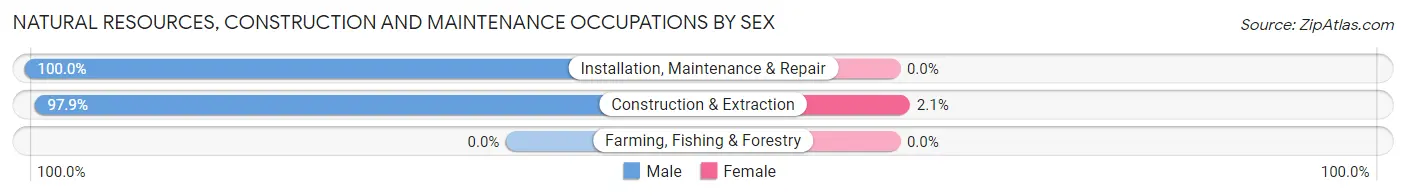
| Occupation | Male | Female |
| Farming, Fishing & Forestry | 0 (0.0%) | 0 (0.0%) |
| Construction & Extraction | 47 (97.9%) | 1 (2.1%) |
| Installation, Maintenance & Repair | 75 (100.0%) | 0 (0.0%) |
| Total (Category) | 122 (99.2%) | 1 (0.8%) |
| Total (Overall) | 1,272 (48.2%) | 1,366 (51.8%) |
Production, Transportation and Moving Occupations
The most common Production, Transportation and Moving occupations in Greenville borough are Material Moving (214 | 8.1%), Production (131 | 5.0%), and Transportation (53 | 2.0%).
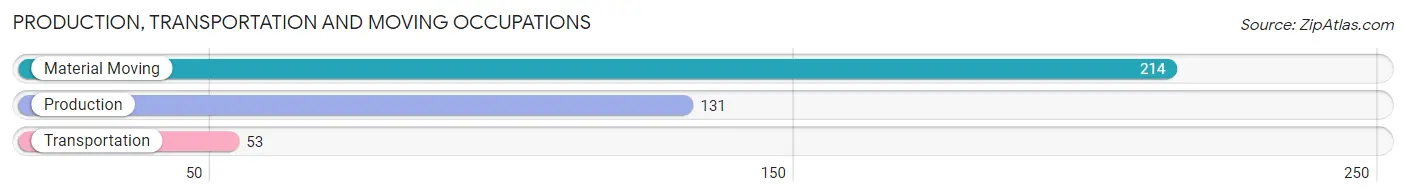
Production, Transportation and Moving Occupations by Sex
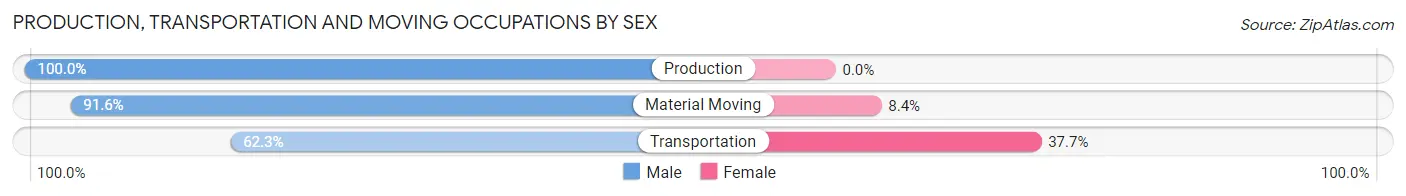
| Occupation | Male | Female |
| Production | 131 (100.0%) | 0 (0.0%) |
| Transportation | 33 (62.3%) | 20 (37.7%) |
| Material Moving | 196 (91.6%) | 18 (8.4%) |
| Total (Category) | 360 (90.4%) | 38 (9.6%) |
| Total (Overall) | 1,272 (48.2%) | 1,366 (51.8%) |
Employment Industries by Sex in Greenville borough
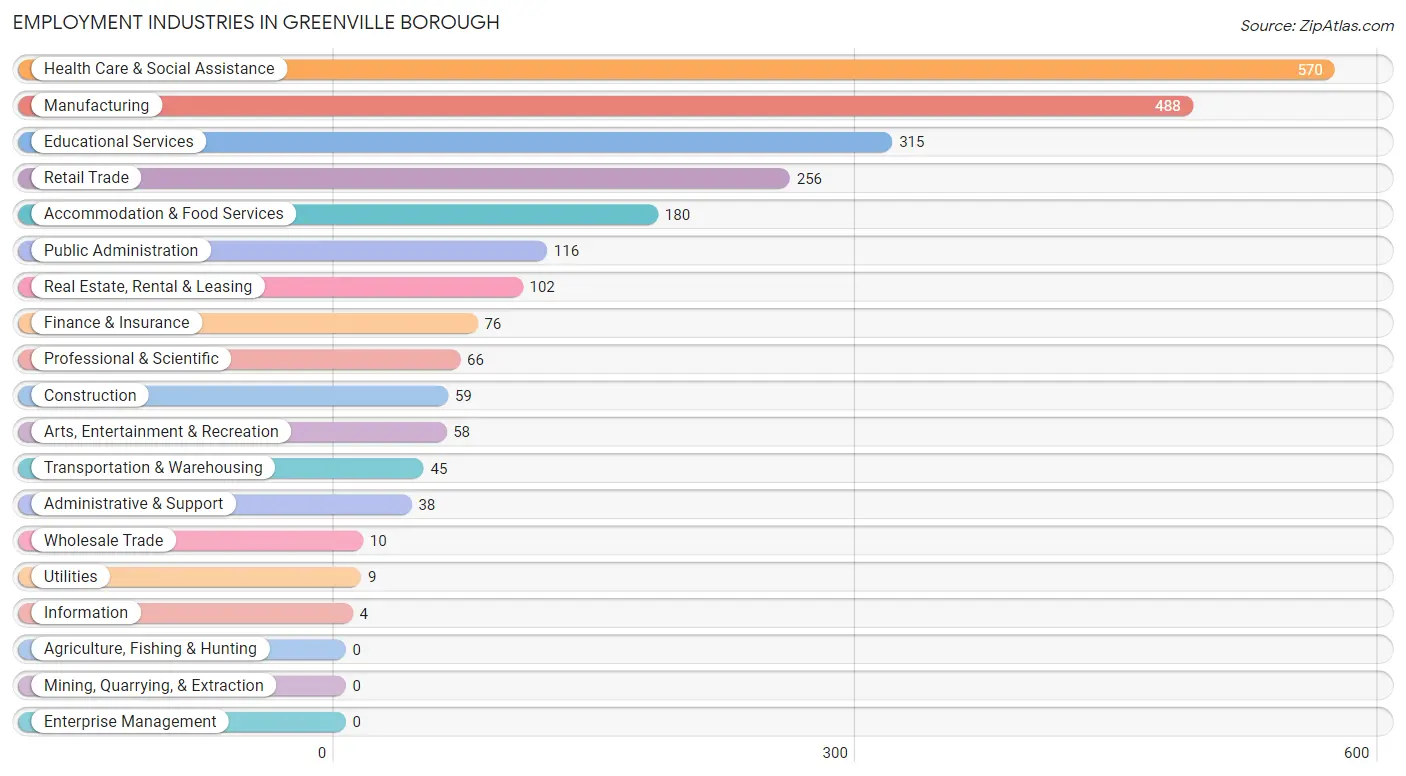
Employment Industries in Greenville borough
The major employment industries in Greenville borough include Health Care & Social Assistance (570 | 21.6%), Manufacturing (488 | 18.5%), Educational Services (315 | 11.9%), Retail Trade (256 | 9.7%), and Accommodation & Food Services (180 | 6.8%).
Employment Industries by Sex in Greenville borough
The Greenville borough industries that see more men than women are Transportation & Warehousing (100.0%), Utilities (100.0%), and Information (100.0%), whereas the industries that tend to have a higher number of women are Wholesale Trade (100.0%), Educational Services (81.3%), and Health Care & Social Assistance (77.7%).
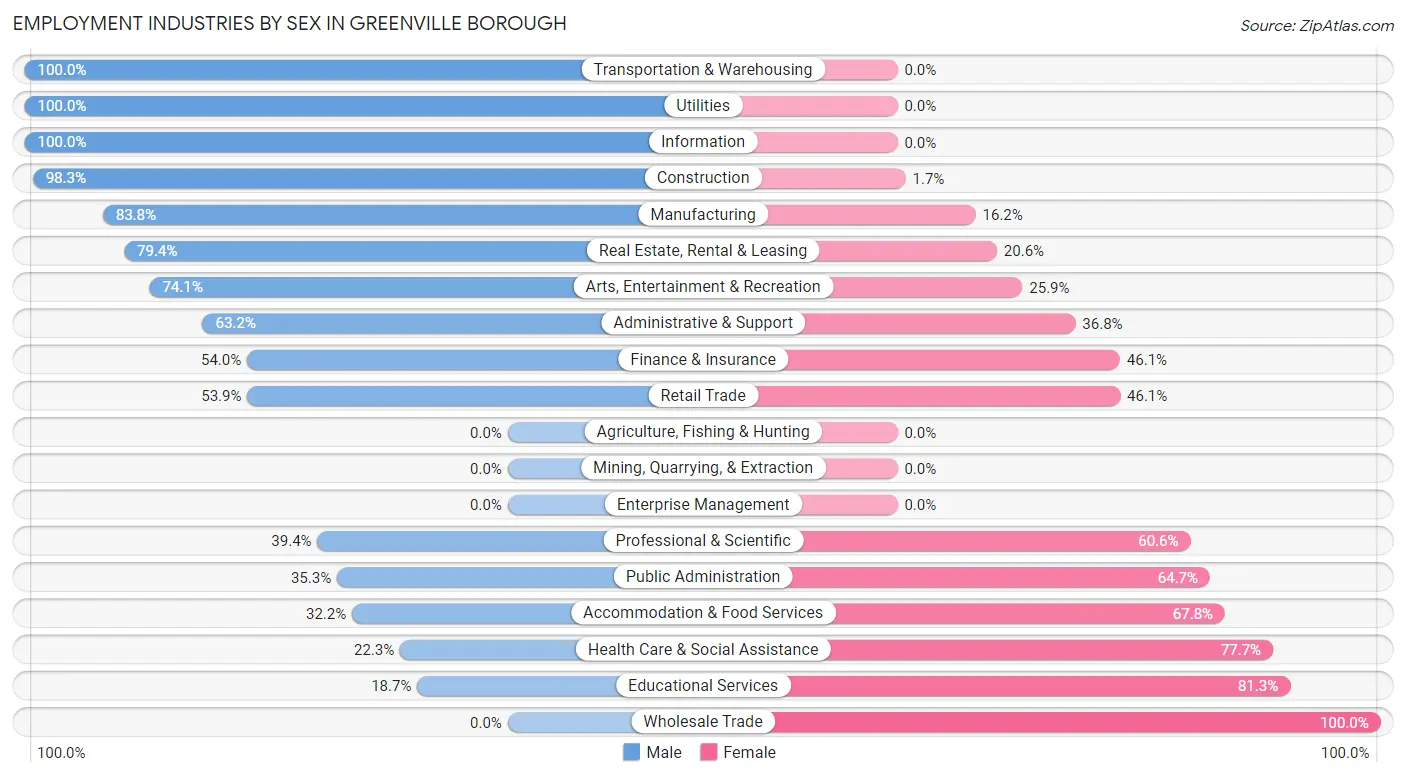
| Industry | Male | Female |
| Agriculture, Fishing & Hunting | 0 (0.0%) | 0 (0.0%) |
| Mining, Quarrying, & Extraction | 0 (0.0%) | 0 (0.0%) |
| Construction | 58 (98.3%) | 1 (1.7%) |
| Manufacturing | 409 (83.8%) | 79 (16.2%) |
| Wholesale Trade | 0 (0.0%) | 10 (100.0%) |
| Retail Trade | 138 (53.9%) | 118 (46.1%) |
| Transportation & Warehousing | 45 (100.0%) | 0 (0.0%) |
| Utilities | 9 (100.0%) | 0 (0.0%) |
| Information | 4 (100.0%) | 0 (0.0%) |
| Finance & Insurance | 41 (53.9%) | 35 (46.1%) |
| Real Estate, Rental & Leasing | 81 (79.4%) | 21 (20.6%) |
| Professional & Scientific | 26 (39.4%) | 40 (60.6%) |
| Enterprise Management | 0 (0.0%) | 0 (0.0%) |
| Administrative & Support | 24 (63.2%) | 14 (36.8%) |
| Educational Services | 59 (18.7%) | 256 (81.3%) |
| Health Care & Social Assistance | 127 (22.3%) | 443 (77.7%) |
| Arts, Entertainment & Recreation | 43 (74.1%) | 15 (25.9%) |
| Accommodation & Food Services | 58 (32.2%) | 122 (67.8%) |
| Public Administration | 41 (35.3%) | 75 (64.7%) |
| Total | 1,272 (48.2%) | 1,366 (51.8%) |
Education in Greenville borough
School Enrollment in Greenville borough
The most common levels of schooling among the 1,729 students in Greenville borough are college / undergraduate (888 | 51.4%), elementary school (335 | 19.4%), and high school (194 | 11.2%).
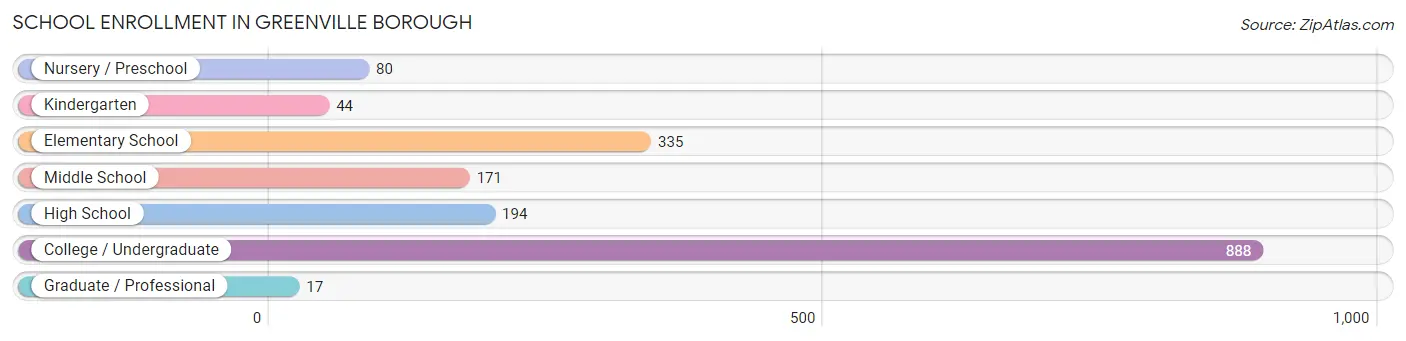
| School Level | # Students | % Students |
| Nursery / Preschool | 80 | 4.6% |
| Kindergarten | 44 | 2.5% |
| Elementary School | 335 | 19.4% |
| Middle School | 171 | 9.9% |
| High School | 194 | 11.2% |
| College / Undergraduate | 888 | 51.4% |
| Graduate / Professional | 17 | 1.0% |
| Total | 1,729 | 100.0% |
School Enrollment by Age by Funding Source in Greenville borough
Out of a total of 1,729 students who are enrolled in schools in Greenville borough, 813 (47.0%) attend a private institution, while the remaining 916 (53.0%) are enrolled in public schools. The age group of 20 to 24 year olds has the highest likelihood of being enrolled in private schools, with 495 (89.5% in the age bracket) enrolled. Conversely, the age group of 5 to 9 year old has the lowest likelihood of being enrolled in a private school, with 379 (100.0% in the age bracket) attending a public institution.
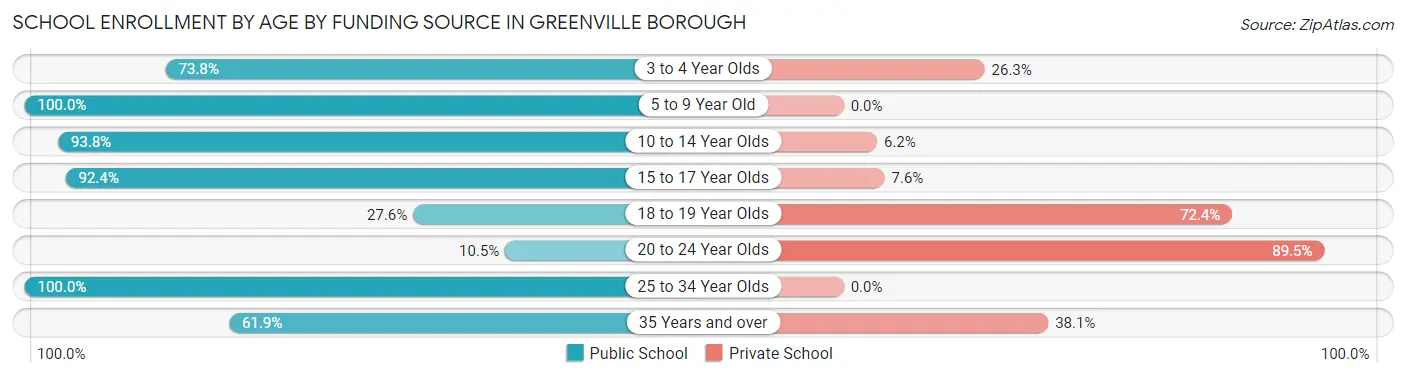
| Age Bracket | Public School | Private School |
| 3 to 4 Year Olds | 59 (73.8%) | 21 (26.3%) |
| 5 to 9 Year Old | 379 (100.0%) | 0 (0.0%) |
| 10 to 14 Year Olds | 166 (93.8%) | 11 (6.2%) |
| 15 to 17 Year Olds | 97 (92.4%) | 8 (7.6%) |
| 18 to 19 Year Olds | 97 (27.6%) | 254 (72.4%) |
| 20 to 24 Year Olds | 58 (10.5%) | 495 (89.5%) |
| 25 to 34 Year Olds | 21 (100.0%) | 0 (0.0%) |
| 35 Years and over | 39 (61.9%) | 24 (38.1%) |
| Total | 916 (53.0%) | 813 (47.0%) |
Educational Attainment by Field of Study in Greenville borough
Arts & humanities (155 | 17.7%), education (131 | 15.0%), business (108 | 12.3%), psychology (97 | 11.1%), and liberal arts & history (77 | 8.8%) are the most common fields of study among 875 individuals in Greenville borough who have obtained a bachelor's degree or higher.
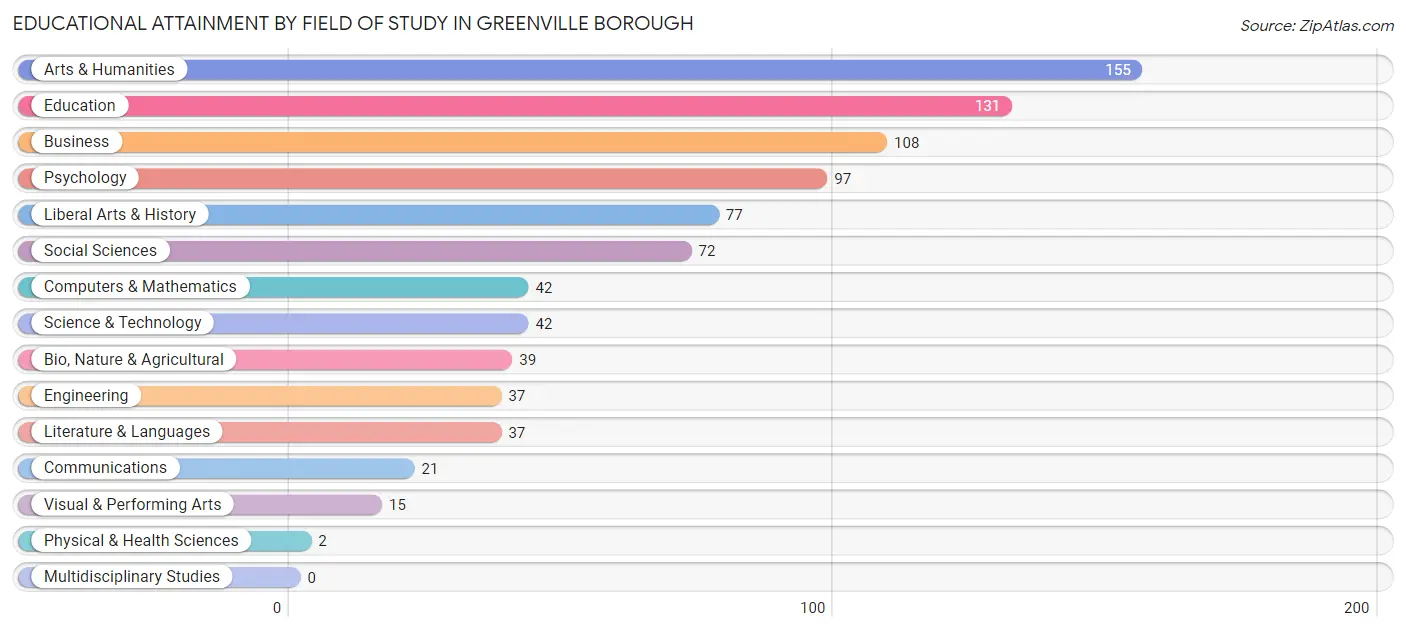
| Field of Study | # Graduates | % Graduates |
| Computers & Mathematics | 42 | 4.8% |
| Bio, Nature & Agricultural | 39 | 4.5% |
| Physical & Health Sciences | 2 | 0.2% |
| Psychology | 97 | 11.1% |
| Social Sciences | 72 | 8.2% |
| Engineering | 37 | 4.2% |
| Multidisciplinary Studies | 0 | 0.0% |
| Science & Technology | 42 | 4.8% |
| Business | 108 | 12.3% |
| Education | 131 | 15.0% |
| Literature & Languages | 37 | 4.2% |
| Liberal Arts & History | 77 | 8.8% |
| Visual & Performing Arts | 15 | 1.7% |
| Communications | 21 | 2.4% |
| Arts & Humanities | 155 | 17.7% |
| Total | 875 | 100.0% |
Transportation & Commute in Greenville borough
Vehicle Availability by Sex in Greenville borough
The most prevalent vehicle ownership categories in Greenville borough are males with 2 vehicles (494, accounting for 46.0%) and females with 2 vehicles (635, making up 43.9%).
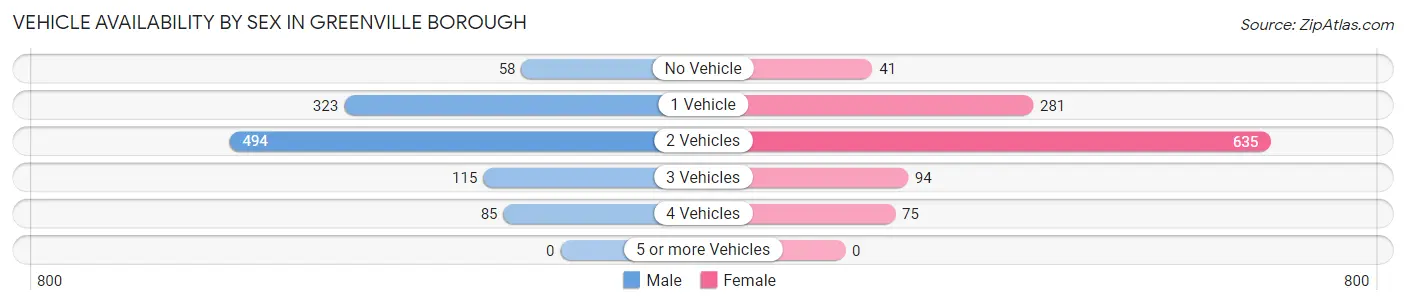
| Vehicles Available | Male | Female |
| No Vehicle | 58 (5.4%) | 41 (3.6%) |
| 1 Vehicle | 323 (30.0%) | 281 (25.0%) |
| 2 Vehicles | 494 (46.0%) | 635 (56.4%) |
| 3 Vehicles | 115 (10.7%) | 94 (8.4%) |
| 4 Vehicles | 85 (7.9%) | 75 (6.7%) |
| 5 or more Vehicles | 0 (0.0%) | 0 (0.0%) |
| Total | 1,075 (100.0%) | 1,126 (100.0%) |
Commute Time in Greenville borough
The most frequently occuring commute durations in Greenville borough are 5 to 9 minutes (710 commuters, 29.9%), 10 to 14 minutes (376 commuters, 15.8%), and less than 5 minutes (264 commuters, 11.1%).
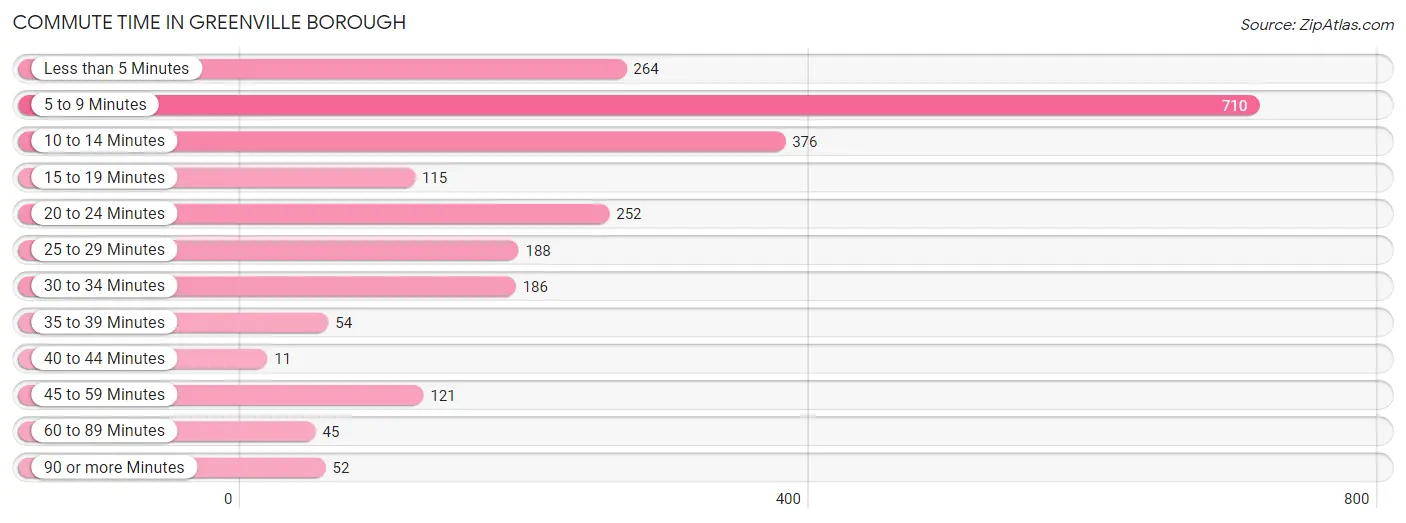
| Commute Time | # Commuters | % Commuters |
| Less than 5 Minutes | 264 | 11.1% |
| 5 to 9 Minutes | 710 | 29.9% |
| 10 to 14 Minutes | 376 | 15.8% |
| 15 to 19 Minutes | 115 | 4.8% |
| 20 to 24 Minutes | 252 | 10.6% |
| 25 to 29 Minutes | 188 | 7.9% |
| 30 to 34 Minutes | 186 | 7.8% |
| 35 to 39 Minutes | 54 | 2.3% |
| 40 to 44 Minutes | 11 | 0.5% |
| 45 to 59 Minutes | 121 | 5.1% |
| 60 to 89 Minutes | 45 | 1.9% |
| 90 or more Minutes | 52 | 2.2% |
Commute Time by Sex in Greenville borough
The most common commute times in Greenville borough are 5 to 9 minutes (323 commuters, 28.5%) for males and 5 to 9 minutes (387 commuters, 31.2%) for females.
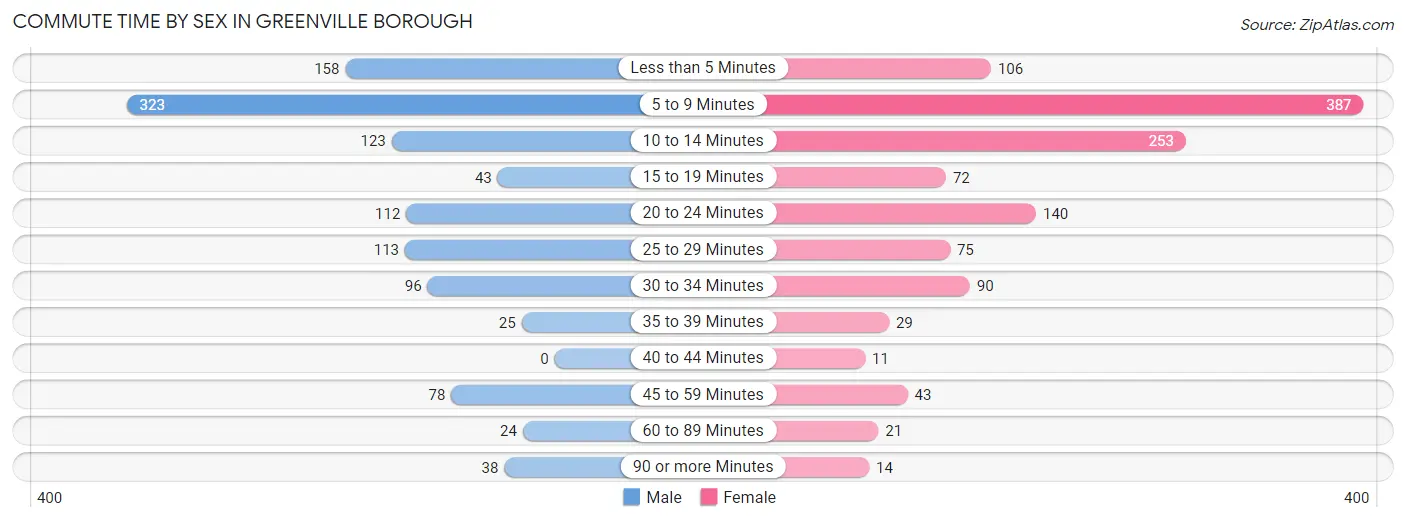
| Commute Time | Male | Female |
| Less than 5 Minutes | 158 (14.0%) | 106 (8.5%) |
| 5 to 9 Minutes | 323 (28.5%) | 387 (31.2%) |
| 10 to 14 Minutes | 123 (10.9%) | 253 (20.4%) |
| 15 to 19 Minutes | 43 (3.8%) | 72 (5.8%) |
| 20 to 24 Minutes | 112 (9.9%) | 140 (11.3%) |
| 25 to 29 Minutes | 113 (10.0%) | 75 (6.0%) |
| 30 to 34 Minutes | 96 (8.5%) | 90 (7.2%) |
| 35 to 39 Minutes | 25 (2.2%) | 29 (2.3%) |
| 40 to 44 Minutes | 0 (0.0%) | 11 (0.9%) |
| 45 to 59 Minutes | 78 (6.9%) | 43 (3.5%) |
| 60 to 89 Minutes | 24 (2.1%) | 21 (1.7%) |
| 90 or more Minutes | 38 (3.4%) | 14 (1.1%) |
Time of Departure to Work by Sex in Greenville borough
The most frequent times of departure to work in Greenville borough are 12:00 PM to 3:59 PM (189, 16.7%) for males and 7:30 AM to 7:59 AM (292, 23.5%) for females.
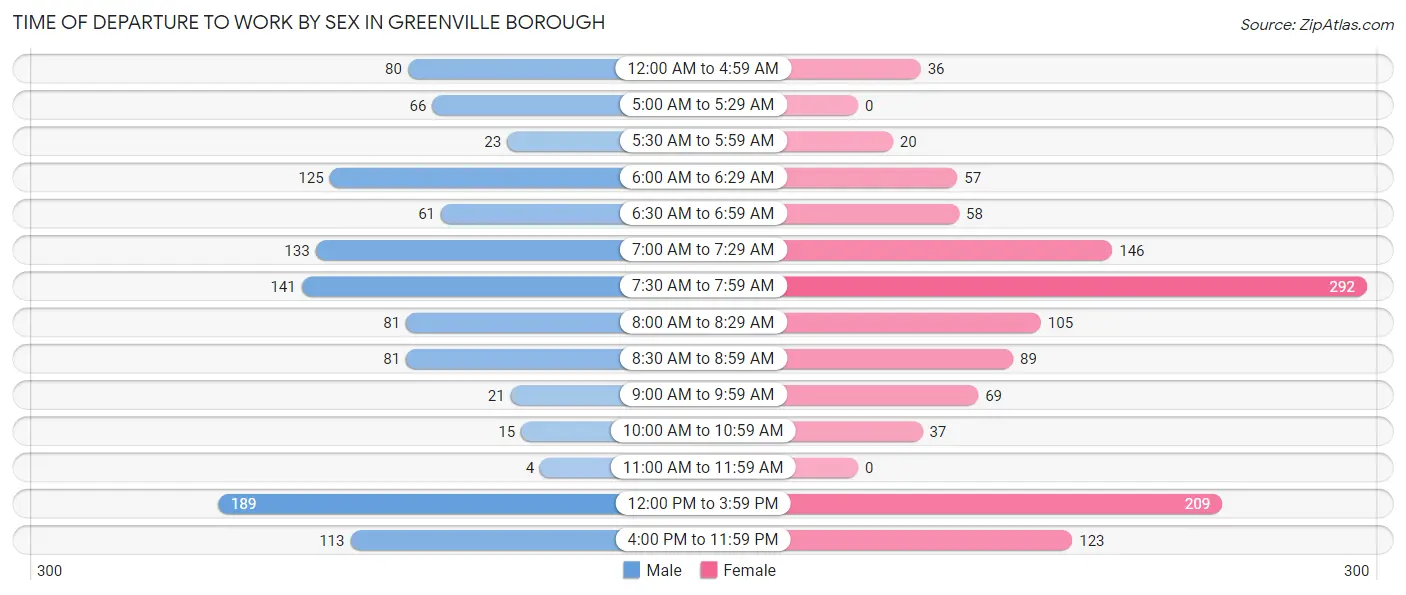
| Time of Departure | Male | Female |
| 12:00 AM to 4:59 AM | 80 (7.1%) | 36 (2.9%) |
| 5:00 AM to 5:29 AM | 66 (5.8%) | 0 (0.0%) |
| 5:30 AM to 5:59 AM | 23 (2.0%) | 20 (1.6%) |
| 6:00 AM to 6:29 AM | 125 (11.0%) | 57 (4.6%) |
| 6:30 AM to 6:59 AM | 61 (5.4%) | 58 (4.7%) |
| 7:00 AM to 7:29 AM | 133 (11.7%) | 146 (11.8%) |
| 7:30 AM to 7:59 AM | 141 (12.4%) | 292 (23.5%) |
| 8:00 AM to 8:29 AM | 81 (7.1%) | 105 (8.5%) |
| 8:30 AM to 8:59 AM | 81 (7.1%) | 89 (7.2%) |
| 9:00 AM to 9:59 AM | 21 (1.8%) | 69 (5.6%) |
| 10:00 AM to 10:59 AM | 15 (1.3%) | 37 (3.0%) |
| 11:00 AM to 11:59 AM | 4 (0.4%) | 0 (0.0%) |
| 12:00 PM to 3:59 PM | 189 (16.7%) | 209 (16.8%) |
| 4:00 PM to 11:59 PM | 113 (10.0%) | 123 (9.9%) |
| Total | 1,133 (100.0%) | 1,241 (100.0%) |
Housing Occupancy in Greenville borough
Occupancy by Ownership in Greenville borough
Of the total 1,992 dwellings in Greenville borough, owner-occupied units account for 1,140 (57.2%), while renter-occupied units make up 852 (42.8%).
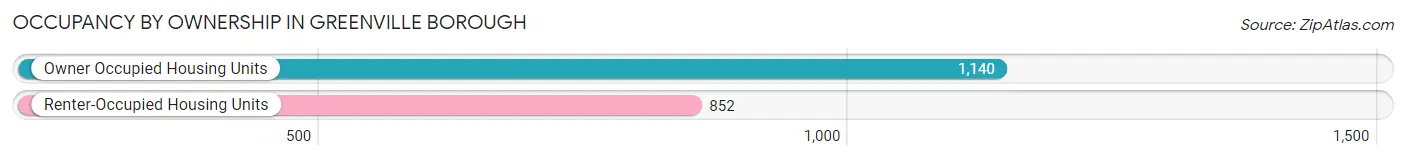
| Occupancy | # Housing Units | % Housing Units |
| Owner Occupied Housing Units | 1,140 | 57.2% |
| Renter-Occupied Housing Units | 852 | 42.8% |
| Total Occupied Housing Units | 1,992 | 100.0% |
Occupancy by Household Size in Greenville borough
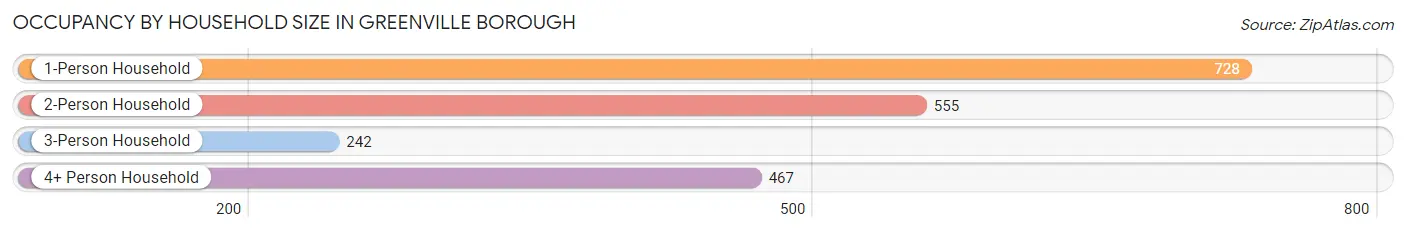
| Household Size | # Housing Units | % Housing Units |
| 1-Person Household | 728 | 36.5% |
| 2-Person Household | 555 | 27.9% |
| 3-Person Household | 242 | 12.1% |
| 4+ Person Household | 467 | 23.4% |
| Total Housing Units | 1,992 | 100.0% |
Occupancy by Ownership by Household Size in Greenville borough
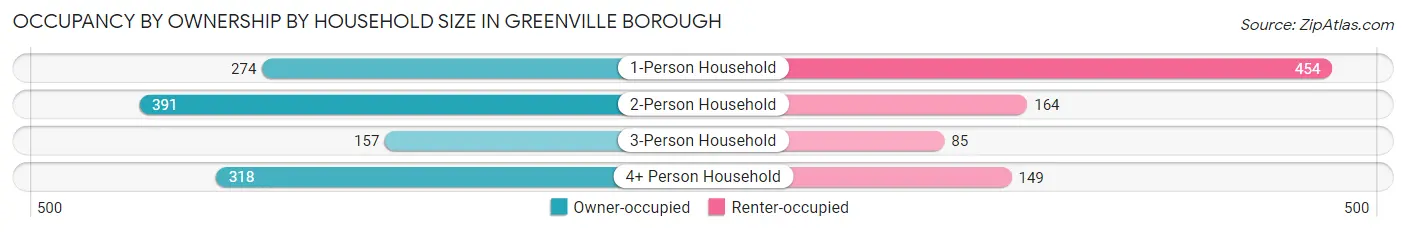
| Household Size | Owner-occupied | Renter-occupied |
| 1-Person Household | 274 (37.6%) | 454 (62.4%) |
| 2-Person Household | 391 (70.5%) | 164 (29.5%) |
| 3-Person Household | 157 (64.9%) | 85 (35.1%) |
| 4+ Person Household | 318 (68.1%) | 149 (31.9%) |
| Total Housing Units | 1,140 (57.2%) | 852 (42.8%) |
Occupancy by Educational Attainment in Greenville borough
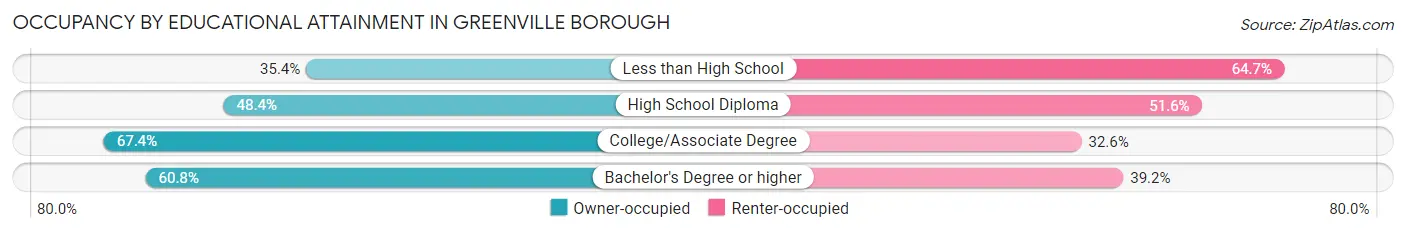
| Household Size | Owner-occupied | Renter-occupied |
| Less than High School | 35 (35.3%) | 64 (64.6%) |
| High School Diploma | 352 (48.4%) | 375 (51.6%) |
| College/Associate Degree | 449 (67.4%) | 217 (32.6%) |
| Bachelor's Degree or higher | 304 (60.8%) | 196 (39.2%) |
Occupancy by Age of Householder in Greenville borough
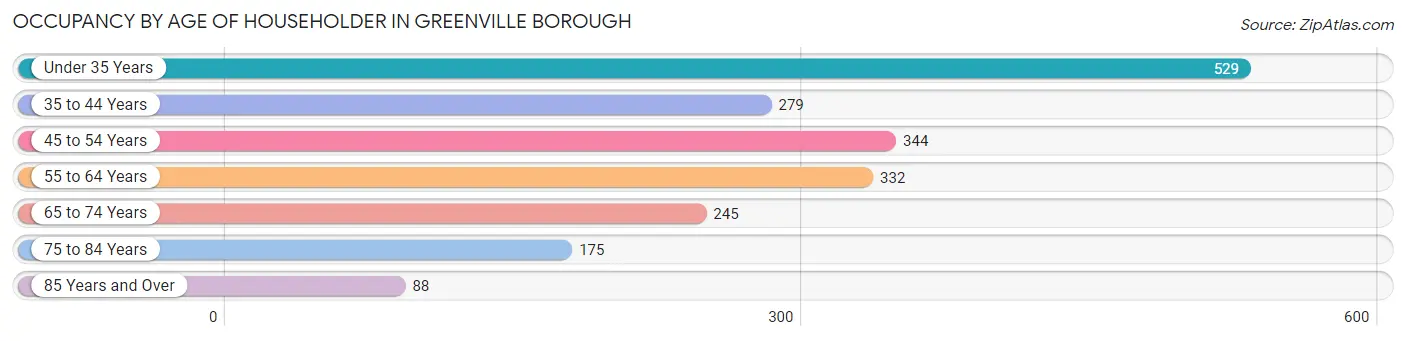
| Age Bracket | # Households | % Households |
| Under 35 Years | 529 | 26.6% |
| 35 to 44 Years | 279 | 14.0% |
| 45 to 54 Years | 344 | 17.3% |
| 55 to 64 Years | 332 | 16.7% |
| 65 to 74 Years | 245 | 12.3% |
| 75 to 84 Years | 175 | 8.8% |
| 85 Years and Over | 88 | 4.4% |
| Total | 1,992 | 100.0% |
Housing Finances in Greenville borough
Median Income by Occupancy in Greenville borough
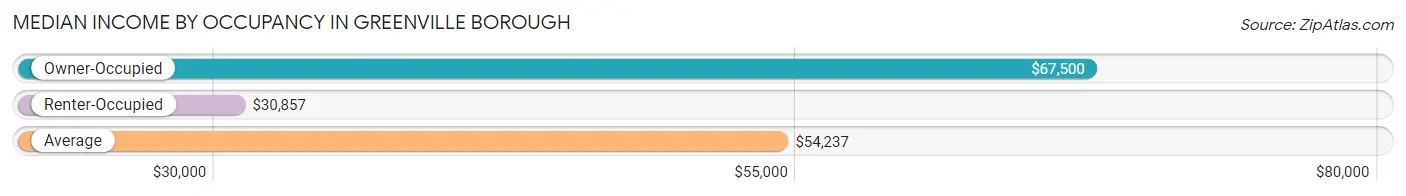
| Occupancy Type | # Households | Median Income |
| Owner-Occupied | 1,140 (57.2%) | $67,500 |
| Renter-Occupied | 852 (42.8%) | $30,857 |
| Average | 1,992 (100.0%) | $54,237 |
Occupancy by Householder Income Bracket in Greenville borough
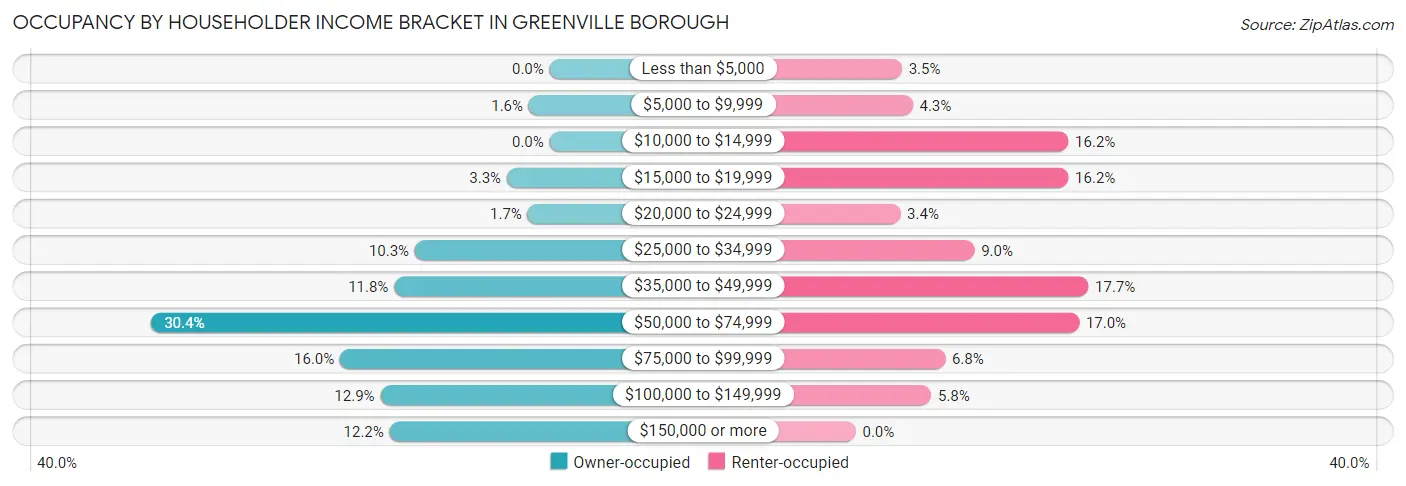
| Income Bracket | Owner-occupied | Renter-occupied |
| Less than $5,000 | 0 (0.0%) | 30 (3.5%) |
| $5,000 to $9,999 | 18 (1.6%) | 37 (4.3%) |
| $10,000 to $14,999 | 0 (0.0%) | 138 (16.2%) |
| $15,000 to $19,999 | 37 (3.3%) | 138 (16.2%) |
| $20,000 to $24,999 | 19 (1.7%) | 29 (3.4%) |
| $25,000 to $34,999 | 117 (10.3%) | 77 (9.0%) |
| $35,000 to $49,999 | 135 (11.8%) | 151 (17.7%) |
| $50,000 to $74,999 | 346 (30.3%) | 145 (17.0%) |
| $75,000 to $99,999 | 182 (16.0%) | 58 (6.8%) |
| $100,000 to $149,999 | 147 (12.9%) | 49 (5.8%) |
| $150,000 or more | 139 (12.2%) | 0 (0.0%) |
| Total | 1,140 (100.0%) | 852 (100.0%) |
Monthly Housing Cost Tiers in Greenville borough
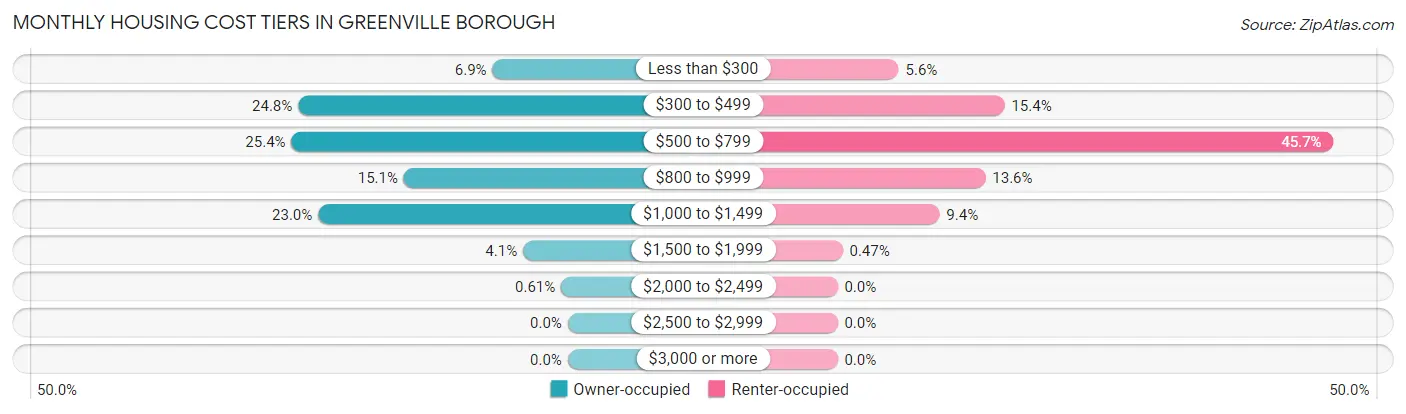
| Monthly Cost | Owner-occupied | Renter-occupied |
| Less than $300 | 79 (6.9%) | 48 (5.6%) |
| $300 to $499 | 283 (24.8%) | 131 (15.4%) |
| $500 to $799 | 290 (25.4%) | 389 (45.7%) |
| $800 to $999 | 172 (15.1%) | 116 (13.6%) |
| $1,000 to $1,499 | 262 (23.0%) | 80 (9.4%) |
| $1,500 to $1,999 | 47 (4.1%) | 4 (0.5%) |
| $2,000 to $2,499 | 7 (0.6%) | 0 (0.0%) |
| $2,500 to $2,999 | 0 (0.0%) | 0 (0.0%) |
| $3,000 or more | 0 (0.0%) | 0 (0.0%) |
| Total | 1,140 (100.0%) | 852 (100.0%) |
Physical Housing Characteristics in Greenville borough
Housing Structures in Greenville borough
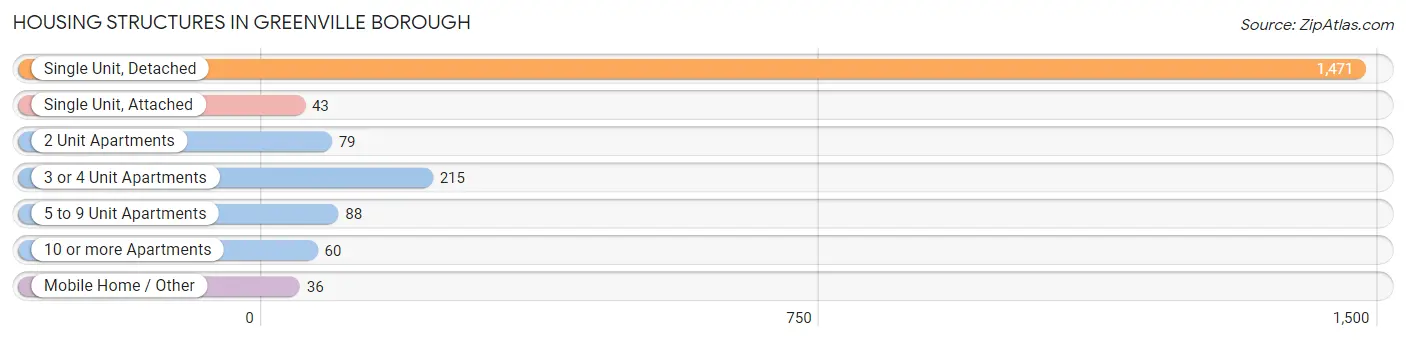
| Structure Type | # Housing Units | % Housing Units |
| Single Unit, Detached | 1,471 | 73.9% |
| Single Unit, Attached | 43 | 2.2% |
| 2 Unit Apartments | 79 | 4.0% |
| 3 or 4 Unit Apartments | 215 | 10.8% |
| 5 to 9 Unit Apartments | 88 | 4.4% |
| 10 or more Apartments | 60 | 3.0% |
| Mobile Home / Other | 36 | 1.8% |
| Total | 1,992 | 100.0% |
Housing Structures by Occupancy in Greenville borough
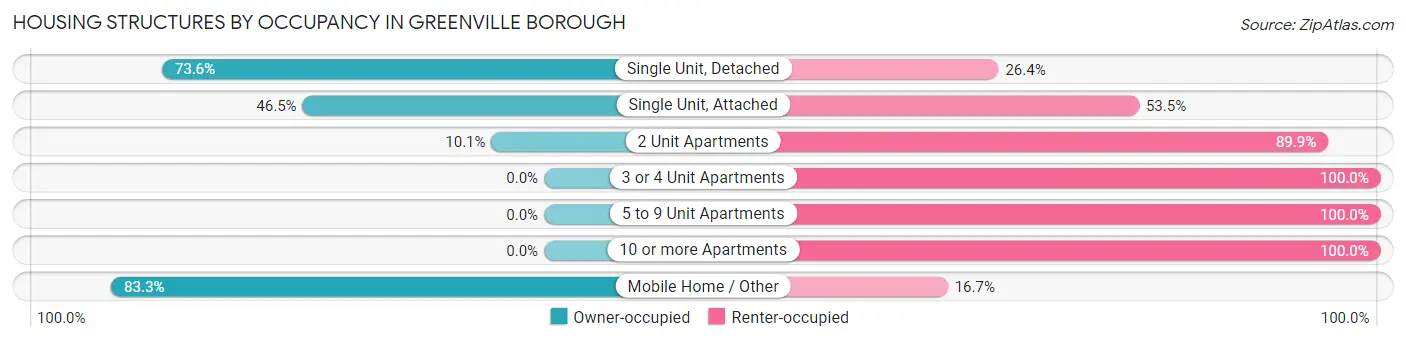
| Structure Type | Owner-occupied | Renter-occupied |
| Single Unit, Detached | 1,082 (73.6%) | 389 (26.4%) |
| Single Unit, Attached | 20 (46.5%) | 23 (53.5%) |
| 2 Unit Apartments | 8 (10.1%) | 71 (89.9%) |
| 3 or 4 Unit Apartments | 0 (0.0%) | 215 (100.0%) |
| 5 to 9 Unit Apartments | 0 (0.0%) | 88 (100.0%) |
| 10 or more Apartments | 0 (0.0%) | 60 (100.0%) |
| Mobile Home / Other | 30 (83.3%) | 6 (16.7%) |
| Total | 1,140 (57.2%) | 852 (42.8%) |
Housing Structures by Number of Rooms in Greenville borough
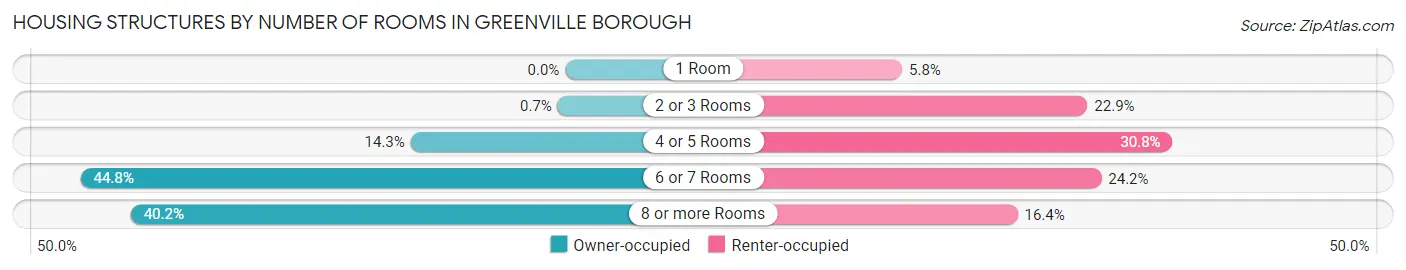
| Number of Rooms | Owner-occupied | Renter-occupied |
| 1 Room | 0 (0.0%) | 49 (5.8%) |
| 2 or 3 Rooms | 8 (0.7%) | 195 (22.9%) |
| 4 or 5 Rooms | 163 (14.3%) | 262 (30.7%) |
| 6 or 7 Rooms | 511 (44.8%) | 206 (24.2%) |
| 8 or more Rooms | 458 (40.2%) | 140 (16.4%) |
| Total | 1,140 (100.0%) | 852 (100.0%) |
Housing Structure by Heating Type in Greenville borough
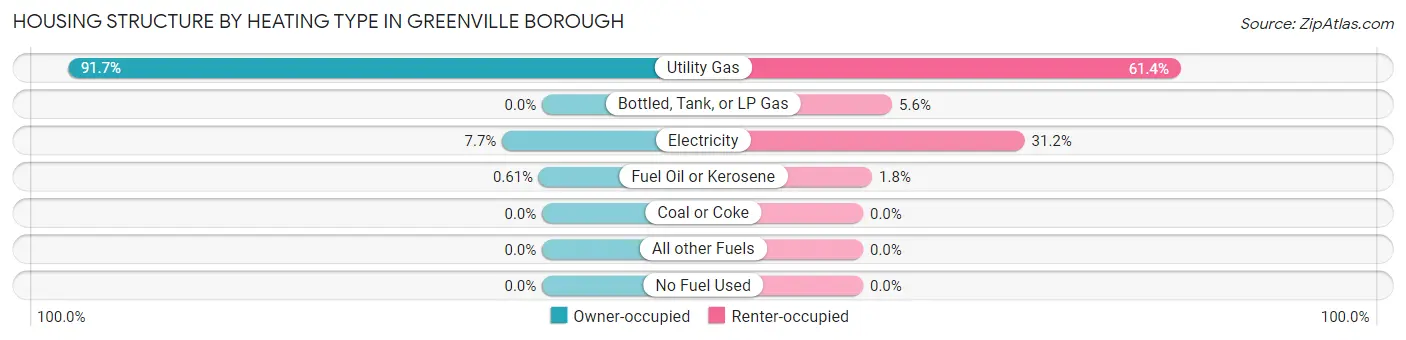
| Heating Type | Owner-occupied | Renter-occupied |
| Utility Gas | 1,045 (91.7%) | 523 (61.4%) |
| Bottled, Tank, or LP Gas | 0 (0.0%) | 48 (5.6%) |
| Electricity | 88 (7.7%) | 266 (31.2%) |
| Fuel Oil or Kerosene | 7 (0.6%) | 15 (1.8%) |
| Coal or Coke | 0 (0.0%) | 0 (0.0%) |
| All other Fuels | 0 (0.0%) | 0 (0.0%) |
| No Fuel Used | 0 (0.0%) | 0 (0.0%) |
| Total | 1,140 (100.0%) | 852 (100.0%) |
Household Vehicle Usage in Greenville borough
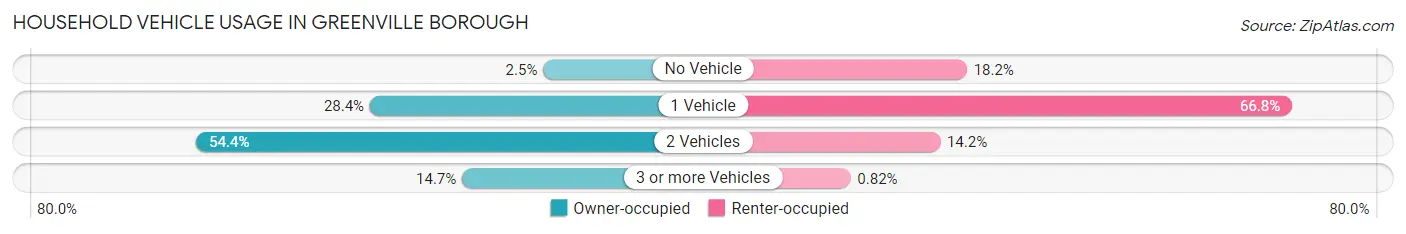
| Vehicles per Household | Owner-occupied | Renter-occupied |
| No Vehicle | 29 (2.5%) | 155 (18.2%) |
| 1 Vehicle | 324 (28.4%) | 569 (66.8%) |
| 2 Vehicles | 620 (54.4%) | 121 (14.2%) |
| 3 or more Vehicles | 167 (14.6%) | 7 (0.8%) |
| Total | 1,140 (100.0%) | 852 (100.0%) |
Real Estate & Mortgages in Greenville borough
Real Estate and Mortgage Overview in Greenville borough
| Characteristic | Without Mortgage | With Mortgage |
| Housing Units | 510 | 630 |
| Median Property Value | $81,800 | $89,100 |
| Median Household Income | $57,414 | $53 |
| Monthly Housing Costs | $435 | $0 |
| Real Estate Taxes | $1,639 | $0 |
Property Value by Mortgage Status in Greenville borough
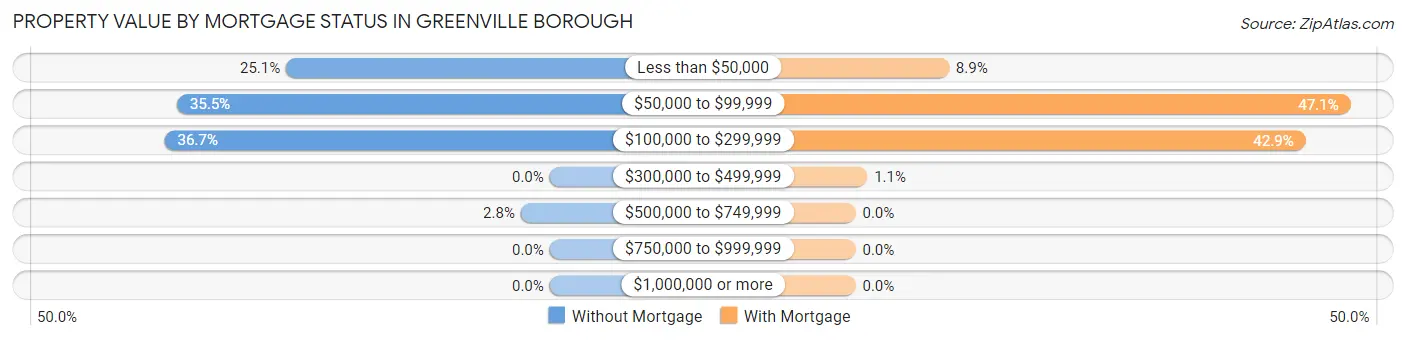
| Property Value | Without Mortgage | With Mortgage |
| Less than $50,000 | 128 (25.1%) | 56 (8.9%) |
| $50,000 to $99,999 | 181 (35.5%) | 297 (47.1%) |
| $100,000 to $299,999 | 187 (36.7%) | 270 (42.9%) |
| $300,000 to $499,999 | 0 (0.0%) | 7 (1.1%) |
| $500,000 to $749,999 | 14 (2.8%) | 0 (0.0%) |
| $750,000 to $999,999 | 0 (0.0%) | 0 (0.0%) |
| $1,000,000 or more | 0 (0.0%) | 0 (0.0%) |
| Total | 510 (100.0%) | 630 (100.0%) |
Household Income by Mortgage Status in Greenville borough
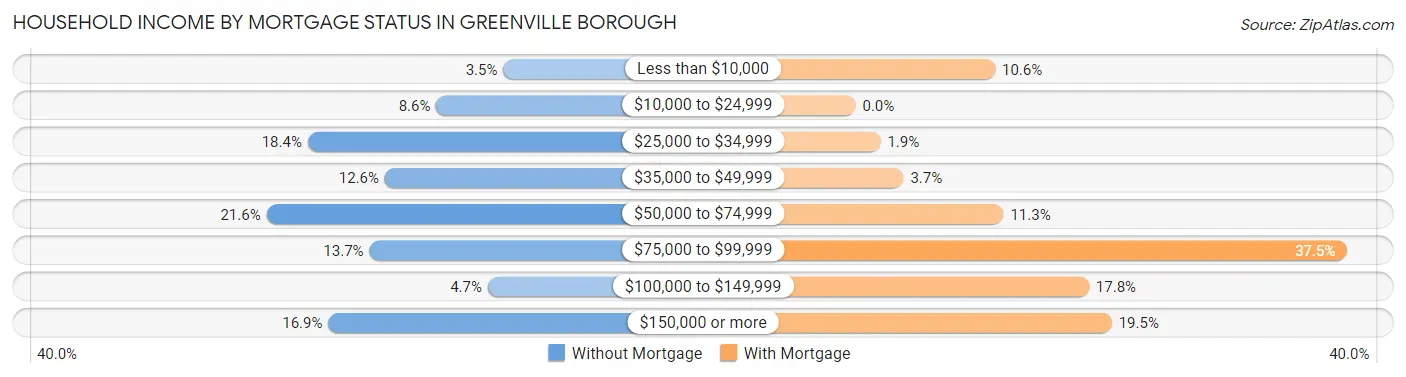
| Household Income | Without Mortgage | With Mortgage |
| Less than $10,000 | 18 (3.5%) | 67 (10.6%) |
| $10,000 to $24,999 | 44 (8.6%) | 0 (0.0%) |
| $25,000 to $34,999 | 94 (18.4%) | 12 (1.9%) |
| $35,000 to $49,999 | 64 (12.6%) | 23 (3.6%) |
| $50,000 to $74,999 | 110 (21.6%) | 71 (11.3%) |
| $75,000 to $99,999 | 70 (13.7%) | 236 (37.5%) |
| $100,000 to $149,999 | 24 (4.7%) | 112 (17.8%) |
| $150,000 or more | 86 (16.9%) | 123 (19.5%) |
| Total | 510 (100.0%) | 630 (100.0%) |
Property Value to Household Income Ratio in Greenville borough
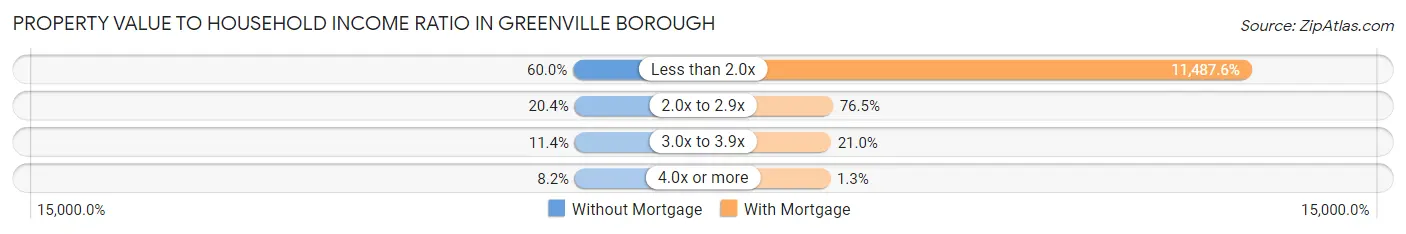
| Value-to-Income Ratio | Without Mortgage | With Mortgage |
| Less than 2.0x | 306 (60.0%) | 72,372 (11,487.6%) |
| 2.0x to 2.9x | 104 (20.4%) | 482 (76.5%) |
| 3.0x to 3.9x | 58 (11.4%) | 132 (20.9%) |
| 4.0x or more | 42 (8.2%) | 8 (1.3%) |
| Total | 510 (100.0%) | 630 (100.0%) |
Real Estate Taxes by Mortgage Status in Greenville borough
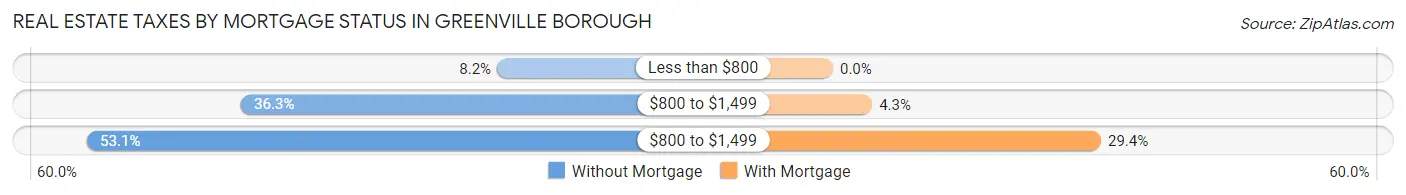
| Property Taxes | Without Mortgage | With Mortgage |
| Less than $800 | 42 (8.2%) | 0 (0.0%) |
| $800 to $1,499 | 185 (36.3%) | 27 (4.3%) |
| $800 to $1,499 | 271 (53.1%) | 185 (29.4%) |
| Total | 510 (100.0%) | 630 (100.0%) |
Health & Disability in Greenville borough
Health Insurance Coverage by Age in Greenville borough
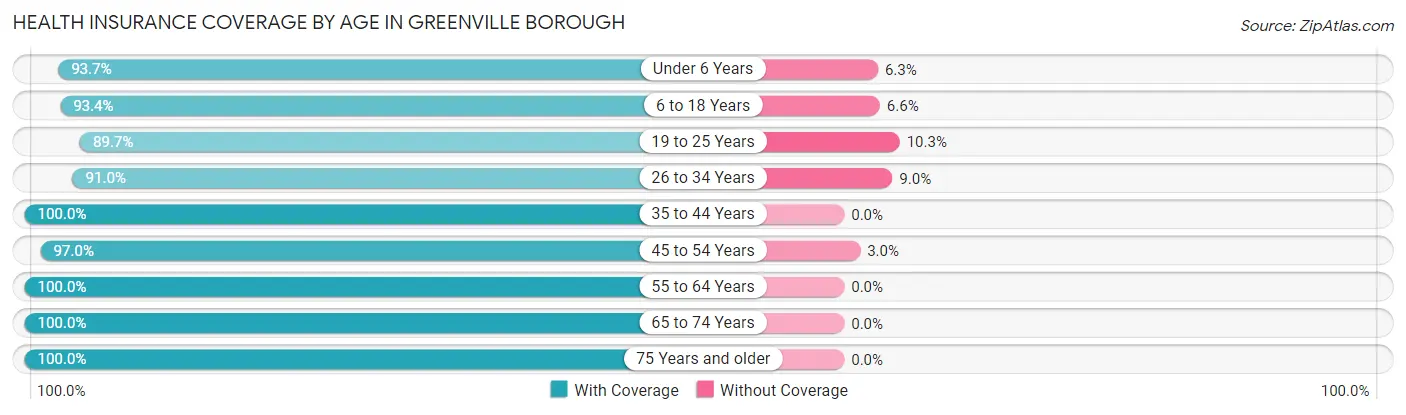
| Age Bracket | With Coverage | Without Coverage |
| Under 6 Years | 597 (93.7%) | 40 (6.3%) |
| 6 to 18 Years | 829 (93.4%) | 59 (6.6%) |
| 19 to 25 Years | 988 (89.7%) | 114 (10.3%) |
| 26 to 34 Years | 629 (91.0%) | 62 (9.0%) |
| 35 to 44 Years | 477 (100.0%) | 0 (0.0%) |
| 45 to 54 Years | 555 (97.0%) | 17 (3.0%) |
| 55 to 64 Years | 486 (100.0%) | 0 (0.0%) |
| 65 to 74 Years | 391 (100.0%) | 0 (0.0%) |
| 75 Years and older | 317 (100.0%) | 0 (0.0%) |
| Total | 5,269 (94.8%) | 292 (5.2%) |
Health Insurance Coverage by Citizenship Status in Greenville borough
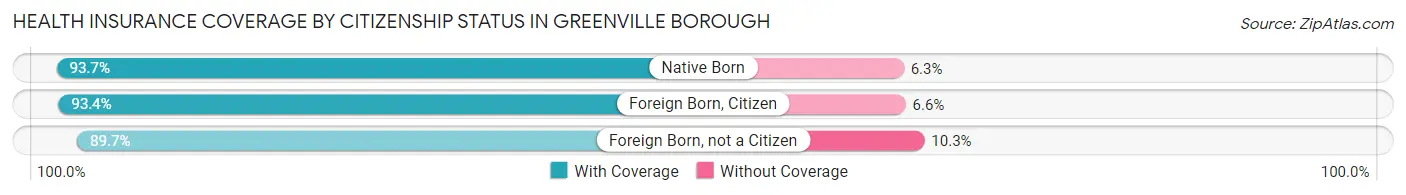
| Citizenship Status | With Coverage | Without Coverage |
| Native Born | 597 (93.7%) | 40 (6.3%) |
| Foreign Born, Citizen | 829 (93.4%) | 59 (6.6%) |
| Foreign Born, not a Citizen | 988 (89.7%) | 114 (10.3%) |
Health Insurance Coverage by Household Income in Greenville borough
| Household Income | With Coverage | Without Coverage |
| Under $25,000 | 510 (97.0%) | 16 (3.0%) |
| $25,000 to $49,999 | 842 (91.2%) | 81 (8.8%) |
| $50,000 to $74,999 | 1,262 (100.0%) | 0 (0.0%) |
| $75,000 to $99,999 | 699 (90.1%) | 77 (9.9%) |
| $100,000 and over | 1,182 (94.1%) | 74 (5.9%) |
Public vs Private Health Insurance Coverage by Age in Greenville borough
| Age Bracket | Public Insurance | Private Insurance |
| Under 6 | 256 (40.2%) | 352 (55.3%) |
| 6 to 18 Years | 379 (42.7%) | 567 (63.8%) |
| 19 to 25 Years | 160 (14.5%) | 845 (76.7%) |
| 25 to 34 Years | 260 (37.6%) | 369 (53.4%) |
| 35 to 44 Years | 150 (31.5%) | 388 (81.3%) |
| 45 to 54 Years | 236 (41.3%) | 376 (65.7%) |
| 55 to 64 Years | 234 (48.1%) | 284 (58.4%) |
| 65 to 74 Years | 384 (98.2%) | 170 (43.5%) |
| 75 Years and over | 317 (100.0%) | 185 (58.4%) |
| Total | 2,376 (42.7%) | 3,536 (63.6%) |
Disability Status by Sex by Age in Greenville borough
| Age Bracket | Male | Female |
| Under 5 Years | 0 (0.0%) | 0 (0.0%) |
| 5 to 17 Years | 27 (9.2%) | 21 (5.2%) |
| 18 to 34 Years | 110 (10.8%) | 133 (13.1%) |
| 35 to 64 Years | 106 (15.2%) | 228 (27.2%) |
| 65 to 74 Years | 83 (46.9%) | 35 (16.4%) |
| 75 Years and over | 91 (65.5%) | 59 (33.2%) |
Disability Class by Sex by Age in Greenville borough
Disability Class: Hearing Difficulty
| Age Bracket | Male | Female |
| Under 5 Years | 0 (0.0%) | 0 (0.0%) |
| 5 to 17 Years | 0 (0.0%) | 0 (0.0%) |
| 18 to 34 Years | 5 (0.5%) | 5 (0.5%) |
| 35 to 64 Years | 7 (1.0%) | 7 (0.8%) |
| 65 to 74 Years | 53 (29.9%) | 15 (7.0%) |
| 75 Years and over | 75 (54.0%) | 29 (16.3%) |
Disability Class: Vision Difficulty
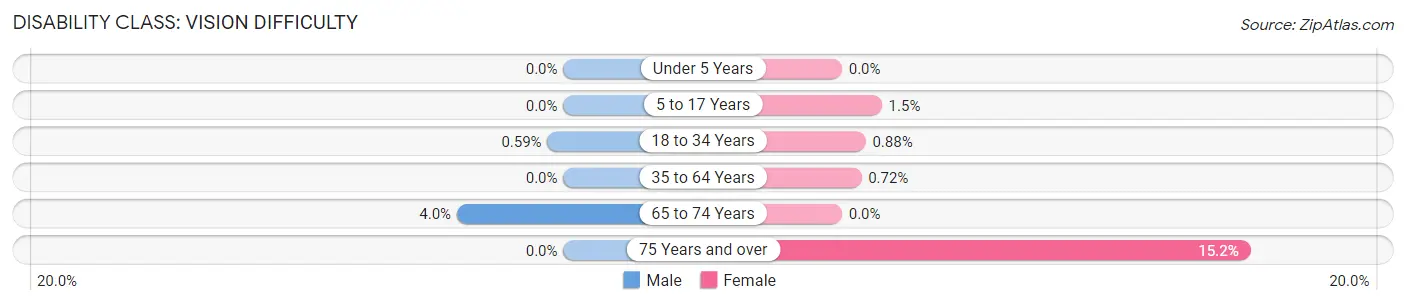
| Age Bracket | Male | Female |
| Under 5 Years | 0 (0.0%) | 0 (0.0%) |
| 5 to 17 Years | 0 (0.0%) | 6 (1.5%) |
| 18 to 34 Years | 6 (0.6%) | 9 (0.9%) |
| 35 to 64 Years | 0 (0.0%) | 6 (0.7%) |
| 65 to 74 Years | 7 (4.0%) | 0 (0.0%) |
| 75 Years and over | 0 (0.0%) | 27 (15.2%) |
Disability Class: Cognitive Difficulty
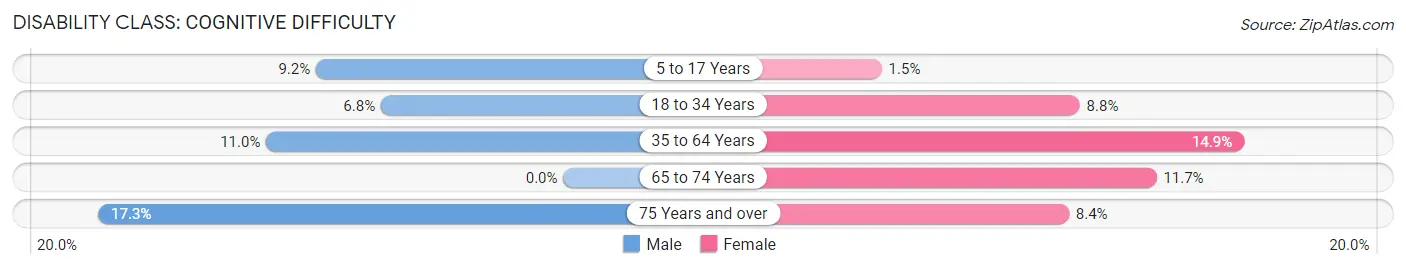
| Age Bracket | Male | Female |
| 5 to 17 Years | 27 (9.2%) | 6 (1.5%) |
| 18 to 34 Years | 69 (6.8%) | 90 (8.8%) |
| 35 to 64 Years | 77 (11.0%) | 125 (14.9%) |
| 65 to 74 Years | 0 (0.0%) | 25 (11.7%) |
| 75 Years and over | 24 (17.3%) | 15 (8.4%) |
Disability Class: Ambulatory Difficulty
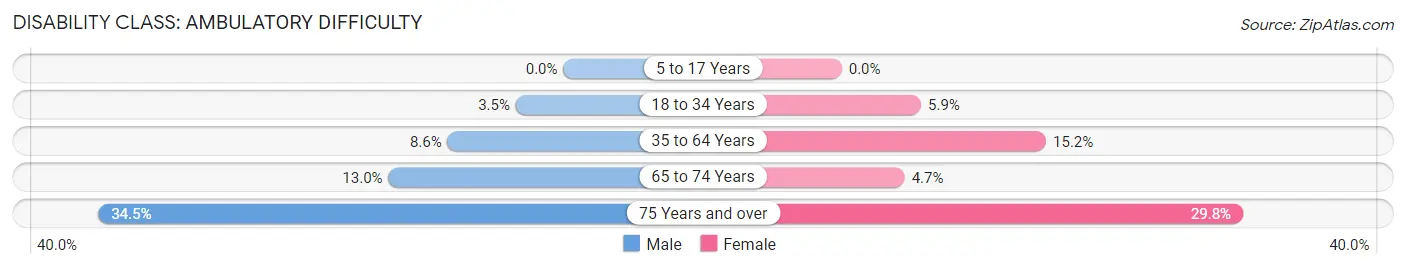
| Age Bracket | Male | Female |
| 5 to 17 Years | 0 (0.0%) | 0 (0.0%) |
| 18 to 34 Years | 36 (3.5%) | 60 (5.9%) |
| 35 to 64 Years | 60 (8.6%) | 127 (15.2%) |
| 65 to 74 Years | 23 (13.0%) | 10 (4.7%) |
| 75 Years and over | 48 (34.5%) | 53 (29.8%) |
Disability Class: Self-Care Difficulty
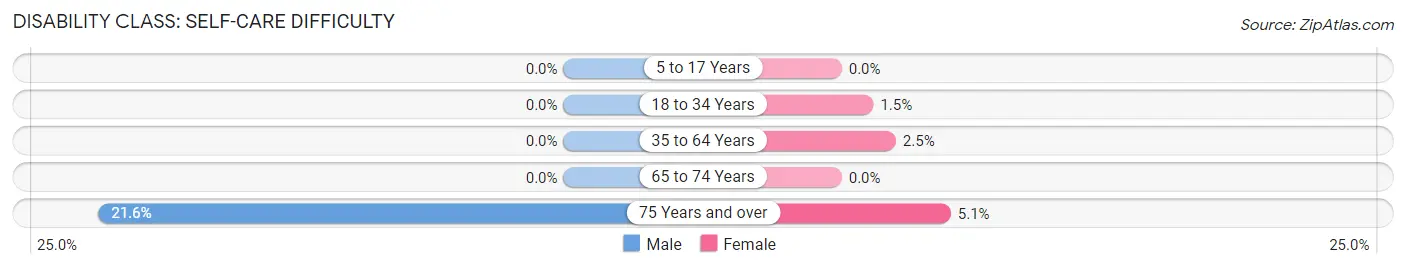
| Age Bracket | Male | Female |
| 5 to 17 Years | 0 (0.0%) | 0 (0.0%) |
| 18 to 34 Years | 0 (0.0%) | 15 (1.5%) |
| 35 to 64 Years | 0 (0.0%) | 21 (2.5%) |
| 65 to 74 Years | 0 (0.0%) | 0 (0.0%) |
| 75 Years and over | 30 (21.6%) | 9 (5.1%) |
Technology Access in Greenville borough
Computing Device Access in Greenville borough
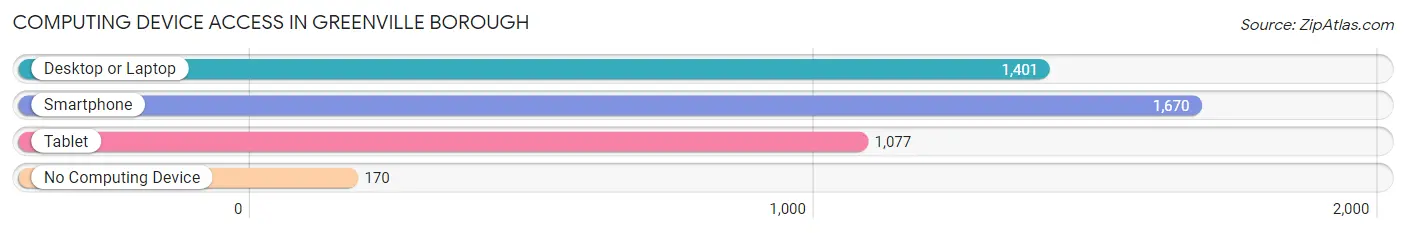
| Device Type | # Households | % Households |
| Desktop or Laptop | 1,401 | 70.3% |
| Smartphone | 1,670 | 83.8% |
| Tablet | 1,077 | 54.1% |
| No Computing Device | 170 | 8.5% |
| Total | 1,992 | 100.0% |
Internet Access in Greenville borough
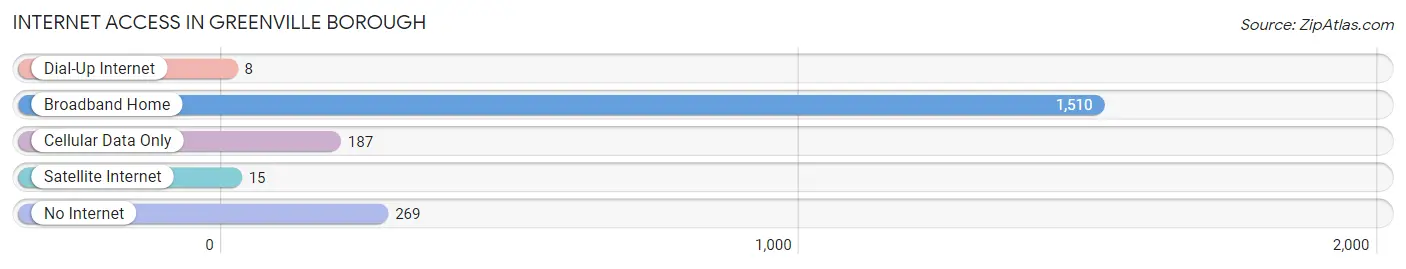
| Internet Type | # Households | % Households |
| Dial-Up Internet | 8 | 0.4% |
| Broadband Home | 1,510 | 75.8% |
| Cellular Data Only | 187 | 9.4% |
| Satellite Internet | 15 | 0.7% |
| No Internet | 269 | 13.5% |
| Total | 1,992 | 100.0% |
Greenville borough Summary
Introduction
Greenville Borough is a small borough located in Mercer County, Pennsylvania. It is situated in the Shenango Valley, approximately 30 miles north of Pittsburgh. The borough was incorporated in 1871 and has a population of approximately 4,000 people. The borough is home to a variety of businesses, including manufacturing, retail, and healthcare.
History
Greenville Borough was founded in 1871 by a group of settlers from the nearby town of Greenville, Ohio. The settlers were attracted to the area due to its proximity to the Shenango River, which provided a source of water for the town. The town was originally known as “Greenville Station” due to its location on the Pittsburgh and Lake Erie Railroad. The town was officially incorporated as a borough in 1871.
In the late 19th century, Greenville Borough was a thriving industrial center. The borough was home to several factories, including a glass factory, a paper mill, and a steel mill. The borough also had a thriving retail sector, with several stores and shops located in the downtown area.
In the early 20th century, the borough experienced a period of decline. The factories and mills began to close, and the population began to decline. The borough was also affected by the Great Depression, which caused many businesses to close.
In the late 20th century, the borough began to experience a period of revitalization. The downtown area was renovated, and new businesses began to open. The borough also began to attract new residents, and the population began to increase.
Geography
Greenville Borough is located in Mercer County, Pennsylvania. The borough is situated in the Shenango Valley, approximately 30 miles north of Pittsburgh. The borough is bordered by the Shenango River to the east and the city of Greenville to the west. The borough is located in a hilly region, with several small hills and valleys.
The borough has a total area of 1.3 square miles, all of which is land. The borough has a humid continental climate, with cold winters and hot summers. The average annual temperature is approximately 50 degrees Fahrenheit.
Economy
Greenville Borough has a diverse economy, with a variety of businesses located in the borough. The borough is home to several manufacturing companies, including a glass factory, a paper mill, and a steel mill. The borough also has a thriving retail sector, with several stores and shops located in the downtown area.
The borough is also home to several healthcare facilities, including a hospital and several medical offices. The borough is also home to several educational institutions, including a community college and a vocational school.
Demographics
As of the 2010 census, the population of Greenville Borough was 4,000. The population is predominantly white, with approximately 95% of the population identifying as white. The median household income is approximately $40,000, and the median home value is approximately $90,000.
Conclusion
Greenville Borough is a small borough located in Mercer County, Pennsylvania. The borough was founded in 1871 and has a population of approximately 4,000 people. The borough is home to a variety of businesses, including manufacturing, retail, and healthcare. The borough has a diverse economy and a predominantly white population. The median household income is approximately $40,000, and the median home value is approximately $90,000.
Common Questions
What is Per Capita Income in Greenville borough?
Per Capita income in Greenville borough is $23,510.
What is the Median Family Income in Greenville borough?
Median Family Income in Greenville borough is $69,364.
What is the Median Household income in Greenville borough?
Median Household Income in Greenville borough is $54,237.
What is Income or Wage Gap in Greenville borough?
Income or Wage Gap in Greenville borough is 31.4%.
Women in Greenville borough earn 68.6 cents for every dollar earned by a man.
What is Inequality or Gini Index in Greenville borough?
Inequality or Gini Index in Greenville borough is 0.41.
What is the Total Population of Greenville borough?
Total Population of Greenville borough is 5,568.
What is the Total Male Population of Greenville borough?
Total Male Population of Greenville borough is 2,632.
What is the Total Female Population of Greenville borough?
Total Female Population of Greenville borough is 2,936.
What is the Ratio of Males per 100 Females in Greenville borough?
There are 89.65 Males per 100 Females in Greenville borough.
What is the Ratio of Females per 100 Males in Greenville borough?
There are 111.55 Females per 100 Males in Greenville borough.
What is the Median Population Age in Greenville borough?
Median Population Age in Greenville borough is 28.4 Years.
What is the Average Family Size in Greenville borough
Average Family Size in Greenville borough is 3.1 People.
What is the Average Household Size in Greenville borough
Average Household Size in Greenville borough is 2.4 People.
How Large is the Labor Force in Greenville borough?
There are 2,723 People in the Labor Forcein in Greenville borough.
What is the Percentage of People in the Labor Force in Greenville borough?
62.4% of People are in the Labor Force in Greenville borough.
What is the Unemployment Rate in Greenville borough?
Unemployment Rate in Greenville borough is 2.8%.