Quakertown borough, PA Map & Demographics
Quakertown borough Overview
$35,853
PER CAPITA INCOME
$98,271
AVG FAMILY INCOME
$70,813
AVG HOUSEHOLD INCOME
27.6%
WAGE / INCOME GAP [ % ]
72.4¢/ $1
WAGE / INCOME GAP [ $ ]
0.40
INEQUALITY / GINI INDEX
9,309
TOTAL POPULATION
4,569
MALE POPULATION
4,740
FEMALE POPULATION
96.39
MALES / 100 FEMALES
103.74
FEMALES / 100 MALES
37.0
MEDIAN AGE
3.2
AVG FAMILY SIZE
2.6
AVG HOUSEHOLD SIZE
5,393
LABOR FORCE [ PEOPLE ]
70.6%
PERCENT IN LABOR FORCE
6.4%
UNEMPLOYMENT RATE
Income in Quakertown borough
Income Overview in Quakertown borough
Per Capita Income in Quakertown borough is $35,853, while median incomes of families and households are $98,271 and $70,813 respectively.
| Characteristic | Number | Measure |
| Per Capita Income | 9,309 | $35,853 |
| Median Family Income | 2,059 | $98,271 |
| Mean Family Income | 2,059 | $105,406 |
| Median Household Income | 3,510 | $70,813 |
| Mean Household Income | 3,510 | $88,595 |
| Income Deficit | 2,059 | $0 |
| Wage / Income Gap (%) | 9,309 | 27.63% |
| Wage / Income Gap ($) | 9,309 | 72.37¢ per $1 |
| Gini / Inequality Index | 9,309 | 0.40 |
Earnings by Sex in Quakertown borough
Average Earnings in Quakertown borough are $39,913, $47,081 for men and $34,071 for women, a difference of 27.6%.
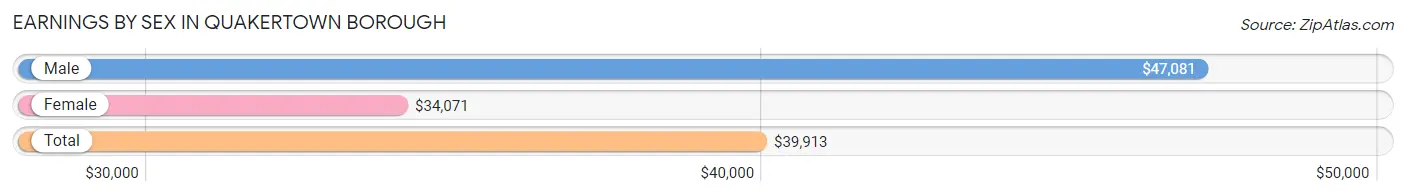
| Sex | Number | Average Earnings |
| Male | 2,816 (52.1%) | $47,081 |
| Female | 2,586 (47.9%) | $34,071 |
| Total | 5,402 (100.0%) | $39,913 |
Earnings by Sex by Income Bracket in Quakertown borough
The most common earnings brackets in Quakertown borough are $75,000 to $99,999 for men (429 | 15.2%) and $35,000 to $39,999 for women (372 | 14.4%).
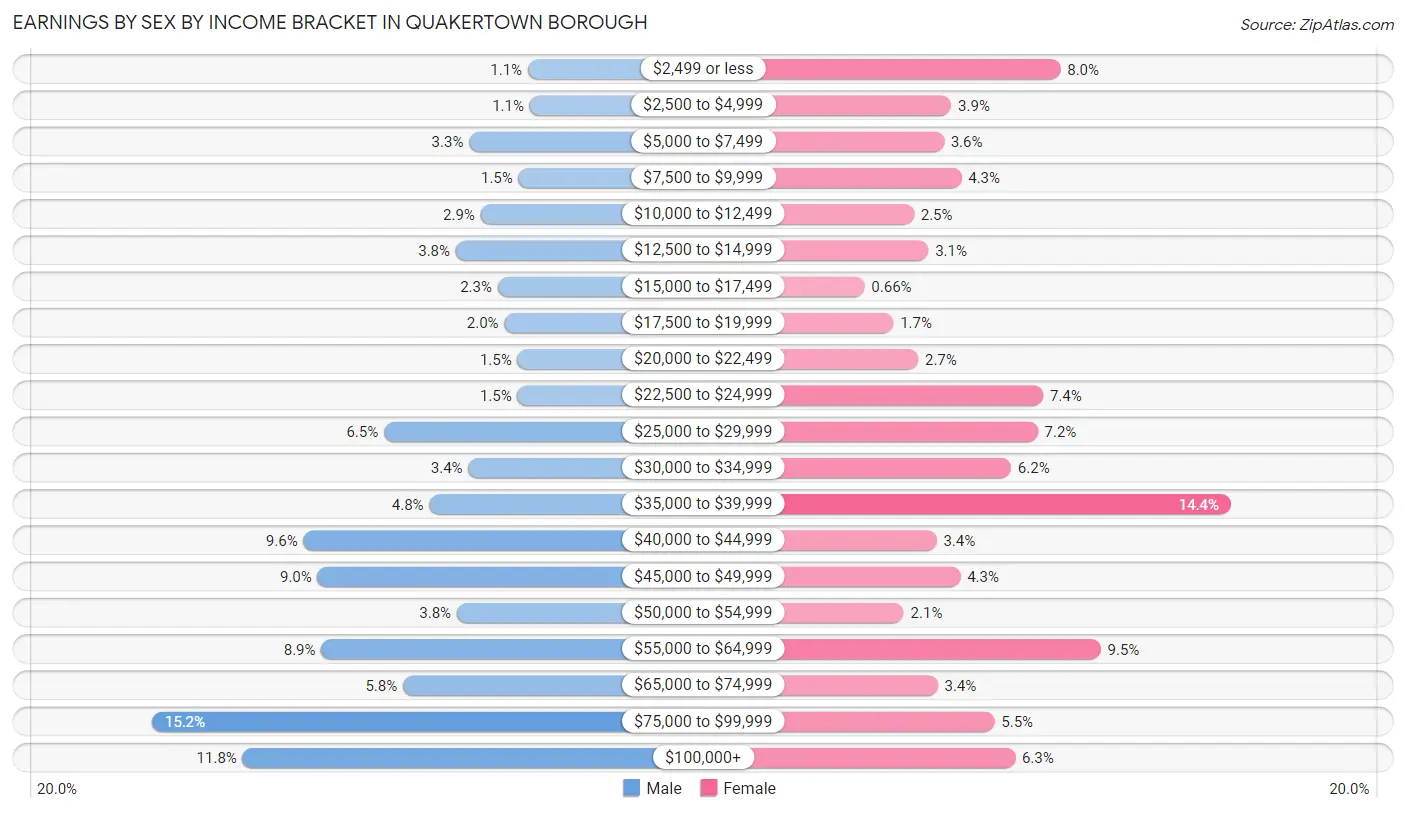
| Income | Male | Female |
| $2,499 or less | 32 (1.1%) | 207 (8.0%) |
| $2,500 to $4,999 | 30 (1.1%) | 101 (3.9%) |
| $5,000 to $7,499 | 94 (3.3%) | 94 (3.6%) |
| $7,500 to $9,999 | 42 (1.5%) | 111 (4.3%) |
| $10,000 to $12,499 | 82 (2.9%) | 65 (2.5%) |
| $12,500 to $14,999 | 108 (3.8%) | 79 (3.0%) |
| $15,000 to $17,499 | 64 (2.3%) | 17 (0.7%) |
| $17,500 to $19,999 | 57 (2.0%) | 45 (1.7%) |
| $20,000 to $22,499 | 43 (1.5%) | 69 (2.7%) |
| $22,500 to $24,999 | 43 (1.5%) | 190 (7.3%) |
| $25,000 to $29,999 | 184 (6.5%) | 185 (7.1%) |
| $30,000 to $34,999 | 95 (3.4%) | 159 (6.1%) |
| $35,000 to $39,999 | 136 (4.8%) | 372 (14.4%) |
| $40,000 to $44,999 | 269 (9.6%) | 87 (3.4%) |
| $45,000 to $49,999 | 254 (9.0%) | 110 (4.3%) |
| $50,000 to $54,999 | 107 (3.8%) | 55 (2.1%) |
| $55,000 to $64,999 | 250 (8.9%) | 246 (9.5%) |
| $65,000 to $74,999 | 164 (5.8%) | 88 (3.4%) |
| $75,000 to $99,999 | 429 (15.2%) | 143 (5.5%) |
| $100,000+ | 333 (11.8%) | 163 (6.3%) |
| Total | 2,816 (100.0%) | 2,586 (100.0%) |
Earnings by Sex by Educational Attainment in Quakertown borough
Average earnings in Quakertown borough are $52,446 for men and $33,603 for women, a difference of 35.9%. Men with an educational attainment of graduate degree enjoy the highest average annual earnings of $91,563, while those with high school diploma education earn the least with $46,810. Women with an educational attainment of graduate degree earn the most with the average annual earnings of $80,833, while those with high school diploma education have the smallest earnings of $24,798.
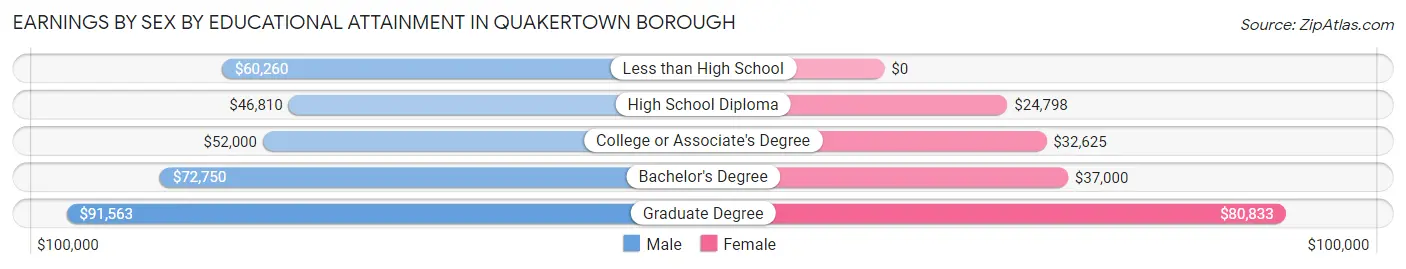
| Educational Attainment | Male Income | Female Income |
| Less than High School | $60,260 | $0 |
| High School Diploma | $46,810 | $24,798 |
| College or Associate's Degree | $52,000 | $32,625 |
| Bachelor's Degree | $72,750 | $37,000 |
| Graduate Degree | $91,563 | $80,833 |
| Total | $52,446 | $33,603 |
Family Income in Quakertown borough
Family Income Brackets in Quakertown borough
According to the Quakertown borough family income data, there are 632 families falling into the $100,000 to $149,999 income range, which is the most common income bracket and makes up 30.7% of all families. Conversely, the $15,000 to $24,999 income bracket is the least frequent group with only 45 families (2.2%) belonging to this category.
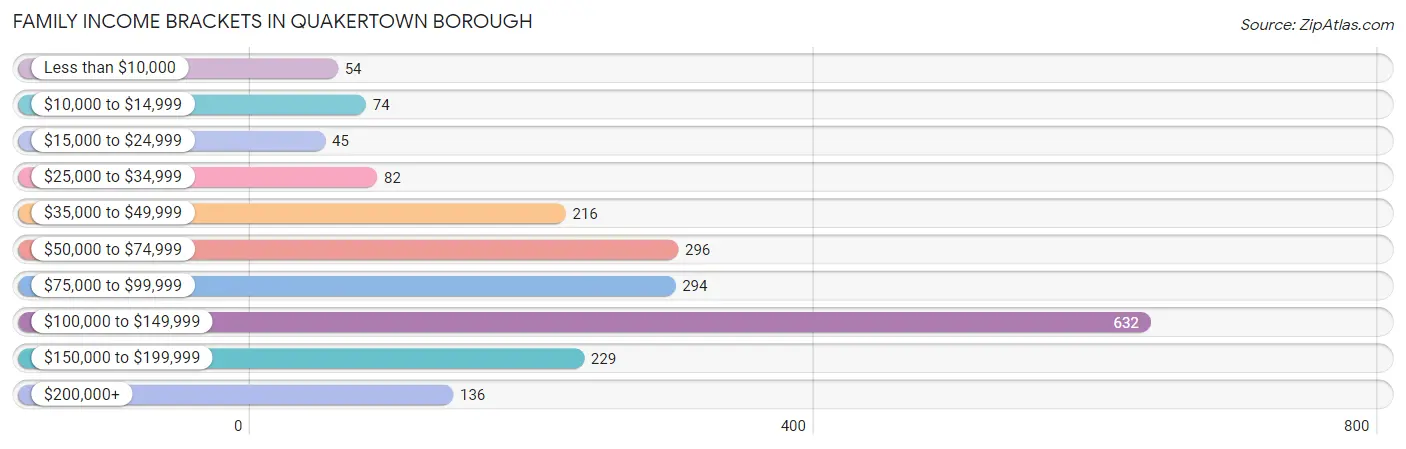
| Income Bracket | # Families | % Families |
| Less than $10,000 | 54 | 2.6% |
| $10,000 to $14,999 | 74 | 3.6% |
| $15,000 to $24,999 | 45 | 2.2% |
| $25,000 to $34,999 | 82 | 4.0% |
| $35,000 to $49,999 | 216 | 10.5% |
| $50,000 to $74,999 | 296 | 14.4% |
| $75,000 to $99,999 | 294 | 14.3% |
| $100,000 to $149,999 | 632 | 30.7% |
| $150,000 to $199,999 | 229 | 11.1% |
| $200,000+ | 136 | 6.6% |
Family Income by Famaliy Size in Quakertown borough
5-person families (179 | 8.7%) account for the highest median family income in Quakertown borough with $140,536 per family, while 2-person families (903 | 43.9%) have the highest median income of $41,510 per family member.
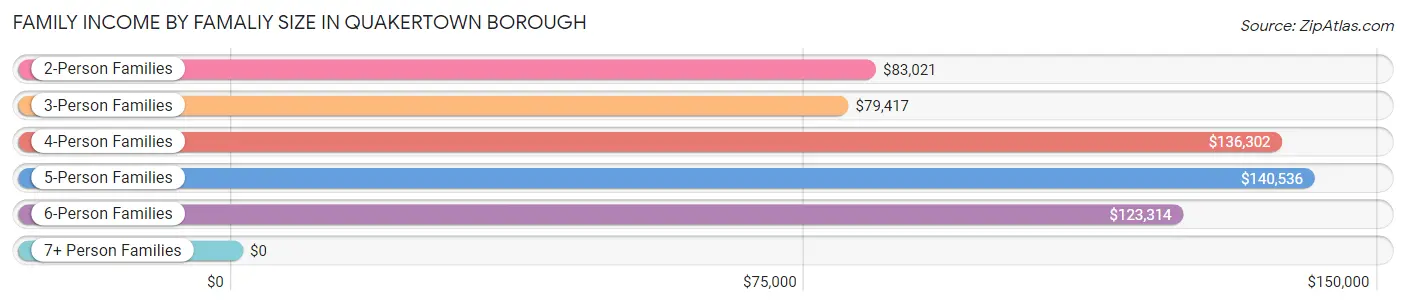
| Income Bracket | # Families | Median Income |
| 2-Person Families | 903 (43.9%) | $83,021 |
| 3-Person Families | 503 (24.4%) | $79,417 |
| 4-Person Families | 267 (13.0%) | $136,302 |
| 5-Person Families | 179 (8.7%) | $140,536 |
| 6-Person Families | 195 (9.5%) | $123,314 |
| 7+ Person Families | 12 (0.6%) | $0 |
| Total | 2,059 (100.0%) | $98,271 |
Family Income by Number of Earners in Quakertown borough
The median family income in Quakertown borough is $98,271, with families comprising 3+ earners (317) having the highest median family income of $124,851, while families with no earners (207) have the lowest median family income of $34,879, accounting for 15.4% and 10.1% of families, respectively.
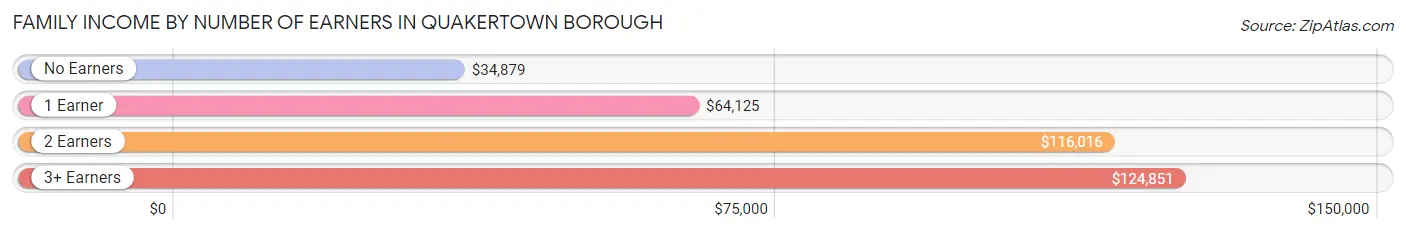
| Number of Earners | # Families | Median Income |
| No Earners | 207 (10.1%) | $34,879 |
| 1 Earner | 699 (34.0%) | $64,125 |
| 2 Earners | 836 (40.6%) | $116,016 |
| 3+ Earners | 317 (15.4%) | $124,851 |
| Total | 2,059 (100.0%) | $98,271 |
Household Income in Quakertown borough
Household Income Brackets in Quakertown borough
With 737 households falling in the category, the $100,000 to $149,999 income range is the most frequent in Quakertown borough, accounting for 21.0% of all households. In contrast, only 116 households (3.3%) fall into the less than $10,000 income bracket, making it the least populous group.
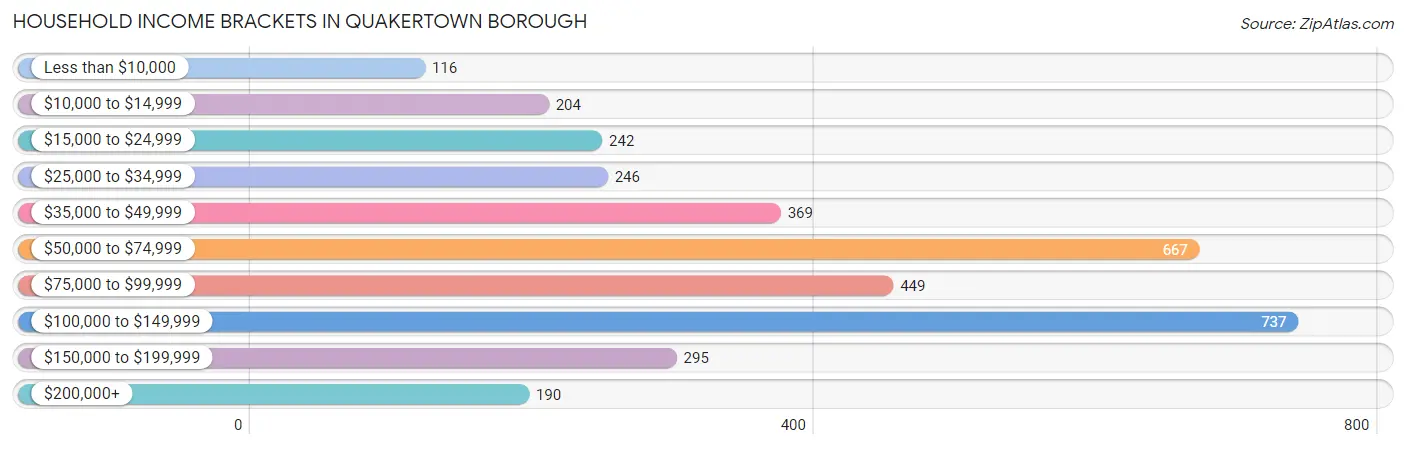
| Income Bracket | # Households | % Households |
| Less than $10,000 | 116 | 3.3% |
| $10,000 to $14,999 | 204 | 5.8% |
| $15,000 to $24,999 | 242 | 6.9% |
| $25,000 to $34,999 | 246 | 7.0% |
| $35,000 to $49,999 | 369 | 10.5% |
| $50,000 to $74,999 | 667 | 19.0% |
| $75,000 to $99,999 | 449 | 12.8% |
| $100,000 to $149,999 | 737 | 21.0% |
| $150,000 to $199,999 | 295 | 8.4% |
| $200,000+ | 190 | 5.4% |
Household Income by Householder Age in Quakertown borough
The median household income in Quakertown borough is $70,813, with the highest median household income of $92,348 found in the 25 to 44 years age bracket for the primary householder. A total of 1,312 households (37.4%) fall into this category. Meanwhile, the 65+ years age bracket for the primary householder has the lowest median household income of $46,462, with 899 households (25.6%) in this group.
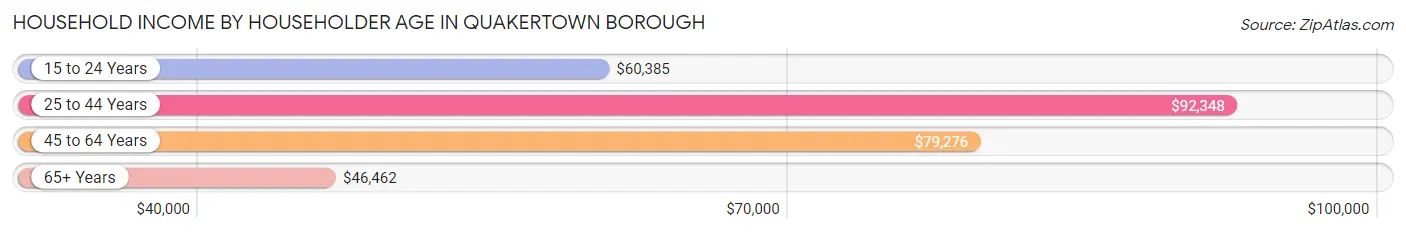
| Income Bracket | # Households | Median Income |
| 15 to 24 Years | 114 (3.3%) | $60,385 |
| 25 to 44 Years | 1,312 (37.4%) | $92,348 |
| 45 to 64 Years | 1,185 (33.8%) | $79,276 |
| 65+ Years | 899 (25.6%) | $46,462 |
| Total | 3,510 (100.0%) | $70,813 |
Poverty in Quakertown borough
Income Below Poverty by Sex and Age in Quakertown borough
With 8.0% poverty level for males and 14.9% for females among the residents of Quakertown borough, under 5 year old males and 12 to 14 year old females are the most vulnerable to poverty, with 42 males (21.9%) and 41 females (36.0%) in their respective age groups living below the poverty level.
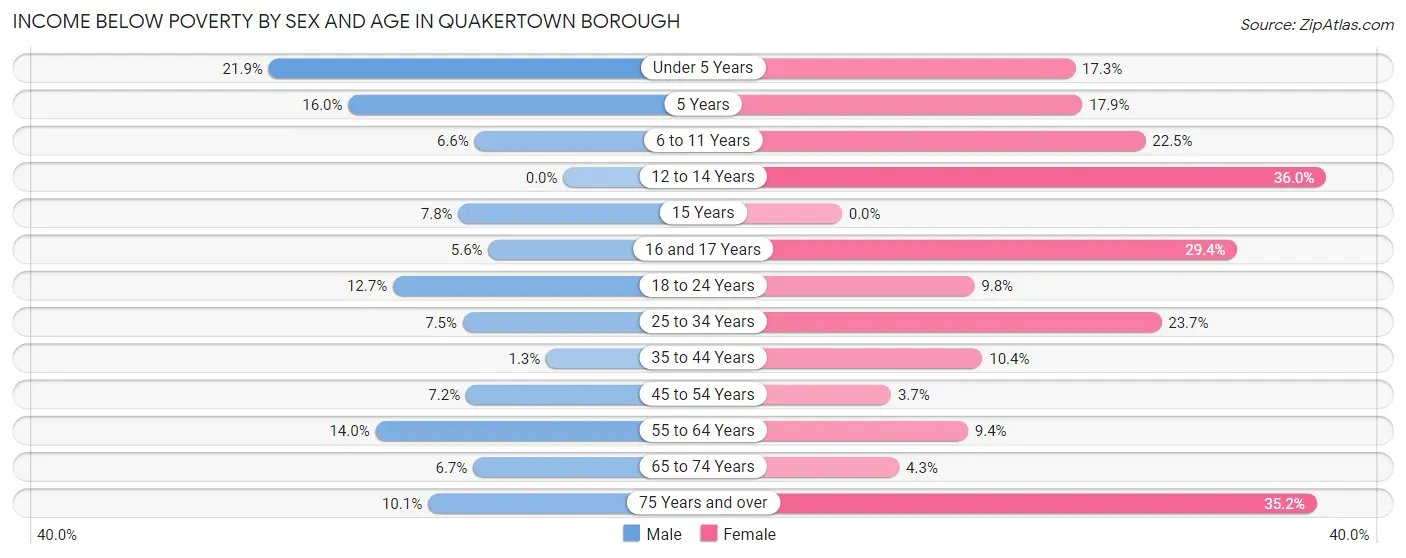
| Age Bracket | Male | Female |
| Under 5 Years | 42 (21.9%) | 53 (17.3%) |
| 5 Years | 15 (16.0%) | 10 (17.9%) |
| 6 to 11 Years | 23 (6.6%) | 55 (22.5%) |
| 12 to 14 Years | 0 (0.0%) | 41 (36.0%) |
| 15 Years | 6 (7.8%) | 0 (0.0%) |
| 16 and 17 Years | 5 (5.6%) | 42 (29.4%) |
| 18 to 24 Years | 52 (12.7%) | 57 (9.8%) |
| 25 to 34 Years | 61 (7.5%) | 153 (23.7%) |
| 35 to 44 Years | 10 (1.3%) | 75 (10.4%) |
| 45 to 54 Years | 30 (7.2%) | 18 (3.6%) |
| 55 to 64 Years | 65 (14.0%) | 48 (9.4%) |
| 65 to 74 Years | 27 (6.7%) | 18 (4.3%) |
| 75 Years and over | 21 (10.1%) | 117 (35.2%) |
| Total | 357 (8.0%) | 687 (14.9%) |
Income Above Poverty by Sex and Age in Quakertown borough
According to the poverty statistics in Quakertown borough, males aged 12 to 14 years and females aged 15 years are the age groups that are most secure financially, with 100.0% of males and 100.0% of females in these age groups living above the poverty line.
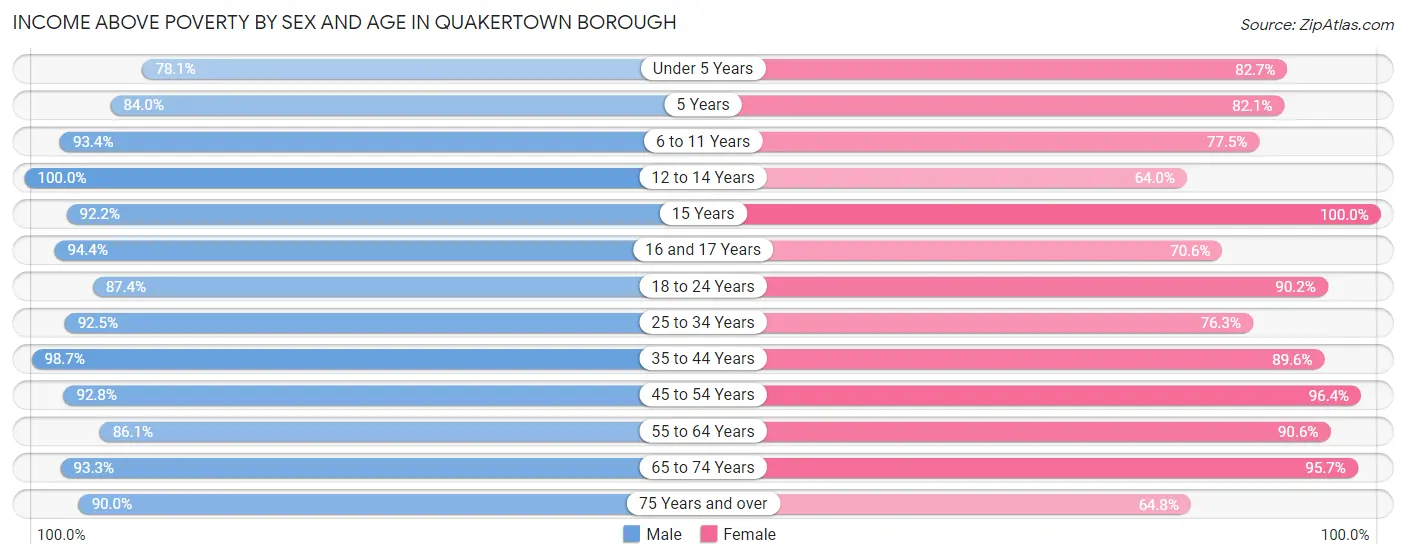
| Age Bracket | Male | Female |
| Under 5 Years | 150 (78.1%) | 253 (82.7%) |
| 5 Years | 79 (84.0%) | 46 (82.1%) |
| 6 to 11 Years | 326 (93.4%) | 189 (77.5%) |
| 12 to 14 Years | 171 (100.0%) | 73 (64.0%) |
| 15 Years | 71 (92.2%) | 31 (100.0%) |
| 16 and 17 Years | 85 (94.4%) | 101 (70.6%) |
| 18 to 24 Years | 359 (87.4%) | 522 (90.2%) |
| 25 to 34 Years | 757 (92.5%) | 492 (76.3%) |
| 35 to 44 Years | 770 (98.7%) | 644 (89.6%) |
| 45 to 54 Years | 385 (92.8%) | 475 (96.4%) |
| 55 to 64 Years | 401 (86.1%) | 465 (90.6%) |
| 65 to 74 Years | 376 (93.3%) | 405 (95.7%) |
| 75 Years and over | 188 (89.9%) | 215 (64.8%) |
| Total | 4,118 (92.0%) | 3,911 (85.1%) |
Income Below Poverty Among Married-Couple Families in Quakertown borough
The poverty statistics for married-couple families in Quakertown borough show that 0.7% or 10 of the total 1,344 families live below the poverty line. Families with 1 or 2 children have the highest poverty rate of 2.1%, comprising of 10 families. On the other hand, families with no children have the lowest poverty rate of 0.0%, which includes 0 families.
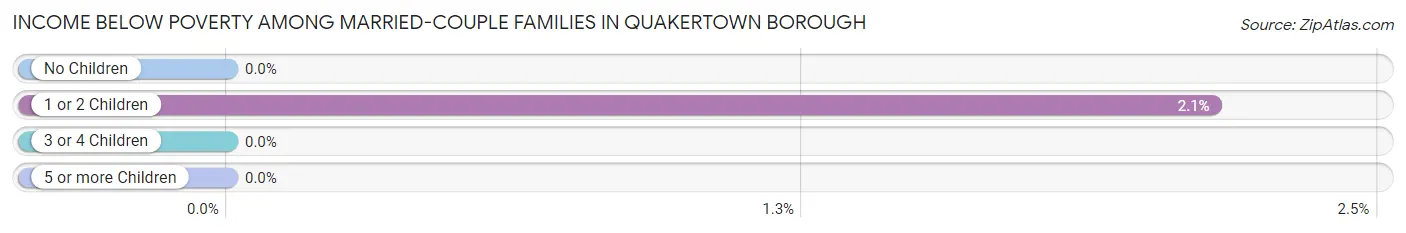
| Children | Above Poverty | Below Poverty |
| No Children | 757 (100.0%) | 0 (0.0%) |
| 1 or 2 Children | 458 (97.9%) | 10 (2.1%) |
| 3 or 4 Children | 119 (100.0%) | 0 (0.0%) |
| 5 or more Children | 0 (0.0%) | 0 (0.0%) |
| Total | 1,334 (99.3%) | 10 (0.7%) |
Income Below Poverty Among Single-Parent Households in Quakertown borough
According to the poverty data in Quakertown borough, 7.4% or 22 single-father households and 27.6% or 115 single-mother households are living below the poverty line. Among single-father households, those with 1 or 2 children have the highest poverty rate, with 22 households (23.4%) experiencing poverty. Likewise, among single-mother households, those with 5 or more children have the highest poverty rate, with 9 households (100.0%) falling below the poverty line.
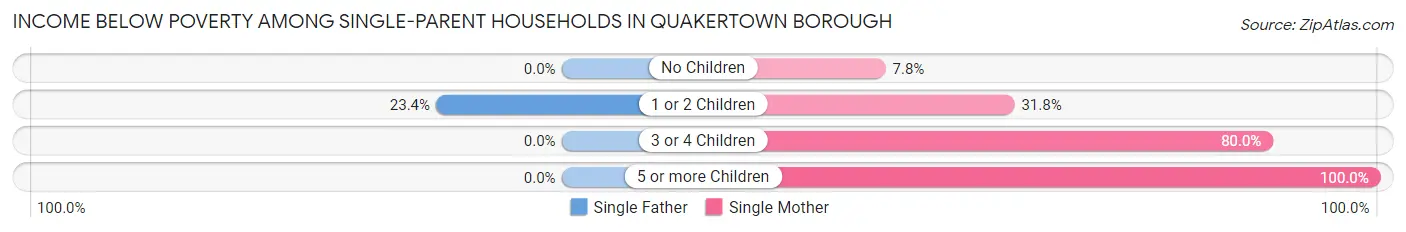
| Children | Single Father | Single Mother |
| No Children | 0 (0.0%) | 10 (7.8%) |
| 1 or 2 Children | 22 (23.4%) | 84 (31.8%) |
| 3 or 4 Children | 0 (0.0%) | 12 (80.0%) |
| 5 or more Children | 0 (0.0%) | 9 (100.0%) |
| Total | 22 (7.4%) | 115 (27.6%) |
Income Below Poverty Among Married-Couple vs Single-Parent Households in Quakertown borough
The poverty data for Quakertown borough shows that 10 of the married-couple family households (0.7%) and 137 of the single-parent households (19.2%) are living below the poverty level. Within the married-couple family households, those with 1 or 2 children have the highest poverty rate, with 10 households (2.1%) falling below the poverty line. Among the single-parent households, those with 5 or more children have the highest poverty rate, with 9 household (100.0%) living below poverty.
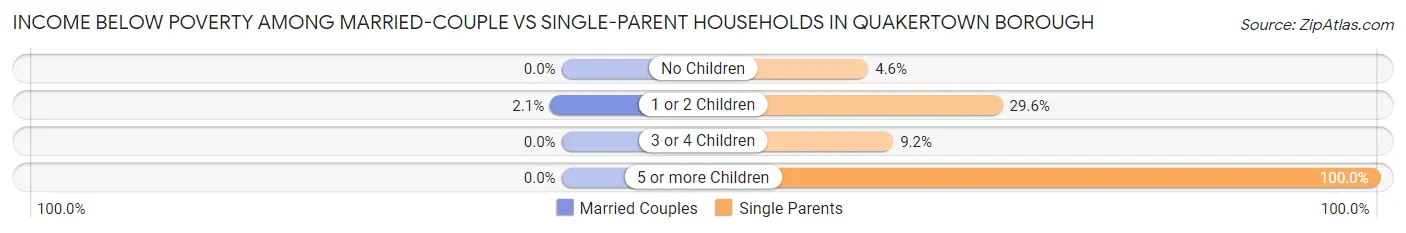
| Children | Married-Couple Families | Single-Parent Households |
| No Children | 0 (0.0%) | 10 (4.6%) |
| 1 or 2 Children | 10 (2.1%) | 106 (29.6%) |
| 3 or 4 Children | 0 (0.0%) | 12 (9.2%) |
| 5 or more Children | 0 (0.0%) | 9 (100.0%) |
| Total | 10 (0.7%) | 137 (19.2%) |
Race in Quakertown borough
The most populous races in Quakertown borough are White / Caucasian (7,428 | 79.8%), Hispanic or Latino (1,320 | 14.2%), and Two or more Races (1,252 | 13.5%).
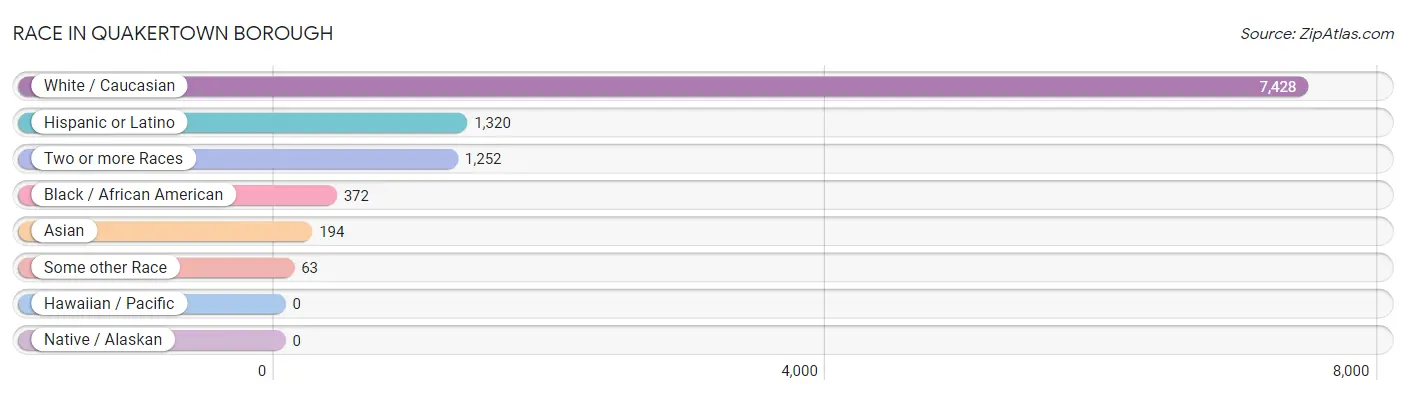
| Race | # Population | % Population |
| Asian | 194 | 2.1% |
| Black / African American | 372 | 4.0% |
| Hawaiian / Pacific | 0 | 0.0% |
| Hispanic or Latino | 1,320 | 14.2% |
| Native / Alaskan | 0 | 0.0% |
| White / Caucasian | 7,428 | 79.8% |
| Two or more Races | 1,252 | 13.5% |
| Some other Race | 63 | 0.7% |
| Total | 9,309 | 100.0% |
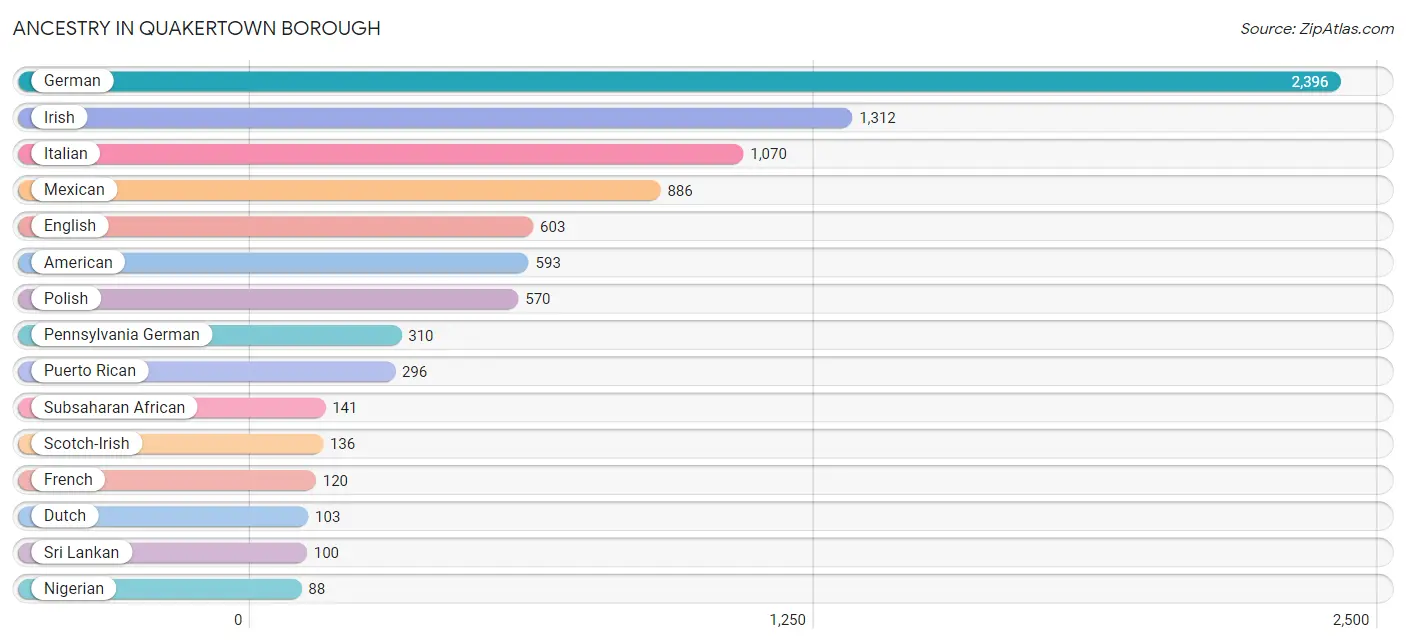
Ancestry in Quakertown borough
The most populous ancestries reported in Quakertown borough are German (2,396 | 25.7%), Irish (1,312 | 14.1%), Italian (1,070 | 11.5%), Mexican (886 | 9.5%), and English (603 | 6.5%), together accounting for 67.3% of all Quakertown borough residents.
| Ancestry | # Population | % Population |
| African | 53 | 0.6% |
| American | 593 | 6.4% |
| Arab | 18 | 0.2% |
| Armenian | 23 | 0.3% |
| Austrian | 24 | 0.3% |
| Barbadian | 22 | 0.2% |
| Belgian | 6 | 0.1% |
| Blackfeet | 16 | 0.2% |
| British | 19 | 0.2% |
| Bulgarian | 16 | 0.2% |
| Burmese | 29 | 0.3% |
| Canadian | 11 | 0.1% |
| Celtic | 7 | 0.1% |
| Central American | 77 | 0.8% |
| Cherokee | 6 | 0.1% |
| Colombian | 12 | 0.1% |
| Costa Rican | 19 | 0.2% |
| Cuban | 2 | 0.0% |
| Czech | 9 | 0.1% |
| Czechoslovakian | 4 | 0.0% |
| Danish | 11 | 0.1% |
| Delaware | 1 | 0.0% |
| Dominican | 14 | 0.2% |
| Dutch | 103 | 1.1% |
| Egyptian | 10 | 0.1% |
| English | 603 | 6.5% |
| European | 62 | 0.7% |
| French | 120 | 1.3% |
| French Canadian | 11 | 0.1% |
| German | 2,396 | 25.7% |
| Greek | 5 | 0.1% |
| Haitian | 18 | 0.2% |
| Hungarian | 19 | 0.2% |
| Irish | 1,312 | 14.1% |
| Iroquois | 4 | 0.0% |
| Italian | 1,070 | 11.5% |
| Jamaican | 80 | 0.9% |
| Korean | 38 | 0.4% |
| Lithuanian | 56 | 0.6% |
| Mexican | 886 | 9.5% |
| Nigerian | 88 | 0.9% |
| Norwegian | 45 | 0.5% |
| Pennsylvania German | 310 | 3.3% |
| Peruvian | 20 | 0.2% |
| Polish | 570 | 6.1% |
| Puerto Rican | 296 | 3.2% |
| Romanian | 12 | 0.1% |
| Russian | 49 | 0.5% |
| Salvadoran | 58 | 0.6% |
| Scandinavian | 5 | 0.1% |
| Scotch-Irish | 136 | 1.5% |
| Scottish | 32 | 0.3% |
| Slovak | 75 | 0.8% |
| South American | 45 | 0.5% |
| Sri Lankan | 100 | 1.1% |
| Subsaharan African | 141 | 1.5% |
| Swedish | 47 | 0.5% |
| Swiss | 68 | 0.7% |
| Syrian | 8 | 0.1% |
| Thai | 44 | 0.5% |
| Turkish | 10 | 0.1% |
| Ukrainian | 51 | 0.5% |
| Venezuelan | 13 | 0.1% |
| Welsh | 68 | 0.7% | View All 64 Rows |
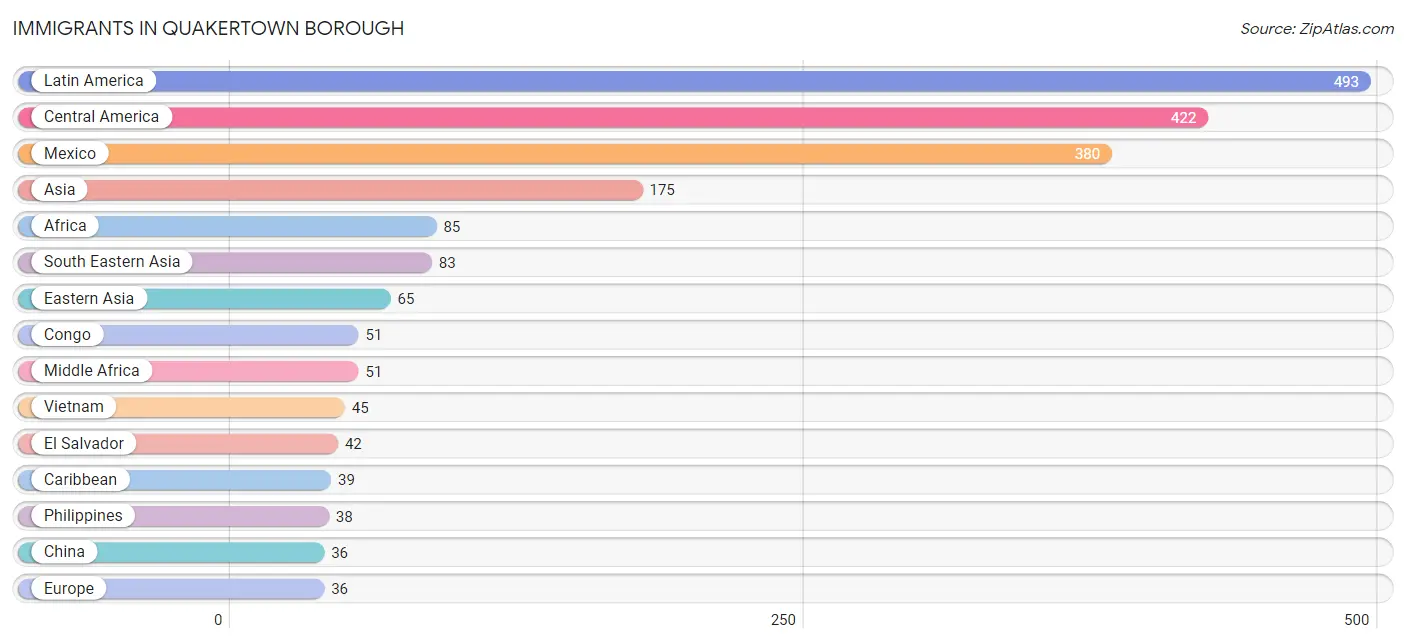
Immigrants in Quakertown borough
The most numerous immigrant groups reported in Quakertown borough came from Latin America (493 | 5.3%), Central America (422 | 4.5%), Mexico (380 | 4.1%), Asia (175 | 1.9%), and Africa (85 | 0.9%), together accounting for 16.7% of all Quakertown borough residents.
| Immigration Origin | # Population | % Population |
| Africa | 85 | 0.9% |
| Asia | 175 | 1.9% |
| Austria | 6 | 0.1% |
| Barbados | 22 | 0.2% |
| Canada | 5 | 0.1% |
| Caribbean | 39 | 0.4% |
| Central America | 422 | 4.5% |
| China | 36 | 0.4% |
| Colombia | 8 | 0.1% |
| Congo | 51 | 0.5% |
| Eastern Africa | 1 | 0.0% |
| Eastern Asia | 65 | 0.7% |
| Eastern Europe | 25 | 0.3% |
| El Salvador | 42 | 0.4% |
| Europe | 36 | 0.4% |
| Germany | 5 | 0.1% |
| India | 27 | 0.3% |
| Jamaica | 17 | 0.2% |
| Korea | 29 | 0.3% |
| Latin America | 493 | 5.3% |
| Mexico | 380 | 4.1% |
| Middle Africa | 51 | 0.5% |
| Nigeria | 33 | 0.4% |
| Peru | 11 | 0.1% |
| Philippines | 38 | 0.4% |
| Poland | 11 | 0.1% |
| Romania | 4 | 0.0% |
| South America | 32 | 0.3% |
| South Central Asia | 27 | 0.3% |
| South Eastern Asia | 83 | 0.9% |
| Ukraine | 10 | 0.1% |
| Venezuela | 13 | 0.1% |
| Vietnam | 45 | 0.5% |
| Western Africa | 33 | 0.4% |
| Western Europe | 11 | 0.1% | View All 35 Rows |
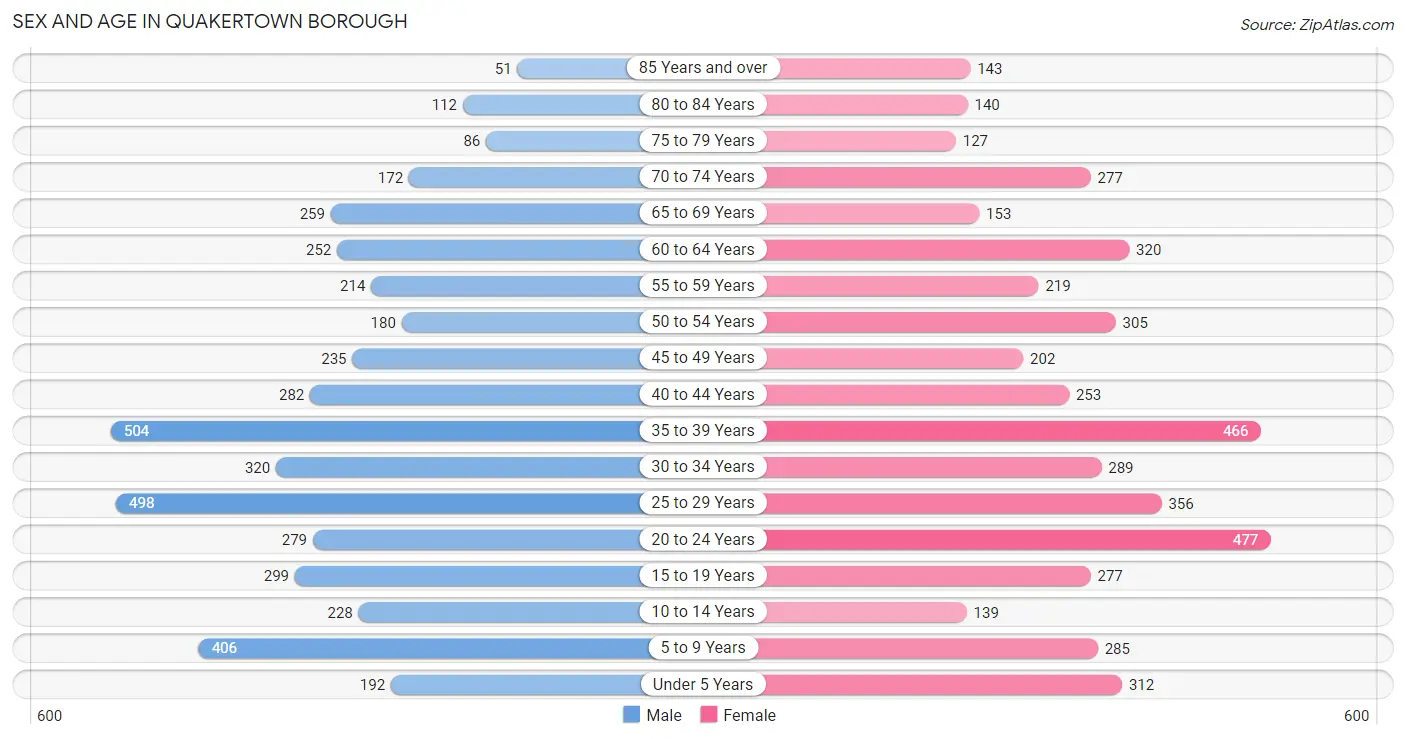
Sex and Age in Quakertown borough
Sex and Age in Quakertown borough
The most populous age groups in Quakertown borough are 35 to 39 Years (504 | 11.0%) for men and 20 to 24 Years (477 | 10.1%) for women.
| Age Bracket | Male | Female |
| Under 5 Years | 192 (4.2%) | 312 (6.6%) |
| 5 to 9 Years | 406 (8.9%) | 285 (6.0%) |
| 10 to 14 Years | 228 (5.0%) | 139 (2.9%) |
| 15 to 19 Years | 299 (6.5%) | 277 (5.8%) |
| 20 to 24 Years | 279 (6.1%) | 477 (10.1%) |
| 25 to 29 Years | 498 (10.9%) | 356 (7.5%) |
| 30 to 34 Years | 320 (7.0%) | 289 (6.1%) |
| 35 to 39 Years | 504 (11.0%) | 466 (9.8%) |
| 40 to 44 Years | 282 (6.2%) | 253 (5.3%) |
| 45 to 49 Years | 235 (5.1%) | 202 (4.3%) |
| 50 to 54 Years | 180 (3.9%) | 305 (6.4%) |
| 55 to 59 Years | 214 (4.7%) | 219 (4.6%) |
| 60 to 64 Years | 252 (5.5%) | 320 (6.8%) |
| 65 to 69 Years | 259 (5.7%) | 153 (3.2%) |
| 70 to 74 Years | 172 (3.8%) | 277 (5.8%) |
| 75 to 79 Years | 86 (1.9%) | 127 (2.7%) |
| 80 to 84 Years | 112 (2.5%) | 140 (2.9%) |
| 85 Years and over | 51 (1.1%) | 143 (3.0%) |
| Total | 4,569 (100.0%) | 4,740 (100.0%) |
Families and Households in Quakertown borough
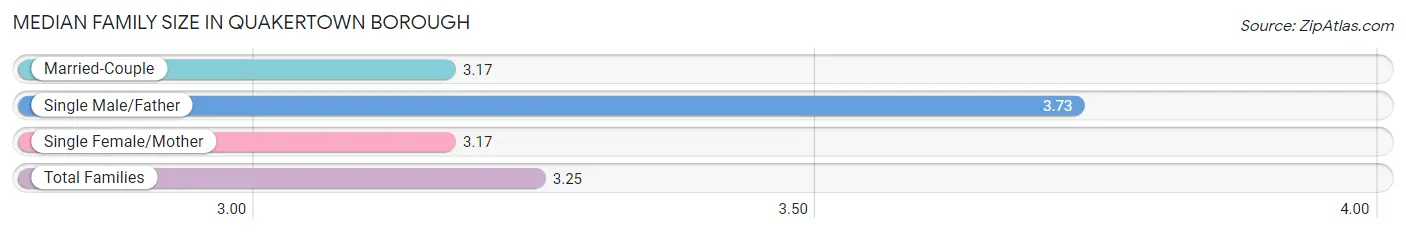
Median Family Size in Quakertown borough
The median family size in Quakertown borough is 3.25 persons per family, with single male/father families (299 | 14.5%) accounting for the largest median family size of 3.73 persons per family. On the other hand, married-couple families (1,344 | 65.3%) represent the smallest median family size with 3.17 persons per family.
| Family Type | # Families | Family Size |
| Married-Couple | 1,344 (65.3%) | 3.17 |
| Single Male/Father | 299 (14.5%) | 3.73 |
| Single Female/Mother | 416 (20.2%) | 3.17 |
| Total Families | 2,059 (100.0%) | 3.25 |
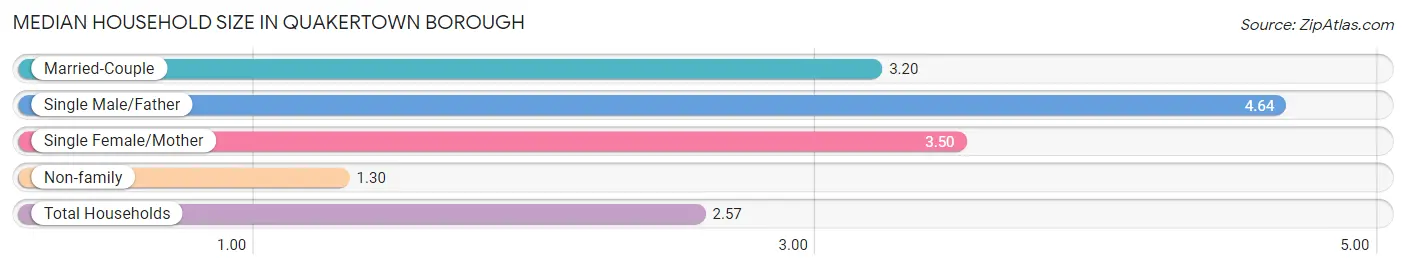
Median Household Size in Quakertown borough
The median household size in Quakertown borough is 2.57 persons per household, with single male/father households (299 | 8.5%) accounting for the largest median household size of 4.64 persons per household. non-family households (1,451 | 41.3%) represent the smallest median household size with 1.30 persons per household.
| Household Type | # Households | Household Size |
| Married-Couple | 1,344 (38.3%) | 3.20 |
| Single Male/Father | 299 (8.5%) | 4.64 |
| Single Female/Mother | 416 (11.8%) | 3.50 |
| Non-family | 1,451 (41.3%) | 1.30 |
| Total Households | 3,510 (100.0%) | 2.57 |
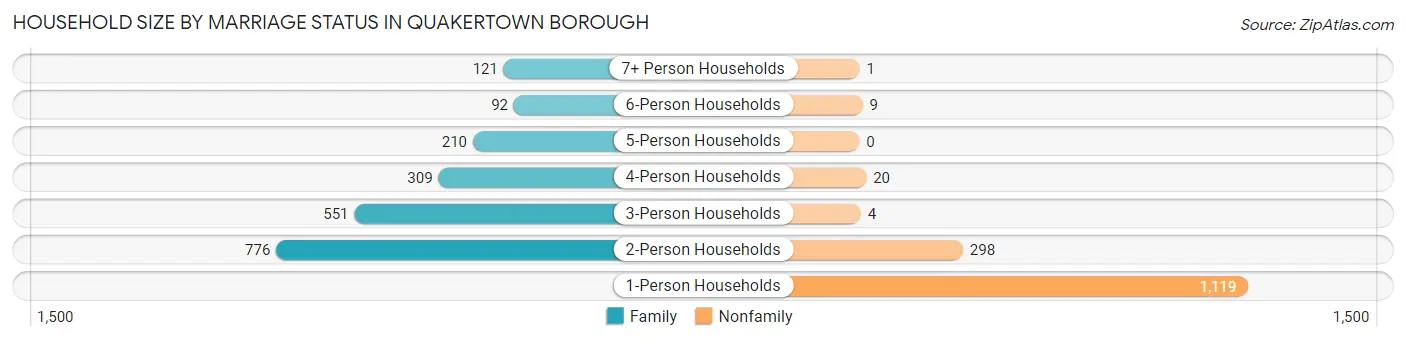
Household Size by Marriage Status in Quakertown borough
Out of a total of 3,510 households in Quakertown borough, 2,059 (58.7%) are family households, while 1,451 (41.3%) are nonfamily households. The most numerous type of family households are 2-person households, comprising 776, and the most common type of nonfamily households are 1-person households, comprising 1,119.
| Household Size | Family Households | Nonfamily Households |
| 1-Person Households | - | 1,119 (31.9%) |
| 2-Person Households | 776 (22.1%) | 298 (8.5%) |
| 3-Person Households | 551 (15.7%) | 4 (0.1%) |
| 4-Person Households | 309 (8.8%) | 20 (0.6%) |
| 5-Person Households | 210 (6.0%) | 0 (0.0%) |
| 6-Person Households | 92 (2.6%) | 9 (0.3%) |
| 7+ Person Households | 121 (3.5%) | 1 (0.0%) |
| Total | 2,059 (58.7%) | 1,451 (41.3%) |
Female Fertility in Quakertown borough
Fertility by Age in Quakertown borough
Average fertility rate in Quakertown borough is 45.0 births per 1,000 women. Women in the age bracket of 20 to 34 years have the highest fertility rate with 71.0 births per 1,000 women. Women in the age bracket of 20 to 34 years acount for 74.8% of all women with births.
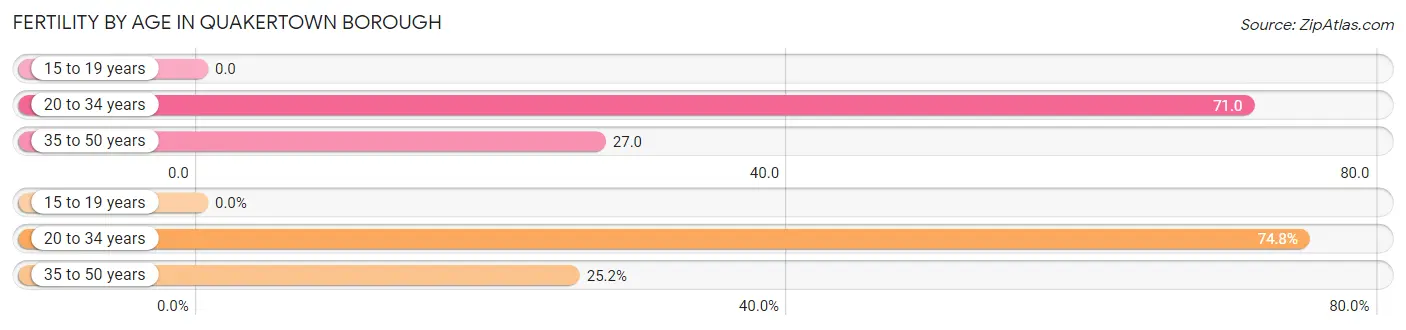
| Age Bracket | Women with Births | Births / 1,000 Women |
| 15 to 19 years | 0 (0.0%) | 0.0 |
| 20 to 34 years | 80 (74.8%) | 71.0 |
| 35 to 50 years | 27 (25.2%) | 27.0 |
| Total | 107 (100.0%) | 45.0 |
Fertility by Age by Marriage Status in Quakertown borough
60.7% of women with births (107) in Quakertown borough are married. The highest percentage of unmarried women with births falls into 20 to 34 years age bracket with 43.8% of them unmarried at the time of birth, while the lowest percentage of unmarried women with births belong to 35 to 50 years age bracket with 25.9% of them unmarried.
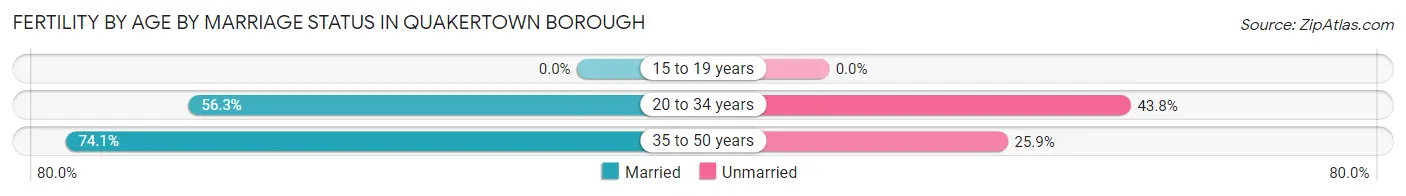
| Age Bracket | Married | Unmarried |
| 15 to 19 years | 0 (0.0%) | 0 (0.0%) |
| 20 to 34 years | 45 (56.2%) | 35 (43.8%) |
| 35 to 50 years | 20 (74.1%) | 7 (25.9%) |
| Total | 65 (60.8%) | 42 (39.3%) |
Fertility by Education in Quakertown borough
Average fertility rate in Quakertown borough is 45.0 births per 1,000 women. Women with the education attainment of bachelor's degree have the highest fertility rate of 104.0 births per 1,000 women, while women with the education attainment of high school diploma have the lowest fertility at 5.0 births per 1,000 women. Women with the education attainment of college or associate's degree represent 40.2% of all women with births.
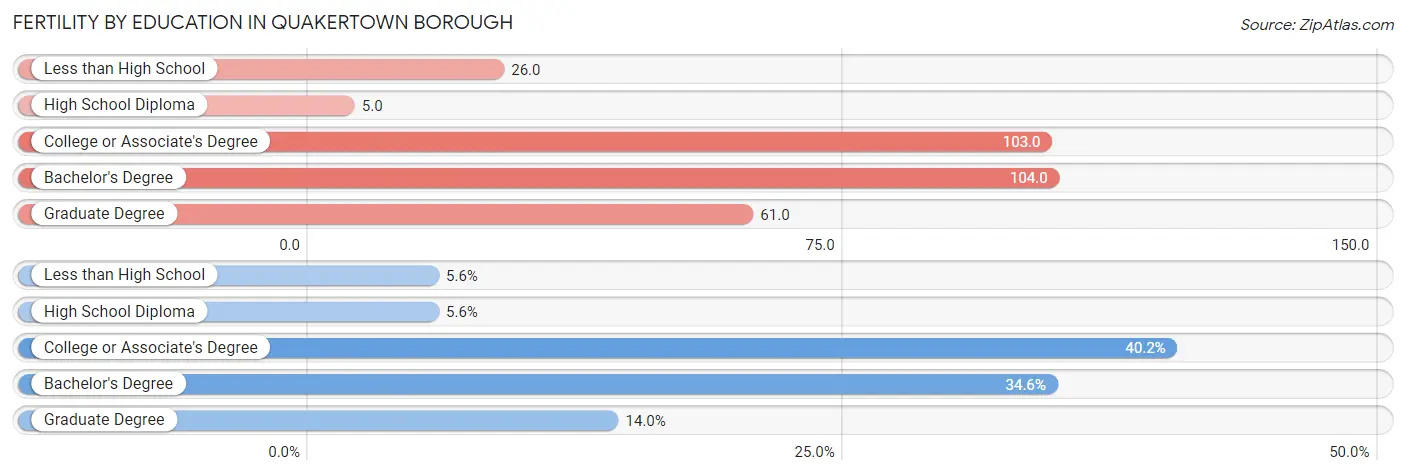
| Educational Attainment | Women with Births | Births / 1,000 Women |
| Less than High School | 6 (5.6%) | 26.0 |
| High School Diploma | 6 (5.6%) | 5.0 |
| College or Associate's Degree | 43 (40.2%) | 103.0 |
| Bachelor's Degree | 37 (34.6%) | 104.0 |
| Graduate Degree | 15 (14.0%) | 61.0 |
| Total | 107 (100.0%) | 45.0 |
Fertility by Education by Marriage Status in Quakertown borough
39.3% of women with births in Quakertown borough are unmarried. Women with the educational attainment of less than high school are most likely to be married with 100.0% of them married at childbirth, while women with the educational attainment of high school diploma are least likely to be married with 100.0% of them unmarried at childbirth.
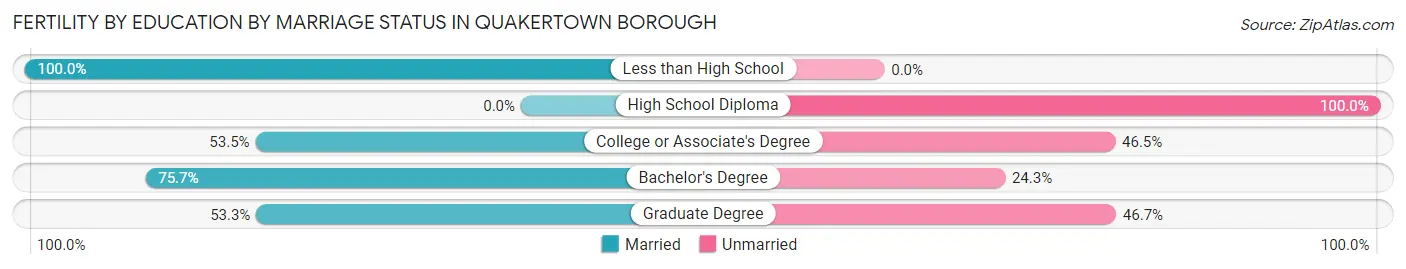
| Educational Attainment | Married | Unmarried |
| Less than High School | 6 (100.0%) | 0 (0.0%) |
| High School Diploma | 0 (0.0%) | 6 (100.0%) |
| College or Associate's Degree | 23 (53.5%) | 20 (46.5%) |
| Bachelor's Degree | 28 (75.7%) | 9 (24.3%) |
| Graduate Degree | 8 (53.3%) | 7 (46.7%) |
| Total | 65 (60.8%) | 42 (39.3%) |
Employment Characteristics in Quakertown borough
Employment by Class of Employer in Quakertown borough
Among the 4,980 employed individuals in Quakertown borough, private company employees (3,994 | 80.2%), not-for-profit organizations (335 | 6.7%), and local government employees (209 | 4.2%) make up the most common classes of employment.
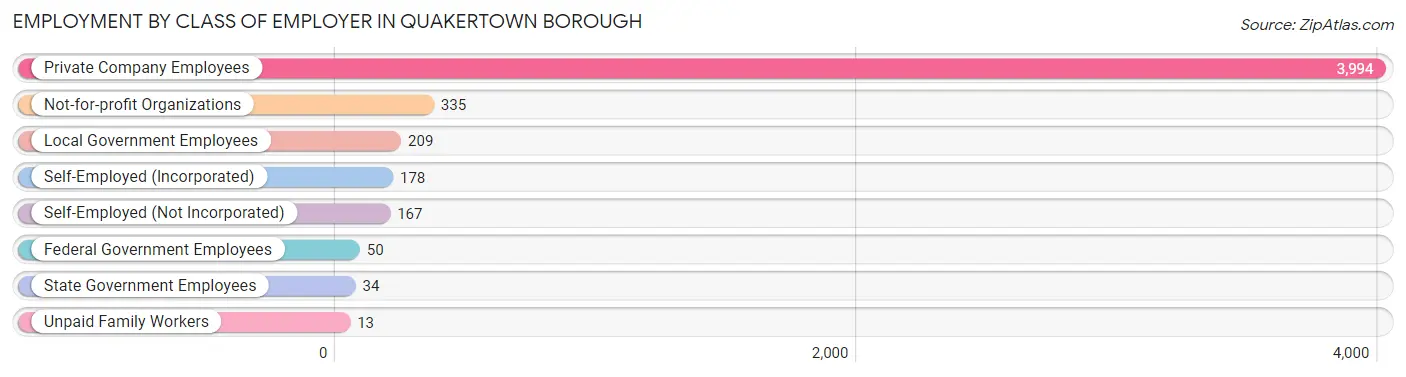
| Employer Class | # Employees | % Employees |
| Private Company Employees | 3,994 | 80.2% |
| Self-Employed (Incorporated) | 178 | 3.6% |
| Self-Employed (Not Incorporated) | 167 | 3.4% |
| Not-for-profit Organizations | 335 | 6.7% |
| Local Government Employees | 209 | 4.2% |
| State Government Employees | 34 | 0.7% |
| Federal Government Employees | 50 | 1.0% |
| Unpaid Family Workers | 13 | 0.3% |
| Total | 4,980 | 100.0% |
Employment Status by Age in Quakertown borough
According to the labor force statistics for Quakertown borough, out of the total population over 16 years of age (7,639), 70.6% or 5,393 individuals are in the labor force, with 6.4% or 345 of them unemployed. The age group with the highest labor force participation rate is 35 to 44 years, with 91.3% or 1,374 individuals in the labor force. Within the labor force, the 16 to 19 years age range has the highest percentage of unemployed individuals, with 22.0% or 56 of them being unemployed.
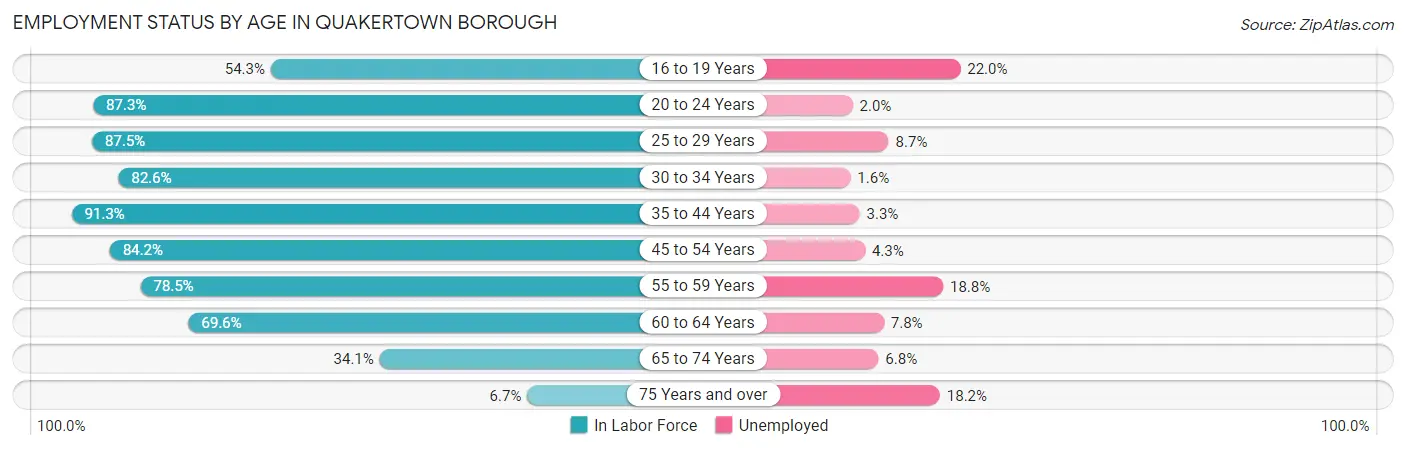
| Age Bracket | In Labor Force | Unemployed |
| 16 to 19 Years | 254 (54.3%) | 56 (22.0%) |
| 20 to 24 Years | 660 (87.3%) | 13 (2.0%) |
| 25 to 29 Years | 747 (87.5%) | 65 (8.7%) |
| 30 to 34 Years | 503 (82.6%) | 8 (1.6%) |
| 35 to 44 Years | 1,374 (91.3%) | 45 (3.3%) |
| 45 to 54 Years | 776 (84.2%) | 33 (4.3%) |
| 55 to 59 Years | 340 (78.5%) | 64 (18.8%) |
| 60 to 64 Years | 398 (69.6%) | 31 (7.8%) |
| 65 to 74 Years | 294 (34.1%) | 20 (6.8%) |
| 75 Years and over | 44 (6.7%) | 8 (18.2%) |
| Total | 5,393 (70.6%) | 345 (6.4%) |
Employment Status by Educational Attainment in Quakertown borough
According to labor force statistics for Quakertown borough, 84.5% of individuals (4,136) out of the total population between 25 and 64 years of age (4,895) are in the labor force, with 5.9% or 244 of them being unemployed. The group with the highest labor force participation rate are those with the educational attainment of bachelor's degree or higher, with 88.6% or 1,033 individuals in the labor force. Within the labor force, individuals with bachelor's degree or higher education have the highest percentage of unemployment, with 8.5% or 88 of them being unemployed.
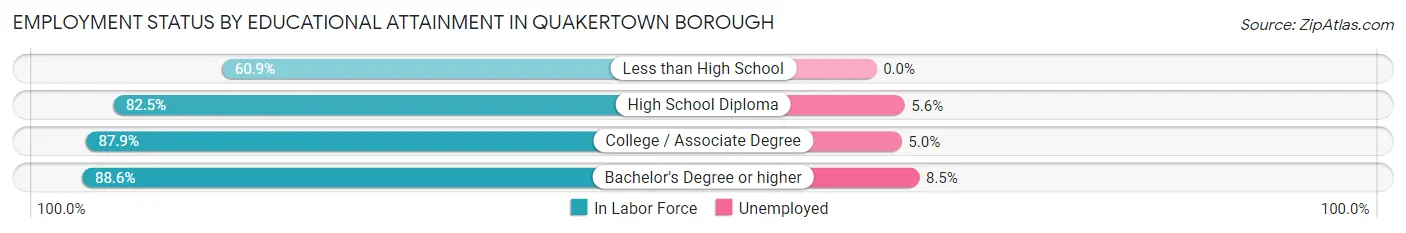
| Educational Attainment | In Labor Force | Unemployed |
| Less than High School | 137 (60.9%) | 0 (0.0%) |
| High School Diploma | 1,705 (82.5%) | 116 (5.6%) |
| College / Associate Degree | 1,263 (87.9%) | 72 (5.0%) |
| Bachelor's Degree or higher | 1,033 (88.6%) | 99 (8.5%) |
| Total | 4,136 (84.5%) | 289 (5.9%) |
Employment Occupations by Sex in Quakertown borough
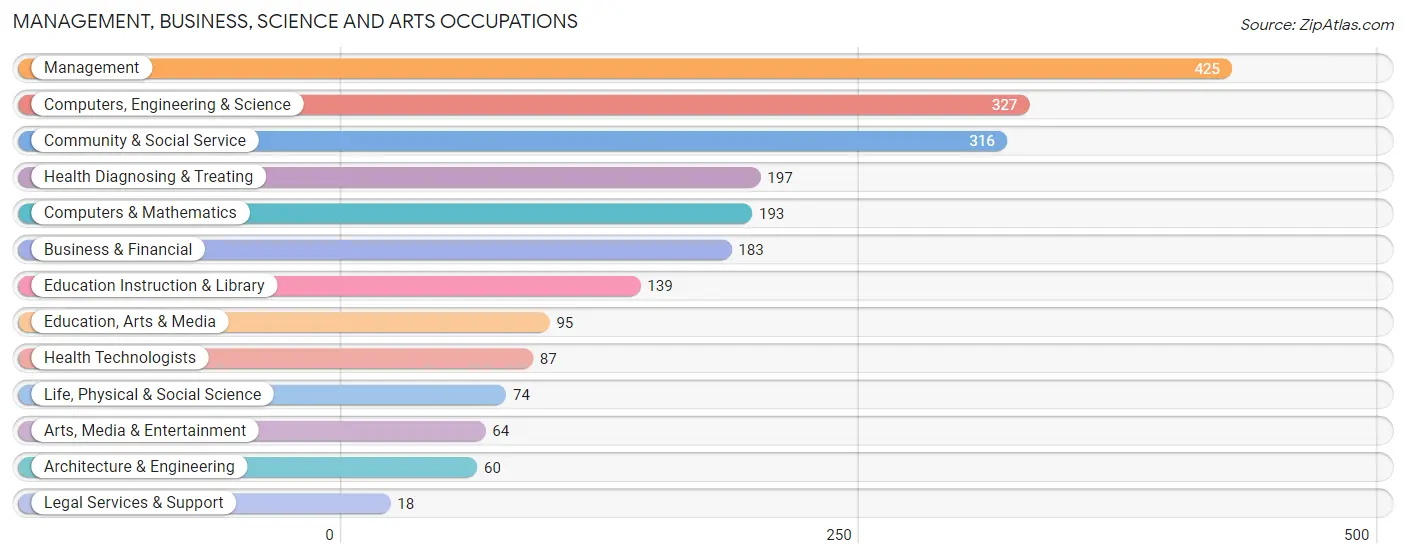
Management, Business, Science and Arts Occupations
The most common Management, Business, Science and Arts occupations in Quakertown borough are Management (425 | 8.4%), Computers, Engineering & Science (327 | 6.5%), Community & Social Service (316 | 6.3%), Health Diagnosing & Treating (197 | 3.9%), and Computers & Mathematics (193 | 3.8%).
Management, Business, Science and Arts Occupations by Sex
Within the Management, Business, Science and Arts occupations in Quakertown borough, the most male-oriented occupations are Life, Physical & Social Science (100.0%), Arts, Media & Entertainment (76.6%), and Computers, Engineering & Science (69.7%), while the most female-oriented occupations are Health Diagnosing & Treating (92.4%), Health Technologists (89.7%), and Education Instruction & Library (64.7%).
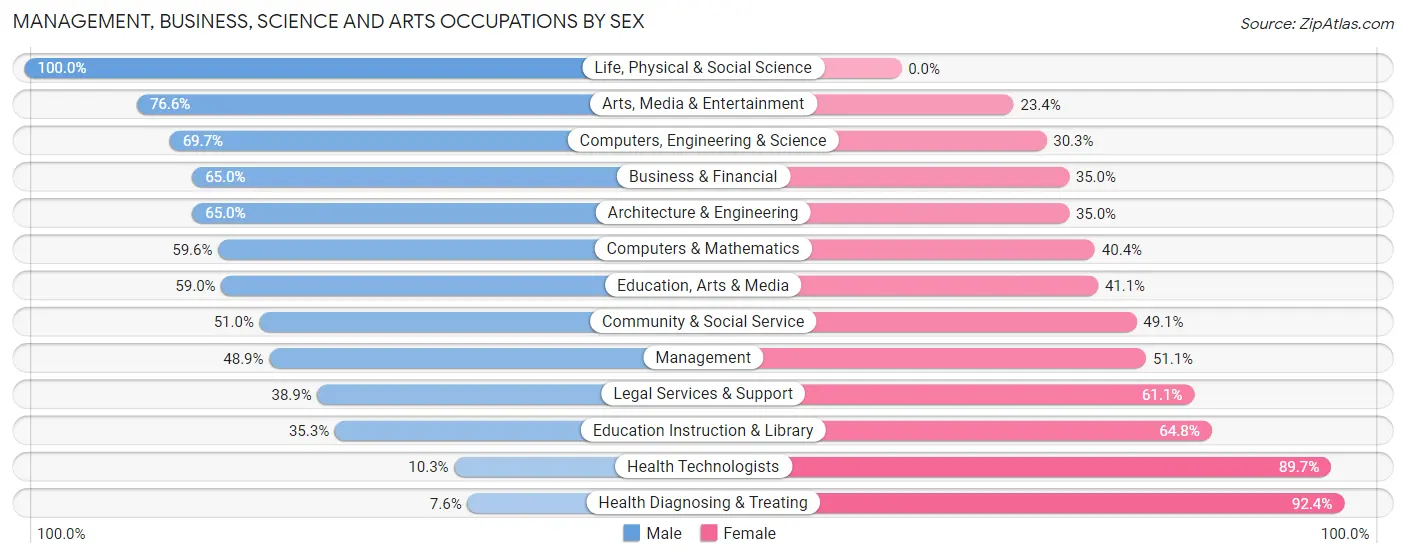
| Occupation | Male | Female |
| Management | 208 (48.9%) | 217 (51.1%) |
| Business & Financial | 119 (65.0%) | 64 (35.0%) |
| Computers, Engineering & Science | 228 (69.7%) | 99 (30.3%) |
| Computers & Mathematics | 115 (59.6%) | 78 (40.4%) |
| Architecture & Engineering | 39 (65.0%) | 21 (35.0%) |
| Life, Physical & Social Science | 74 (100.0%) | 0 (0.0%) |
| Community & Social Service | 161 (50.9%) | 155 (49.0%) |
| Education, Arts & Media | 56 (59.0%) | 39 (41.0%) |
| Legal Services & Support | 7 (38.9%) | 11 (61.1%) |
| Education Instruction & Library | 49 (35.2%) | 90 (64.7%) |
| Arts, Media & Entertainment | 49 (76.6%) | 15 (23.4%) |
| Health Diagnosing & Treating | 15 (7.6%) | 182 (92.4%) |
| Health Technologists | 9 (10.3%) | 78 (89.7%) |
| Total (Category) | 731 (50.5%) | 717 (49.5%) |
| Total (Overall) | 2,678 (53.1%) | 2,369 (46.9%) |
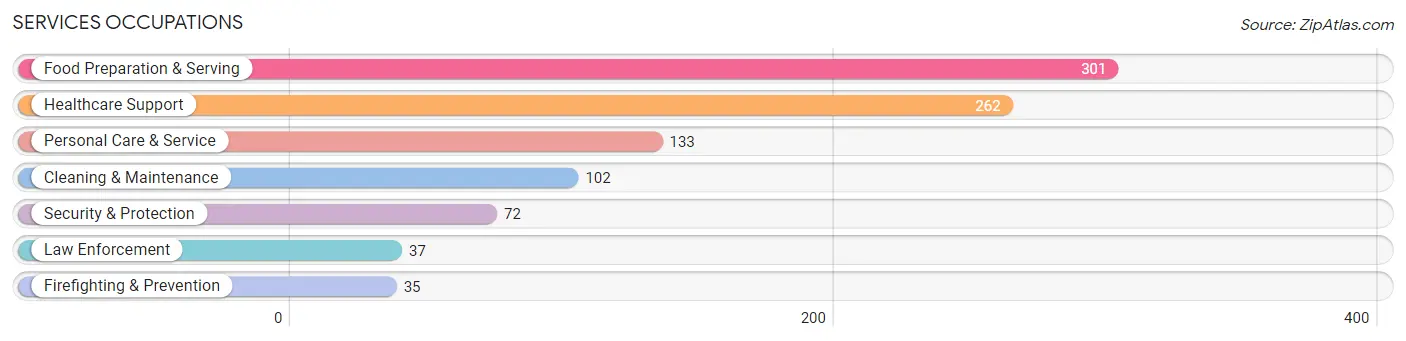
Services Occupations
The most common Services occupations in Quakertown borough are Food Preparation & Serving (301 | 6.0%), Healthcare Support (262 | 5.2%), Personal Care & Service (133 | 2.6%), Cleaning & Maintenance (102 | 2.0%), and Security & Protection (72 | 1.4%).
Services Occupations by Sex
Within the Services occupations in Quakertown borough, the most male-oriented occupations are Law Enforcement (97.3%), Security & Protection (83.3%), and Firefighting & Prevention (68.6%), while the most female-oriented occupations are Personal Care & Service (100.0%), Healthcare Support (52.7%), and Food Preparation & Serving (51.5%).
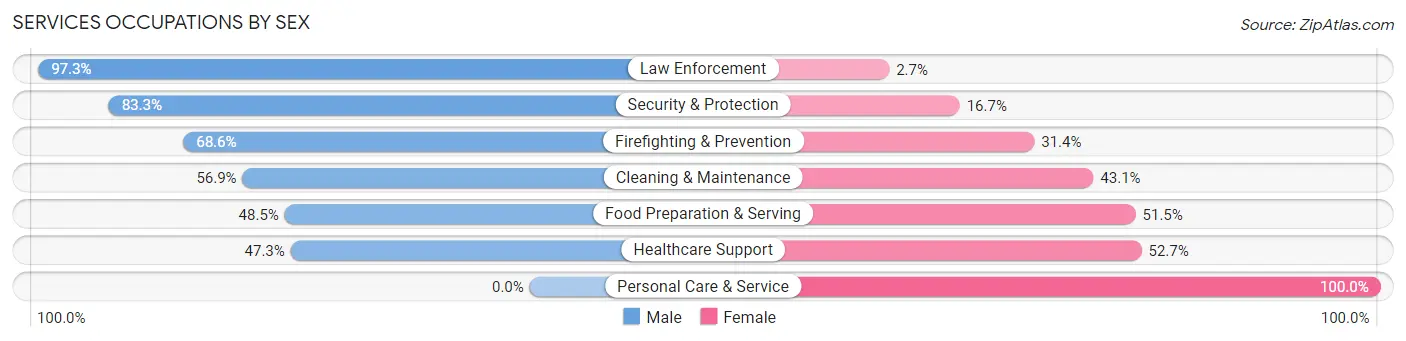
| Occupation | Male | Female |
| Healthcare Support | 124 (47.3%) | 138 (52.7%) |
| Security & Protection | 60 (83.3%) | 12 (16.7%) |
| Firefighting & Prevention | 24 (68.6%) | 11 (31.4%) |
| Law Enforcement | 36 (97.3%) | 1 (2.7%) |
| Food Preparation & Serving | 146 (48.5%) | 155 (51.5%) |
| Cleaning & Maintenance | 58 (56.9%) | 44 (43.1%) |
| Personal Care & Service | 0 (0.0%) | 133 (100.0%) |
| Total (Category) | 388 (44.6%) | 482 (55.4%) |
| Total (Overall) | 2,678 (53.1%) | 2,369 (46.9%) |
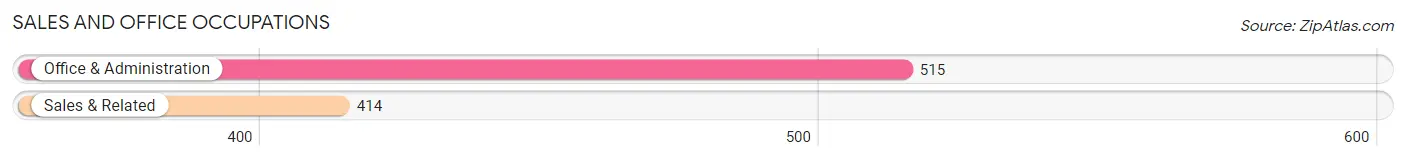
Sales and Office Occupations
The most common Sales and Office occupations in Quakertown borough are Office & Administration (515 | 10.2%), and Sales & Related (414 | 8.2%).
Sales and Office Occupations by Sex
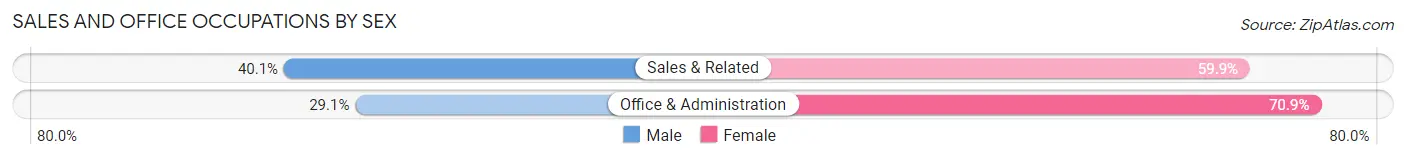
| Occupation | Male | Female |
| Sales & Related | 166 (40.1%) | 248 (59.9%) |
| Office & Administration | 150 (29.1%) | 365 (70.9%) |
| Total (Category) | 316 (34.0%) | 613 (66.0%) |
| Total (Overall) | 2,678 (53.1%) | 2,369 (46.9%) |
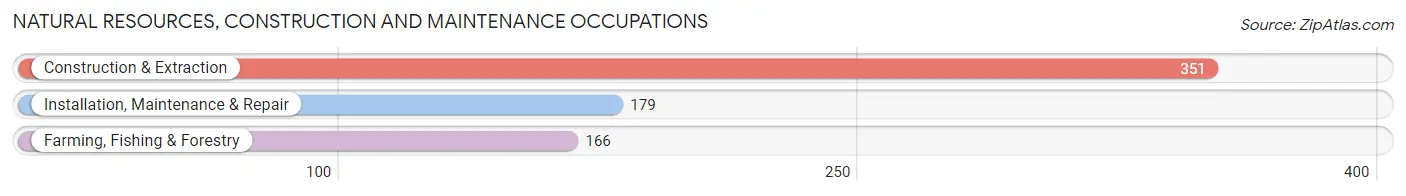
Natural Resources, Construction and Maintenance Occupations
The most common Natural Resources, Construction and Maintenance occupations in Quakertown borough are Construction & Extraction (351 | 7.0%), Installation, Maintenance & Repair (179 | 3.5%), and Farming, Fishing & Forestry (166 | 3.3%).
Natural Resources, Construction and Maintenance Occupations by Sex
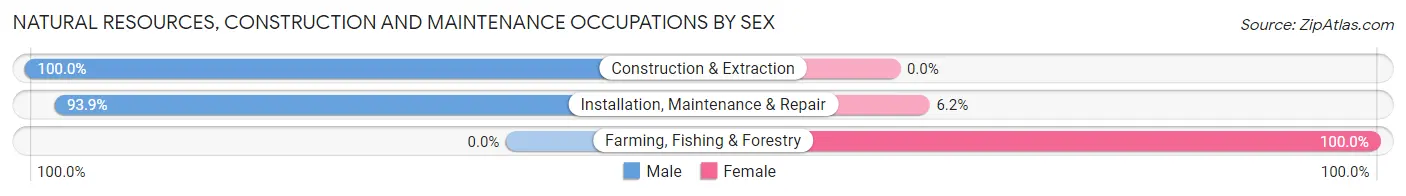
| Occupation | Male | Female |
| Farming, Fishing & Forestry | 0 (0.0%) | 166 (100.0%) |
| Construction & Extraction | 351 (100.0%) | 0 (0.0%) |
| Installation, Maintenance & Repair | 168 (93.9%) | 11 (6.1%) |
| Total (Category) | 519 (74.6%) | 177 (25.4%) |
| Total (Overall) | 2,678 (53.1%) | 2,369 (46.9%) |
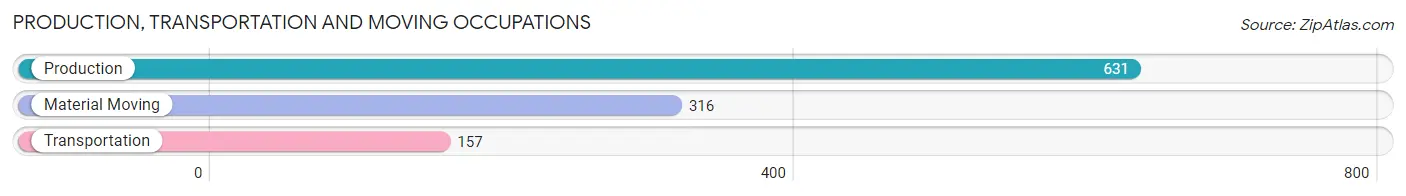
Production, Transportation and Moving Occupations
The most common Production, Transportation and Moving occupations in Quakertown borough are Production (631 | 12.5%), Material Moving (316 | 6.3%), and Transportation (157 | 3.1%).
Production, Transportation and Moving Occupations by Sex
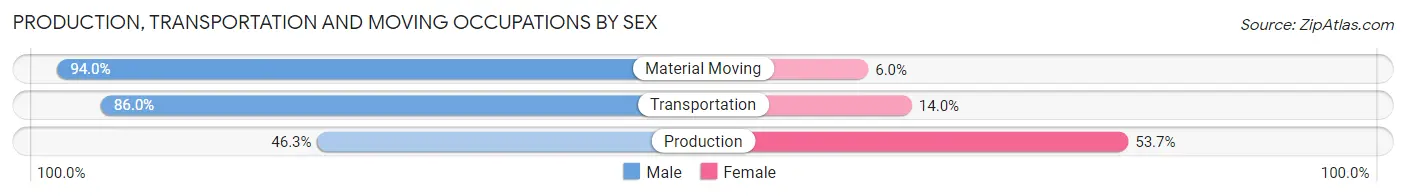
| Occupation | Male | Female |
| Production | 292 (46.3%) | 339 (53.7%) |
| Transportation | 135 (86.0%) | 22 (14.0%) |
| Material Moving | 297 (94.0%) | 19 (6.0%) |
| Total (Category) | 724 (65.6%) | 380 (34.4%) |
| Total (Overall) | 2,678 (53.1%) | 2,369 (46.9%) |
Employment Industries by Sex in Quakertown borough
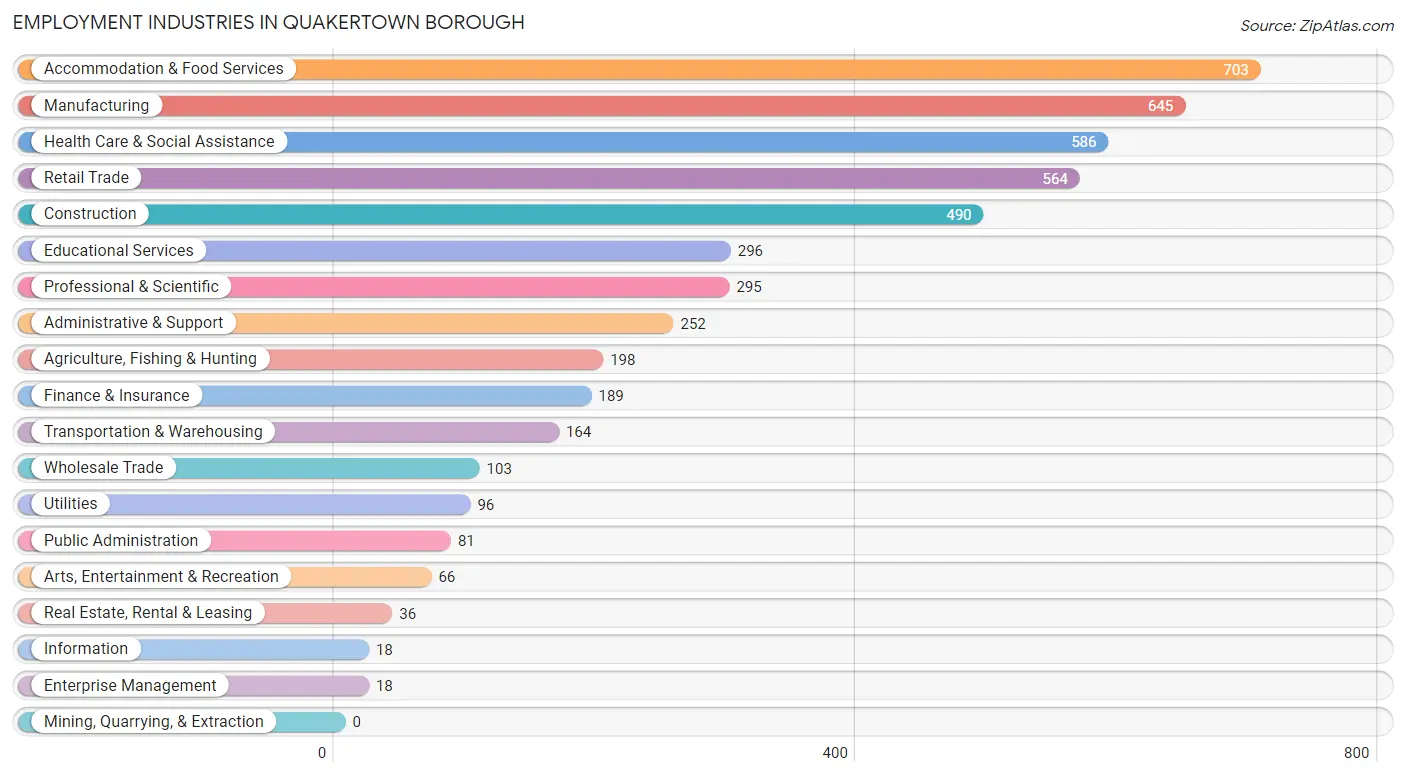
Employment Industries in Quakertown borough
The major employment industries in Quakertown borough include Accommodation & Food Services (703 | 13.9%), Manufacturing (645 | 12.8%), Health Care & Social Assistance (586 | 11.6%), Retail Trade (564 | 11.2%), and Construction (490 | 9.7%).
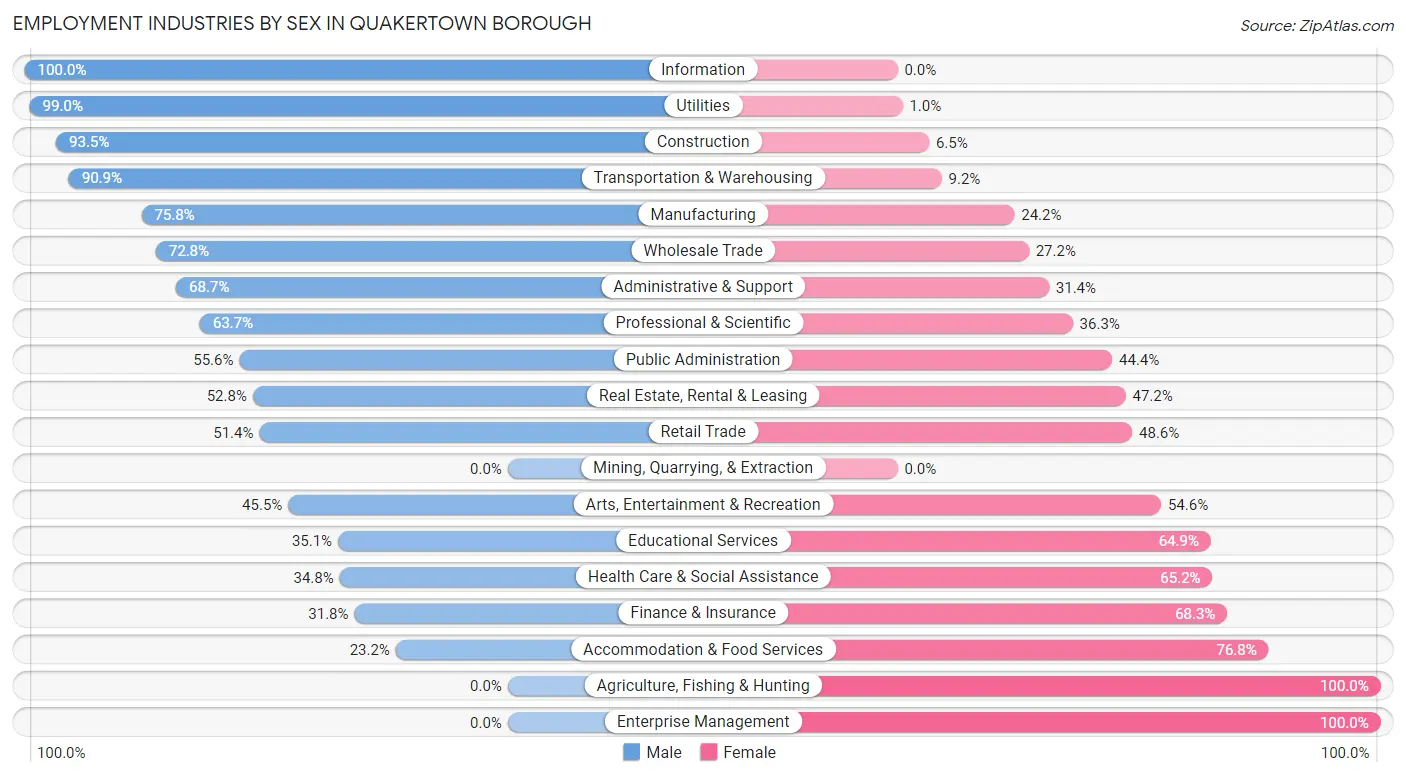
Employment Industries by Sex in Quakertown borough
The Quakertown borough industries that see more men than women are Information (100.0%), Utilities (99.0%), and Construction (93.5%), whereas the industries that tend to have a higher number of women are Agriculture, Fishing & Hunting (100.0%), Enterprise Management (100.0%), and Accommodation & Food Services (76.8%).
| Industry | Male | Female |
| Agriculture, Fishing & Hunting | 0 (0.0%) | 198 (100.0%) |
| Mining, Quarrying, & Extraction | 0 (0.0%) | 0 (0.0%) |
| Construction | 458 (93.5%) | 32 (6.5%) |
| Manufacturing | 489 (75.8%) | 156 (24.2%) |
| Wholesale Trade | 75 (72.8%) | 28 (27.2%) |
| Retail Trade | 290 (51.4%) | 274 (48.6%) |
| Transportation & Warehousing | 149 (90.8%) | 15 (9.1%) |
| Utilities | 95 (99.0%) | 1 (1.0%) |
| Information | 18 (100.0%) | 0 (0.0%) |
| Finance & Insurance | 60 (31.8%) | 129 (68.2%) |
| Real Estate, Rental & Leasing | 19 (52.8%) | 17 (47.2%) |
| Professional & Scientific | 188 (63.7%) | 107 (36.3%) |
| Enterprise Management | 0 (0.0%) | 18 (100.0%) |
| Administrative & Support | 173 (68.6%) | 79 (31.4%) |
| Educational Services | 104 (35.1%) | 192 (64.9%) |
| Health Care & Social Assistance | 204 (34.8%) | 382 (65.2%) |
| Arts, Entertainment & Recreation | 30 (45.5%) | 36 (54.5%) |
| Accommodation & Food Services | 163 (23.2%) | 540 (76.8%) |
| Public Administration | 45 (55.6%) | 36 (44.4%) |
| Total | 2,678 (53.1%) | 2,369 (46.9%) |
Education in Quakertown borough
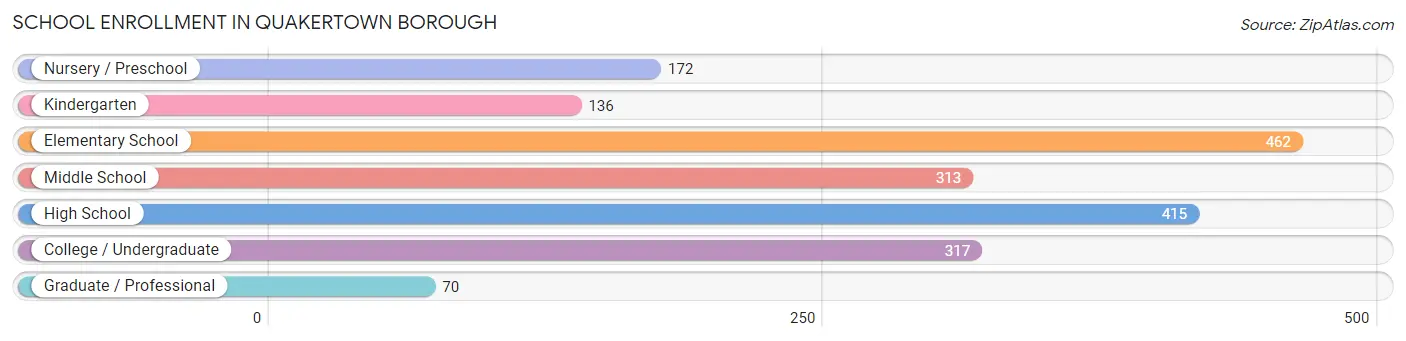
School Enrollment in Quakertown borough
The most common levels of schooling among the 1,885 students in Quakertown borough are elementary school (462 | 24.5%), high school (415 | 22.0%), and college / undergraduate (317 | 16.8%).
| School Level | # Students | % Students |
| Nursery / Preschool | 172 | 9.1% |
| Kindergarten | 136 | 7.2% |
| Elementary School | 462 | 24.5% |
| Middle School | 313 | 16.6% |
| High School | 415 | 22.0% |
| College / Undergraduate | 317 | 16.8% |
| Graduate / Professional | 70 | 3.7% |
| Total | 1,885 | 100.0% |
School Enrollment by Age by Funding Source in Quakertown borough
Out of a total of 1,885 students who are enrolled in schools in Quakertown borough, 445 (23.6%) attend a private institution, while the remaining 1,440 (76.4%) are enrolled in public schools. The age group of 25 to 34 year olds has the highest likelihood of being enrolled in private schools, with 54 (91.5% in the age bracket) enrolled. Conversely, the age group of 18 to 19 year olds has the lowest likelihood of being enrolled in a private school, with 121 (92.4% in the age bracket) attending a public institution.
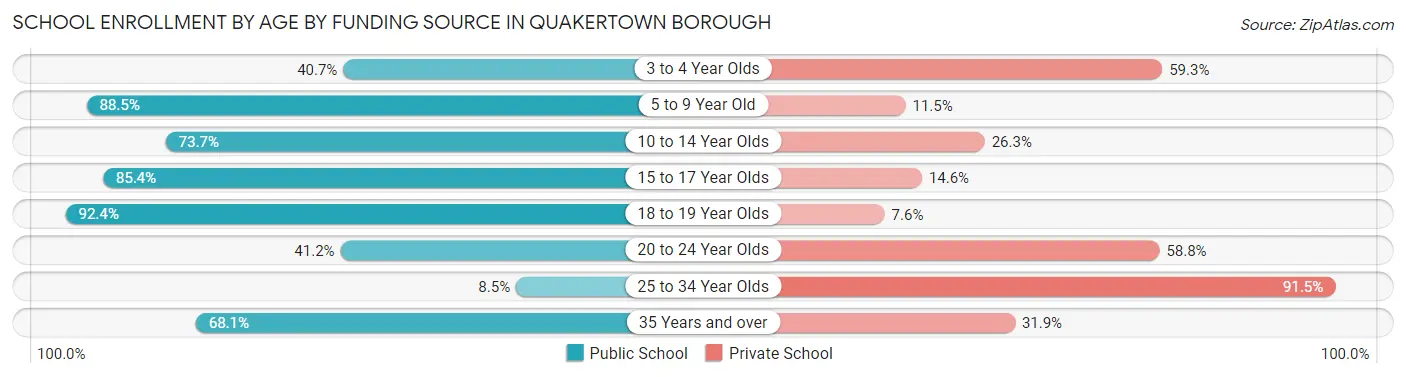
| Age Bracket | Public School | Private School |
| 3 to 4 Year Olds | 37 (40.7%) | 54 (59.3%) |
| 5 to 9 Year Old | 591 (88.5%) | 77 (11.5%) |
| 10 to 14 Year Olds | 247 (73.7%) | 88 (26.3%) |
| 15 to 17 Year Olds | 287 (85.4%) | 49 (14.6%) |
| 18 to 19 Year Olds | 121 (92.4%) | 10 (7.6%) |
| 20 to 24 Year Olds | 42 (41.2%) | 60 (58.8%) |
| 25 to 34 Year Olds | 5 (8.5%) | 54 (91.5%) |
| 35 Years and over | 111 (68.1%) | 52 (31.9%) |
| Total | 1,440 (76.4%) | 445 (23.6%) |
Educational Attainment by Field of Study in Quakertown borough
Business (334 | 20.9%), education (231 | 14.5%), science & technology (124 | 7.8%), visual & performing arts (110 | 6.9%), and arts & humanities (110 | 6.9%) are the most common fields of study among 1,596 individuals in Quakertown borough who have obtained a bachelor's degree or higher.
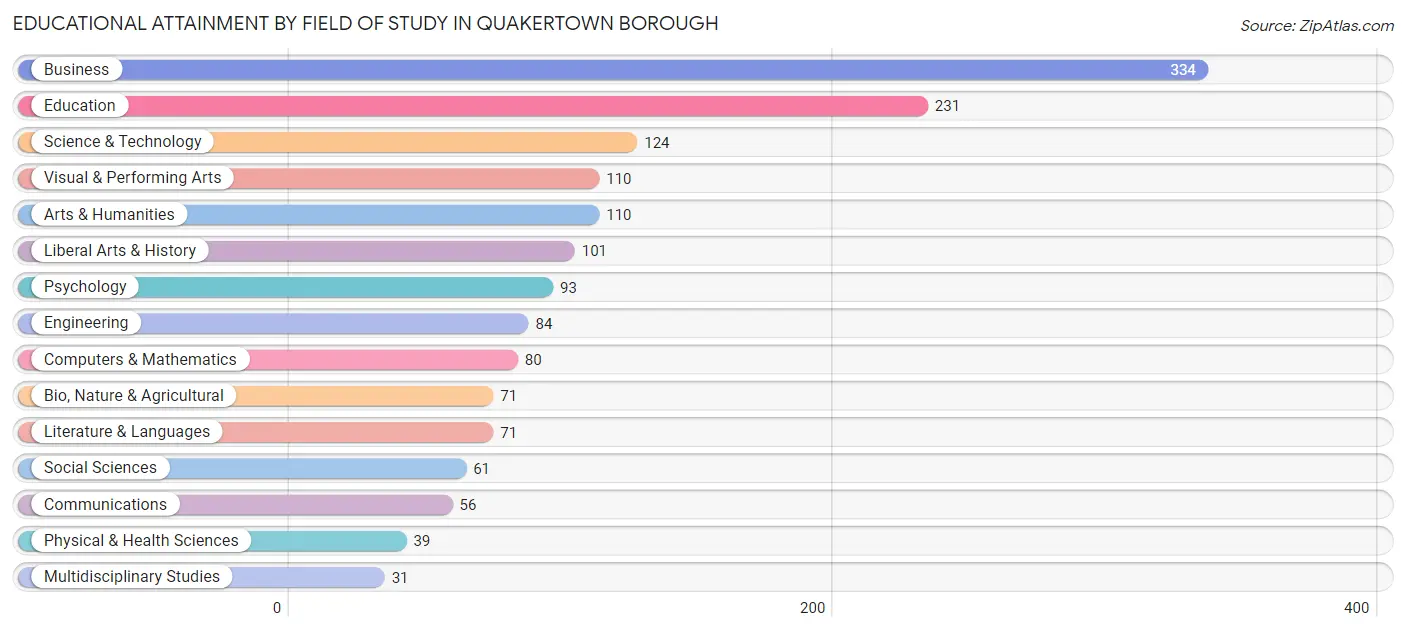
| Field of Study | # Graduates | % Graduates |
| Computers & Mathematics | 80 | 5.0% |
| Bio, Nature & Agricultural | 71 | 4.4% |
| Physical & Health Sciences | 39 | 2.4% |
| Psychology | 93 | 5.8% |
| Social Sciences | 61 | 3.8% |
| Engineering | 84 | 5.3% |
| Multidisciplinary Studies | 31 | 1.9% |
| Science & Technology | 124 | 7.8% |
| Business | 334 | 20.9% |
| Education | 231 | 14.5% |
| Literature & Languages | 71 | 4.4% |
| Liberal Arts & History | 101 | 6.3% |
| Visual & Performing Arts | 110 | 6.9% |
| Communications | 56 | 3.5% |
| Arts & Humanities | 110 | 6.9% |
| Total | 1,596 | 100.0% |
Transportation & Commute in Quakertown borough
Vehicle Availability by Sex in Quakertown borough
The most prevalent vehicle ownership categories in Quakertown borough are males with 2 vehicles (962, accounting for 36.5%) and females with 2 vehicles (721, making up 41.3%).
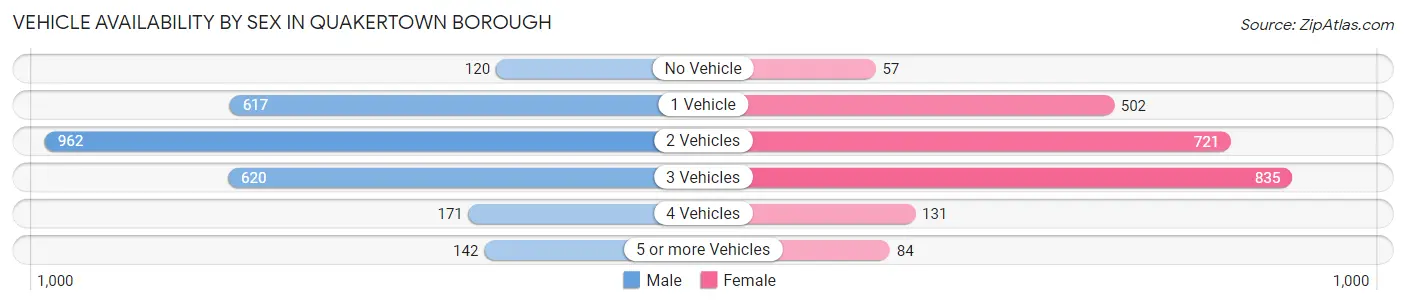
| Vehicles Available | Male | Female |
| No Vehicle | 120 (4.6%) | 57 (2.5%) |
| 1 Vehicle | 617 (23.4%) | 502 (21.5%) |
| 2 Vehicles | 962 (36.5%) | 721 (30.9%) |
| 3 Vehicles | 620 (23.6%) | 835 (35.8%) |
| 4 Vehicles | 171 (6.5%) | 131 (5.6%) |
| 5 or more Vehicles | 142 (5.4%) | 84 (3.6%) |
| Total | 2,632 (100.0%) | 2,330 (100.0%) |
Commute Time in Quakertown borough
The most frequently occuring commute durations in Quakertown borough are 5 to 9 minutes (755 commuters, 16.7%), 15 to 19 minutes (680 commuters, 15.0%), and 30 to 34 minutes (666 commuters, 14.7%).
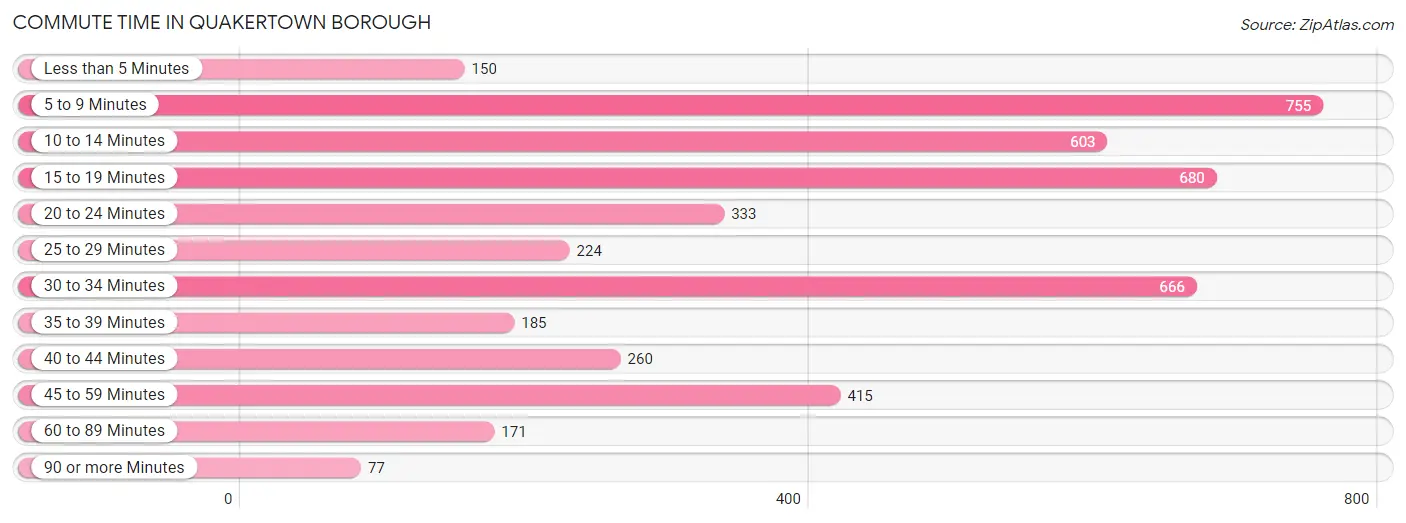
| Commute Time | # Commuters | % Commuters |
| Less than 5 Minutes | 150 | 3.3% |
| 5 to 9 Minutes | 755 | 16.7% |
| 10 to 14 Minutes | 603 | 13.3% |
| 15 to 19 Minutes | 680 | 15.0% |
| 20 to 24 Minutes | 333 | 7.4% |
| 25 to 29 Minutes | 224 | 5.0% |
| 30 to 34 Minutes | 666 | 14.7% |
| 35 to 39 Minutes | 185 | 4.1% |
| 40 to 44 Minutes | 260 | 5.8% |
| 45 to 59 Minutes | 415 | 9.2% |
| 60 to 89 Minutes | 171 | 3.8% |
| 90 or more Minutes | 77 | 1.7% |
Commute Time by Sex in Quakertown borough
The most common commute times in Quakertown borough are 30 to 34 minutes (440 commuters, 18.2%) for males and 5 to 9 minutes (473 commuters, 22.5%) for females.
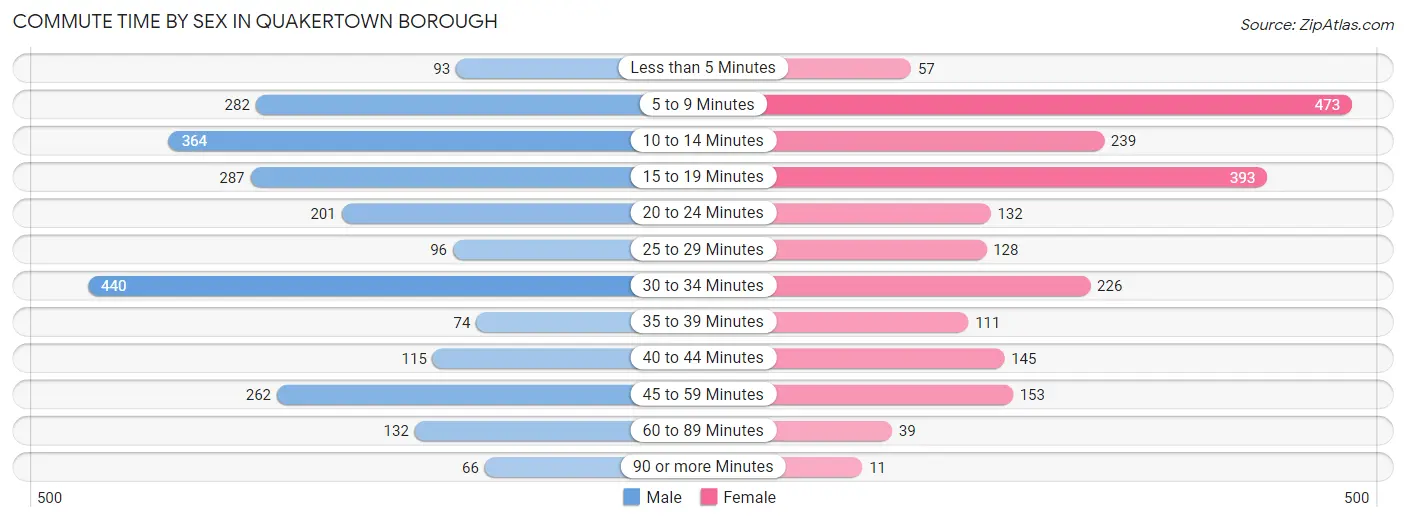
| Commute Time | Male | Female |
| Less than 5 Minutes | 93 (3.9%) | 57 (2.7%) |
| 5 to 9 Minutes | 282 (11.7%) | 473 (22.5%) |
| 10 to 14 Minutes | 364 (15.1%) | 239 (11.3%) |
| 15 to 19 Minutes | 287 (11.9%) | 393 (18.6%) |
| 20 to 24 Minutes | 201 (8.3%) | 132 (6.3%) |
| 25 to 29 Minutes | 96 (4.0%) | 128 (6.1%) |
| 30 to 34 Minutes | 440 (18.2%) | 226 (10.7%) |
| 35 to 39 Minutes | 74 (3.1%) | 111 (5.3%) |
| 40 to 44 Minutes | 115 (4.8%) | 145 (6.9%) |
| 45 to 59 Minutes | 262 (10.9%) | 153 (7.3%) |
| 60 to 89 Minutes | 132 (5.5%) | 39 (1.8%) |
| 90 or more Minutes | 66 (2.7%) | 11 (0.5%) |
Time of Departure to Work by Sex in Quakertown borough
The most frequent times of departure to work in Quakertown borough are 6:30 AM to 6:59 AM (332, 13.8%) for males and 7:30 AM to 7:59 AM (392, 18.6%) for females.
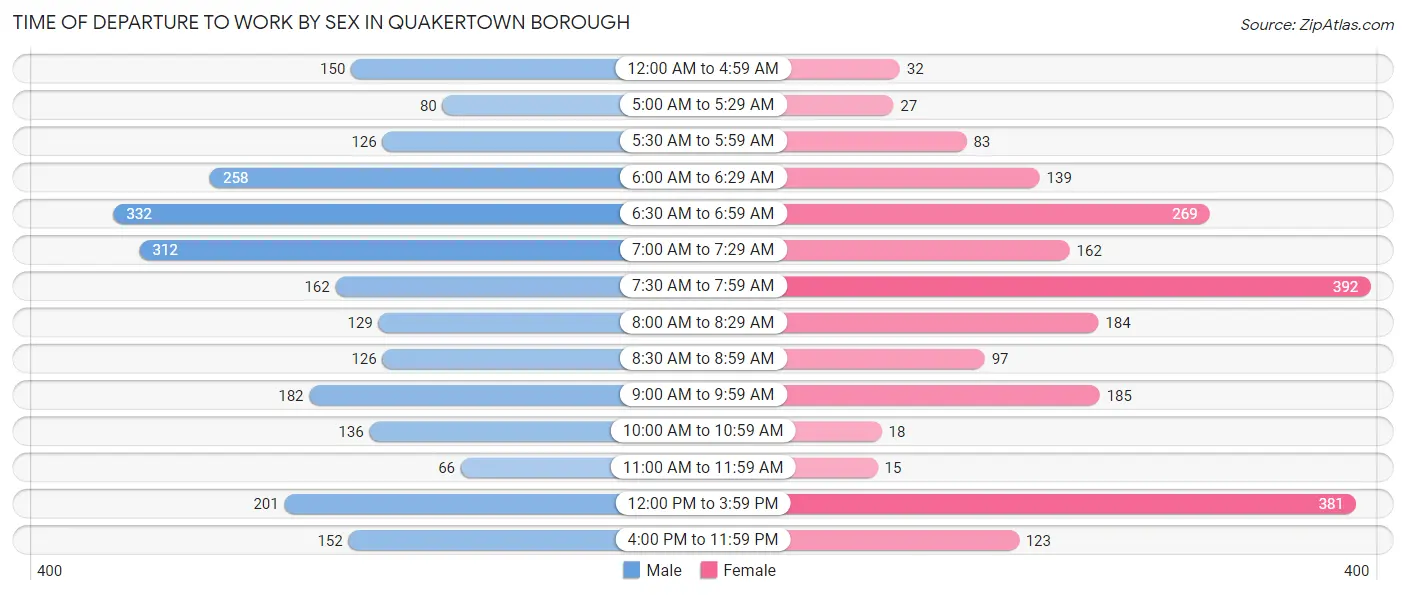
| Time of Departure | Male | Female |
| 12:00 AM to 4:59 AM | 150 (6.2%) | 32 (1.5%) |
| 5:00 AM to 5:29 AM | 80 (3.3%) | 27 (1.3%) |
| 5:30 AM to 5:59 AM | 126 (5.2%) | 83 (3.9%) |
| 6:00 AM to 6:29 AM | 258 (10.7%) | 139 (6.6%) |
| 6:30 AM to 6:59 AM | 332 (13.8%) | 269 (12.8%) |
| 7:00 AM to 7:29 AM | 312 (12.9%) | 162 (7.7%) |
| 7:30 AM to 7:59 AM | 162 (6.7%) | 392 (18.6%) |
| 8:00 AM to 8:29 AM | 129 (5.3%) | 184 (8.7%) |
| 8:30 AM to 8:59 AM | 126 (5.2%) | 97 (4.6%) |
| 9:00 AM to 9:59 AM | 182 (7.5%) | 185 (8.8%) |
| 10:00 AM to 10:59 AM | 136 (5.6%) | 18 (0.9%) |
| 11:00 AM to 11:59 AM | 66 (2.7%) | 15 (0.7%) |
| 12:00 PM to 3:59 PM | 201 (8.3%) | 381 (18.1%) |
| 4:00 PM to 11:59 PM | 152 (6.3%) | 123 (5.8%) |
| Total | 2,412 (100.0%) | 2,107 (100.0%) |
Housing Occupancy in Quakertown borough
Occupancy by Ownership in Quakertown borough
Of the total 3,510 dwellings in Quakertown borough, owner-occupied units account for 1,940 (55.3%), while renter-occupied units make up 1,570 (44.7%).
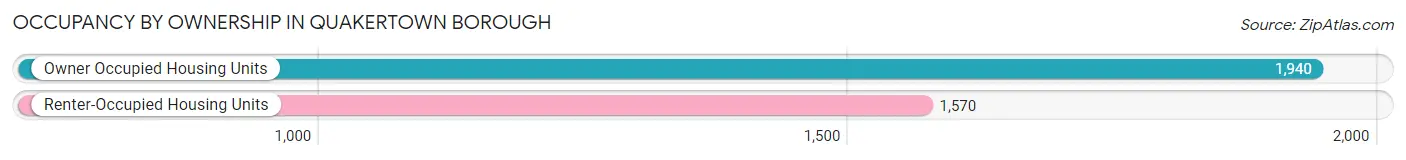
| Occupancy | # Housing Units | % Housing Units |
| Owner Occupied Housing Units | 1,940 | 55.3% |
| Renter-Occupied Housing Units | 1,570 | 44.7% |
| Total Occupied Housing Units | 3,510 | 100.0% |
Occupancy by Household Size in Quakertown borough
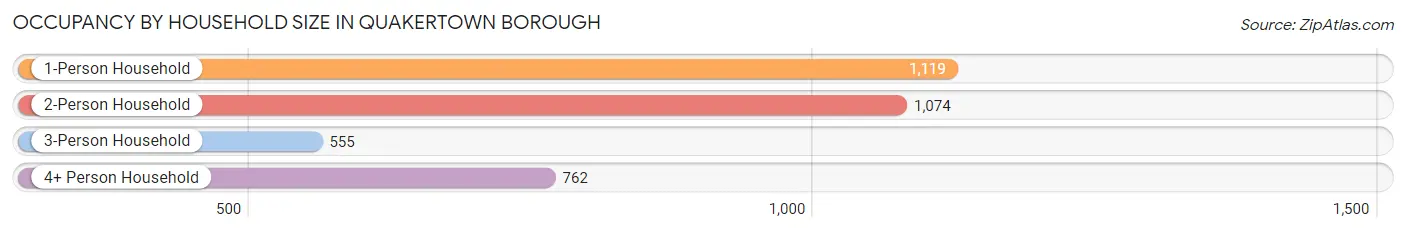
| Household Size | # Housing Units | % Housing Units |
| 1-Person Household | 1,119 | 31.9% |
| 2-Person Household | 1,074 | 30.6% |
| 3-Person Household | 555 | 15.8% |
| 4+ Person Household | 762 | 21.7% |
| Total Housing Units | 3,510 | 100.0% |
Occupancy by Ownership by Household Size in Quakertown borough
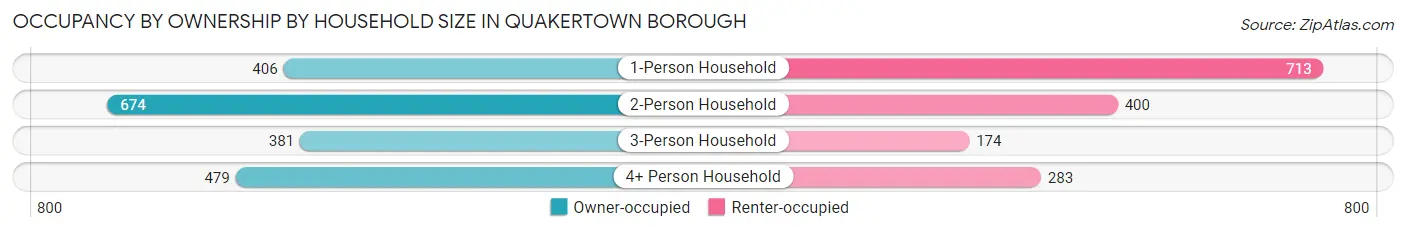
| Household Size | Owner-occupied | Renter-occupied |
| 1-Person Household | 406 (36.3%) | 713 (63.7%) |
| 2-Person Household | 674 (62.8%) | 400 (37.2%) |
| 3-Person Household | 381 (68.6%) | 174 (31.4%) |
| 4+ Person Household | 479 (62.9%) | 283 (37.1%) |
| Total Housing Units | 1,940 (55.3%) | 1,570 (44.7%) |
Occupancy by Educational Attainment in Quakertown borough
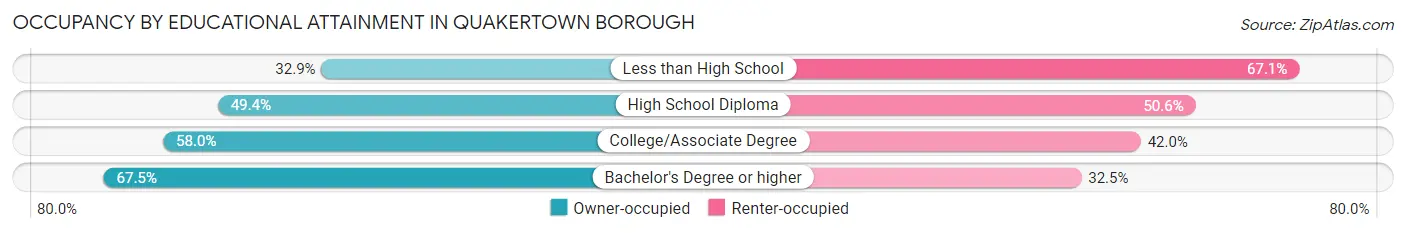
| Household Size | Owner-occupied | Renter-occupied |
| Less than High School | 79 (32.9%) | 161 (67.1%) |
| High School Diploma | 660 (49.4%) | 677 (50.6%) |
| College/Associate Degree | 635 (58.0%) | 459 (42.0%) |
| Bachelor's Degree or higher | 566 (67.5%) | 273 (32.5%) |
Occupancy by Age of Householder in Quakertown borough
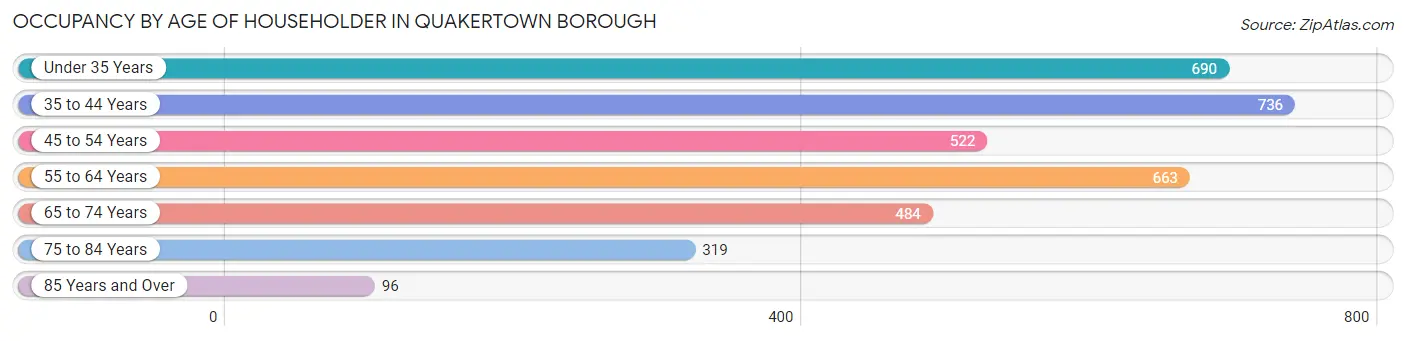
| Age Bracket | # Households | % Households |
| Under 35 Years | 690 | 19.7% |
| 35 to 44 Years | 736 | 21.0% |
| 45 to 54 Years | 522 | 14.9% |
| 55 to 64 Years | 663 | 18.9% |
| 65 to 74 Years | 484 | 13.8% |
| 75 to 84 Years | 319 | 9.1% |
| 85 Years and Over | 96 | 2.7% |
| Total | 3,510 | 100.0% |
Housing Finances in Quakertown borough
Median Income by Occupancy in Quakertown borough
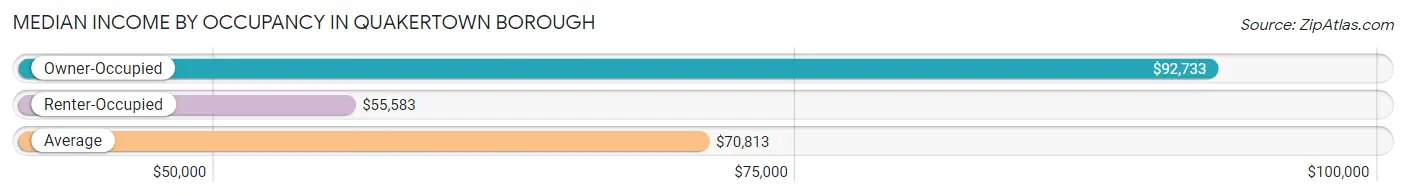
| Occupancy Type | # Households | Median Income |
| Owner-Occupied | 1,940 (55.3%) | $92,733 |
| Renter-Occupied | 1,570 (44.7%) | $55,583 |
| Average | 3,510 (100.0%) | $70,813 |
Occupancy by Householder Income Bracket in Quakertown borough
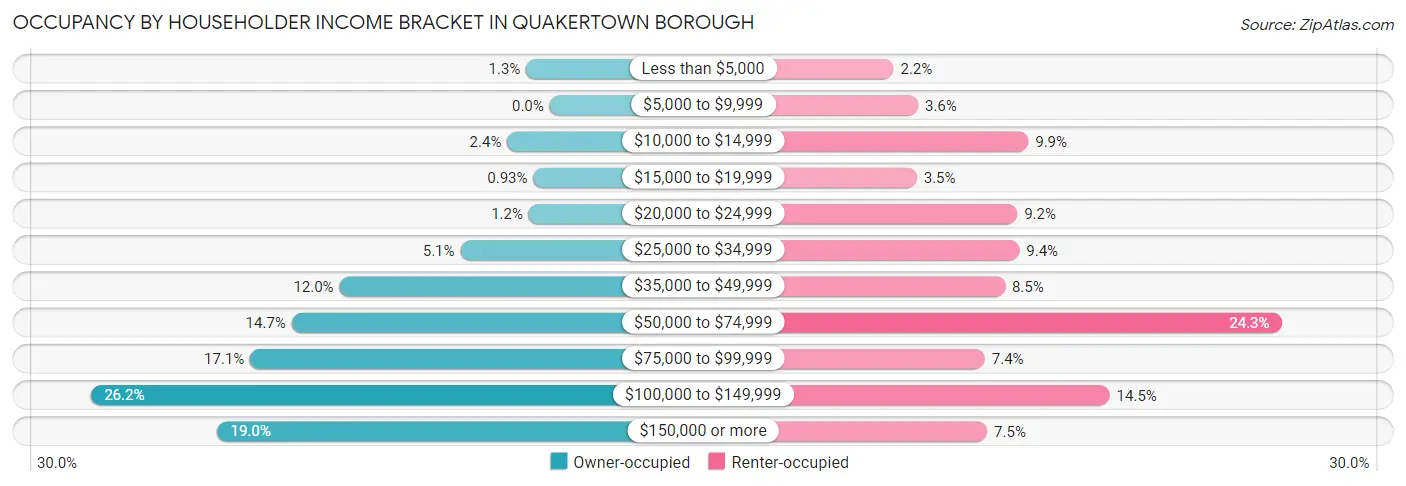
| Income Bracket | Owner-occupied | Renter-occupied |
| Less than $5,000 | 26 (1.3%) | 34 (2.2%) |
| $5,000 to $9,999 | 0 (0.0%) | 56 (3.6%) |
| $10,000 to $14,999 | 47 (2.4%) | 155 (9.9%) |
| $15,000 to $19,999 | 18 (0.9%) | 55 (3.5%) |
| $20,000 to $24,999 | 23 (1.2%) | 145 (9.2%) |
| $25,000 to $34,999 | 99 (5.1%) | 147 (9.4%) |
| $35,000 to $49,999 | 233 (12.0%) | 134 (8.5%) |
| $50,000 to $74,999 | 286 (14.7%) | 382 (24.3%) |
| $75,000 to $99,999 | 332 (17.1%) | 116 (7.4%) |
| $100,000 to $149,999 | 508 (26.2%) | 228 (14.5%) |
| $150,000 or more | 368 (19.0%) | 118 (7.5%) |
| Total | 1,940 (100.0%) | 1,570 (100.0%) |
Monthly Housing Cost Tiers in Quakertown borough
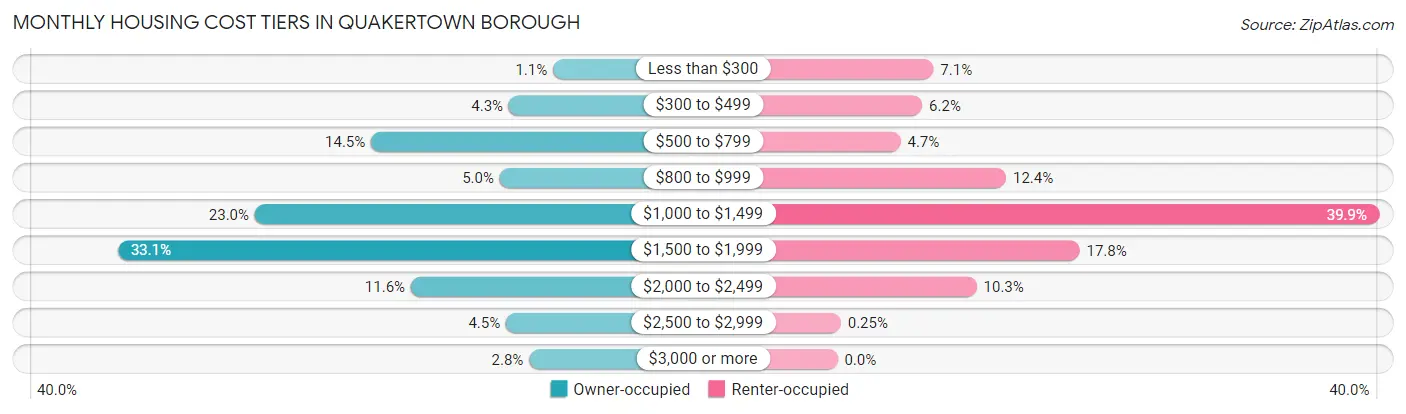
| Monthly Cost | Owner-occupied | Renter-occupied |
| Less than $300 | 21 (1.1%) | 111 (7.1%) |
| $300 to $499 | 84 (4.3%) | 98 (6.2%) |
| $500 to $799 | 281 (14.5%) | 73 (4.6%) |
| $800 to $999 | 97 (5.0%) | 195 (12.4%) |
| $1,000 to $1,499 | 447 (23.0%) | 626 (39.9%) |
| $1,500 to $1,999 | 643 (33.1%) | 280 (17.8%) |
| $2,000 to $2,499 | 224 (11.6%) | 161 (10.2%) |
| $2,500 to $2,999 | 88 (4.5%) | 4 (0.3%) |
| $3,000 or more | 55 (2.8%) | 0 (0.0%) |
| Total | 1,940 (100.0%) | 1,570 (100.0%) |
Physical Housing Characteristics in Quakertown borough
Housing Structures in Quakertown borough
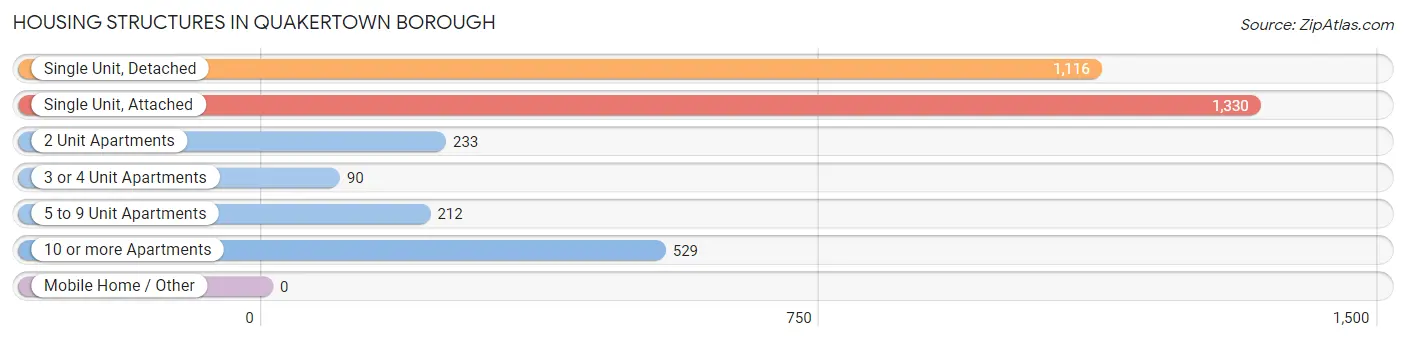
| Structure Type | # Housing Units | % Housing Units |
| Single Unit, Detached | 1,116 | 31.8% |
| Single Unit, Attached | 1,330 | 37.9% |
| 2 Unit Apartments | 233 | 6.6% |
| 3 or 4 Unit Apartments | 90 | 2.6% |
| 5 to 9 Unit Apartments | 212 | 6.0% |
| 10 or more Apartments | 529 | 15.1% |
| Mobile Home / Other | 0 | 0.0% |
| Total | 3,510 | 100.0% |
Housing Structures by Occupancy in Quakertown borough
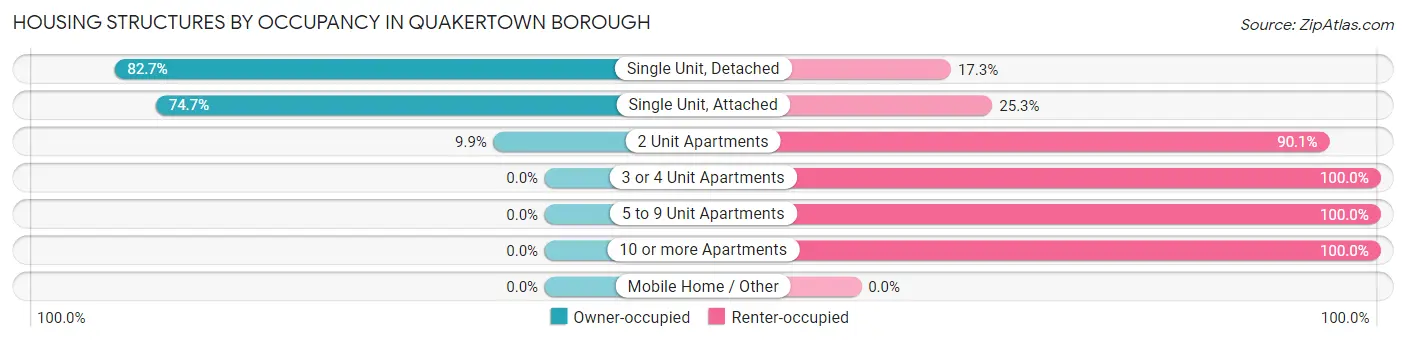
| Structure Type | Owner-occupied | Renter-occupied |
| Single Unit, Detached | 923 (82.7%) | 193 (17.3%) |
| Single Unit, Attached | 994 (74.7%) | 336 (25.3%) |
| 2 Unit Apartments | 23 (9.9%) | 210 (90.1%) |
| 3 or 4 Unit Apartments | 0 (0.0%) | 90 (100.0%) |
| 5 to 9 Unit Apartments | 0 (0.0%) | 212 (100.0%) |
| 10 or more Apartments | 0 (0.0%) | 529 (100.0%) |
| Mobile Home / Other | 0 (0.0%) | 0 (0.0%) |
| Total | 1,940 (55.3%) | 1,570 (44.7%) |
Housing Structures by Number of Rooms in Quakertown borough
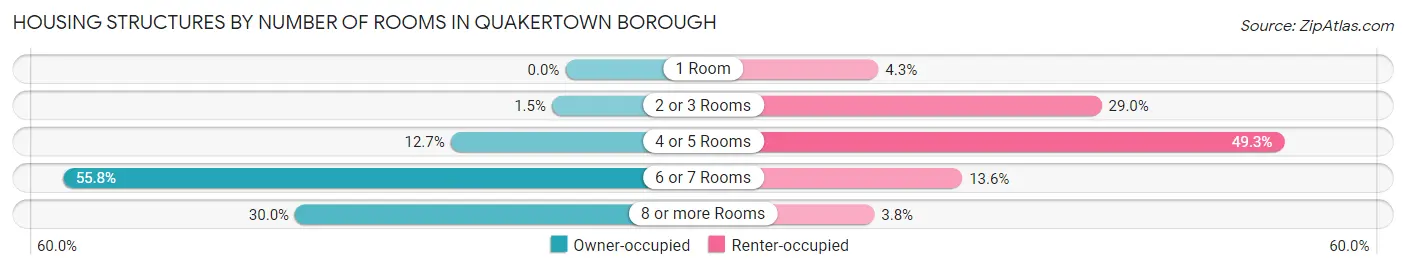
| Number of Rooms | Owner-occupied | Renter-occupied |
| 1 Room | 0 (0.0%) | 67 (4.3%) |
| 2 or 3 Rooms | 29 (1.5%) | 456 (29.0%) |
| 4 or 5 Rooms | 247 (12.7%) | 774 (49.3%) |
| 6 or 7 Rooms | 1,082 (55.8%) | 213 (13.6%) |
| 8 or more Rooms | 582 (30.0%) | 60 (3.8%) |
| Total | 1,940 (100.0%) | 1,570 (100.0%) |
Housing Structure by Heating Type in Quakertown borough
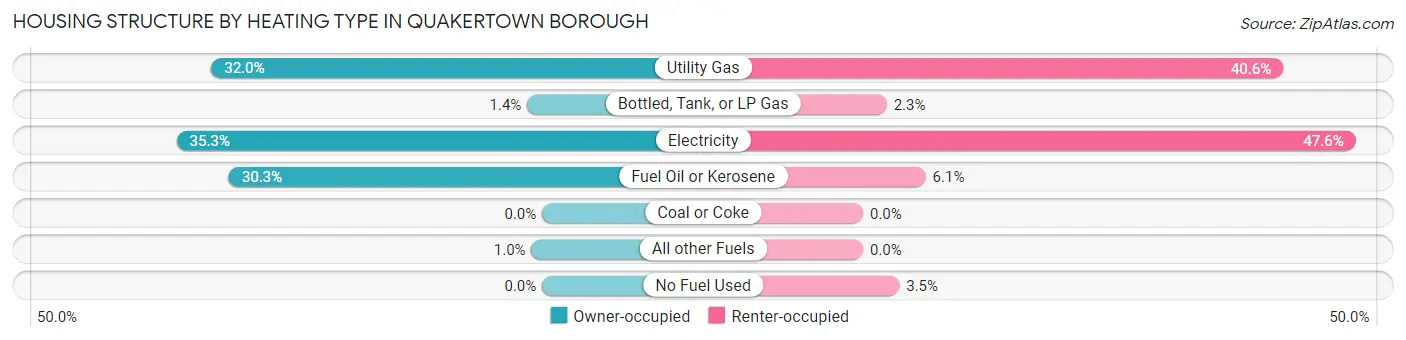
| Heating Type | Owner-occupied | Renter-occupied |
| Utility Gas | 620 (32.0%) | 637 (40.6%) |
| Bottled, Tank, or LP Gas | 28 (1.4%) | 36 (2.3%) |
| Electricity | 685 (35.3%) | 747 (47.6%) |
| Fuel Oil or Kerosene | 587 (30.3%) | 95 (6.0%) |
| Coal or Coke | 0 (0.0%) | 0 (0.0%) |
| All other Fuels | 20 (1.0%) | 0 (0.0%) |
| No Fuel Used | 0 (0.0%) | 55 (3.5%) |
| Total | 1,940 (100.0%) | 1,570 (100.0%) |
Household Vehicle Usage in Quakertown borough
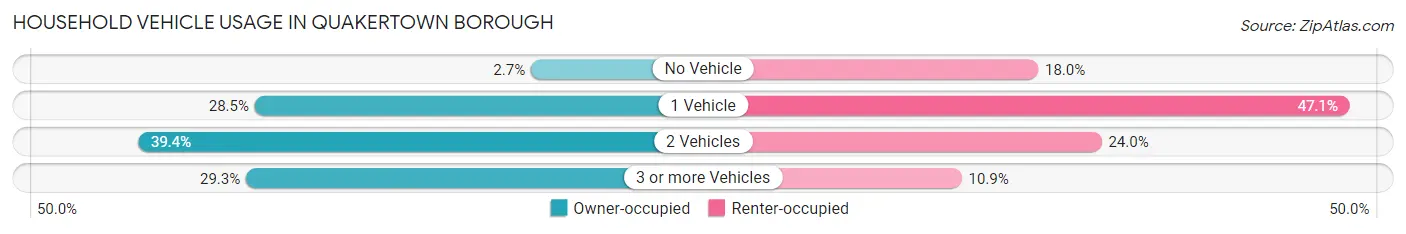
| Vehicles per Household | Owner-occupied | Renter-occupied |
| No Vehicle | 53 (2.7%) | 283 (18.0%) |
| 1 Vehicle | 553 (28.5%) | 740 (47.1%) |
| 2 Vehicles | 765 (39.4%) | 376 (23.9%) |
| 3 or more Vehicles | 569 (29.3%) | 171 (10.9%) |
| Total | 1,940 (100.0%) | 1,570 (100.0%) |
Real Estate & Mortgages in Quakertown borough
Real Estate and Mortgage Overview in Quakertown borough
| Characteristic | Without Mortgage | With Mortgage |
| Housing Units | 491 | 1,449 |
| Median Property Value | $261,500 | $237,500 |
| Median Household Income | $59,934 | $288 |
| Monthly Housing Costs | $728 | $55 |
| Real Estate Taxes | $3,765 | $20 |
Property Value by Mortgage Status in Quakertown borough
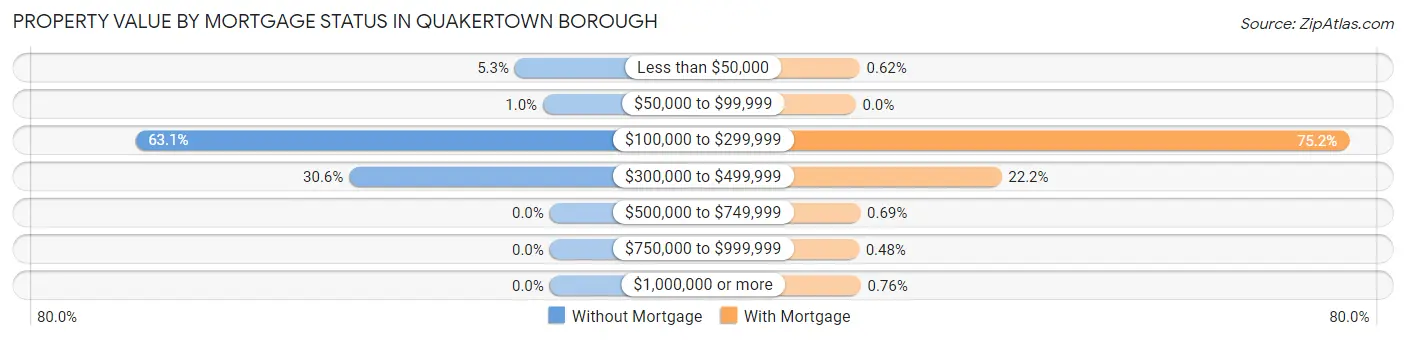
| Property Value | Without Mortgage | With Mortgage |
| Less than $50,000 | 26 (5.3%) | 9 (0.6%) |
| $50,000 to $99,999 | 5 (1.0%) | 0 (0.0%) |
| $100,000 to $299,999 | 310 (63.1%) | 1,090 (75.2%) |
| $300,000 to $499,999 | 150 (30.5%) | 322 (22.2%) |
| $500,000 to $749,999 | 0 (0.0%) | 10 (0.7%) |
| $750,000 to $999,999 | 0 (0.0%) | 7 (0.5%) |
| $1,000,000 or more | 0 (0.0%) | 11 (0.8%) |
| Total | 491 (100.0%) | 1,449 (100.0%) |
Household Income by Mortgage Status in Quakertown borough
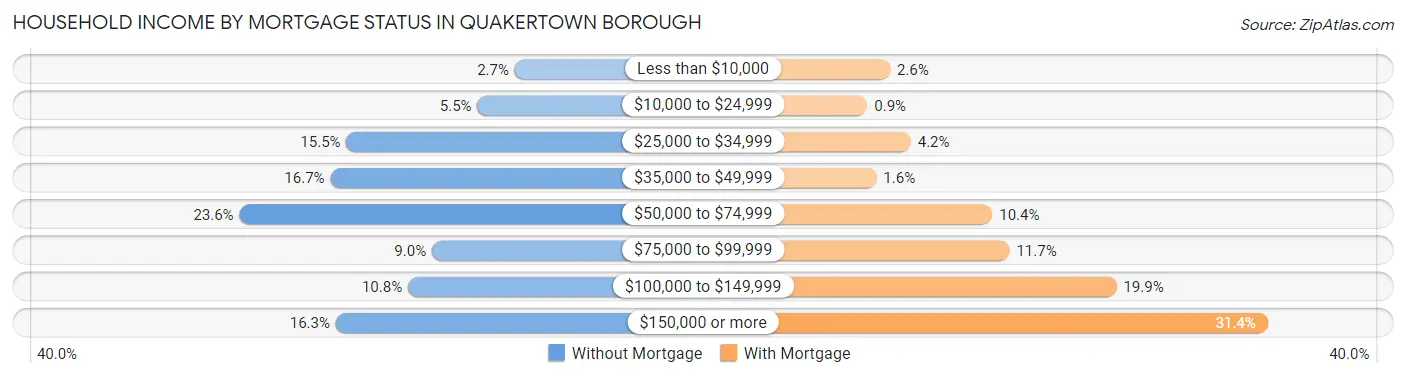
| Household Income | Without Mortgage | With Mortgage |
| Less than $10,000 | 13 (2.6%) | 38 (2.6%) |
| $10,000 to $24,999 | 27 (5.5%) | 13 (0.9%) |
| $25,000 to $34,999 | 76 (15.5%) | 61 (4.2%) |
| $35,000 to $49,999 | 82 (16.7%) | 23 (1.6%) |
| $50,000 to $74,999 | 116 (23.6%) | 151 (10.4%) |
| $75,000 to $99,999 | 44 (9.0%) | 170 (11.7%) |
| $100,000 to $149,999 | 53 (10.8%) | 288 (19.9%) |
| $150,000 or more | 80 (16.3%) | 455 (31.4%) |
| Total | 491 (100.0%) | 1,449 (100.0%) |
Property Value to Household Income Ratio in Quakertown borough
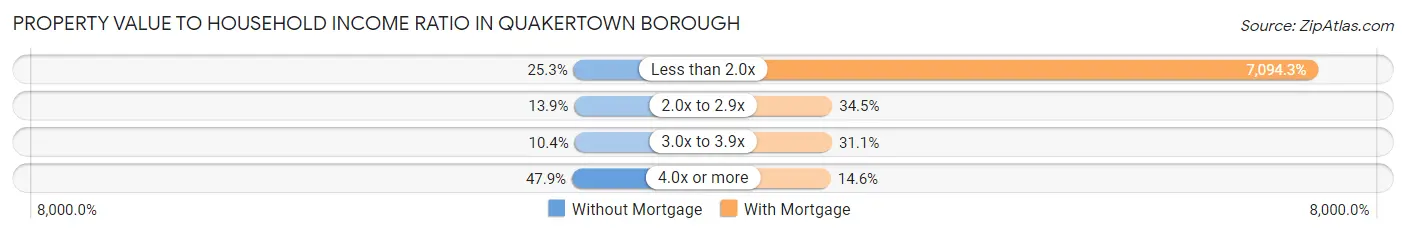
| Value-to-Income Ratio | Without Mortgage | With Mortgage |
| Less than 2.0x | 124 (25.3%) | 102,796 (7,094.3%) |
| 2.0x to 2.9x | 68 (13.9%) | 500 (34.5%) |
| 3.0x to 3.9x | 51 (10.4%) | 450 (31.1%) |
| 4.0x or more | 235 (47.9%) | 212 (14.6%) |
| Total | 491 (100.0%) | 1,449 (100.0%) |
Real Estate Taxes by Mortgage Status in Quakertown borough
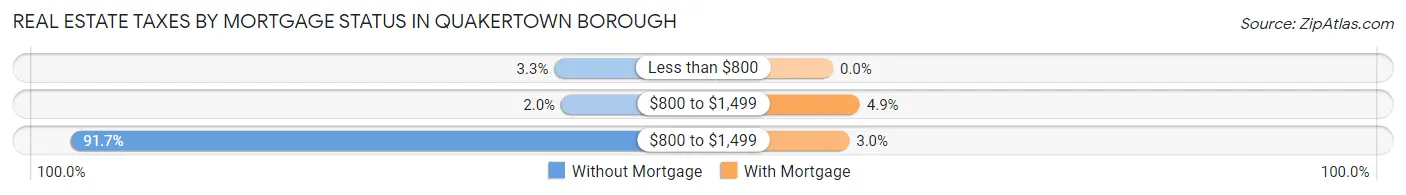
| Property Taxes | Without Mortgage | With Mortgage |
| Less than $800 | 16 (3.3%) | 0 (0.0%) |
| $800 to $1,499 | 10 (2.0%) | 71 (4.9%) |
| $800 to $1,499 | 450 (91.6%) | 43 (3.0%) |
| Total | 491 (100.0%) | 1,449 (100.0%) |
Health & Disability in Quakertown borough
Health Insurance Coverage by Age in Quakertown borough
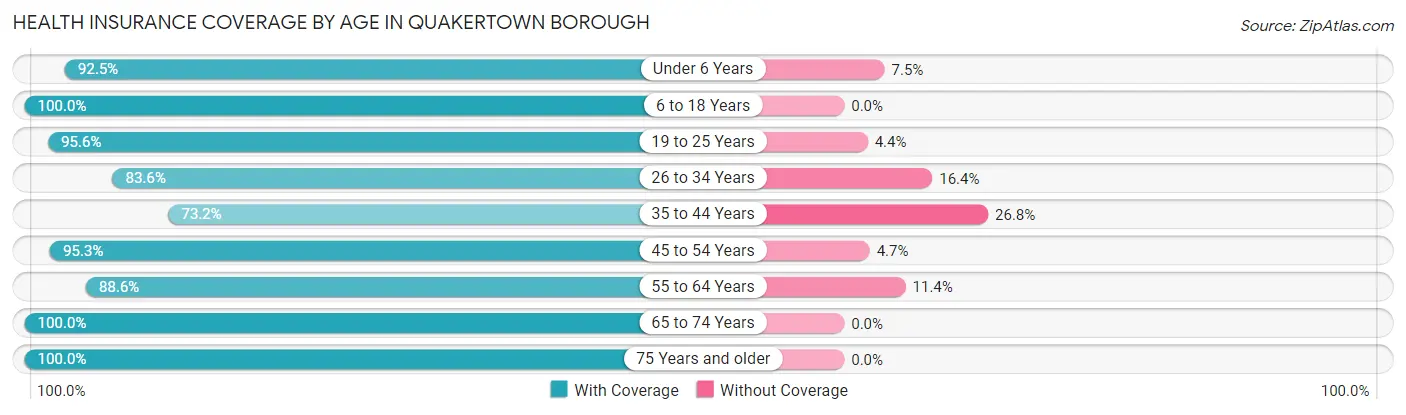
| Age Bracket | With Coverage | Without Coverage |
| Under 6 Years | 615 (92.5%) | 50 (7.5%) |
| 6 to 18 Years | 1,391 (100.0%) | 0 (0.0%) |
| 19 to 25 Years | 941 (95.6%) | 43 (4.4%) |
| 26 to 34 Years | 1,100 (83.6%) | 216 (16.4%) |
| 35 to 44 Years | 1,097 (73.2%) | 402 (26.8%) |
| 45 to 54 Years | 865 (95.3%) | 43 (4.7%) |
| 55 to 64 Years | 867 (88.6%) | 112 (11.4%) |
| 65 to 74 Years | 826 (100.0%) | 0 (0.0%) |
| 75 Years and older | 541 (100.0%) | 0 (0.0%) |
| Total | 8,243 (90.5%) | 866 (9.5%) |
Health Insurance Coverage by Citizenship Status in Quakertown borough
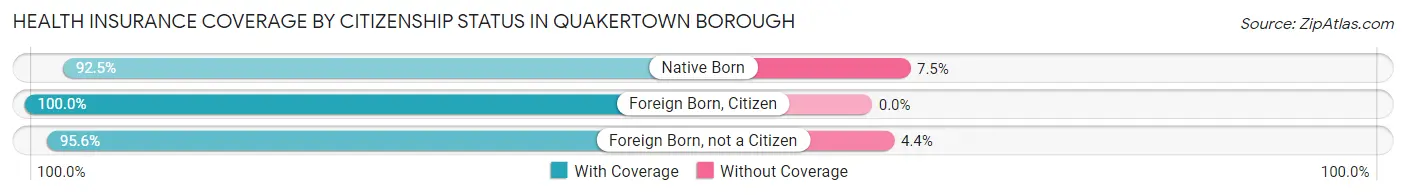
| Citizenship Status | With Coverage | Without Coverage |
| Native Born | 615 (92.5%) | 50 (7.5%) |
| Foreign Born, Citizen | 1,391 (100.0%) | 0 (0.0%) |
| Foreign Born, not a Citizen | 941 (95.6%) | 43 (4.4%) |
Health Insurance Coverage by Household Income in Quakertown borough
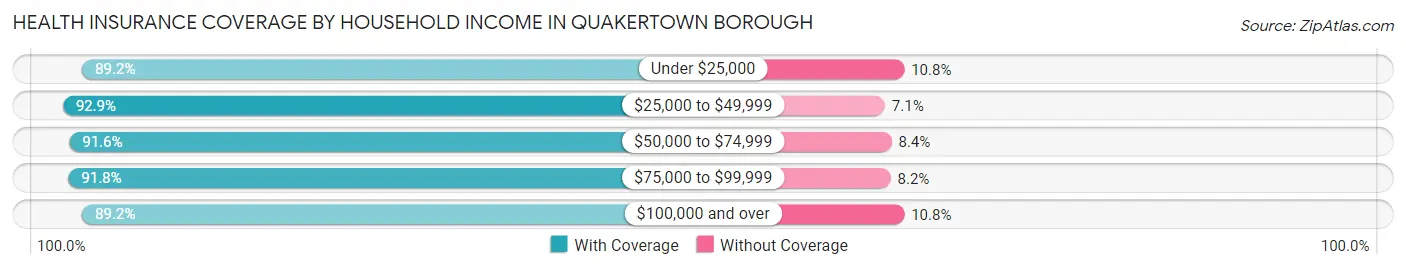
| Household Income | With Coverage | Without Coverage |
| Under $25,000 | 763 (89.2%) | 92 (10.8%) |
| $25,000 to $49,999 | 1,028 (92.9%) | 79 (7.1%) |
| $50,000 to $74,999 | 1,388 (91.6%) | 127 (8.4%) |
| $75,000 to $99,999 | 1,051 (91.8%) | 94 (8.2%) |
| $100,000 and over | 3,932 (89.2%) | 474 (10.8%) |
Public vs Private Health Insurance Coverage by Age in Quakertown borough
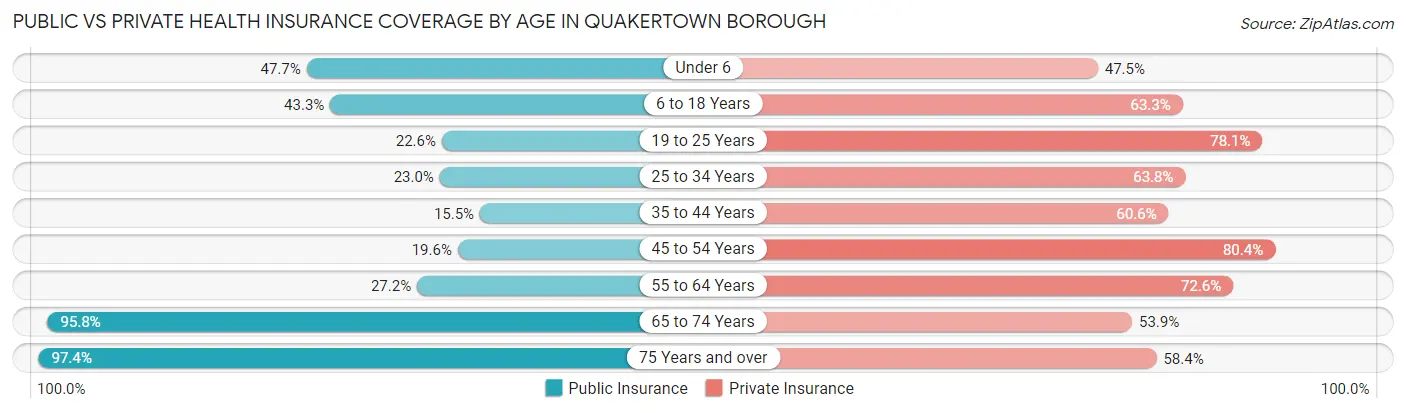
| Age Bracket | Public Insurance | Private Insurance |
| Under 6 | 317 (47.7%) | 316 (47.5%) |
| 6 to 18 Years | 602 (43.3%) | 880 (63.3%) |
| 19 to 25 Years | 222 (22.6%) | 768 (78.0%) |
| 25 to 34 Years | 302 (23.0%) | 839 (63.7%) |
| 35 to 44 Years | 232 (15.5%) | 909 (60.6%) |
| 45 to 54 Years | 178 (19.6%) | 730 (80.4%) |
| 55 to 64 Years | 266 (27.2%) | 711 (72.6%) |
| 65 to 74 Years | 791 (95.8%) | 445 (53.9%) |
| 75 Years and over | 527 (97.4%) | 316 (58.4%) |
| Total | 3,437 (37.7%) | 5,914 (64.9%) |
Disability Status by Sex by Age in Quakertown borough
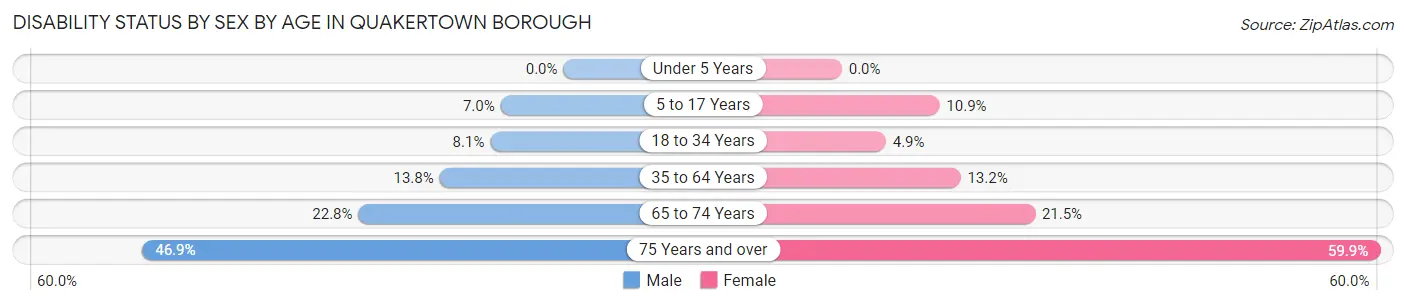
| Age Bracket | Male | Female |
| Under 5 Years | 0 (0.0%) | 0 (0.0%) |
| 5 to 17 Years | 56 (7.0%) | 65 (10.9%) |
| 18 to 34 Years | 100 (8.1%) | 60 (4.9%) |
| 35 to 64 Years | 229 (13.8%) | 228 (13.2%) |
| 65 to 74 Years | 92 (22.8%) | 91 (21.5%) |
| 75 Years and over | 98 (46.9%) | 199 (59.9%) |
Disability Class by Sex by Age in Quakertown borough
Disability Class: Hearing Difficulty
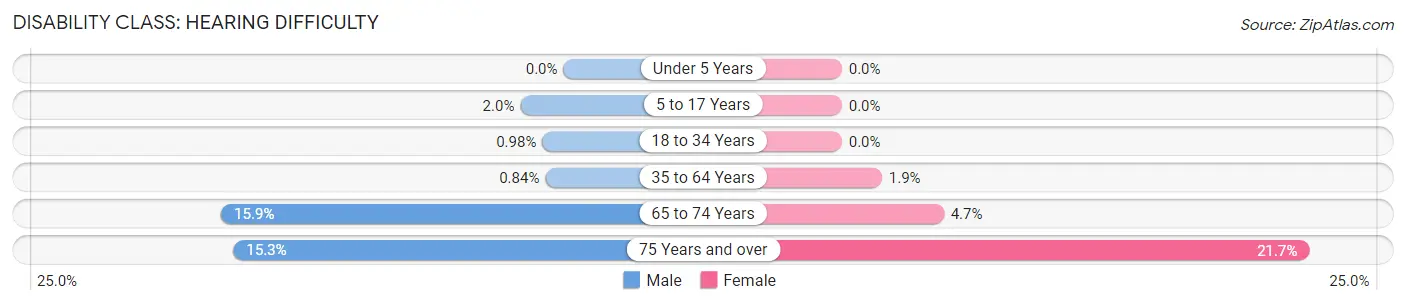
| Age Bracket | Male | Female |
| Under 5 Years | 0 (0.0%) | 0 (0.0%) |
| 5 to 17 Years | 16 (2.0%) | 0 (0.0%) |
| 18 to 34 Years | 12 (1.0%) | 0 (0.0%) |
| 35 to 64 Years | 14 (0.8%) | 32 (1.9%) |
| 65 to 74 Years | 64 (15.9%) | 20 (4.7%) |
| 75 Years and over | 32 (15.3%) | 72 (21.7%) |
Disability Class: Vision Difficulty
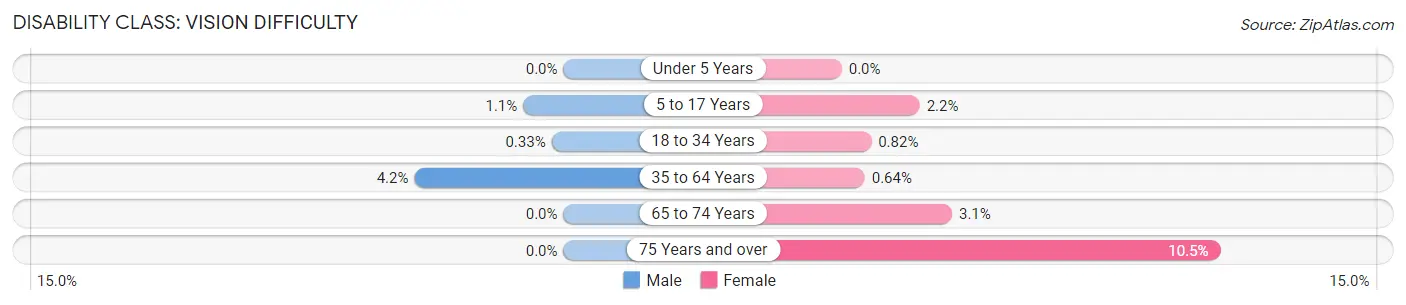
| Age Bracket | Male | Female |
| Under 5 Years | 0 (0.0%) | 0 (0.0%) |
| 5 to 17 Years | 9 (1.1%) | 13 (2.2%) |
| 18 to 34 Years | 4 (0.3%) | 10 (0.8%) |
| 35 to 64 Years | 69 (4.2%) | 11 (0.6%) |
| 65 to 74 Years | 0 (0.0%) | 13 (3.1%) |
| 75 Years and over | 0 (0.0%) | 35 (10.5%) |
Disability Class: Cognitive Difficulty
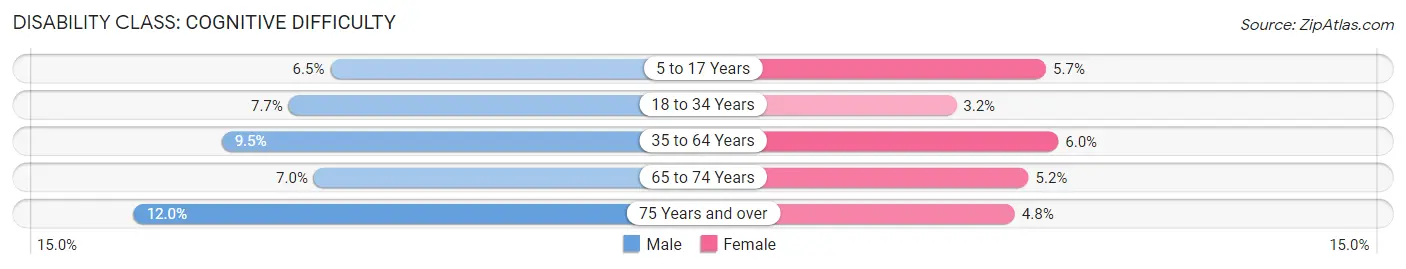
| Age Bracket | Male | Female |
| 5 to 17 Years | 52 (6.5%) | 34 (5.7%) |
| 18 to 34 Years | 94 (7.6%) | 39 (3.2%) |
| 35 to 64 Years | 158 (9.5%) | 104 (6.0%) |
| 65 to 74 Years | 28 (7.0%) | 22 (5.2%) |
| 75 Years and over | 25 (12.0%) | 16 (4.8%) |
Disability Class: Ambulatory Difficulty
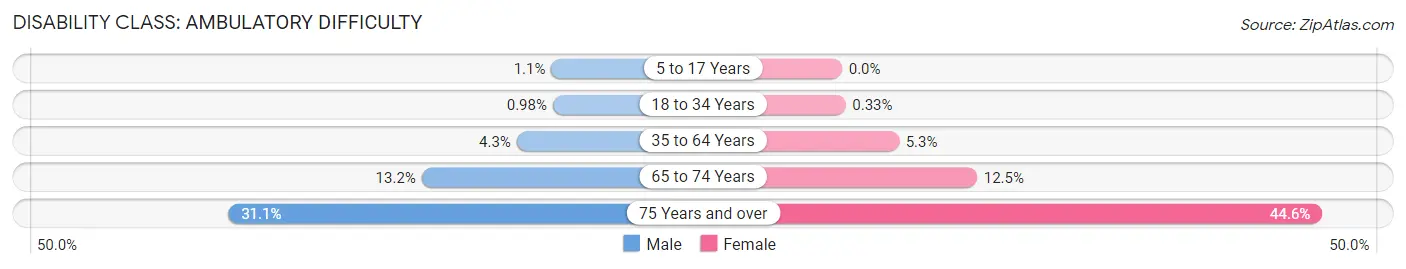
| Age Bracket | Male | Female |
| 5 to 17 Years | 9 (1.1%) | 0 (0.0%) |
| 18 to 34 Years | 12 (1.0%) | 4 (0.3%) |
| 35 to 64 Years | 72 (4.3%) | 91 (5.3%) |
| 65 to 74 Years | 53 (13.2%) | 53 (12.5%) |
| 75 Years and over | 65 (31.1%) | 148 (44.6%) |
Disability Class: Self-Care Difficulty
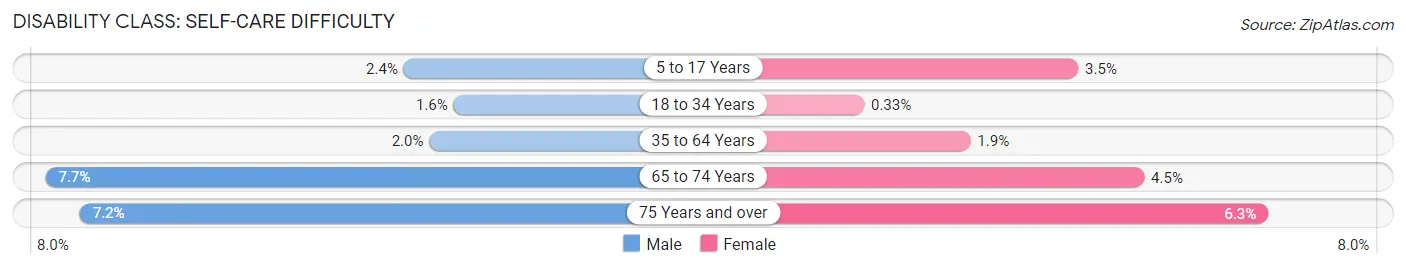
| Age Bracket | Male | Female |
| 5 to 17 Years | 19 (2.4%) | 21 (3.5%) |
| 18 to 34 Years | 20 (1.6%) | 4 (0.3%) |
| 35 to 64 Years | 33 (2.0%) | 33 (1.9%) |
| 65 to 74 Years | 31 (7.7%) | 19 (4.5%) |
| 75 Years and over | 15 (7.2%) | 21 (6.3%) |
Technology Access in Quakertown borough
Computing Device Access in Quakertown borough
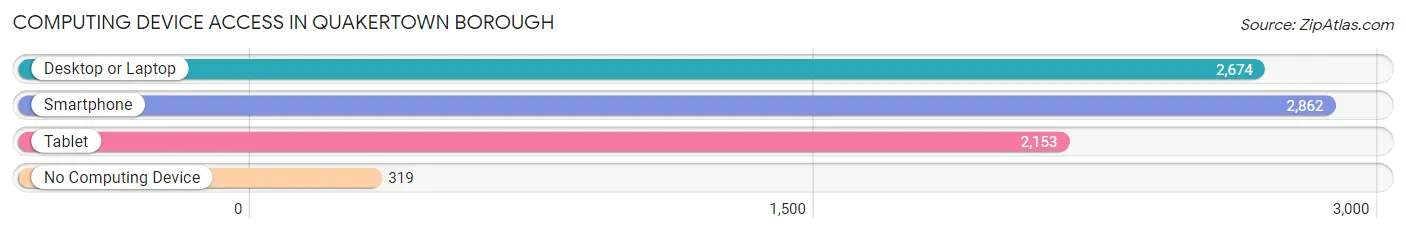
| Device Type | # Households | % Households |
| Desktop or Laptop | 2,674 | 76.2% |
| Smartphone | 2,862 | 81.5% |
| Tablet | 2,153 | 61.3% |
| No Computing Device | 319 | 9.1% |
| Total | 3,510 | 100.0% |
Internet Access in Quakertown borough
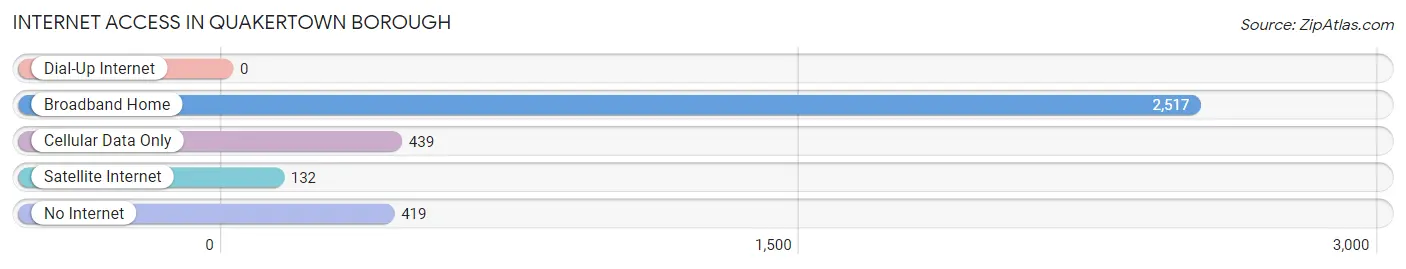
| Internet Type | # Households | % Households |
| Dial-Up Internet | 0 | 0.0% |
| Broadband Home | 2,517 | 71.7% |
| Cellular Data Only | 439 | 12.5% |
| Satellite Internet | 132 | 3.8% |
| No Internet | 419 | 11.9% |
| Total | 3,510 | 100.0% |
Quakertown borough Summary
Quakertown Borough is a small borough located in Bucks County, Pennsylvania. It is situated in the heart of the Lehigh Valley, approximately 30 miles north of Philadelphia and 60 miles south of New York City. The borough is home to a population of 8,979 people, according to the 2010 census.
History
Quakertown Borough was founded in 1854 by a group of Quakers who had migrated from Bucks County, Pennsylvania. The town was named after the Quaker settlers who had settled in the area. The first settlers were primarily farmers, and the town quickly grew to become a thriving agricultural community. The town was incorporated in 1873, and the first mayor was elected in 1874.
In the late 19th century, Quakertown began to experience a period of industrialization. The town was home to several factories, including a silk mill, a paper mill, and a brickyard. The town also had a thriving business district, which included a variety of stores and shops.
In the early 20th century, Quakertown began to experience a period of decline. The factories began to close, and the business district began to suffer. The town was hit hard by the Great Depression, and many of the businesses closed.
In the 1950s, Quakertown began to experience a period of revitalization. The town was home to several new businesses, including a shopping center and a movie theater. The town also experienced a population boom, as many people moved to the area from Philadelphia and New York City.
Geography
Quakertown Borough is located in the heart of Bucks County, Pennsylvania. The borough is situated in the Lehigh Valley, approximately 30 miles north of Philadelphia and 60 miles south of New York City. The borough is bordered by Richland Township to the north, Milford Township to the east, Richlandtown Borough to the south, and Haycock Township to the west.
The borough is located in a hilly region of the Lehigh Valley. The highest point in the borough is located at the intersection of Main Street and Park Avenue, which is approximately 590 feet above sea level. The borough is home to several parks, including Memorial Park, which is located in the center of the borough.
Economy
Quakertown Borough is home to a variety of businesses and industries. The borough is home to several manufacturing companies, including a paper mill, a brickyard, and a silk mill. The borough is also home to several retail stores, restaurants, and other businesses.
The borough is home to several educational institutions, including Quakertown Community High School, Quakertown Community Middle School, and Quakertown Elementary School. The borough is also home to several churches, including the Quakertown United Methodist Church and the Quakertown Presbyterian Church.
Demographics
According to the 2010 census, Quakertown Borough has a population of 8,979 people. The population is spread out with a median age of 41.7 years. The racial makeup of the borough is 94.3% White, 1.7% African American, 0.3% Native American, 1.2% Asian, 0.1% Pacific Islander, 1.2% from other races, and 1.4% from two or more races.
The median household income in Quakertown Borough is $50,945, and the median family income is $60,945. The per capita income in the borough is $25,945. The poverty rate in the borough is 8.3%.
Conclusion
Quakertown Borough is a small borough located in Bucks County, Pennsylvania. The borough is situated in the heart of the Lehigh Valley, approximately 30 miles north of Philadelphia and 60 miles south of New York City. The borough is home to a population of 8,979 people, according to the 2010 census. The borough is home to a variety of businesses and industries, and the median household income is $50,945. Quakertown Borough is a thriving community with a rich history and a bright future.
Common Questions
What is Per Capita Income in Quakertown borough?
Per Capita income in Quakertown borough is $35,853.
What is the Median Family Income in Quakertown borough?
Median Family Income in Quakertown borough is $98,271.
What is the Median Household income in Quakertown borough?
Median Household Income in Quakertown borough is $70,813.
What is Income or Wage Gap in Quakertown borough?
Income or Wage Gap in Quakertown borough is 27.6%.
Women in Quakertown borough earn 72.4 cents for every dollar earned by a man.
What is Inequality or Gini Index in Quakertown borough?
Inequality or Gini Index in Quakertown borough is 0.40.
What is the Total Population of Quakertown borough?
Total Population of Quakertown borough is 9,309.
What is the Total Male Population of Quakertown borough?
Total Male Population of Quakertown borough is 4,569.
What is the Total Female Population of Quakertown borough?
Total Female Population of Quakertown borough is 4,740.
What is the Ratio of Males per 100 Females in Quakertown borough?
There are 96.39 Males per 100 Females in Quakertown borough.
What is the Ratio of Females per 100 Males in Quakertown borough?
There are 103.74 Females per 100 Males in Quakertown borough.
What is the Median Population Age in Quakertown borough?
Median Population Age in Quakertown borough is 37.0 Years.
What is the Average Family Size in Quakertown borough
Average Family Size in Quakertown borough is 3.2 People.
What is the Average Household Size in Quakertown borough
Average Household Size in Quakertown borough is 2.6 People.
How Large is the Labor Force in Quakertown borough?
There are 5,393 People in the Labor Forcein in Quakertown borough.
What is the Percentage of People in the Labor Force in Quakertown borough?
70.6% of People are in the Labor Force in Quakertown borough.
What is the Unemployment Rate in Quakertown borough?
Unemployment Rate in Quakertown borough is 6.4%.