Robesonia borough, PA Map & Demographics
Robesonia borough Overview
$36,993
PER CAPITA INCOME
$91,800
AVG FAMILY INCOME
$72,394
AVG HOUSEHOLD INCOME
6.1%
WAGE / INCOME GAP [ % ]
93.9¢/ $1
WAGE / INCOME GAP [ $ ]
0.36
INEQUALITY / GINI INDEX
2,149
TOTAL POPULATION
1,040
MALE POPULATION
1,109
FEMALE POPULATION
93.78
MALES / 100 FEMALES
106.63
FEMALES / 100 MALES
41.9
MEDIAN AGE
3.1
AVG FAMILY SIZE
2.5
AVG HOUSEHOLD SIZE
1,206
LABOR FORCE [ PEOPLE ]
67.9%
PERCENT IN LABOR FORCE
2.5%
UNEMPLOYMENT RATE
Income in Robesonia borough
Income Overview in Robesonia borough
Per Capita Income in Robesonia borough is $36,993, while median incomes of families and households are $91,800 and $72,394 respectively.
| Characteristic | Number | Measure |
| Per Capita Income | 2,149 | $36,993 |
| Median Family Income | 542 | $91,800 |
| Mean Family Income | 542 | $103,768 |
| Median Household Income | 862 | $72,394 |
| Mean Household Income | 862 | $89,893 |
| Income Deficit | 542 | $0 |
| Wage / Income Gap (%) | 2,149 | 6.13% |
| Wage / Income Gap ($) | 2,149 | 93.87¢ per $1 |
| Gini / Inequality Index | 2,149 | 0.36 |
Earnings by Sex in Robesonia borough
Average Earnings in Robesonia borough are $44,727, $45,000 for men and $42,240 for women, a difference of 6.1%.
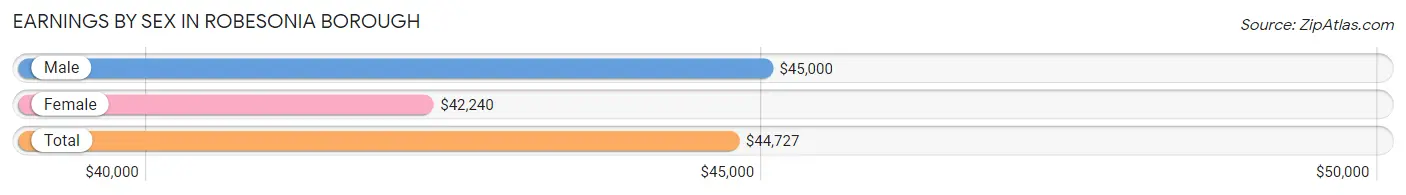
| Sex | Number | Average Earnings |
| Male | 602 (48.2%) | $45,000 |
| Female | 647 (51.8%) | $42,240 |
| Total | 1,249 (100.0%) | $44,727 |
Earnings by Sex by Income Bracket in Robesonia borough
The most common earnings brackets in Robesonia borough are $100,000+ for men (104 | 17.3%) and $50,000 to $54,999 for women (134 | 20.7%).
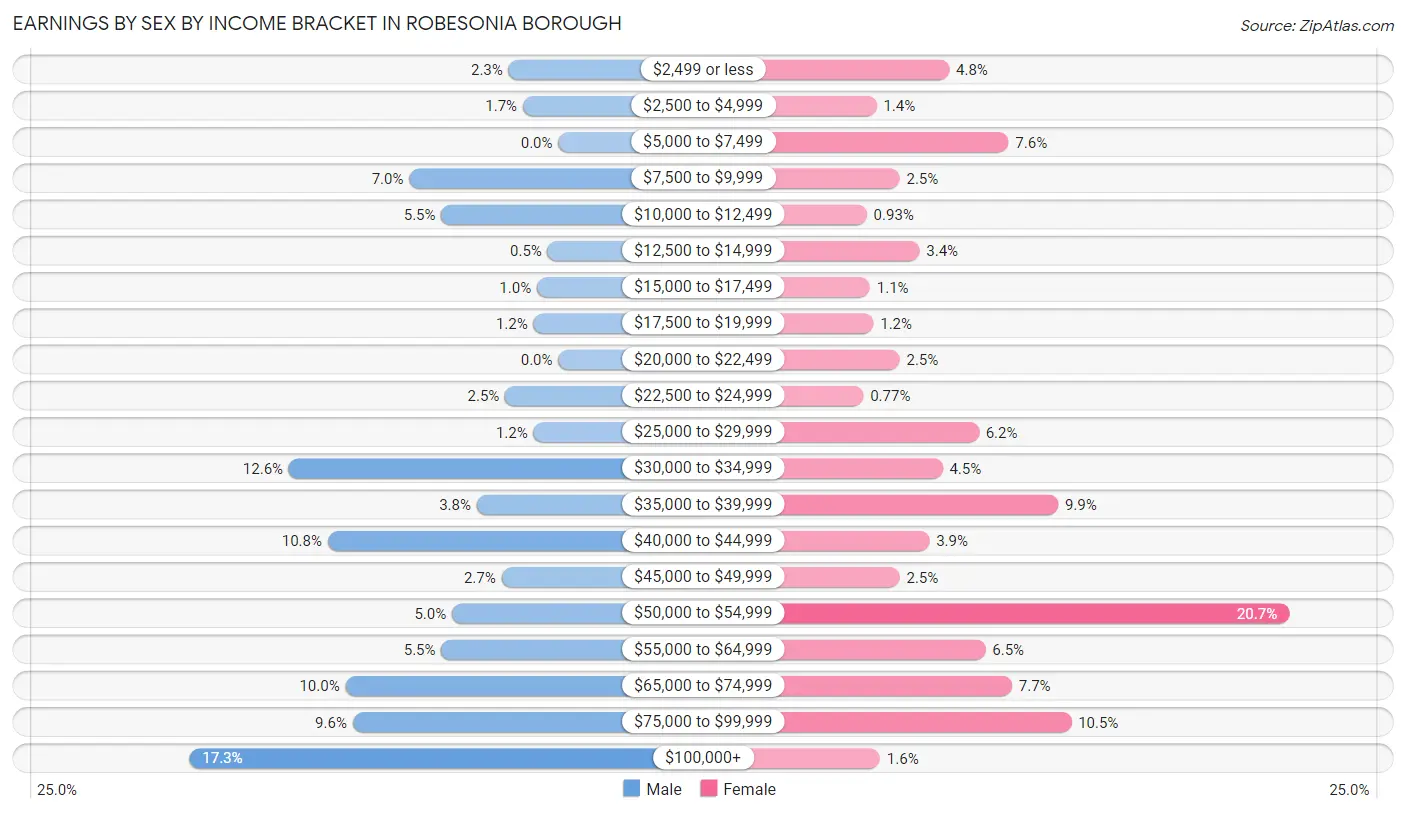
| Income | Male | Female |
| $2,499 or less | 14 (2.3%) | 31 (4.8%) |
| $2,500 to $4,999 | 10 (1.7%) | 9 (1.4%) |
| $5,000 to $7,499 | 0 (0.0%) | 49 (7.6%) |
| $7,500 to $9,999 | 42 (7.0%) | 16 (2.5%) |
| $10,000 to $12,499 | 33 (5.5%) | 6 (0.9%) |
| $12,500 to $14,999 | 3 (0.5%) | 22 (3.4%) |
| $15,000 to $17,499 | 6 (1.0%) | 7 (1.1%) |
| $17,500 to $19,999 | 7 (1.2%) | 8 (1.2%) |
| $20,000 to $22,499 | 0 (0.0%) | 16 (2.5%) |
| $22,500 to $24,999 | 15 (2.5%) | 5 (0.8%) |
| $25,000 to $29,999 | 7 (1.2%) | 40 (6.2%) |
| $30,000 to $34,999 | 76 (12.6%) | 29 (4.5%) |
| $35,000 to $39,999 | 23 (3.8%) | 64 (9.9%) |
| $40,000 to $44,999 | 65 (10.8%) | 25 (3.9%) |
| $45,000 to $49,999 | 16 (2.7%) | 16 (2.5%) |
| $50,000 to $54,999 | 30 (5.0%) | 134 (20.7%) |
| $55,000 to $64,999 | 33 (5.5%) | 42 (6.5%) |
| $65,000 to $74,999 | 60 (10.0%) | 50 (7.7%) |
| $75,000 to $99,999 | 58 (9.6%) | 68 (10.5%) |
| $100,000+ | 104 (17.3%) | 10 (1.5%) |
| Total | 602 (100.0%) | 647 (100.0%) |
Earnings by Sex by Educational Attainment in Robesonia borough
Average earnings in Robesonia borough are $59,688 for men and $48,750 for women, a difference of 18.3%. Men with an educational attainment of graduate degree enjoy the highest average annual earnings of $87,386, while those with bachelor's degree education earn the least with $44,417. Women with an educational attainment of graduate degree earn the most with the average annual earnings of $69,792, while those with high school diploma education have the smallest earnings of $37,813.
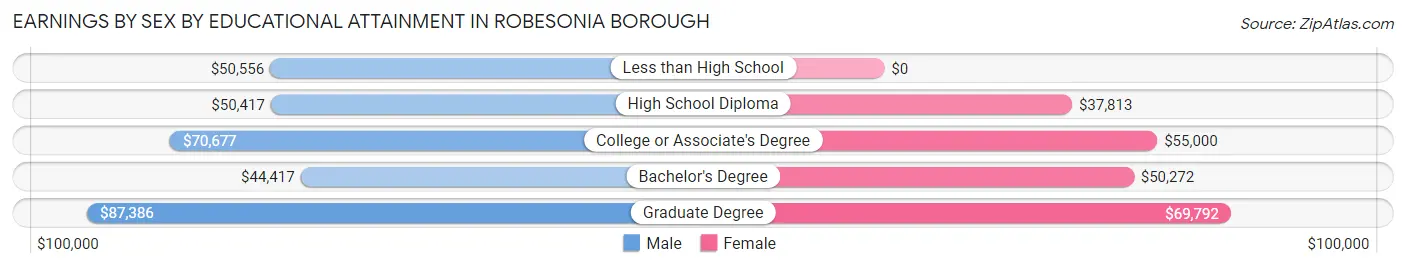
| Educational Attainment | Male Income | Female Income |
| Less than High School | $50,556 | $0 |
| High School Diploma | $50,417 | $37,813 |
| College or Associate's Degree | $70,677 | $55,000 |
| Bachelor's Degree | $44,417 | $50,272 |
| Graduate Degree | $87,386 | $69,792 |
| Total | $59,688 | $48,750 |
Family Income in Robesonia borough
Family Income Brackets in Robesonia borough
According to the Robesonia borough family income data, there are 137 families falling into the $100,000 to $149,999 income range, which is the most common income bracket and makes up 25.3% of all families. Conversely, the $15,000 to $24,999 income bracket is the least frequent group with only 4 families (0.7%) belonging to this category.
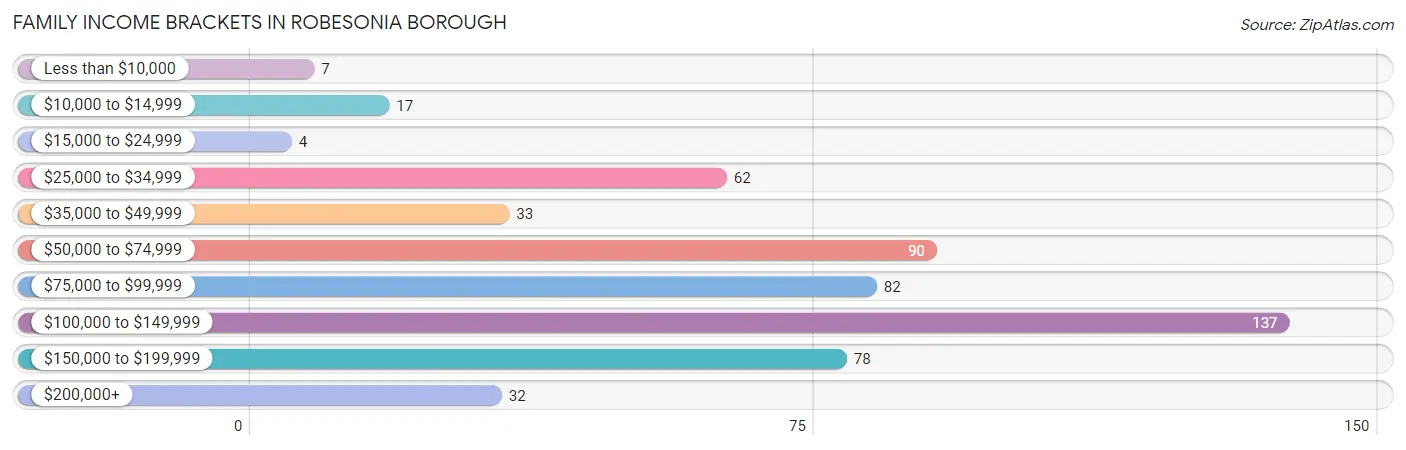
| Income Bracket | # Families | % Families |
| Less than $10,000 | 7 | 1.3% |
| $10,000 to $14,999 | 17 | 3.1% |
| $15,000 to $24,999 | 4 | 0.7% |
| $25,000 to $34,999 | 62 | 11.4% |
| $35,000 to $49,999 | 33 | 6.1% |
| $50,000 to $74,999 | 90 | 16.6% |
| $75,000 to $99,999 | 82 | 15.1% |
| $100,000 to $149,999 | 137 | 25.3% |
| $150,000 to $199,999 | 78 | 14.4% |
| $200,000+ | 32 | 5.9% |
Family Income by Famaliy Size in Robesonia borough
5-person families (54 | 10.0%) account for the highest median family income in Robesonia borough with $168,176 per family, while 2-person families (211 | 38.9%) have the highest median income of $45,469 per family member.
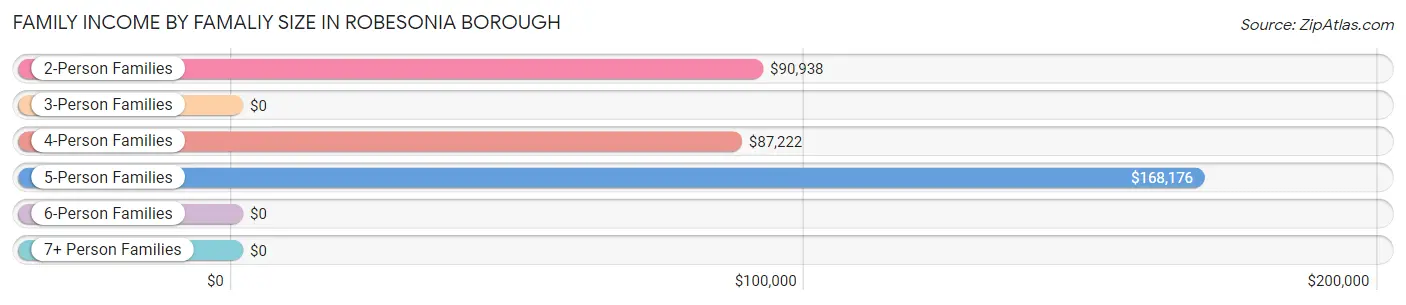
| Income Bracket | # Families | Median Income |
| 2-Person Families | 211 (38.9%) | $90,938 |
| 3-Person Families | 147 (27.1%) | $0 |
| 4-Person Families | 128 (23.6%) | $87,222 |
| 5-Person Families | 54 (10.0%) | $168,176 |
| 6-Person Families | 2 (0.4%) | $0 |
| 7+ Person Families | 0 (0.0%) | $0 |
| Total | 542 (100.0%) | $91,800 |
Family Income by Number of Earners in Robesonia borough
The median family income in Robesonia borough is $91,800, with families comprising 3+ earners (83) having the highest median family income of $167,872, while families with no earners (75) have the lowest median family income of $34,390, accounting for 15.3% and 13.8% of families, respectively.
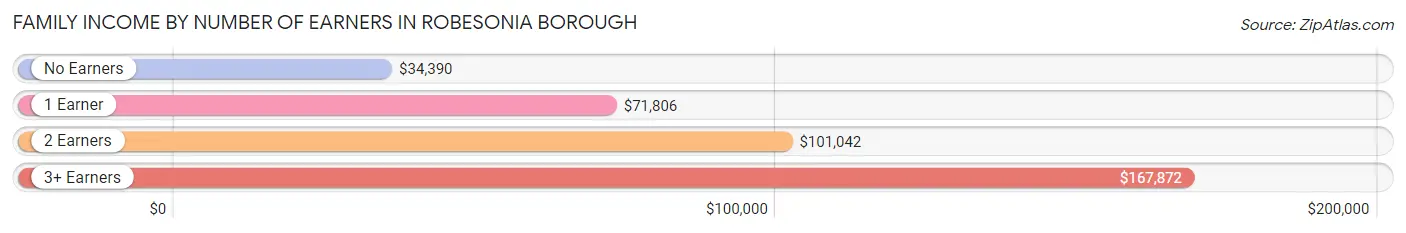
| Number of Earners | # Families | Median Income |
| No Earners | 75 (13.8%) | $34,390 |
| 1 Earner | 139 (25.7%) | $71,806 |
| 2 Earners | 245 (45.2%) | $101,042 |
| 3+ Earners | 83 (15.3%) | $167,872 |
| Total | 542 (100.0%) | $91,800 |
Household Income in Robesonia borough
Household Income Brackets in Robesonia borough
With 195 households falling in the category, the $50,000 to $74,999 income range is the most frequent in Robesonia borough, accounting for 22.6% of all households. In contrast, only 7 households (0.8%) fall into the less than $10,000 income bracket, making it the least populous group.
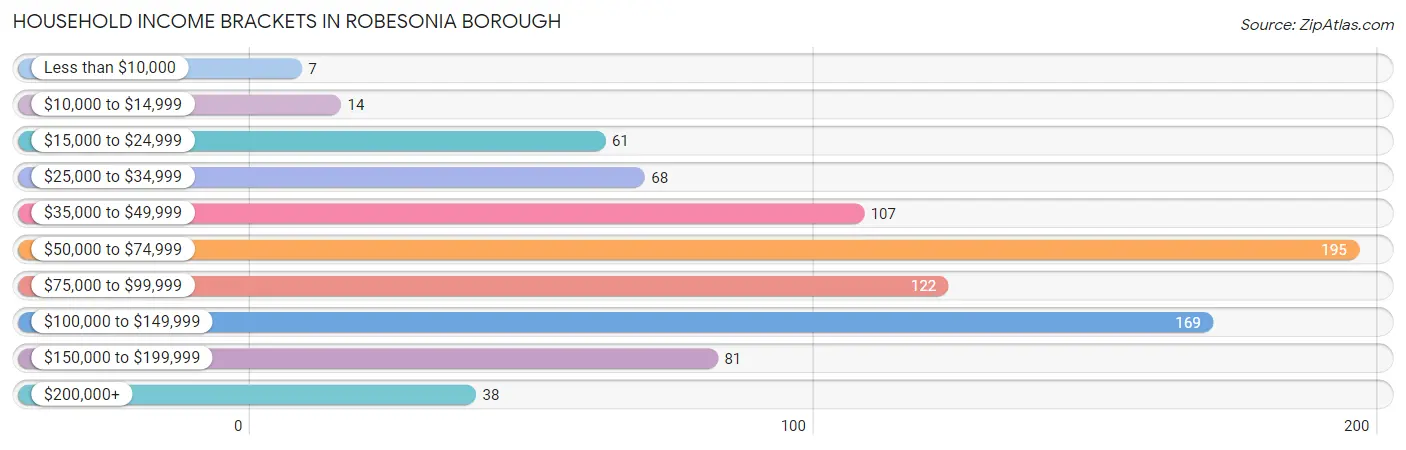
| Income Bracket | # Households | % Households |
| Less than $10,000 | 7 | 0.8% |
| $10,000 to $14,999 | 14 | 1.6% |
| $15,000 to $24,999 | 61 | 7.1% |
| $25,000 to $34,999 | 68 | 7.9% |
| $35,000 to $49,999 | 107 | 12.4% |
| $50,000 to $74,999 | 195 | 22.6% |
| $75,000 to $99,999 | 122 | 14.2% |
| $100,000 to $149,999 | 169 | 19.6% |
| $150,000 to $199,999 | 81 | 9.4% |
| $200,000+ | 38 | 4.4% |
Household Income by Householder Age in Robesonia borough
The median household income in Robesonia borough is $72,394, with the highest median household income of $81,667 found in the 25 to 44 years age bracket for the primary householder. A total of 240 households (27.8%) fall into this category. Meanwhile, the 15 to 24 years age bracket for the primary householder has the lowest median household income of $0, with 9 households (1.0%) in this group.
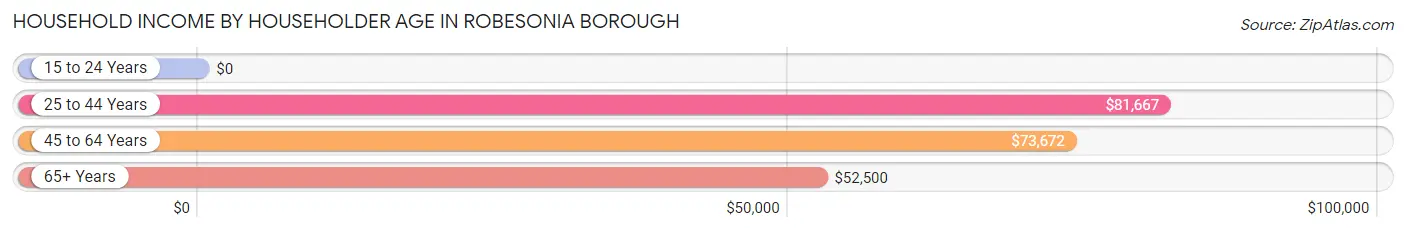
| Income Bracket | # Households | Median Income |
| 15 to 24 Years | 9 (1.0%) | $0 |
| 25 to 44 Years | 240 (27.8%) | $81,667 |
| 45 to 64 Years | 371 (43.0%) | $73,672 |
| 65+ Years | 242 (28.1%) | $52,500 |
| Total | 862 (100.0%) | $72,394 |
Poverty in Robesonia borough
Income Below Poverty by Sex and Age in Robesonia borough
With 3.8% poverty level for males and 5.3% for females among the residents of Robesonia borough, under 5 year old males and 65 to 74 year old females are the most vulnerable to poverty, with 14 males (16.7%) and 25 females (21.5%) in their respective age groups living below the poverty level.
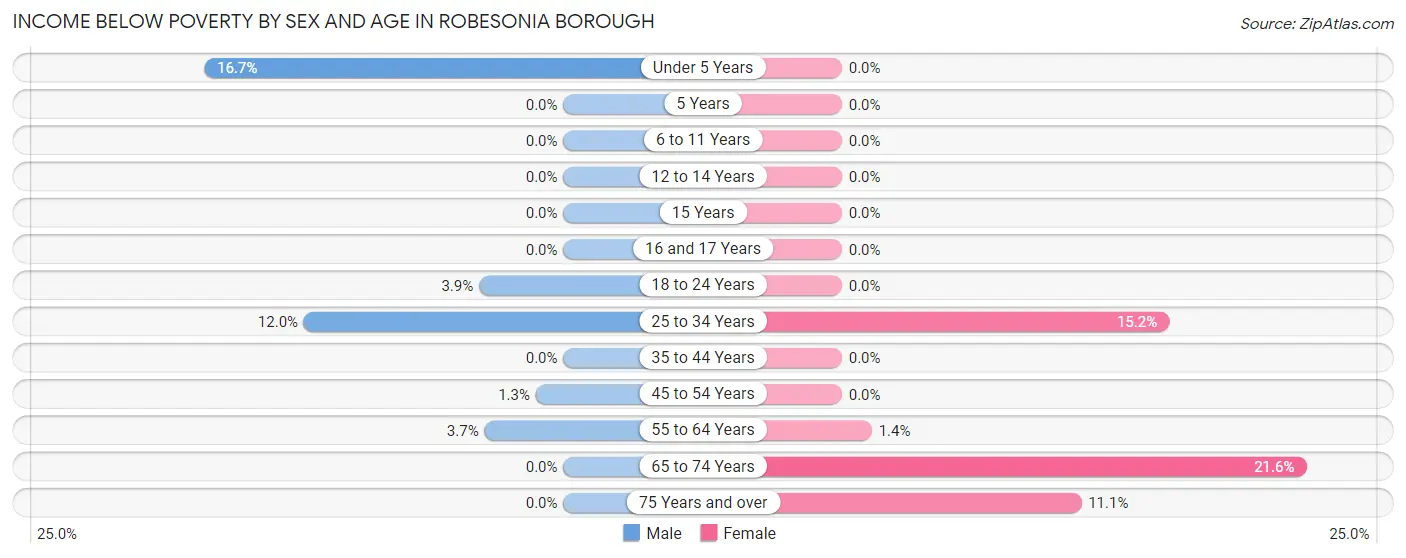
| Age Bracket | Male | Female |
| Under 5 Years | 14 (16.7%) | 0 (0.0%) |
| 5 Years | 0 (0.0%) | 0 (0.0%) |
| 6 to 11 Years | 0 (0.0%) | 0 (0.0%) |
| 12 to 14 Years | 0 (0.0%) | 0 (0.0%) |
| 15 Years | 0 (0.0%) | 0 (0.0%) |
| 16 and 17 Years | 0 (0.0%) | 0 (0.0%) |
| 18 to 24 Years | 5 (3.9%) | 0 (0.0%) |
| 25 to 34 Years | 13 (12.0%) | 17 (15.2%) |
| 35 to 44 Years | 0 (0.0%) | 0 (0.0%) |
| 45 to 54 Years | 2 (1.3%) | 0 (0.0%) |
| 55 to 64 Years | 6 (3.7%) | 3 (1.4%) |
| 65 to 74 Years | 0 (0.0%) | 25 (21.5%) |
| 75 Years and over | 0 (0.0%) | 14 (11.1%) |
| Total | 40 (3.8%) | 59 (5.3%) |
Income Above Poverty by Sex and Age in Robesonia borough
According to the poverty statistics in Robesonia borough, males aged 5 years and females aged under 5 years are the age groups that are most secure financially, with 100.0% of males and 100.0% of females in these age groups living above the poverty line.
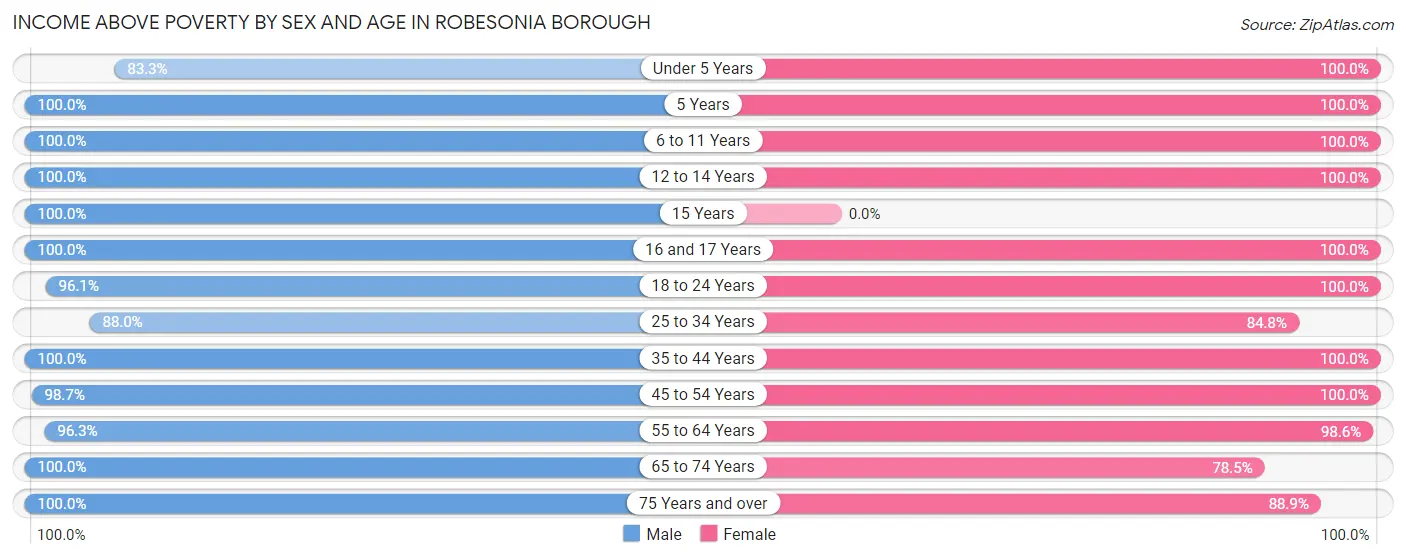
| Age Bracket | Male | Female |
| Under 5 Years | 70 (83.3%) | 35 (100.0%) |
| 5 Years | 34 (100.0%) | 13 (100.0%) |
| 6 to 11 Years | 115 (100.0%) | 42 (100.0%) |
| 12 to 14 Years | 9 (100.0%) | 37 (100.0%) |
| 15 Years | 4 (100.0%) | 0 (0.0%) |
| 16 and 17 Years | 4 (100.0%) | 18 (100.0%) |
| 18 to 24 Years | 123 (96.1%) | 128 (100.0%) |
| 25 to 34 Years | 95 (88.0%) | 95 (84.8%) |
| 35 to 44 Years | 112 (100.0%) | 162 (100.0%) |
| 45 to 54 Years | 154 (98.7%) | 104 (100.0%) |
| 55 to 64 Years | 158 (96.3%) | 213 (98.6%) |
| 65 to 74 Years | 102 (100.0%) | 91 (78.4%) |
| 75 Years and over | 20 (100.0%) | 112 (88.9%) |
| Total | 1,000 (96.2%) | 1,050 (94.7%) |
Income Below Poverty Among Married-Couple Families in Robesonia borough
The poverty statistics for married-couple families in Robesonia borough show that 0.6% or 2 of the total 353 families live below the poverty line. Families with no children have the highest poverty rate of 1.2%, comprising of 2 families. On the other hand, families with 1 or 2 children have the lowest poverty rate of 0.0%, which includes 0 families.
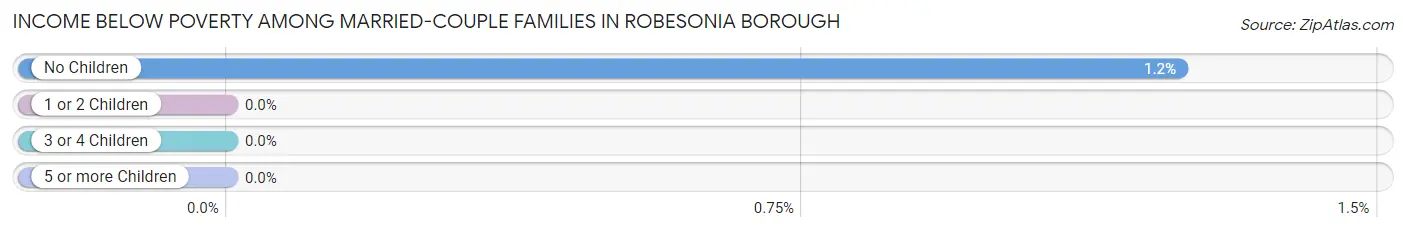
| Children | Above Poverty | Below Poverty |
| No Children | 159 (98.8%) | 2 (1.2%) |
| 1 or 2 Children | 181 (100.0%) | 0 (0.0%) |
| 3 or 4 Children | 11 (100.0%) | 0 (0.0%) |
| 5 or more Children | 0 (0.0%) | 0 (0.0%) |
| Total | 351 (99.4%) | 2 (0.6%) |
Income Below Poverty Among Single-Parent Households in Robesonia borough
According to the poverty data in Robesonia borough, 6.1% or 5 single-father households and 15.9% or 17 single-mother households are living below the poverty line. Among single-father households, those with no children have the highest poverty rate, with 5 households (7.6%) experiencing poverty. Likewise, among single-mother households, those with 1 or 2 children have the highest poverty rate, with 17 households (32.1%) falling below the poverty line.
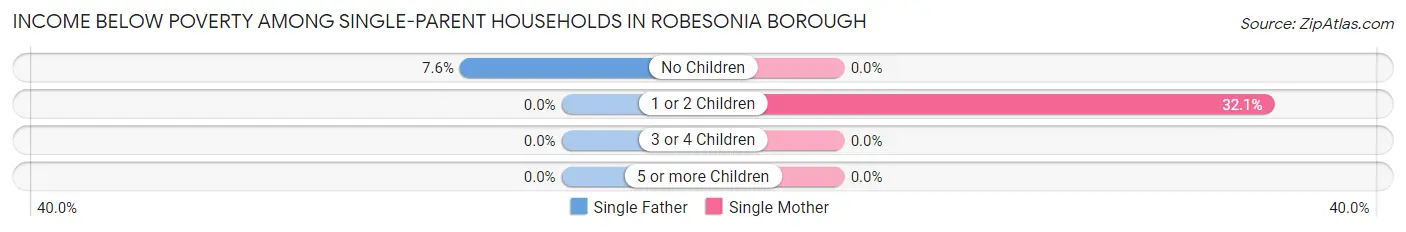
| Children | Single Father | Single Mother |
| No Children | 5 (7.6%) | 0 (0.0%) |
| 1 or 2 Children | 0 (0.0%) | 17 (32.1%) |
| 3 or 4 Children | 0 (0.0%) | 0 (0.0%) |
| 5 or more Children | 0 (0.0%) | 0 (0.0%) |
| Total | 5 (6.1%) | 17 (15.9%) |
Income Below Poverty Among Married-Couple vs Single-Parent Households in Robesonia borough
The poverty data for Robesonia borough shows that 2 of the married-couple family households (0.6%) and 22 of the single-parent households (11.6%) are living below the poverty level. Within the married-couple family households, those with no children have the highest poverty rate, with 2 households (1.2%) falling below the poverty line. Among the single-parent households, those with 1 or 2 children have the highest poverty rate, with 17 household (24.6%) living below poverty.
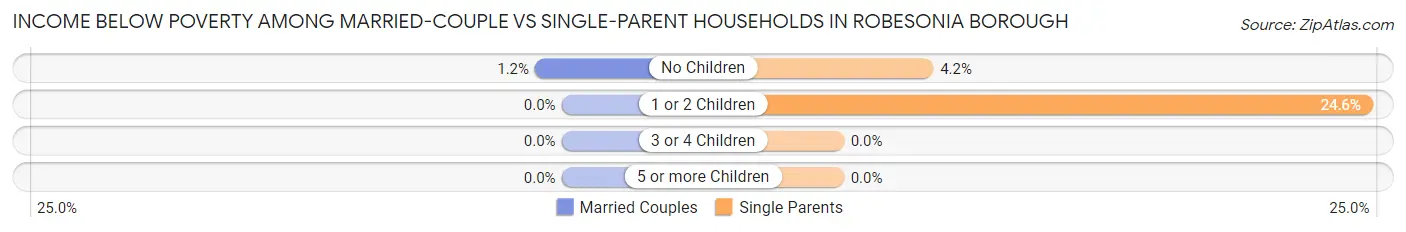
| Children | Married-Couple Families | Single-Parent Households |
| No Children | 2 (1.2%) | 5 (4.2%) |
| 1 or 2 Children | 0 (0.0%) | 17 (24.6%) |
| 3 or 4 Children | 0 (0.0%) | 0 (0.0%) |
| 5 or more Children | 0 (0.0%) | 0 (0.0%) |
| Total | 2 (0.6%) | 22 (11.6%) |
Race in Robesonia borough
The most populous races in Robesonia borough are White / Caucasian (1,993 | 92.7%), Hispanic or Latino (111 | 5.2%), and Two or more Races (80 | 3.7%).
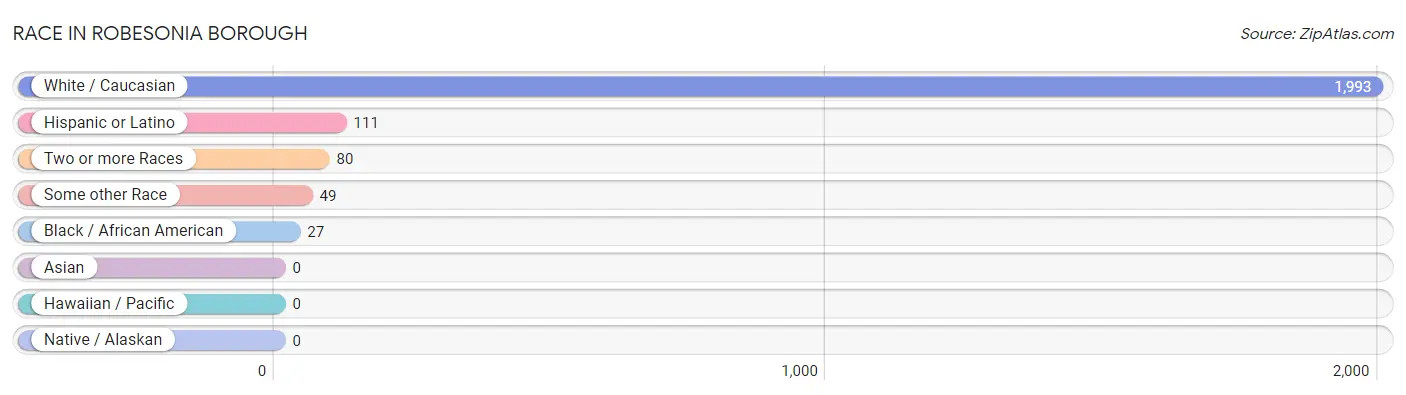
| Race | # Population | % Population |
| Asian | 0 | 0.0% |
| Black / African American | 27 | 1.3% |
| Hawaiian / Pacific | 0 | 0.0% |
| Hispanic or Latino | 111 | 5.2% |
| Native / Alaskan | 0 | 0.0% |
| White / Caucasian | 1,993 | 92.7% |
| Two or more Races | 80 | 3.7% |
| Some other Race | 49 | 2.3% |
| Total | 2,149 | 100.0% |
Ancestry in Robesonia borough
The most populous ancestries reported in Robesonia borough are German (854 | 39.7%), Italian (203 | 9.5%), Polish (182 | 8.5%), Irish (134 | 6.2%), and Pennsylvania German (96 | 4.5%), together accounting for 68.4% of all Robesonia borough residents.
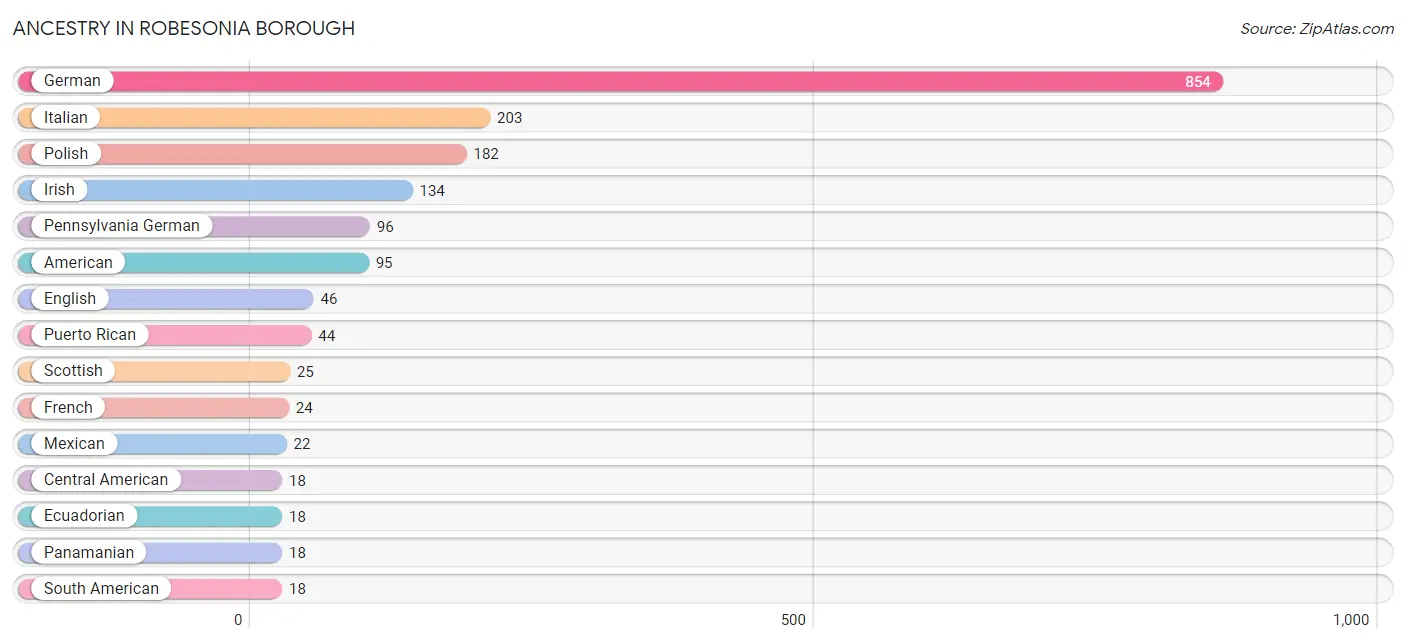
| Ancestry | # Population | % Population |
| American | 95 | 4.4% |
| Austrian | 9 | 0.4% |
| Central American | 18 | 0.8% |
| Cuban | 3 | 0.1% |
| Danish | 8 | 0.4% |
| Dutch | 17 | 0.8% |
| Dutch West Indian | 4 | 0.2% |
| Eastern European | 13 | 0.6% |
| Ecuadorian | 18 | 0.8% |
| English | 46 | 2.1% |
| European | 12 | 0.6% |
| Finnish | 6 | 0.3% |
| French | 24 | 1.1% |
| German | 854 | 39.7% |
| Greek | 14 | 0.6% |
| Hungarian | 5 | 0.2% |
| Irish | 134 | 6.2% |
| Italian | 203 | 9.5% |
| Mexican | 22 | 1.0% |
| Northern European | 6 | 0.3% |
| Panamanian | 18 | 0.8% |
| Pennsylvania German | 96 | 4.5% |
| Polish | 182 | 8.5% |
| Puerto Rican | 44 | 2.1% |
| Russian | 6 | 0.3% |
| Scotch-Irish | 6 | 0.3% |
| Scottish | 25 | 1.2% |
| Slovak | 6 | 0.3% |
| South American | 18 | 0.8% |
| Spaniard | 6 | 0.3% |
| Swedish | 2 | 0.1% |
| Swiss | 15 | 0.7% |
| Welsh | 14 | 0.6% | View All 33 Rows |
Immigrants in Robesonia borough
The most numerous immigrant groups reported in Robesonia borough came from Latin America (28 | 1.3%), Europe (24 | 1.1%), Northern Europe (18 | 0.8%), Central America (16 | 0.7%), and England (12 | 0.6%), together accounting for 4.6% of all Robesonia borough residents.
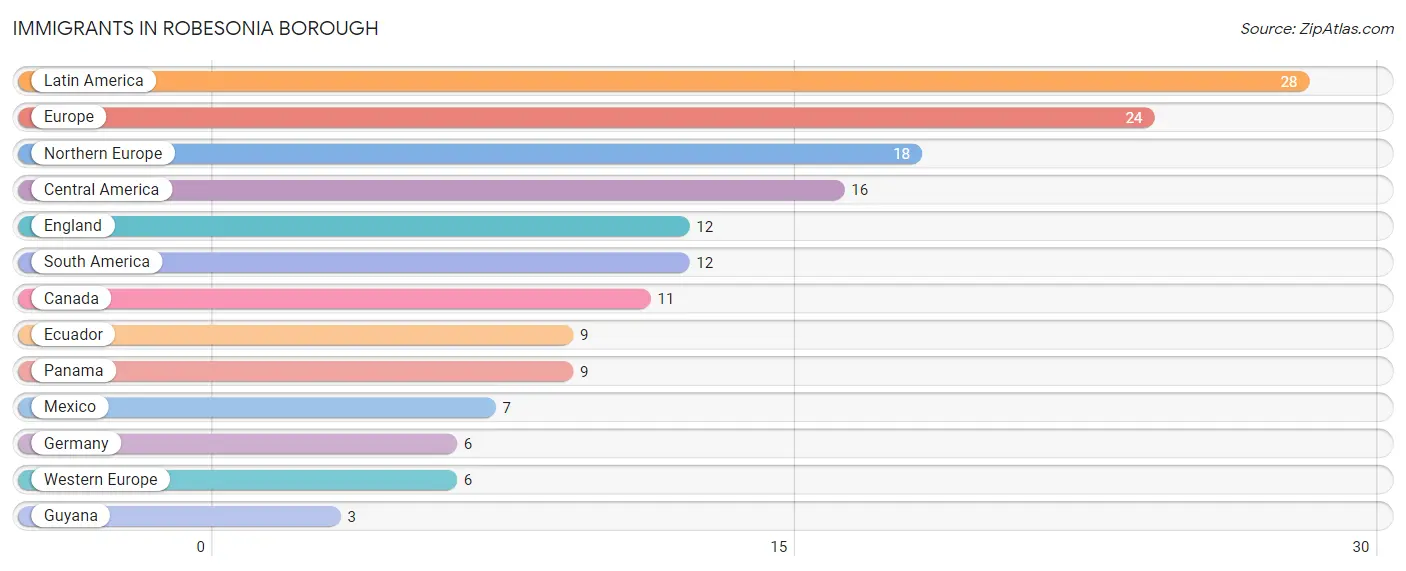
| Immigration Origin | # Population | % Population |
| Canada | 11 | 0.5% |
| Central America | 16 | 0.7% |
| Ecuador | 9 | 0.4% |
| England | 12 | 0.6% |
| Europe | 24 | 1.1% |
| Germany | 6 | 0.3% |
| Guyana | 3 | 0.1% |
| Latin America | 28 | 1.3% |
| Mexico | 7 | 0.3% |
| Northern Europe | 18 | 0.8% |
| Panama | 9 | 0.4% |
| South America | 12 | 0.6% |
| Western Europe | 6 | 0.3% | View All 13 Rows |
Sex and Age in Robesonia borough
Sex and Age in Robesonia borough
The most populous age groups in Robesonia borough are 5 to 9 Years (115 | 11.1%) for men and 60 to 64 Years (139 | 12.5%) for women.
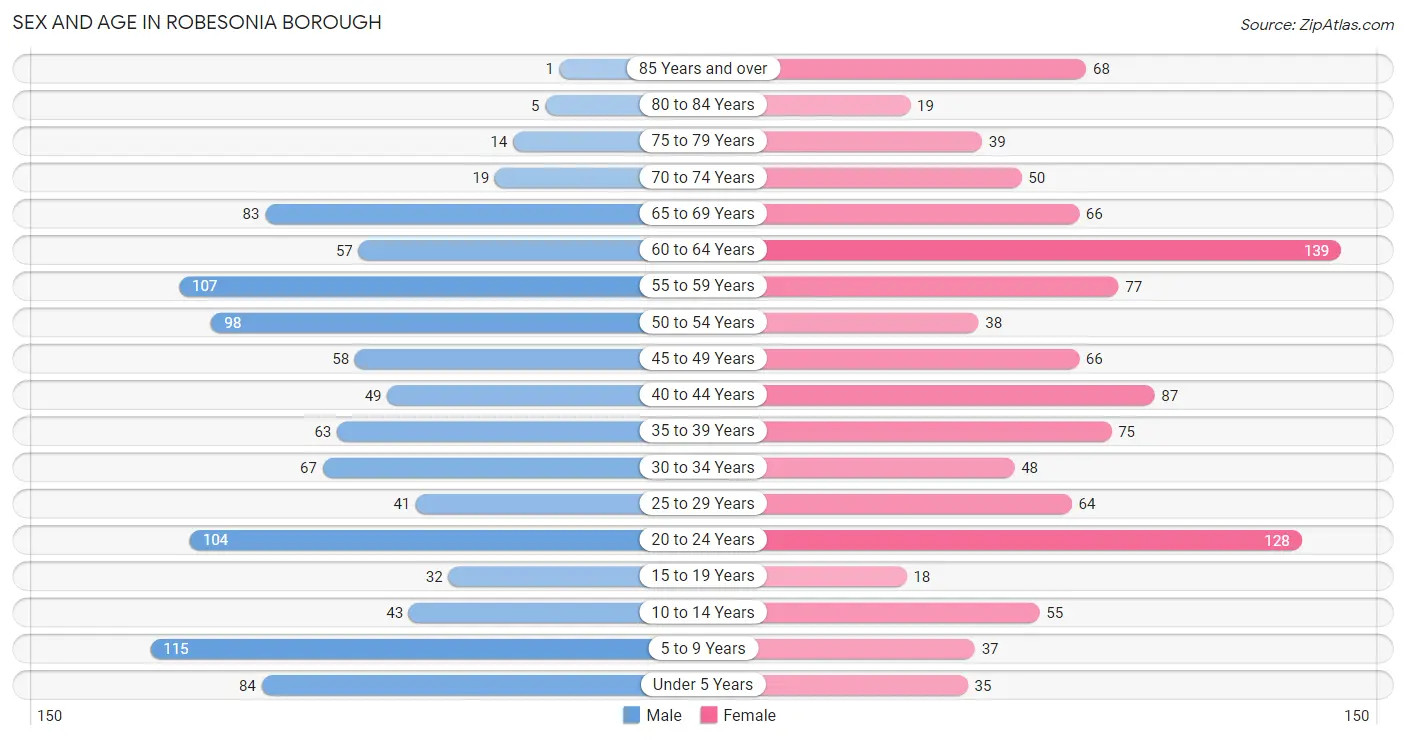
| Age Bracket | Male | Female |
| Under 5 Years | 84 (8.1%) | 35 (3.2%) |
| 5 to 9 Years | 115 (11.1%) | 37 (3.3%) |
| 10 to 14 Years | 43 (4.1%) | 55 (5.0%) |
| 15 to 19 Years | 32 (3.1%) | 18 (1.6%) |
| 20 to 24 Years | 104 (10.0%) | 128 (11.5%) |
| 25 to 29 Years | 41 (3.9%) | 64 (5.8%) |
| 30 to 34 Years | 67 (6.4%) | 48 (4.3%) |
| 35 to 39 Years | 63 (6.1%) | 75 (6.8%) |
| 40 to 44 Years | 49 (4.7%) | 87 (7.8%) |
| 45 to 49 Years | 58 (5.6%) | 66 (5.9%) |
| 50 to 54 Years | 98 (9.4%) | 38 (3.4%) |
| 55 to 59 Years | 107 (10.3%) | 77 (6.9%) |
| 60 to 64 Years | 57 (5.5%) | 139 (12.5%) |
| 65 to 69 Years | 83 (8.0%) | 66 (5.9%) |
| 70 to 74 Years | 19 (1.8%) | 50 (4.5%) |
| 75 to 79 Years | 14 (1.3%) | 39 (3.5%) |
| 80 to 84 Years | 5 (0.5%) | 19 (1.7%) |
| 85 Years and over | 1 (0.1%) | 68 (6.1%) |
| Total | 1,040 (100.0%) | 1,109 (100.0%) |
Families and Households in Robesonia borough
Median Family Size in Robesonia borough
The median family size in Robesonia borough is 3.15 persons per family, with married-couple families (353 | 65.1%) accounting for the largest median family size of 3.37 persons per family. On the other hand, single male/father families (82 | 15.1%) represent the smallest median family size with 2.70 persons per family.
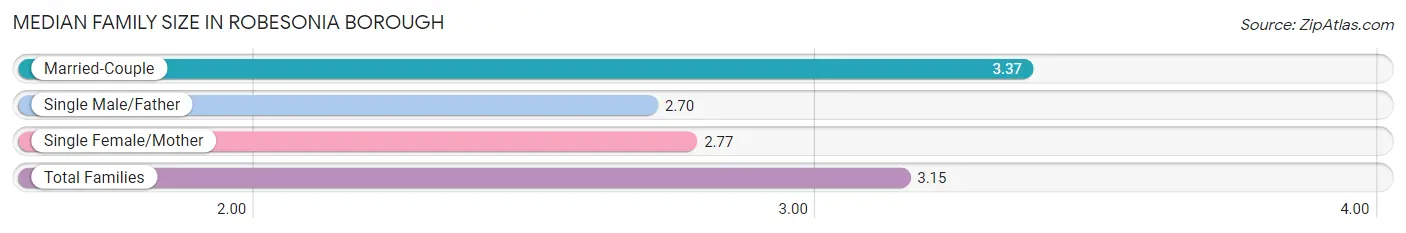
| Family Type | # Families | Family Size |
| Married-Couple | 353 (65.1%) | 3.37 |
| Single Male/Father | 82 (15.1%) | 2.70 |
| Single Female/Mother | 107 (19.7%) | 2.77 |
| Total Families | 542 (100.0%) | 3.15 |
Median Household Size in Robesonia borough
The median household size in Robesonia borough is 2.49 persons per household, with married-couple households (353 | 40.9%) accounting for the largest median household size of 3.38 persons per household. non-family households (320 | 37.1%) represent the smallest median household size with 1.17 persons per household.
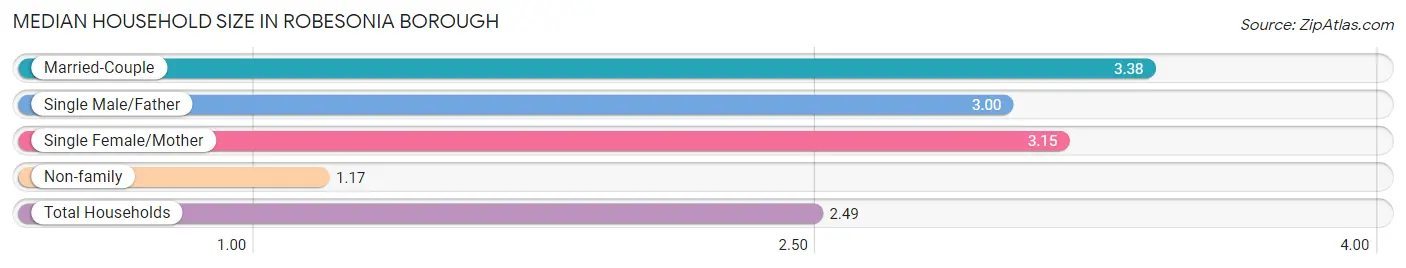
| Household Type | # Households | Household Size |
| Married-Couple | 353 (40.9%) | 3.38 |
| Single Male/Father | 82 (9.5%) | 3.00 |
| Single Female/Mother | 107 (12.4%) | 3.15 |
| Non-family | 320 (37.1%) | 1.17 |
| Total Households | 862 (100.0%) | 2.49 |
Household Size by Marriage Status in Robesonia borough
Out of a total of 862 households in Robesonia borough, 542 (62.9%) are family households, while 320 (37.1%) are nonfamily households. The most numerous type of family households are 2-person households, comprising 179, and the most common type of nonfamily households are 1-person households, comprising 271.
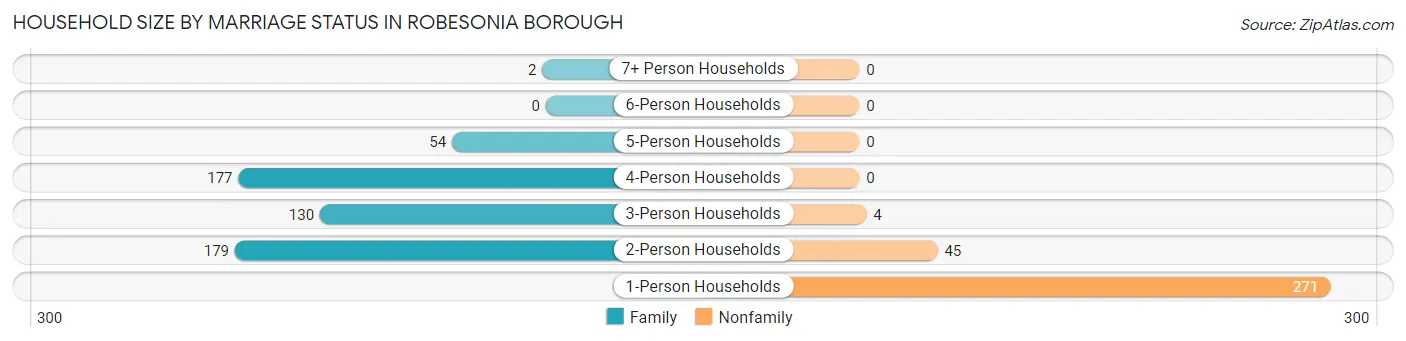
| Household Size | Family Households | Nonfamily Households |
| 1-Person Households | - | 271 (31.4%) |
| 2-Person Households | 179 (20.8%) | 45 (5.2%) |
| 3-Person Households | 130 (15.1%) | 4 (0.5%) |
| 4-Person Households | 177 (20.5%) | 0 (0.0%) |
| 5-Person Households | 54 (6.3%) | 0 (0.0%) |
| 6-Person Households | 0 (0.0%) | 0 (0.0%) |
| 7+ Person Households | 2 (0.2%) | 0 (0.0%) |
| Total | 542 (62.9%) | 320 (37.1%) |
Female Fertility in Robesonia borough
Fertility by Age in Robesonia borough
Average fertility rate in Robesonia borough is 55.0 births per 1,000 women. Women in the age bracket of 35 to 50 years have the highest fertility rate with 100.0 births per 1,000 women. Women in the age bracket of 35 to 50 years acount for 85.2% of all women with births.
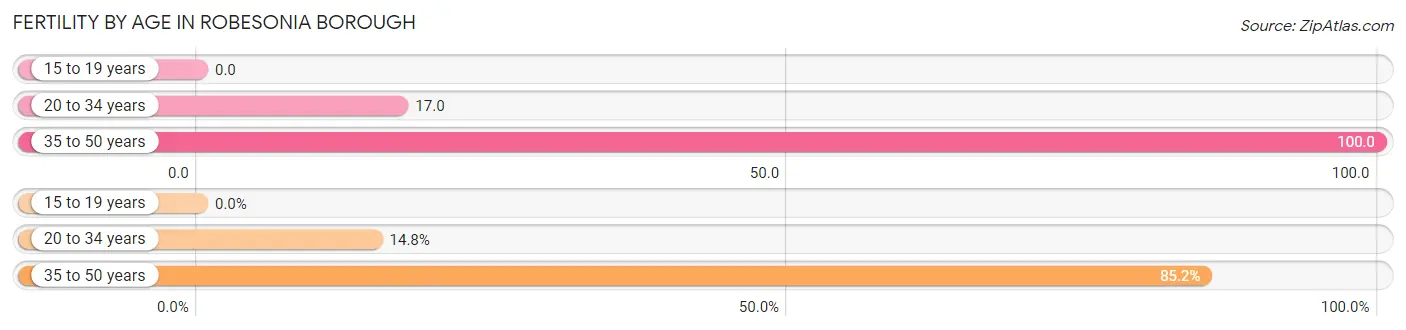
| Age Bracket | Women with Births | Births / 1,000 Women |
| 15 to 19 years | 0 (0.0%) | 0.0 |
| 20 to 34 years | 4 (14.8%) | 17.0 |
| 35 to 50 years | 23 (85.2%) | 100.0 |
| Total | 27 (100.0%) | 55.0 |
Fertility by Age by Marriage Status in Robesonia borough
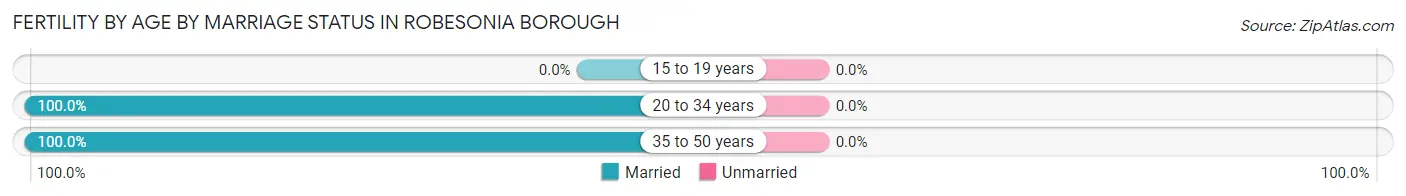
| Age Bracket | Married | Unmarried |
| 15 to 19 years | 0 (0.0%) | 0 (0.0%) |
| 20 to 34 years | 4 (100.0%) | 0 (0.0%) |
| 35 to 50 years | 23 (100.0%) | 0 (0.0%) |
| Total | 27 (100.0%) | 0 (0.0%) |
Fertility by Education in Robesonia borough
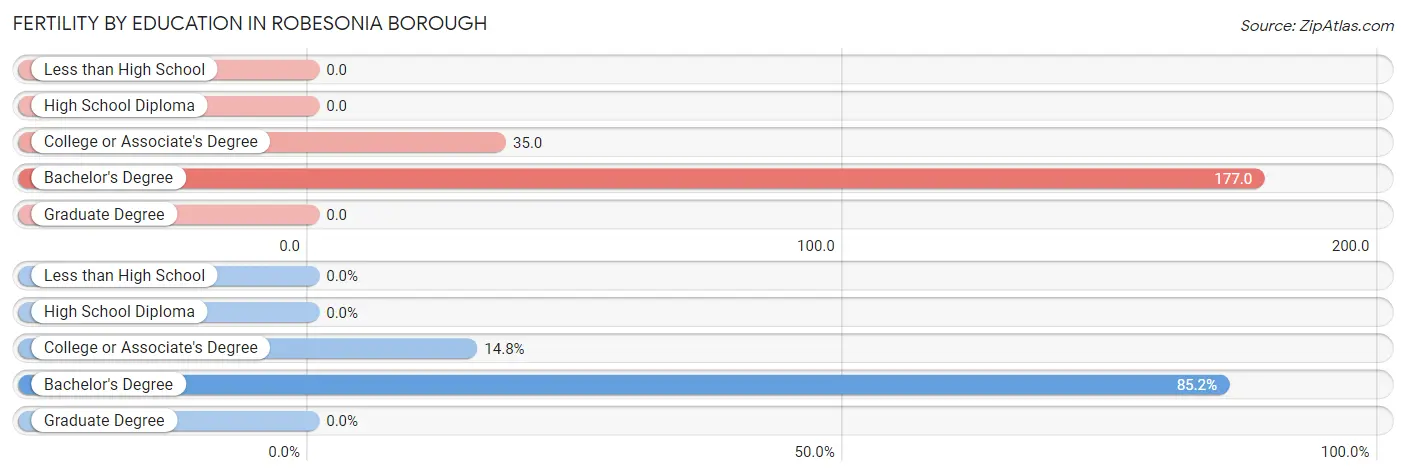
| Educational Attainment | Women with Births | Births / 1,000 Women |
| Less than High School | 0 (0.0%) | 0.0 |
| High School Diploma | 0 (0.0%) | 0.0 |
| College or Associate's Degree | 4 (14.8%) | 35.0 |
| Bachelor's Degree | 23 (85.2%) | 177.0 |
| Graduate Degree | 0 (0.0%) | 0.0 |
| Total | 27 (100.0%) | 55.0 |
Fertility by Education by Marriage Status in Robesonia borough
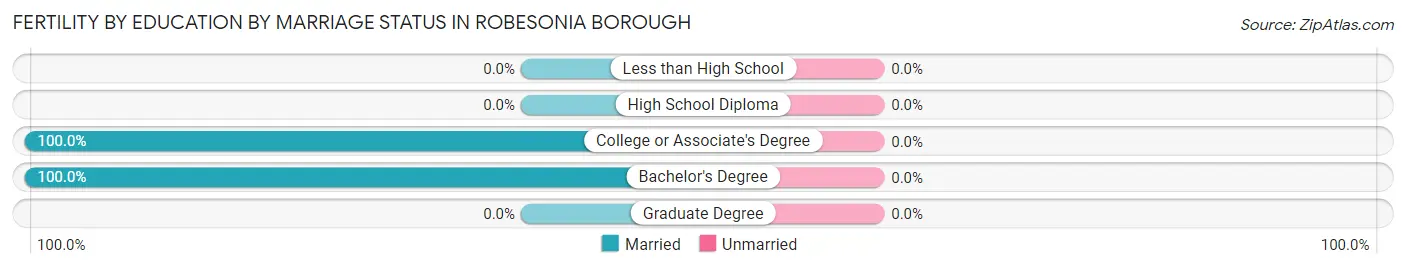
| Educational Attainment | Married | Unmarried |
| Less than High School | 0 (0.0%) | 0 (0.0%) |
| High School Diploma | 0 (0.0%) | 0 (0.0%) |
| College or Associate's Degree | 4 (100.0%) | 0 (0.0%) |
| Bachelor's Degree | 23 (100.0%) | 0 (0.0%) |
| Graduate Degree | 0 (0.0%) | 0 (0.0%) |
| Total | 27 (100.0%) | 0 (0.0%) |
Employment Characteristics in Robesonia borough
Employment by Class of Employer in Robesonia borough
Among the 1,171 employed individuals in Robesonia borough, private company employees (872 | 74.5%), not-for-profit organizations (161 | 13.8%), and federal government employees (40 | 3.4%) make up the most common classes of employment.
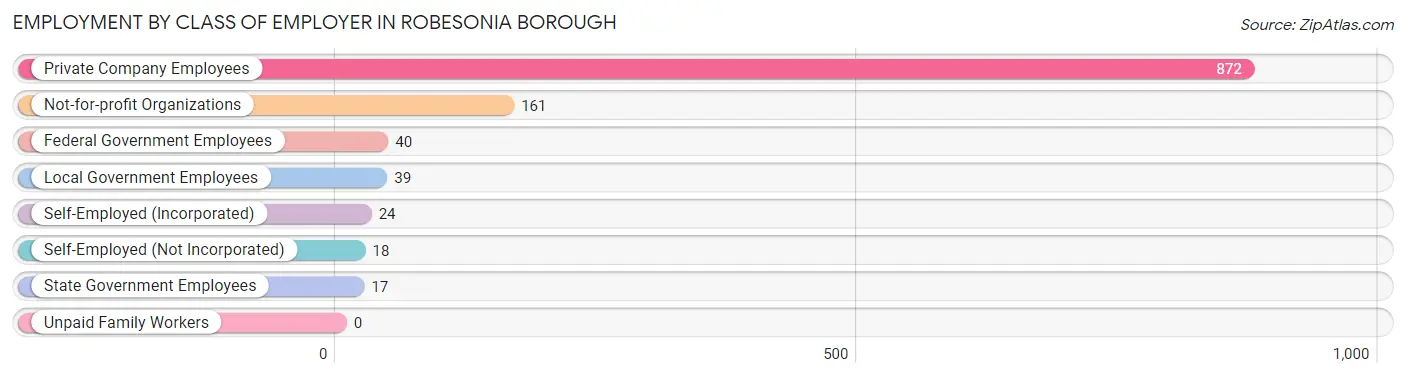
| Employer Class | # Employees | % Employees |
| Private Company Employees | 872 | 74.5% |
| Self-Employed (Incorporated) | 24 | 2.1% |
| Self-Employed (Not Incorporated) | 18 | 1.5% |
| Not-for-profit Organizations | 161 | 13.8% |
| Local Government Employees | 39 | 3.3% |
| State Government Employees | 17 | 1.5% |
| Federal Government Employees | 40 | 3.4% |
| Unpaid Family Workers | 0 | 0.0% |
| Total | 1,171 | 100.0% |
Employment Status by Age in Robesonia borough
According to the labor force statistics for Robesonia borough, out of the total population over 16 years of age (1,776), 67.9% or 1,206 individuals are in the labor force, with 2.5% or 30 of them unemployed. The age group with the highest labor force participation rate is 25 to 29 years, with 99.0% or 104 individuals in the labor force. Within the labor force, the 35 to 44 years age range has the highest percentage of unemployed individuals, with 6.3% or 15 of them being unemployed.
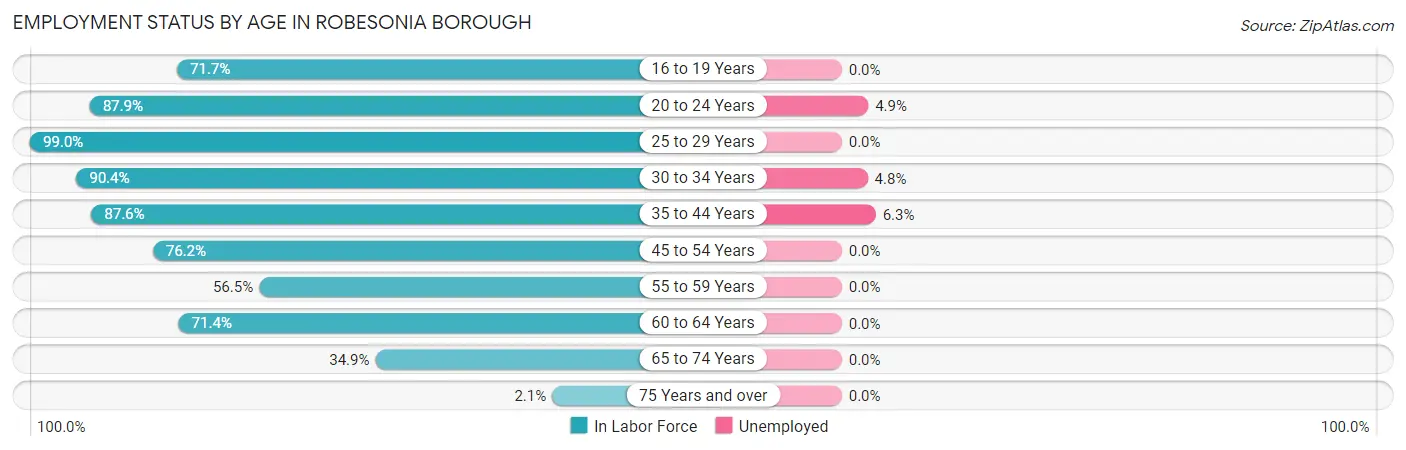
| Age Bracket | In Labor Force | Unemployed |
| 16 to 19 Years | 33 (71.7%) | 0 (0.0%) |
| 20 to 24 Years | 204 (87.9%) | 10 (4.9%) |
| 25 to 29 Years | 104 (99.0%) | 0 (0.0%) |
| 30 to 34 Years | 104 (90.4%) | 5 (4.8%) |
| 35 to 44 Years | 240 (87.6%) | 15 (6.3%) |
| 45 to 54 Years | 198 (76.2%) | 0 (0.0%) |
| 55 to 59 Years | 104 (56.5%) | 0 (0.0%) |
| 60 to 64 Years | 140 (71.4%) | 0 (0.0%) |
| 65 to 74 Years | 76 (34.9%) | 0 (0.0%) |
| 75 Years and over | 3 (2.1%) | 0 (0.0%) |
| Total | 1,206 (67.9%) | 30 (2.5%) |
Employment Status by Educational Attainment in Robesonia borough
According to labor force statistics for Robesonia borough, 78.5% of individuals (890) out of the total population between 25 and 64 years of age (1,134) are in the labor force, with 2.2% or 20 of them being unemployed. The group with the highest labor force participation rate are those with the educational attainment of college / associate degree, with 97.2% or 240 individuals in the labor force. Within the labor force, individuals with less than high school education have the highest percentage of unemployment, with 16.4% or 9 of them being unemployed.
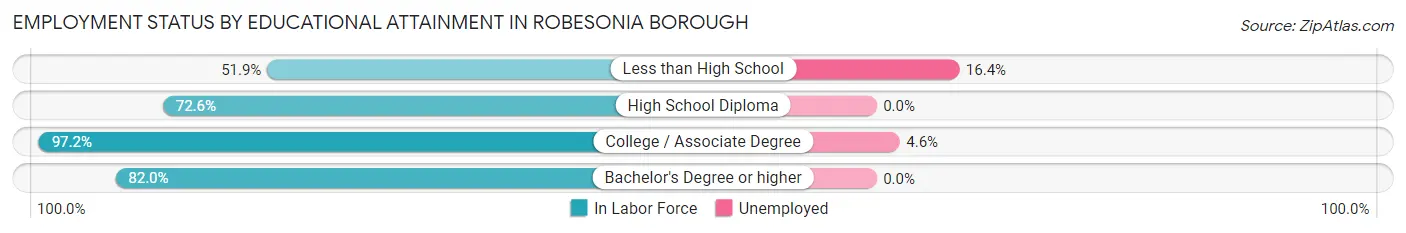
| Educational Attainment | In Labor Force | Unemployed |
| Less than High School | 55 (51.9%) | 17 (16.4%) |
| High School Diploma | 349 (72.6%) | 0 (0.0%) |
| College / Associate Degree | 240 (97.2%) | 11 (4.6%) |
| Bachelor's Degree or higher | 246 (82.0%) | 0 (0.0%) |
| Total | 890 (78.5%) | 25 (2.2%) |
Employment Occupations by Sex in Robesonia borough
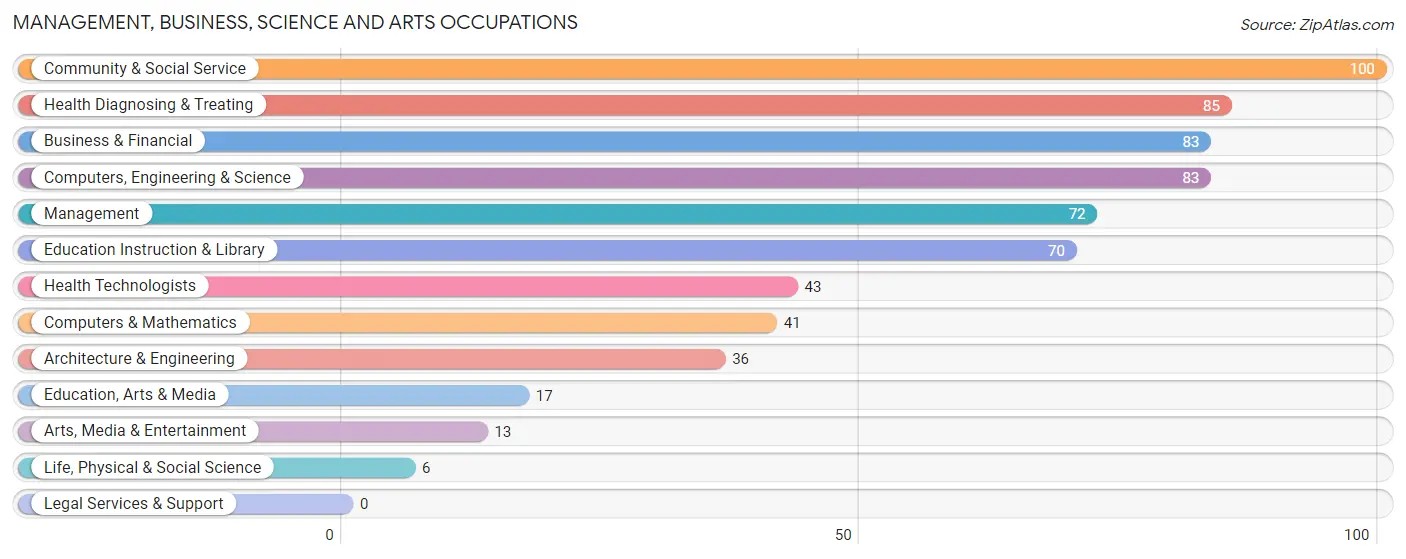
Management, Business, Science and Arts Occupations
The most common Management, Business, Science and Arts occupations in Robesonia borough are Community & Social Service (100 | 8.5%), Health Diagnosing & Treating (85 | 7.2%), Business & Financial (83 | 7.1%), Computers, Engineering & Science (83 | 7.1%), and Management (72 | 6.1%).
Management, Business, Science and Arts Occupations by Sex
Within the Management, Business, Science and Arts occupations in Robesonia borough, the most male-oriented occupations are Computers & Mathematics (100.0%), Life, Physical & Social Science (100.0%), and Computers, Engineering & Science (69.9%), while the most female-oriented occupations are Education Instruction & Library (94.3%), Health Diagnosing & Treating (80.0%), and Community & Social Service (77.0%).
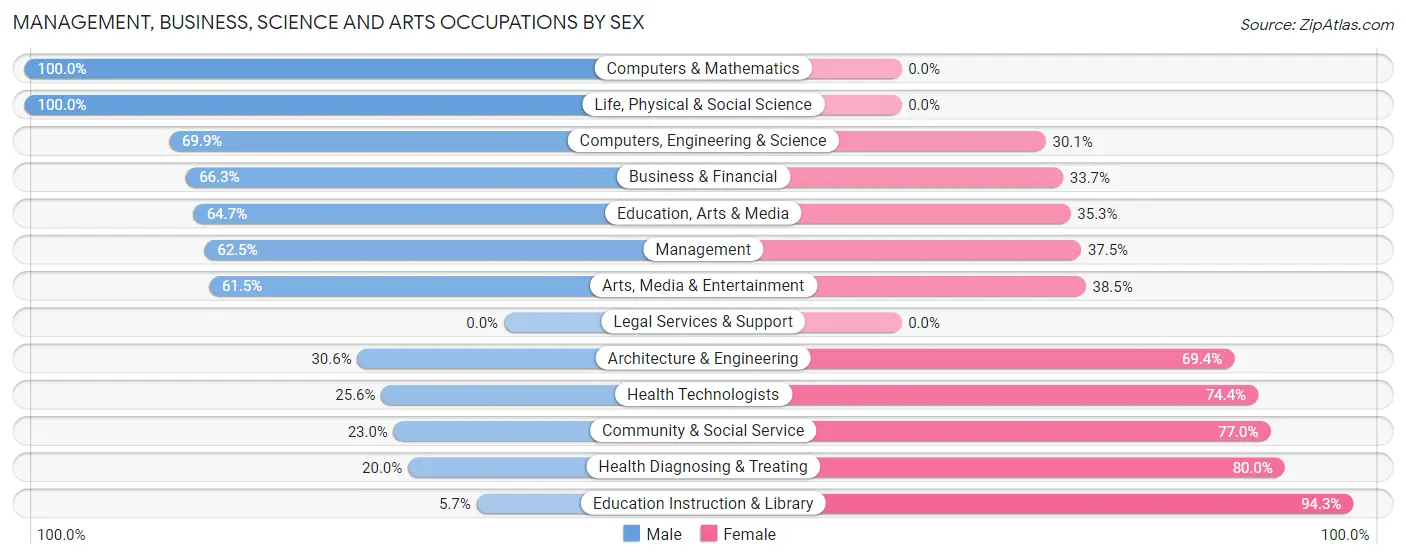
| Occupation | Male | Female |
| Management | 45 (62.5%) | 27 (37.5%) |
| Business & Financial | 55 (66.3%) | 28 (33.7%) |
| Computers, Engineering & Science | 58 (69.9%) | 25 (30.1%) |
| Computers & Mathematics | 41 (100.0%) | 0 (0.0%) |
| Architecture & Engineering | 11 (30.6%) | 25 (69.4%) |
| Life, Physical & Social Science | 6 (100.0%) | 0 (0.0%) |
| Community & Social Service | 23 (23.0%) | 77 (77.0%) |
| Education, Arts & Media | 11 (64.7%) | 6 (35.3%) |
| Legal Services & Support | 0 (0.0%) | 0 (0.0%) |
| Education Instruction & Library | 4 (5.7%) | 66 (94.3%) |
| Arts, Media & Entertainment | 8 (61.5%) | 5 (38.5%) |
| Health Diagnosing & Treating | 17 (20.0%) | 68 (80.0%) |
| Health Technologists | 11 (25.6%) | 32 (74.4%) |
| Total (Category) | 198 (46.8%) | 225 (53.2%) |
| Total (Overall) | 573 (48.7%) | 603 (51.3%) |
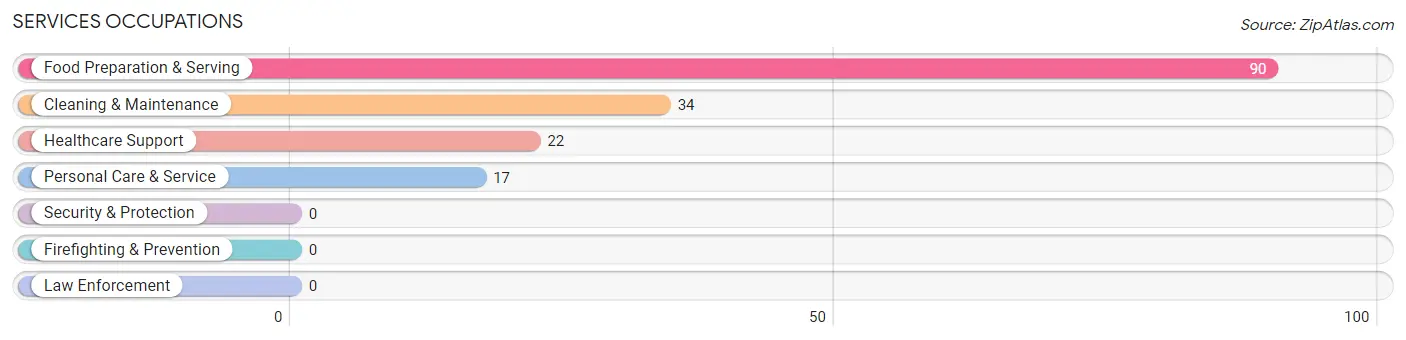
Services Occupations
The most common Services occupations in Robesonia borough are Food Preparation & Serving (90 | 7.6%), Cleaning & Maintenance (34 | 2.9%), Healthcare Support (22 | 1.9%), and Personal Care & Service (17 | 1.5%).
Services Occupations by Sex
Within the Services occupations in Robesonia borough, the most male-oriented occupations are Food Preparation & Serving (54.4%), and Cleaning & Maintenance (38.2%), while the most female-oriented occupations are Healthcare Support (100.0%), Personal Care & Service (100.0%), and Cleaning & Maintenance (61.8%).
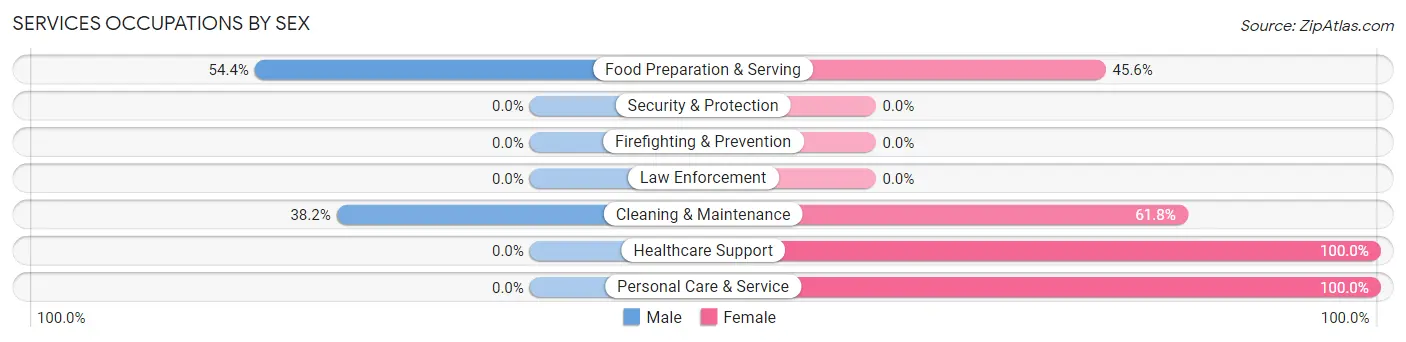
| Occupation | Male | Female |
| Healthcare Support | 0 (0.0%) | 22 (100.0%) |
| Security & Protection | 0 (0.0%) | 0 (0.0%) |
| Firefighting & Prevention | 0 (0.0%) | 0 (0.0%) |
| Law Enforcement | 0 (0.0%) | 0 (0.0%) |
| Food Preparation & Serving | 49 (54.4%) | 41 (45.6%) |
| Cleaning & Maintenance | 13 (38.2%) | 21 (61.8%) |
| Personal Care & Service | 0 (0.0%) | 17 (100.0%) |
| Total (Category) | 62 (38.0%) | 101 (62.0%) |
| Total (Overall) | 573 (48.7%) | 603 (51.3%) |
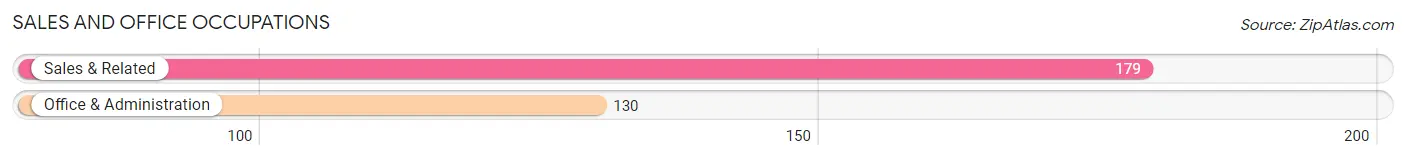
Sales and Office Occupations
The most common Sales and Office occupations in Robesonia borough are Sales & Related (179 | 15.2%), and Office & Administration (130 | 11.1%).
Sales and Office Occupations by Sex
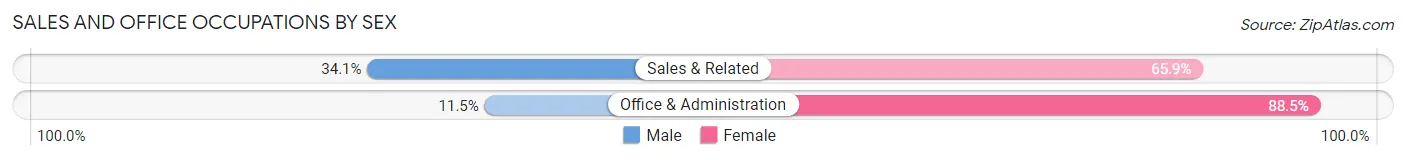
| Occupation | Male | Female |
| Sales & Related | 61 (34.1%) | 118 (65.9%) |
| Office & Administration | 15 (11.5%) | 115 (88.5%) |
| Total (Category) | 76 (24.6%) | 233 (75.4%) |
| Total (Overall) | 573 (48.7%) | 603 (51.3%) |
Natural Resources, Construction and Maintenance Occupations
The most common Natural Resources, Construction and Maintenance occupations in Robesonia borough are Construction & Extraction (93 | 7.9%), and Installation, Maintenance & Repair (33 | 2.8%).
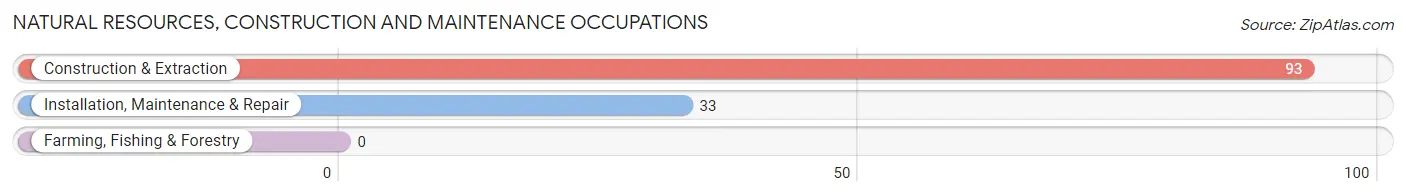
Natural Resources, Construction and Maintenance Occupations by Sex
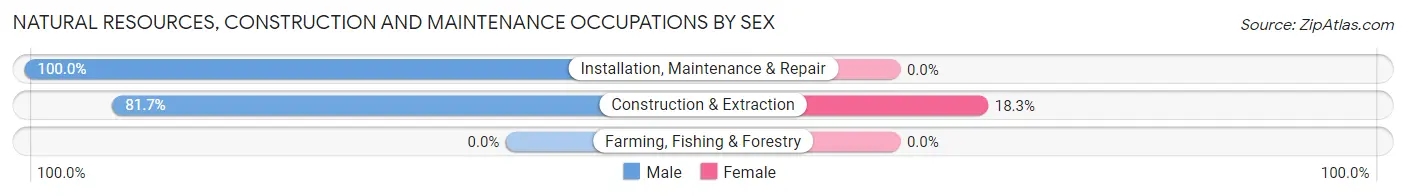
| Occupation | Male | Female |
| Farming, Fishing & Forestry | 0 (0.0%) | 0 (0.0%) |
| Construction & Extraction | 76 (81.7%) | 17 (18.3%) |
| Installation, Maintenance & Repair | 33 (100.0%) | 0 (0.0%) |
| Total (Category) | 109 (86.5%) | 17 (13.5%) |
| Total (Overall) | 573 (48.7%) | 603 (51.3%) |
Production, Transportation and Moving Occupations
The most common Production, Transportation and Moving occupations in Robesonia borough are Material Moving (70 | 5.9%), Production (66 | 5.6%), and Transportation (19 | 1.6%).
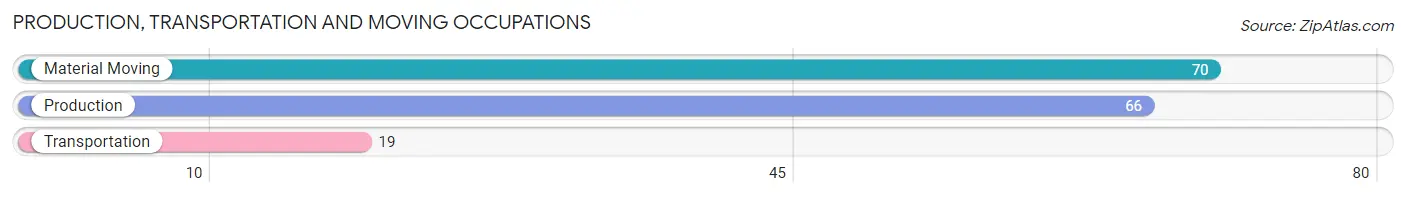
Production, Transportation and Moving Occupations by Sex
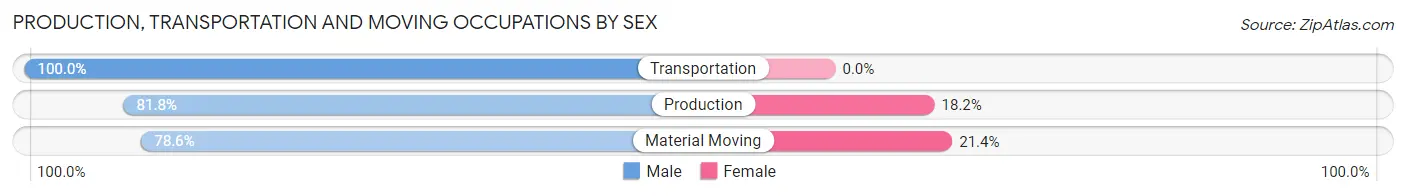
| Occupation | Male | Female |
| Production | 54 (81.8%) | 12 (18.2%) |
| Transportation | 19 (100.0%) | 0 (0.0%) |
| Material Moving | 55 (78.6%) | 15 (21.4%) |
| Total (Category) | 128 (82.6%) | 27 (17.4%) |
| Total (Overall) | 573 (48.7%) | 603 (51.3%) |
Employment Industries by Sex in Robesonia borough
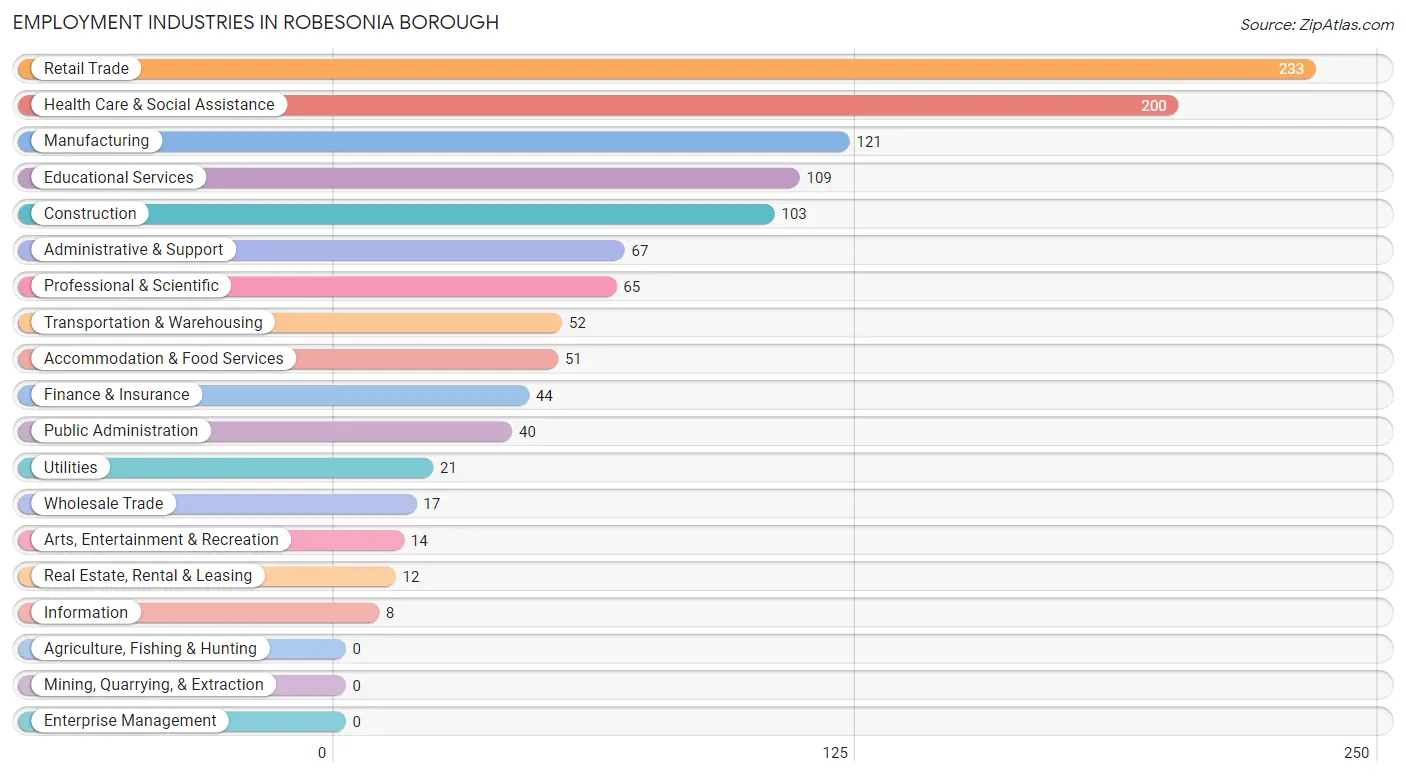
Employment Industries in Robesonia borough
The major employment industries in Robesonia borough include Retail Trade (233 | 19.8%), Health Care & Social Assistance (200 | 17.0%), Manufacturing (121 | 10.3%), Educational Services (109 | 9.3%), and Construction (103 | 8.8%).
Employment Industries by Sex in Robesonia borough
The Robesonia borough industries that see more men than women are Arts, Entertainment & Recreation (100.0%), Transportation & Warehousing (88.5%), and Public Administration (82.5%), whereas the industries that tend to have a higher number of women are Utilities (100.0%), Information (100.0%), and Finance & Insurance (93.2%).
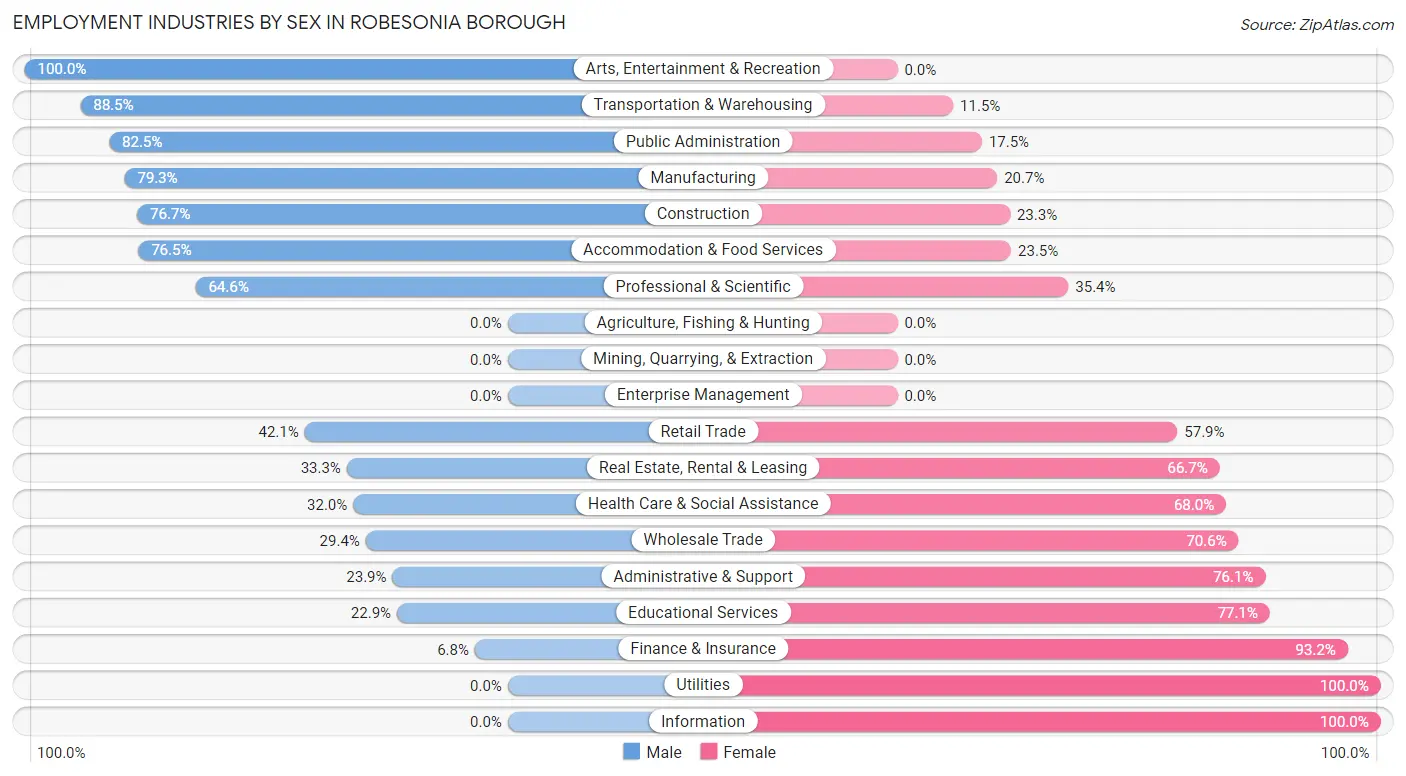
| Industry | Male | Female |
| Agriculture, Fishing & Hunting | 0 (0.0%) | 0 (0.0%) |
| Mining, Quarrying, & Extraction | 0 (0.0%) | 0 (0.0%) |
| Construction | 79 (76.7%) | 24 (23.3%) |
| Manufacturing | 96 (79.3%) | 25 (20.7%) |
| Wholesale Trade | 5 (29.4%) | 12 (70.6%) |
| Retail Trade | 98 (42.1%) | 135 (57.9%) |
| Transportation & Warehousing | 46 (88.5%) | 6 (11.5%) |
| Utilities | 0 (0.0%) | 21 (100.0%) |
| Information | 0 (0.0%) | 8 (100.0%) |
| Finance & Insurance | 3 (6.8%) | 41 (93.2%) |
| Real Estate, Rental & Leasing | 4 (33.3%) | 8 (66.7%) |
| Professional & Scientific | 42 (64.6%) | 23 (35.4%) |
| Enterprise Management | 0 (0.0%) | 0 (0.0%) |
| Administrative & Support | 16 (23.9%) | 51 (76.1%) |
| Educational Services | 25 (22.9%) | 84 (77.1%) |
| Health Care & Social Assistance | 64 (32.0%) | 136 (68.0%) |
| Arts, Entertainment & Recreation | 14 (100.0%) | 0 (0.0%) |
| Accommodation & Food Services | 39 (76.5%) | 12 (23.5%) |
| Public Administration | 33 (82.5%) | 7 (17.5%) |
| Total | 573 (48.7%) | 603 (51.3%) |
Education in Robesonia borough
School Enrollment in Robesonia borough
The most common levels of schooling among the 311 students in Robesonia borough are elementary school (104 | 33.4%), middle school (82 | 26.4%), and college / undergraduate (60 | 19.3%).
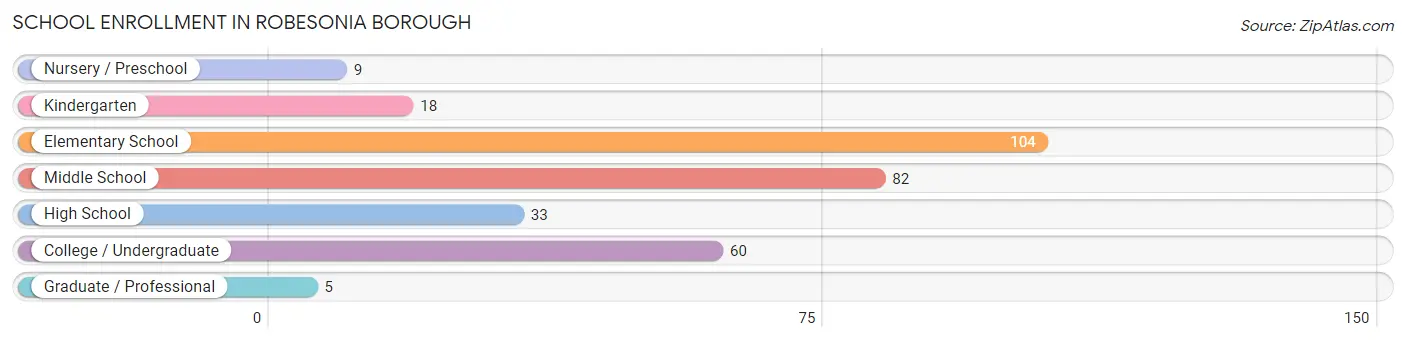
| School Level | # Students | % Students |
| Nursery / Preschool | 9 | 2.9% |
| Kindergarten | 18 | 5.8% |
| Elementary School | 104 | 33.4% |
| Middle School | 82 | 26.4% |
| High School | 33 | 10.6% |
| College / Undergraduate | 60 | 19.3% |
| Graduate / Professional | 5 | 1.6% |
| Total | 311 | 100.0% |
School Enrollment by Age by Funding Source in Robesonia borough
Out of a total of 311 students who are enrolled in schools in Robesonia borough, 66 (21.2%) attend a private institution, while the remaining 245 (78.8%) are enrolled in public schools. The age group of 3 to 4 year olds has the highest likelihood of being enrolled in private schools, with 3 (100.0% in the age bracket) enrolled. Conversely, the age group of 15 to 17 year olds has the lowest likelihood of being enrolled in a private school, with 26 (100.0% in the age bracket) attending a public institution.
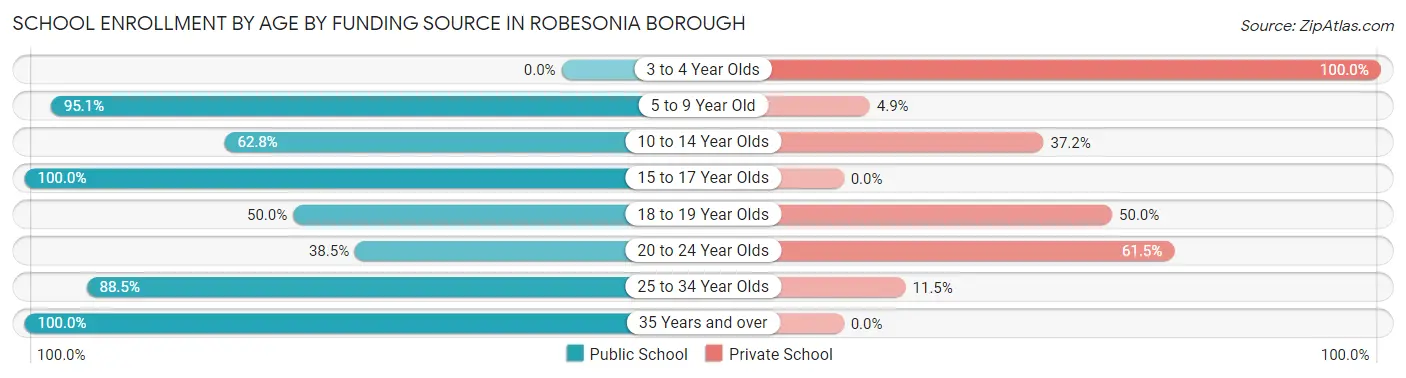
| Age Bracket | Public School | Private School |
| 3 to 4 Year Olds | 0 (0.0%) | 3 (100.0%) |
| 5 to 9 Year Old | 117 (95.1%) | 6 (4.9%) |
| 10 to 14 Year Olds | 59 (62.8%) | 35 (37.2%) |
| 15 to 17 Year Olds | 26 (100.0%) | 0 (0.0%) |
| 18 to 19 Year Olds | 3 (50.0%) | 3 (50.0%) |
| 20 to 24 Year Olds | 10 (38.5%) | 16 (61.5%) |
| 25 to 34 Year Olds | 23 (88.5%) | 3 (11.5%) |
| 35 Years and over | 7 (100.0%) | 0 (0.0%) |
| Total | 245 (78.8%) | 66 (21.2%) |
Educational Attainment by Field of Study in Robesonia borough
Business (80 | 21.9%), education (71 | 19.4%), science & technology (67 | 18.3%), arts & humanities (62 | 16.9%), and psychology (37 | 10.1%) are the most common fields of study among 366 individuals in Robesonia borough who have obtained a bachelor's degree or higher.
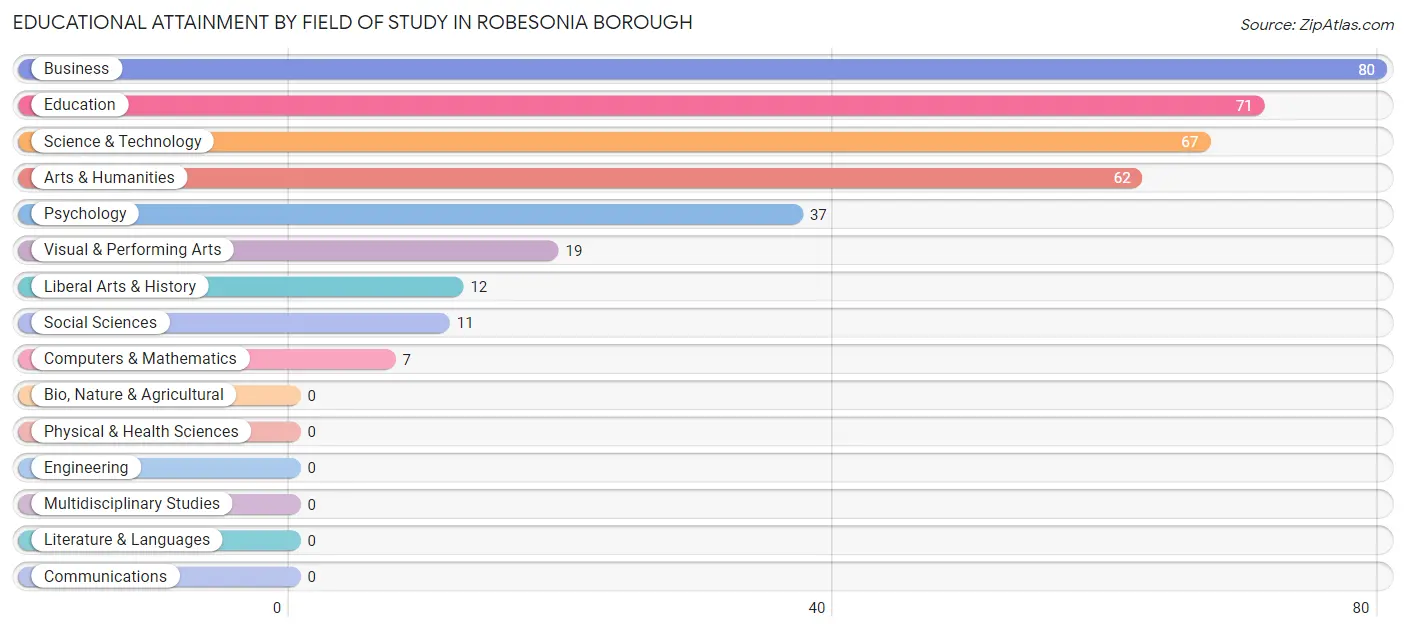
| Field of Study | # Graduates | % Graduates |
| Computers & Mathematics | 7 | 1.9% |
| Bio, Nature & Agricultural | 0 | 0.0% |
| Physical & Health Sciences | 0 | 0.0% |
| Psychology | 37 | 10.1% |
| Social Sciences | 11 | 3.0% |
| Engineering | 0 | 0.0% |
| Multidisciplinary Studies | 0 | 0.0% |
| Science & Technology | 67 | 18.3% |
| Business | 80 | 21.9% |
| Education | 71 | 19.4% |
| Literature & Languages | 0 | 0.0% |
| Liberal Arts & History | 12 | 3.3% |
| Visual & Performing Arts | 19 | 5.2% |
| Communications | 0 | 0.0% |
| Arts & Humanities | 62 | 16.9% |
| Total | 366 | 100.0% |
Transportation & Commute in Robesonia borough
Vehicle Availability by Sex in Robesonia borough
The most prevalent vehicle ownership categories in Robesonia borough are males with 2 vehicles (198, accounting for 34.9%) and females with 2 vehicles (196, making up 32.8%).
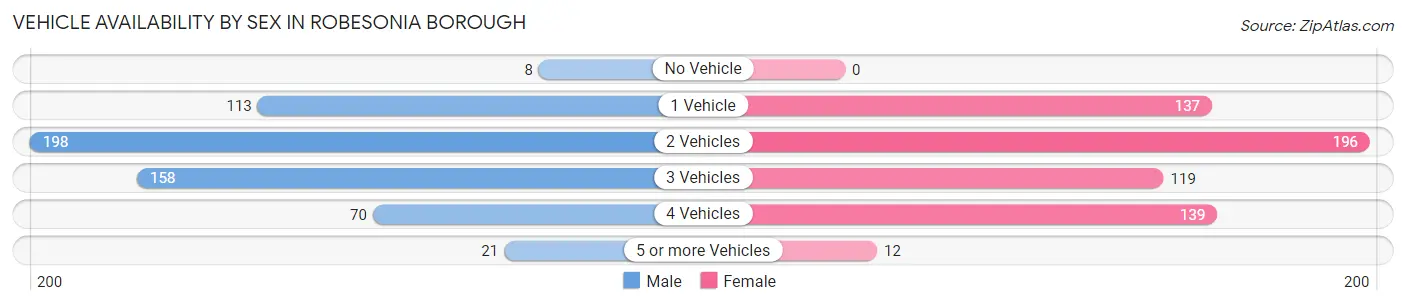
| Vehicles Available | Male | Female |
| No Vehicle | 8 (1.4%) | 0 (0.0%) |
| 1 Vehicle | 113 (19.9%) | 137 (22.7%) |
| 2 Vehicles | 198 (34.9%) | 196 (32.5%) |
| 3 Vehicles | 158 (27.8%) | 119 (19.7%) |
| 4 Vehicles | 70 (12.3%) | 139 (23.1%) |
| 5 or more Vehicles | 21 (3.7%) | 12 (2.0%) |
| Total | 568 (100.0%) | 603 (100.0%) |
Commute Time in Robesonia borough
The most frequently occuring commute durations in Robesonia borough are 25 to 29 minutes (194 commuters, 17.4%), 30 to 34 minutes (165 commuters, 14.8%), and 45 to 59 minutes (156 commuters, 14.0%).
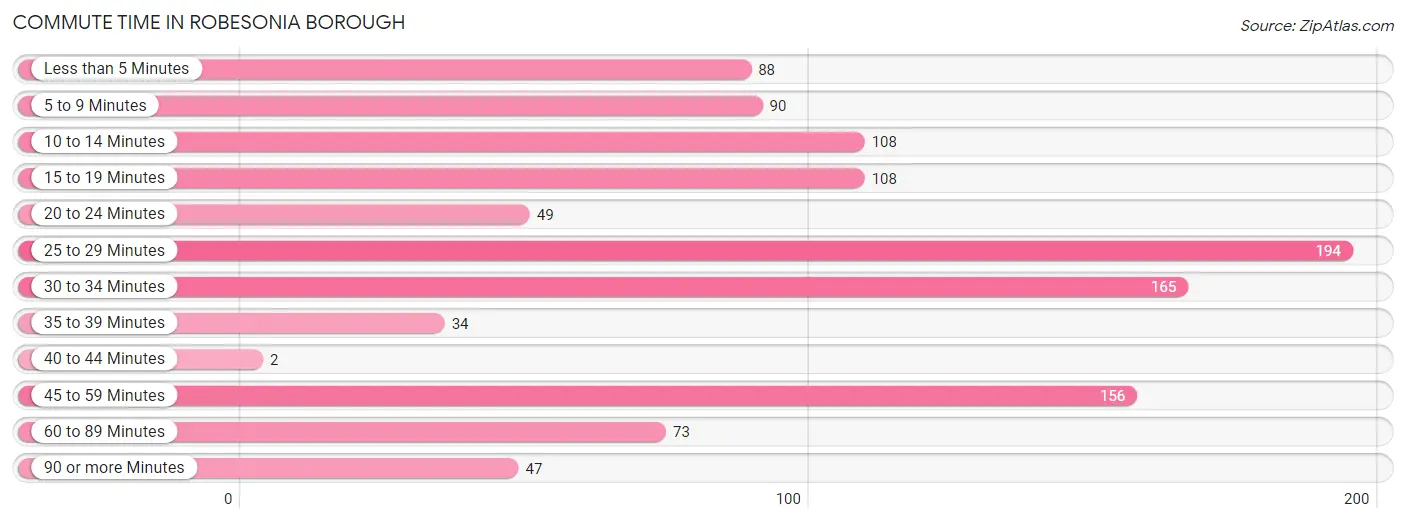
| Commute Time | # Commuters | % Commuters |
| Less than 5 Minutes | 88 | 7.9% |
| 5 to 9 Minutes | 90 | 8.1% |
| 10 to 14 Minutes | 108 | 9.7% |
| 15 to 19 Minutes | 108 | 9.7% |
| 20 to 24 Minutes | 49 | 4.4% |
| 25 to 29 Minutes | 194 | 17.4% |
| 30 to 34 Minutes | 165 | 14.8% |
| 35 to 39 Minutes | 34 | 3.0% |
| 40 to 44 Minutes | 2 | 0.2% |
| 45 to 59 Minutes | 156 | 14.0% |
| 60 to 89 Minutes | 73 | 6.6% |
| 90 or more Minutes | 47 | 4.2% |
Commute Time by Sex in Robesonia borough
The most common commute times in Robesonia borough are 10 to 14 minutes (81 commuters, 14.3%) for males and 25 to 29 minutes (124 commuters, 22.7%) for females.
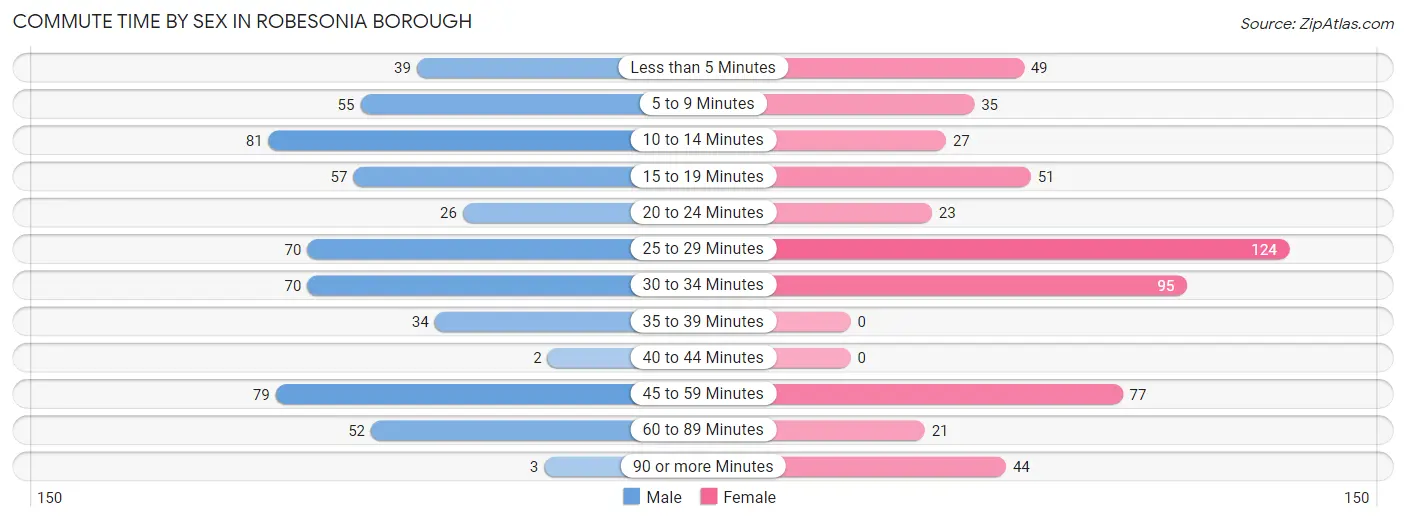
| Commute Time | Male | Female |
| Less than 5 Minutes | 39 (6.9%) | 49 (9.0%) |
| 5 to 9 Minutes | 55 (9.7%) | 35 (6.4%) |
| 10 to 14 Minutes | 81 (14.3%) | 27 (5.0%) |
| 15 to 19 Minutes | 57 (10.0%) | 51 (9.3%) |
| 20 to 24 Minutes | 26 (4.6%) | 23 (4.2%) |
| 25 to 29 Minutes | 70 (12.3%) | 124 (22.7%) |
| 30 to 34 Minutes | 70 (12.3%) | 95 (17.4%) |
| 35 to 39 Minutes | 34 (6.0%) | 0 (0.0%) |
| 40 to 44 Minutes | 2 (0.4%) | 0 (0.0%) |
| 45 to 59 Minutes | 79 (13.9%) | 77 (14.1%) |
| 60 to 89 Minutes | 52 (9.1%) | 21 (3.8%) |
| 90 or more Minutes | 3 (0.5%) | 44 (8.1%) |
Time of Departure to Work by Sex in Robesonia borough
The most frequent times of departure to work in Robesonia borough are 6:30 AM to 6:59 AM (85, 15.0%) for males and 6:30 AM to 6:59 AM (102, 18.7%) for females.
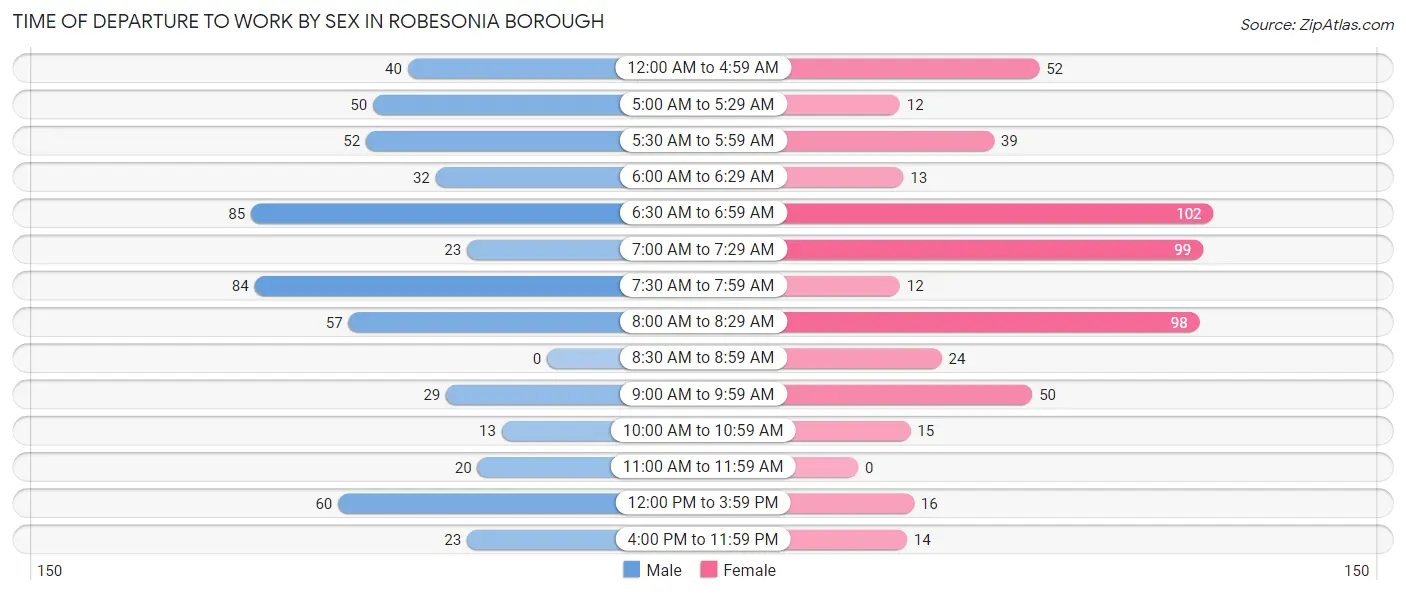
| Time of Departure | Male | Female |
| 12:00 AM to 4:59 AM | 40 (7.0%) | 52 (9.5%) |
| 5:00 AM to 5:29 AM | 50 (8.8%) | 12 (2.2%) |
| 5:30 AM to 5:59 AM | 52 (9.1%) | 39 (7.1%) |
| 6:00 AM to 6:29 AM | 32 (5.6%) | 13 (2.4%) |
| 6:30 AM to 6:59 AM | 85 (15.0%) | 102 (18.7%) |
| 7:00 AM to 7:29 AM | 23 (4.1%) | 99 (18.1%) |
| 7:30 AM to 7:59 AM | 84 (14.8%) | 12 (2.2%) |
| 8:00 AM to 8:29 AM | 57 (10.0%) | 98 (17.9%) |
| 8:30 AM to 8:59 AM | 0 (0.0%) | 24 (4.4%) |
| 9:00 AM to 9:59 AM | 29 (5.1%) | 50 (9.2%) |
| 10:00 AM to 10:59 AM | 13 (2.3%) | 15 (2.8%) |
| 11:00 AM to 11:59 AM | 20 (3.5%) | 0 (0.0%) |
| 12:00 PM to 3:59 PM | 60 (10.6%) | 16 (2.9%) |
| 4:00 PM to 11:59 PM | 23 (4.1%) | 14 (2.6%) |
| Total | 568 (100.0%) | 546 (100.0%) |
Housing Occupancy in Robesonia borough
Occupancy by Ownership in Robesonia borough
Of the total 862 dwellings in Robesonia borough, owner-occupied units account for 663 (76.9%), while renter-occupied units make up 199 (23.1%).
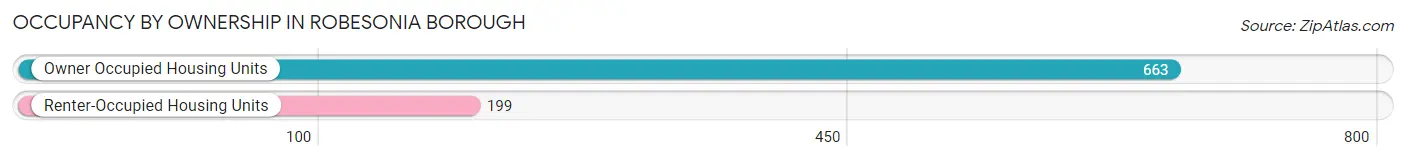
| Occupancy | # Housing Units | % Housing Units |
| Owner Occupied Housing Units | 663 | 76.9% |
| Renter-Occupied Housing Units | 199 | 23.1% |
| Total Occupied Housing Units | 862 | 100.0% |
Occupancy by Household Size in Robesonia borough
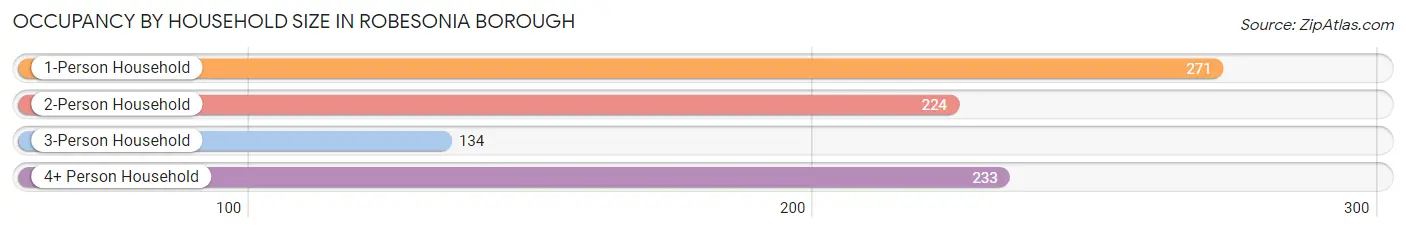
| Household Size | # Housing Units | % Housing Units |
| 1-Person Household | 271 | 31.4% |
| 2-Person Household | 224 | 26.0% |
| 3-Person Household | 134 | 15.5% |
| 4+ Person Household | 233 | 27.0% |
| Total Housing Units | 862 | 100.0% |
Occupancy by Ownership by Household Size in Robesonia borough
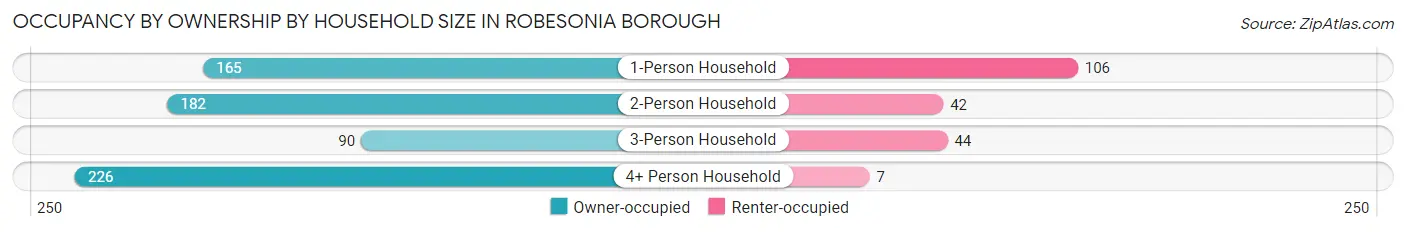
| Household Size | Owner-occupied | Renter-occupied |
| 1-Person Household | 165 (60.9%) | 106 (39.1%) |
| 2-Person Household | 182 (81.2%) | 42 (18.8%) |
| 3-Person Household | 90 (67.2%) | 44 (32.8%) |
| 4+ Person Household | 226 (97.0%) | 7 (3.0%) |
| Total Housing Units | 663 (76.9%) | 199 (23.1%) |
Occupancy by Educational Attainment in Robesonia borough
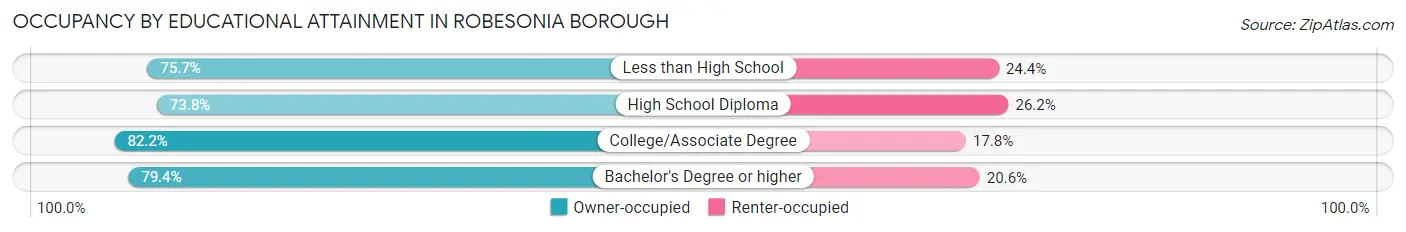
| Household Size | Owner-occupied | Renter-occupied |
| Less than High School | 87 (75.6%) | 28 (24.3%) |
| High School Diploma | 298 (73.8%) | 106 (26.2%) |
| College/Associate Degree | 166 (82.2%) | 36 (17.8%) |
| Bachelor's Degree or higher | 112 (79.4%) | 29 (20.6%) |
Occupancy by Age of Householder in Robesonia borough
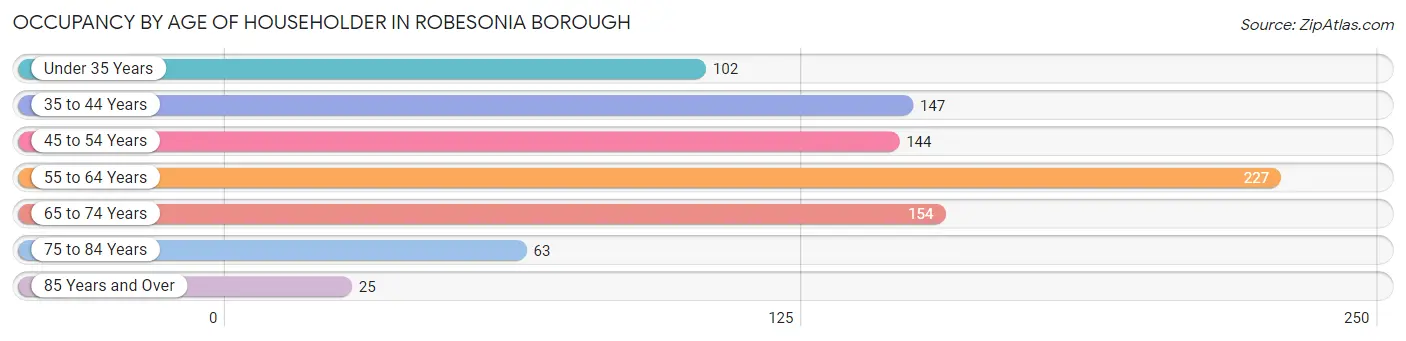
| Age Bracket | # Households | % Households |
| Under 35 Years | 102 | 11.8% |
| 35 to 44 Years | 147 | 17.1% |
| 45 to 54 Years | 144 | 16.7% |
| 55 to 64 Years | 227 | 26.3% |
| 65 to 74 Years | 154 | 17.9% |
| 75 to 84 Years | 63 | 7.3% |
| 85 Years and Over | 25 | 2.9% |
| Total | 862 | 100.0% |
Housing Finances in Robesonia borough
Median Income by Occupancy in Robesonia borough
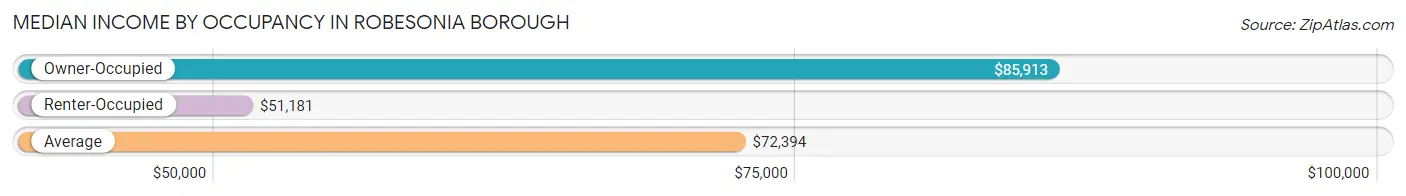
| Occupancy Type | # Households | Median Income |
| Owner-Occupied | 663 (76.9%) | $85,913 |
| Renter-Occupied | 199 (23.1%) | $51,181 |
| Average | 862 (100.0%) | $72,394 |
Occupancy by Householder Income Bracket in Robesonia borough
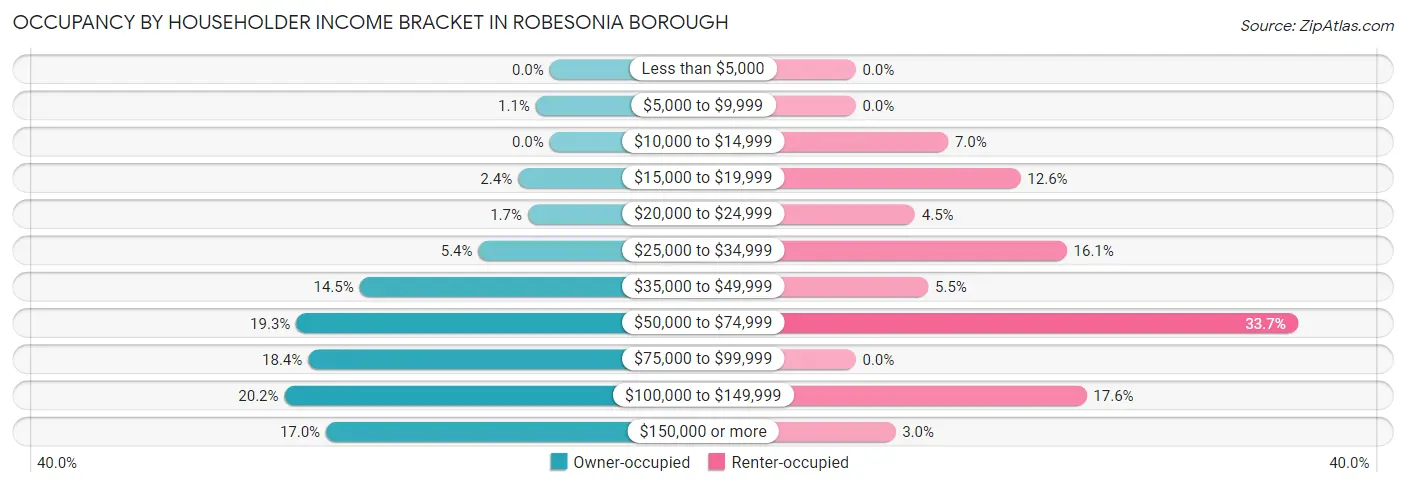
| Income Bracket | Owner-occupied | Renter-occupied |
| Less than $5,000 | 0 (0.0%) | 0 (0.0%) |
| $5,000 to $9,999 | 7 (1.1%) | 0 (0.0%) |
| $10,000 to $14,999 | 0 (0.0%) | 14 (7.0%) |
| $15,000 to $19,999 | 16 (2.4%) | 25 (12.6%) |
| $20,000 to $24,999 | 11 (1.7%) | 9 (4.5%) |
| $25,000 to $34,999 | 36 (5.4%) | 32 (16.1%) |
| $35,000 to $49,999 | 96 (14.5%) | 11 (5.5%) |
| $50,000 to $74,999 | 128 (19.3%) | 67 (33.7%) |
| $75,000 to $99,999 | 122 (18.4%) | 0 (0.0%) |
| $100,000 to $149,999 | 134 (20.2%) | 35 (17.6%) |
| $150,000 or more | 113 (17.0%) | 6 (3.0%) |
| Total | 663 (100.0%) | 199 (100.0%) |
Monthly Housing Cost Tiers in Robesonia borough
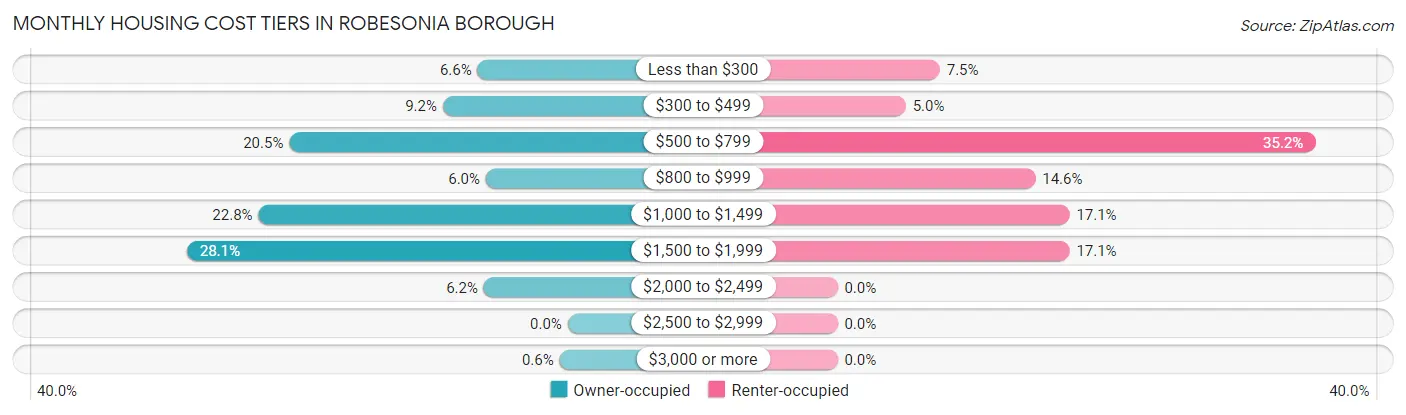
| Monthly Cost | Owner-occupied | Renter-occupied |
| Less than $300 | 44 (6.6%) | 15 (7.5%) |
| $300 to $499 | 61 (9.2%) | 10 (5.0%) |
| $500 to $799 | 136 (20.5%) | 70 (35.2%) |
| $800 to $999 | 40 (6.0%) | 29 (14.6%) |
| $1,000 to $1,499 | 151 (22.8%) | 34 (17.1%) |
| $1,500 to $1,999 | 186 (28.1%) | 34 (17.1%) |
| $2,000 to $2,499 | 41 (6.2%) | 0 (0.0%) |
| $2,500 to $2,999 | 0 (0.0%) | 0 (0.0%) |
| $3,000 or more | 4 (0.6%) | 0 (0.0%) |
| Total | 663 (100.0%) | 199 (100.0%) |
Physical Housing Characteristics in Robesonia borough
Housing Structures in Robesonia borough
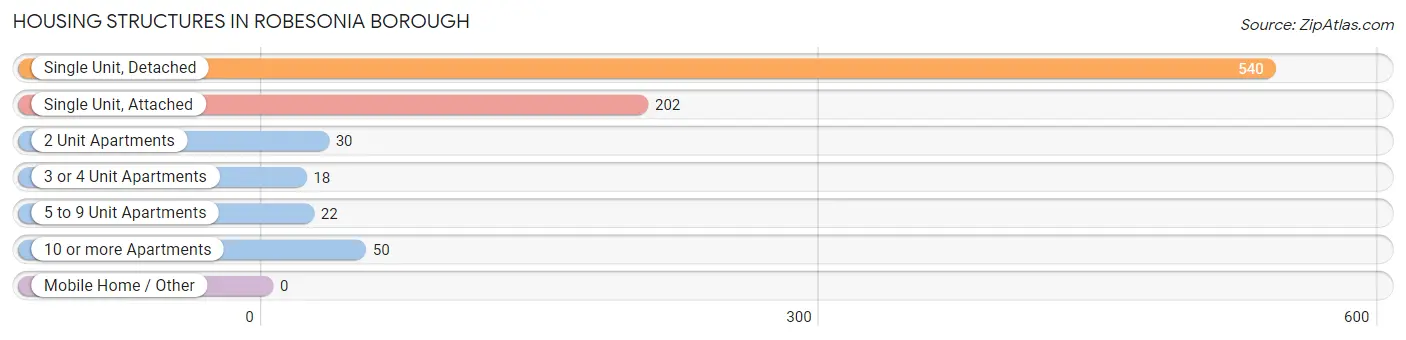
| Structure Type | # Housing Units | % Housing Units |
| Single Unit, Detached | 540 | 62.6% |
| Single Unit, Attached | 202 | 23.4% |
| 2 Unit Apartments | 30 | 3.5% |
| 3 or 4 Unit Apartments | 18 | 2.1% |
| 5 to 9 Unit Apartments | 22 | 2.5% |
| 10 or more Apartments | 50 | 5.8% |
| Mobile Home / Other | 0 | 0.0% |
| Total | 862 | 100.0% |
Housing Structures by Occupancy in Robesonia borough
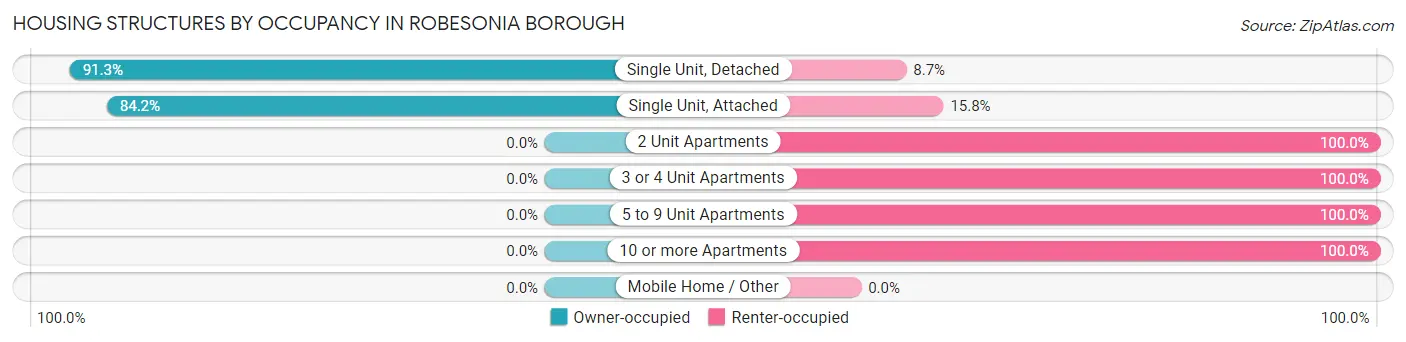
| Structure Type | Owner-occupied | Renter-occupied |
| Single Unit, Detached | 493 (91.3%) | 47 (8.7%) |
| Single Unit, Attached | 170 (84.2%) | 32 (15.8%) |
| 2 Unit Apartments | 0 (0.0%) | 30 (100.0%) |
| 3 or 4 Unit Apartments | 0 (0.0%) | 18 (100.0%) |
| 5 to 9 Unit Apartments | 0 (0.0%) | 22 (100.0%) |
| 10 or more Apartments | 0 (0.0%) | 50 (100.0%) |
| Mobile Home / Other | 0 (0.0%) | 0 (0.0%) |
| Total | 663 (76.9%) | 199 (23.1%) |
Housing Structures by Number of Rooms in Robesonia borough
| Number of Rooms | Owner-occupied | Renter-occupied |
| 1 Room | 0 (0.0%) | 0 (0.0%) |
| 2 or 3 Rooms | 1 (0.2%) | 58 (29.1%) |
| 4 or 5 Rooms | 166 (25.0%) | 94 (47.2%) |
| 6 or 7 Rooms | 334 (50.4%) | 40 (20.1%) |
| 8 or more Rooms | 162 (24.4%) | 7 (3.5%) |
| Total | 663 (100.0%) | 199 (100.0%) |
Housing Structure by Heating Type in Robesonia borough
| Heating Type | Owner-occupied | Renter-occupied |
| Utility Gas | 204 (30.8%) | 88 (44.2%) |
| Bottled, Tank, or LP Gas | 15 (2.3%) | 7 (3.5%) |
| Electricity | 258 (38.9%) | 50 (25.1%) |
| Fuel Oil or Kerosene | 162 (24.4%) | 54 (27.1%) |
| Coal or Coke | 5 (0.7%) | 0 (0.0%) |
| All other Fuels | 19 (2.9%) | 0 (0.0%) |
| No Fuel Used | 0 (0.0%) | 0 (0.0%) |
| Total | 663 (100.0%) | 199 (100.0%) |
Household Vehicle Usage in Robesonia borough
| Vehicles per Household | Owner-occupied | Renter-occupied |
| No Vehicle | 24 (3.6%) | 19 (9.6%) |
| 1 Vehicle | 159 (24.0%) | 130 (65.3%) |
| 2 Vehicles | 272 (41.0%) | 41 (20.6%) |
| 3 or more Vehicles | 208 (31.4%) | 9 (4.5%) |
| Total | 663 (100.0%) | 199 (100.0%) |
Real Estate & Mortgages in Robesonia borough
Real Estate and Mortgage Overview in Robesonia borough
| Characteristic | Without Mortgage | With Mortgage |
| Housing Units | 252 | 411 |
| Median Property Value | $185,700 | $201,600 |
| Median Household Income | $85,208 | $59 |
| Monthly Housing Costs | $544 | $4 |
| Real Estate Taxes | $3,429 | $0 |
Property Value by Mortgage Status in Robesonia borough
| Property Value | Without Mortgage | With Mortgage |
| Less than $50,000 | 4 (1.6%) | 1 (0.2%) |
| $50,000 to $99,999 | 49 (19.4%) | 16 (3.9%) |
| $100,000 to $299,999 | 175 (69.4%) | 347 (84.4%) |
| $300,000 to $499,999 | 24 (9.5%) | 22 (5.3%) |
| $500,000 to $749,999 | 0 (0.0%) | 16 (3.9%) |
| $750,000 to $999,999 | 0 (0.0%) | 0 (0.0%) |
| $1,000,000 or more | 0 (0.0%) | 9 (2.2%) |
| Total | 252 (100.0%) | 411 (100.0%) |
Household Income by Mortgage Status in Robesonia borough
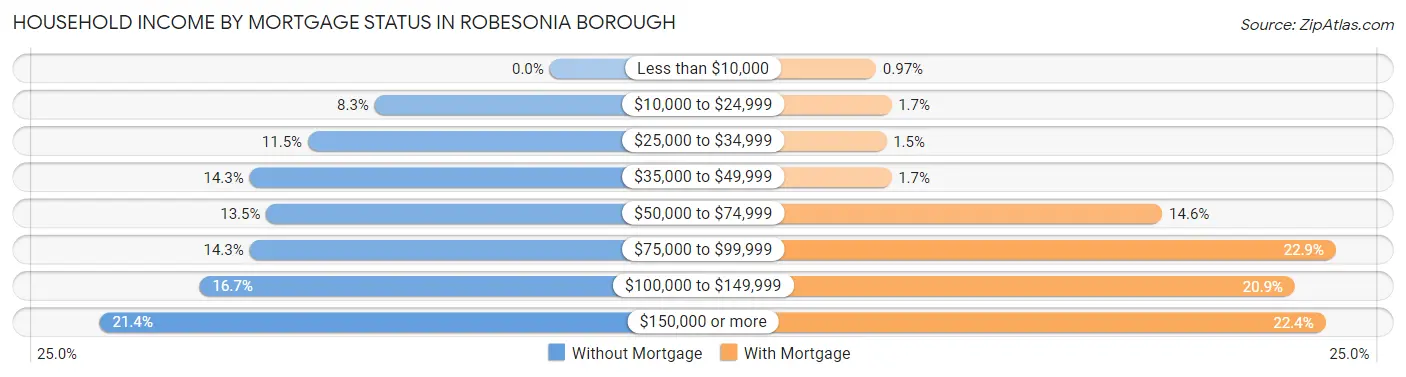
| Household Income | Without Mortgage | With Mortgage |
| Less than $10,000 | 0 (0.0%) | 4 (1.0%) |
| $10,000 to $24,999 | 21 (8.3%) | 7 (1.7%) |
| $25,000 to $34,999 | 29 (11.5%) | 6 (1.5%) |
| $35,000 to $49,999 | 36 (14.3%) | 7 (1.7%) |
| $50,000 to $74,999 | 34 (13.5%) | 60 (14.6%) |
| $75,000 to $99,999 | 36 (14.3%) | 94 (22.9%) |
| $100,000 to $149,999 | 42 (16.7%) | 86 (20.9%) |
| $150,000 or more | 54 (21.4%) | 92 (22.4%) |
| Total | 252 (100.0%) | 411 (100.0%) |
Property Value to Household Income Ratio in Robesonia borough
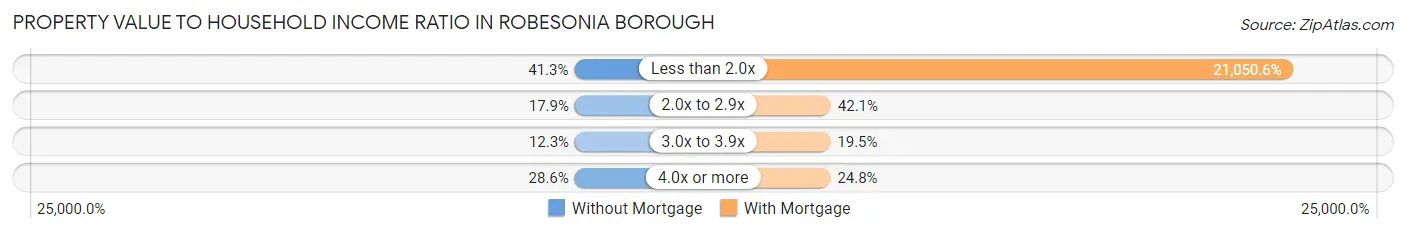
| Value-to-Income Ratio | Without Mortgage | With Mortgage |
| Less than 2.0x | 104 (41.3%) | 86,518 (21,050.6%) |
| 2.0x to 2.9x | 45 (17.9%) | 173 (42.1%) |
| 3.0x to 3.9x | 31 (12.3%) | 80 (19.5%) |
| 4.0x or more | 72 (28.6%) | 102 (24.8%) |
| Total | 252 (100.0%) | 411 (100.0%) |
Real Estate Taxes by Mortgage Status in Robesonia borough
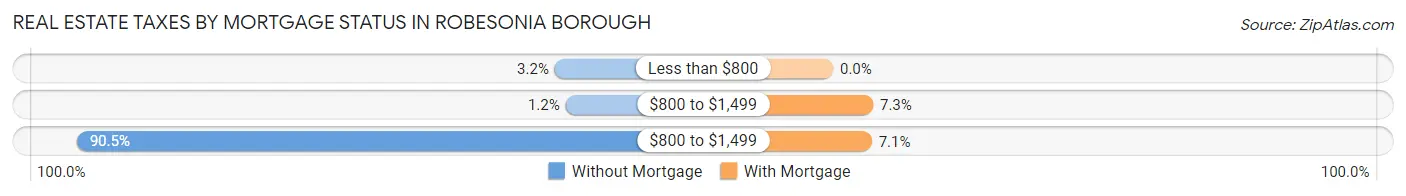
| Property Taxes | Without Mortgage | With Mortgage |
| Less than $800 | 8 (3.2%) | 0 (0.0%) |
| $800 to $1,499 | 3 (1.2%) | 30 (7.3%) |
| $800 to $1,499 | 228 (90.5%) | 29 (7.1%) |
| Total | 252 (100.0%) | 411 (100.0%) |
Health & Disability in Robesonia borough
Health Insurance Coverage by Age in Robesonia borough
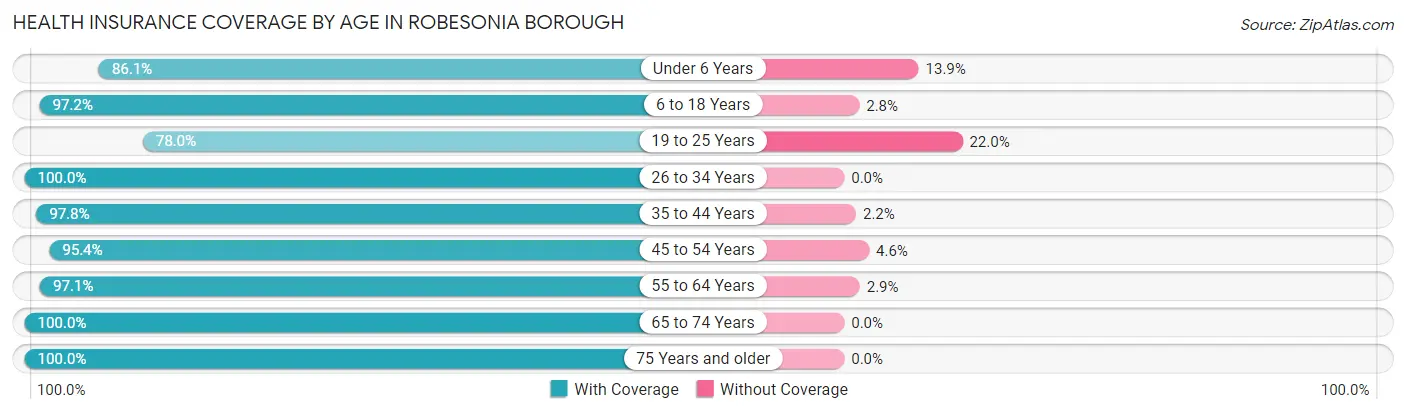
| Age Bracket | With Coverage | Without Coverage |
| Under 6 Years | 143 (86.1%) | 23 (13.9%) |
| 6 to 18 Years | 243 (97.2%) | 7 (2.8%) |
| 19 to 25 Years | 191 (78.0%) | 54 (22.0%) |
| 26 to 34 Years | 210 (100.0%) | 0 (0.0%) |
| 35 to 44 Years | 268 (97.8%) | 6 (2.2%) |
| 45 to 54 Years | 248 (95.4%) | 12 (4.6%) |
| 55 to 64 Years | 369 (97.1%) | 11 (2.9%) |
| 65 to 74 Years | 218 (100.0%) | 0 (0.0%) |
| 75 Years and older | 146 (100.0%) | 0 (0.0%) |
| Total | 2,036 (94.7%) | 113 (5.3%) |
Health Insurance Coverage by Citizenship Status in Robesonia borough
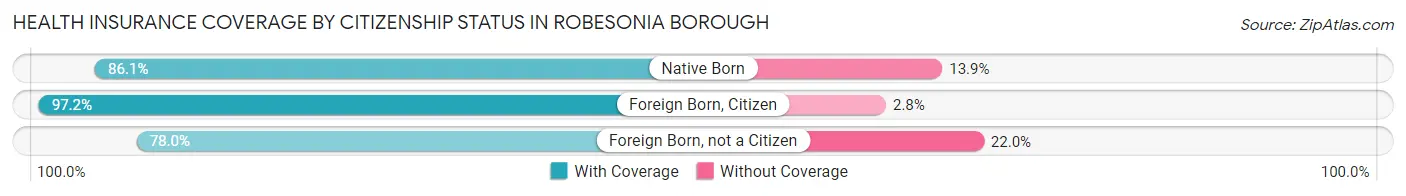
| Citizenship Status | With Coverage | Without Coverage |
| Native Born | 143 (86.1%) | 23 (13.9%) |
| Foreign Born, Citizen | 243 (97.2%) | 7 (2.8%) |
| Foreign Born, not a Citizen | 191 (78.0%) | 54 (22.0%) |
Health Insurance Coverage by Household Income in Robesonia borough
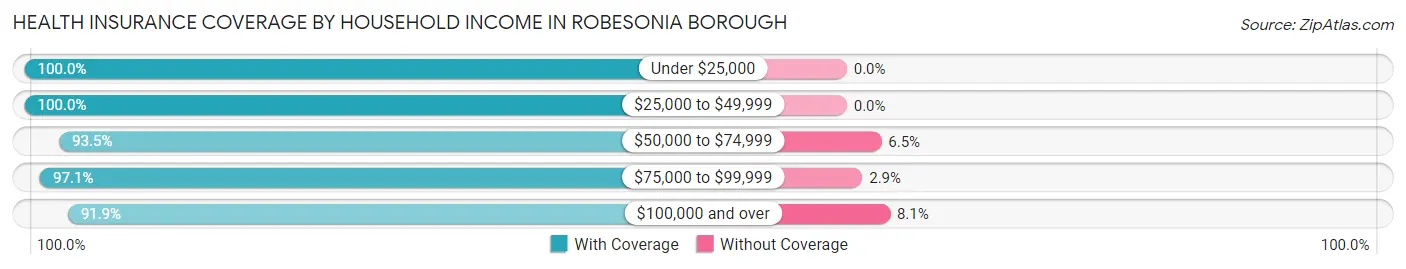
| Household Income | With Coverage | Without Coverage |
| Under $25,000 | 95 (100.0%) | 0 (0.0%) |
| $25,000 to $49,999 | 362 (100.0%) | 0 (0.0%) |
| $50,000 to $74,999 | 448 (93.5%) | 31 (6.5%) |
| $75,000 to $99,999 | 301 (97.1%) | 9 (2.9%) |
| $100,000 and over | 830 (91.9%) | 73 (8.1%) |
Public vs Private Health Insurance Coverage by Age in Robesonia borough
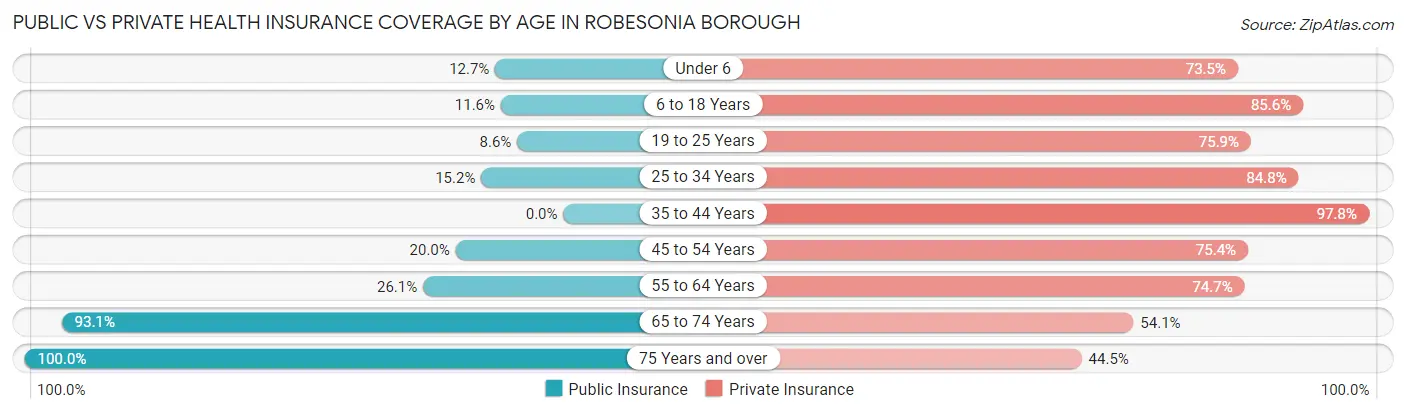
| Age Bracket | Public Insurance | Private Insurance |
| Under 6 | 21 (12.7%) | 122 (73.5%) |
| 6 to 18 Years | 29 (11.6%) | 214 (85.6%) |
| 19 to 25 Years | 21 (8.6%) | 186 (75.9%) |
| 25 to 34 Years | 32 (15.2%) | 178 (84.8%) |
| 35 to 44 Years | 0 (0.0%) | 268 (97.8%) |
| 45 to 54 Years | 52 (20.0%) | 196 (75.4%) |
| 55 to 64 Years | 99 (26.1%) | 284 (74.7%) |
| 65 to 74 Years | 203 (93.1%) | 118 (54.1%) |
| 75 Years and over | 146 (100.0%) | 65 (44.5%) |
| Total | 603 (28.1%) | 1,631 (75.9%) |
Disability Status by Sex by Age in Robesonia borough
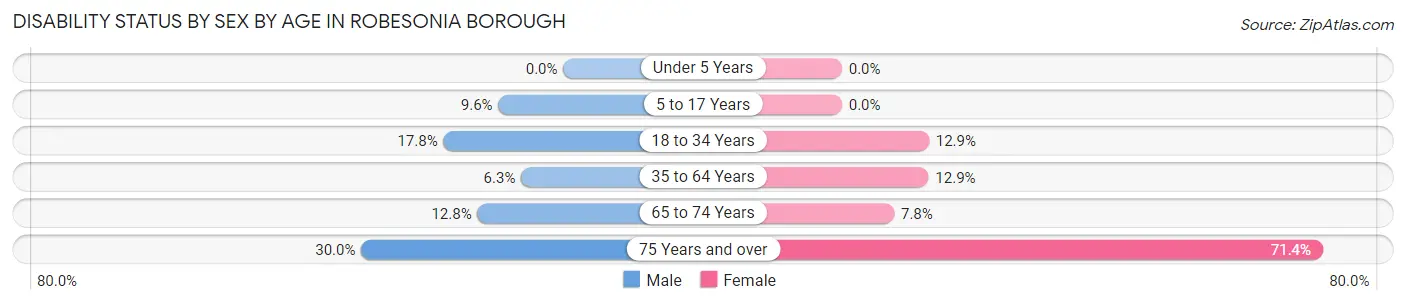
| Age Bracket | Male | Female |
| Under 5 Years | 0 (0.0%) | 0 (0.0%) |
| 5 to 17 Years | 16 (9.6%) | 0 (0.0%) |
| 18 to 34 Years | 42 (17.8%) | 31 (12.9%) |
| 35 to 64 Years | 27 (6.2%) | 62 (12.9%) |
| 65 to 74 Years | 13 (12.8%) | 9 (7.8%) |
| 75 Years and over | 6 (30.0%) | 90 (71.4%) |
Disability Class by Sex by Age in Robesonia borough
Disability Class: Hearing Difficulty
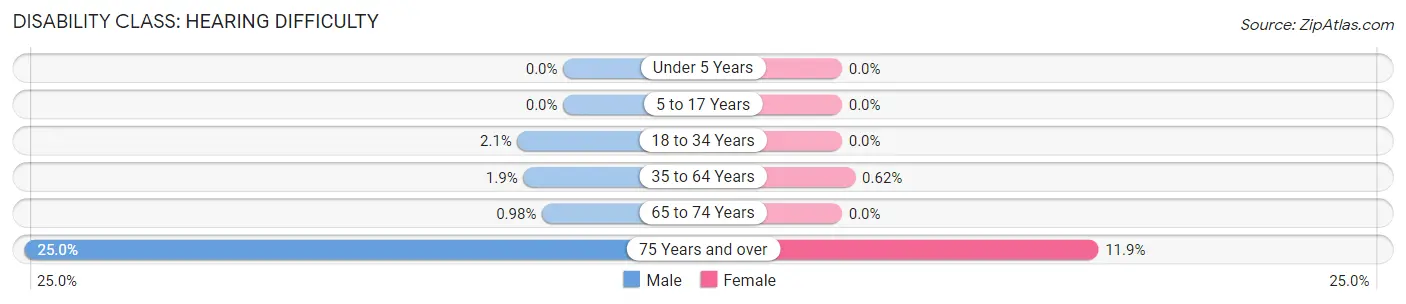
| Age Bracket | Male | Female |
| Under 5 Years | 0 (0.0%) | 0 (0.0%) |
| 5 to 17 Years | 0 (0.0%) | 0 (0.0%) |
| 18 to 34 Years | 5 (2.1%) | 0 (0.0%) |
| 35 to 64 Years | 8 (1.8%) | 3 (0.6%) |
| 65 to 74 Years | 1 (1.0%) | 0 (0.0%) |
| 75 Years and over | 5 (25.0%) | 15 (11.9%) |
Disability Class: Vision Difficulty
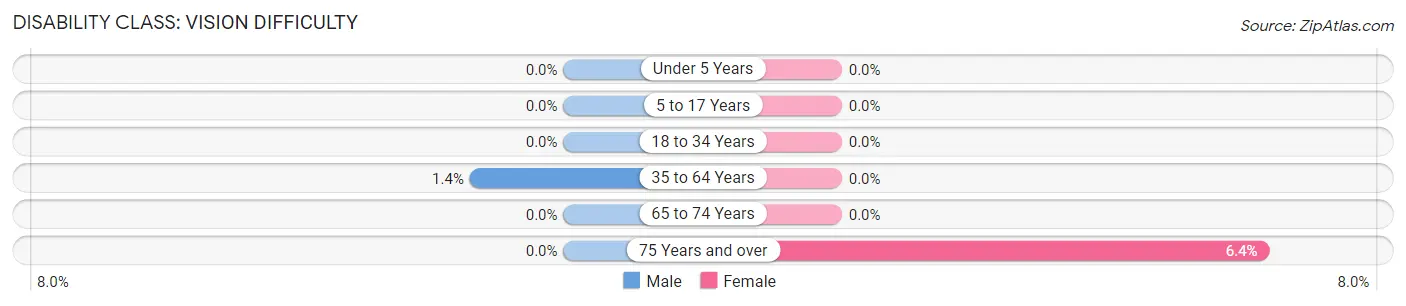
| Age Bracket | Male | Female |
| Under 5 Years | 0 (0.0%) | 0 (0.0%) |
| 5 to 17 Years | 0 (0.0%) | 0 (0.0%) |
| 18 to 34 Years | 0 (0.0%) | 0 (0.0%) |
| 35 to 64 Years | 6 (1.4%) | 0 (0.0%) |
| 65 to 74 Years | 0 (0.0%) | 0 (0.0%) |
| 75 Years and over | 0 (0.0%) | 8 (6.4%) |
Disability Class: Cognitive Difficulty
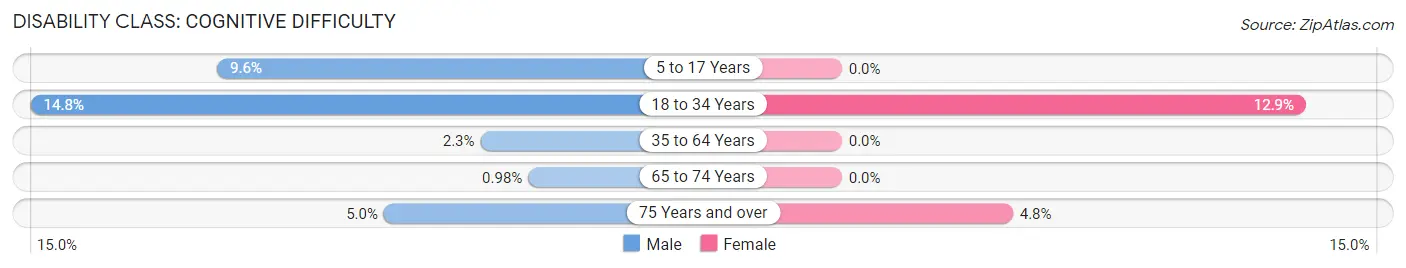
| Age Bracket | Male | Female |
| 5 to 17 Years | 16 (9.6%) | 0 (0.0%) |
| 18 to 34 Years | 35 (14.8%) | 31 (12.9%) |
| 35 to 64 Years | 10 (2.3%) | 0 (0.0%) |
| 65 to 74 Years | 1 (1.0%) | 0 (0.0%) |
| 75 Years and over | 1 (5.0%) | 6 (4.8%) |
Disability Class: Ambulatory Difficulty
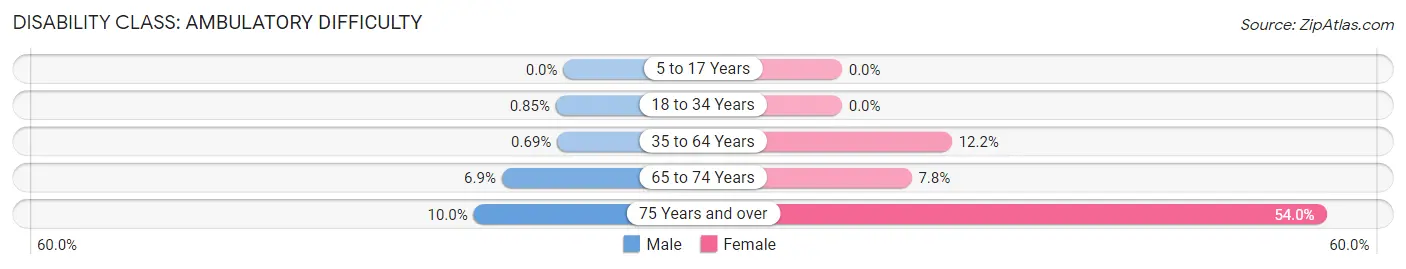
| Age Bracket | Male | Female |
| 5 to 17 Years | 0 (0.0%) | 0 (0.0%) |
| 18 to 34 Years | 2 (0.9%) | 0 (0.0%) |
| 35 to 64 Years | 3 (0.7%) | 59 (12.2%) |
| 65 to 74 Years | 7 (6.9%) | 9 (7.8%) |
| 75 Years and over | 2 (10.0%) | 68 (54.0%) |
Disability Class: Self-Care Difficulty
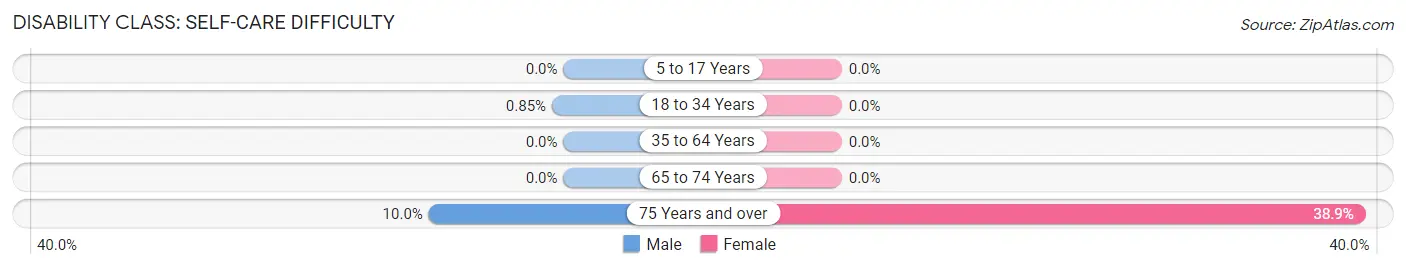
| Age Bracket | Male | Female |
| 5 to 17 Years | 0 (0.0%) | 0 (0.0%) |
| 18 to 34 Years | 2 (0.9%) | 0 (0.0%) |
| 35 to 64 Years | 0 (0.0%) | 0 (0.0%) |
| 65 to 74 Years | 0 (0.0%) | 0 (0.0%) |
| 75 Years and over | 2 (10.0%) | 49 (38.9%) |
Technology Access in Robesonia borough
Computing Device Access in Robesonia borough
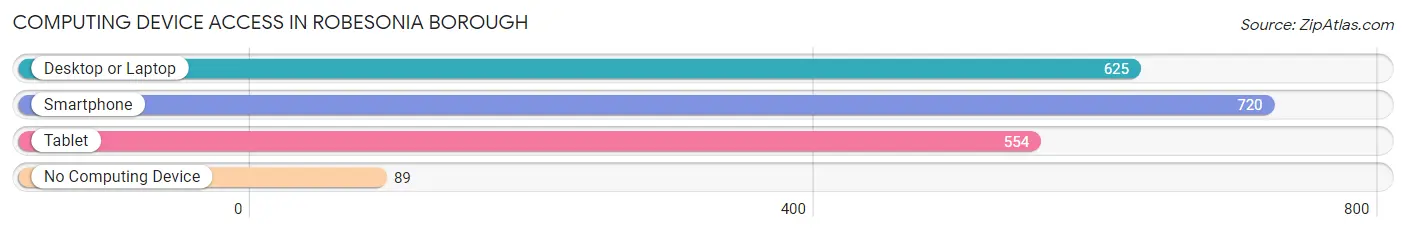
| Device Type | # Households | % Households |
| Desktop or Laptop | 625 | 72.5% |
| Smartphone | 720 | 83.5% |
| Tablet | 554 | 64.3% |
| No Computing Device | 89 | 10.3% |
| Total | 862 | 100.0% |
Internet Access in Robesonia borough
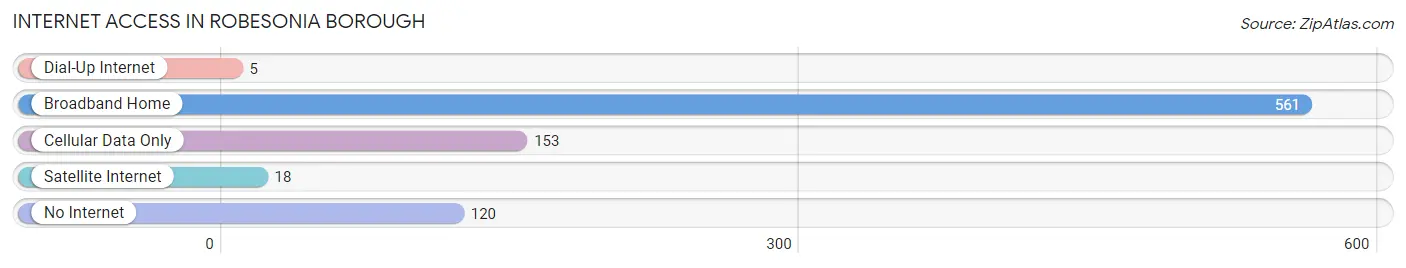
| Internet Type | # Households | % Households |
| Dial-Up Internet | 5 | 0.6% |
| Broadband Home | 561 | 65.1% |
| Cellular Data Only | 153 | 17.7% |
| Satellite Internet | 18 | 2.1% |
| No Internet | 120 | 13.9% |
| Total | 862 | 100.0% |
Robesonia borough Summary
Robesonia Borough is a small borough located in Berks County, Pennsylvania. It is situated in the southeastern corner of the county, approximately 10 miles northwest of Reading. The borough is home to a population of 1,845 people, according to the 2010 census.
History
Robesonia was founded in 1845 by a group of German immigrants who had settled in the area. The town was named after the Robeson family, who were among the first settlers. The Robesons were farmers and millers, and the town was built around their mill. The mill was the center of the town’s economy for many years, and it was the first industry in the area.
In the late 19th century, Robesonia became a popular tourist destination. The town was known for its mineral springs, which were believed to have healing properties. The mineral springs attracted visitors from all over the country, and the town became a popular summer resort.
In the early 20th century, Robesonia began to industrialize. The town was home to several factories, including a silk mill, a paper mill, and a shoe factory. These industries provided employment for many of the town’s residents.
Geography
Robesonia is located in southeastern Berks County, approximately 10 miles northwest of Reading. The borough is situated in the Schuylkill River Valley, and is surrounded by rolling hills and farmland. The borough is located at an elevation of 463 feet above sea level.
The climate in Robesonia is humid continental, with hot summers and cold winters. The average annual temperature is 52 degrees Fahrenheit, and the average annual precipitation is 41 inches.
Economy
Robesonia’s economy is largely based on agriculture and manufacturing. The town is home to several farms, which produce a variety of crops, including corn, soybeans, and hay. The town is also home to several factories, including a paper mill, a shoe factory, and a silk mill.
The town is also home to several small businesses, including restaurants, shops, and services. The town is served by several major highways, including Interstate 78 and U.S. Route 422.
Demographics
According to the 2010 census, Robesonia has a population of 1,845 people. The population is predominantly white (94.3%), with small percentages of African American (2.2%), Asian (1.2%), and Hispanic (1.2%) residents. The median household income is $50,938, and the median home value is $179,400.
Conclusion
Robesonia Borough is a small borough located in Berks County, Pennsylvania. It is situated in the southeastern corner of the county, approximately 10 miles northwest of Reading. The borough is home to a population of 1,845 people, according to the 2010 census. The town’s economy is largely based on agriculture and manufacturing, and it is served by several major highways. The population is predominantly white, with small percentages of African American, Asian, and Hispanic residents.
Common Questions
What is Per Capita Income in Robesonia borough?
Per Capita income in Robesonia borough is $36,993.
What is the Median Family Income in Robesonia borough?
Median Family Income in Robesonia borough is $91,800.
What is the Median Household income in Robesonia borough?
Median Household Income in Robesonia borough is $72,394.
What is Income or Wage Gap in Robesonia borough?
Income or Wage Gap in Robesonia borough is 6.1%.
Women in Robesonia borough earn 93.9 cents for every dollar earned by a man.
What is Inequality or Gini Index in Robesonia borough?
Inequality or Gini Index in Robesonia borough is 0.36.
What is the Total Population of Robesonia borough?
Total Population of Robesonia borough is 2,149.
What is the Total Male Population of Robesonia borough?
Total Male Population of Robesonia borough is 1,040.
What is the Total Female Population of Robesonia borough?
Total Female Population of Robesonia borough is 1,109.
What is the Ratio of Males per 100 Females in Robesonia borough?
There are 93.78 Males per 100 Females in Robesonia borough.
What is the Ratio of Females per 100 Males in Robesonia borough?
There are 106.63 Females per 100 Males in Robesonia borough.
What is the Median Population Age in Robesonia borough?
Median Population Age in Robesonia borough is 41.9 Years.
What is the Average Family Size in Robesonia borough
Average Family Size in Robesonia borough is 3.1 People.
What is the Average Household Size in Robesonia borough
Average Household Size in Robesonia borough is 2.5 People.
How Large is the Labor Force in Robesonia borough?
There are 1,206 People in the Labor Forcein in Robesonia borough.
What is the Percentage of People in the Labor Force in Robesonia borough?
67.9% of People are in the Labor Force in Robesonia borough.
What is the Unemployment Rate in Robesonia borough?
Unemployment Rate in Robesonia borough is 2.5%.