Saegertown borough, PA Map & Demographics
Saegertown borough Overview
$27,069
PER CAPITA INCOME
$75,795
AVG FAMILY INCOME
$70,250
AVG HOUSEHOLD INCOME
0.2%
WAGE / INCOME GAP [ % ]
99.8¢/ $1
WAGE / INCOME GAP [ $ ]
0.36
INEQUALITY / GINI INDEX
967
TOTAL POPULATION
550
MALE POPULATION
417
FEMALE POPULATION
131.89
MALES / 100 FEMALES
75.82
FEMALES / 100 MALES
36.0
MEDIAN AGE
2.7
AVG FAMILY SIZE
2.2
AVG HOUSEHOLD SIZE
433
LABOR FORCE [ PEOPLE ]
53.6%
PERCENT IN LABOR FORCE
0.9%
UNEMPLOYMENT RATE
Income in Saegertown borough
Income Overview in Saegertown borough
Per Capita Income in Saegertown borough is $27,069, while median incomes of families and households are $75,795 and $70,250 respectively.
| Characteristic | Number | Measure |
| Per Capita Income | 967 | $27,069 |
| Median Family Income | 211 | $75,795 |
| Mean Family Income | 211 | $86,097 |
| Median Household Income | 331 | $70,250 |
| Mean Household Income | 331 | $76,808 |
| Income Deficit | 211 | $0 |
| Wage / Income Gap (%) | 967 | 0.25% |
| Wage / Income Gap ($) | 967 | 99.75¢ per $1 |
| Gini / Inequality Index | 967 | 0.36 |
Earnings by Sex in Saegertown borough
Average Earnings in Saegertown borough are $35,694, $35,625 for men and $35,714 for women, a difference of 0.3%.
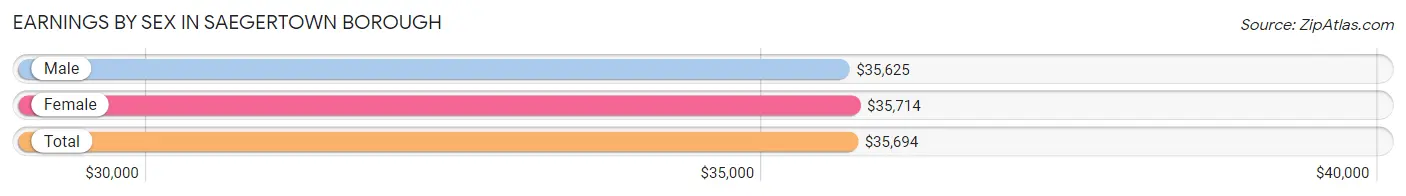
| Sex | Number | Average Earnings |
| Male | 277 (51.4%) | $35,625 |
| Female | 262 (48.6%) | $35,714 |
| Total | 539 (100.0%) | $35,694 |
Earnings by Sex by Income Bracket in Saegertown borough
The most common earnings brackets in Saegertown borough are $22,500 to $24,999 for men (27 | 9.8%) and $35,000 to $39,999 for women (44 | 16.8%).
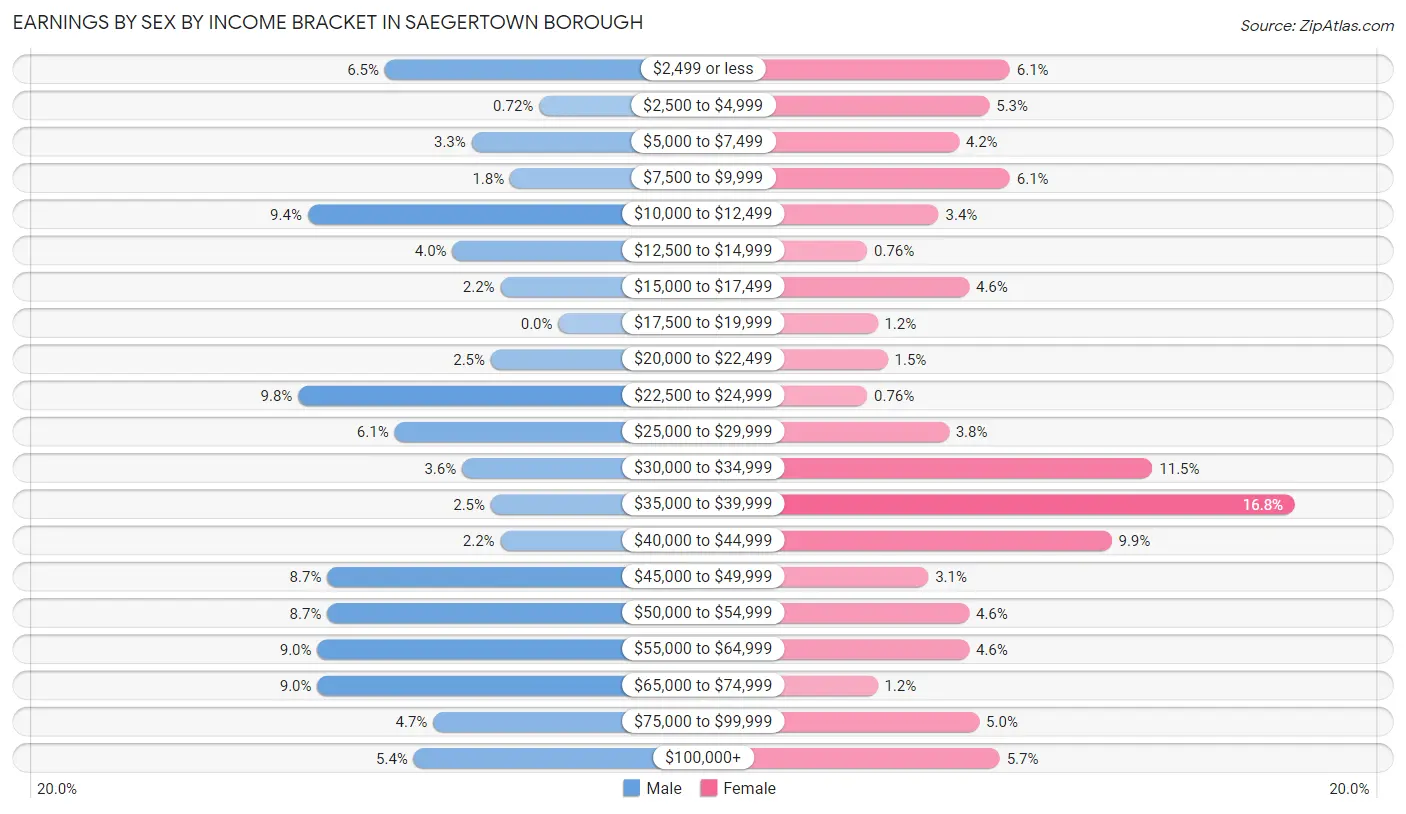
| Income | Male | Female |
| $2,499 or less | 18 (6.5%) | 16 (6.1%) |
| $2,500 to $4,999 | 2 (0.7%) | 14 (5.3%) |
| $5,000 to $7,499 | 9 (3.3%) | 11 (4.2%) |
| $7,500 to $9,999 | 5 (1.8%) | 16 (6.1%) |
| $10,000 to $12,499 | 26 (9.4%) | 9 (3.4%) |
| $12,500 to $14,999 | 11 (4.0%) | 2 (0.8%) |
| $15,000 to $17,499 | 6 (2.2%) | 12 (4.6%) |
| $17,500 to $19,999 | 0 (0.0%) | 3 (1.1%) |
| $20,000 to $22,499 | 7 (2.5%) | 4 (1.5%) |
| $22,500 to $24,999 | 27 (9.8%) | 2 (0.8%) |
| $25,000 to $29,999 | 17 (6.1%) | 10 (3.8%) |
| $30,000 to $34,999 | 10 (3.6%) | 30 (11.5%) |
| $35,000 to $39,999 | 7 (2.5%) | 44 (16.8%) |
| $40,000 to $44,999 | 6 (2.2%) | 26 (9.9%) |
| $45,000 to $49,999 | 24 (8.7%) | 8 (3.0%) |
| $50,000 to $54,999 | 24 (8.7%) | 12 (4.6%) |
| $55,000 to $64,999 | 25 (9.0%) | 12 (4.6%) |
| $65,000 to $74,999 | 25 (9.0%) | 3 (1.1%) |
| $75,000 to $99,999 | 13 (4.7%) | 13 (5.0%) |
| $100,000+ | 15 (5.4%) | 15 (5.7%) |
| Total | 277 (100.0%) | 262 (100.0%) |
Earnings by Sex by Educational Attainment in Saegertown borough
Average earnings in Saegertown borough are $45,179 for men and $37,804 for women, a difference of 16.3%. Men with an educational attainment of bachelor's degree enjoy the highest average annual earnings of $50,208, while those with less than high school education earn the least with $20,625. Women with an educational attainment of bachelor's degree earn the most with the average annual earnings of $38,750, while those with high school diploma education have the smallest earnings of $34,125.
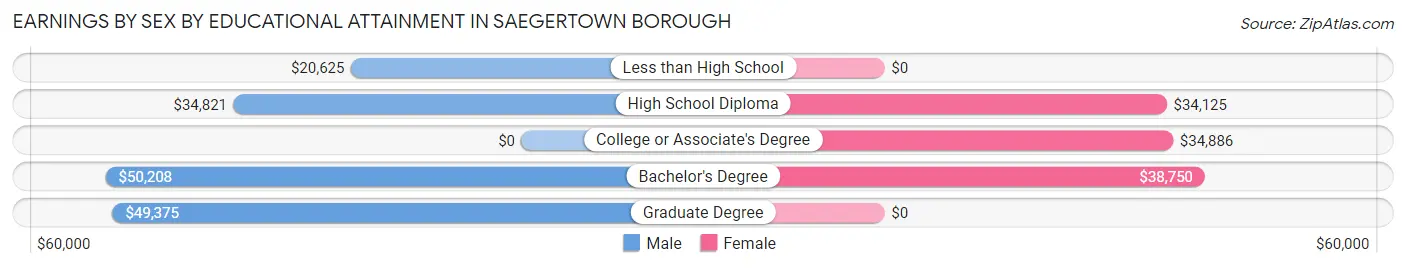
| Educational Attainment | Male Income | Female Income |
| Less than High School | $20,625 | $0 |
| High School Diploma | $34,821 | $34,125 |
| College or Associate's Degree | - | - |
| Bachelor's Degree | $50,208 | $38,750 |
| Graduate Degree | $49,375 | $0 |
| Total | $45,179 | $37,804 |
Family Income in Saegertown borough
Family Income Brackets in Saegertown borough
According to the Saegertown borough family income data, there are 47 families falling into the $50,000 to $74,999 income range, which is the most common income bracket and makes up 22.3% of all families.
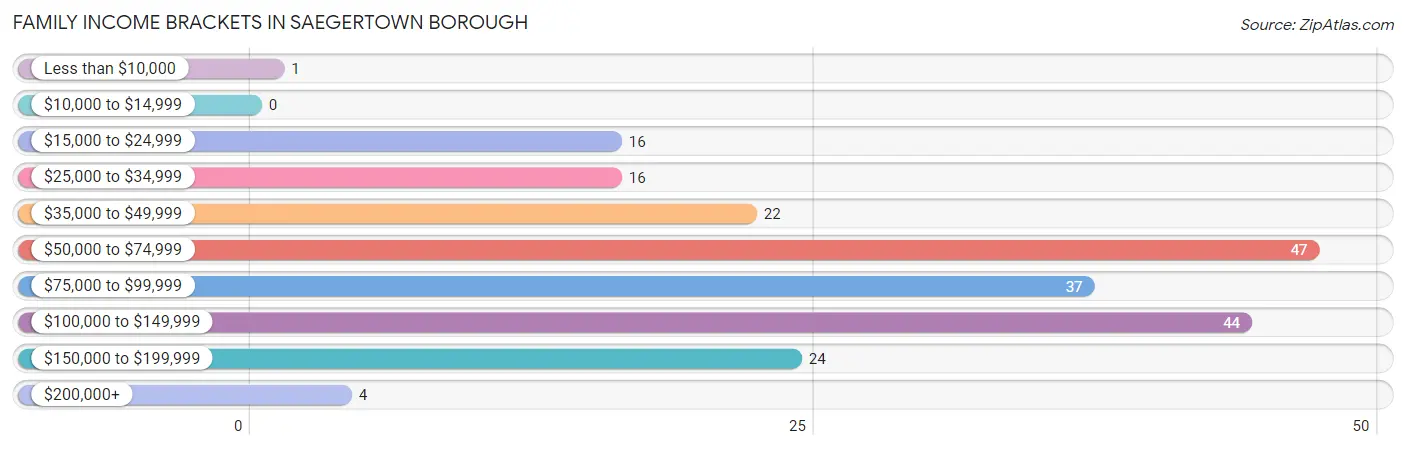
| Income Bracket | # Families | % Families |
| Less than $10,000 | 1 | 0.5% |
| $10,000 to $14,999 | 0 | 0.0% |
| $15,000 to $24,999 | 16 | 7.6% |
| $25,000 to $34,999 | 16 | 7.6% |
| $35,000 to $49,999 | 22 | 10.4% |
| $50,000 to $74,999 | 47 | 22.3% |
| $75,000 to $99,999 | 37 | 17.5% |
| $100,000 to $149,999 | 44 | 20.9% |
| $150,000 to $199,999 | 24 | 11.4% |
| $200,000+ | 4 | 1.9% |
Family Income by Famaliy Size in Saegertown borough
4-person families (26 | 12.3%) account for the highest median family income in Saegertown borough with $83,750 per family, while 2-person families (122 | 57.8%) have the highest median income of $35,000 per family member.
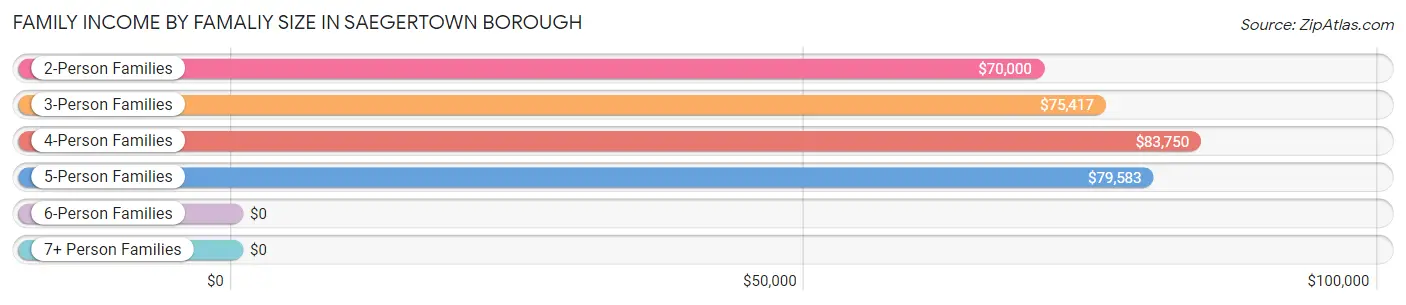
| Income Bracket | # Families | Median Income |
| 2-Person Families | 122 (57.8%) | $70,000 |
| 3-Person Families | 47 (22.3%) | $75,417 |
| 4-Person Families | 26 (12.3%) | $83,750 |
| 5-Person Families | 10 (4.7%) | $79,583 |
| 6-Person Families | 6 (2.8%) | $0 |
| 7+ Person Families | 0 (0.0%) | $0 |
| Total | 211 (100.0%) | $75,795 |
Family Income by Number of Earners in Saegertown borough
The median family income in Saegertown borough is $75,795, with families comprising 3+ earners (8) having the highest median family income of $168,750, while families with 1 earner (55) have the lowest median family income of $46,875, accounting for 3.8% and 26.1% of families, respectively.
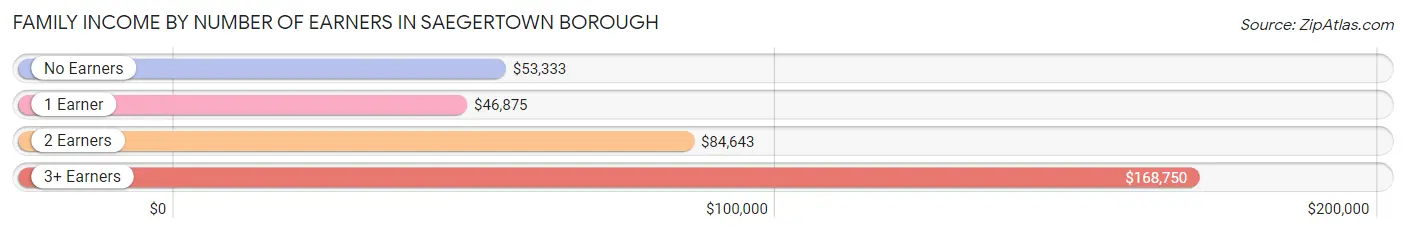
| Number of Earners | # Families | Median Income |
| No Earners | 24 (11.4%) | $53,333 |
| 1 Earner | 55 (26.1%) | $46,875 |
| 2 Earners | 124 (58.8%) | $84,643 |
| 3+ Earners | 8 (3.8%) | $168,750 |
| Total | 211 (100.0%) | $75,795 |
Household Income in Saegertown borough
Household Income Brackets in Saegertown borough
With 72 households falling in the category, the $100,000 to $149,999 income range is the most frequent in Saegertown borough, accounting for 21.7% of all households. In contrast, only 4 households (1.2%) fall into the $10,000 to $14,999 income bracket, making it the least populous group.
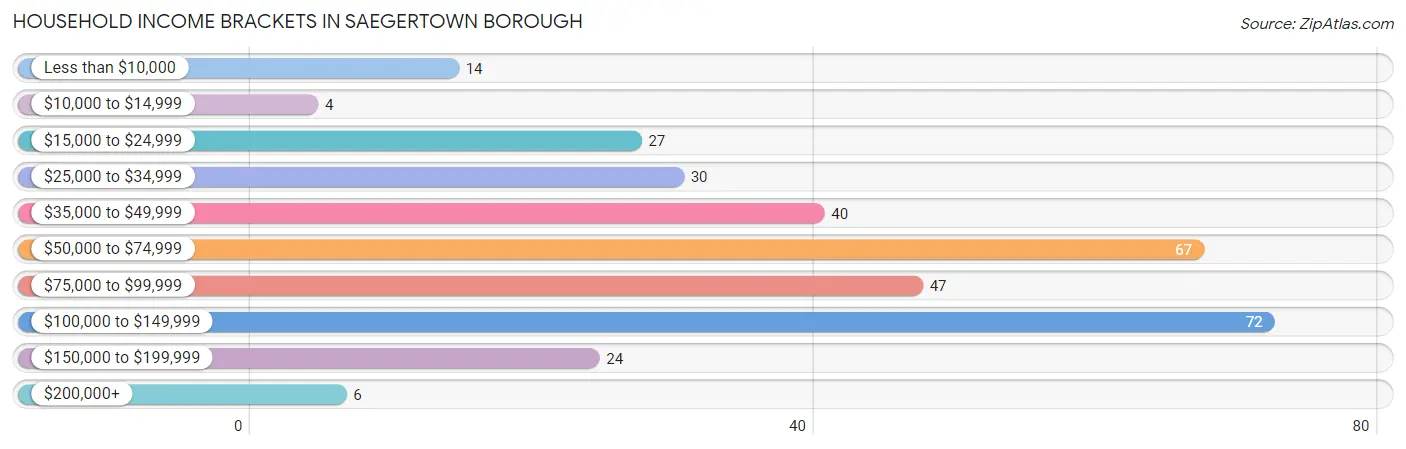
| Income Bracket | # Households | % Households |
| Less than $10,000 | 14 | 4.2% |
| $10,000 to $14,999 | 4 | 1.2% |
| $15,000 to $24,999 | 27 | 8.2% |
| $25,000 to $34,999 | 30 | 9.1% |
| $35,000 to $49,999 | 40 | 12.1% |
| $50,000 to $74,999 | 67 | 20.2% |
| $75,000 to $99,999 | 47 | 14.2% |
| $100,000 to $149,999 | 72 | 21.8% |
| $150,000 to $199,999 | 24 | 7.3% |
| $200,000+ | 6 | 1.8% |
Household Income by Householder Age in Saegertown borough
The median household income in Saegertown borough is $70,250, with the highest median household income of $76,250 found in the 25 to 44 years age bracket for the primary householder. A total of 117 households (35.3%) fall into this category. Meanwhile, the 15 to 24 years age bracket for the primary householder has the lowest median household income of $0, with 4 households (1.2%) in this group.
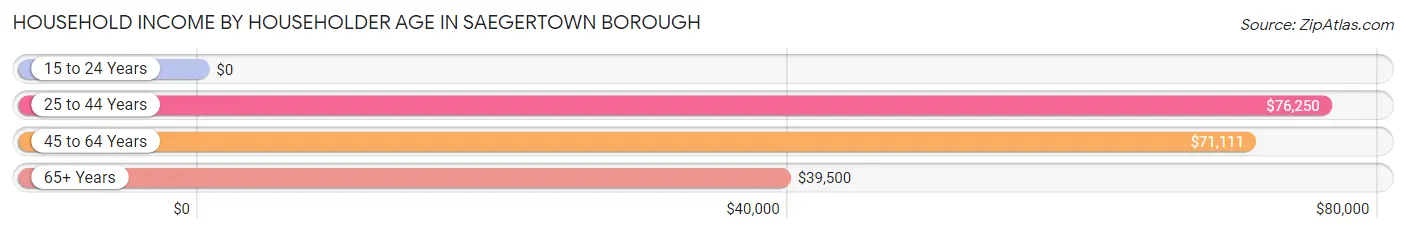
| Income Bracket | # Households | Median Income |
| 15 to 24 Years | 4 (1.2%) | $0 |
| 25 to 44 Years | 117 (35.3%) | $76,250 |
| 45 to 64 Years | 116 (35.0%) | $71,111 |
| 65+ Years | 94 (28.4%) | $39,500 |
| Total | 331 (100.0%) | $70,250 |
Poverty in Saegertown borough
Income Below Poverty by Sex and Age in Saegertown borough
With 5.1% poverty level for males and 7.1% for females among the residents of Saegertown borough, 18 to 24 year old males and 75 year old and over females are the most vulnerable to poverty, with 8 males (34.8%) and 12 females (33.3%) in their respective age groups living below the poverty level.
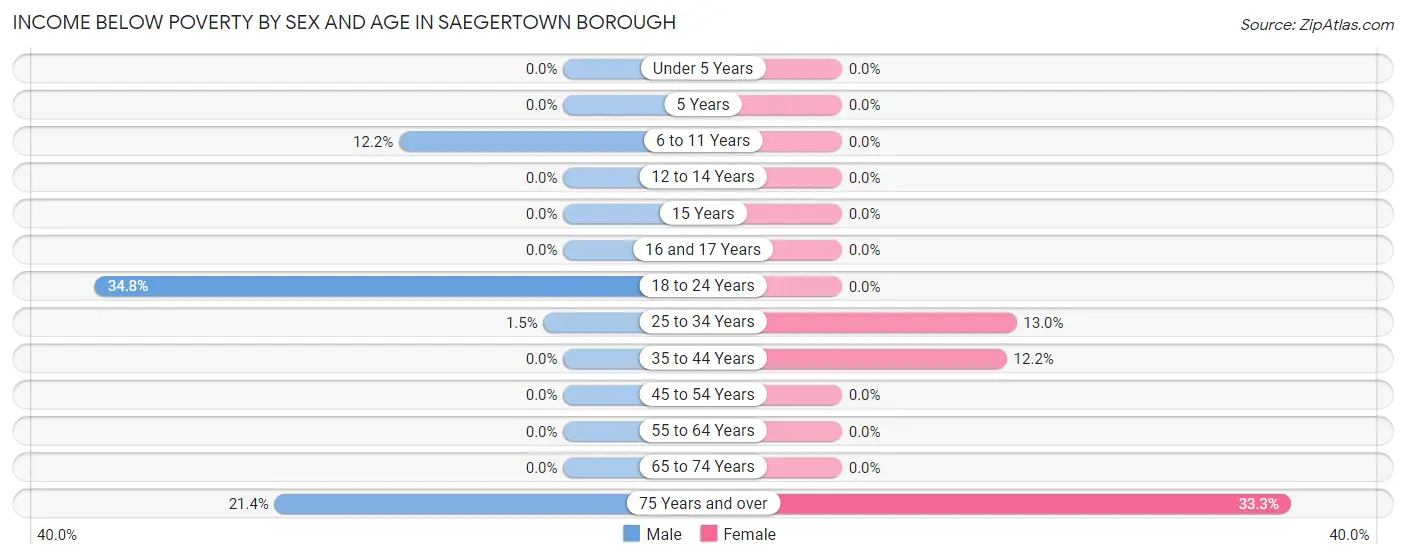
| Age Bracket | Male | Female |
| Under 5 Years | 0 (0.0%) | 0 (0.0%) |
| 5 Years | 0 (0.0%) | 0 (0.0%) |
| 6 to 11 Years | 5 (12.2%) | 0 (0.0%) |
| 12 to 14 Years | 0 (0.0%) | 0 (0.0%) |
| 15 Years | 0 (0.0%) | 0 (0.0%) |
| 16 and 17 Years | 0 (0.0%) | 0 (0.0%) |
| 18 to 24 Years | 8 (34.8%) | 0 (0.0%) |
| 25 to 34 Years | 1 (1.5%) | 7 (13.0%) |
| 35 to 44 Years | 0 (0.0%) | 6 (12.2%) |
| 45 to 54 Years | 0 (0.0%) | 0 (0.0%) |
| 55 to 64 Years | 0 (0.0%) | 0 (0.0%) |
| 65 to 74 Years | 0 (0.0%) | 0 (0.0%) |
| 75 Years and over | 6 (21.4%) | 12 (33.3%) |
| Total | 20 (5.1%) | 25 (7.1%) |
Income Above Poverty by Sex and Age in Saegertown borough
According to the poverty statistics in Saegertown borough, males aged under 5 years and females aged under 5 years are the age groups that are most secure financially, with 100.0% of males and 100.0% of females in these age groups living above the poverty line.
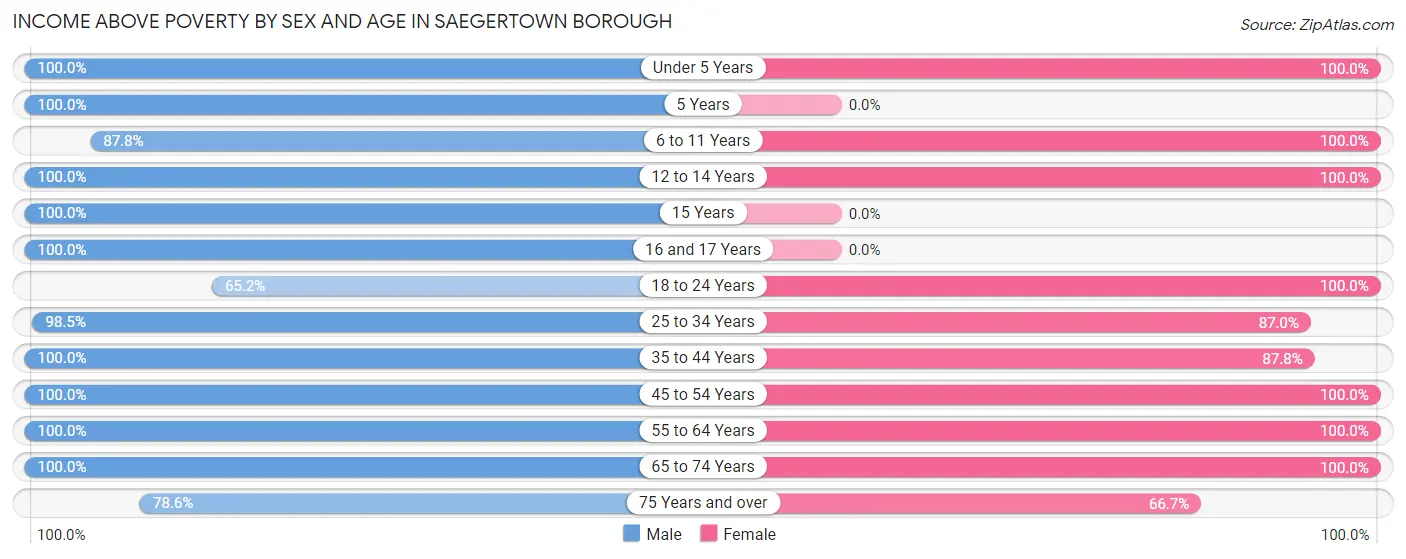
| Age Bracket | Male | Female |
| Under 5 Years | 24 (100.0%) | 18 (100.0%) |
| 5 Years | 2 (100.0%) | 0 (0.0%) |
| 6 to 11 Years | 36 (87.8%) | 29 (100.0%) |
| 12 to 14 Years | 13 (100.0%) | 19 (100.0%) |
| 15 Years | 13 (100.0%) | 0 (0.0%) |
| 16 and 17 Years | 1 (100.0%) | 0 (0.0%) |
| 18 to 24 Years | 15 (65.2%) | 17 (100.0%) |
| 25 to 34 Years | 67 (98.5%) | 47 (87.0%) |
| 35 to 44 Years | 57 (100.0%) | 43 (87.8%) |
| 45 to 54 Years | 33 (100.0%) | 27 (100.0%) |
| 55 to 64 Years | 42 (100.0%) | 64 (100.0%) |
| 65 to 74 Years | 45 (100.0%) | 41 (100.0%) |
| 75 Years and over | 22 (78.6%) | 24 (66.7%) |
| Total | 370 (94.9%) | 329 (92.9%) |
Income Below Poverty Among Married-Couple Families in Saegertown borough
The poverty statistics for married-couple families in Saegertown borough show that 0.7% or 1 of the total 140 families live below the poverty line. Families with no children have the highest poverty rate of 1.1%, comprising of 1 families. On the other hand, families with 1 or 2 children have the lowest poverty rate of 0.0%, which includes 0 families.
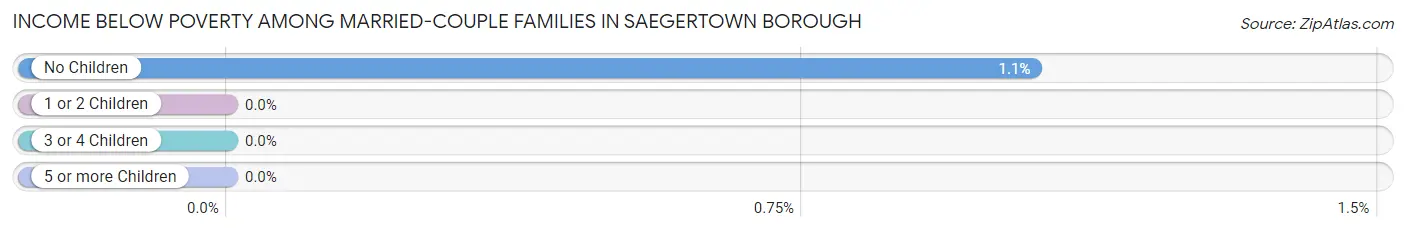
| Children | Above Poverty | Below Poverty |
| No Children | 94 (99.0%) | 1 (1.1%) |
| 1 or 2 Children | 41 (100.0%) | 0 (0.0%) |
| 3 or 4 Children | 4 (100.0%) | 0 (0.0%) |
| 5 or more Children | 0 (0.0%) | 0 (0.0%) |
| Total | 139 (99.3%) | 1 (0.7%) |
Income Below Poverty Among Single-Parent Households in Saegertown borough
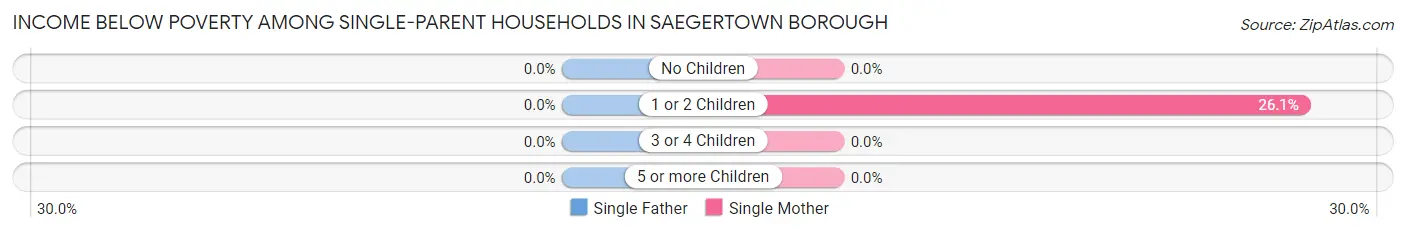
| Children | Single Father | Single Mother |
| No Children | 0 (0.0%) | 0 (0.0%) |
| 1 or 2 Children | 0 (0.0%) | 6 (26.1%) |
| 3 or 4 Children | 0 (0.0%) | 0 (0.0%) |
| 5 or more Children | 0 (0.0%) | 0 (0.0%) |
| Total | 0 (0.0%) | 6 (10.9%) |
Income Below Poverty Among Married-Couple vs Single-Parent Households in Saegertown borough
The poverty data for Saegertown borough shows that 1 of the married-couple family households (0.7%) and 6 of the single-parent households (8.5%) are living below the poverty level. Within the married-couple family households, those with no children have the highest poverty rate, with 1 households (1.1%) falling below the poverty line. Among the single-parent households, those with 1 or 2 children have the highest poverty rate, with 6 household (18.2%) living below poverty.
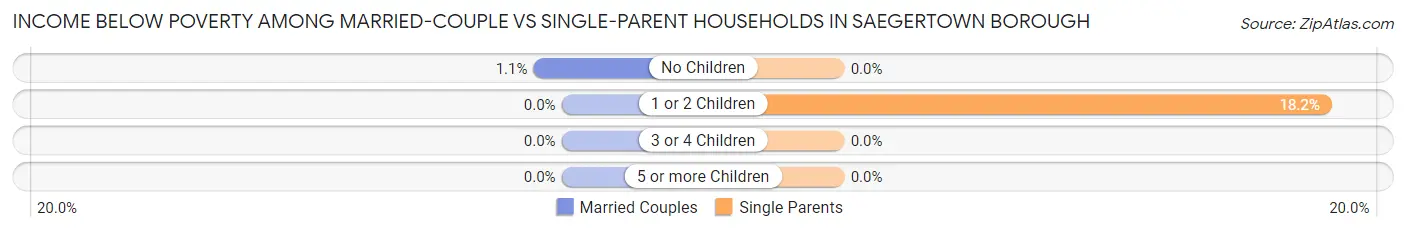
| Children | Married-Couple Families | Single-Parent Households |
| No Children | 1 (1.1%) | 0 (0.0%) |
| 1 or 2 Children | 0 (0.0%) | 6 (18.2%) |
| 3 or 4 Children | 0 (0.0%) | 0 (0.0%) |
| 5 or more Children | 0 (0.0%) | 0 (0.0%) |
| Total | 1 (0.7%) | 6 (8.5%) |
Race in Saegertown borough
The most populous races in Saegertown borough are White / Caucasian (874 | 90.4%), Hispanic or Latino (32 | 3.3%), and Asian (30 | 3.1%).
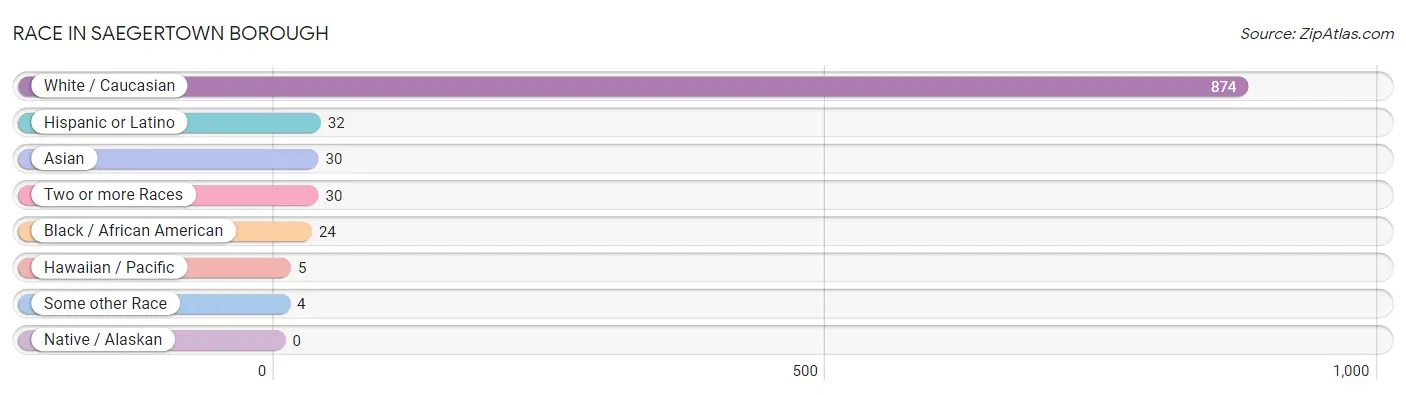
| Race | # Population | % Population |
| Asian | 30 | 3.1% |
| Black / African American | 24 | 2.5% |
| Hawaiian / Pacific | 5 | 0.5% |
| Hispanic or Latino | 32 | 3.3% |
| Native / Alaskan | 0 | 0.0% |
| White / Caucasian | 874 | 90.4% |
| Two or more Races | 30 | 3.1% |
| Some other Race | 4 | 0.4% |
| Total | 967 | 100.0% |
Ancestry in Saegertown borough
The most populous ancestries reported in Saegertown borough are German (238 | 24.6%), Irish (111 | 11.5%), Italian (90 | 9.3%), French (79 | 8.2%), and English (72 | 7.4%), together accounting for 61.0% of all Saegertown borough residents.
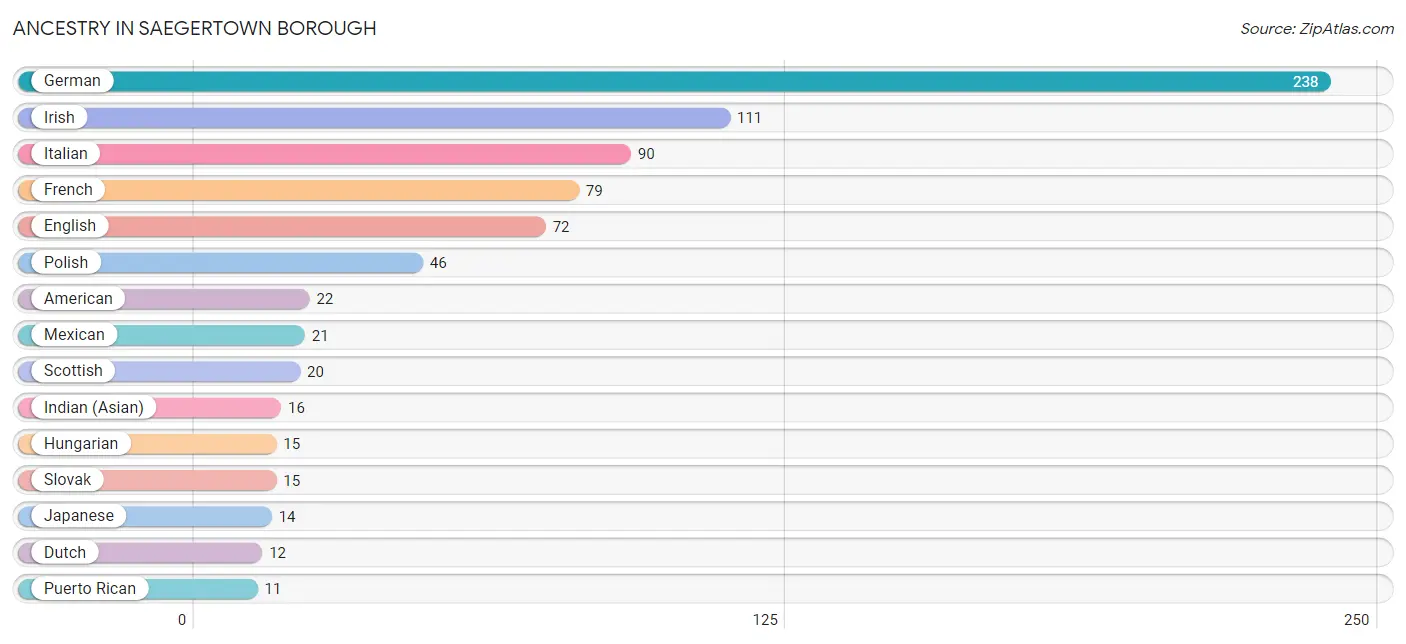
| Ancestry | # Population | % Population |
| American | 22 | 2.3% |
| Austrian | 3 | 0.3% |
| Blackfeet | 4 | 0.4% |
| British | 7 | 0.7% |
| Burmese | 5 | 0.5% |
| Cherokee | 4 | 0.4% |
| Dutch | 12 | 1.2% |
| English | 72 | 7.4% |
| French | 79 | 8.2% |
| French Canadian | 2 | 0.2% |
| German | 238 | 24.6% |
| Greek | 7 | 0.7% |
| Hungarian | 15 | 1.5% |
| Indian (Asian) | 16 | 1.7% |
| Irish | 111 | 11.5% |
| Italian | 90 | 9.3% |
| Japanese | 14 | 1.5% |
| Mexican | 21 | 2.2% |
| Native Hawaiian | 5 | 0.5% |
| Norwegian | 2 | 0.2% |
| Pennsylvania German | 6 | 0.6% |
| Polish | 46 | 4.8% |
| Portuguese | 9 | 0.9% |
| Puerto Rican | 11 | 1.1% |
| Russian | 11 | 1.1% |
| Scandinavian | 5 | 0.5% |
| Scotch-Irish | 6 | 0.6% |
| Scottish | 20 | 2.1% |
| Slovak | 15 | 1.5% |
| Swedish | 8 | 0.8% |
| Thai | 7 | 0.7% |
| Welsh | 8 | 0.8% |
| West Indian | 5 | 0.5% | View All 33 Rows |
Immigrants in Saegertown borough
The most numerous immigrant groups reported in Saegertown borough came from Asia (18 | 1.9%), China (16 | 1.7%), Eastern Asia (16 | 1.7%), Central America (4 | 0.4%), and Latin America (4 | 0.4%), together accounting for 6.0% of all Saegertown borough residents.
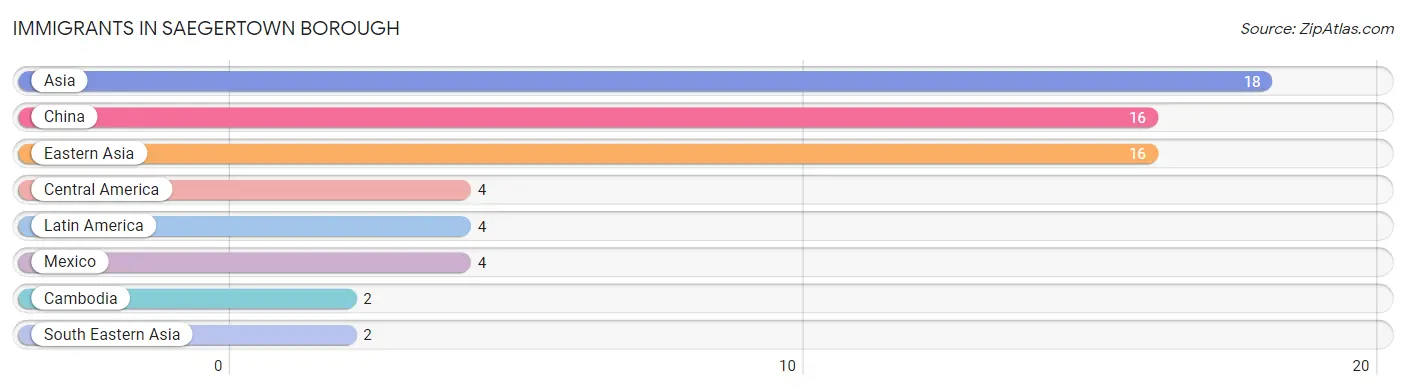
| Immigration Origin | # Population | % Population |
| Asia | 18 | 1.9% |
| Cambodia | 2 | 0.2% |
| Central America | 4 | 0.4% |
| China | 16 | 1.7% |
| Eastern Asia | 16 | 1.7% |
| Latin America | 4 | 0.4% |
| Mexico | 4 | 0.4% |
| South Eastern Asia | 2 | 0.2% | View All 8 Rows |
Sex and Age in Saegertown borough
Sex and Age in Saegertown borough
The most populous age groups in Saegertown borough are 25 to 29 Years (73 | 13.3%) for men and 30 to 34 Years (47 | 11.3%) for women.
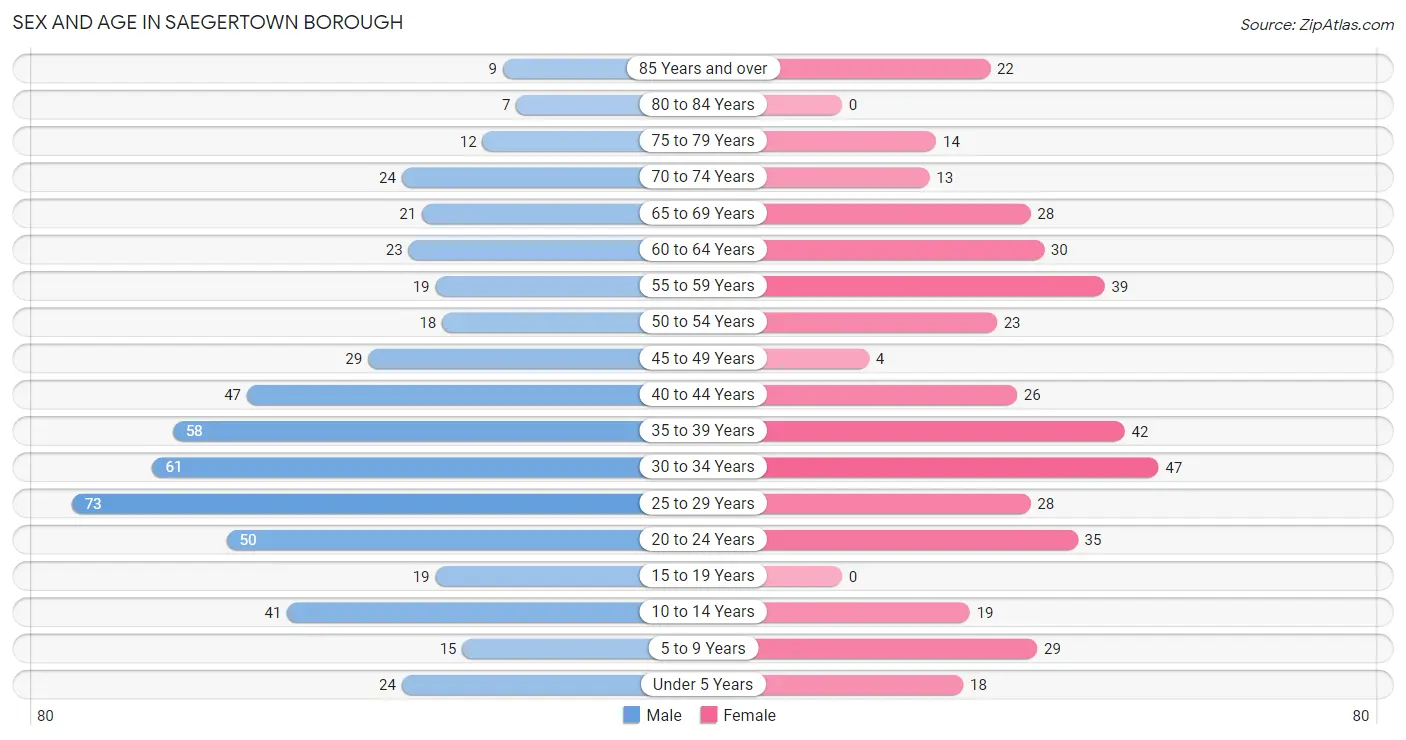
| Age Bracket | Male | Female |
| Under 5 Years | 24 (4.4%) | 18 (4.3%) |
| 5 to 9 Years | 15 (2.7%) | 29 (7.0%) |
| 10 to 14 Years | 41 (7.4%) | 19 (4.6%) |
| 15 to 19 Years | 19 (3.5%) | 0 (0.0%) |
| 20 to 24 Years | 50 (9.1%) | 35 (8.4%) |
| 25 to 29 Years | 73 (13.3%) | 28 (6.7%) |
| 30 to 34 Years | 61 (11.1%) | 47 (11.3%) |
| 35 to 39 Years | 58 (10.5%) | 42 (10.1%) |
| 40 to 44 Years | 47 (8.6%) | 26 (6.2%) |
| 45 to 49 Years | 29 (5.3%) | 4 (1.0%) |
| 50 to 54 Years | 18 (3.3%) | 23 (5.5%) |
| 55 to 59 Years | 19 (3.5%) | 39 (9.3%) |
| 60 to 64 Years | 23 (4.2%) | 30 (7.2%) |
| 65 to 69 Years | 21 (3.8%) | 28 (6.7%) |
| 70 to 74 Years | 24 (4.4%) | 13 (3.1%) |
| 75 to 79 Years | 12 (2.2%) | 14 (3.4%) |
| 80 to 84 Years | 7 (1.3%) | 0 (0.0%) |
| 85 Years and over | 9 (1.6%) | 22 (5.3%) |
| Total | 550 (100.0%) | 417 (100.0%) |
Families and Households in Saegertown borough
Median Family Size in Saegertown borough
The median family size in Saegertown borough is 2.70 persons per family, with single male/father families (16 | 7.6%) accounting for the largest median family size of 3.06 persons per family. On the other hand, married-couple families (140 | 66.3%) represent the smallest median family size with 2.64 persons per family.
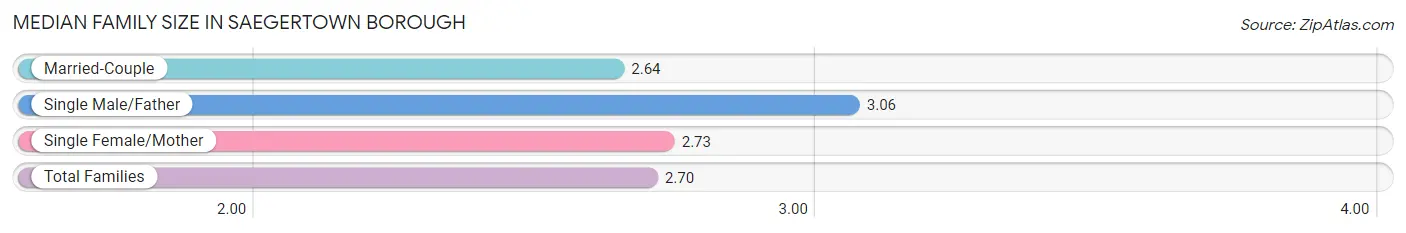
| Family Type | # Families | Family Size |
| Married-Couple | 140 (66.3%) | 2.64 |
| Single Male/Father | 16 (7.6%) | 3.06 |
| Single Female/Mother | 55 (26.1%) | 2.73 |
| Total Families | 211 (100.0%) | 2.70 |
Median Household Size in Saegertown borough
The median household size in Saegertown borough is 2.25 persons per household, with single male/father households (16 | 4.8%) accounting for the largest median household size of 3.56 persons per household. non-family households (120 | 36.2%) represent the smallest median household size with 1.20 persons per household.
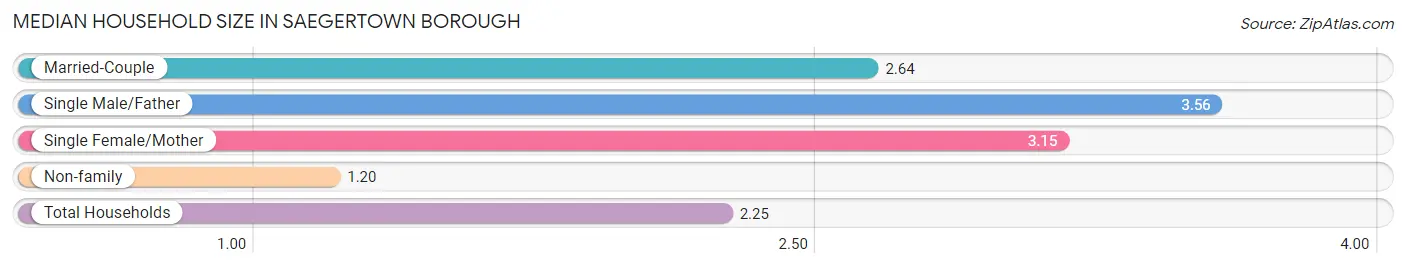
| Household Type | # Households | Household Size |
| Married-Couple | 140 (42.3%) | 2.64 |
| Single Male/Father | 16 (4.8%) | 3.56 |
| Single Female/Mother | 55 (16.6%) | 3.15 |
| Non-family | 120 (36.2%) | 1.20 |
| Total Households | 331 (100.0%) | 2.25 |
Household Size by Marriage Status in Saegertown borough
Out of a total of 331 households in Saegertown borough, 211 (63.7%) are family households, while 120 (36.2%) are nonfamily households. The most numerous type of family households are 2-person households, comprising 102, and the most common type of nonfamily households are 1-person households, comprising 105.
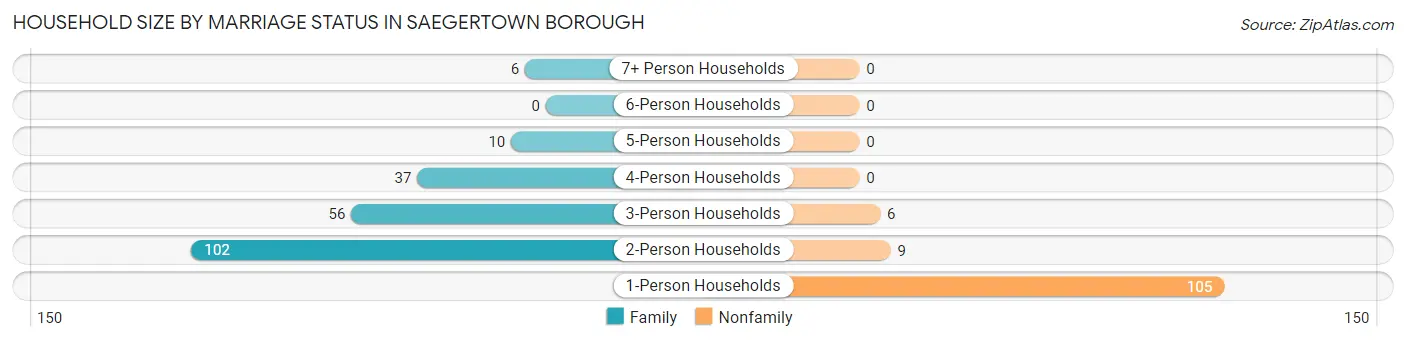
| Household Size | Family Households | Nonfamily Households |
| 1-Person Households | - | 105 (31.7%) |
| 2-Person Households | 102 (30.8%) | 9 (2.7%) |
| 3-Person Households | 56 (16.9%) | 6 (1.8%) |
| 4-Person Households | 37 (11.2%) | 0 (0.0%) |
| 5-Person Households | 10 (3.0%) | 0 (0.0%) |
| 6-Person Households | 0 (0.0%) | 0 (0.0%) |
| 7+ Person Households | 6 (1.8%) | 0 (0.0%) |
| Total | 211 (63.7%) | 120 (36.2%) |
Female Fertility in Saegertown borough
Fertility by Age in Saegertown borough
Average fertility rate in Saegertown borough is 43.0 births per 1,000 women. Women in the age bracket of 35 to 50 years have the highest fertility rate with 80.0 births per 1,000 women. Women in the age bracket of 35 to 50 years acount for 75.0% of all women with births.
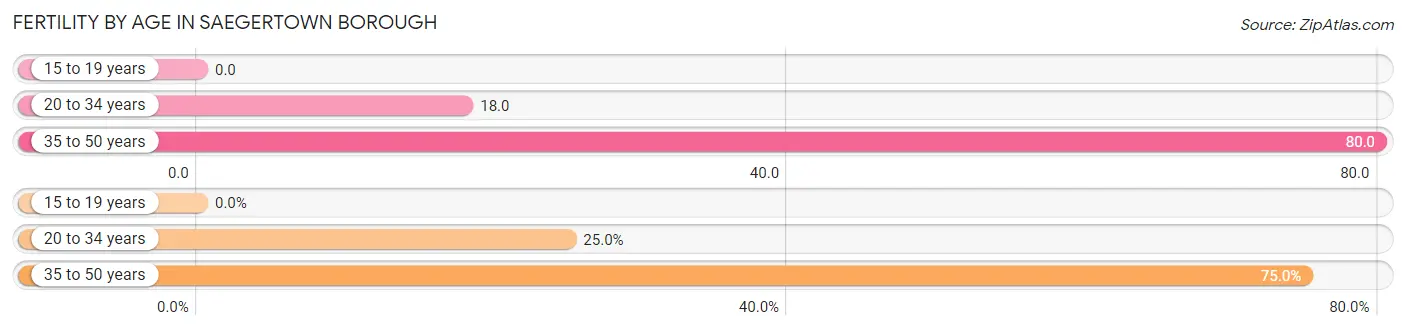
| Age Bracket | Women with Births | Births / 1,000 Women |
| 15 to 19 years | 0 (0.0%) | 0.0 |
| 20 to 34 years | 2 (25.0%) | 18.0 |
| 35 to 50 years | 6 (75.0%) | 80.0 |
| Total | 8 (100.0%) | 43.0 |
Fertility by Age by Marriage Status in Saegertown borough
25.0% of women with births (8) in Saegertown borough are married. The highest percentage of unmarried women with births falls into 35 to 50 years age bracket with 100.0% of them unmarried at the time of birth, while the lowest percentage of unmarried women with births belong to 20 to 34 years age bracket with 0.0% of them unmarried.
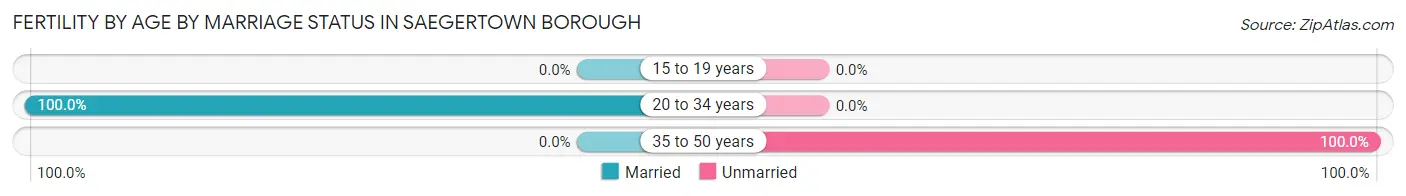
| Age Bracket | Married | Unmarried |
| 15 to 19 years | 0 (0.0%) | 0 (0.0%) |
| 20 to 34 years | 2 (100.0%) | 0 (0.0%) |
| 35 to 50 years | 0 (0.0%) | 6 (100.0%) |
| Total | 2 (25.0%) | 6 (75.0%) |
Fertility by Education in Saegertown borough
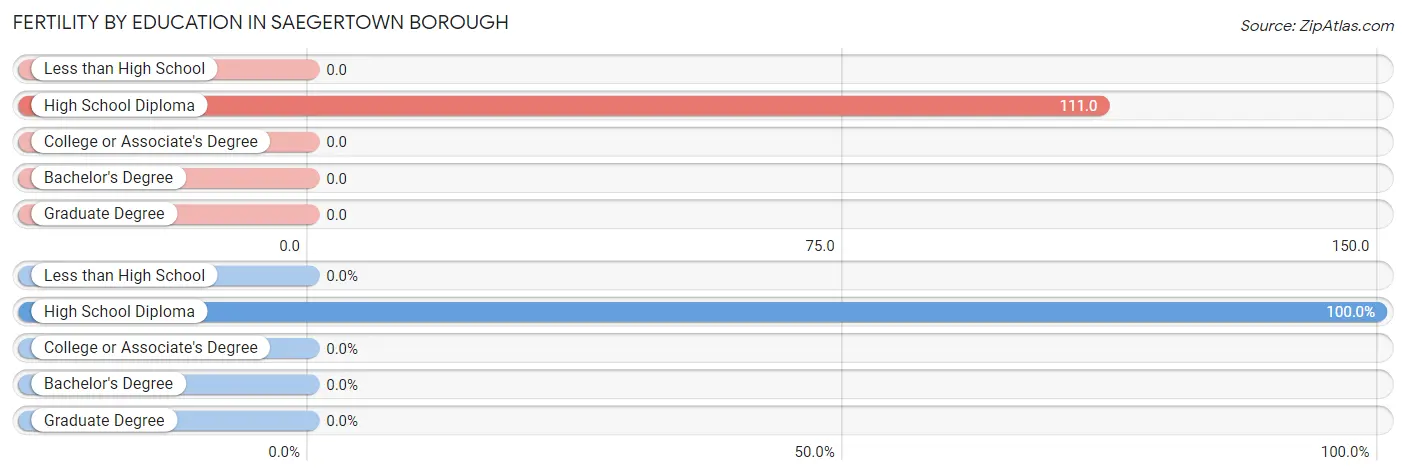
| Educational Attainment | Women with Births | Births / 1,000 Women |
| Less than High School | 0 (0.0%) | 0.0 |
| High School Diploma | 8 (100.0%) | 111.0 |
| College or Associate's Degree | 0 (0.0%) | 0.0 |
| Bachelor's Degree | 0 (0.0%) | 0.0 |
| Graduate Degree | 0 (0.0%) | 0.0 |
| Total | 8 (100.0%) | 43.0 |
Fertility by Education by Marriage Status in Saegertown borough
75.0% of women with births in Saegertown borough are unmarried. Women with the educational attainment of high school diploma are most likely to be married with 25.0% of them married at childbirth, while women with the educational attainment of high school diploma are least likely to be married with 75.0% of them unmarried at childbirth.
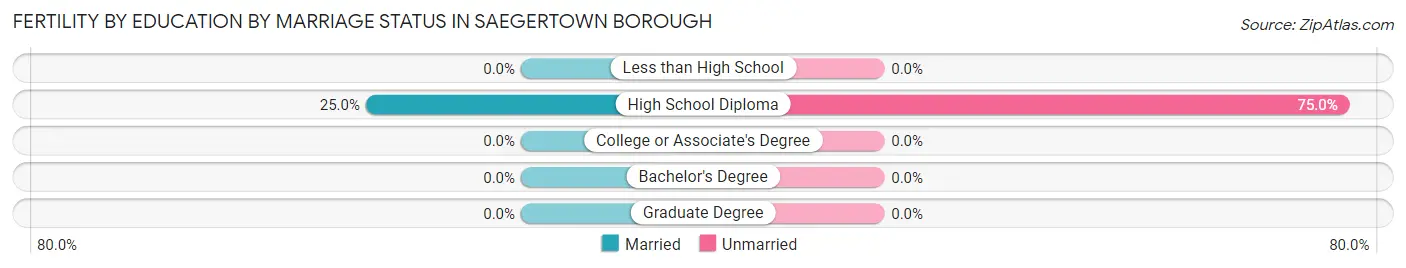
| Educational Attainment | Married | Unmarried |
| Less than High School | 0 (0.0%) | 0 (0.0%) |
| High School Diploma | 2 (25.0%) | 6 (75.0%) |
| College or Associate's Degree | 0 (0.0%) | 0 (0.0%) |
| Bachelor's Degree | 0 (0.0%) | 0 (0.0%) |
| Graduate Degree | 0 (0.0%) | 0 (0.0%) |
| Total | 2 (25.0%) | 6 (75.0%) |
Employment Characteristics in Saegertown borough
Employment by Class of Employer in Saegertown borough
Among the 427 employed individuals in Saegertown borough, private company employees (274 | 64.2%), not-for-profit organizations (72 | 16.9%), and state government employees (30 | 7.0%) make up the most common classes of employment.
| Employer Class | # Employees | % Employees |
| Private Company Employees | 274 | 64.2% |
| Self-Employed (Incorporated) | 11 | 2.6% |
| Self-Employed (Not Incorporated) | 5 | 1.2% |
| Not-for-profit Organizations | 72 | 16.9% |
| Local Government Employees | 26 | 6.1% |
| State Government Employees | 30 | 7.0% |
| Federal Government Employees | 9 | 2.1% |
| Unpaid Family Workers | 0 | 0.0% |
| Total | 427 | 100.0% |
Employment Status by Age in Saegertown borough
According to the labor force statistics for Saegertown borough, out of the total population over 16 years of age (808), 53.6% or 433 individuals are in the labor force, with 0.9% or 4 of them unemployed. The age group with the highest labor force participation rate is 55 to 59 years, with 86.2% or 50 individuals in the labor force. Within the labor force, the 35 to 44 years age range has the highest percentage of unemployed individuals, with 4.1% or 4 of them being unemployed.
| Age Bracket | In Labor Force | Unemployed |
| 16 to 19 Years | 0 (0.0%) | 0 (0.0%) |
| 20 to 24 Years | 33 (38.8%) | 0 (0.0%) |
| 25 to 29 Years | 51 (50.5%) | 0 (0.0%) |
| 30 to 34 Years | 58 (53.7%) | 0 (0.0%) |
| 35 to 44 Years | 97 (56.1%) | 4 (4.1%) |
| 45 to 54 Years | 60 (81.1%) | 0 (0.0%) |
| 55 to 59 Years | 50 (86.2%) | 0 (0.0%) |
| 60 to 64 Years | 27 (50.9%) | 0 (0.0%) |
| 65 to 74 Years | 57 (66.3%) | 0 (0.0%) |
| 75 Years and over | 0 (0.0%) | 0 (0.0%) |
| Total | 433 (53.6%) | 4 (0.9%) |
Employment Status by Educational Attainment in Saegertown borough
According to labor force statistics for Saegertown borough, 60.5% of individuals (343) out of the total population between 25 and 64 years of age (567) are in the labor force, with 1.2% or 4 of them being unemployed. The group with the highest labor force participation rate are those with the educational attainment of bachelor's degree or higher, with 94.4% or 119 individuals in the labor force. Within the labor force, individuals with less than high school education have the highest percentage of unemployment, with 20.0% or 4 of them being unemployed.
| Educational Attainment | In Labor Force | Unemployed |
| Less than High School | 20 (43.5%) | 9 (20.0%) |
| High School Diploma | 134 (47.5%) | 0 (0.0%) |
| College / Associate Degree | 70 (61.9%) | 0 (0.0%) |
| Bachelor's Degree or higher | 119 (94.4%) | 0 (0.0%) |
| Total | 343 (60.5%) | 7 (1.2%) |
Employment Occupations by Sex in Saegertown borough
Management, Business, Science and Arts Occupations
The most common Management, Business, Science and Arts occupations in Saegertown borough are Community & Social Service (35 | 8.2%), Computers, Engineering & Science (33 | 7.7%), Health Diagnosing & Treating (28 | 6.5%), Computers & Mathematics (24 | 5.6%), and Education Instruction & Library (21 | 4.9%).
Management, Business, Science and Arts Occupations by Sex
Within the Management, Business, Science and Arts occupations in Saegertown borough, the most male-oriented occupations are Architecture & Engineering (100.0%), Life, Physical & Social Science (100.0%), and Legal Services & Support (100.0%), while the most female-oriented occupations are Arts, Media & Entertainment (100.0%), Education Instruction & Library (90.5%), and Health Diagnosing & Treating (89.3%).
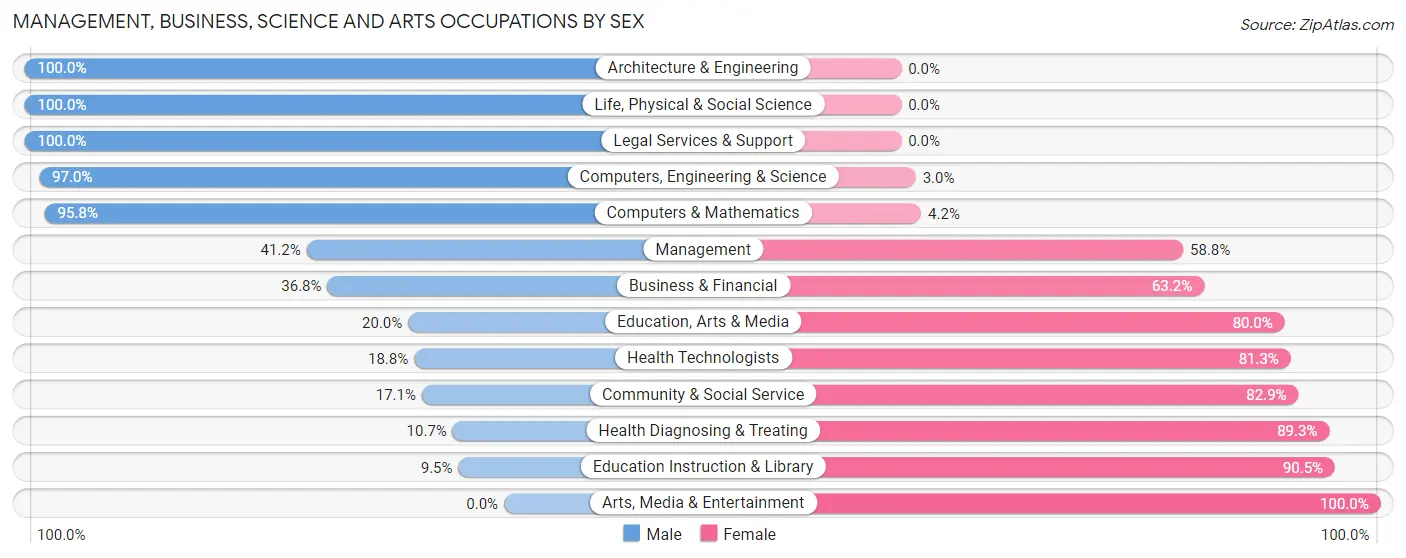
| Occupation | Male | Female |
| Management | 7 (41.2%) | 10 (58.8%) |
| Business & Financial | 7 (36.8%) | 12 (63.2%) |
| Computers, Engineering & Science | 32 (97.0%) | 1 (3.0%) |
| Computers & Mathematics | 23 (95.8%) | 1 (4.2%) |
| Architecture & Engineering | 6 (100.0%) | 0 (0.0%) |
| Life, Physical & Social Science | 3 (100.0%) | 0 (0.0%) |
| Community & Social Service | 6 (17.1%) | 29 (82.9%) |
| Education, Arts & Media | 2 (20.0%) | 8 (80.0%) |
| Legal Services & Support | 2 (100.0%) | 0 (0.0%) |
| Education Instruction & Library | 2 (9.5%) | 19 (90.5%) |
| Arts, Media & Entertainment | 0 (0.0%) | 2 (100.0%) |
| Health Diagnosing & Treating | 3 (10.7%) | 25 (89.3%) |
| Health Technologists | 3 (18.8%) | 13 (81.2%) |
| Total (Category) | 55 (41.7%) | 77 (58.3%) |
| Total (Overall) | 225 (52.4%) | 204 (47.5%) |
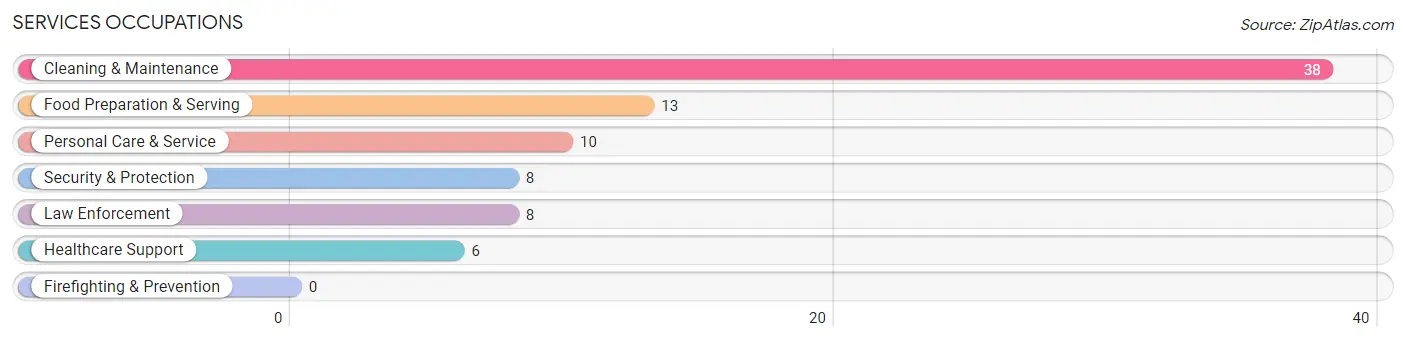
Services Occupations
The most common Services occupations in Saegertown borough are Cleaning & Maintenance (38 | 8.9%), Food Preparation & Serving (13 | 3.0%), Personal Care & Service (10 | 2.3%), Security & Protection (8 | 1.9%), and Law Enforcement (8 | 1.9%).
Services Occupations by Sex
Within the Services occupations in Saegertown borough, the most male-oriented occupations are Security & Protection (100.0%), Law Enforcement (100.0%), and Cleaning & Maintenance (81.6%), while the most female-oriented occupations are Healthcare Support (66.7%), Personal Care & Service (60.0%), and Food Preparation & Serving (38.5%).
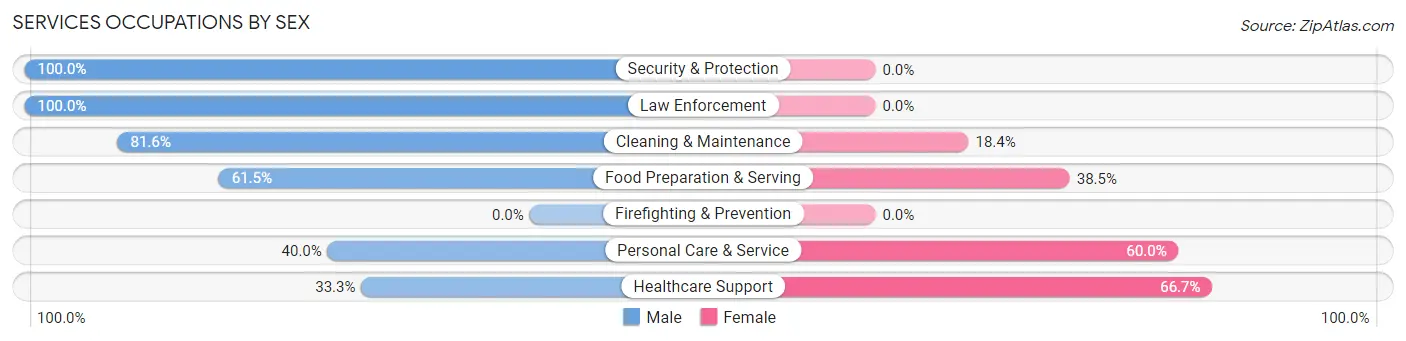
| Occupation | Male | Female |
| Healthcare Support | 2 (33.3%) | 4 (66.7%) |
| Security & Protection | 8 (100.0%) | 0 (0.0%) |
| Firefighting & Prevention | 0 (0.0%) | 0 (0.0%) |
| Law Enforcement | 8 (100.0%) | 0 (0.0%) |
| Food Preparation & Serving | 8 (61.5%) | 5 (38.5%) |
| Cleaning & Maintenance | 31 (81.6%) | 7 (18.4%) |
| Personal Care & Service | 4 (40.0%) | 6 (60.0%) |
| Total (Category) | 53 (70.7%) | 22 (29.3%) |
| Total (Overall) | 225 (52.4%) | 204 (47.5%) |
Sales and Office Occupations
The most common Sales and Office occupations in Saegertown borough are Office & Administration (62 | 14.4%), and Sales & Related (13 | 3.0%).
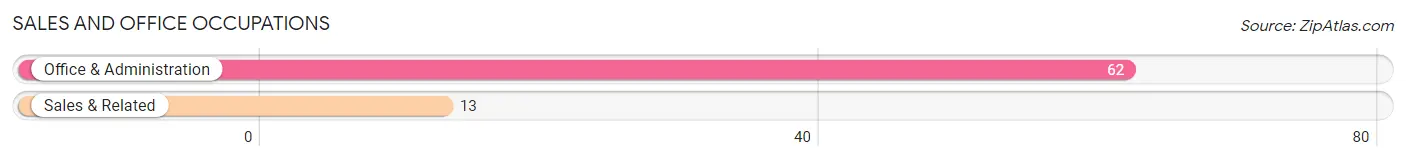
Sales and Office Occupations by Sex
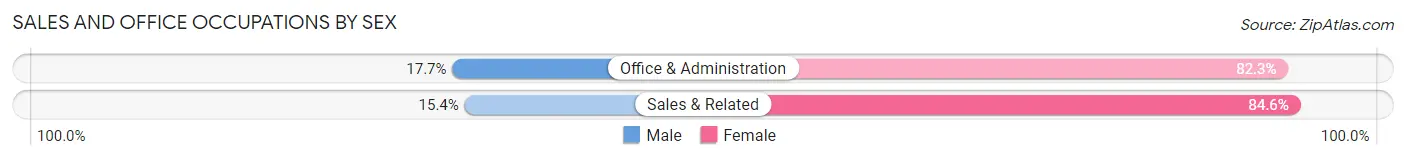
| Occupation | Male | Female |
| Sales & Related | 2 (15.4%) | 11 (84.6%) |
| Office & Administration | 11 (17.7%) | 51 (82.3%) |
| Total (Category) | 13 (17.3%) | 62 (82.7%) |
| Total (Overall) | 225 (52.4%) | 204 (47.5%) |
Natural Resources, Construction and Maintenance Occupations
The most common Natural Resources, Construction and Maintenance occupations in Saegertown borough are Farming, Fishing & Forestry (14 | 3.3%), Construction & Extraction (12 | 2.8%), and Installation, Maintenance & Repair (7 | 1.6%).
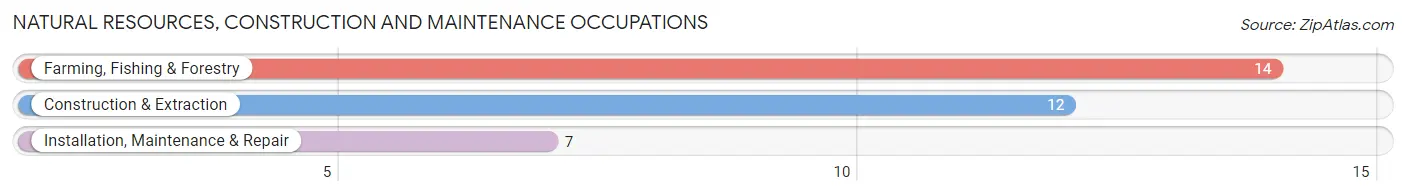
Natural Resources, Construction and Maintenance Occupations by Sex
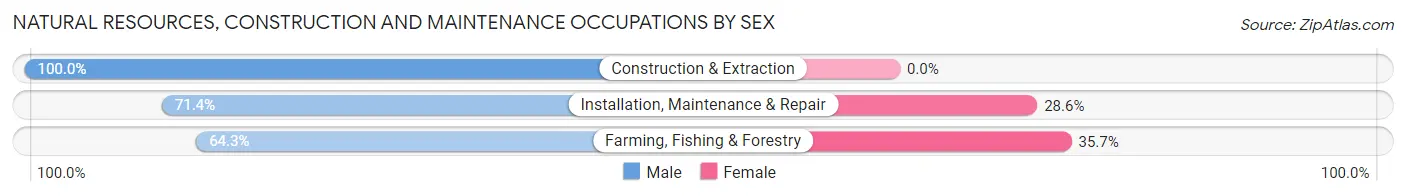
| Occupation | Male | Female |
| Farming, Fishing & Forestry | 9 (64.3%) | 5 (35.7%) |
| Construction & Extraction | 12 (100.0%) | 0 (0.0%) |
| Installation, Maintenance & Repair | 5 (71.4%) | 2 (28.6%) |
| Total (Category) | 26 (78.8%) | 7 (21.2%) |
| Total (Overall) | 225 (52.4%) | 204 (47.5%) |
Production, Transportation and Moving Occupations
The most common Production, Transportation and Moving occupations in Saegertown borough are Production (88 | 20.5%), Material Moving (17 | 4.0%), and Transportation (9 | 2.1%).
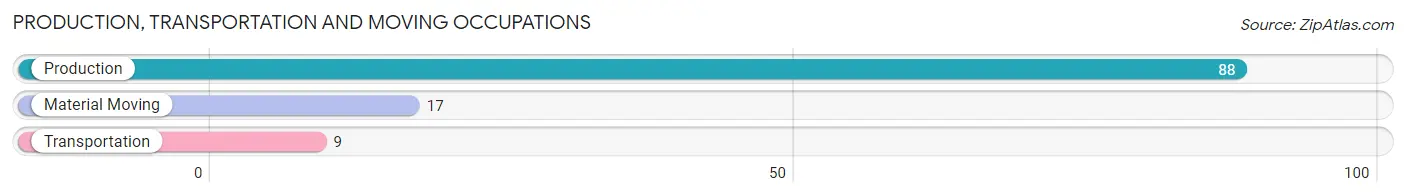
Production, Transportation and Moving Occupations by Sex
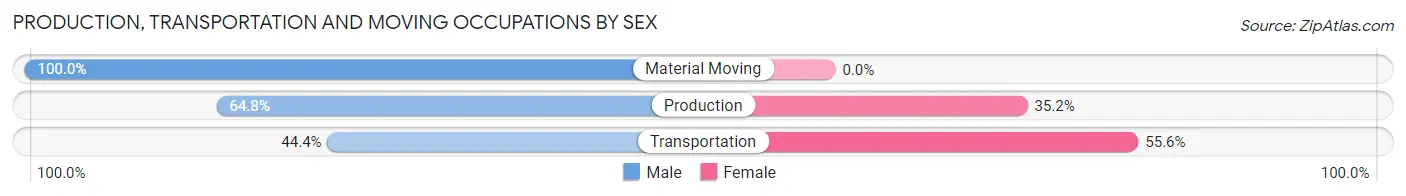
| Occupation | Male | Female |
| Production | 57 (64.8%) | 31 (35.2%) |
| Transportation | 4 (44.4%) | 5 (55.6%) |
| Material Moving | 17 (100.0%) | 0 (0.0%) |
| Total (Category) | 78 (68.4%) | 36 (31.6%) |
| Total (Overall) | 225 (52.4%) | 204 (47.5%) |
Employment Industries by Sex in Saegertown borough
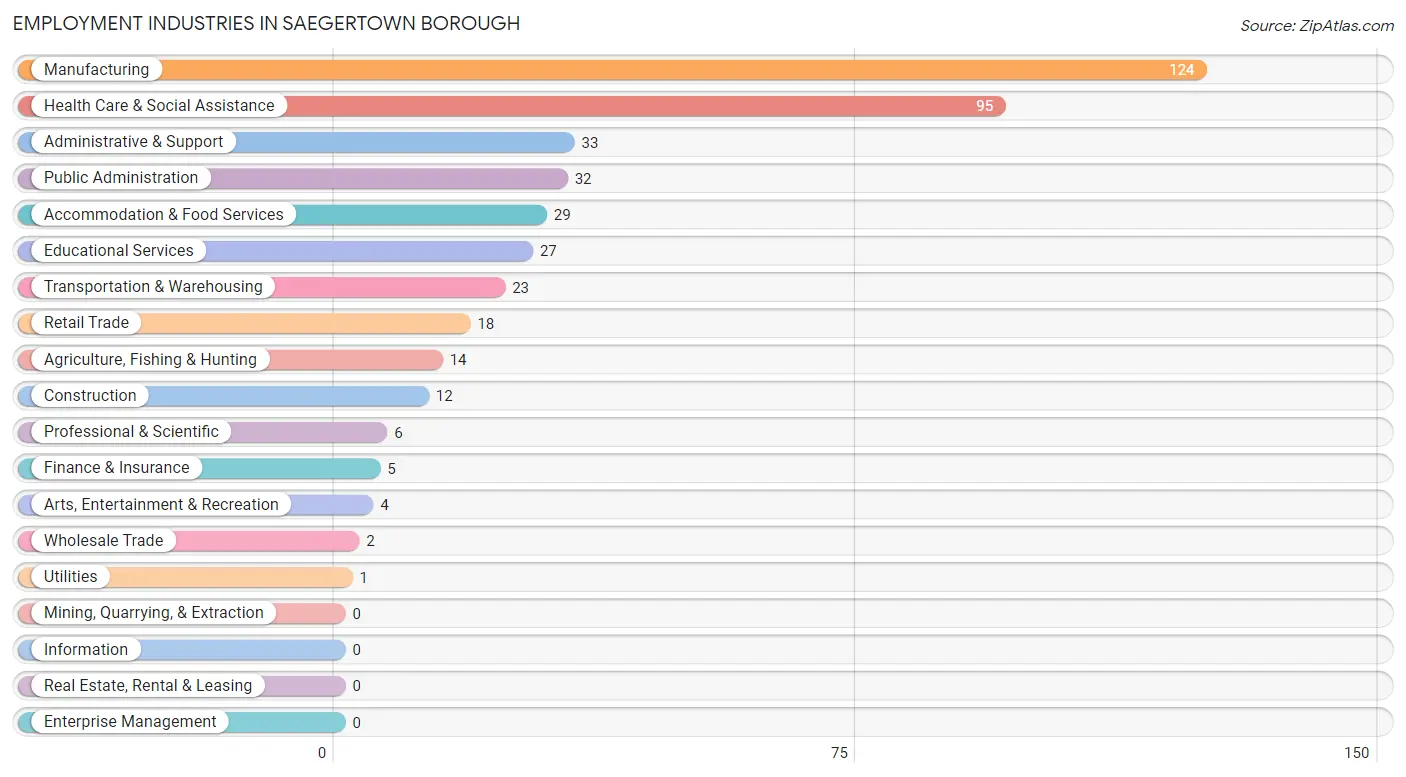
Employment Industries in Saegertown borough
The major employment industries in Saegertown borough include Manufacturing (124 | 28.9%), Health Care & Social Assistance (95 | 22.1%), Administrative & Support (33 | 7.7%), Public Administration (32 | 7.5%), and Accommodation & Food Services (29 | 6.8%).
Employment Industries by Sex in Saegertown borough
The Saegertown borough industries that see more men than women are Construction (100.0%), Wholesale Trade (100.0%), and Utilities (100.0%), whereas the industries that tend to have a higher number of women are Educational Services (85.2%), Health Care & Social Assistance (77.9%), and Accommodation & Food Services (72.4%).
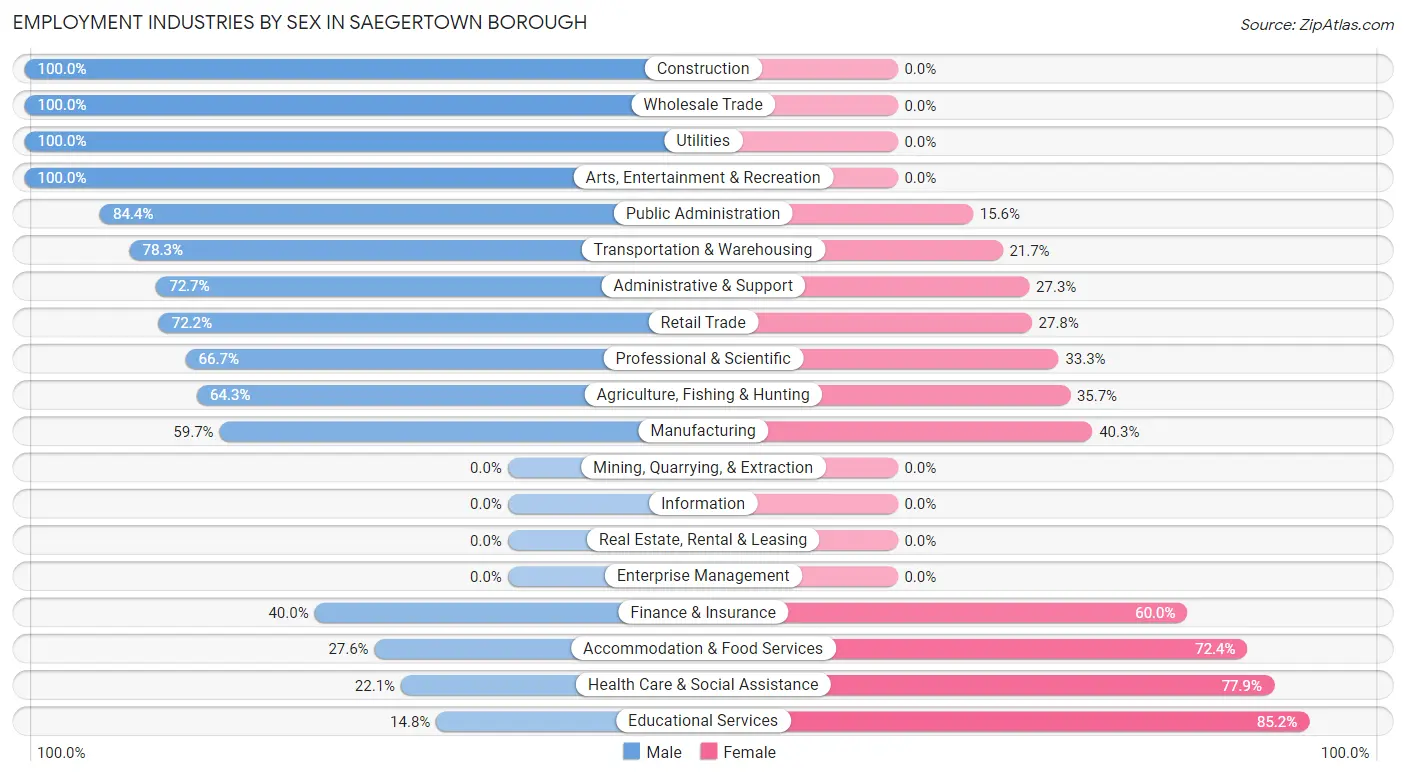
| Industry | Male | Female |
| Agriculture, Fishing & Hunting | 9 (64.3%) | 5 (35.7%) |
| Mining, Quarrying, & Extraction | 0 (0.0%) | 0 (0.0%) |
| Construction | 12 (100.0%) | 0 (0.0%) |
| Manufacturing | 74 (59.7%) | 50 (40.3%) |
| Wholesale Trade | 2 (100.0%) | 0 (0.0%) |
| Retail Trade | 13 (72.2%) | 5 (27.8%) |
| Transportation & Warehousing | 18 (78.3%) | 5 (21.7%) |
| Utilities | 1 (100.0%) | 0 (0.0%) |
| Information | 0 (0.0%) | 0 (0.0%) |
| Finance & Insurance | 2 (40.0%) | 3 (60.0%) |
| Real Estate, Rental & Leasing | 0 (0.0%) | 0 (0.0%) |
| Professional & Scientific | 4 (66.7%) | 2 (33.3%) |
| Enterprise Management | 0 (0.0%) | 0 (0.0%) |
| Administrative & Support | 24 (72.7%) | 9 (27.3%) |
| Educational Services | 4 (14.8%) | 23 (85.2%) |
| Health Care & Social Assistance | 21 (22.1%) | 74 (77.9%) |
| Arts, Entertainment & Recreation | 4 (100.0%) | 0 (0.0%) |
| Accommodation & Food Services | 8 (27.6%) | 21 (72.4%) |
| Public Administration | 27 (84.4%) | 5 (15.6%) |
| Total | 225 (52.4%) | 204 (47.5%) |
Education in Saegertown borough
School Enrollment in Saegertown borough
The most common levels of schooling among the 150 students in Saegertown borough are middle school (54 | 36.0%), elementary school (35 | 23.3%), and high school (20 | 13.3%).
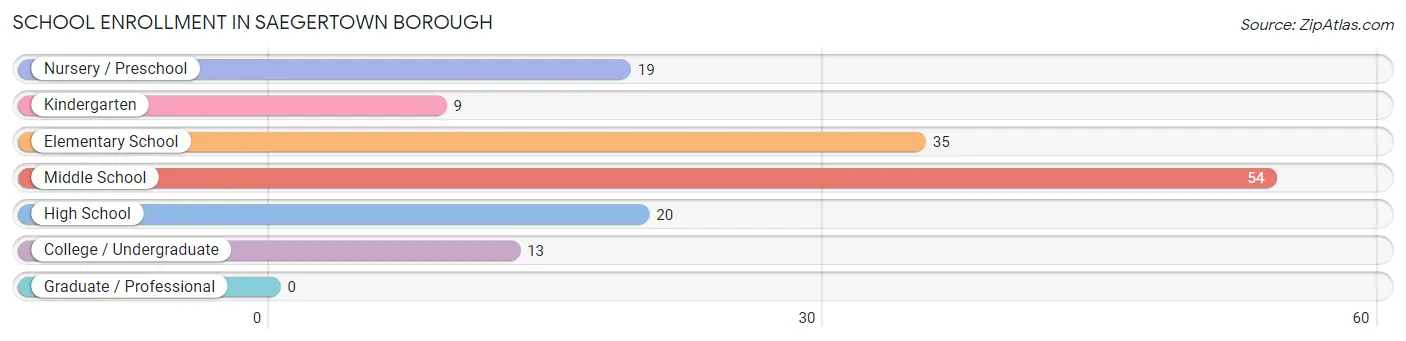
| School Level | # Students | % Students |
| Nursery / Preschool | 19 | 12.7% |
| Kindergarten | 9 | 6.0% |
| Elementary School | 35 | 23.3% |
| Middle School | 54 | 36.0% |
| High School | 20 | 13.3% |
| College / Undergraduate | 13 | 8.7% |
| Graduate / Professional | 0 | 0.0% |
| Total | 150 | 100.0% |
School Enrollment by Age by Funding Source in Saegertown borough
Out of a total of 150 students who are enrolled in schools in Saegertown borough, 27 (18.0%) attend a private institution, while the remaining 123 (82.0%) are enrolled in public schools. The age group of 25 to 34 year olds has the highest likelihood of being enrolled in private schools, with 2 (100.0% in the age bracket) enrolled. Conversely, the age group of 20 to 24 year olds has the lowest likelihood of being enrolled in a private school, with 6 (100.0% in the age bracket) attending a public institution.
| Age Bracket | Public School | Private School |
| 3 to 4 Year Olds | 13 (68.4%) | 6 (31.6%) |
| 5 to 9 Year Old | 36 (81.8%) | 8 (18.2%) |
| 10 to 14 Year Olds | 51 (85.0%) | 9 (15.0%) |
| 15 to 17 Year Olds | 12 (85.7%) | 2 (14.3%) |
| 18 to 19 Year Olds | 0 (0.0%) | 0 (0.0%) |
| 20 to 24 Year Olds | 6 (100.0%) | 0 (0.0%) |
| 25 to 34 Year Olds | 0 (0.0%) | 2 (100.0%) |
| 35 Years and over | 5 (100.0%) | 0 (0.0%) |
| Total | 123 (82.0%) | 27 (18.0%) |
Educational Attainment by Field of Study in Saegertown borough
Education (33 | 20.3%), business (29 | 17.8%), science & technology (19 | 11.7%), visual & performing arts (17 | 10.4%), and engineering (14 | 8.6%) are the most common fields of study among 163 individuals in Saegertown borough who have obtained a bachelor's degree or higher.
| Field of Study | # Graduates | % Graduates |
| Computers & Mathematics | 4 | 2.5% |
| Bio, Nature & Agricultural | 11 | 6.8% |
| Physical & Health Sciences | 5 | 3.1% |
| Psychology | 7 | 4.3% |
| Social Sciences | 10 | 6.1% |
| Engineering | 14 | 8.6% |
| Multidisciplinary Studies | 0 | 0.0% |
| Science & Technology | 19 | 11.7% |
| Business | 29 | 17.8% |
| Education | 33 | 20.3% |
| Literature & Languages | 0 | 0.0% |
| Liberal Arts & History | 0 | 0.0% |
| Visual & Performing Arts | 17 | 10.4% |
| Communications | 3 | 1.8% |
| Arts & Humanities | 11 | 6.8% |
| Total | 163 | 100.0% |
Transportation & Commute in Saegertown borough
Vehicle Availability by Sex in Saegertown borough
The most prevalent vehicle ownership categories in Saegertown borough are males with 2 vehicles (116, accounting for 51.6%) and females with 2 vehicles (106, making up 57.4%).
| Vehicles Available | Male | Female |
| No Vehicle | 8 (3.6%) | 0 (0.0%) |
| 1 Vehicle | 41 (18.2%) | 61 (30.2%) |
| 2 Vehicles | 116 (51.6%) | 106 (52.5%) |
| 3 Vehicles | 47 (20.9%) | 31 (15.3%) |
| 4 Vehicles | 13 (5.8%) | 4 (2.0%) |
| 5 or more Vehicles | 0 (0.0%) | 0 (0.0%) |
| Total | 225 (100.0%) | 202 (100.0%) |
Commute Time in Saegertown borough
The most frequently occuring commute durations in Saegertown borough are 15 to 19 minutes (104 commuters, 25.1%), less than 5 minutes (63 commuters, 15.2%), and 5 to 9 minutes (51 commuters, 12.3%).

| Commute Time | # Commuters | % Commuters |
| Less than 5 Minutes | 63 | 15.2% |
| 5 to 9 Minutes | 51 | 12.3% |
| 10 to 14 Minutes | 51 | 12.3% |
| 15 to 19 Minutes | 104 | 25.1% |
| 20 to 24 Minutes | 22 | 5.3% |
| 25 to 29 Minutes | 4 | 1.0% |
| 30 to 34 Minutes | 40 | 9.6% |
| 35 to 39 Minutes | 4 | 1.0% |
| 40 to 44 Minutes | 42 | 10.1% |
| 45 to 59 Minutes | 18 | 4.3% |
| 60 to 89 Minutes | 8 | 1.9% |
| 90 or more Minutes | 8 | 1.9% |
Commute Time by Sex in Saegertown borough
The most common commute times in Saegertown borough are 15 to 19 minutes (66 commuters, 30.4%) for males and 5 to 9 minutes (38 commuters, 19.2%) for females.
| Commute Time | Male | Female |
| Less than 5 Minutes | 44 (20.3%) | 19 (9.6%) |
| 5 to 9 Minutes | 13 (6.0%) | 38 (19.2%) |
| 10 to 14 Minutes | 26 (12.0%) | 25 (12.6%) |
| 15 to 19 Minutes | 66 (30.4%) | 38 (19.2%) |
| 20 to 24 Minutes | 10 (4.6%) | 12 (6.1%) |
| 25 to 29 Minutes | 0 (0.0%) | 4 (2.0%) |
| 30 to 34 Minutes | 24 (11.1%) | 16 (8.1%) |
| 35 to 39 Minutes | 2 (0.9%) | 2 (1.0%) |
| 40 to 44 Minutes | 24 (11.1%) | 18 (9.1%) |
| 45 to 59 Minutes | 2 (0.9%) | 16 (8.1%) |
| 60 to 89 Minutes | 0 (0.0%) | 8 (4.0%) |
| 90 or more Minutes | 6 (2.8%) | 2 (1.0%) |
Time of Departure to Work by Sex in Saegertown borough
The most frequent times of departure to work in Saegertown borough are 7:00 AM to 7:29 AM (57, 26.3%) for males and 6:30 AM to 6:59 AM (48, 24.2%) for females.
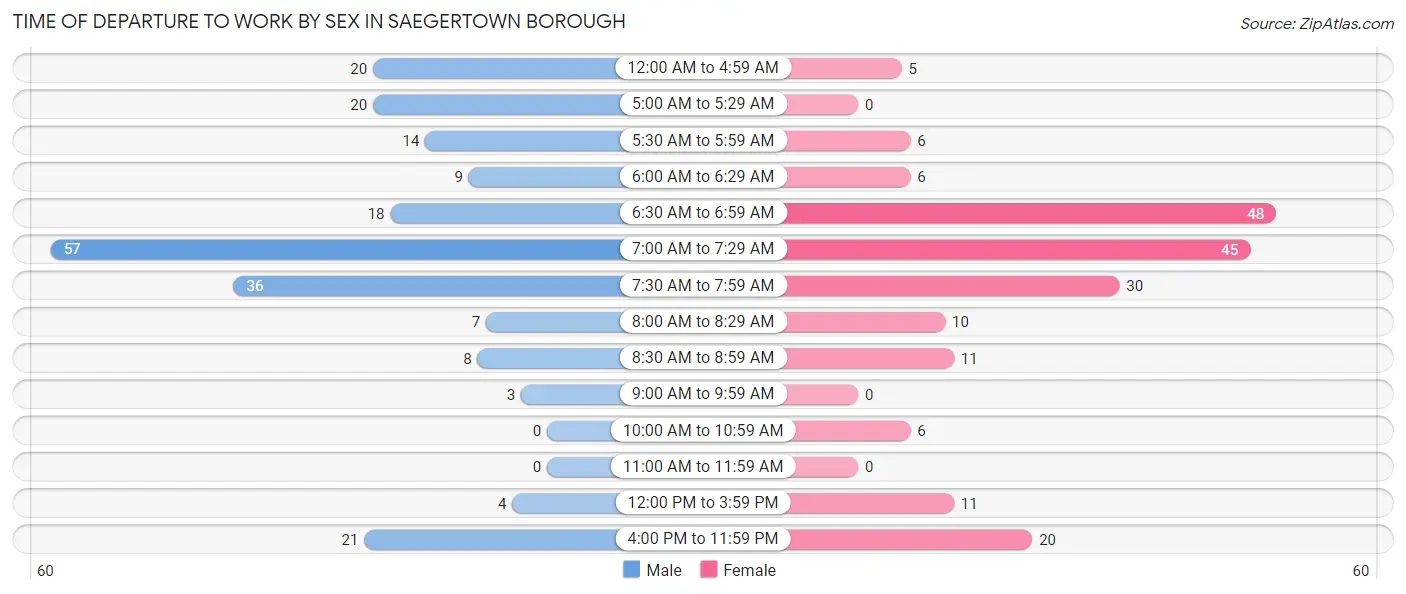
| Time of Departure | Male | Female |
| 12:00 AM to 4:59 AM | 20 (9.2%) | 5 (2.5%) |
| 5:00 AM to 5:29 AM | 20 (9.2%) | 0 (0.0%) |
| 5:30 AM to 5:59 AM | 14 (6.5%) | 6 (3.0%) |
| 6:00 AM to 6:29 AM | 9 (4.2%) | 6 (3.0%) |
| 6:30 AM to 6:59 AM | 18 (8.3%) | 48 (24.2%) |
| 7:00 AM to 7:29 AM | 57 (26.3%) | 45 (22.7%) |
| 7:30 AM to 7:59 AM | 36 (16.6%) | 30 (15.1%) |
| 8:00 AM to 8:29 AM | 7 (3.2%) | 10 (5.1%) |
| 8:30 AM to 8:59 AM | 8 (3.7%) | 11 (5.6%) |
| 9:00 AM to 9:59 AM | 3 (1.4%) | 0 (0.0%) |
| 10:00 AM to 10:59 AM | 0 (0.0%) | 6 (3.0%) |
| 11:00 AM to 11:59 AM | 0 (0.0%) | 0 (0.0%) |
| 12:00 PM to 3:59 PM | 4 (1.8%) | 11 (5.6%) |
| 4:00 PM to 11:59 PM | 21 (9.7%) | 20 (10.1%) |
| Total | 217 (100.0%) | 198 (100.0%) |
Housing Occupancy in Saegertown borough
Occupancy by Ownership in Saegertown borough
Of the total 331 dwellings in Saegertown borough, owner-occupied units account for 232 (70.1%), while renter-occupied units make up 99 (29.9%).
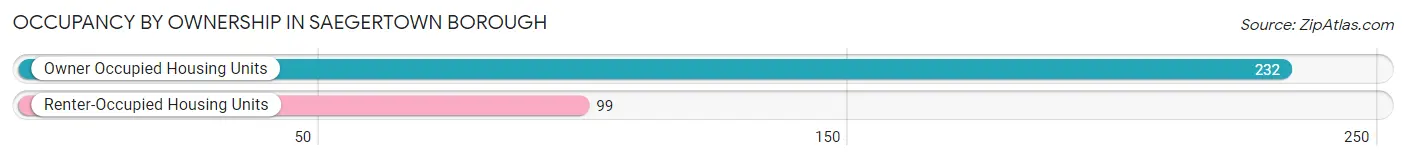
| Occupancy | # Housing Units | % Housing Units |
| Owner Occupied Housing Units | 232 | 70.1% |
| Renter-Occupied Housing Units | 99 | 29.9% |
| Total Occupied Housing Units | 331 | 100.0% |
Occupancy by Household Size in Saegertown borough
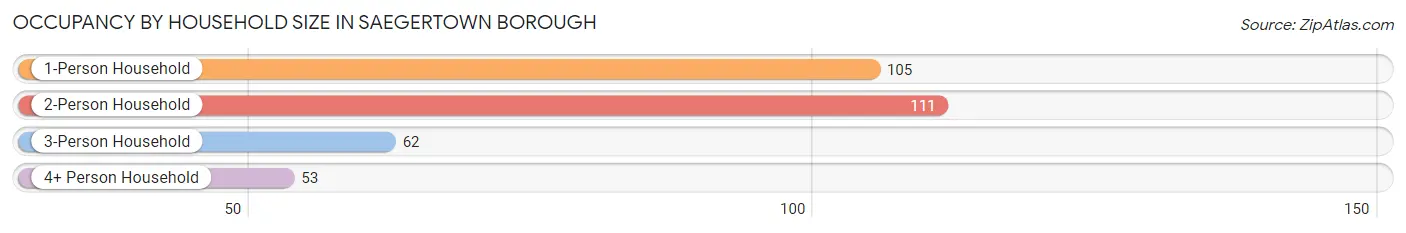
| Household Size | # Housing Units | % Housing Units |
| 1-Person Household | 105 | 31.7% |
| 2-Person Household | 111 | 33.5% |
| 3-Person Household | 62 | 18.7% |
| 4+ Person Household | 53 | 16.0% |
| Total Housing Units | 331 | 100.0% |
Occupancy by Ownership by Household Size in Saegertown borough
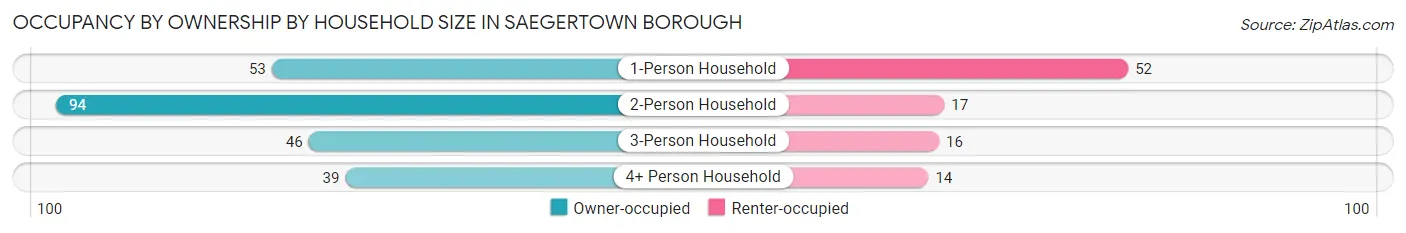
| Household Size | Owner-occupied | Renter-occupied |
| 1-Person Household | 53 (50.5%) | 52 (49.5%) |
| 2-Person Household | 94 (84.7%) | 17 (15.3%) |
| 3-Person Household | 46 (74.2%) | 16 (25.8%) |
| 4+ Person Household | 39 (73.6%) | 14 (26.4%) |
| Total Housing Units | 232 (70.1%) | 99 (29.9%) |
Occupancy by Educational Attainment in Saegertown borough
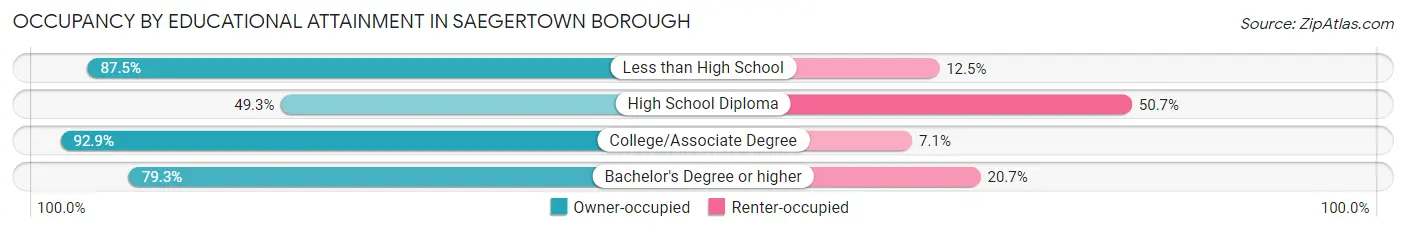
| Household Size | Owner-occupied | Renter-occupied |
| Less than High School | 14 (87.5%) | 2 (12.5%) |
| High School Diploma | 71 (49.3%) | 73 (50.7%) |
| College/Associate Degree | 78 (92.9%) | 6 (7.1%) |
| Bachelor's Degree or higher | 69 (79.3%) | 18 (20.7%) |
Occupancy by Age of Householder in Saegertown borough
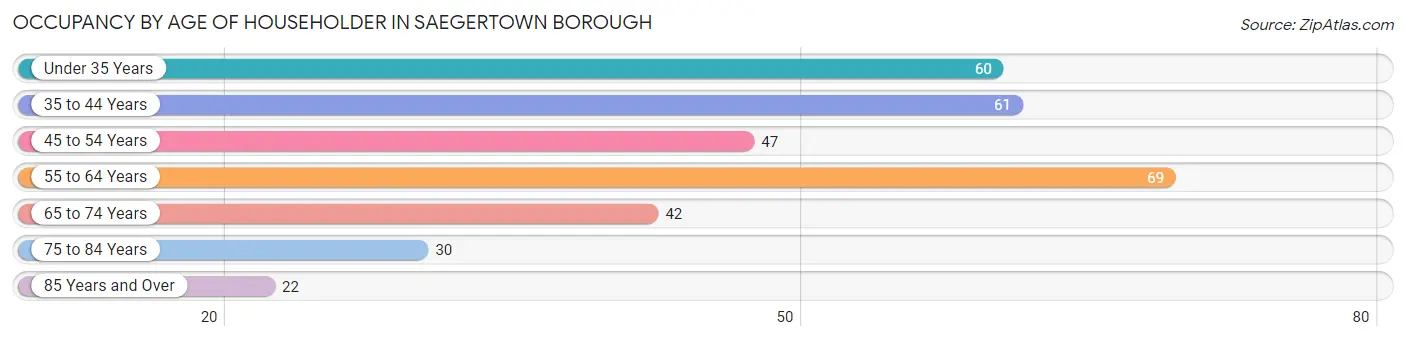
| Age Bracket | # Households | % Households |
| Under 35 Years | 60 | 18.1% |
| 35 to 44 Years | 61 | 18.4% |
| 45 to 54 Years | 47 | 14.2% |
| 55 to 64 Years | 69 | 20.8% |
| 65 to 74 Years | 42 | 12.7% |
| 75 to 84 Years | 30 | 9.1% |
| 85 Years and Over | 22 | 6.7% |
| Total | 331 | 100.0% |
Housing Finances in Saegertown borough
Median Income by Occupancy in Saegertown borough
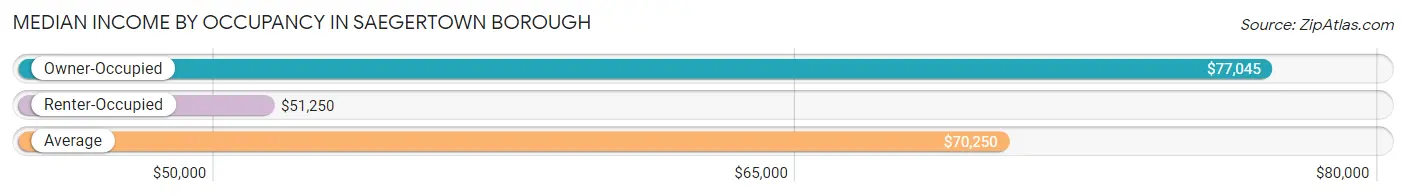
| Occupancy Type | # Households | Median Income |
| Owner-Occupied | 232 (70.1%) | $77,045 |
| Renter-Occupied | 99 (29.9%) | $51,250 |
| Average | 331 (100.0%) | $70,250 |
Occupancy by Householder Income Bracket in Saegertown borough

| Income Bracket | Owner-occupied | Renter-occupied |
| Less than $5,000 | 3 (1.3%) | 1 (1.0%) |
| $5,000 to $9,999 | 10 (4.3%) | 0 (0.0%) |
| $10,000 to $14,999 | 4 (1.7%) | 0 (0.0%) |
| $15,000 to $19,999 | 16 (6.9%) | 6 (6.1%) |
| $20,000 to $24,999 | 0 (0.0%) | 5 (5.1%) |
| $25,000 to $34,999 | 14 (6.0%) | 16 (16.2%) |
| $35,000 to $49,999 | 20 (8.6%) | 20 (20.2%) |
| $50,000 to $74,999 | 40 (17.2%) | 27 (27.3%) |
| $75,000 to $99,999 | 29 (12.5%) | 18 (18.2%) |
| $100,000 to $149,999 | 66 (28.4%) | 6 (6.1%) |
| $150,000 or more | 30 (12.9%) | 0 (0.0%) |
| Total | 232 (100.0%) | 99 (100.0%) |
Monthly Housing Cost Tiers in Saegertown borough
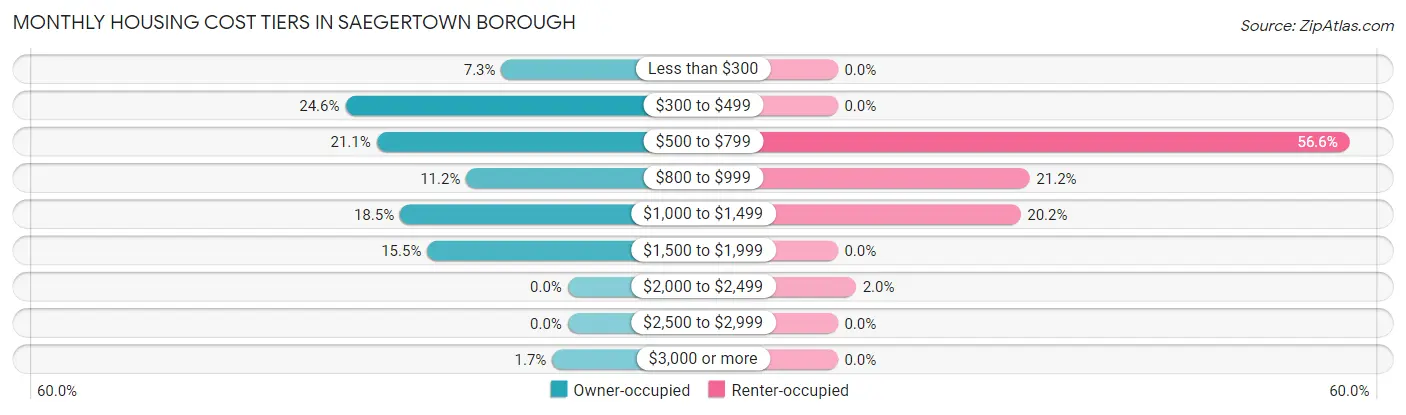
| Monthly Cost | Owner-occupied | Renter-occupied |
| Less than $300 | 17 (7.3%) | 0 (0.0%) |
| $300 to $499 | 57 (24.6%) | 0 (0.0%) |
| $500 to $799 | 49 (21.1%) | 56 (56.6%) |
| $800 to $999 | 26 (11.2%) | 21 (21.2%) |
| $1,000 to $1,499 | 43 (18.5%) | 20 (20.2%) |
| $1,500 to $1,999 | 36 (15.5%) | 0 (0.0%) |
| $2,000 to $2,499 | 0 (0.0%) | 2 (2.0%) |
| $2,500 to $2,999 | 0 (0.0%) | 0 (0.0%) |
| $3,000 or more | 4 (1.7%) | 0 (0.0%) |
| Total | 232 (100.0%) | 99 (100.0%) |
Physical Housing Characteristics in Saegertown borough
Housing Structures in Saegertown borough
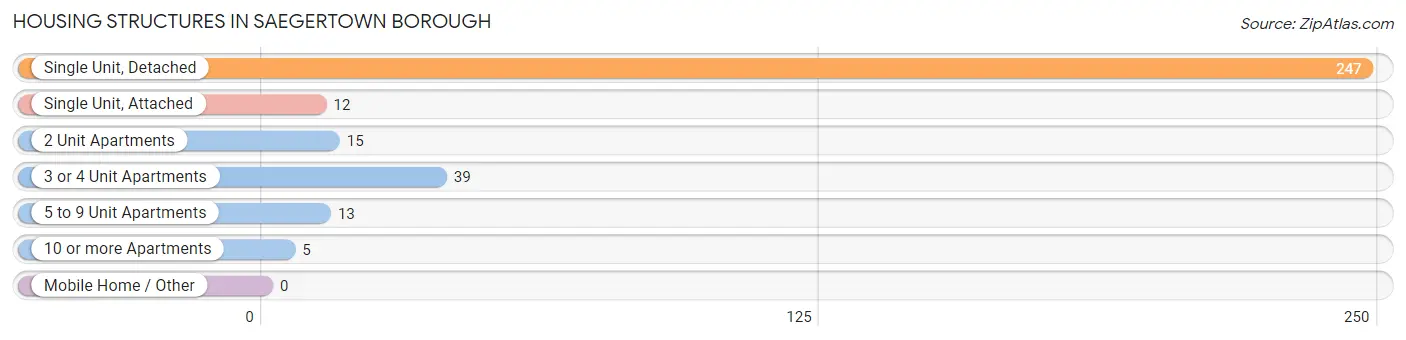
| Structure Type | # Housing Units | % Housing Units |
| Single Unit, Detached | 247 | 74.6% |
| Single Unit, Attached | 12 | 3.6% |
| 2 Unit Apartments | 15 | 4.5% |
| 3 or 4 Unit Apartments | 39 | 11.8% |
| 5 to 9 Unit Apartments | 13 | 3.9% |
| 10 or more Apartments | 5 | 1.5% |
| Mobile Home / Other | 0 | 0.0% |
| Total | 331 | 100.0% |
Housing Structures by Occupancy in Saegertown borough
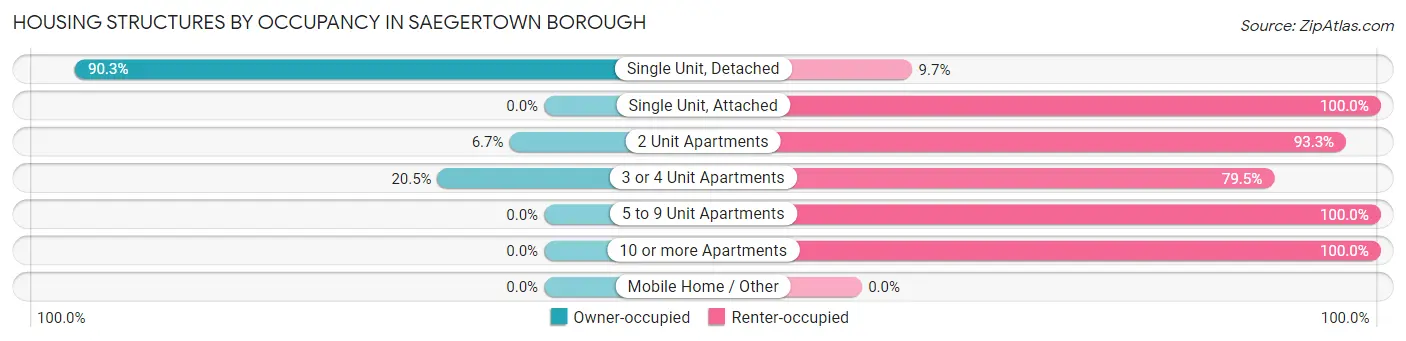
| Structure Type | Owner-occupied | Renter-occupied |
| Single Unit, Detached | 223 (90.3%) | 24 (9.7%) |
| Single Unit, Attached | 0 (0.0%) | 12 (100.0%) |
| 2 Unit Apartments | 1 (6.7%) | 14 (93.3%) |
| 3 or 4 Unit Apartments | 8 (20.5%) | 31 (79.5%) |
| 5 to 9 Unit Apartments | 0 (0.0%) | 13 (100.0%) |
| 10 or more Apartments | 0 (0.0%) | 5 (100.0%) |
| Mobile Home / Other | 0 (0.0%) | 0 (0.0%) |
| Total | 232 (70.1%) | 99 (29.9%) |
Housing Structures by Number of Rooms in Saegertown borough
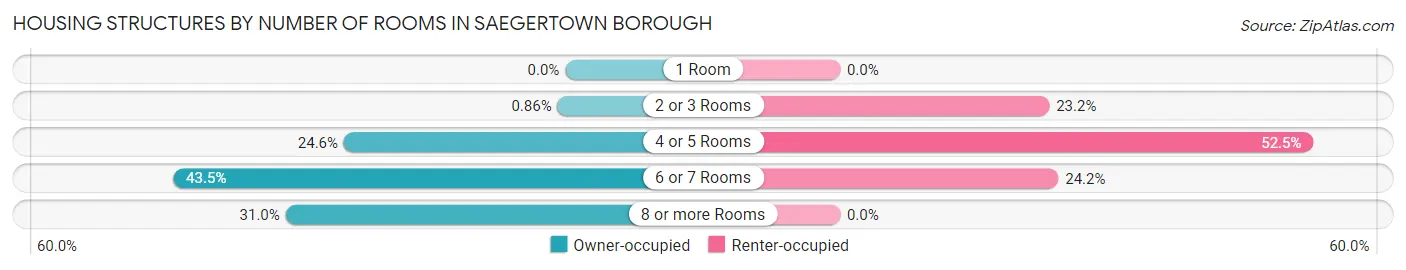
| Number of Rooms | Owner-occupied | Renter-occupied |
| 1 Room | 0 (0.0%) | 0 (0.0%) |
| 2 or 3 Rooms | 2 (0.9%) | 23 (23.2%) |
| 4 or 5 Rooms | 57 (24.6%) | 52 (52.5%) |
| 6 or 7 Rooms | 101 (43.5%) | 24 (24.2%) |
| 8 or more Rooms | 72 (31.0%) | 0 (0.0%) |
| Total | 232 (100.0%) | 99 (100.0%) |
Housing Structure by Heating Type in Saegertown borough

| Heating Type | Owner-occupied | Renter-occupied |
| Utility Gas | 205 (88.4%) | 85 (85.9%) |
| Bottled, Tank, or LP Gas | 0 (0.0%) | 0 (0.0%) |
| Electricity | 27 (11.6%) | 12 (12.1%) |
| Fuel Oil or Kerosene | 0 (0.0%) | 2 (2.0%) |
| Coal or Coke | 0 (0.0%) | 0 (0.0%) |
| All other Fuels | 0 (0.0%) | 0 (0.0%) |
| No Fuel Used | 0 (0.0%) | 0 (0.0%) |
| Total | 232 (100.0%) | 99 (100.0%) |
Household Vehicle Usage in Saegertown borough
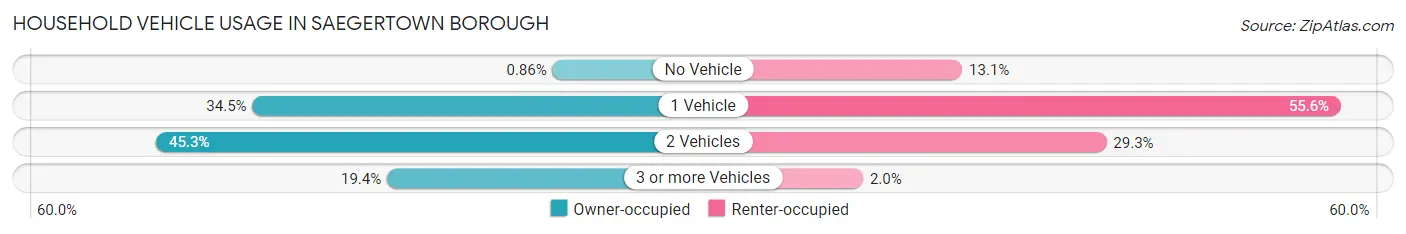
| Vehicles per Household | Owner-occupied | Renter-occupied |
| No Vehicle | 2 (0.9%) | 13 (13.1%) |
| 1 Vehicle | 80 (34.5%) | 55 (55.6%) |
| 2 Vehicles | 105 (45.3%) | 29 (29.3%) |
| 3 or more Vehicles | 45 (19.4%) | 2 (2.0%) |
| Total | 232 (100.0%) | 99 (100.0%) |
Real Estate & Mortgages in Saegertown borough
Real Estate and Mortgage Overview in Saegertown borough
| Characteristic | Without Mortgage | With Mortgage |
| Housing Units | 120 | 112 |
| Median Property Value | $112,500 | $131,800 |
| Median Household Income | $68,125 | $24 |
| Monthly Housing Costs | $450 | $4 |
| Real Estate Taxes | $1,690 | $0 |
Property Value by Mortgage Status in Saegertown borough
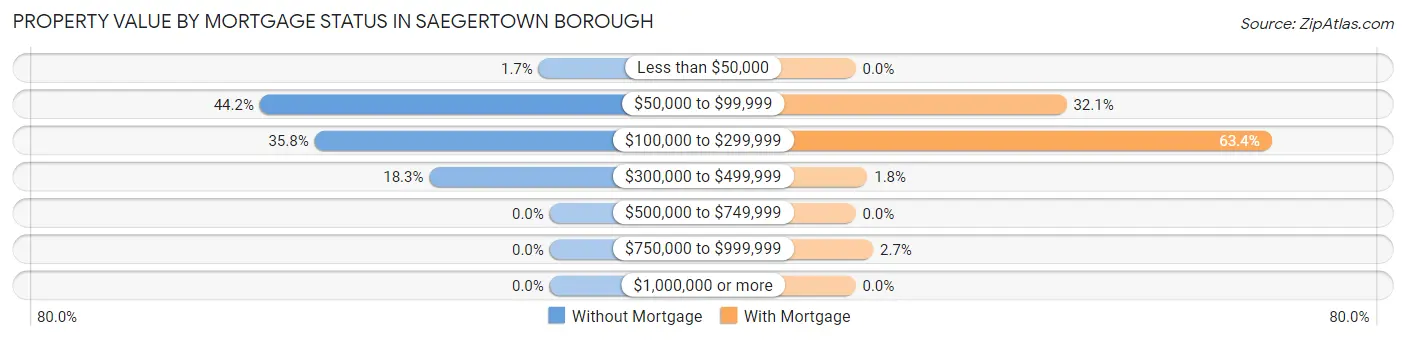
| Property Value | Without Mortgage | With Mortgage |
| Less than $50,000 | 2 (1.7%) | 0 (0.0%) |
| $50,000 to $99,999 | 53 (44.2%) | 36 (32.1%) |
| $100,000 to $299,999 | 43 (35.8%) | 71 (63.4%) |
| $300,000 to $499,999 | 22 (18.3%) | 2 (1.8%) |
| $500,000 to $749,999 | 0 (0.0%) | 0 (0.0%) |
| $750,000 to $999,999 | 0 (0.0%) | 3 (2.7%) |
| $1,000,000 or more | 0 (0.0%) | 0 (0.0%) |
| Total | 120 (100.0%) | 112 (100.0%) |
Household Income by Mortgage Status in Saegertown borough
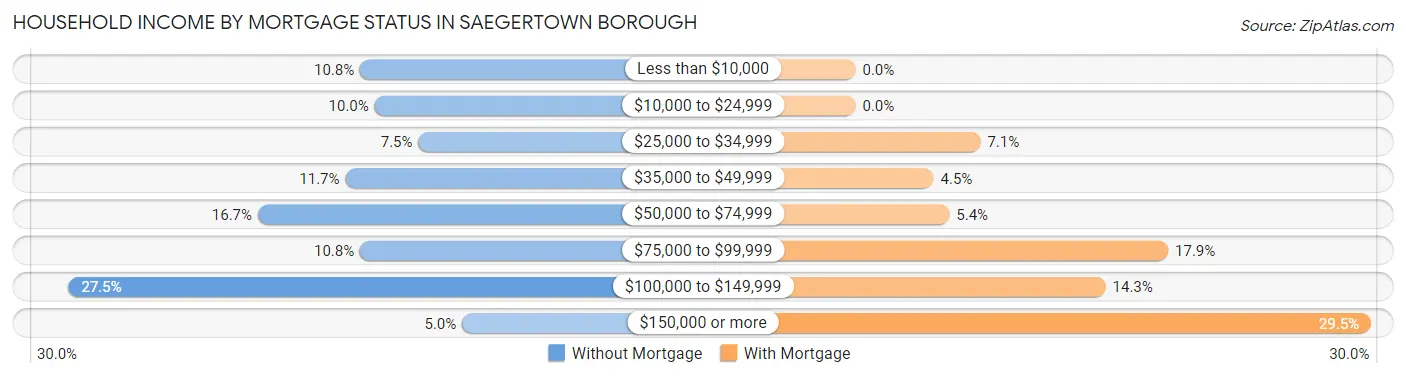
| Household Income | Without Mortgage | With Mortgage |
| Less than $10,000 | 13 (10.8%) | 0 (0.0%) |
| $10,000 to $24,999 | 12 (10.0%) | 0 (0.0%) |
| $25,000 to $34,999 | 9 (7.5%) | 8 (7.1%) |
| $35,000 to $49,999 | 14 (11.7%) | 5 (4.5%) |
| $50,000 to $74,999 | 20 (16.7%) | 6 (5.4%) |
| $75,000 to $99,999 | 13 (10.8%) | 20 (17.9%) |
| $100,000 to $149,999 | 33 (27.5%) | 16 (14.3%) |
| $150,000 or more | 6 (5.0%) | 33 (29.5%) |
| Total | 120 (100.0%) | 112 (100.0%) |
Property Value to Household Income Ratio in Saegertown borough
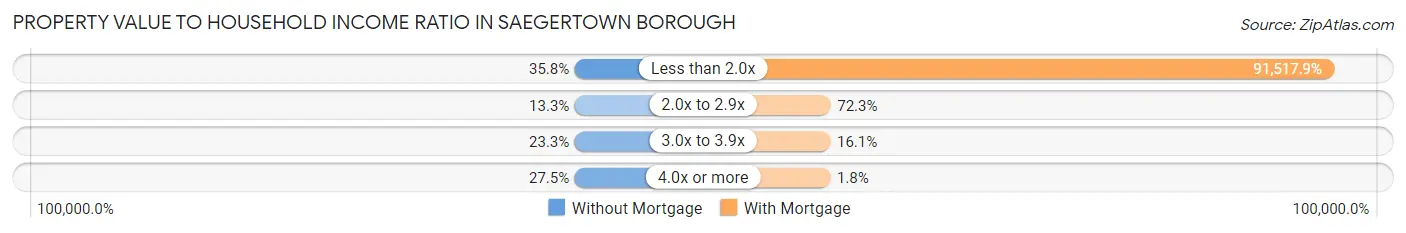
| Value-to-Income Ratio | Without Mortgage | With Mortgage |
| Less than 2.0x | 43 (35.8%) | 102,500 (91,517.9%) |
| 2.0x to 2.9x | 16 (13.3%) | 81 (72.3%) |
| 3.0x to 3.9x | 28 (23.3%) | 18 (16.1%) |
| 4.0x or more | 33 (27.5%) | 2 (1.8%) |
| Total | 120 (100.0%) | 112 (100.0%) |
Real Estate Taxes by Mortgage Status in Saegertown borough
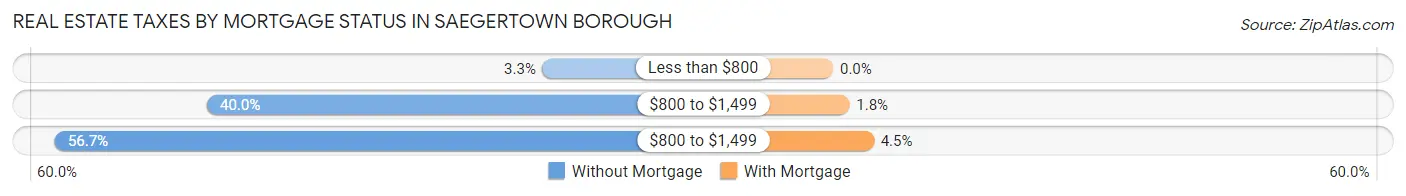
| Property Taxes | Without Mortgage | With Mortgage |
| Less than $800 | 4 (3.3%) | 0 (0.0%) |
| $800 to $1,499 | 48 (40.0%) | 2 (1.8%) |
| $800 to $1,499 | 68 (56.7%) | 5 (4.5%) |
| Total | 120 (100.0%) | 112 (100.0%) |
Health & Disability in Saegertown borough
Health Insurance Coverage by Age in Saegertown borough
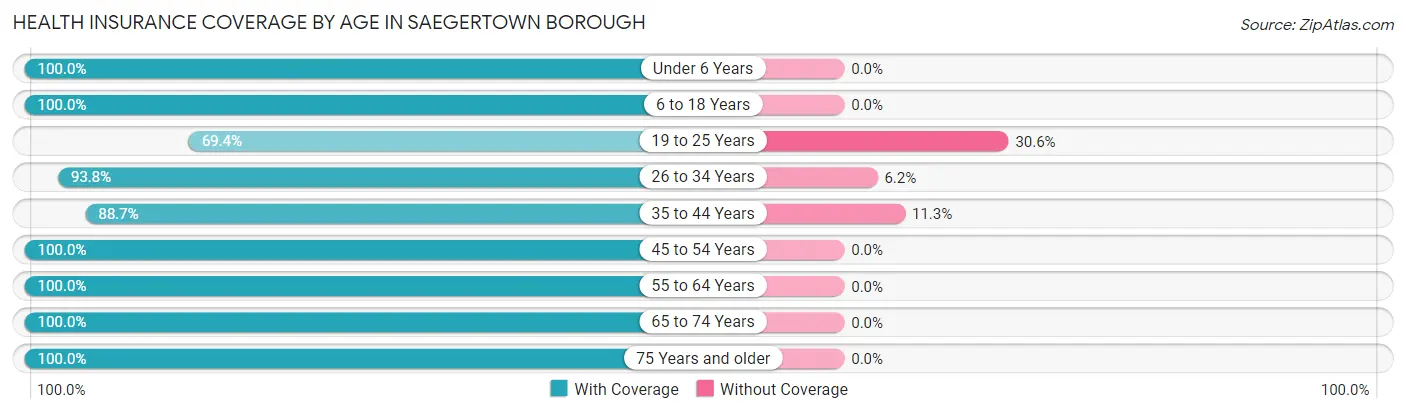
| Age Bracket | With Coverage | Without Coverage |
| Under 6 Years | 44 (100.0%) | 0 (0.0%) |
| 6 to 18 Years | 116 (100.0%) | 0 (0.0%) |
| 19 to 25 Years | 34 (69.4%) | 15 (30.6%) |
| 26 to 34 Years | 106 (93.8%) | 7 (6.2%) |
| 35 to 44 Years | 94 (88.7%) | 12 (11.3%) |
| 45 to 54 Years | 60 (100.0%) | 0 (0.0%) |
| 55 to 64 Years | 106 (100.0%) | 0 (0.0%) |
| 65 to 74 Years | 86 (100.0%) | 0 (0.0%) |
| 75 Years and older | 64 (100.0%) | 0 (0.0%) |
| Total | 710 (95.4%) | 34 (4.6%) |
Health Insurance Coverage by Citizenship Status in Saegertown borough
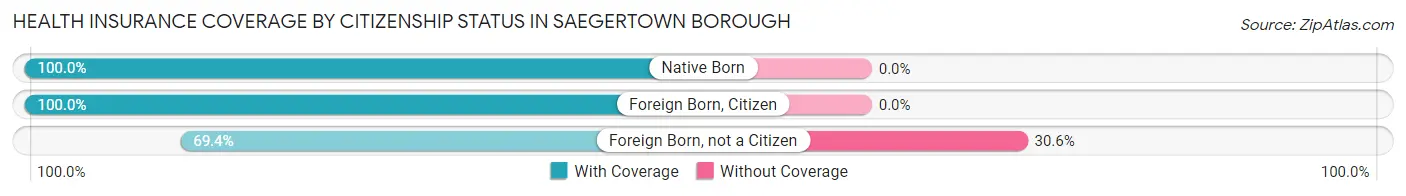
| Citizenship Status | With Coverage | Without Coverage |
| Native Born | 44 (100.0%) | 0 (0.0%) |
| Foreign Born, Citizen | 116 (100.0%) | 0 (0.0%) |
| Foreign Born, not a Citizen | 34 (69.4%) | 15 (30.6%) |
Health Insurance Coverage by Household Income in Saegertown borough
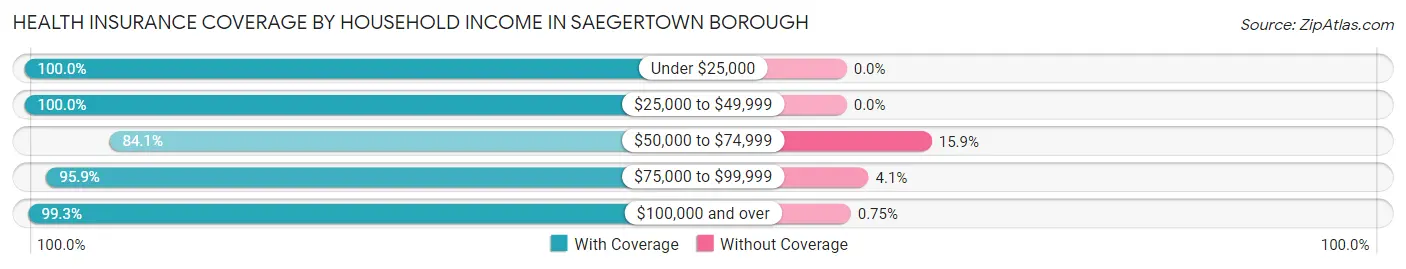
| Household Income | With Coverage | Without Coverage |
| Under $25,000 | 51 (100.0%) | 0 (0.0%) |
| $25,000 to $49,999 | 100 (100.0%) | 0 (0.0%) |
| $50,000 to $74,999 | 132 (84.1%) | 25 (15.9%) |
| $75,000 to $99,999 | 164 (95.9%) | 7 (4.1%) |
| $100,000 and over | 263 (99.3%) | 2 (0.7%) |
Public vs Private Health Insurance Coverage by Age in Saegertown borough
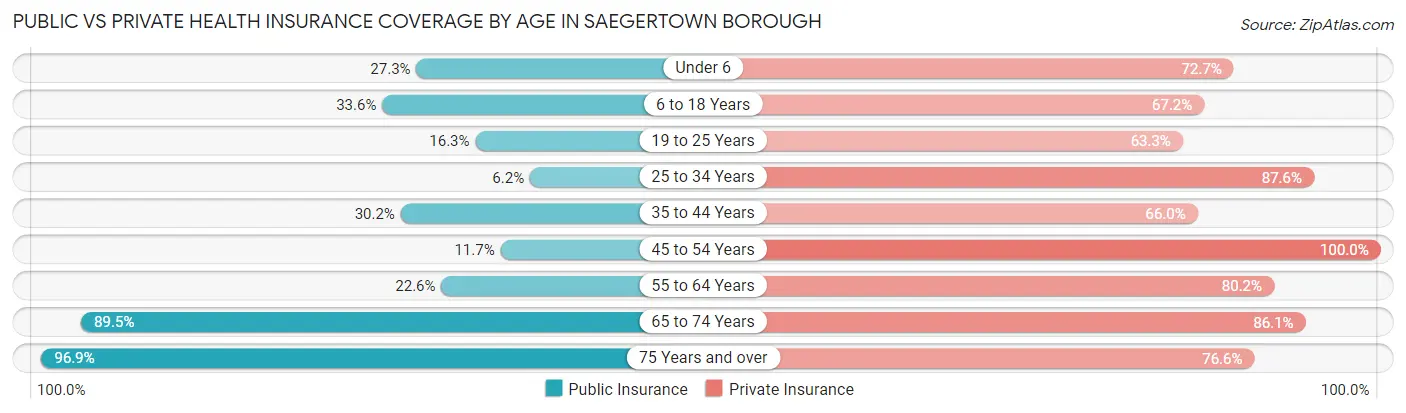
| Age Bracket | Public Insurance | Private Insurance |
| Under 6 | 12 (27.3%) | 32 (72.7%) |
| 6 to 18 Years | 39 (33.6%) | 78 (67.2%) |
| 19 to 25 Years | 8 (16.3%) | 31 (63.3%) |
| 25 to 34 Years | 7 (6.2%) | 99 (87.6%) |
| 35 to 44 Years | 32 (30.2%) | 70 (66.0%) |
| 45 to 54 Years | 7 (11.7%) | 60 (100.0%) |
| 55 to 64 Years | 24 (22.6%) | 85 (80.2%) |
| 65 to 74 Years | 77 (89.5%) | 74 (86.1%) |
| 75 Years and over | 62 (96.9%) | 49 (76.6%) |
| Total | 268 (36.0%) | 578 (77.7%) |
Disability Status by Sex by Age in Saegertown borough
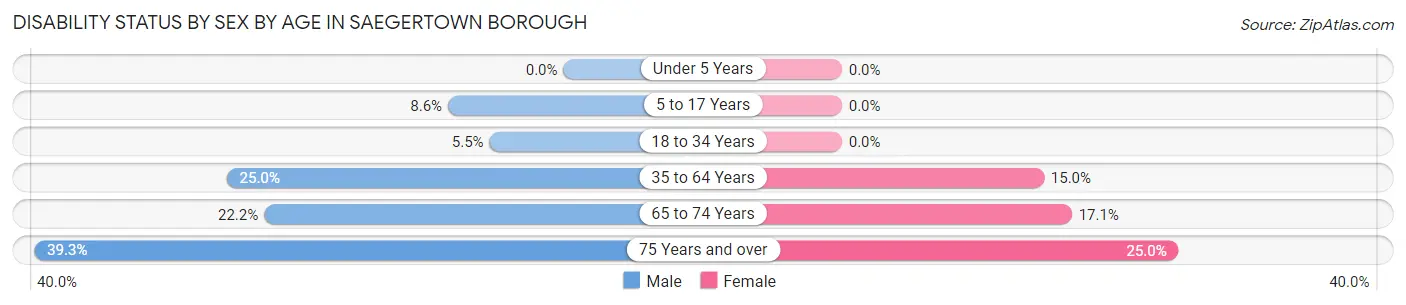
| Age Bracket | Male | Female |
| Under 5 Years | 0 (0.0%) | 0 (0.0%) |
| 5 to 17 Years | 6 (8.6%) | 0 (0.0%) |
| 18 to 34 Years | 5 (5.5%) | 0 (0.0%) |
| 35 to 64 Years | 33 (25.0%) | 21 (15.0%) |
| 65 to 74 Years | 10 (22.2%) | 7 (17.1%) |
| 75 Years and over | 11 (39.3%) | 9 (25.0%) |
Disability Class by Sex by Age in Saegertown borough
Disability Class: Hearing Difficulty
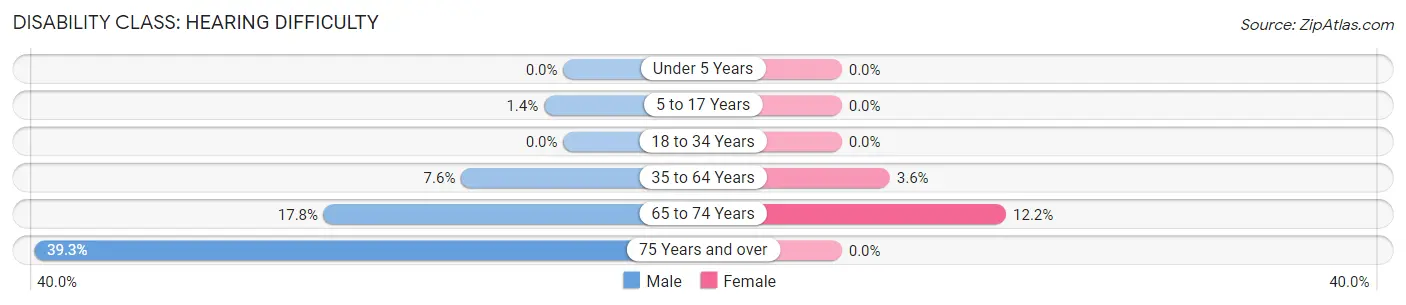
| Age Bracket | Male | Female |
| Under 5 Years | 0 (0.0%) | 0 (0.0%) |
| 5 to 17 Years | 1 (1.4%) | 0 (0.0%) |
| 18 to 34 Years | 0 (0.0%) | 0 (0.0%) |
| 35 to 64 Years | 10 (7.6%) | 5 (3.6%) |
| 65 to 74 Years | 8 (17.8%) | 5 (12.2%) |
| 75 Years and over | 11 (39.3%) | 0 (0.0%) |
Disability Class: Vision Difficulty
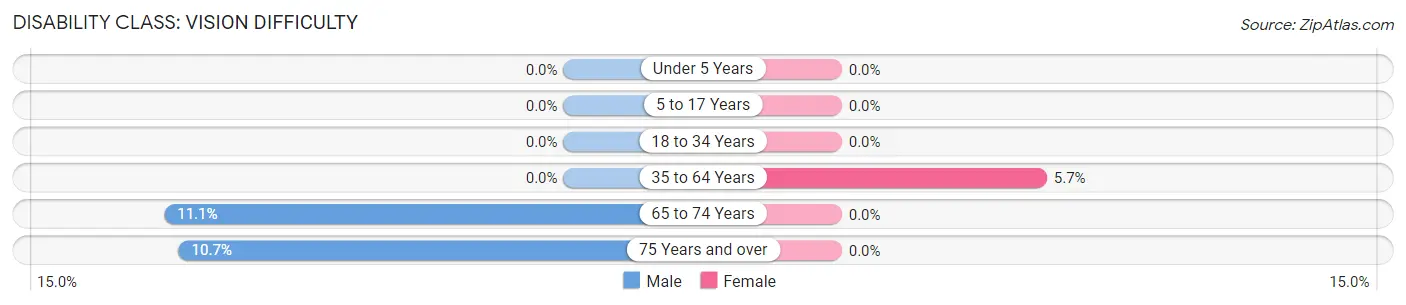
| Age Bracket | Male | Female |
| Under 5 Years | 0 (0.0%) | 0 (0.0%) |
| 5 to 17 Years | 0 (0.0%) | 0 (0.0%) |
| 18 to 34 Years | 0 (0.0%) | 0 (0.0%) |
| 35 to 64 Years | 0 (0.0%) | 8 (5.7%) |
| 65 to 74 Years | 5 (11.1%) | 0 (0.0%) |
| 75 Years and over | 3 (10.7%) | 0 (0.0%) |
Disability Class: Cognitive Difficulty
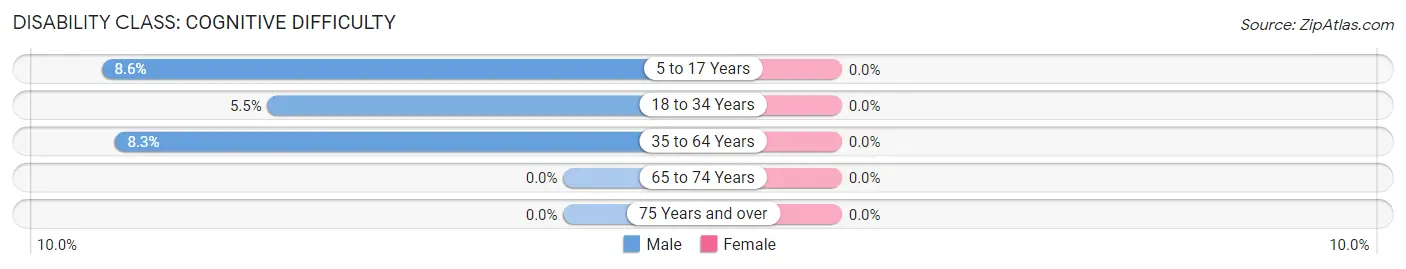
| Age Bracket | Male | Female |
| 5 to 17 Years | 6 (8.6%) | 0 (0.0%) |
| 18 to 34 Years | 5 (5.5%) | 0 (0.0%) |
| 35 to 64 Years | 11 (8.3%) | 0 (0.0%) |
| 65 to 74 Years | 0 (0.0%) | 0 (0.0%) |
| 75 Years and over | 0 (0.0%) | 0 (0.0%) |
Disability Class: Ambulatory Difficulty
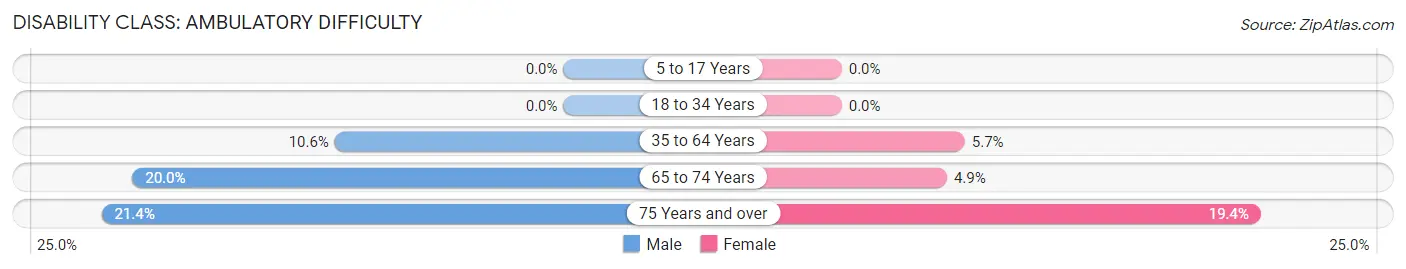
| Age Bracket | Male | Female |
| 5 to 17 Years | 0 (0.0%) | 0 (0.0%) |
| 18 to 34 Years | 0 (0.0%) | 0 (0.0%) |
| 35 to 64 Years | 14 (10.6%) | 8 (5.7%) |
| 65 to 74 Years | 9 (20.0%) | 2 (4.9%) |
| 75 Years and over | 6 (21.4%) | 7 (19.4%) |
Disability Class: Self-Care Difficulty
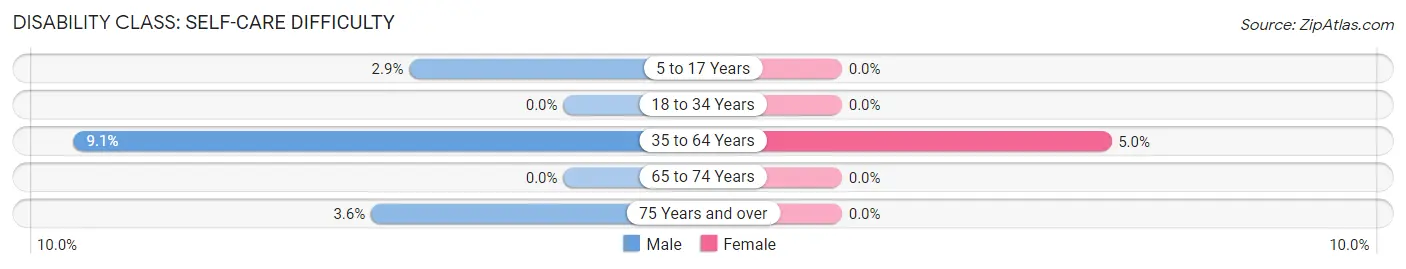
| Age Bracket | Male | Female |
| 5 to 17 Years | 2 (2.9%) | 0 (0.0%) |
| 18 to 34 Years | 0 (0.0%) | 0 (0.0%) |
| 35 to 64 Years | 12 (9.1%) | 7 (5.0%) |
| 65 to 74 Years | 0 (0.0%) | 0 (0.0%) |
| 75 Years and over | 1 (3.6%) | 0 (0.0%) |
Technology Access in Saegertown borough
Computing Device Access in Saegertown borough
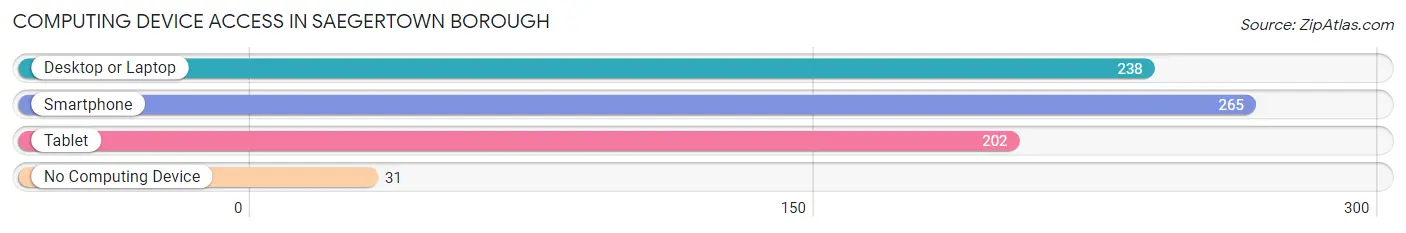
| Device Type | # Households | % Households |
| Desktop or Laptop | 238 | 71.9% |
| Smartphone | 265 | 80.1% |
| Tablet | 202 | 61.0% |
| No Computing Device | 31 | 9.4% |
| Total | 331 | 100.0% |
Internet Access in Saegertown borough
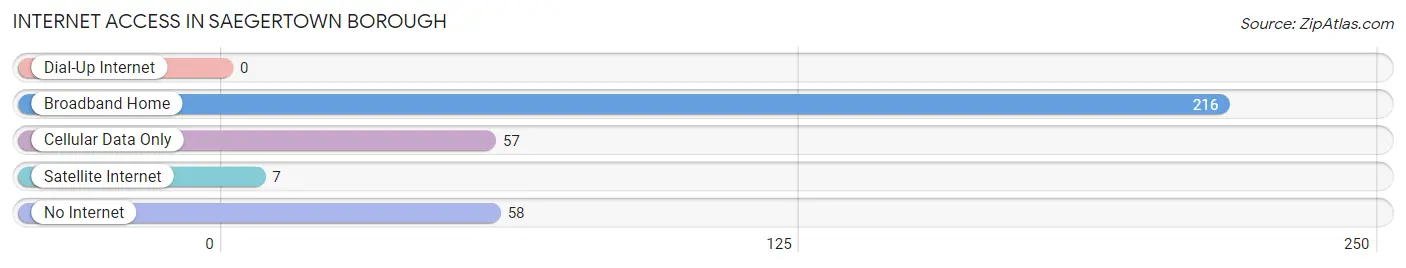
| Internet Type | # Households | % Households |
| Dial-Up Internet | 0 | 0.0% |
| Broadband Home | 216 | 65.3% |
| Cellular Data Only | 57 | 17.2% |
| Satellite Internet | 7 | 2.1% |
| No Internet | 58 | 17.5% |
| Total | 331 | 100.0% |
Saegertown borough Summary
Saegertown Borough is a small borough located in Crawford County, Pennsylvania. It is situated in the northwestern corner of the state, approximately 30 miles south of Erie. The borough is home to approximately 1,400 people and covers an area of 0.6 square miles.
History
The area that is now Saegertown Borough was first settled in the early 1800s by German immigrants. The town was originally known as “Sager’s Town” after the first settler, John Sager. In 1845, the town was officially incorporated as Saegertown Borough.
The town grew slowly but steadily throughout the 19th century. In the early 20th century, the town experienced a period of rapid growth as the population increased from 1,000 in 1900 to 1,400 in 1920. This growth was largely due to the influx of immigrants from Europe, particularly from Poland and Italy.
The town’s economy was largely based on agriculture and small-scale manufacturing. In the early 20th century, the town was home to several small factories, including a furniture factory, a canning factory, and a brickyard.
Geography
Saegertown Borough is located in the northwestern corner of Crawford County, Pennsylvania. It is situated approximately 30 miles south of Erie and is bordered by the townships of Hayfield, Rome, and Sparta. The borough is located in a rural area and is surrounded by rolling hills and farmland.
The borough is located in the Allegheny Plateau region of Pennsylvania and is part of the Lake Erie watershed. The borough is drained by several small creeks, including French Creek, which flows through the center of town.
Economy
The economy of Saegertown Borough is largely based on agriculture and small-scale manufacturing. The town is home to several small businesses, including a furniture factory, a canning factory, and a brickyard.
The town is also home to several small retail stores, including a grocery store, a hardware store, and a pharmacy. The town is also home to several restaurants, including a pizza shop, a diner, and a Mexican restaurant.
Demographics
As of the 2010 census, the population of Saegertown Borough was 1,400. The racial makeup of the borough was 97.4% White, 0.7% African American, 0.3% Native American, 0.3% Asian, and 1.3% from other races. Hispanic or Latino of any race were 1.3% of the population.
The median household income in Saegertown Borough was $37,500, and the median family income was $45,000. The per capita income was $18,000. About 11.3% of families and 14.3% of the population were below the poverty line, including 18.2% of those under age 18 and 8.3% of those age 65 or over.
Conclusion
Saegertown Borough is a small borough located in Crawford County, Pennsylvania. It is situated in the northwestern corner of the state, approximately 30 miles south of Erie. The borough is home to approximately 1,400 people and covers an area of 0.6 square miles. The town’s economy is largely based on agriculture and small-scale manufacturing, and the population is predominantly white. The median household income in Saegertown Borough is $37,500, and the median family income is $45,000.
Common Questions
What is Per Capita Income in Saegertown borough?
Per Capita income in Saegertown borough is $27,069.
What is the Median Family Income in Saegertown borough?
Median Family Income in Saegertown borough is $75,795.
What is the Median Household income in Saegertown borough?
Median Household Income in Saegertown borough is $70,250.
What is Income or Wage Gap in Saegertown borough?
Income or Wage Gap in Saegertown borough is 0.2%.
Women in Saegertown borough earn 99.8 cents for every dollar earned by a man.
What is Inequality or Gini Index in Saegertown borough?
Inequality or Gini Index in Saegertown borough is 0.36.
What is the Total Population of Saegertown borough?
Total Population of Saegertown borough is 967.
What is the Total Male Population of Saegertown borough?
Total Male Population of Saegertown borough is 550.
What is the Total Female Population of Saegertown borough?
Total Female Population of Saegertown borough is 417.
What is the Ratio of Males per 100 Females in Saegertown borough?
There are 131.89 Males per 100 Females in Saegertown borough.
What is the Ratio of Females per 100 Males in Saegertown borough?
There are 75.82 Females per 100 Males in Saegertown borough.
What is the Median Population Age in Saegertown borough?
Median Population Age in Saegertown borough is 36.0 Years.
What is the Average Family Size in Saegertown borough
Average Family Size in Saegertown borough is 2.7 People.
What is the Average Household Size in Saegertown borough
Average Household Size in Saegertown borough is 2.2 People.
How Large is the Labor Force in Saegertown borough?
There are 433 People in the Labor Forcein in Saegertown borough.
What is the Percentage of People in the Labor Force in Saegertown borough?
53.6% of People are in the Labor Force in Saegertown borough.
What is the Unemployment Rate in Saegertown borough?
Unemployment Rate in Saegertown borough is 0.9%.