Madison borough, PA Map & Demographics
Madison borough Overview
$34,736
PER CAPITA INCOME
$97,500
AVG FAMILY INCOME
$70,000
AVG HOUSEHOLD INCOME
0.37
INEQUALITY / GINI INDEX
363
TOTAL POPULATION
174
MALE POPULATION
189
FEMALE POPULATION
92.06
MALES / 100 FEMALES
108.62
FEMALES / 100 MALES
43.1
MEDIAN AGE
2.7
AVG FAMILY SIZE
2.2
AVG HOUSEHOLD SIZE
180
LABOR FORCE [ PEOPLE ]
64.1%
PERCENT IN LABOR FORCE
Income in Madison borough
Income Overview in Madison borough
Per Capita Income in Madison borough is $34,736, while median incomes of families and households are $97,500 and $70,000 respectively.
| Characteristic | Number | Measure |
| Per Capita Income | 363 | $34,736 |
| Median Family Income | 118 | $97,500 |
| Mean Family Income | 118 | $100,311 |
| Median Household Income | 164 | $70,000 |
| Mean Household Income | 164 | $85,312 |
| Income Deficit | 118 | $0 |
| Wage / Income Gap (%) | 363 | 0.00% |
| Wage / Income Gap ($) | 363 | 100.00¢ per $1 |
| Gini / Inequality Index | 363 | 0.37 |
Earnings by Sex in Madison borough
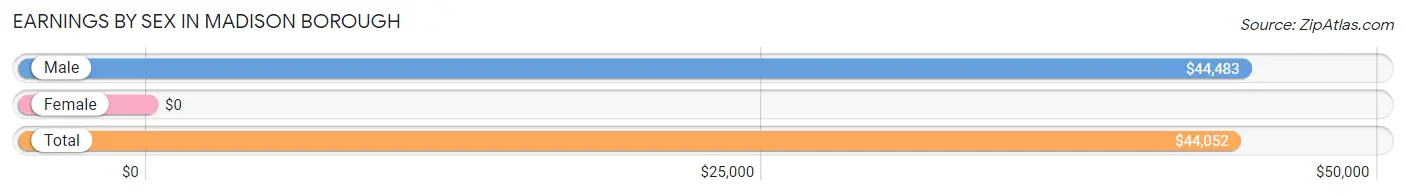
| Sex | Number | Average Earnings |
| Male | 94 (50.5%) | $44,483 |
| Female | 92 (49.5%) | $0 |
| Total | 186 (100.0%) | $44,052 |
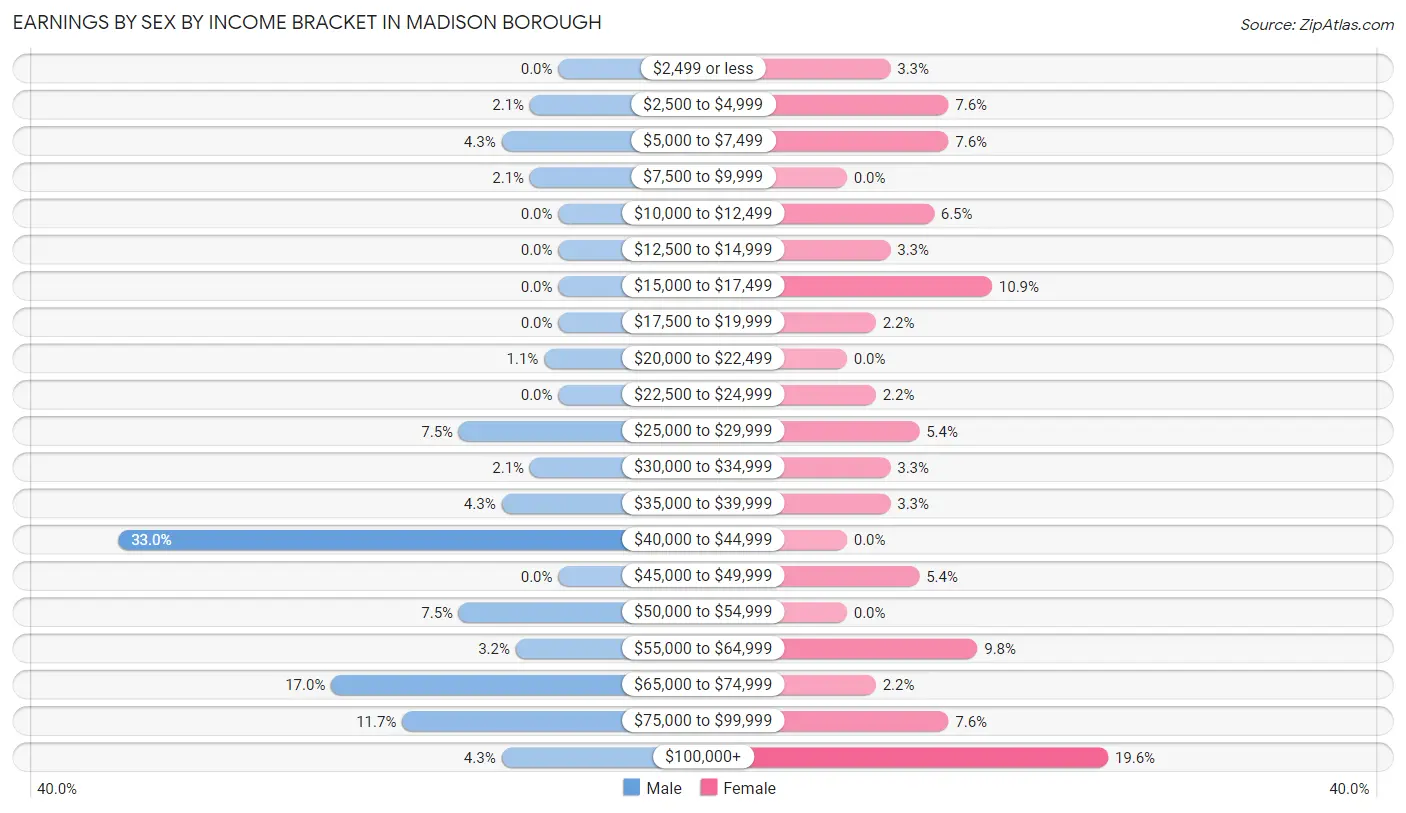
Earnings by Sex by Income Bracket in Madison borough
The most common earnings brackets in Madison borough are $40,000 to $44,999 for men (31 | 33.0%) and $100,000+ for women (18 | 19.6%).
| Income | Male | Female |
| $2,499 or less | 0 (0.0%) | 3 (3.3%) |
| $2,500 to $4,999 | 2 (2.1%) | 7 (7.6%) |
| $5,000 to $7,499 | 4 (4.3%) | 7 (7.6%) |
| $7,500 to $9,999 | 2 (2.1%) | 0 (0.0%) |
| $10,000 to $12,499 | 0 (0.0%) | 6 (6.5%) |
| $12,500 to $14,999 | 0 (0.0%) | 3 (3.3%) |
| $15,000 to $17,499 | 0 (0.0%) | 10 (10.9%) |
| $17,500 to $19,999 | 0 (0.0%) | 2 (2.2%) |
| $20,000 to $22,499 | 1 (1.1%) | 0 (0.0%) |
| $22,500 to $24,999 | 0 (0.0%) | 2 (2.2%) |
| $25,000 to $29,999 | 7 (7.4%) | 5 (5.4%) |
| $30,000 to $34,999 | 2 (2.1%) | 3 (3.3%) |
| $35,000 to $39,999 | 4 (4.3%) | 3 (3.3%) |
| $40,000 to $44,999 | 31 (33.0%) | 0 (0.0%) |
| $45,000 to $49,999 | 0 (0.0%) | 5 (5.4%) |
| $50,000 to $54,999 | 7 (7.4%) | 0 (0.0%) |
| $55,000 to $64,999 | 3 (3.2%) | 9 (9.8%) |
| $65,000 to $74,999 | 16 (17.0%) | 2 (2.2%) |
| $75,000 to $99,999 | 11 (11.7%) | 7 (7.6%) |
| $100,000+ | 4 (4.3%) | 18 (19.6%) |
| Total | 94 (100.0%) | 92 (100.0%) |
Earnings by Sex by Educational Attainment in Madison borough
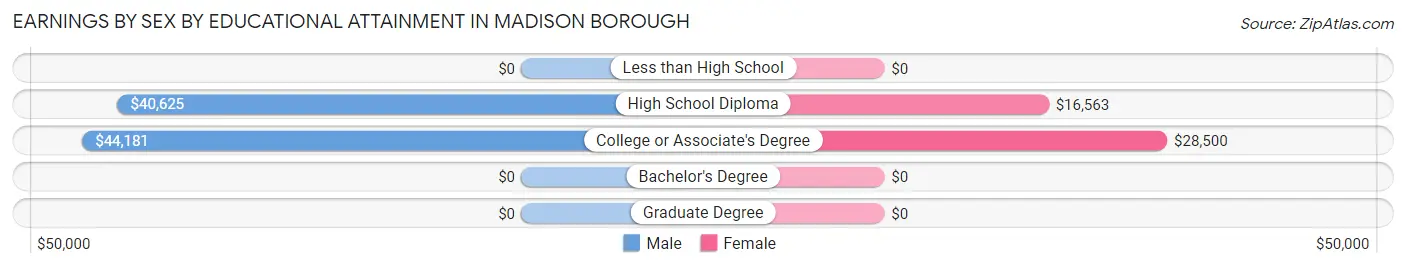
| Educational Attainment | Male Income | Female Income |
| Less than High School | - | - |
| High School Diploma | $40,625 | $16,563 |
| College or Associate's Degree | $44,181 | $28,500 |
| Bachelor's Degree | - | - |
| Graduate Degree | - | - |
| Total | $44,483 | $0 |
Family Income in Madison borough
Family Income Brackets in Madison borough
According to the Madison borough family income data, there are 34 families falling into the $150,000 to $199,999 income range, which is the most common income bracket and makes up 28.8% of all families.
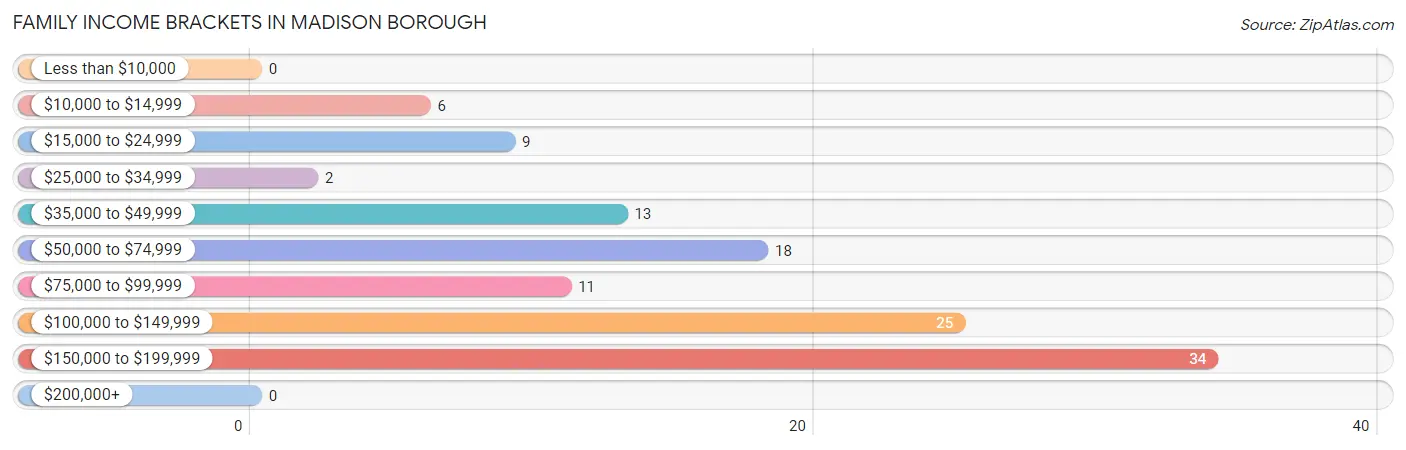
| Income Bracket | # Families | % Families |
| Less than $10,000 | 0 | 0.0% |
| $10,000 to $14,999 | 6 | 5.1% |
| $15,000 to $24,999 | 9 | 7.6% |
| $25,000 to $34,999 | 2 | 1.7% |
| $35,000 to $49,999 | 13 | 11.0% |
| $50,000 to $74,999 | 18 | 15.3% |
| $75,000 to $99,999 | 11 | 9.3% |
| $100,000 to $149,999 | 25 | 21.2% |
| $150,000 to $199,999 | 34 | 28.8% |
| $200,000+ | 0 | 0.0% |
Family Income by Famaliy Size in Madison borough
4-person families (45 | 38.1%) account for the highest median family income in Madison borough with $168,060 per family, while 4-person families (45 | 38.1%) have the highest median income of $42,015 per family member.
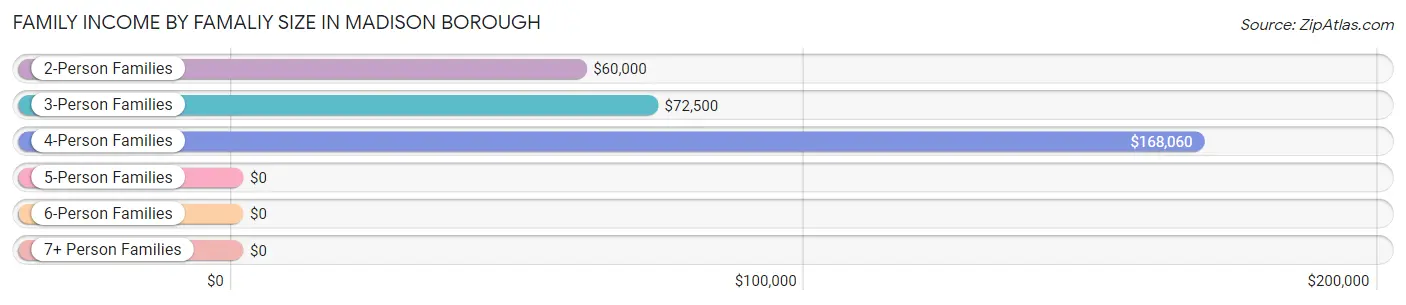
| Income Bracket | # Families | Median Income |
| 2-Person Families | 60 (50.8%) | $60,000 |
| 3-Person Families | 12 (10.2%) | $72,500 |
| 4-Person Families | 45 (38.1%) | $168,060 |
| 5-Person Families | 0 (0.0%) | $0 |
| 6-Person Families | 1 (0.9%) | $0 |
| 7+ Person Families | 0 (0.0%) | $0 |
| Total | 118 (100.0%) | $97,500 |
Family Income by Number of Earners in Madison borough
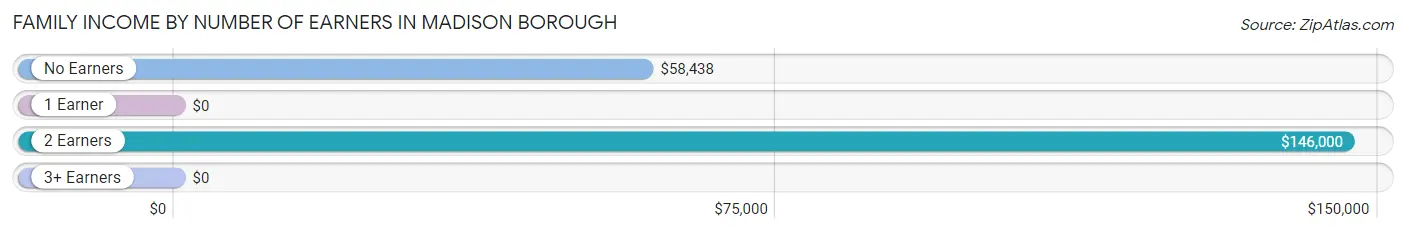
| Number of Earners | # Families | Median Income |
| No Earners | 17 (14.4%) | $58,438 |
| 1 Earner | 23 (19.5%) | $0 |
| 2 Earners | 76 (64.4%) | $146,000 |
| 3+ Earners | 2 (1.7%) | $0 |
| Total | 118 (100.0%) | $97,500 |
Household Income in Madison borough
Household Income Brackets in Madison borough
With 34 households falling in the category, the $150,000 to $199,999 income range is the most frequent in Madison borough, accounting for 20.7% of all households.
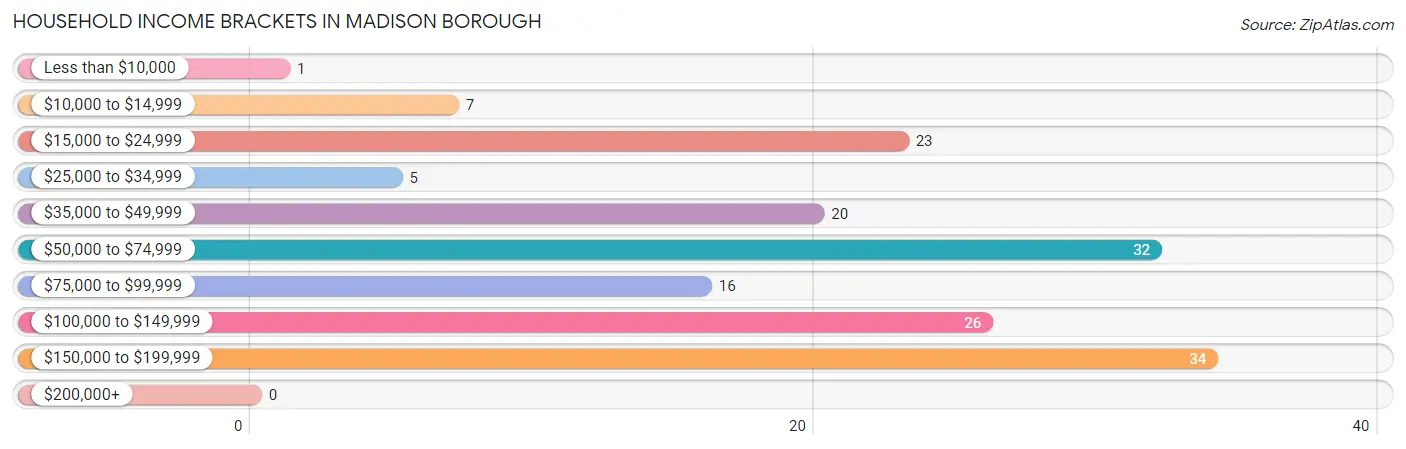
| Income Bracket | # Households | % Households |
| Less than $10,000 | 1 | 0.6% |
| $10,000 to $14,999 | 7 | 4.3% |
| $15,000 to $24,999 | 23 | 14.0% |
| $25,000 to $34,999 | 5 | 3.0% |
| $35,000 to $49,999 | 20 | 12.2% |
| $50,000 to $74,999 | 32 | 19.5% |
| $75,000 to $99,999 | 16 | 9.8% |
| $100,000 to $149,999 | 26 | 15.9% |
| $150,000 to $199,999 | 34 | 20.7% |
| $200,000+ | 0 | 0.0% |
Household Income by Householder Age in Madison borough
The median household income in Madison borough is $70,000, with the highest median household income of $167,586 found in the 25 to 44 years age bracket for the primary householder. A total of 56 households (34.2%) fall into this category.
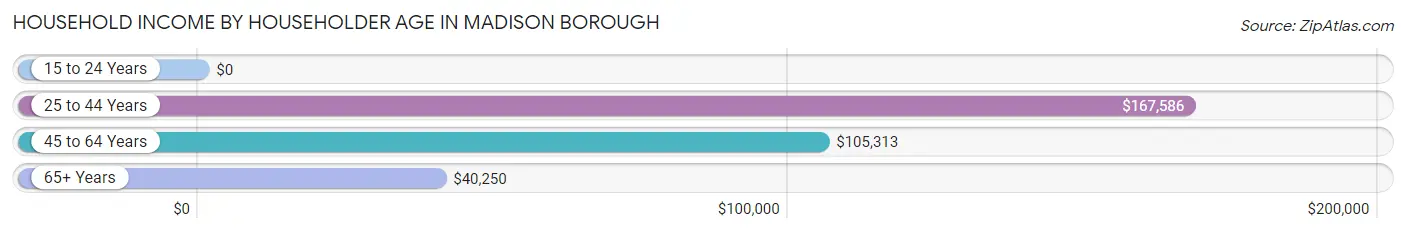
| Income Bracket | # Households | Median Income |
| 15 to 24 Years | 0 (0.0%) | $0 |
| 25 to 44 Years | 56 (34.2%) | $167,586 |
| 45 to 64 Years | 51 (31.1%) | $105,313 |
| 65+ Years | 57 (34.8%) | $40,250 |
| Total | 164 (100.0%) | $70,000 |
Poverty in Madison borough
Income Below Poverty by Sex and Age in Madison borough
With 3.5% poverty level for males and 10.1% for females among the residents of Madison borough, under 5 year old males and 12 to 14 year old females are the most vulnerable to poverty, with 3 males (60.0%) and 2 females (50.0%) in their respective age groups living below the poverty level.
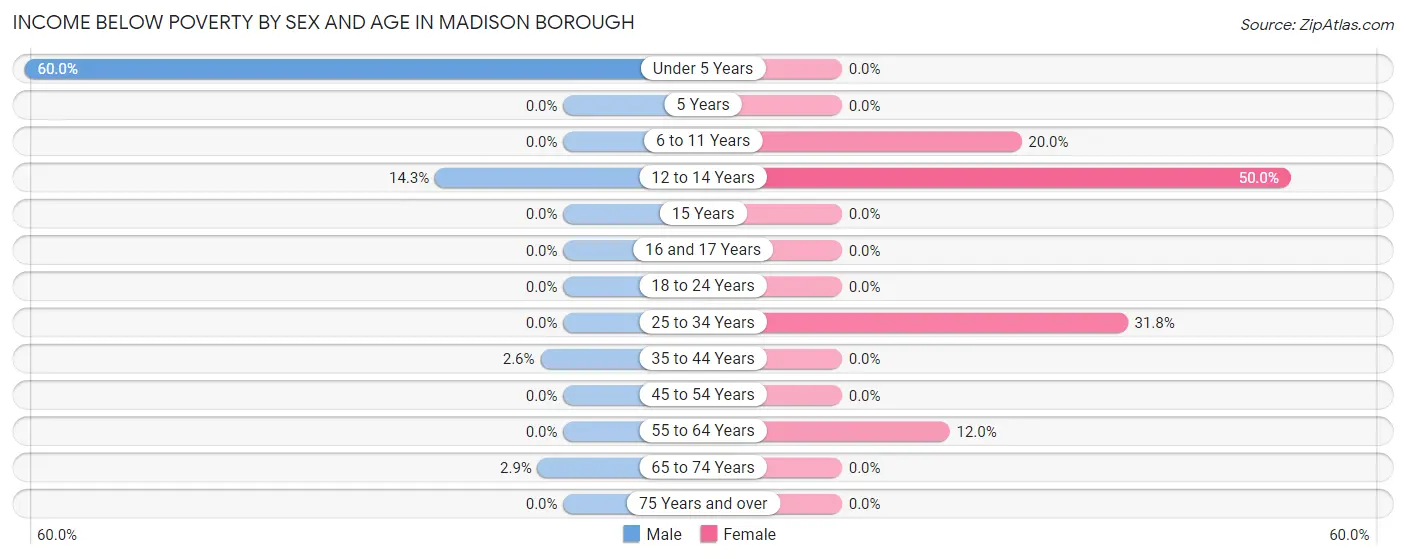
| Age Bracket | Male | Female |
| Under 5 Years | 3 (60.0%) | 0 (0.0%) |
| 5 Years | 0 (0.0%) | 0 (0.0%) |
| 6 to 11 Years | 0 (0.0%) | 7 (20.0%) |
| 12 to 14 Years | 1 (14.3%) | 2 (50.0%) |
| 15 Years | 0 (0.0%) | 0 (0.0%) |
| 16 and 17 Years | 0 (0.0%) | 0 (0.0%) |
| 18 to 24 Years | 0 (0.0%) | 0 (0.0%) |
| 25 to 34 Years | 0 (0.0%) | 7 (31.8%) |
| 35 to 44 Years | 1 (2.6%) | 0 (0.0%) |
| 45 to 54 Years | 0 (0.0%) | 0 (0.0%) |
| 55 to 64 Years | 0 (0.0%) | 3 (12.0%) |
| 65 to 74 Years | 1 (2.9%) | 0 (0.0%) |
| 75 Years and over | 0 (0.0%) | 0 (0.0%) |
| Total | 6 (3.5%) | 19 (10.1%) |
Income Above Poverty by Sex and Age in Madison borough
According to the poverty statistics in Madison borough, males aged 6 to 11 years and females aged under 5 years are the age groups that are most secure financially, with 100.0% of males and 100.0% of females in these age groups living above the poverty line.
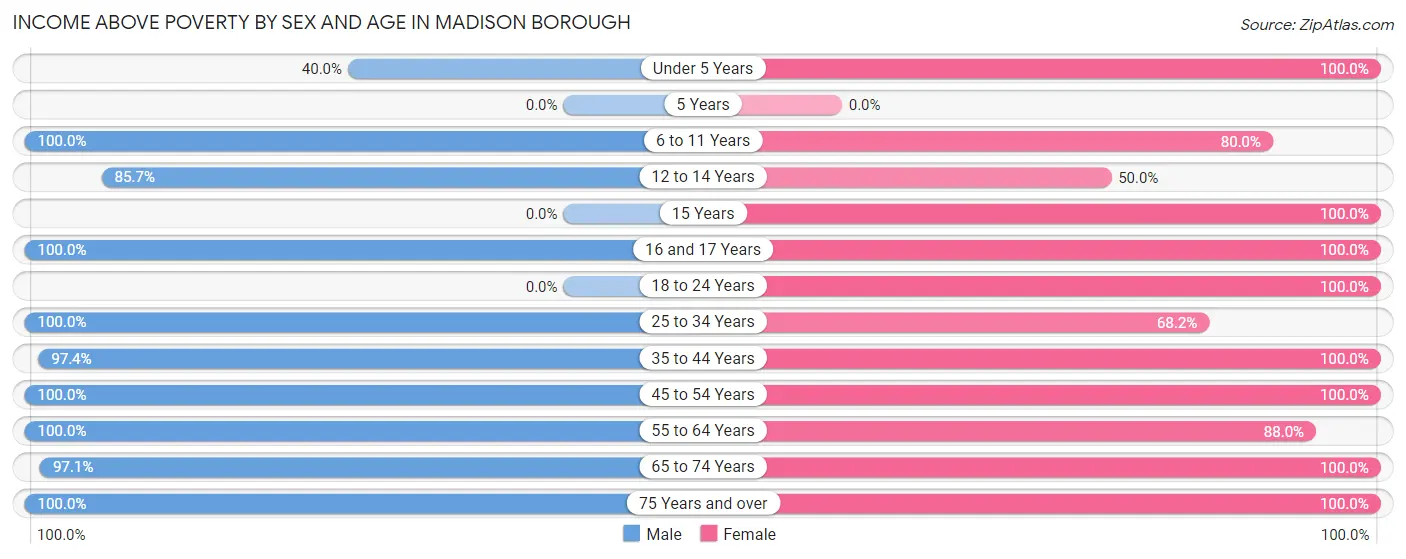
| Age Bracket | Male | Female |
| Under 5 Years | 2 (40.0%) | 6 (100.0%) |
| 5 Years | 0 (0.0%) | 0 (0.0%) |
| 6 to 11 Years | 23 (100.0%) | 28 (80.0%) |
| 12 to 14 Years | 6 (85.7%) | 2 (50.0%) |
| 15 Years | 0 (0.0%) | 2 (100.0%) |
| 16 and 17 Years | 2 (100.0%) | 1 (100.0%) |
| 18 to 24 Years | 0 (0.0%) | 4 (100.0%) |
| 25 to 34 Years | 17 (100.0%) | 15 (68.2%) |
| 35 to 44 Years | 38 (97.4%) | 24 (100.0%) |
| 45 to 54 Years | 19 (100.0%) | 16 (100.0%) |
| 55 to 64 Years | 26 (100.0%) | 22 (88.0%) |
| 65 to 74 Years | 34 (97.1%) | 36 (100.0%) |
| 75 Years and over | 1 (100.0%) | 14 (100.0%) |
| Total | 168 (96.6%) | 170 (89.9%) |
Income Below Poverty Among Married-Couple Families in Madison borough
The poverty statistics for married-couple families in Madison borough show that 0.9% or 1 of the total 105 families live below the poverty line. Families with 3 or 4 children have the highest poverty rate of 100.0%, comprising of 1 families. On the other hand, families with no children have the lowest poverty rate of 0.0%, which includes 0 families.
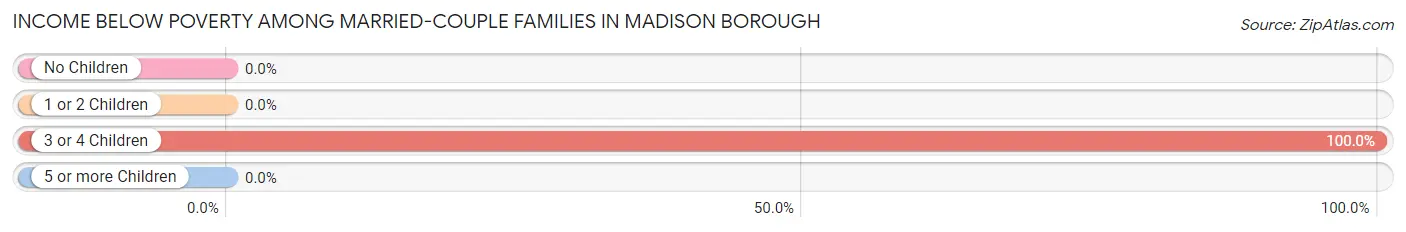
| Children | Above Poverty | Below Poverty |
| No Children | 53 (100.0%) | 0 (0.0%) |
| 1 or 2 Children | 51 (100.0%) | 0 (0.0%) |
| 3 or 4 Children | 0 (0.0%) | 1 (100.0%) |
| 5 or more Children | 0 (0.0%) | 0 (0.0%) |
| Total | 104 (99.1%) | 1 (0.9%) |
Income Below Poverty Among Single-Parent Households in Madison borough
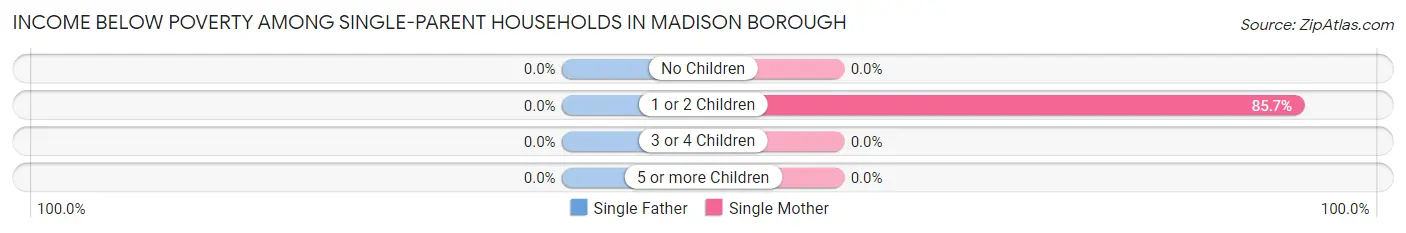
| Children | Single Father | Single Mother |
| No Children | 0 (0.0%) | 0 (0.0%) |
| 1 or 2 Children | 0 (0.0%) | 6 (85.7%) |
| 3 or 4 Children | 0 (0.0%) | 0 (0.0%) |
| 5 or more Children | 0 (0.0%) | 0 (0.0%) |
| Total | 0 (0.0%) | 6 (46.2%) |
Income Below Poverty Among Married-Couple vs Single-Parent Households in Madison borough
The poverty data for Madison borough shows that 1 of the married-couple family households (0.9%) and 6 of the single-parent households (46.2%) are living below the poverty level. Within the married-couple family households, those with 3 or 4 children have the highest poverty rate, with 1 households (100.0%) falling below the poverty line. Among the single-parent households, those with 1 or 2 children have the highest poverty rate, with 6 household (85.7%) living below poverty.
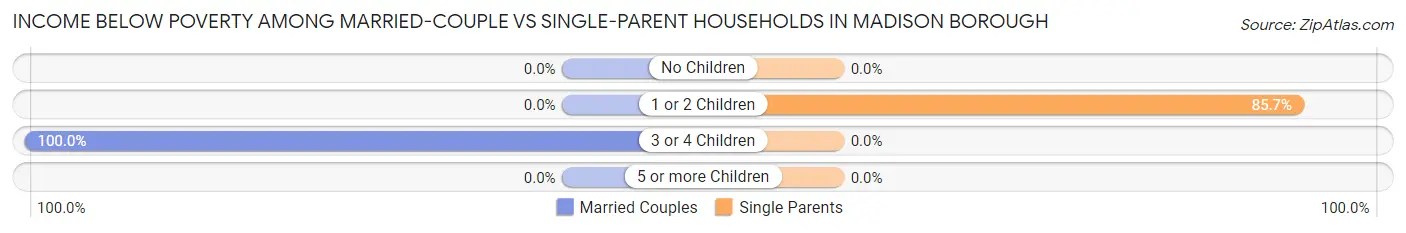
| Children | Married-Couple Families | Single-Parent Households |
| No Children | 0 (0.0%) | 0 (0.0%) |
| 1 or 2 Children | 0 (0.0%) | 6 (85.7%) |
| 3 or 4 Children | 1 (100.0%) | 0 (0.0%) |
| 5 or more Children | 0 (0.0%) | 0 (0.0%) |
| Total | 1 (0.9%) | 6 (46.2%) |
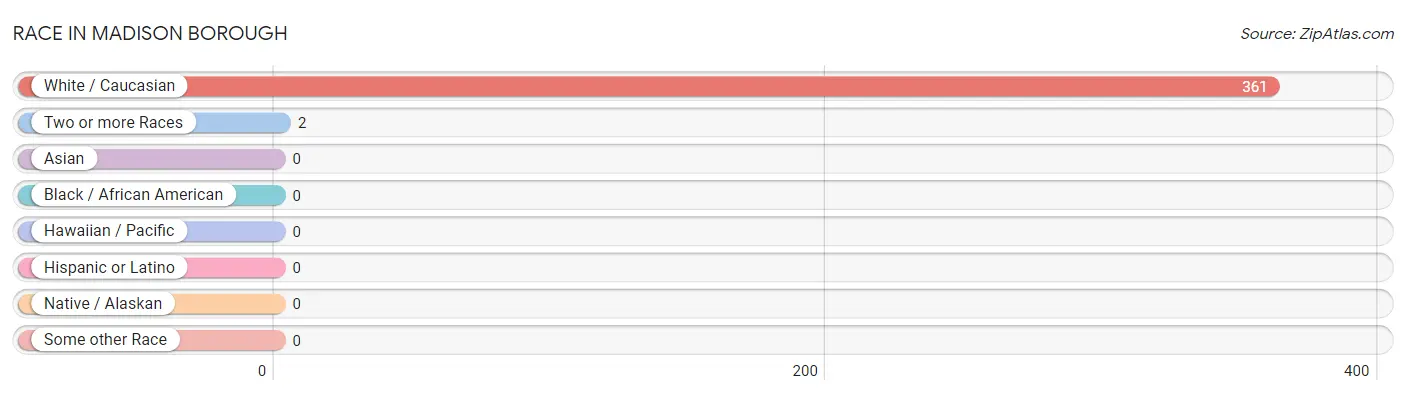
Race in Madison borough
The most populous races in Madison borough are White / Caucasian (361 | 99.5%), and Two or more Races (2 | 0.5%).
| Race | # Population | % Population |
| Asian | 0 | 0.0% |
| Black / African American | 0 | 0.0% |
| Hawaiian / Pacific | 0 | 0.0% |
| Hispanic or Latino | 0 | 0.0% |
| Native / Alaskan | 0 | 0.0% |
| White / Caucasian | 361 | 99.5% |
| Two or more Races | 2 | 0.5% |
| Some other Race | 0 | 0.0% |
| Total | 363 | 100.0% |
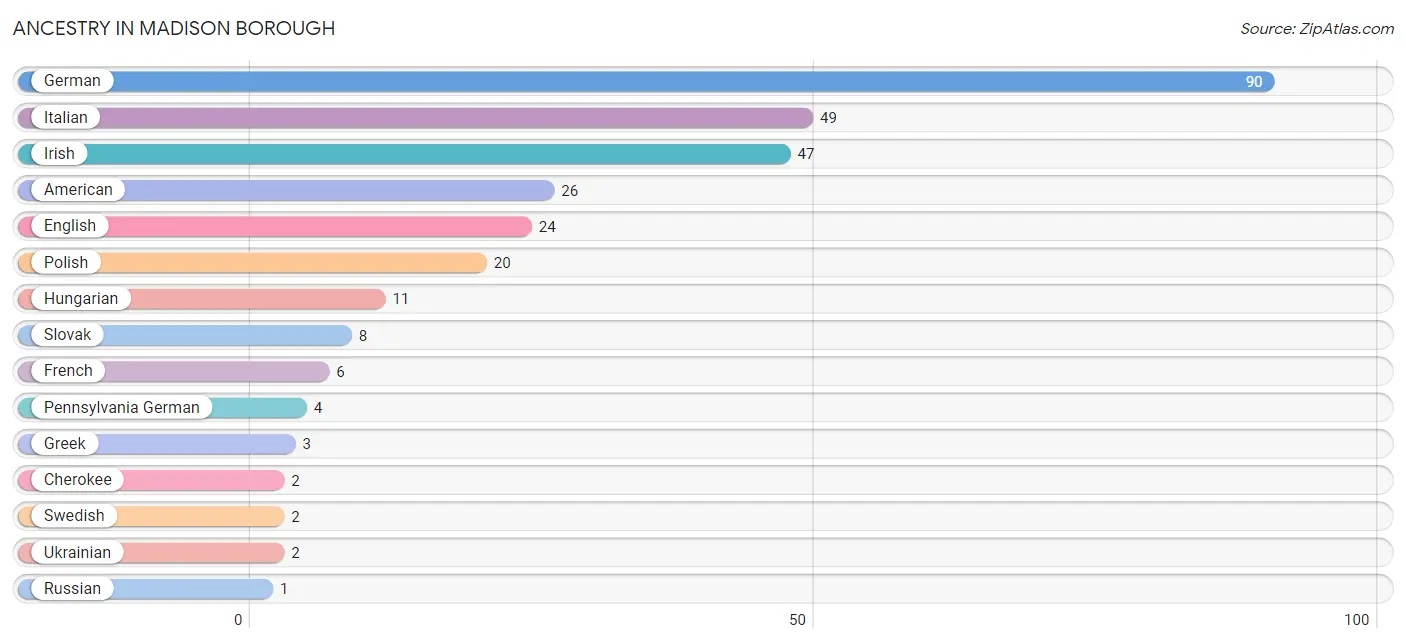
Ancestry in Madison borough
The most populous ancestries reported in Madison borough are German (90 | 24.8%), Italian (49 | 13.5%), Irish (47 | 13.0%), American (26 | 7.2%), and English (24 | 6.6%), together accounting for 65.0% of all Madison borough residents.
| Ancestry | # Population | % Population |
| American | 26 | 7.2% |
| Cherokee | 2 | 0.5% |
| English | 24 | 6.6% |
| French | 6 | 1.7% |
| German | 90 | 24.8% |
| Greek | 3 | 0.8% |
| Hungarian | 11 | 3.0% |
| Irish | 47 | 13.0% |
| Italian | 49 | 13.5% |
| Pennsylvania German | 4 | 1.1% |
| Polish | 20 | 5.5% |
| Russian | 1 | 0.3% |
| Scotch-Irish | 1 | 0.3% |
| Slovak | 8 | 2.2% |
| Swedish | 2 | 0.5% |
| Ukrainian | 2 | 0.5% | View All 16 Rows |
Immigrants in Madison borough

| Immigration Origin | # Population | % Population | View All 0 Rows |
Sex and Age in Madison borough
Sex and Age in Madison borough
The most populous age groups in Madison borough are 40 to 44 Years (38 | 21.8%) for men and 5 to 9 Years (33 | 17.5%) for women.
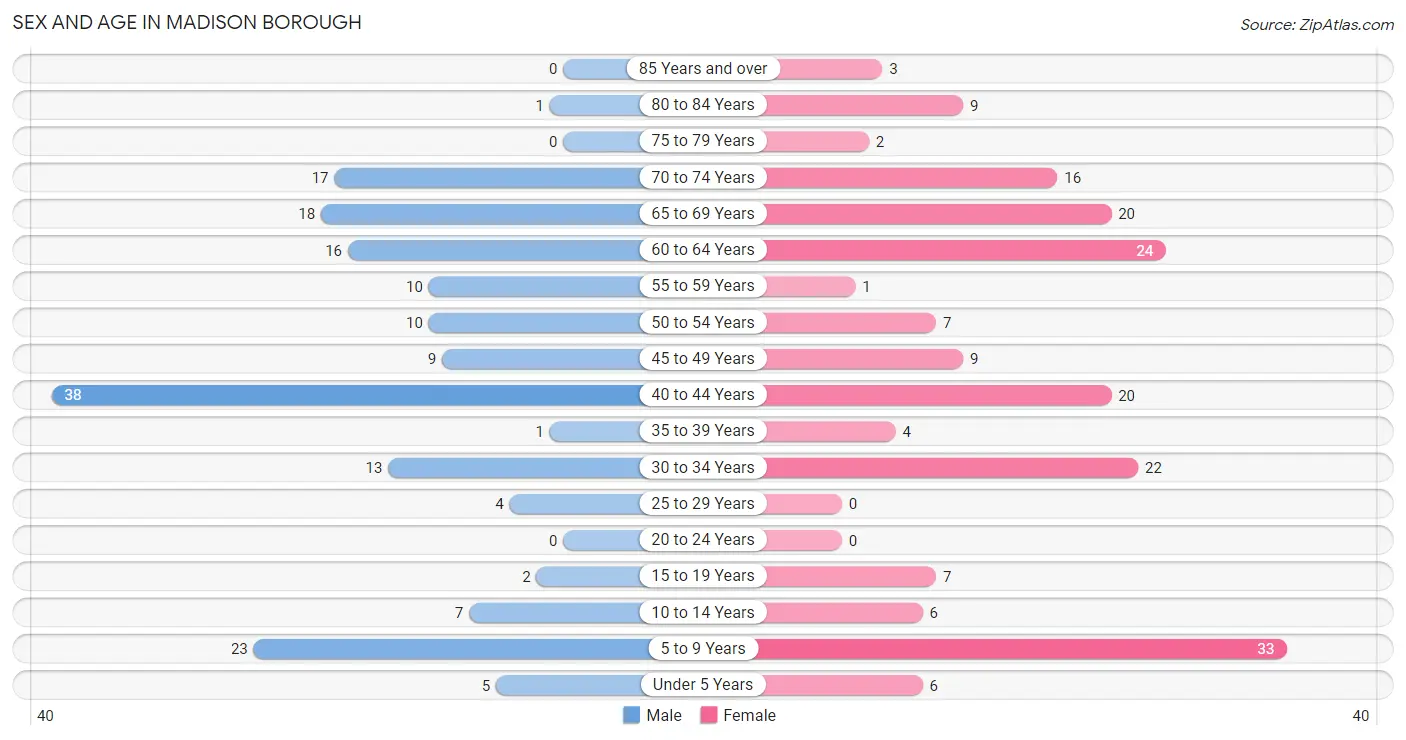
| Age Bracket | Male | Female |
| Under 5 Years | 5 (2.9%) | 6 (3.2%) |
| 5 to 9 Years | 23 (13.2%) | 33 (17.5%) |
| 10 to 14 Years | 7 (4.0%) | 6 (3.2%) |
| 15 to 19 Years | 2 (1.1%) | 7 (3.7%) |
| 20 to 24 Years | 0 (0.0%) | 0 (0.0%) |
| 25 to 29 Years | 4 (2.3%) | 0 (0.0%) |
| 30 to 34 Years | 13 (7.5%) | 22 (11.6%) |
| 35 to 39 Years | 1 (0.6%) | 4 (2.1%) |
| 40 to 44 Years | 38 (21.8%) | 20 (10.6%) |
| 45 to 49 Years | 9 (5.2%) | 9 (4.8%) |
| 50 to 54 Years | 10 (5.8%) | 7 (3.7%) |
| 55 to 59 Years | 10 (5.8%) | 1 (0.5%) |
| 60 to 64 Years | 16 (9.2%) | 24 (12.7%) |
| 65 to 69 Years | 18 (10.3%) | 20 (10.6%) |
| 70 to 74 Years | 17 (9.8%) | 16 (8.5%) |
| 75 to 79 Years | 0 (0.0%) | 2 (1.1%) |
| 80 to 84 Years | 1 (0.6%) | 9 (4.8%) |
| 85 Years and over | 0 (0.0%) | 3 (1.6%) |
| Total | 174 (100.0%) | 189 (100.0%) |
Families and Households in Madison borough
Median Family Size in Madison borough
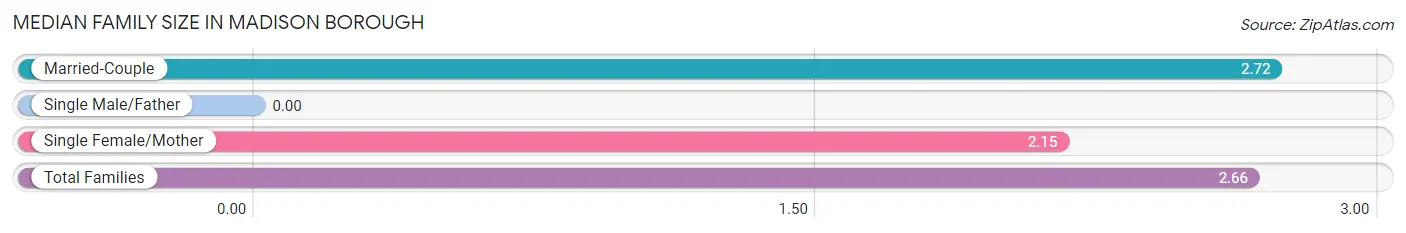
| Family Type | # Families | Family Size |
| Married-Couple | 105 (89.0%) | 2.72 |
| Single Male/Father | 0 (0.0%) | - |
| Single Female/Mother | 13 (11.0%) | 2.15 |
| Total Families | 118 (100.0%) | 2.66 |
Median Household Size in Madison borough
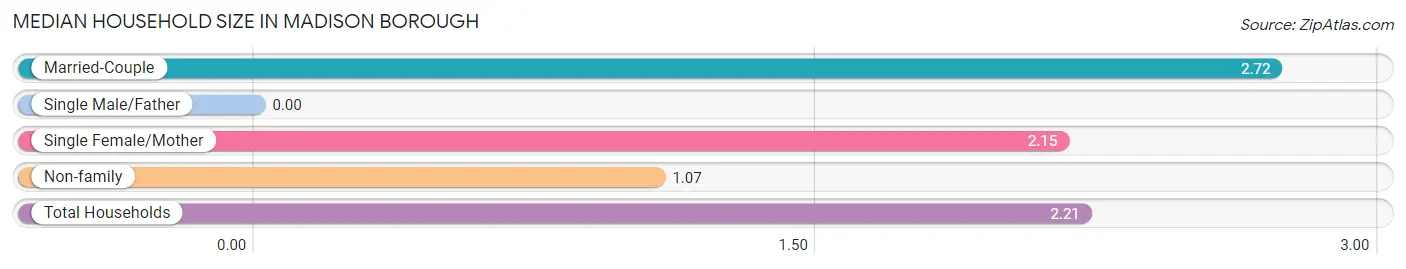
| Household Type | # Households | Household Size |
| Married-Couple | 105 (64.0%) | 2.72 |
| Single Male/Father | 0 (0.0%) | - |
| Single Female/Mother | 13 (7.9%) | 2.15 |
| Non-family | 46 (28.1%) | 1.07 |
| Total Households | 164 (100.0%) | 2.21 |
Household Size by Marriage Status in Madison borough
Out of a total of 164 households in Madison borough, 118 (72.0%) are family households, while 46 (28.1%) are nonfamily households. The most numerous type of family households are 2-person households, comprising 60, and the most common type of nonfamily households are 1-person households, comprising 43.
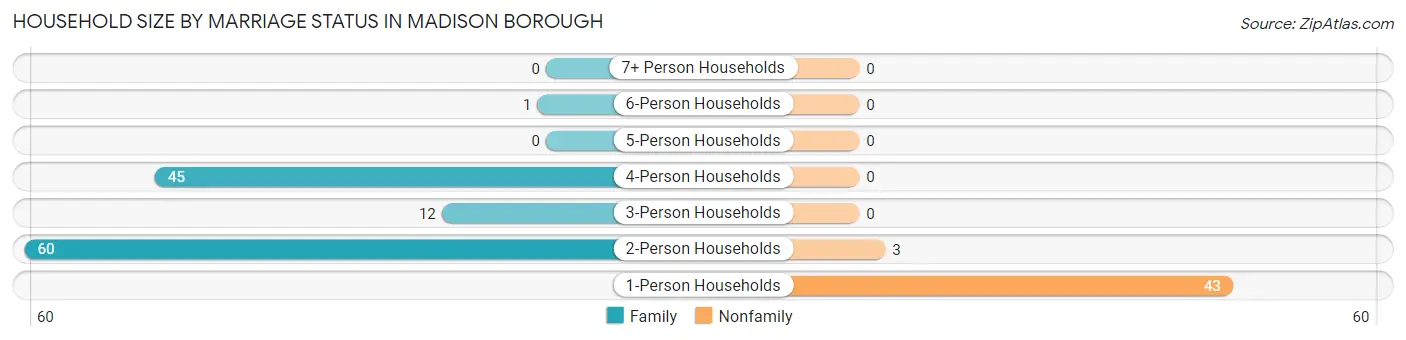
| Household Size | Family Households | Nonfamily Households |
| 1-Person Households | - | 43 (26.2%) |
| 2-Person Households | 60 (36.6%) | 3 (1.8%) |
| 3-Person Households | 12 (7.3%) | 0 (0.0%) |
| 4-Person Households | 45 (27.4%) | 0 (0.0%) |
| 5-Person Households | 0 (0.0%) | 0 (0.0%) |
| 6-Person Households | 1 (0.6%) | 0 (0.0%) |
| 7+ Person Households | 0 (0.0%) | 0 (0.0%) |
| Total | 118 (72.0%) | 46 (28.1%) |
Female Fertility in Madison borough
Fertility by Age in Madison borough
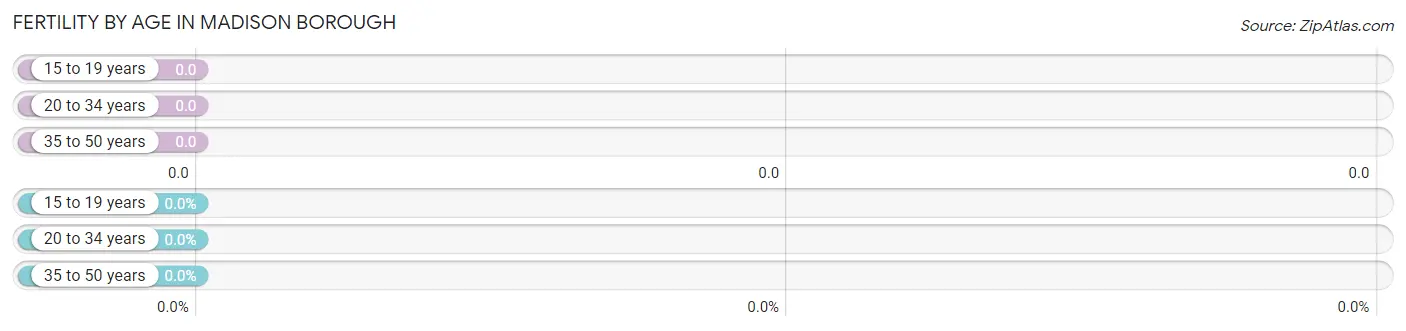
| Age Bracket | Women with Births | Births / 1,000 Women |
| 15 to 19 years | 0 (0.0%) | 0.0 |
| 20 to 34 years | 0 (0.0%) | 0.0 |
| 35 to 50 years | 0 (0.0%) | 0.0 |
| Total | 0 (0.0%) | 0.0 |
Fertility by Age by Marriage Status in Madison borough
| Age Bracket | Married | Unmarried |
| 15 to 19 years | 0 (0.0%) | 0 (0.0%) |
| 20 to 34 years | 0 (0.0%) | 0 (0.0%) |
| 35 to 50 years | 0 (0.0%) | 0 (0.0%) |
| Total | 0 (0.0%) | 0 (0.0%) |
Fertility by Education in Madison borough
| Educational Attainment | Women with Births | Births / 1,000 Women |
| Less than High School | 0 (0.0%) | 0.0 |
| High School Diploma | 0 (0.0%) | 0.0 |
| College or Associate's Degree | 0 (0.0%) | 0.0 |
| Bachelor's Degree | 0 (0.0%) | 0.0 |
| Graduate Degree | 0 (0.0%) | 0.0 |
| Total | 0 (0.0%) | 0.0 |
Fertility by Education by Marriage Status in Madison borough
| Educational Attainment | Married | Unmarried |
| Less than High School | 0 (0.0%) | 0 (0.0%) |
| High School Diploma | 0 (0.0%) | 0 (0.0%) |
| College or Associate's Degree | 0 (0.0%) | 0 (0.0%) |
| Bachelor's Degree | 0 (0.0%) | 0 (0.0%) |
| Graduate Degree | 0 (0.0%) | 0 (0.0%) |
| Total | 0 (0.0%) | 0 (0.0%) |
Employment Characteristics in Madison borough
Employment by Class of Employer in Madison borough
Among the 175 employed individuals in Madison borough, private company employees (127 | 72.6%), self-employed (incorporated) (34 | 19.4%), and not-for-profit organizations (9 | 5.1%) make up the most common classes of employment.
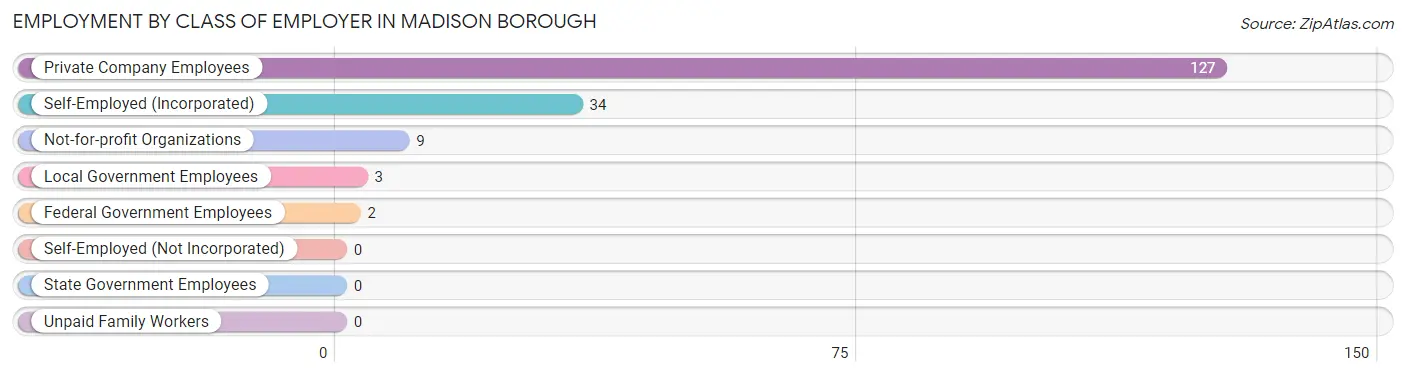
| Employer Class | # Employees | % Employees |
| Private Company Employees | 127 | 72.6% |
| Self-Employed (Incorporated) | 34 | 19.4% |
| Self-Employed (Not Incorporated) | 0 | 0.0% |
| Not-for-profit Organizations | 9 | 5.1% |
| Local Government Employees | 3 | 1.7% |
| State Government Employees | 0 | 0.0% |
| Federal Government Employees | 2 | 1.1% |
| Unpaid Family Workers | 0 | 0.0% |
| Total | 175 | 100.0% |
Employment Status by Age in Madison borough
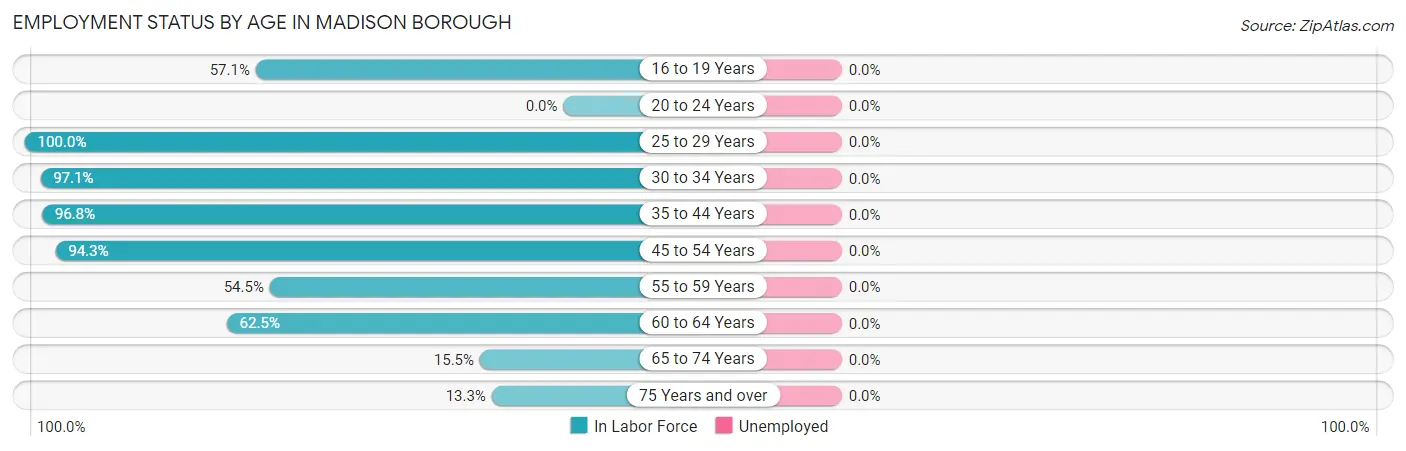
| Age Bracket | In Labor Force | Unemployed |
| 16 to 19 Years | 4 (57.1%) | 0 (0.0%) |
| 20 to 24 Years | 0 (0.0%) | 0 (0.0%) |
| 25 to 29 Years | 4 (100.0%) | 0 (0.0%) |
| 30 to 34 Years | 34 (97.1%) | 0 (0.0%) |
| 35 to 44 Years | 61 (96.8%) | 0 (0.0%) |
| 45 to 54 Years | 33 (94.3%) | 0 (0.0%) |
| 55 to 59 Years | 6 (54.5%) | 0 (0.0%) |
| 60 to 64 Years | 25 (62.5%) | 0 (0.0%) |
| 65 to 74 Years | 11 (15.5%) | 0 (0.0%) |
| 75 Years and over | 2 (13.3%) | 0 (0.0%) |
| Total | 180 (64.1%) | 0 (0.0%) |
Employment Status by Educational Attainment in Madison borough
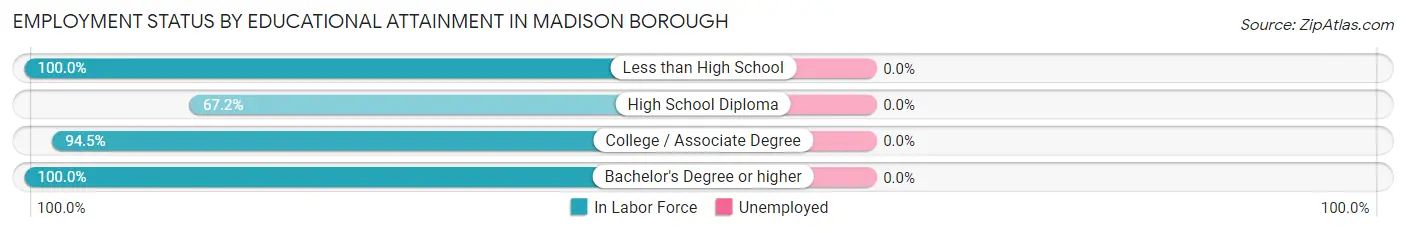
| Educational Attainment | In Labor Force | Unemployed |
| Less than High School | 5 (100.0%) | 0 (0.0%) |
| High School Diploma | 41 (67.2%) | 0 (0.0%) |
| College / Associate Degree | 86 (94.5%) | 0 (0.0%) |
| Bachelor's Degree or higher | 31 (100.0%) | 0 (0.0%) |
| Total | 163 (86.7%) | 0 (0.0%) |
Employment Occupations by Sex in Madison borough
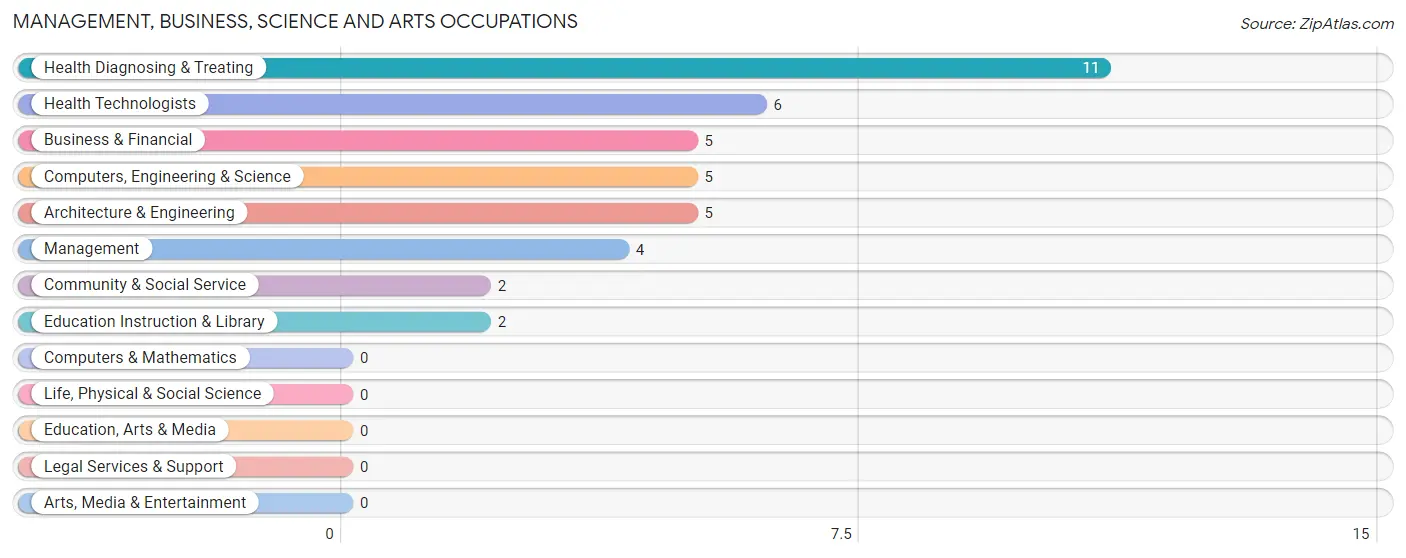
Management, Business, Science and Arts Occupations
The most common Management, Business, Science and Arts occupations in Madison borough are Health Diagnosing & Treating (11 | 6.1%), Health Technologists (6 | 3.3%), Business & Financial (5 | 2.8%), Computers, Engineering & Science (5 | 2.8%), and Architecture & Engineering (5 | 2.8%).
Management, Business, Science and Arts Occupations by Sex
Within the Management, Business, Science and Arts occupations in Madison borough, the most male-oriented occupations are Management (100.0%), Business & Financial (100.0%), and Computers, Engineering & Science (100.0%), while the most female-oriented occupations are Community & Social Service (100.0%), Education Instruction & Library (100.0%), and Health Diagnosing & Treating (100.0%).
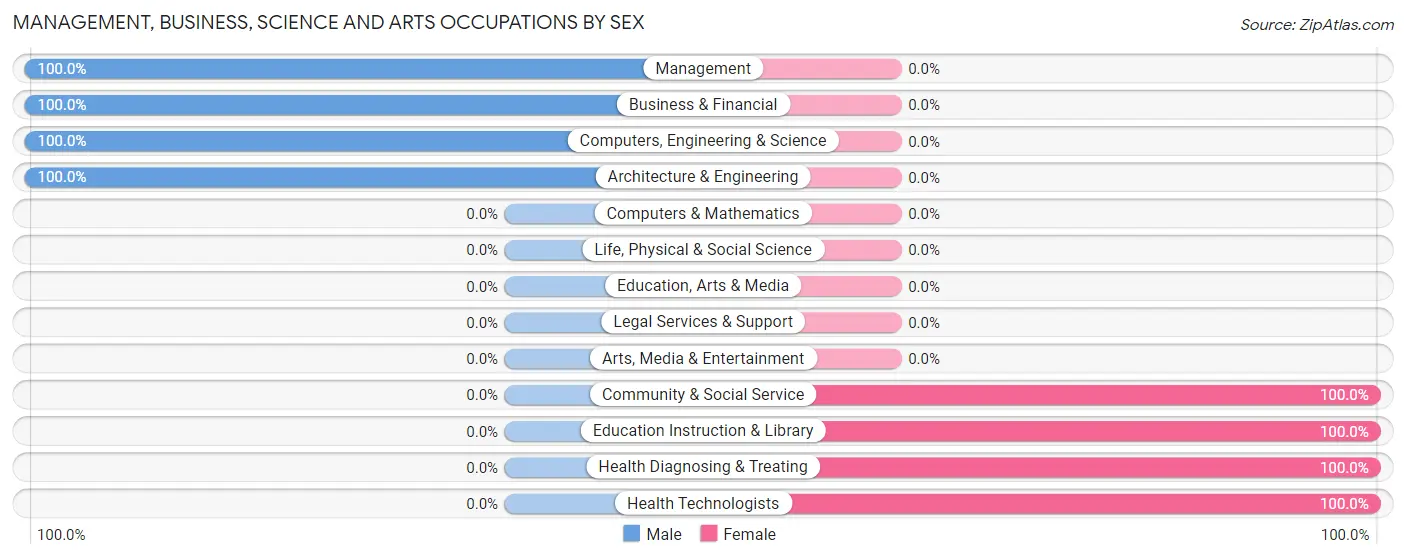
| Occupation | Male | Female |
| Management | 4 (100.0%) | 0 (0.0%) |
| Business & Financial | 5 (100.0%) | 0 (0.0%) |
| Computers, Engineering & Science | 5 (100.0%) | 0 (0.0%) |
| Computers & Mathematics | 0 (0.0%) | 0 (0.0%) |
| Architecture & Engineering | 5 (100.0%) | 0 (0.0%) |
| Life, Physical & Social Science | 0 (0.0%) | 0 (0.0%) |
| Community & Social Service | 0 (0.0%) | 2 (100.0%) |
| Education, Arts & Media | 0 (0.0%) | 0 (0.0%) |
| Legal Services & Support | 0 (0.0%) | 0 (0.0%) |
| Education Instruction & Library | 0 (0.0%) | 2 (100.0%) |
| Arts, Media & Entertainment | 0 (0.0%) | 0 (0.0%) |
| Health Diagnosing & Treating | 0 (0.0%) | 11 (100.0%) |
| Health Technologists | 0 (0.0%) | 6 (100.0%) |
| Total (Category) | 14 (51.8%) | 13 (48.1%) |
| Total (Overall) | 90 (50.0%) | 90 (50.0%) |
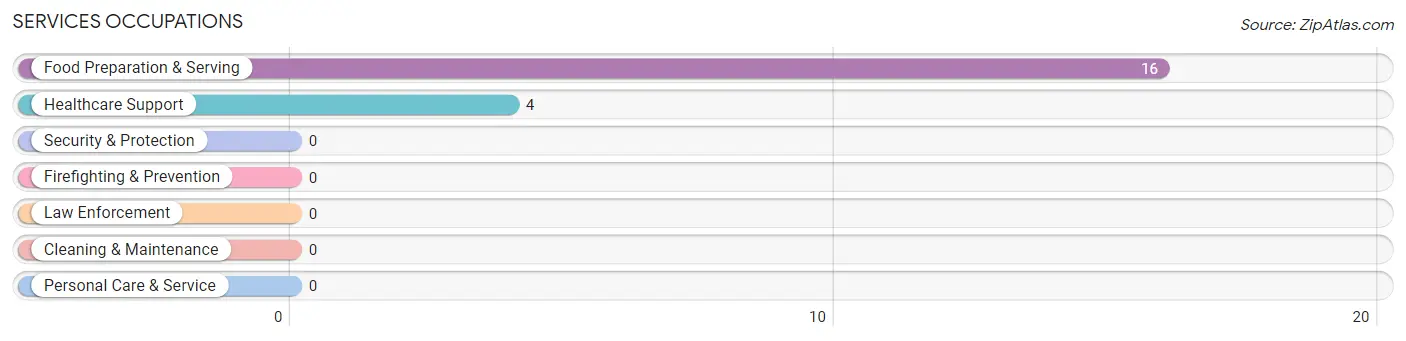
Services Occupations
The most common Services occupations in Madison borough are Food Preparation & Serving (16 | 8.9%), and Healthcare Support (4 | 2.2%).
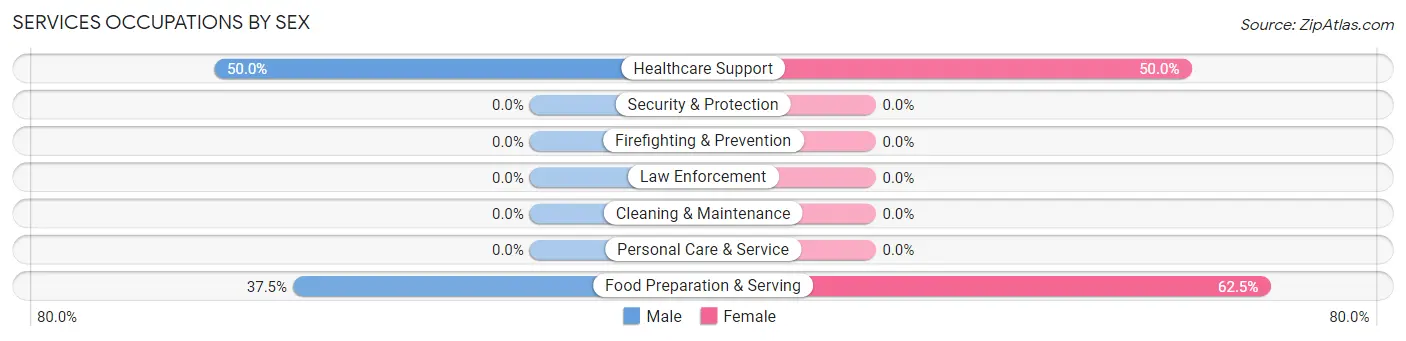
Services Occupations by Sex
Within the Services occupations in Madison borough, the most male-oriented occupations are Healthcare Support (50.0%), and Food Preparation & Serving (37.5%), while the most female-oriented occupations are Food Preparation & Serving (62.5%), and Healthcare Support (50.0%).
| Occupation | Male | Female |
| Healthcare Support | 2 (50.0%) | 2 (50.0%) |
| Security & Protection | 0 (0.0%) | 0 (0.0%) |
| Firefighting & Prevention | 0 (0.0%) | 0 (0.0%) |
| Law Enforcement | 0 (0.0%) | 0 (0.0%) |
| Food Preparation & Serving | 6 (37.5%) | 10 (62.5%) |
| Cleaning & Maintenance | 0 (0.0%) | 0 (0.0%) |
| Personal Care & Service | 0 (0.0%) | 0 (0.0%) |
| Total (Category) | 8 (40.0%) | 12 (60.0%) |
| Total (Overall) | 90 (50.0%) | 90 (50.0%) |
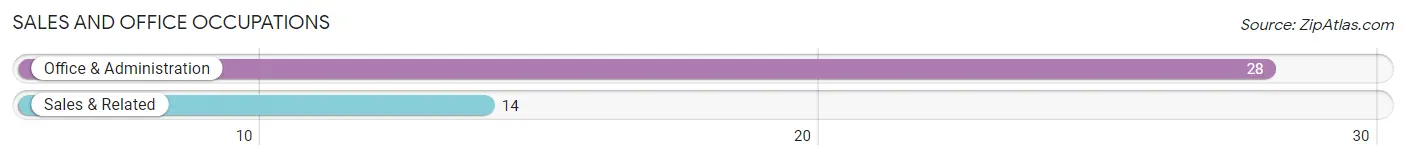
Sales and Office Occupations
The most common Sales and Office occupations in Madison borough are Office & Administration (28 | 15.6%), and Sales & Related (14 | 7.8%).
Sales and Office Occupations by Sex
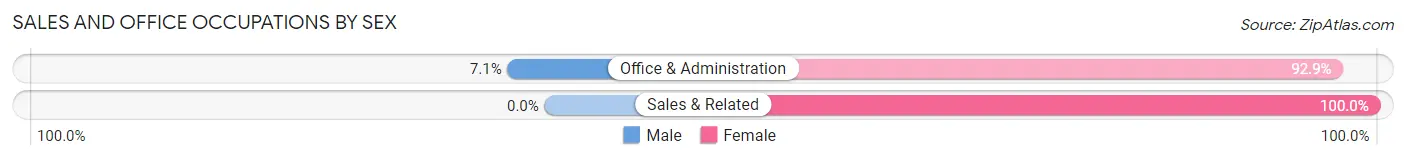
| Occupation | Male | Female |
| Sales & Related | 0 (0.0%) | 14 (100.0%) |
| Office & Administration | 2 (7.1%) | 26 (92.9%) |
| Total (Category) | 2 (4.8%) | 40 (95.2%) |
| Total (Overall) | 90 (50.0%) | 90 (50.0%) |
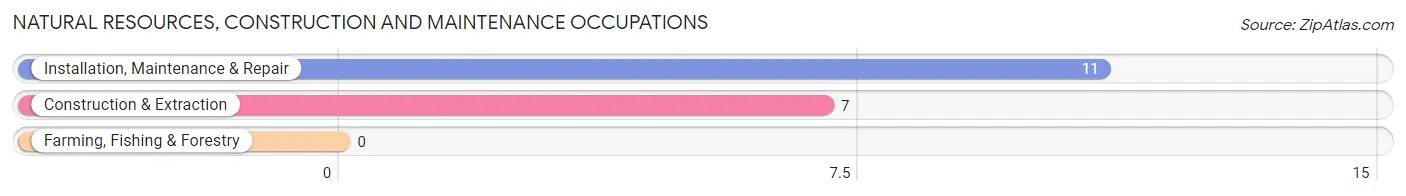
Natural Resources, Construction and Maintenance Occupations
The most common Natural Resources, Construction and Maintenance occupations in Madison borough are Installation, Maintenance & Repair (11 | 6.1%), and Construction & Extraction (7 | 3.9%).
Natural Resources, Construction and Maintenance Occupations by Sex
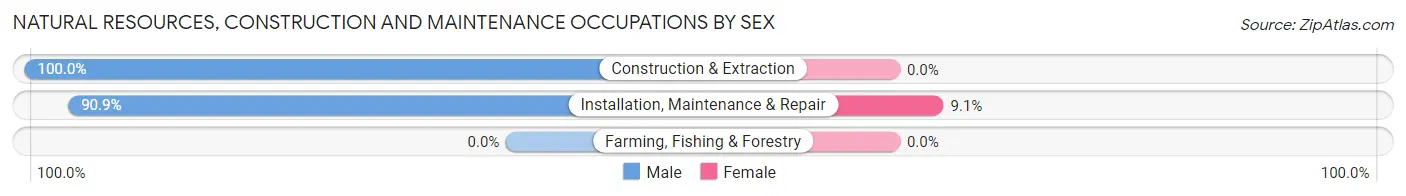
| Occupation | Male | Female |
| Farming, Fishing & Forestry | 0 (0.0%) | 0 (0.0%) |
| Construction & Extraction | 7 (100.0%) | 0 (0.0%) |
| Installation, Maintenance & Repair | 10 (90.9%) | 1 (9.1%) |
| Total (Category) | 17 (94.4%) | 1 (5.6%) |
| Total (Overall) | 90 (50.0%) | 90 (50.0%) |
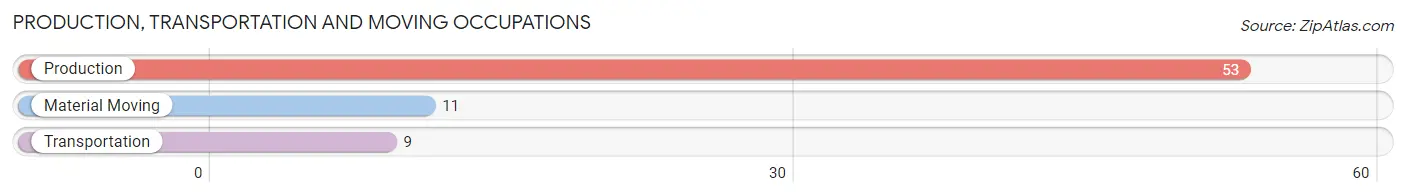
Production, Transportation and Moving Occupations
The most common Production, Transportation and Moving occupations in Madison borough are Production (53 | 29.4%), Material Moving (11 | 6.1%), and Transportation (9 | 5.0%).
Production, Transportation and Moving Occupations by Sex
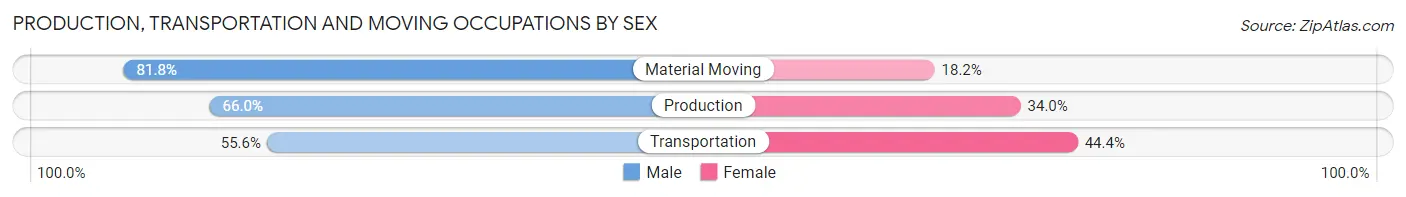
| Occupation | Male | Female |
| Production | 35 (66.0%) | 18 (34.0%) |
| Transportation | 5 (55.6%) | 4 (44.4%) |
| Material Moving | 9 (81.8%) | 2 (18.2%) |
| Total (Category) | 49 (67.1%) | 24 (32.9%) |
| Total (Overall) | 90 (50.0%) | 90 (50.0%) |
Employment Industries by Sex in Madison borough
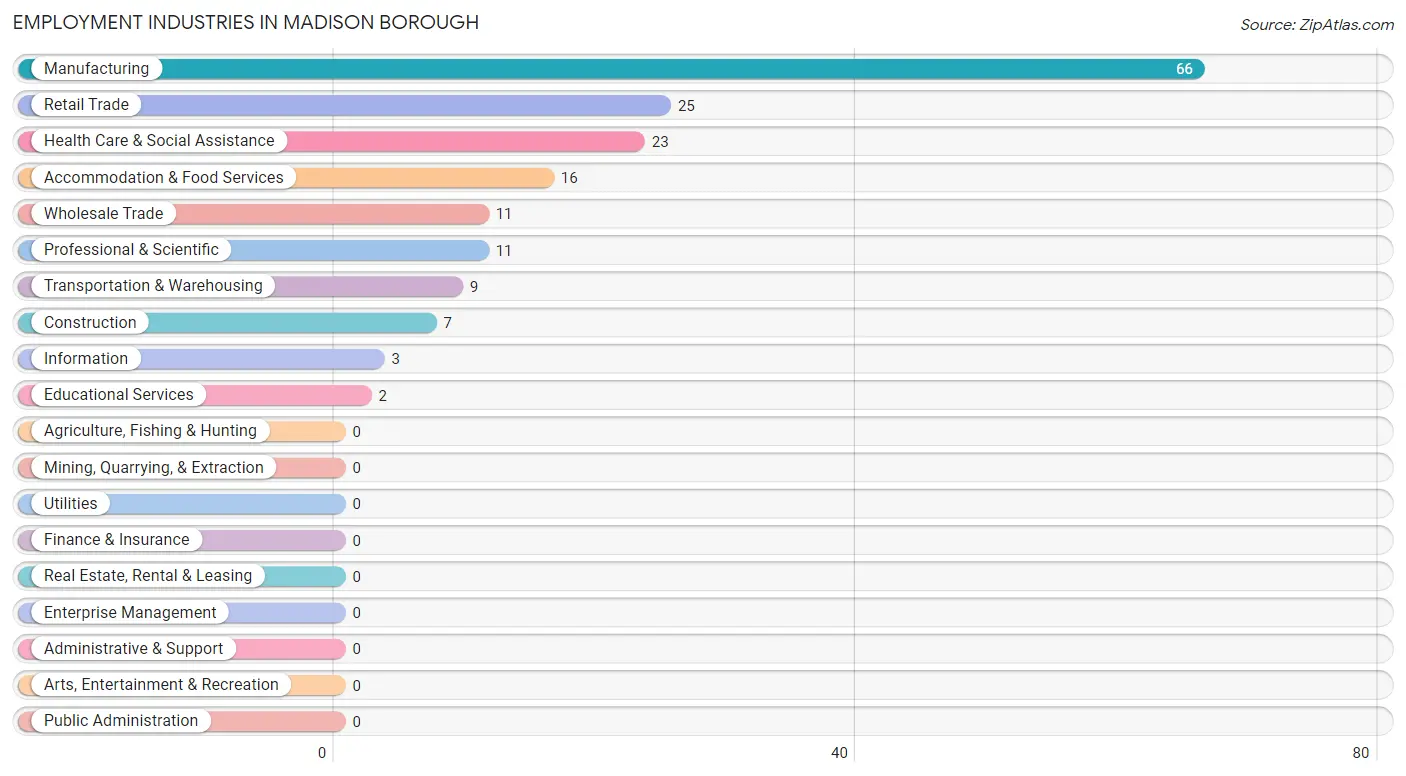
Employment Industries in Madison borough
The major employment industries in Madison borough include Manufacturing (66 | 36.7%), Retail Trade (25 | 13.9%), Health Care & Social Assistance (23 | 12.8%), Accommodation & Food Services (16 | 8.9%), and Wholesale Trade (11 | 6.1%).
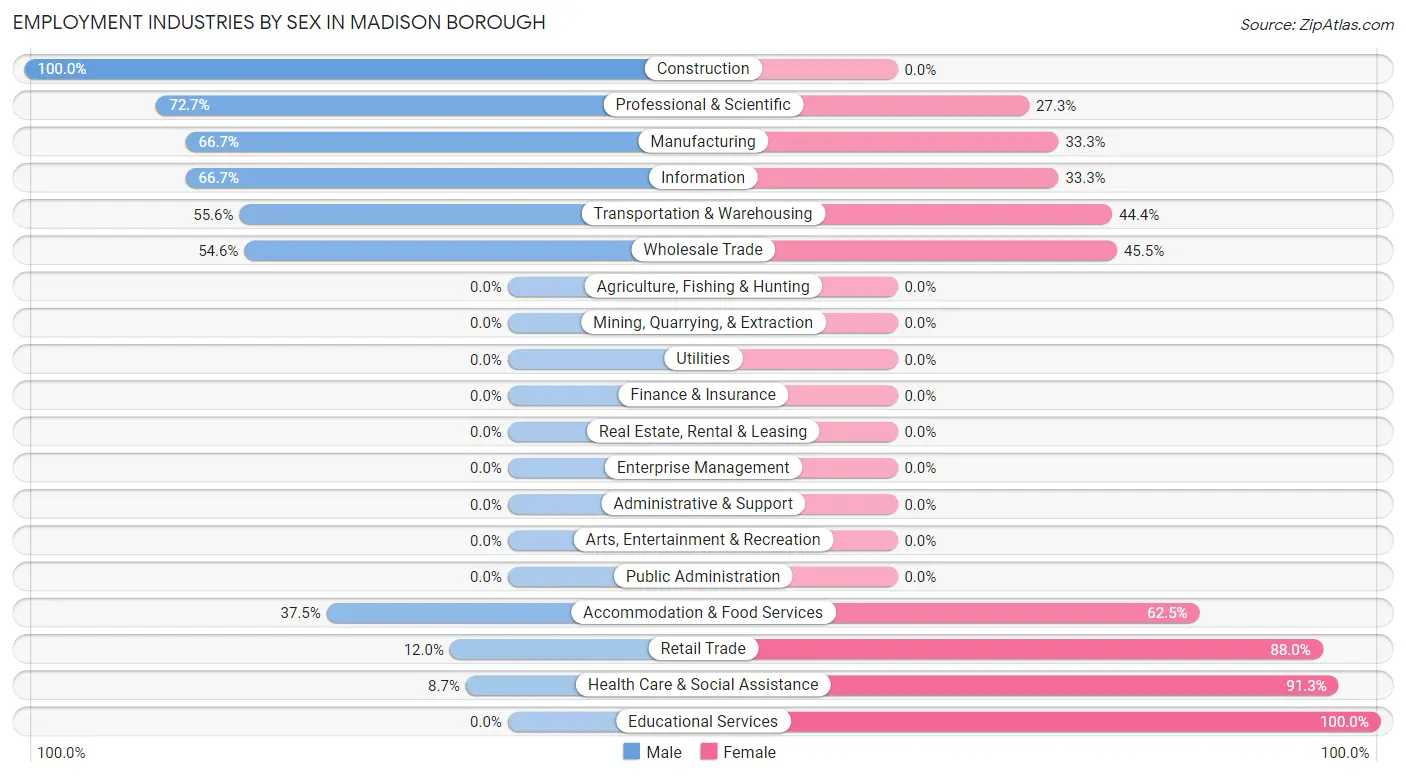
Employment Industries by Sex in Madison borough
The Madison borough industries that see more men than women are Construction (100.0%), Professional & Scientific (72.7%), and Manufacturing (66.7%), whereas the industries that tend to have a higher number of women are Educational Services (100.0%), Health Care & Social Assistance (91.3%), and Retail Trade (88.0%).
| Industry | Male | Female |
| Agriculture, Fishing & Hunting | 0 (0.0%) | 0 (0.0%) |
| Mining, Quarrying, & Extraction | 0 (0.0%) | 0 (0.0%) |
| Construction | 7 (100.0%) | 0 (0.0%) |
| Manufacturing | 44 (66.7%) | 22 (33.3%) |
| Wholesale Trade | 6 (54.5%) | 5 (45.5%) |
| Retail Trade | 3 (12.0%) | 22 (88.0%) |
| Transportation & Warehousing | 5 (55.6%) | 4 (44.4%) |
| Utilities | 0 (0.0%) | 0 (0.0%) |
| Information | 2 (66.7%) | 1 (33.3%) |
| Finance & Insurance | 0 (0.0%) | 0 (0.0%) |
| Real Estate, Rental & Leasing | 0 (0.0%) | 0 (0.0%) |
| Professional & Scientific | 8 (72.7%) | 3 (27.3%) |
| Enterprise Management | 0 (0.0%) | 0 (0.0%) |
| Administrative & Support | 0 (0.0%) | 0 (0.0%) |
| Educational Services | 0 (0.0%) | 2 (100.0%) |
| Health Care & Social Assistance | 2 (8.7%) | 21 (91.3%) |
| Arts, Entertainment & Recreation | 0 (0.0%) | 0 (0.0%) |
| Accommodation & Food Services | 6 (37.5%) | 10 (62.5%) |
| Public Administration | 0 (0.0%) | 0 (0.0%) |
| Total | 90 (50.0%) | 90 (50.0%) |
Education in Madison borough
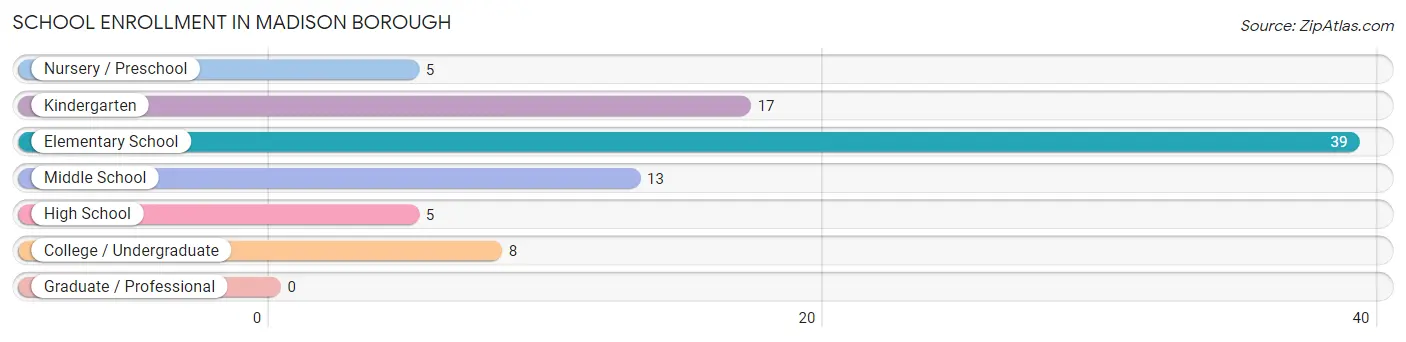
School Enrollment in Madison borough
The most common levels of schooling among the 87 students in Madison borough are elementary school (39 | 44.8%), kindergarten (17 | 19.5%), and middle school (13 | 14.9%).
| School Level | # Students | % Students |
| Nursery / Preschool | 5 | 5.8% |
| Kindergarten | 17 | 19.5% |
| Elementary School | 39 | 44.8% |
| Middle School | 13 | 14.9% |
| High School | 5 | 5.8% |
| College / Undergraduate | 8 | 9.2% |
| Graduate / Professional | 0 | 0.0% |
| Total | 87 | 100.0% |
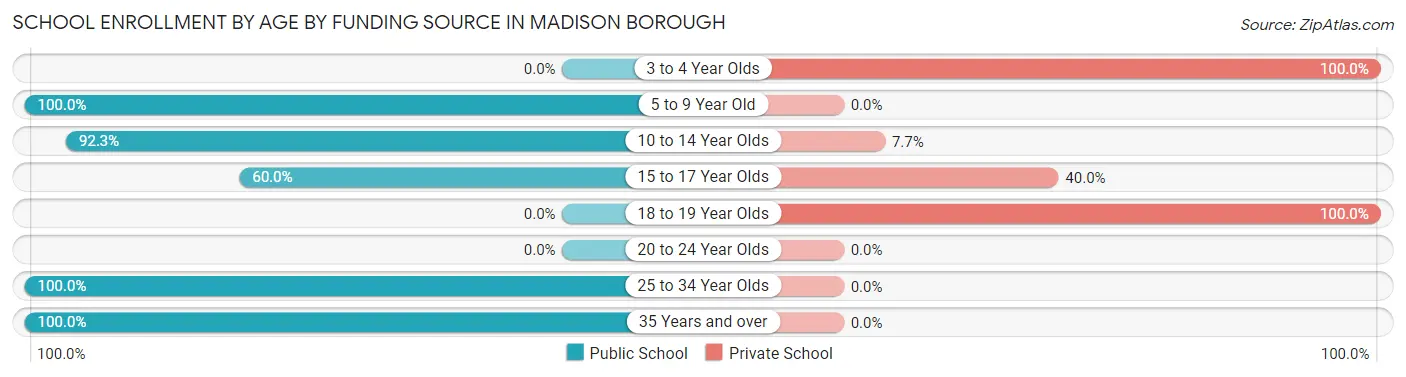
School Enrollment by Age by Funding Source in Madison borough
Out of a total of 87 students who are enrolled in schools in Madison borough, 12 (13.8%) attend a private institution, while the remaining 75 (86.2%) are enrolled in public schools. The age group of 3 to 4 year olds has the highest likelihood of being enrolled in private schools, with 5 (100.0% in the age bracket) enrolled. Conversely, the age group of 5 to 9 year old has the lowest likelihood of being enrolled in a private school, with 56 (100.0% in the age bracket) attending a public institution.
| Age Bracket | Public School | Private School |
| 3 to 4 Year Olds | 0 (0.0%) | 5 (100.0%) |
| 5 to 9 Year Old | 56 (100.0%) | 0 (0.0%) |
| 10 to 14 Year Olds | 12 (92.3%) | 1 (7.7%) |
| 15 to 17 Year Olds | 3 (60.0%) | 2 (40.0%) |
| 18 to 19 Year Olds | 0 (0.0%) | 4 (100.0%) |
| 20 to 24 Year Olds | 0 (0.0%) | 0 (0.0%) |
| 25 to 34 Year Olds | 2 (100.0%) | 0 (0.0%) |
| 35 Years and over | 2 (100.0%) | 0 (0.0%) |
| Total | 75 (86.2%) | 12 (13.8%) |
Educational Attainment by Field of Study in Madison borough
Business (18 | 39.1%), science & technology (16 | 34.8%), education (7 | 15.2%), engineering (3 | 6.5%), and communications (2 | 4.3%) are the most common fields of study among 46 individuals in Madison borough who have obtained a bachelor's degree or higher.
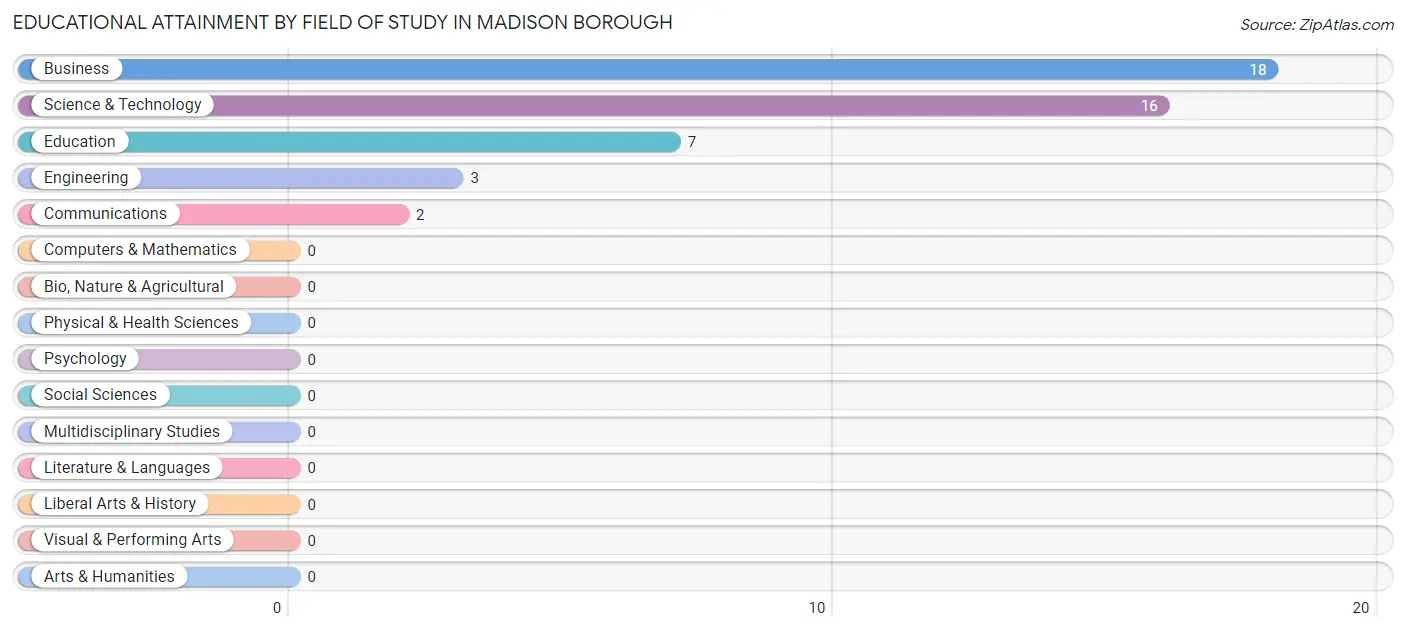
| Field of Study | # Graduates | % Graduates |
| Computers & Mathematics | 0 | 0.0% |
| Bio, Nature & Agricultural | 0 | 0.0% |
| Physical & Health Sciences | 0 | 0.0% |
| Psychology | 0 | 0.0% |
| Social Sciences | 0 | 0.0% |
| Engineering | 3 | 6.5% |
| Multidisciplinary Studies | 0 | 0.0% |
| Science & Technology | 16 | 34.8% |
| Business | 18 | 39.1% |
| Education | 7 | 15.2% |
| Literature & Languages | 0 | 0.0% |
| Liberal Arts & History | 0 | 0.0% |
| Visual & Performing Arts | 0 | 0.0% |
| Communications | 2 | 4.3% |
| Arts & Humanities | 0 | 0.0% |
| Total | 46 | 100.0% |
Transportation & Commute in Madison borough
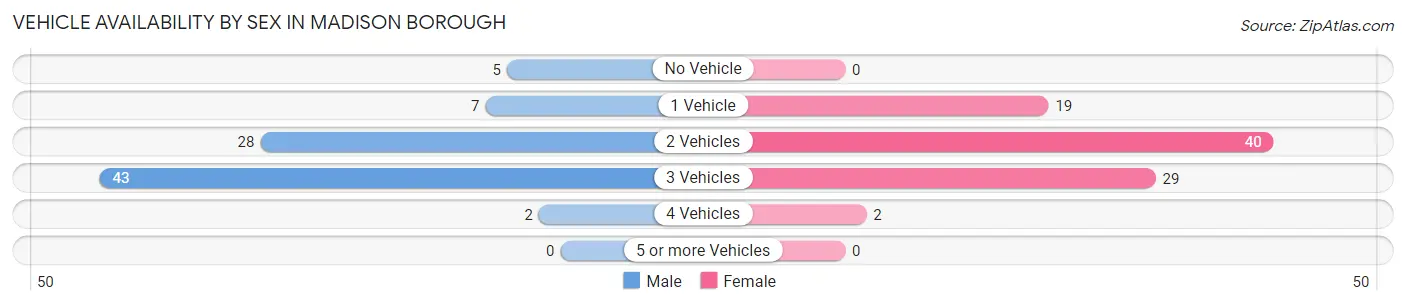
Vehicle Availability by Sex in Madison borough
The most prevalent vehicle ownership categories in Madison borough are males with 3 vehicles (43, accounting for 50.6%) and females with 3 vehicles (29, making up 47.8%).
| Vehicles Available | Male | Female |
| No Vehicle | 5 (5.9%) | 0 (0.0%) |
| 1 Vehicle | 7 (8.2%) | 19 (21.1%) |
| 2 Vehicles | 28 (32.9%) | 40 (44.4%) |
| 3 Vehicles | 43 (50.6%) | 29 (32.2%) |
| 4 Vehicles | 2 (2.4%) | 2 (2.2%) |
| 5 or more Vehicles | 0 (0.0%) | 0 (0.0%) |
| Total | 85 (100.0%) | 90 (100.0%) |
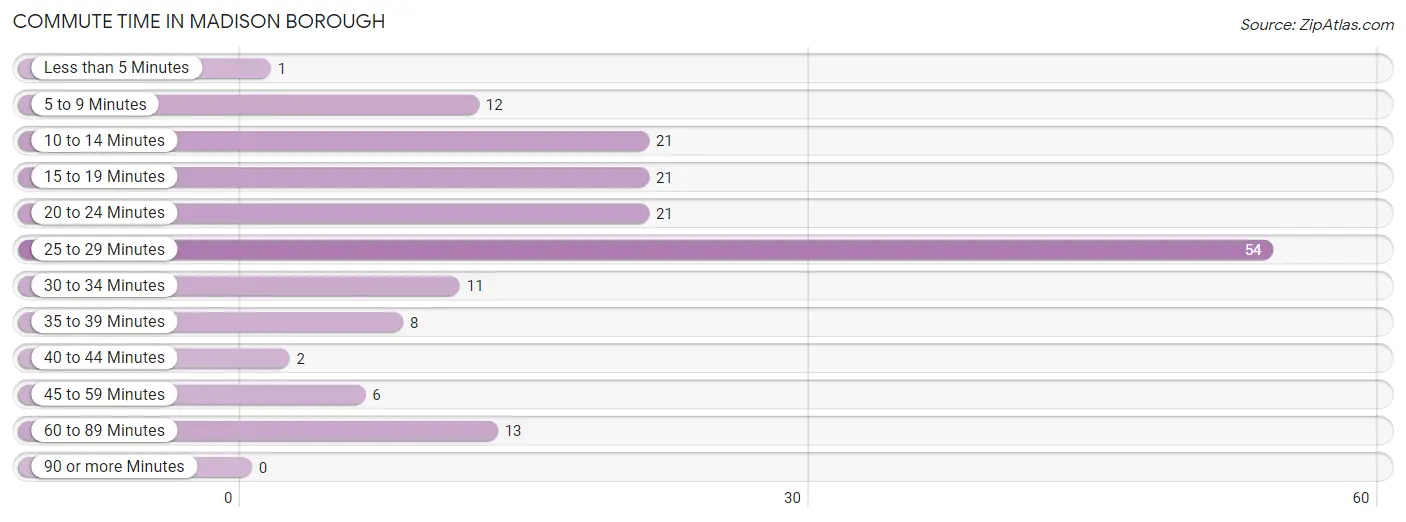
Commute Time in Madison borough
The most frequently occuring commute durations in Madison borough are 25 to 29 minutes (54 commuters, 31.8%), 10 to 14 minutes (21 commuters, 12.3%), and 15 to 19 minutes (21 commuters, 12.3%).
| Commute Time | # Commuters | % Commuters |
| Less than 5 Minutes | 1 | 0.6% |
| 5 to 9 Minutes | 12 | 7.1% |
| 10 to 14 Minutes | 21 | 12.3% |
| 15 to 19 Minutes | 21 | 12.3% |
| 20 to 24 Minutes | 21 | 12.3% |
| 25 to 29 Minutes | 54 | 31.8% |
| 30 to 34 Minutes | 11 | 6.5% |
| 35 to 39 Minutes | 8 | 4.7% |
| 40 to 44 Minutes | 2 | 1.2% |
| 45 to 59 Minutes | 6 | 3.5% |
| 60 to 89 Minutes | 13 | 7.6% |
| 90 or more Minutes | 0 | 0.0% |
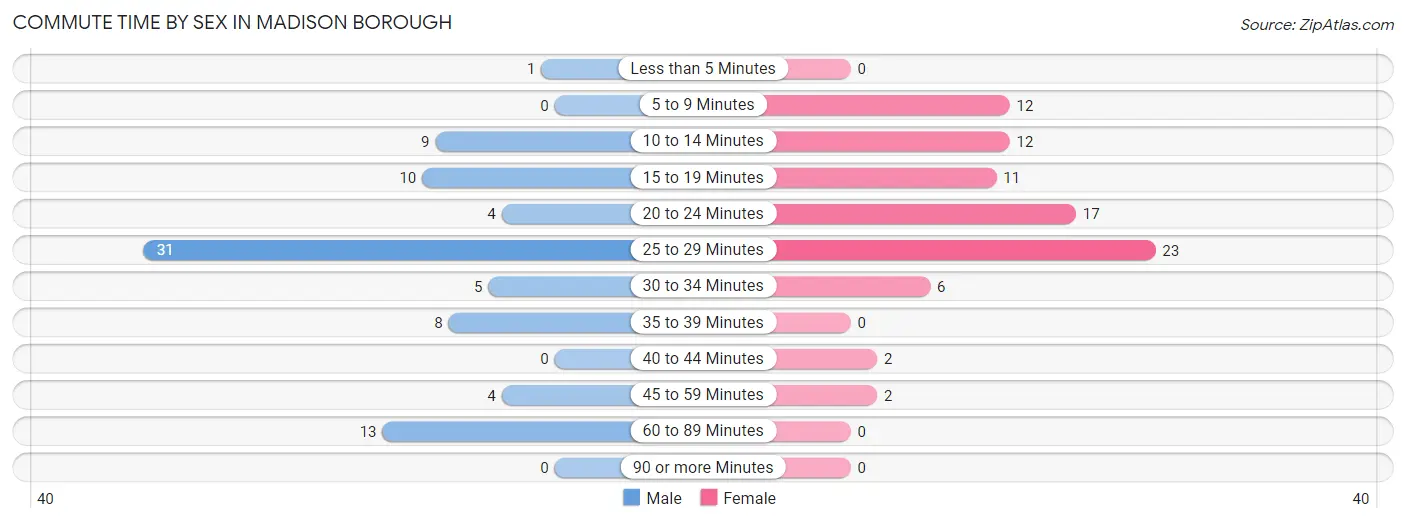
Commute Time by Sex in Madison borough
The most common commute times in Madison borough are 25 to 29 minutes (31 commuters, 36.5%) for males and 25 to 29 minutes (23 commuters, 27.1%) for females.
| Commute Time | Male | Female |
| Less than 5 Minutes | 1 (1.2%) | 0 (0.0%) |
| 5 to 9 Minutes | 0 (0.0%) | 12 (14.1%) |
| 10 to 14 Minutes | 9 (10.6%) | 12 (14.1%) |
| 15 to 19 Minutes | 10 (11.8%) | 11 (12.9%) |
| 20 to 24 Minutes | 4 (4.7%) | 17 (20.0%) |
| 25 to 29 Minutes | 31 (36.5%) | 23 (27.1%) |
| 30 to 34 Minutes | 5 (5.9%) | 6 (7.1%) |
| 35 to 39 Minutes | 8 (9.4%) | 0 (0.0%) |
| 40 to 44 Minutes | 0 (0.0%) | 2 (2.4%) |
| 45 to 59 Minutes | 4 (4.7%) | 2 (2.4%) |
| 60 to 89 Minutes | 13 (15.3%) | 0 (0.0%) |
| 90 or more Minutes | 0 (0.0%) | 0 (0.0%) |
Time of Departure to Work by Sex in Madison borough
The most frequent times of departure to work in Madison borough are 7:30 AM to 7:59 AM (36, 42.3%) for males and 9:00 AM to 9:59 AM (23, 27.1%) for females.
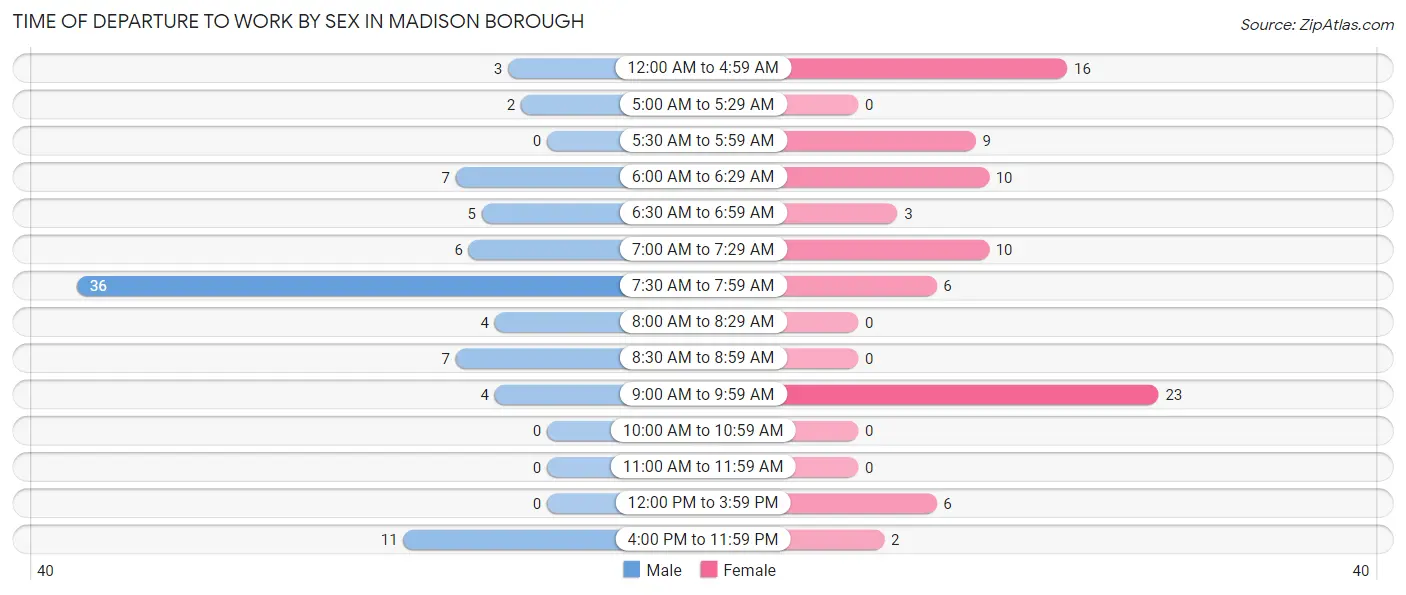
| Time of Departure | Male | Female |
| 12:00 AM to 4:59 AM | 3 (3.5%) | 16 (18.8%) |
| 5:00 AM to 5:29 AM | 2 (2.4%) | 0 (0.0%) |
| 5:30 AM to 5:59 AM | 0 (0.0%) | 9 (10.6%) |
| 6:00 AM to 6:29 AM | 7 (8.2%) | 10 (11.8%) |
| 6:30 AM to 6:59 AM | 5 (5.9%) | 3 (3.5%) |
| 7:00 AM to 7:29 AM | 6 (7.1%) | 10 (11.8%) |
| 7:30 AM to 7:59 AM | 36 (42.3%) | 6 (7.1%) |
| 8:00 AM to 8:29 AM | 4 (4.7%) | 0 (0.0%) |
| 8:30 AM to 8:59 AM | 7 (8.2%) | 0 (0.0%) |
| 9:00 AM to 9:59 AM | 4 (4.7%) | 23 (27.1%) |
| 10:00 AM to 10:59 AM | 0 (0.0%) | 0 (0.0%) |
| 11:00 AM to 11:59 AM | 0 (0.0%) | 0 (0.0%) |
| 12:00 PM to 3:59 PM | 0 (0.0%) | 6 (7.1%) |
| 4:00 PM to 11:59 PM | 11 (12.9%) | 2 (2.4%) |
| Total | 85 (100.0%) | 85 (100.0%) |
Housing Occupancy in Madison borough
Occupancy by Ownership in Madison borough
Of the total 164 dwellings in Madison borough, owner-occupied units account for 142 (86.6%), while renter-occupied units make up 22 (13.4%).
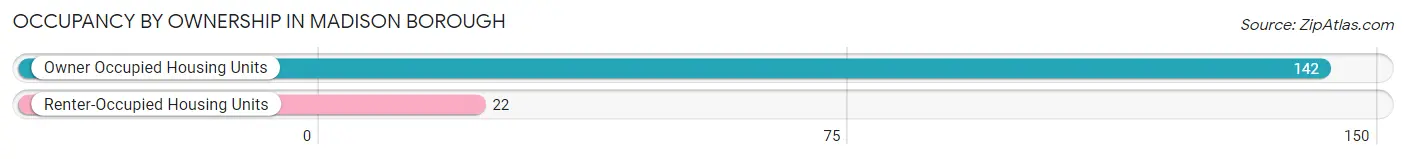
| Occupancy | # Housing Units | % Housing Units |
| Owner Occupied Housing Units | 142 | 86.6% |
| Renter-Occupied Housing Units | 22 | 13.4% |
| Total Occupied Housing Units | 164 | 100.0% |
Occupancy by Household Size in Madison borough
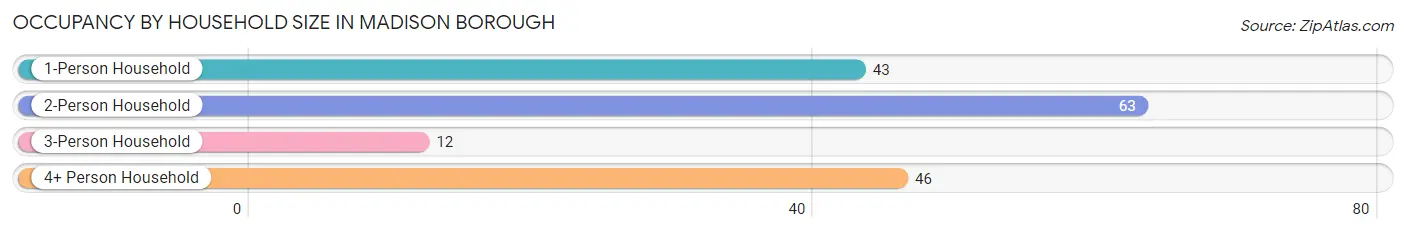
| Household Size | # Housing Units | % Housing Units |
| 1-Person Household | 43 | 26.2% |
| 2-Person Household | 63 | 38.4% |
| 3-Person Household | 12 | 7.3% |
| 4+ Person Household | 46 | 28.1% |
| Total Housing Units | 164 | 100.0% |
Occupancy by Ownership by Household Size in Madison borough
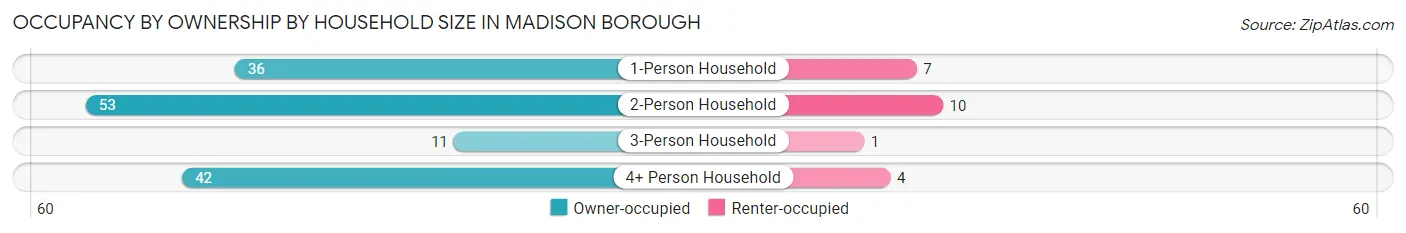
| Household Size | Owner-occupied | Renter-occupied |
| 1-Person Household | 36 (83.7%) | 7 (16.3%) |
| 2-Person Household | 53 (84.1%) | 10 (15.9%) |
| 3-Person Household | 11 (91.7%) | 1 (8.3%) |
| 4+ Person Household | 42 (91.3%) | 4 (8.7%) |
| Total Housing Units | 142 (86.6%) | 22 (13.4%) |
Occupancy by Educational Attainment in Madison borough
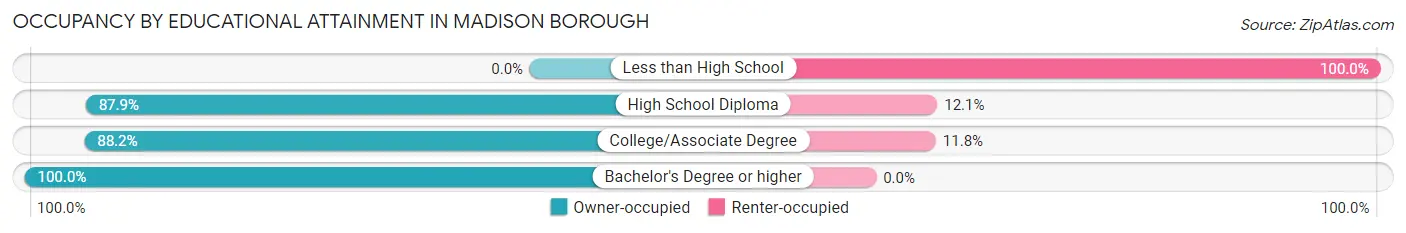
| Household Size | Owner-occupied | Renter-occupied |
| Less than High School | 0 (0.0%) | 5 (100.0%) |
| High School Diploma | 58 (87.9%) | 8 (12.1%) |
| College/Associate Degree | 67 (88.2%) | 9 (11.8%) |
| Bachelor's Degree or higher | 17 (100.0%) | 0 (0.0%) |
Occupancy by Age of Householder in Madison borough
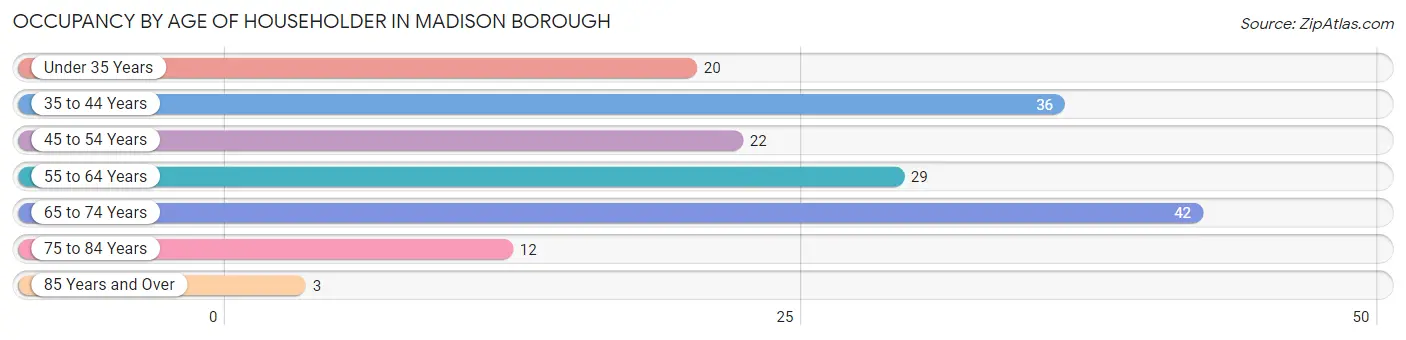
| Age Bracket | # Households | % Households |
| Under 35 Years | 20 | 12.2% |
| 35 to 44 Years | 36 | 22.0% |
| 45 to 54 Years | 22 | 13.4% |
| 55 to 64 Years | 29 | 17.7% |
| 65 to 74 Years | 42 | 25.6% |
| 75 to 84 Years | 12 | 7.3% |
| 85 Years and Over | 3 | 1.8% |
| Total | 164 | 100.0% |
Housing Finances in Madison borough
Median Income by Occupancy in Madison borough
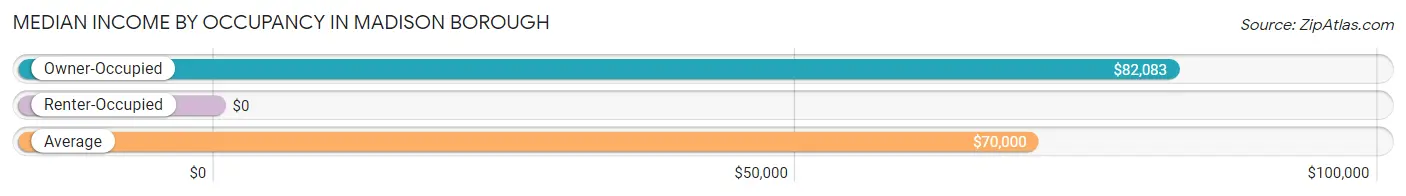
| Occupancy Type | # Households | Median Income |
| Owner-Occupied | 142 (86.6%) | $82,083 |
| Renter-Occupied | 22 (13.4%) | $0 |
| Average | 164 (100.0%) | $70,000 |
Occupancy by Householder Income Bracket in Madison borough
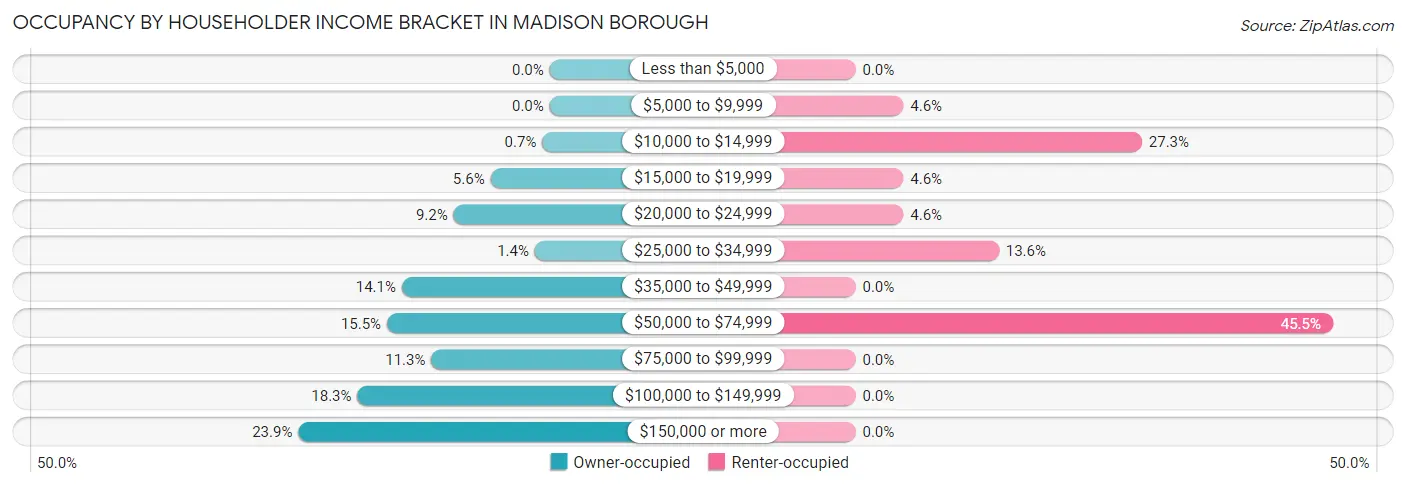
| Income Bracket | Owner-occupied | Renter-occupied |
| Less than $5,000 | 0 (0.0%) | 0 (0.0%) |
| $5,000 to $9,999 | 0 (0.0%) | 1 (4.5%) |
| $10,000 to $14,999 | 1 (0.7%) | 6 (27.3%) |
| $15,000 to $19,999 | 8 (5.6%) | 1 (4.5%) |
| $20,000 to $24,999 | 13 (9.1%) | 1 (4.5%) |
| $25,000 to $34,999 | 2 (1.4%) | 3 (13.6%) |
| $35,000 to $49,999 | 20 (14.1%) | 0 (0.0%) |
| $50,000 to $74,999 | 22 (15.5%) | 10 (45.5%) |
| $75,000 to $99,999 | 16 (11.3%) | 0 (0.0%) |
| $100,000 to $149,999 | 26 (18.3%) | 0 (0.0%) |
| $150,000 or more | 34 (23.9%) | 0 (0.0%) |
| Total | 142 (100.0%) | 22 (100.0%) |
Monthly Housing Cost Tiers in Madison borough
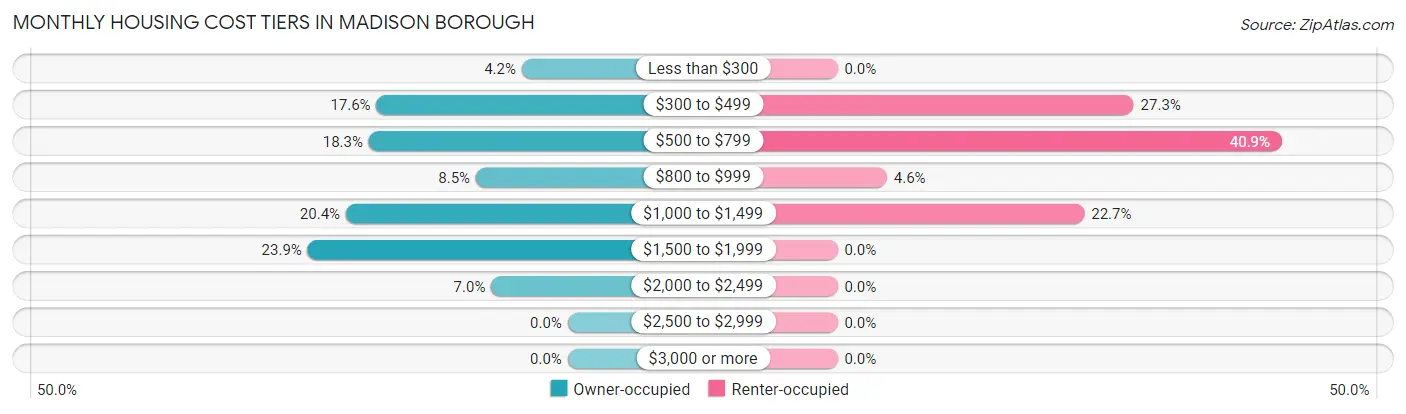
| Monthly Cost | Owner-occupied | Renter-occupied |
| Less than $300 | 6 (4.2%) | 0 (0.0%) |
| $300 to $499 | 25 (17.6%) | 6 (27.3%) |
| $500 to $799 | 26 (18.3%) | 9 (40.9%) |
| $800 to $999 | 12 (8.5%) | 1 (4.5%) |
| $1,000 to $1,499 | 29 (20.4%) | 5 (22.7%) |
| $1,500 to $1,999 | 34 (23.9%) | 0 (0.0%) |
| $2,000 to $2,499 | 10 (7.0%) | 0 (0.0%) |
| $2,500 to $2,999 | 0 (0.0%) | 0 (0.0%) |
| $3,000 or more | 0 (0.0%) | 0 (0.0%) |
| Total | 142 (100.0%) | 22 (100.0%) |
Physical Housing Characteristics in Madison borough
Housing Structures in Madison borough
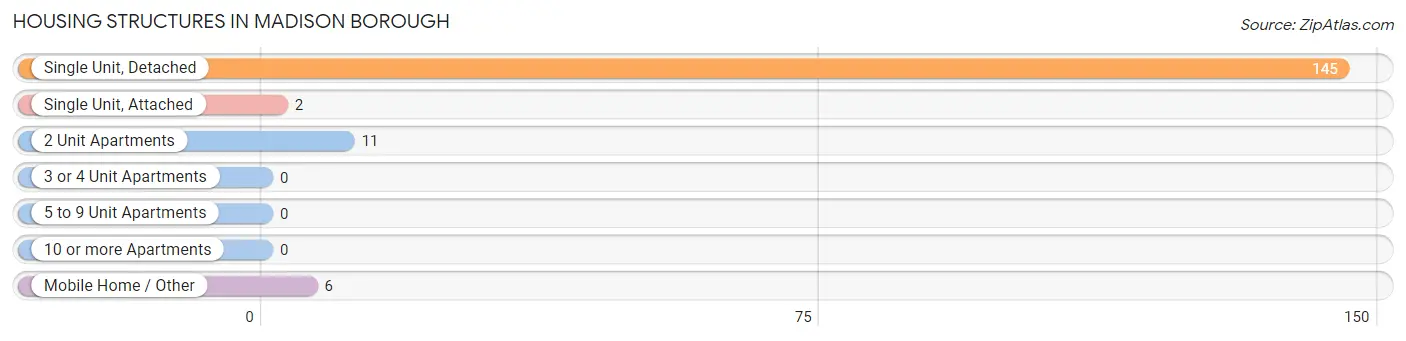
| Structure Type | # Housing Units | % Housing Units |
| Single Unit, Detached | 145 | 88.4% |
| Single Unit, Attached | 2 | 1.2% |
| 2 Unit Apartments | 11 | 6.7% |
| 3 or 4 Unit Apartments | 0 | 0.0% |
| 5 to 9 Unit Apartments | 0 | 0.0% |
| 10 or more Apartments | 0 | 0.0% |
| Mobile Home / Other | 6 | 3.7% |
| Total | 164 | 100.0% |
Housing Structures by Occupancy in Madison borough
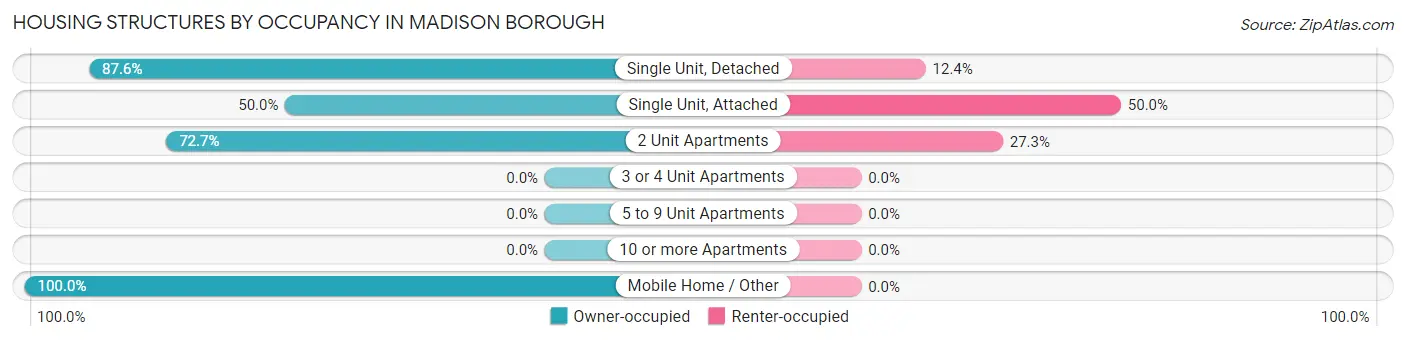
| Structure Type | Owner-occupied | Renter-occupied |
| Single Unit, Detached | 127 (87.6%) | 18 (12.4%) |
| Single Unit, Attached | 1 (50.0%) | 1 (50.0%) |
| 2 Unit Apartments | 8 (72.7%) | 3 (27.3%) |
| 3 or 4 Unit Apartments | 0 (0.0%) | 0 (0.0%) |
| 5 to 9 Unit Apartments | 0 (0.0%) | 0 (0.0%) |
| 10 or more Apartments | 0 (0.0%) | 0 (0.0%) |
| Mobile Home / Other | 6 (100.0%) | 0 (0.0%) |
| Total | 142 (86.6%) | 22 (13.4%) |
Housing Structures by Number of Rooms in Madison borough
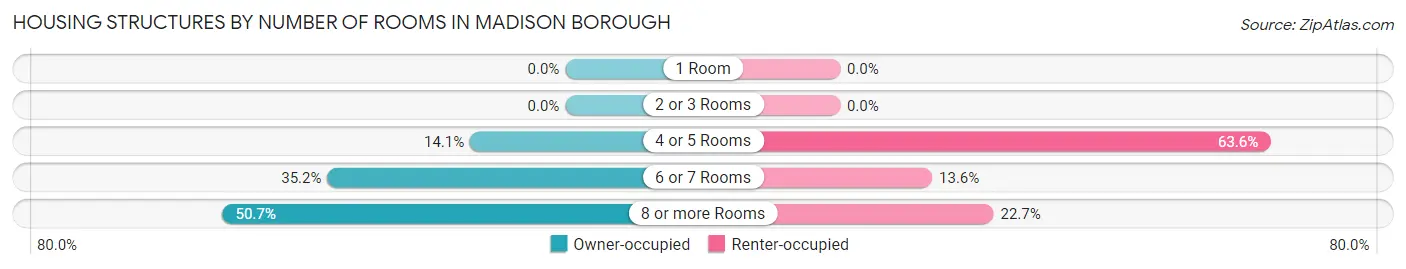
| Number of Rooms | Owner-occupied | Renter-occupied |
| 1 Room | 0 (0.0%) | 0 (0.0%) |
| 2 or 3 Rooms | 0 (0.0%) | 0 (0.0%) |
| 4 or 5 Rooms | 20 (14.1%) | 14 (63.6%) |
| 6 or 7 Rooms | 50 (35.2%) | 3 (13.6%) |
| 8 or more Rooms | 72 (50.7%) | 5 (22.7%) |
| Total | 142 (100.0%) | 22 (100.0%) |
Housing Structure by Heating Type in Madison borough
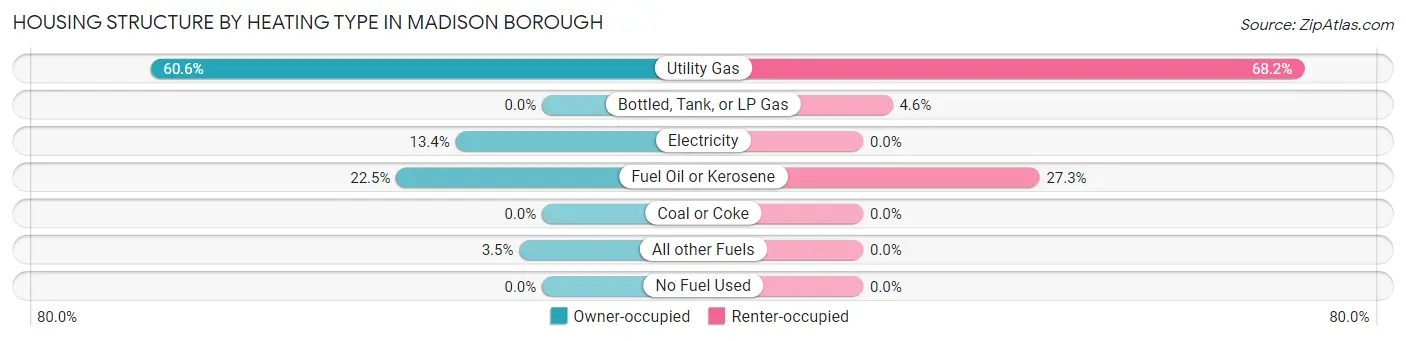
| Heating Type | Owner-occupied | Renter-occupied |
| Utility Gas | 86 (60.6%) | 15 (68.2%) |
| Bottled, Tank, or LP Gas | 0 (0.0%) | 1 (4.5%) |
| Electricity | 19 (13.4%) | 0 (0.0%) |
| Fuel Oil or Kerosene | 32 (22.5%) | 6 (27.3%) |
| Coal or Coke | 0 (0.0%) | 0 (0.0%) |
| All other Fuels | 5 (3.5%) | 0 (0.0%) |
| No Fuel Used | 0 (0.0%) | 0 (0.0%) |
| Total | 142 (100.0%) | 22 (100.0%) |
Household Vehicle Usage in Madison borough
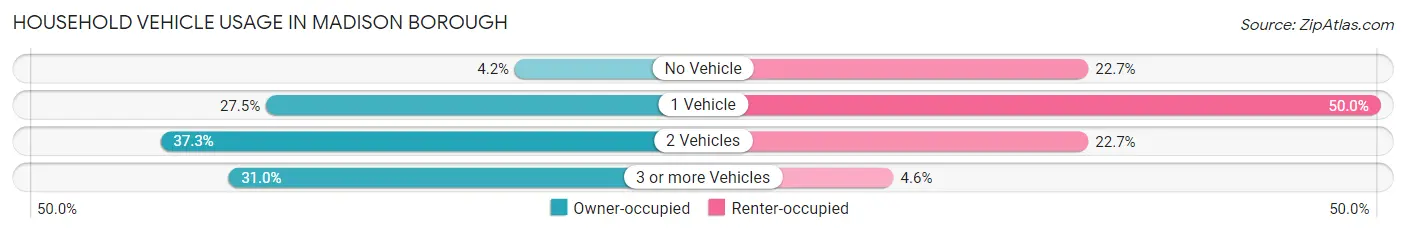
| Vehicles per Household | Owner-occupied | Renter-occupied |
| No Vehicle | 6 (4.2%) | 5 (22.7%) |
| 1 Vehicle | 39 (27.5%) | 11 (50.0%) |
| 2 Vehicles | 53 (37.3%) | 5 (22.7%) |
| 3 or more Vehicles | 44 (31.0%) | 1 (4.5%) |
| Total | 142 (100.0%) | 22 (100.0%) |
Real Estate & Mortgages in Madison borough
Real Estate and Mortgage Overview in Madison borough
| Characteristic | Without Mortgage | With Mortgage |
| Housing Units | 53 | 89 |
| Median Property Value | $209,200 | $253,400 |
| Median Household Income | $36,964 | $34 |
| Monthly Housing Costs | $479 | $0 |
| Real Estate Taxes | $2,400 | $0 |
Property Value by Mortgage Status in Madison borough
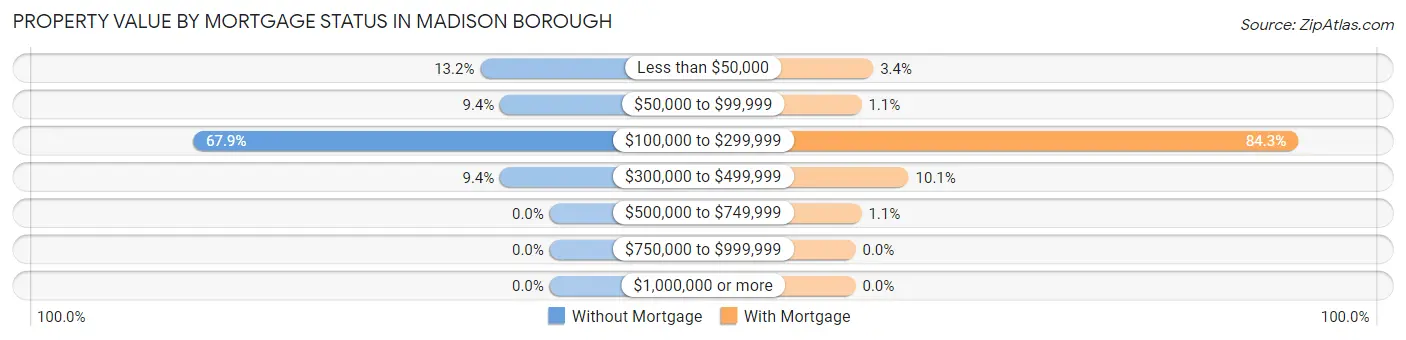
| Property Value | Without Mortgage | With Mortgage |
| Less than $50,000 | 7 (13.2%) | 3 (3.4%) |
| $50,000 to $99,999 | 5 (9.4%) | 1 (1.1%) |
| $100,000 to $299,999 | 36 (67.9%) | 75 (84.3%) |
| $300,000 to $499,999 | 5 (9.4%) | 9 (10.1%) |
| $500,000 to $749,999 | 0 (0.0%) | 1 (1.1%) |
| $750,000 to $999,999 | 0 (0.0%) | 0 (0.0%) |
| $1,000,000 or more | 0 (0.0%) | 0 (0.0%) |
| Total | 53 (100.0%) | 89 (100.0%) |
Household Income by Mortgage Status in Madison borough
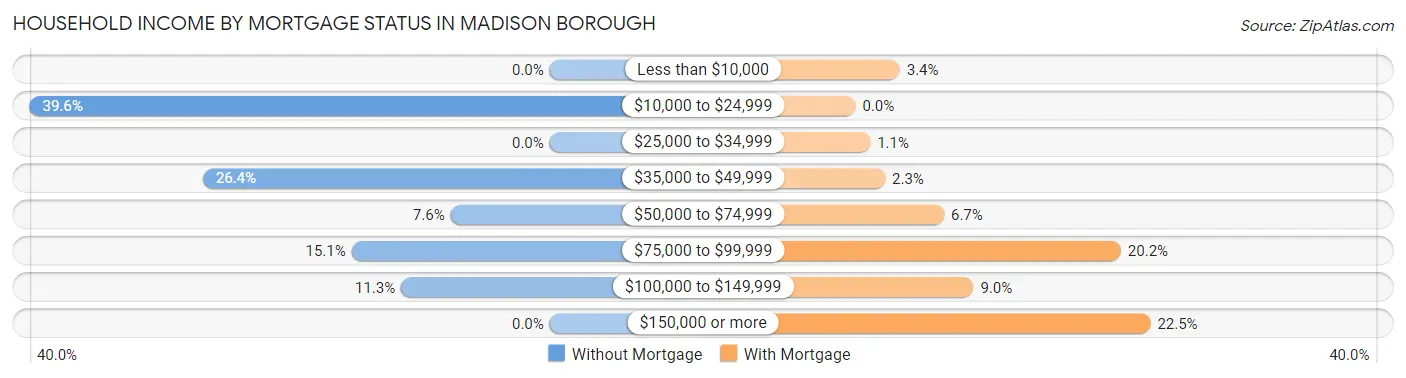
| Household Income | Without Mortgage | With Mortgage |
| Less than $10,000 | 0 (0.0%) | 3 (3.4%) |
| $10,000 to $24,999 | 21 (39.6%) | 0 (0.0%) |
| $25,000 to $34,999 | 0 (0.0%) | 1 (1.1%) |
| $35,000 to $49,999 | 14 (26.4%) | 2 (2.2%) |
| $50,000 to $74,999 | 4 (7.5%) | 6 (6.7%) |
| $75,000 to $99,999 | 8 (15.1%) | 18 (20.2%) |
| $100,000 to $149,999 | 6 (11.3%) | 8 (9.0%) |
| $150,000 or more | 0 (0.0%) | 20 (22.5%) |
| Total | 53 (100.0%) | 89 (100.0%) |
Property Value to Household Income Ratio in Madison borough
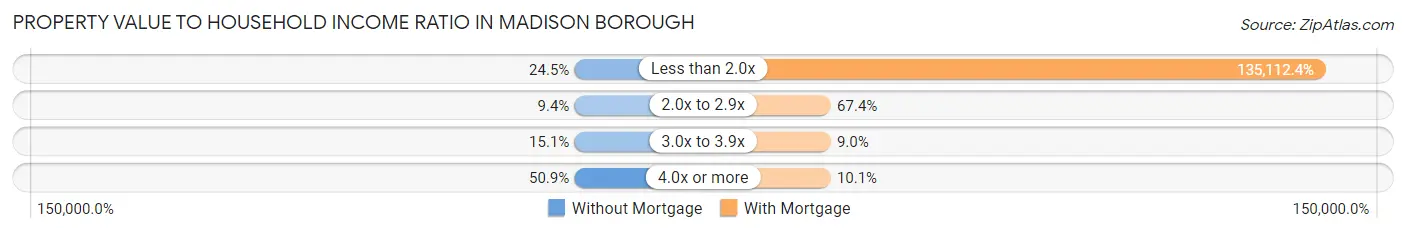
| Value-to-Income Ratio | Without Mortgage | With Mortgage |
| Less than 2.0x | 13 (24.5%) | 120,250 (135,112.4%) |
| 2.0x to 2.9x | 5 (9.4%) | 60 (67.4%) |
| 3.0x to 3.9x | 8 (15.1%) | 8 (9.0%) |
| 4.0x or more | 27 (50.9%) | 9 (10.1%) |
| Total | 53 (100.0%) | 89 (100.0%) |
Real Estate Taxes by Mortgage Status in Madison borough
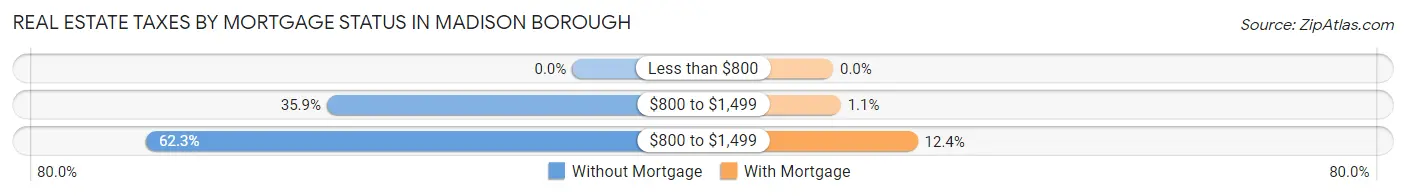
| Property Taxes | Without Mortgage | With Mortgage |
| Less than $800 | 0 (0.0%) | 0 (0.0%) |
| $800 to $1,499 | 19 (35.8%) | 1 (1.1%) |
| $800 to $1,499 | 33 (62.3%) | 11 (12.4%) |
| Total | 53 (100.0%) | 89 (100.0%) |
Health & Disability in Madison borough
Health Insurance Coverage by Age in Madison borough
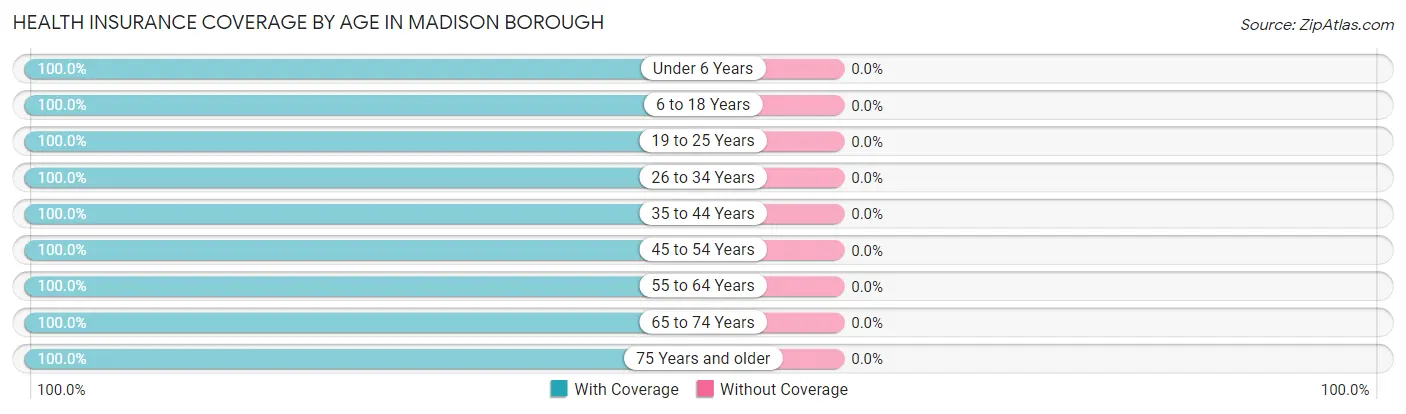
| Age Bracket | With Coverage | Without Coverage |
| Under 6 Years | 11 (100.0%) | 0 (0.0%) |
| 6 to 18 Years | 75 (100.0%) | 0 (0.0%) |
| 19 to 25 Years | 3 (100.0%) | 0 (0.0%) |
| 26 to 34 Years | 39 (100.0%) | 0 (0.0%) |
| 35 to 44 Years | 63 (100.0%) | 0 (0.0%) |
| 45 to 54 Years | 35 (100.0%) | 0 (0.0%) |
| 55 to 64 Years | 51 (100.0%) | 0 (0.0%) |
| 65 to 74 Years | 71 (100.0%) | 0 (0.0%) |
| 75 Years and older | 15 (100.0%) | 0 (0.0%) |
| Total | 363 (100.0%) | 0 (0.0%) |
Health Insurance Coverage by Citizenship Status in Madison borough
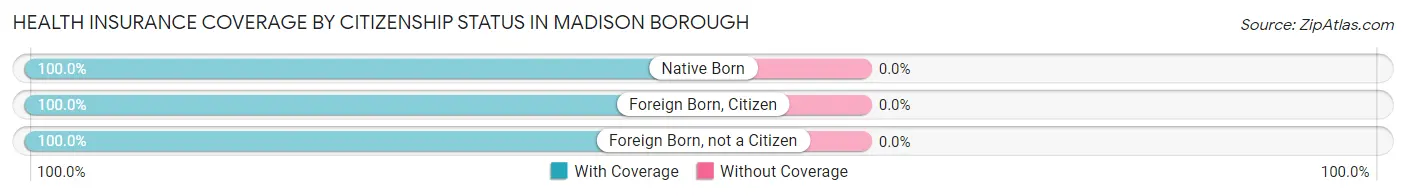
| Citizenship Status | With Coverage | Without Coverage |
| Native Born | 11 (100.0%) | 0 (0.0%) |
| Foreign Born, Citizen | 75 (100.0%) | 0 (0.0%) |
| Foreign Born, not a Citizen | 3 (100.0%) | 0 (0.0%) |
Health Insurance Coverage by Household Income in Madison borough
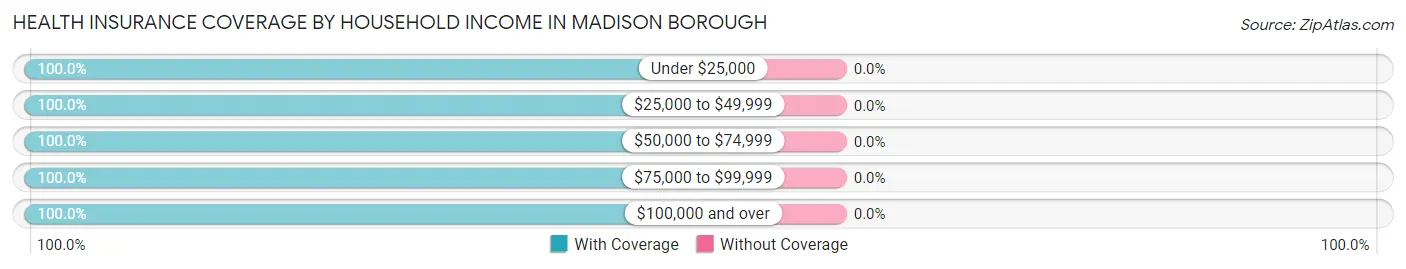
| Household Income | With Coverage | Without Coverage |
| Under $25,000 | 53 (100.0%) | 0 (0.0%) |
| $25,000 to $49,999 | 45 (100.0%) | 0 (0.0%) |
| $50,000 to $74,999 | 66 (100.0%) | 0 (0.0%) |
| $75,000 to $99,999 | 35 (100.0%) | 0 (0.0%) |
| $100,000 and over | 164 (100.0%) | 0 (0.0%) |
Public vs Private Health Insurance Coverage by Age in Madison borough
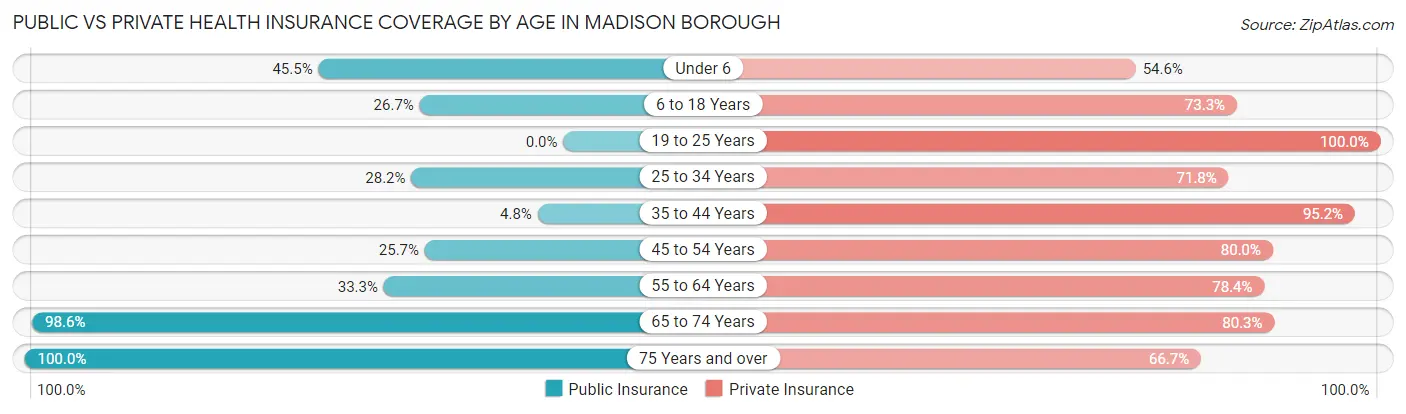
| Age Bracket | Public Insurance | Private Insurance |
| Under 6 | 5 (45.5%) | 6 (54.5%) |
| 6 to 18 Years | 20 (26.7%) | 55 (73.3%) |
| 19 to 25 Years | 0 (0.0%) | 3 (100.0%) |
| 25 to 34 Years | 11 (28.2%) | 28 (71.8%) |
| 35 to 44 Years | 3 (4.8%) | 60 (95.2%) |
| 45 to 54 Years | 9 (25.7%) | 28 (80.0%) |
| 55 to 64 Years | 17 (33.3%) | 40 (78.4%) |
| 65 to 74 Years | 70 (98.6%) | 57 (80.3%) |
| 75 Years and over | 15 (100.0%) | 10 (66.7%) |
| Total | 150 (41.3%) | 287 (79.1%) |
Disability Status by Sex by Age in Madison borough
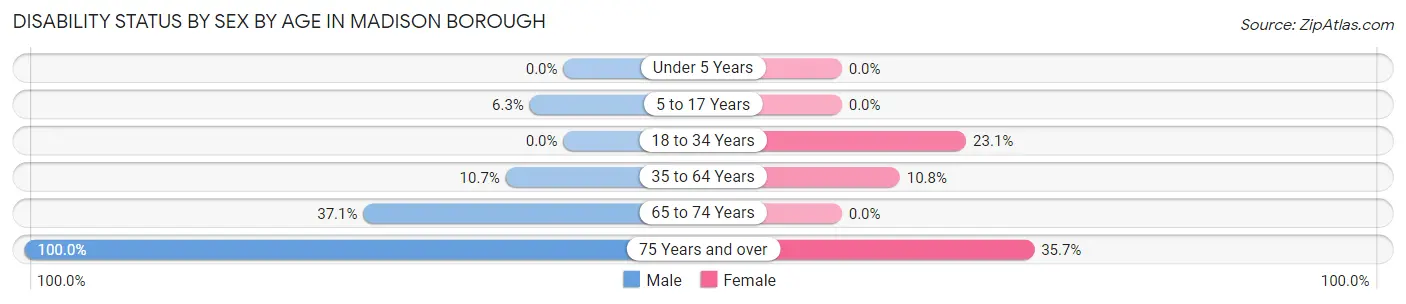
| Age Bracket | Male | Female |
| Under 5 Years | 0 (0.0%) | 0 (0.0%) |
| 5 to 17 Years | 2 (6.2%) | 0 (0.0%) |
| 18 to 34 Years | 0 (0.0%) | 6 (23.1%) |
| 35 to 64 Years | 9 (10.7%) | 7 (10.8%) |
| 65 to 74 Years | 13 (37.1%) | 0 (0.0%) |
| 75 Years and over | 1 (100.0%) | 5 (35.7%) |
Disability Class by Sex by Age in Madison borough
Disability Class: Hearing Difficulty
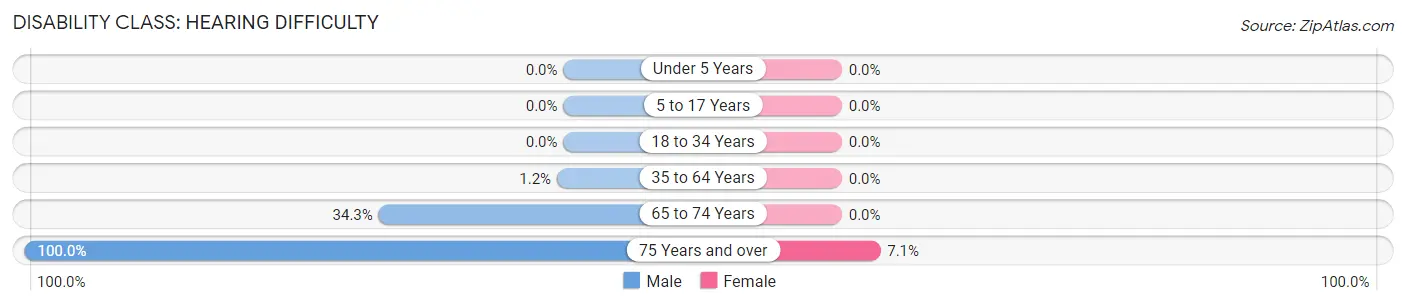
| Age Bracket | Male | Female |
| Under 5 Years | 0 (0.0%) | 0 (0.0%) |
| 5 to 17 Years | 0 (0.0%) | 0 (0.0%) |
| 18 to 34 Years | 0 (0.0%) | 0 (0.0%) |
| 35 to 64 Years | 1 (1.2%) | 0 (0.0%) |
| 65 to 74 Years | 12 (34.3%) | 0 (0.0%) |
| 75 Years and over | 1 (100.0%) | 1 (7.1%) |
Disability Class: Vision Difficulty
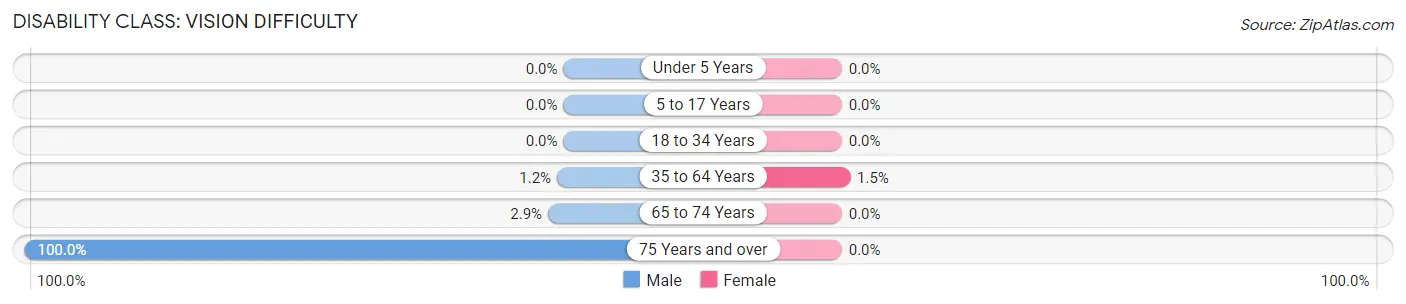
| Age Bracket | Male | Female |
| Under 5 Years | 0 (0.0%) | 0 (0.0%) |
| 5 to 17 Years | 0 (0.0%) | 0 (0.0%) |
| 18 to 34 Years | 0 (0.0%) | 0 (0.0%) |
| 35 to 64 Years | 1 (1.2%) | 1 (1.5%) |
| 65 to 74 Years | 1 (2.9%) | 0 (0.0%) |
| 75 Years and over | 1 (100.0%) | 0 (0.0%) |
Disability Class: Cognitive Difficulty
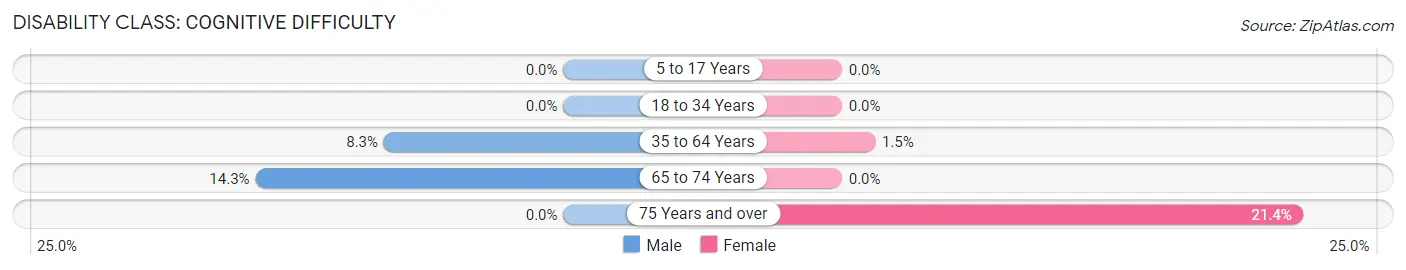
| Age Bracket | Male | Female |
| 5 to 17 Years | 0 (0.0%) | 0 (0.0%) |
| 18 to 34 Years | 0 (0.0%) | 0 (0.0%) |
| 35 to 64 Years | 7 (8.3%) | 1 (1.5%) |
| 65 to 74 Years | 5 (14.3%) | 0 (0.0%) |
| 75 Years and over | 0 (0.0%) | 3 (21.4%) |
Disability Class: Ambulatory Difficulty
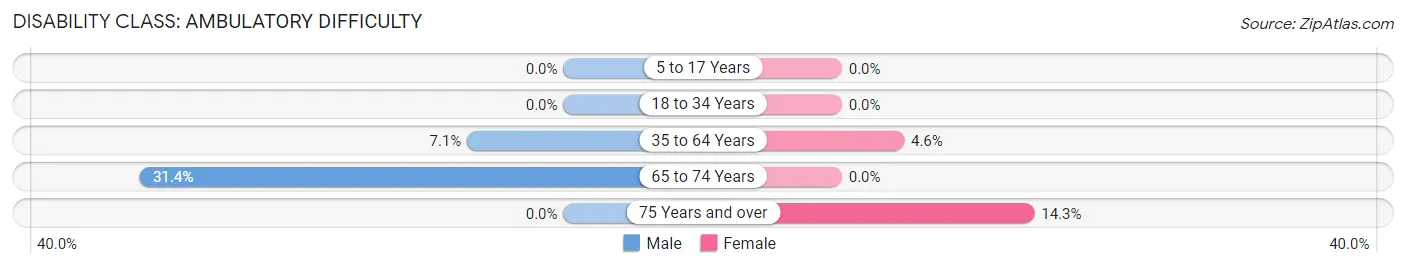
| Age Bracket | Male | Female |
| 5 to 17 Years | 0 (0.0%) | 0 (0.0%) |
| 18 to 34 Years | 0 (0.0%) | 0 (0.0%) |
| 35 to 64 Years | 6 (7.1%) | 3 (4.6%) |
| 65 to 74 Years | 11 (31.4%) | 0 (0.0%) |
| 75 Years and over | 0 (0.0%) | 2 (14.3%) |
Disability Class: Self-Care Difficulty
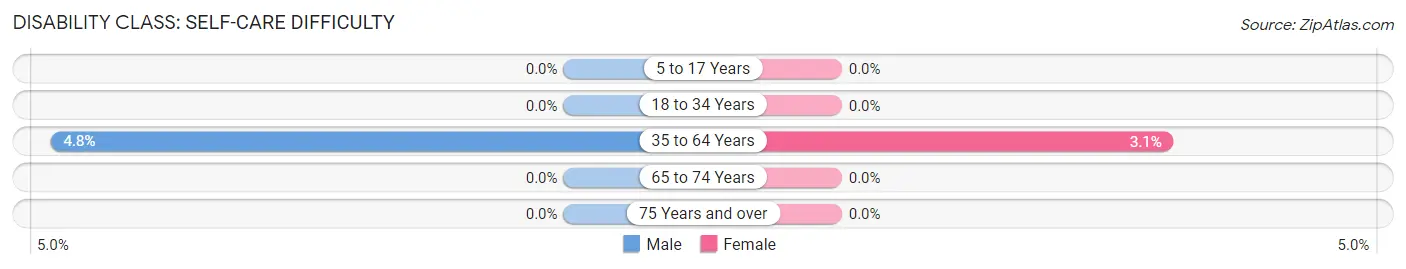
| Age Bracket | Male | Female |
| 5 to 17 Years | 0 (0.0%) | 0 (0.0%) |
| 18 to 34 Years | 0 (0.0%) | 0 (0.0%) |
| 35 to 64 Years | 4 (4.8%) | 2 (3.1%) |
| 65 to 74 Years | 0 (0.0%) | 0 (0.0%) |
| 75 Years and over | 0 (0.0%) | 0 (0.0%) |
Technology Access in Madison borough
Computing Device Access in Madison borough
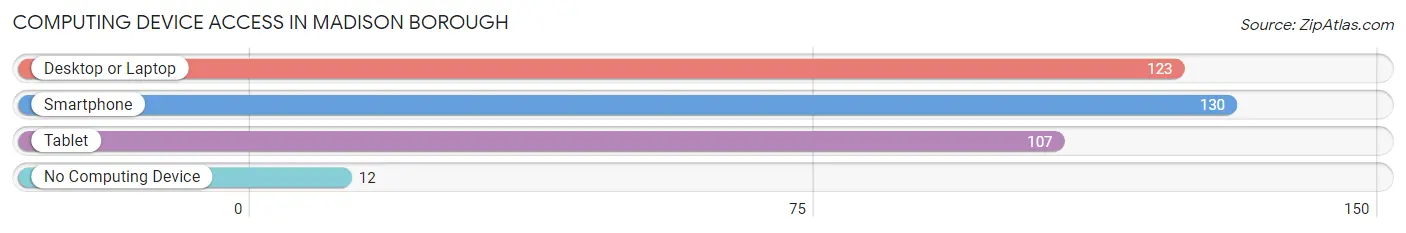
| Device Type | # Households | % Households |
| Desktop or Laptop | 123 | 75.0% |
| Smartphone | 130 | 79.3% |
| Tablet | 107 | 65.2% |
| No Computing Device | 12 | 7.3% |
| Total | 164 | 100.0% |
Internet Access in Madison borough
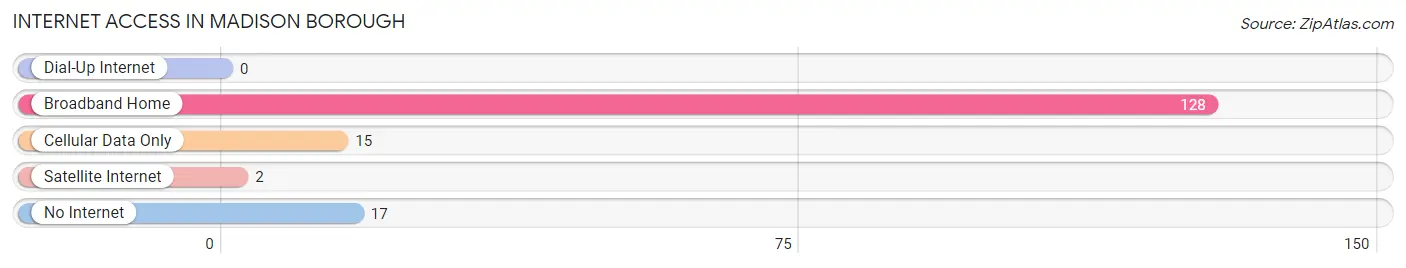
| Internet Type | # Households | % Households |
| Dial-Up Internet | 0 | 0.0% |
| Broadband Home | 128 | 78.0% |
| Cellular Data Only | 15 | 9.1% |
| Satellite Internet | 2 | 1.2% |
| No Internet | 17 | 10.4% |
| Total | 164 | 100.0% |
Madison borough Summary
Introduction
The borough of Madison, Pennsylvania is located in Mercer County, Pennsylvania, United States. It is situated in the northwest corner of the county, approximately 20 miles from the state capital of Harrisburg. The borough was founded in 1814 and is home to a population of approximately 1,400 people. Madison is a small, rural community that is known for its agricultural heritage and its close-knit community.
History
The borough of Madison was founded in 1814 by a group of settlers from New Jersey. The settlers were attracted to the area due to its fertile soil and abundant natural resources. The town was named after James Madison, the fourth President of the United States. The town quickly grew and by 1820, it had a population of over 500 people.
In the late 19th century, Madison became a popular destination for tourists due to its proximity to the Allegheny River and its scenic views. The town was also known for its many churches and its thriving agricultural industry.
In the early 20th century, Madison experienced a period of growth and development. The town was home to several factories, including a brickyard, a sawmill, and a tannery. The town also had a thriving business district, which included several stores, restaurants, and hotels.
Geography
Madison is located in the northwest corner of Mercer County, Pennsylvania. It is situated on the Allegheny River, approximately 20 miles from the state capital of Harrisburg. The borough is bordered by the townships of Sandy Lake, Wilmington, and West Salem.
The borough has a total area of 1.2 square miles, all of which is land. The terrain is mostly flat, with some rolling hills in the northern part of the borough. The borough is located in a humid continental climate zone, with hot summers and cold winters.
Economy
The economy of Madison is largely based on agriculture. The borough is home to several farms, which produce a variety of crops, including corn, soybeans, wheat, and hay. The borough also has a thriving dairy industry, with several local dairy farms.
In addition to agriculture, Madison is home to several small businesses, including restaurants, retail stores, and service providers. The borough also has a small manufacturing sector, which produces a variety of products, including furniture, clothing, and electronics.
Demographics
As of the 2010 census, the borough of Madison had a population of 1,400 people. The racial makeup of the borough was 97.4% White, 0.6% African American, 0.3% Native American, 0.3% Asian, and 1.4% from other races. The median household income was $37,500, and the median family income was $45,000.
Conclusion
The borough of Madison, Pennsylvania is a small, rural community located in Mercer County, Pennsylvania. The borough was founded in 1814 and is home to a population of approximately 1,400 people. Madison is known for its agricultural heritage and its close-knit community. The economy of Madison is largely based on agriculture, with several local farms producing a variety of crops. The borough also has a small manufacturing sector and a thriving business district. The racial makeup of the borough is predominantly White, with a small percentage of African American, Native American, and Asian residents.
Common Questions
What is Per Capita Income in Madison borough?
Per Capita income in Madison borough is $34,736.
What is the Median Family Income in Madison borough?
Median Family Income in Madison borough is $97,500.
What is the Median Household income in Madison borough?
Median Household Income in Madison borough is $70,000.
What is Inequality or Gini Index in Madison borough?
Inequality or Gini Index in Madison borough is 0.37.
What is the Total Population of Madison borough?
Total Population of Madison borough is 363.
What is the Total Male Population of Madison borough?
Total Male Population of Madison borough is 174.
What is the Total Female Population of Madison borough?
Total Female Population of Madison borough is 189.
What is the Ratio of Males per 100 Females in Madison borough?
There are 92.06 Males per 100 Females in Madison borough.
What is the Ratio of Females per 100 Males in Madison borough?
There are 108.62 Females per 100 Males in Madison borough.
What is the Median Population Age in Madison borough?
Median Population Age in Madison borough is 43.1 Years.
What is the Average Family Size in Madison borough
Average Family Size in Madison borough is 2.7 People.
What is the Average Household Size in Madison borough
Average Household Size in Madison borough is 2.2 People.
How Large is the Labor Force in Madison borough?
There are 180 People in the Labor Forcein in Madison borough.
What is the Percentage of People in the Labor Force in Madison borough?
64.1% of People are in the Labor Force in Madison borough.