Bryn Mawr, PA Map & Demographics
Bryn Mawr Map
Bryn Mawr Overview
$43,309
PER CAPITA INCOME
$125,948
AVG FAMILY INCOME
$93,250
AVG HOUSEHOLD INCOME
86.9%
WAGE / INCOME GAP [ % ]
13.1¢/ $1
WAGE / INCOME GAP [ $ ]
0.50
INEQUALITY / GINI INDEX
5,508
TOTAL POPULATION
2,051
MALE POPULATION
3,457
FEMALE POPULATION
59.33
MALES / 100 FEMALES
168.55
FEMALES / 100 MALES
27.5
MEDIAN AGE
2.7
AVG FAMILY SIZE
2.0
AVG HOUSEHOLD SIZE
3,227
LABOR FORCE [ PEOPLE ]
63.0%
PERCENT IN LABOR FORCE
7.4%
UNEMPLOYMENT RATE
Bryn Mawr Zip Codes
Income in Bryn Mawr
Income Overview in Bryn Mawr
Per Capita Income in Bryn Mawr is $43,309, while median incomes of families and households are $125,948 and $93,250 respectively.
| Characteristic | Number | Measure |
| Per Capita Income | 5,508 | $43,309 |
| Median Family Income | 900 | $125,948 |
| Mean Family Income | 900 | $176,762 |
| Median Household Income | 1,862 | $93,250 |
| Mean Household Income | 1,862 | $123,190 |
| Income Deficit | 900 | $0 |
| Wage / Income Gap (%) | 5,508 | 86.93% |
| Wage / Income Gap ($) | 5,508 | 13.07¢ per $1 |
| Gini / Inequality Index | 5,508 | 0.50 |
Earnings by Sex in Bryn Mawr
Average Earnings in Bryn Mawr are $22,297, $73,611 for men and $9,620 for women, a difference of 86.9%.
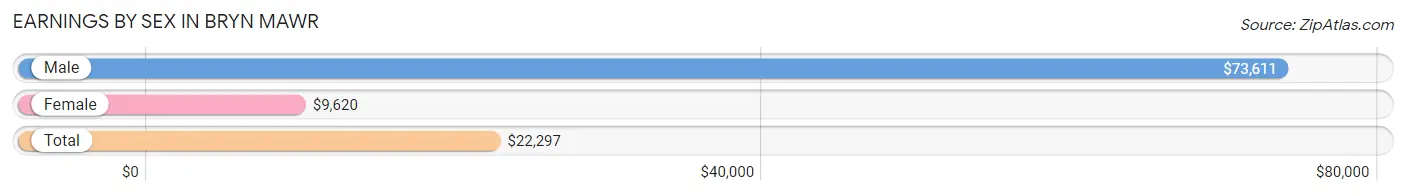
| Sex | Number | Average Earnings |
| Male | 1,324 (36.1%) | $73,611 |
| Female | 2,343 (63.9%) | $9,620 |
| Total | 3,667 (100.0%) | $22,297 |
Earnings by Sex by Income Bracket in Bryn Mawr
The most common earnings brackets in Bryn Mawr are $75,000 to $99,999 for men (354 | 26.7%) and $2,499 or less for women (640 | 27.3%).
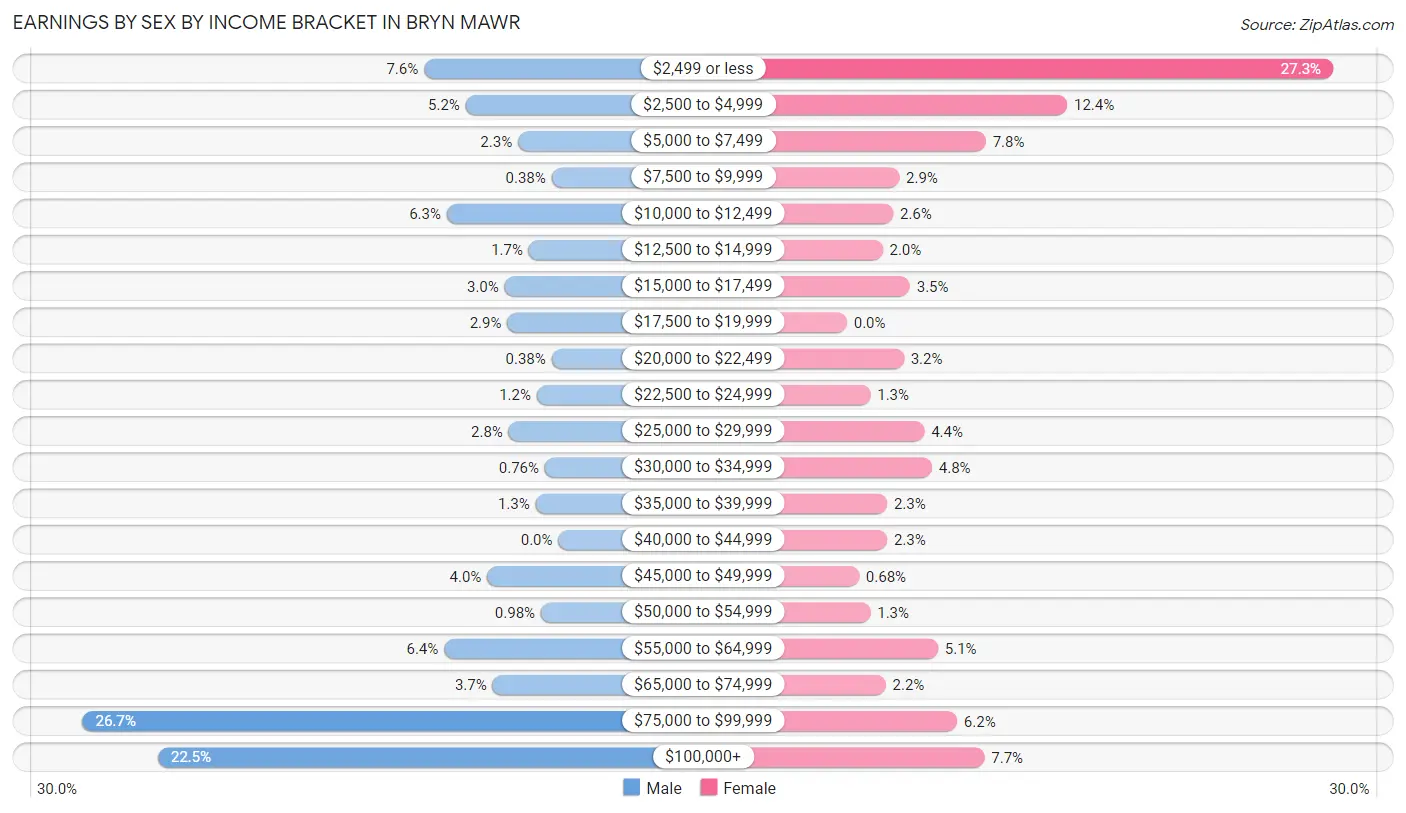
| Income | Male | Female |
| $2,499 or less | 100 (7.5%) | 640 (27.3%) |
| $2,500 to $4,999 | 69 (5.2%) | 290 (12.4%) |
| $5,000 to $7,499 | 30 (2.3%) | 183 (7.8%) |
| $7,500 to $9,999 | 5 (0.4%) | 69 (2.9%) |
| $10,000 to $12,499 | 83 (6.3%) | 61 (2.6%) |
| $12,500 to $14,999 | 22 (1.7%) | 47 (2.0%) |
| $15,000 to $17,499 | 40 (3.0%) | 83 (3.5%) |
| $17,500 to $19,999 | 38 (2.9%) | 0 (0.0%) |
| $20,000 to $22,499 | 5 (0.4%) | 75 (3.2%) |
| $22,500 to $24,999 | 16 (1.2%) | 31 (1.3%) |
| $25,000 to $29,999 | 37 (2.8%) | 102 (4.3%) |
| $30,000 to $34,999 | 10 (0.8%) | 112 (4.8%) |
| $35,000 to $39,999 | 17 (1.3%) | 53 (2.3%) |
| $40,000 to $44,999 | 0 (0.0%) | 53 (2.3%) |
| $45,000 to $49,999 | 53 (4.0%) | 16 (0.7%) |
| $50,000 to $54,999 | 13 (1.0%) | 31 (1.3%) |
| $55,000 to $64,999 | 85 (6.4%) | 120 (5.1%) |
| $65,000 to $74,999 | 49 (3.7%) | 51 (2.2%) |
| $75,000 to $99,999 | 354 (26.7%) | 145 (6.2%) |
| $100,000+ | 298 (22.5%) | 181 (7.7%) |
| Total | 1,324 (100.0%) | 2,343 (100.0%) |
Earnings by Sex by Educational Attainment in Bryn Mawr
Average earnings in Bryn Mawr are $80,150 for men and $51,190 for women, a difference of 36.1%. Men with an educational attainment of graduate degree enjoy the highest average annual earnings of $93,281, while those with college or associate's degree education earn the least with $63,681. Women with an educational attainment of graduate degree earn the most with the average annual earnings of $71,750, while those with high school diploma education have the smallest earnings of $30,511.
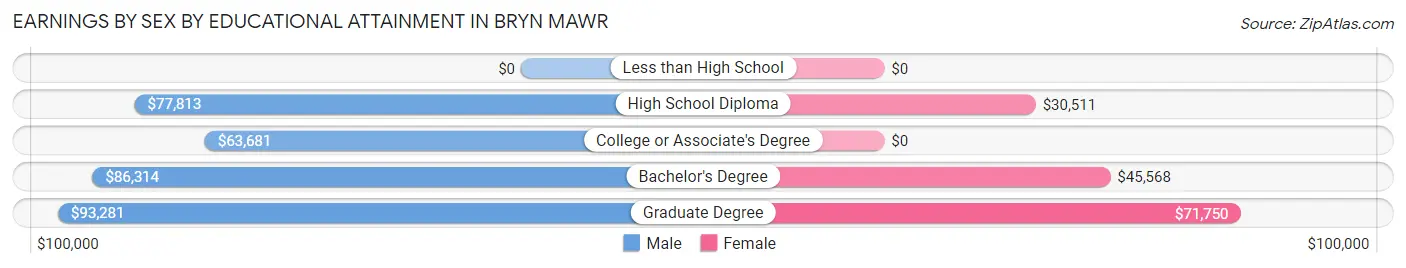
| Educational Attainment | Male Income | Female Income |
| Less than High School | - | - |
| High School Diploma | $77,813 | $30,511 |
| College or Associate's Degree | $63,681 | $0 |
| Bachelor's Degree | $86,314 | $45,568 |
| Graduate Degree | $93,281 | $71,750 |
| Total | $80,150 | $51,190 |
Family Income in Bryn Mawr
Family Income Brackets in Bryn Mawr
According to the Bryn Mawr family income data, there are 306 families falling into the $100,000 to $149,999 income range, which is the most common income bracket and makes up 34.0% of all families.
| Income Bracket | # Families | % Families |
| Less than $10,000 | 13 | 1.4% |
| $10,000 to $14,999 | 0 | 0.0% |
| $15,000 to $24,999 | 9 | 1.0% |
| $25,000 to $34,999 | 12 | 1.3% |
| $35,000 to $49,999 | 46 | 5.1% |
| $50,000 to $74,999 | 55 | 6.1% |
| $75,000 to $99,999 | 92 | 10.2% |
| $100,000 to $149,999 | 306 | 34.0% |
| $150,000 to $199,999 | 105 | 11.7% |
| $200,000+ | 262 | 29.1% |
Family Income by Famaliy Size in Bryn Mawr
4-person families (93 | 10.3%) account for the highest median family income in Bryn Mawr with $250,001 per family, while 4-person families (93 | 10.3%) have the highest median income of $62,500 per family member.
| Income Bracket | # Families | Median Income |
| 2-Person Families | 512 (56.9%) | $118,148 |
| 3-Person Families | 223 (24.8%) | $79,583 |
| 4-Person Families | 93 (10.3%) | $250,001 |
| 5-Person Families | 62 (6.9%) | $0 |
| 6-Person Families | 10 (1.1%) | $0 |
| 7+ Person Families | 0 (0.0%) | $0 |
| Total | 900 (100.0%) | $125,948 |
Family Income by Number of Earners in Bryn Mawr
The median family income in Bryn Mawr is $125,948, with families comprising 3+ earners (76) having the highest median family income of $161,000, while families with no earners (120) have the lowest median family income of $97,917, accounting for 8.4% and 13.3% of families, respectively.
| Number of Earners | # Families | Median Income |
| No Earners | 120 (13.3%) | $97,917 |
| 1 Earner | 131 (14.6%) | $138,558 |
| 2 Earners | 573 (63.7%) | $127,361 |
| 3+ Earners | 76 (8.4%) | $161,000 |
| Total | 900 (100.0%) | $125,948 |
Household Income in Bryn Mawr
Household Income Brackets in Bryn Mawr
With 428 households falling in the category, the $100,000 to $149,999 income range is the most frequent in Bryn Mawr, accounting for 23.0% of all households. In contrast, only 41 households (2.2%) fall into the $10,000 to $14,999 income bracket, making it the least populous group.
| Income Bracket | # Households | % Households |
| Less than $10,000 | 223 | 12.0% |
| $10,000 to $14,999 | 41 | 2.2% |
| $15,000 to $24,999 | 48 | 2.6% |
| $25,000 to $34,999 | 58 | 3.1% |
| $35,000 to $49,999 | 190 | 10.2% |
| $50,000 to $74,999 | 166 | 8.9% |
| $75,000 to $99,999 | 223 | 12.0% |
| $100,000 to $149,999 | 428 | 23.0% |
| $150,000 to $199,999 | 138 | 7.4% |
| $200,000+ | 344 | 18.5% |
Household Income by Householder Age in Bryn Mawr
The median household income in Bryn Mawr is $93,250, with the highest median household income of $108,947 found in the 25 to 44 years age bracket for the primary householder. A total of 576 households (30.9%) fall into this category. Meanwhile, the 15 to 24 years age bracket for the primary householder has the lowest median household income of $0, with 292 households (15.7%) in this group.
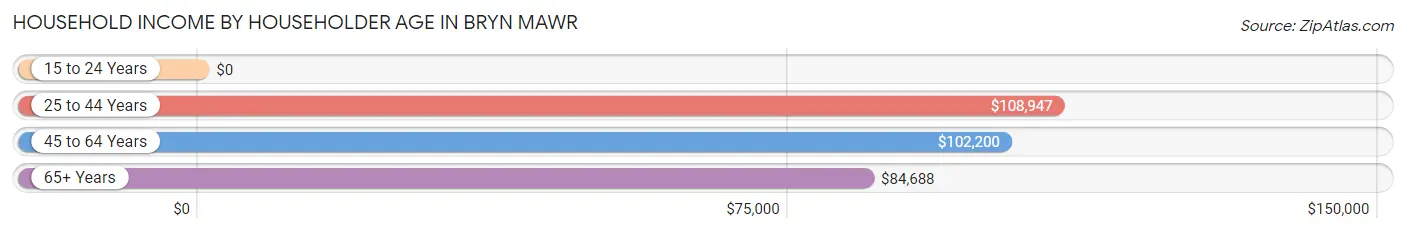
| Income Bracket | # Households | Median Income |
| 15 to 24 Years | 292 (15.7%) | $0 |
| 25 to 44 Years | 576 (30.9%) | $108,947 |
| 45 to 64 Years | 580 (31.1%) | $102,200 |
| 65+ Years | 414 (22.2%) | $84,688 |
| Total | 1,862 (100.0%) | $93,250 |
Poverty in Bryn Mawr
Income Below Poverty by Sex and Age in Bryn Mawr
With 9.9% poverty level for males and 20.2% for females among the residents of Bryn Mawr, 18 to 24 year old males and 5 year old females are the most vulnerable to poverty, with 152 males (51.7%) and 10 females (100.0%) in their respective age groups living below the poverty level.
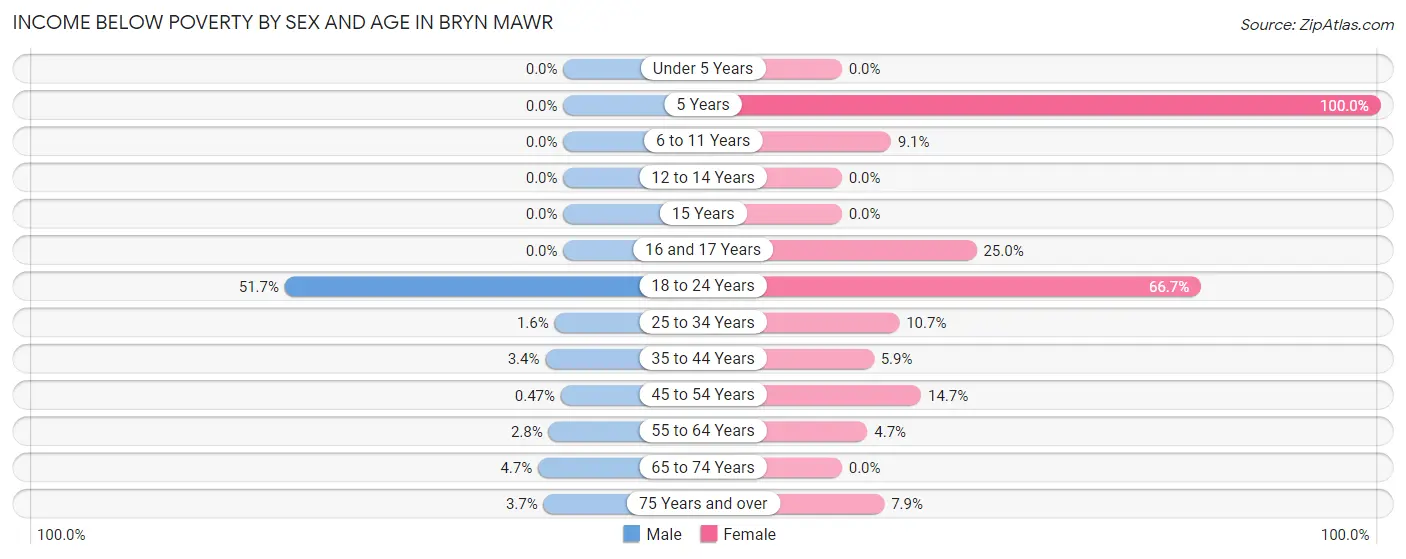
| Age Bracket | Male | Female |
| Under 5 Years | 0 (0.0%) | 0 (0.0%) |
| 5 Years | 0 (0.0%) | 10 (100.0%) |
| 6 to 11 Years | 0 (0.0%) | 7 (9.1%) |
| 12 to 14 Years | 0 (0.0%) | 0 (0.0%) |
| 15 Years | 0 (0.0%) | 0 (0.0%) |
| 16 and 17 Years | 0 (0.0%) | 3 (25.0%) |
| 18 to 24 Years | 152 (51.7%) | 270 (66.7%) |
| 25 to 34 Years | 5 (1.6%) | 39 (10.7%) |
| 35 to 44 Years | 7 (3.4%) | 18 (5.9%) |
| 45 to 54 Years | 1 (0.5%) | 30 (14.7%) |
| 55 to 64 Years | 7 (2.8%) | 10 (4.7%) |
| 65 to 74 Years | 7 (4.7%) | 0 (0.0%) |
| 75 Years and over | 5 (3.7%) | 13 (7.9%) |
| Total | 184 (9.9%) | 400 (20.2%) |
Income Above Poverty by Sex and Age in Bryn Mawr
According to the poverty statistics in Bryn Mawr, males aged under 5 years and females aged under 5 years are the age groups that are most secure financially, with 100.0% of males and 100.0% of females in these age groups living above the poverty line.
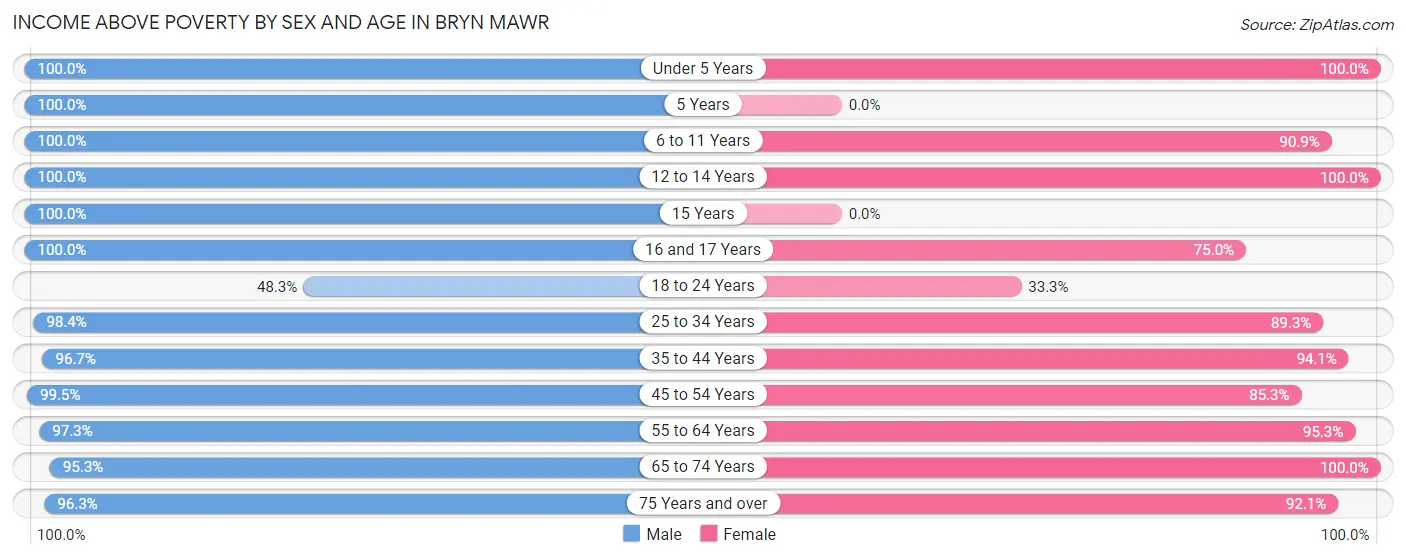
| Age Bracket | Male | Female |
| Under 5 Years | 105 (100.0%) | 13 (100.0%) |
| 5 Years | 40 (100.0%) | 0 (0.0%) |
| 6 to 11 Years | 42 (100.0%) | 70 (90.9%) |
| 12 to 14 Years | 59 (100.0%) | 20 (100.0%) |
| 15 Years | 17 (100.0%) | 0 (0.0%) |
| 16 and 17 Years | 44 (100.0%) | 9 (75.0%) |
| 18 to 24 Years | 142 (48.3%) | 135 (33.3%) |
| 25 to 34 Years | 300 (98.4%) | 327 (89.3%) |
| 35 to 44 Years | 202 (96.7%) | 286 (94.1%) |
| 45 to 54 Years | 210 (99.5%) | 174 (85.3%) |
| 55 to 64 Years | 248 (97.3%) | 201 (95.3%) |
| 65 to 74 Years | 142 (95.3%) | 190 (100.0%) |
| 75 Years and over | 131 (96.3%) | 152 (92.1%) |
| Total | 1,682 (90.1%) | 1,577 (79.8%) |
Income Below Poverty Among Married-Couple Families in Bryn Mawr
The poverty statistics for married-couple families in Bryn Mawr show that 0.9% or 7 of the total 766 families live below the poverty line. Families with no children have the highest poverty rate of 1.4%, comprising of 7 families. On the other hand, families with 1 or 2 children have the lowest poverty rate of 0.0%, which includes 0 families.
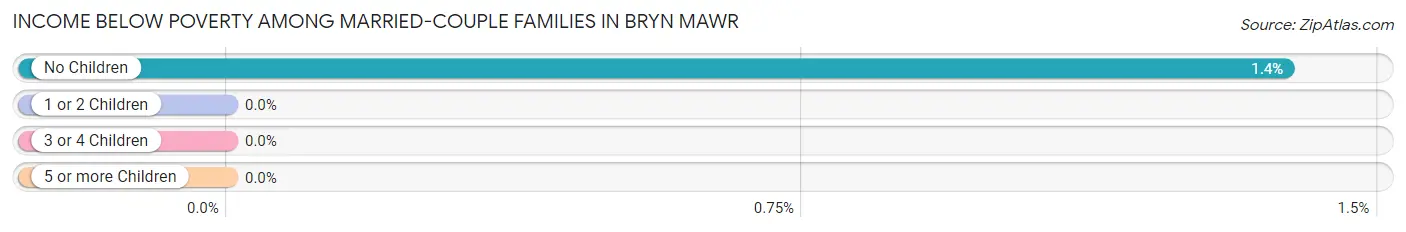
| Children | Above Poverty | Below Poverty |
| No Children | 499 (98.6%) | 7 (1.4%) |
| 1 or 2 Children | 218 (100.0%) | 0 (0.0%) |
| 3 or 4 Children | 42 (100.0%) | 0 (0.0%) |
| 5 or more Children | 0 (0.0%) | 0 (0.0%) |
| Total | 759 (99.1%) | 7 (0.9%) |
Income Below Poverty Among Single-Parent Households in Bryn Mawr
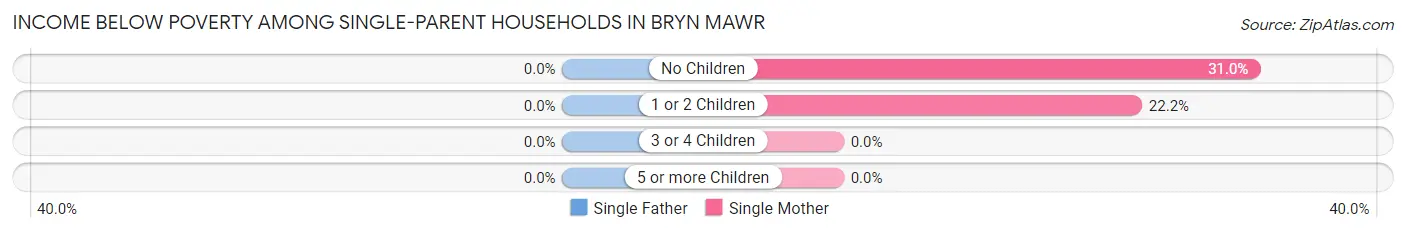
| Children | Single Father | Single Mother |
| No Children | 0 (0.0%) | 9 (31.0%) |
| 1 or 2 Children | 0 (0.0%) | 6 (22.2%) |
| 3 or 4 Children | 0 (0.0%) | 0 (0.0%) |
| 5 or more Children | 0 (0.0%) | 0 (0.0%) |
| Total | 0 (0.0%) | 15 (26.8%) |
Income Below Poverty Among Married-Couple vs Single-Parent Households in Bryn Mawr
The poverty data for Bryn Mawr shows that 7 of the married-couple family households (0.9%) and 15 of the single-parent households (11.2%) are living below the poverty level. Within the married-couple family households, those with no children have the highest poverty rate, with 7 households (1.4%) falling below the poverty line. Among the single-parent households, those with 1 or 2 children have the highest poverty rate, with 6 household (22.2%) living below poverty.
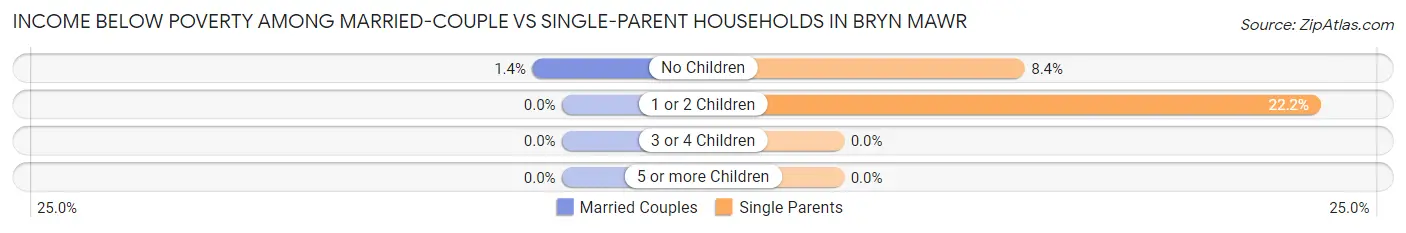
| Children | Married-Couple Families | Single-Parent Households |
| No Children | 7 (1.4%) | 9 (8.4%) |
| 1 or 2 Children | 0 (0.0%) | 6 (22.2%) |
| 3 or 4 Children | 0 (0.0%) | 0 (0.0%) |
| 5 or more Children | 0 (0.0%) | 0 (0.0%) |
| Total | 7 (0.9%) | 15 (11.2%) |
Race in Bryn Mawr
The most populous races in Bryn Mawr are White / Caucasian (4,083 | 74.1%), Hispanic or Latino (689 | 12.5%), and Black / African American (543 | 9.9%).
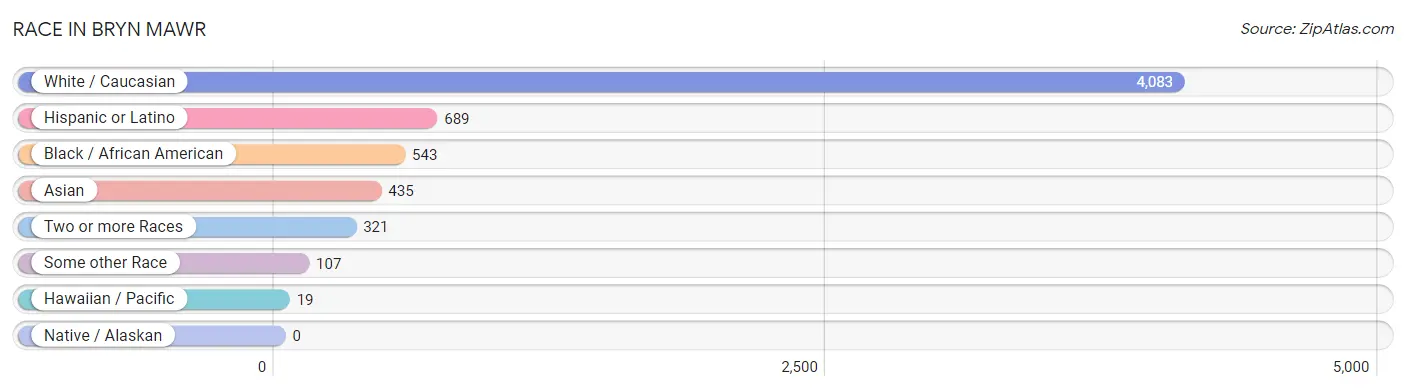
| Race | # Population | % Population |
| Asian | 435 | 7.9% |
| Black / African American | 543 | 9.9% |
| Hawaiian / Pacific | 19 | 0.3% |
| Hispanic or Latino | 689 | 12.5% |
| Native / Alaskan | 0 | 0.0% |
| White / Caucasian | 4,083 | 74.1% |
| Two or more Races | 321 | 5.8% |
| Some other Race | 107 | 1.9% |
| Total | 5,508 | 100.0% |
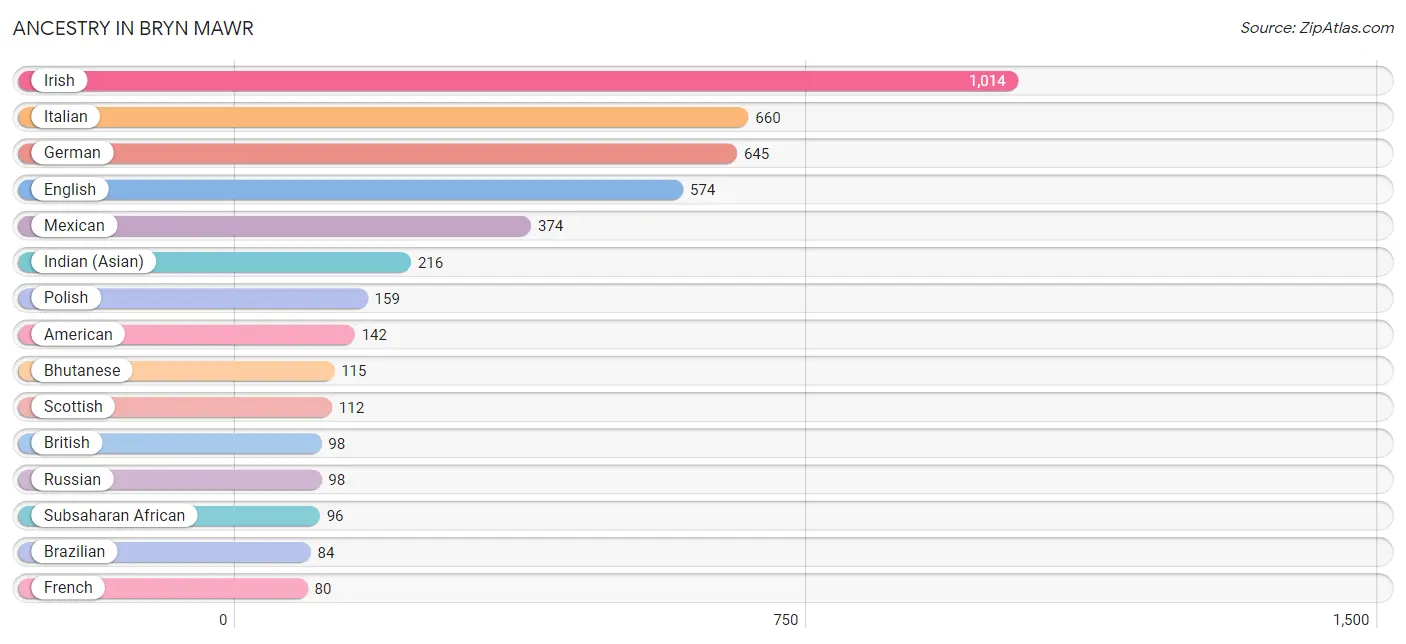
Ancestry in Bryn Mawr
The most populous ancestries reported in Bryn Mawr are Irish (1,014 | 18.4%), Italian (660 | 12.0%), German (645 | 11.7%), English (574 | 10.4%), and Mexican (374 | 6.8%), together accounting for 59.3% of all Bryn Mawr residents.
| Ancestry | # Population | % Population |
| Albanian | 4 | 0.1% |
| Alsatian | 3 | 0.1% |
| American | 142 | 2.6% |
| Arab | 61 | 1.1% |
| Armenian | 55 | 1.0% |
| Australian | 4 | 0.1% |
| Austrian | 59 | 1.1% |
| Barbadian | 11 | 0.2% |
| Belgian | 32 | 0.6% |
| Bhutanese | 115 | 2.1% |
| Blackfeet | 5 | 0.1% |
| Brazilian | 84 | 1.5% |
| British | 98 | 1.8% |
| Burmese | 65 | 1.2% |
| Central American | 70 | 1.3% |
| Central American Indian | 12 | 0.2% |
| Chilean | 10 | 0.2% |
| Chippewa | 4 | 0.1% |
| Colombian | 13 | 0.2% |
| Costa Rican | 19 | 0.3% |
| Cuban | 51 | 0.9% |
| Czech | 45 | 0.8% |
| Dominican | 24 | 0.4% |
| Dutch | 59 | 1.1% |
| Eastern European | 24 | 0.4% |
| Egyptian | 56 | 1.0% |
| English | 574 | 10.4% |
| European | 51 | 0.9% |
| French | 80 | 1.5% |
| French Canadian | 26 | 0.5% |
| German | 645 | 11.7% |
| Ghanaian | 16 | 0.3% |
| Greek | 31 | 0.6% |
| Honduran | 11 | 0.2% |
| Hungarian | 24 | 0.4% |
| Indian (Asian) | 216 | 3.9% |
| Irish | 1,014 | 18.4% |
| Italian | 660 | 12.0% |
| Jamaican | 19 | 0.3% |
| Kenyan | 10 | 0.2% |
| Korean | 29 | 0.5% |
| Latvian | 14 | 0.3% |
| Lebanese | 5 | 0.1% |
| Lithuanian | 8 | 0.2% |
| Mexican | 374 | 6.8% |
| Mexican American Indian | 6 | 0.1% |
| Mongolian | 4 | 0.1% |
| Native Hawaiian | 33 | 0.6% |
| New Zealander | 13 | 0.2% |
| Nigerian | 5 | 0.1% |
| Northern European | 4 | 0.1% |
| Norwegian | 17 | 0.3% |
| Okinawan | 8 | 0.2% |
| Palestinian | 5 | 0.1% |
| Panamanian | 35 | 0.6% |
| Polish | 159 | 2.9% |
| Portuguese | 9 | 0.2% |
| Puerto Rican | 71 | 1.3% |
| Romanian | 5 | 0.1% |
| Russian | 98 | 1.8% |
| Salvadoran | 5 | 0.1% |
| Scandinavian | 24 | 0.4% |
| Scotch-Irish | 68 | 1.2% |
| Scottish | 112 | 2.0% |
| Sioux | 1 | 0.0% |
| Slovak | 4 | 0.1% |
| South African | 33 | 0.6% |
| South American | 43 | 0.8% |
| Spaniard | 17 | 0.3% |
| Sri Lankan | 14 | 0.3% |
| Subsaharan African | 96 | 1.7% |
| Swedish | 20 | 0.4% |
| Swiss | 23 | 0.4% |
| Thai | 79 | 1.4% |
| Trinidadian and Tobagonian | 6 | 0.1% |
| Turkish | 9 | 0.2% |
| Ukrainian | 70 | 1.3% |
| Uruguayan | 7 | 0.1% |
| Venezuelan | 13 | 0.2% |
| Welsh | 15 | 0.3% |
| Zimbabwean | 13 | 0.2% | View All 81 Rows |
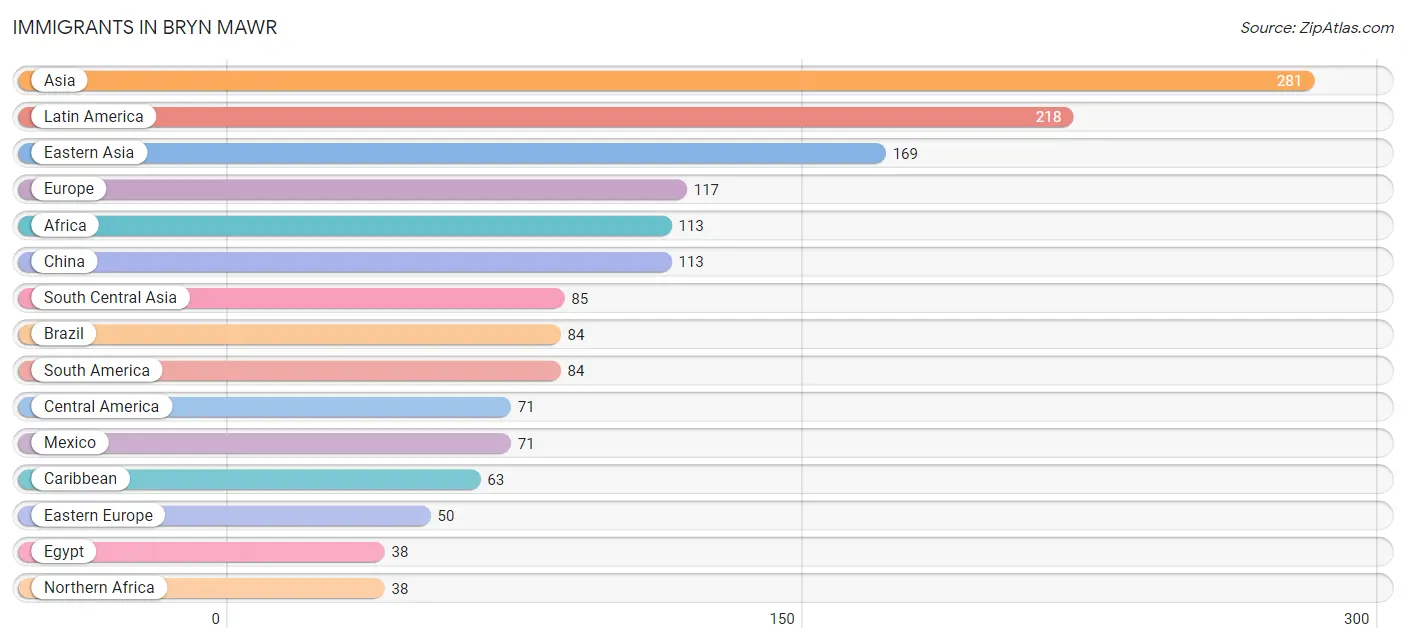
Immigrants in Bryn Mawr
The most numerous immigrant groups reported in Bryn Mawr came from Asia (281 | 5.1%), Latin America (218 | 4.0%), Eastern Asia (169 | 3.1%), Europe (117 | 2.1%), and Africa (113 | 2.1%), together accounting for 16.3% of all Bryn Mawr residents.
| Immigration Origin | # Population | % Population |
| Africa | 113 | 2.1% |
| Albania | 4 | 0.1% |
| Asia | 281 | 5.1% |
| Australia | 4 | 0.1% |
| Bangladesh | 10 | 0.2% |
| Brazil | 84 | 1.5% |
| Caribbean | 63 | 1.1% |
| Central America | 71 | 1.3% |
| China | 113 | 2.1% |
| Cuba | 7 | 0.1% |
| Czechoslovakia | 14 | 0.3% |
| Dominica | 13 | 0.2% |
| Dominican Republic | 24 | 0.4% |
| Eastern Africa | 23 | 0.4% |
| Eastern Asia | 169 | 3.1% |
| Eastern Europe | 50 | 0.9% |
| Egypt | 38 | 0.7% |
| England | 6 | 0.1% |
| Europe | 117 | 2.1% |
| Germany | 11 | 0.2% |
| Hong Kong | 27 | 0.5% |
| India | 30 | 0.5% |
| Jamaica | 19 | 0.3% |
| Japan | 27 | 0.5% |
| Kazakhstan | 4 | 0.1% |
| Kenya | 10 | 0.2% |
| Korea | 29 | 0.5% |
| Latin America | 218 | 4.0% |
| Liberia | 8 | 0.2% |
| Mexico | 71 | 1.3% |
| Middle Africa | 11 | 0.2% |
| Nepal | 33 | 0.6% |
| Netherlands | 7 | 0.1% |
| Northern Africa | 38 | 0.7% |
| Northern Europe | 38 | 0.7% |
| Oceania | 17 | 0.3% |
| Pakistan | 8 | 0.2% |
| Philippines | 6 | 0.1% |
| Russia | 14 | 0.3% |
| Singapore | 12 | 0.2% |
| South Africa | 33 | 0.6% |
| South America | 84 | 1.5% |
| South Central Asia | 85 | 1.5% |
| South Eastern Asia | 18 | 0.3% |
| Switzerland | 11 | 0.2% |
| Turkey | 9 | 0.2% |
| Ukraine | 18 | 0.3% |
| Western Africa | 8 | 0.2% |
| Western Asia | 9 | 0.2% |
| Western Europe | 29 | 0.5% |
| Zaire | 11 | 0.2% |
| Zimbabwe | 13 | 0.2% | View All 52 Rows |
Sex and Age in Bryn Mawr
Sex and Age in Bryn Mawr
The most populous age groups in Bryn Mawr are 20 to 24 Years (318 | 15.5%) for men and 20 to 24 Years (1,062 | 30.7%) for women.
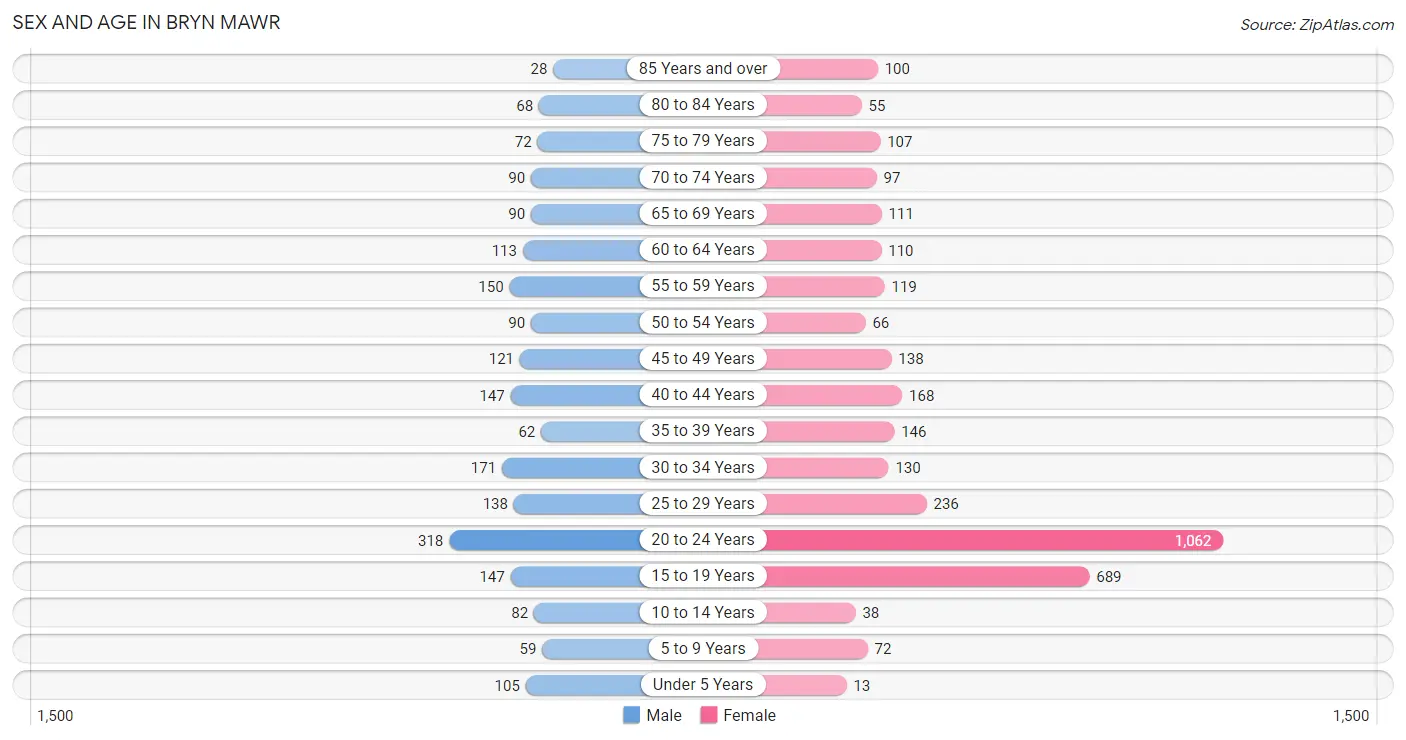
| Age Bracket | Male | Female |
| Under 5 Years | 105 (5.1%) | 13 (0.4%) |
| 5 to 9 Years | 59 (2.9%) | 72 (2.1%) |
| 10 to 14 Years | 82 (4.0%) | 38 (1.1%) |
| 15 to 19 Years | 147 (7.2%) | 689 (19.9%) |
| 20 to 24 Years | 318 (15.5%) | 1,062 (30.7%) |
| 25 to 29 Years | 138 (6.7%) | 236 (6.8%) |
| 30 to 34 Years | 171 (8.3%) | 130 (3.8%) |
| 35 to 39 Years | 62 (3.0%) | 146 (4.2%) |
| 40 to 44 Years | 147 (7.2%) | 168 (4.9%) |
| 45 to 49 Years | 121 (5.9%) | 138 (4.0%) |
| 50 to 54 Years | 90 (4.4%) | 66 (1.9%) |
| 55 to 59 Years | 150 (7.3%) | 119 (3.4%) |
| 60 to 64 Years | 113 (5.5%) | 110 (3.2%) |
| 65 to 69 Years | 90 (4.4%) | 111 (3.2%) |
| 70 to 74 Years | 90 (4.4%) | 97 (2.8%) |
| 75 to 79 Years | 72 (3.5%) | 107 (3.1%) |
| 80 to 84 Years | 68 (3.3%) | 55 (1.6%) |
| 85 Years and over | 28 (1.4%) | 100 (2.9%) |
| Total | 2,051 (100.0%) | 3,457 (100.0%) |
Families and Households in Bryn Mawr
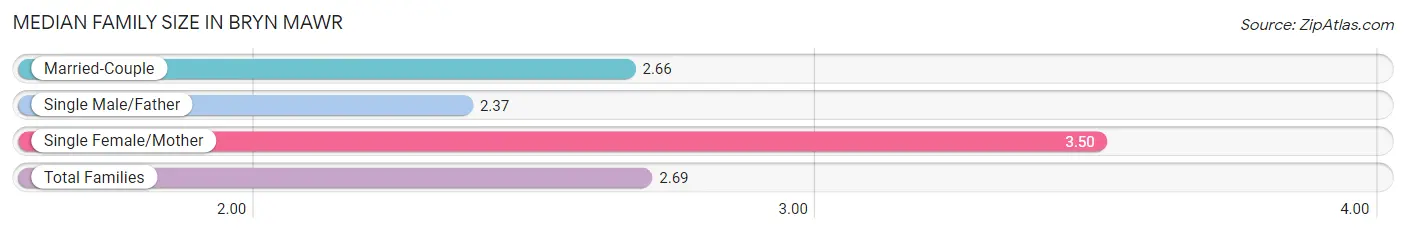
Median Family Size in Bryn Mawr
The median family size in Bryn Mawr is 2.69 persons per family, with single female/mother families (56 | 6.2%) accounting for the largest median family size of 3.5 persons per family. On the other hand, single male/father families (78 | 8.7%) represent the smallest median family size with 2.37 persons per family.
| Family Type | # Families | Family Size |
| Married-Couple | 766 (85.1%) | 2.66 |
| Single Male/Father | 78 (8.7%) | 2.37 |
| Single Female/Mother | 56 (6.2%) | 3.50 |
| Total Families | 900 (100.0%) | 2.69 |
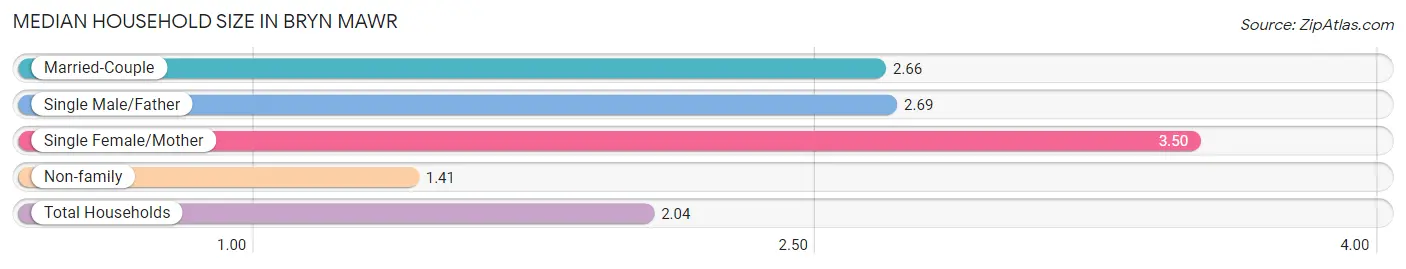
Median Household Size in Bryn Mawr
The median household size in Bryn Mawr is 2.04 persons per household, with single female/mother households (56 | 3.0%) accounting for the largest median household size of 3.5 persons per household. non-family households (962 | 51.7%) represent the smallest median household size with 1.41 persons per household.
| Household Type | # Households | Household Size |
| Married-Couple | 766 (41.1%) | 2.66 |
| Single Male/Father | 78 (4.2%) | 2.69 |
| Single Female/Mother | 56 (3.0%) | 3.50 |
| Non-family | 962 (51.7%) | 1.41 |
| Total Households | 1,862 (100.0%) | 2.04 |
Household Size by Marriage Status in Bryn Mawr
Out of a total of 1,862 households in Bryn Mawr, 900 (48.3%) are family households, while 962 (51.7%) are nonfamily households. The most numerous type of family households are 2-person households, comprising 512, and the most common type of nonfamily households are 1-person households, comprising 683.
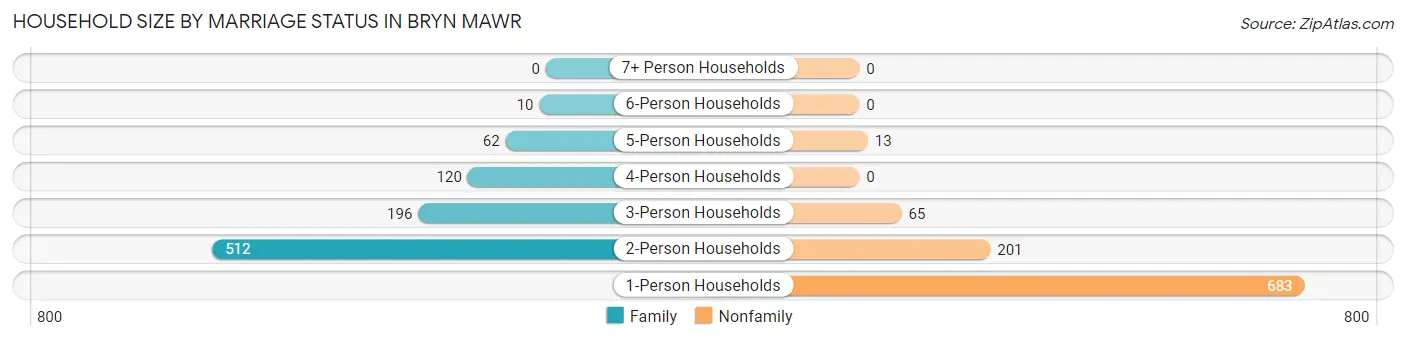
| Household Size | Family Households | Nonfamily Households |
| 1-Person Households | - | 683 (36.7%) |
| 2-Person Households | 512 (27.5%) | 201 (10.8%) |
| 3-Person Households | 196 (10.5%) | 65 (3.5%) |
| 4-Person Households | 120 (6.4%) | 0 (0.0%) |
| 5-Person Households | 62 (3.3%) | 13 (0.7%) |
| 6-Person Households | 10 (0.5%) | 0 (0.0%) |
| 7+ Person Households | 0 (0.0%) | 0 (0.0%) |
| Total | 900 (48.3%) | 962 (51.7%) |
Female Fertility in Bryn Mawr
Fertility by Age in Bryn Mawr
Average fertility rate in Bryn Mawr is 11.0 births per 1,000 women. Women in the age bracket of 20 to 34 years have the highest fertility rate with 20.0 births per 1,000 women. Women in the age bracket of 20 to 34 years acount for 100.0% of all women with births.
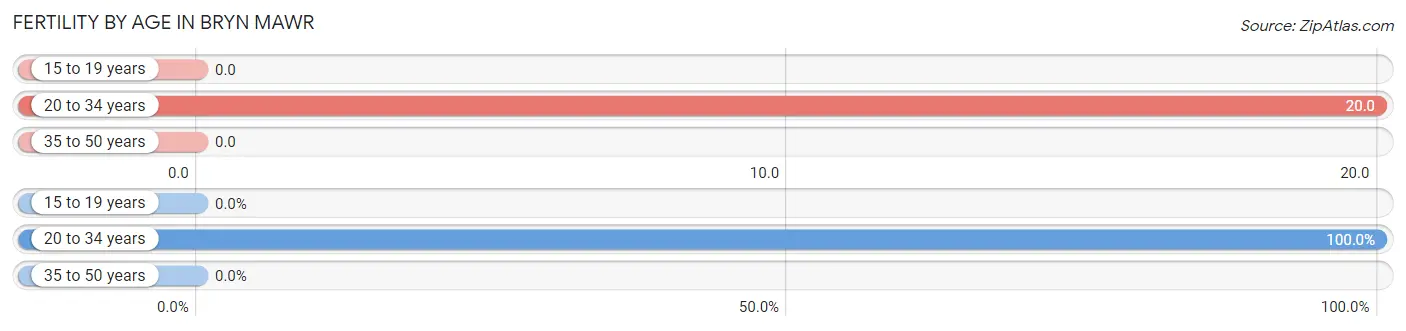
| Age Bracket | Women with Births | Births / 1,000 Women |
| 15 to 19 years | 0 (0.0%) | 0.0 |
| 20 to 34 years | 29 (100.0%) | 20.0 |
| 35 to 50 years | 0 (0.0%) | 0.0 |
| Total | 29 (100.0%) | 11.0 |
Fertility by Age by Marriage Status in Bryn Mawr
34.5% of women with births (29) in Bryn Mawr are married. The highest percentage of unmarried women with births falls into 20 to 34 years age bracket with 65.5% of them unmarried at the time of birth, while the lowest percentage of unmarried women with births belong to 20 to 34 years age bracket with 65.5% of them unmarried.
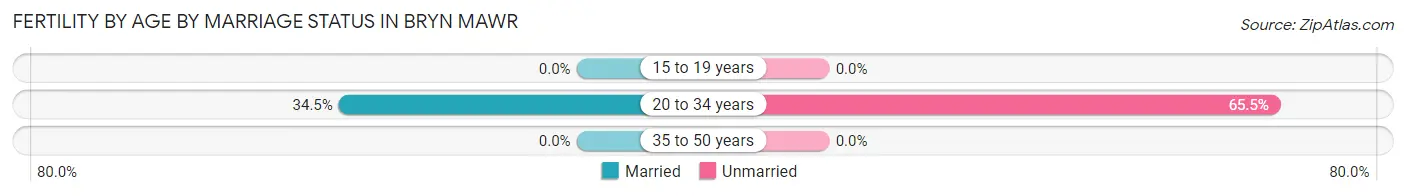
| Age Bracket | Married | Unmarried |
| 15 to 19 years | 0 (0.0%) | 0 (0.0%) |
| 20 to 34 years | 10 (34.5%) | 19 (65.5%) |
| 35 to 50 years | 0 (0.0%) | 0 (0.0%) |
| Total | 10 (34.5%) | 19 (65.5%) |
Fertility by Education in Bryn Mawr
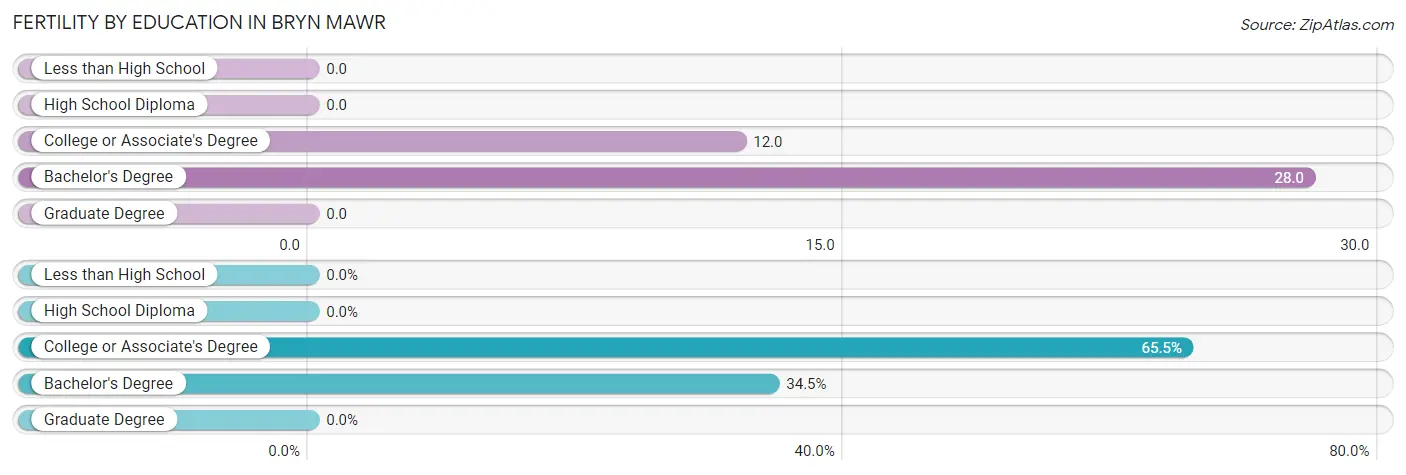
| Educational Attainment | Women with Births | Births / 1,000 Women |
| Less than High School | 0 (0.0%) | 0.0 |
| High School Diploma | 0 (0.0%) | 0.0 |
| College or Associate's Degree | 19 (65.5%) | 12.0 |
| Bachelor's Degree | 10 (34.5%) | 28.0 |
| Graduate Degree | 0 (0.0%) | 0.0 |
| Total | 29 (100.0%) | 11.0 |
Fertility by Education by Marriage Status in Bryn Mawr
65.5% of women with births in Bryn Mawr are unmarried. Women with the educational attainment of bachelor's degree are most likely to be married with 100.0% of them married at childbirth, while women with the educational attainment of college or associate's degree are least likely to be married with 100.0% of them unmarried at childbirth.
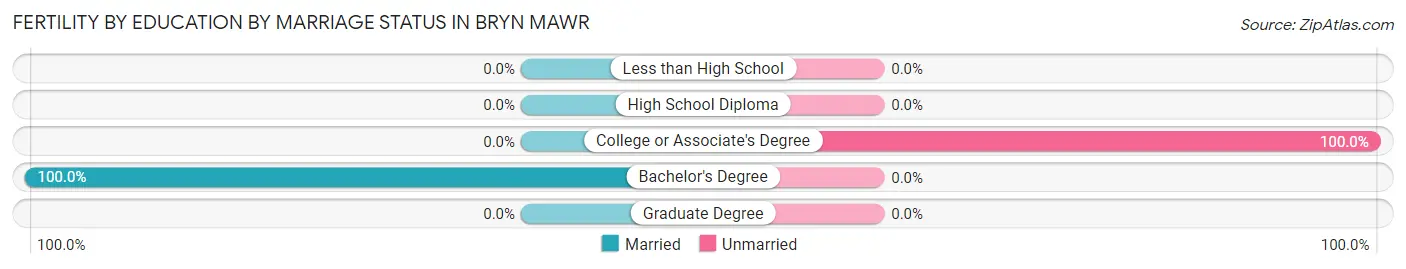
| Educational Attainment | Married | Unmarried |
| Less than High School | 0 (0.0%) | 0 (0.0%) |
| High School Diploma | 0 (0.0%) | 0 (0.0%) |
| College or Associate's Degree | 0 (0.0%) | 19 (100.0%) |
| Bachelor's Degree | 10 (100.0%) | 0 (0.0%) |
| Graduate Degree | 0 (0.0%) | 0 (0.0%) |
| Total | 10 (34.5%) | 19 (65.5%) |
Employment Characteristics in Bryn Mawr
Employment by Class of Employer in Bryn Mawr
Among the 2,897 employed individuals in Bryn Mawr, private company employees (1,642 | 56.7%), not-for-profit organizations (686 | 23.7%), and self-employed (incorporated) (191 | 6.6%) make up the most common classes of employment.
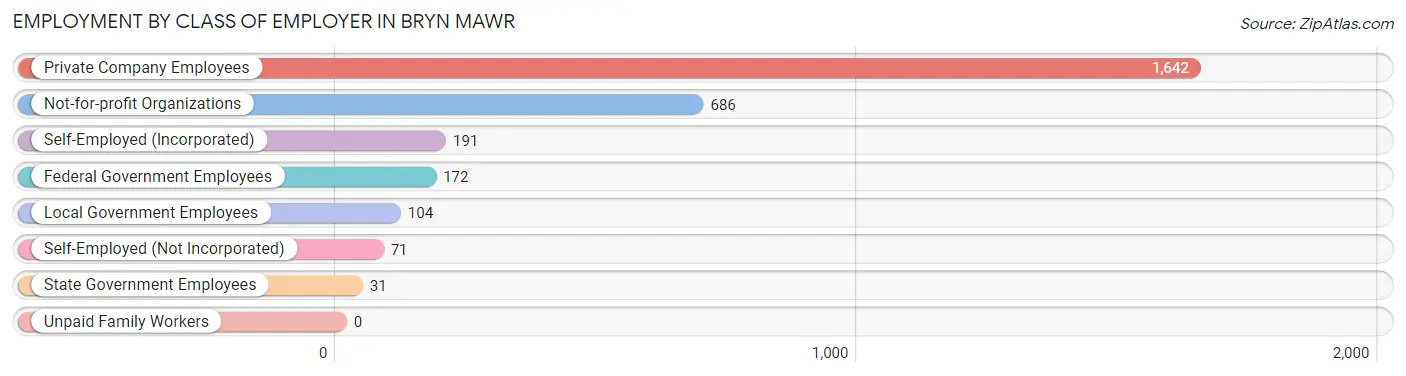
| Employer Class | # Employees | % Employees |
| Private Company Employees | 1,642 | 56.7% |
| Self-Employed (Incorporated) | 191 | 6.6% |
| Self-Employed (Not Incorporated) | 71 | 2.5% |
| Not-for-profit Organizations | 686 | 23.7% |
| Local Government Employees | 104 | 3.6% |
| State Government Employees | 31 | 1.1% |
| Federal Government Employees | 172 | 5.9% |
| Unpaid Family Workers | 0 | 0.0% |
| Total | 2,897 | 100.0% |
Employment Status by Age in Bryn Mawr
According to the labor force statistics for Bryn Mawr, out of the total population over 16 years of age (5,122), 63.0% or 3,227 individuals are in the labor force, with 7.4% or 239 of them unemployed. The age group with the highest labor force participation rate is 30 to 34 years, with 96.7% or 291 individuals in the labor force. Within the labor force, the 25 to 29 years age range has the highest percentage of unemployed individuals, with 13.6% or 44 of them being unemployed.
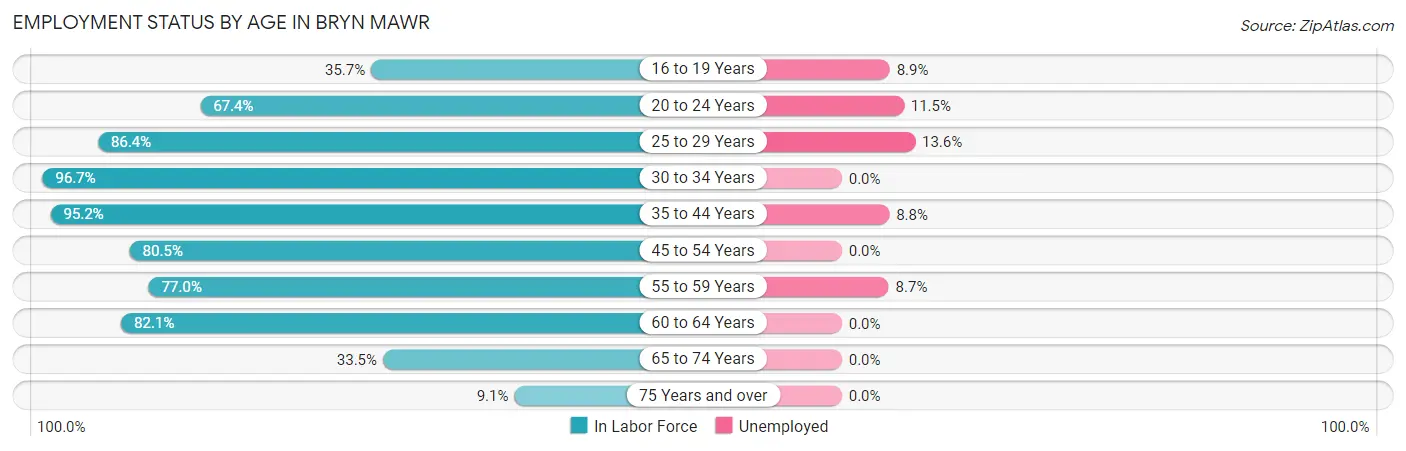
| Age Bracket | In Labor Force | Unemployed |
| 16 to 19 Years | 292 (35.7%) | 26 (8.9%) |
| 20 to 24 Years | 930 (67.4%) | 107 (11.5%) |
| 25 to 29 Years | 323 (86.4%) | 44 (13.6%) |
| 30 to 34 Years | 291 (96.7%) | 0 (0.0%) |
| 35 to 44 Years | 498 (95.2%) | 44 (8.8%) |
| 45 to 54 Years | 334 (80.5%) | 0 (0.0%) |
| 55 to 59 Years | 207 (77.0%) | 18 (8.7%) |
| 60 to 64 Years | 183 (82.1%) | 0 (0.0%) |
| 65 to 74 Years | 130 (33.5%) | 0 (0.0%) |
| 75 Years and over | 39 (9.1%) | 0 (0.0%) |
| Total | 3,227 (63.0%) | 239 (7.4%) |
Employment Status by Educational Attainment in Bryn Mawr
According to labor force statistics for Bryn Mawr, 87.2% of individuals (1,836) out of the total population between 25 and 64 years of age (2,105) are in the labor force, with 5.8% or 106 of them being unemployed. The group with the highest labor force participation rate are those with the educational attainment of bachelor's degree or higher, with 90.2% or 1,245 individuals in the labor force. Within the labor force, individuals with college / associate degree education have the highest percentage of unemployment, with 13.2% or 49 of them being unemployed.
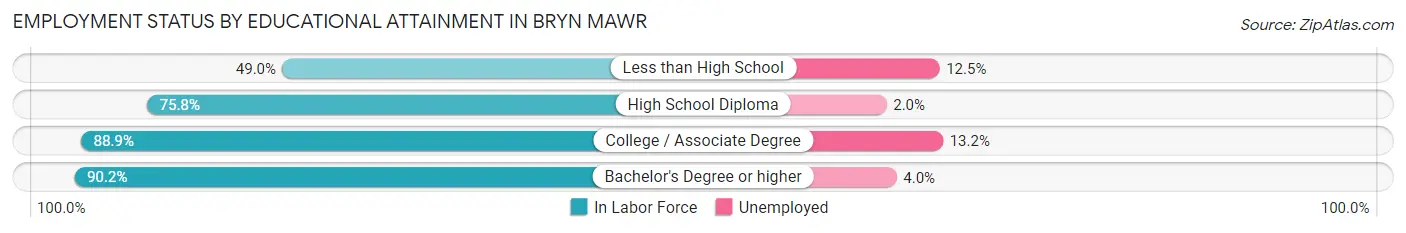
| Educational Attainment | In Labor Force | Unemployed |
| Less than High School | 24 (49.0%) | 6 (12.5%) |
| High School Diploma | 197 (75.8%) | 5 (2.0%) |
| College / Associate Degree | 370 (88.9%) | 55 (13.2%) |
| Bachelor's Degree or higher | 1,245 (90.2%) | 55 (4.0%) |
| Total | 1,836 (87.2%) | 122 (5.8%) |
Employment Occupations by Sex in Bryn Mawr
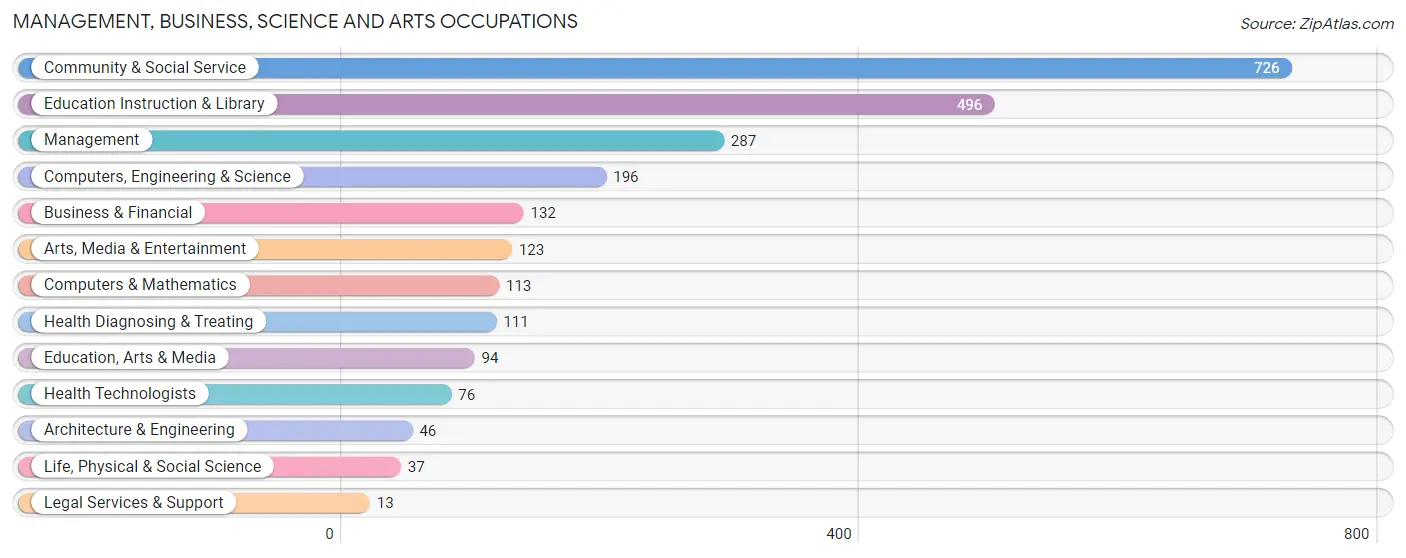
Management, Business, Science and Arts Occupations
The most common Management, Business, Science and Arts occupations in Bryn Mawr are Community & Social Service (726 | 24.4%), Education Instruction & Library (496 | 16.7%), Management (287 | 9.6%), Computers, Engineering & Science (196 | 6.6%), and Business & Financial (132 | 4.4%).
Management, Business, Science and Arts Occupations by Sex
Within the Management, Business, Science and Arts occupations in Bryn Mawr, the most male-oriented occupations are Legal Services & Support (100.0%), Business & Financial (72.0%), and Life, Physical & Social Science (64.9%), while the most female-oriented occupations are Education, Arts & Media (95.7%), Education Instruction & Library (79.2%), and Community & Social Service (79.1%).
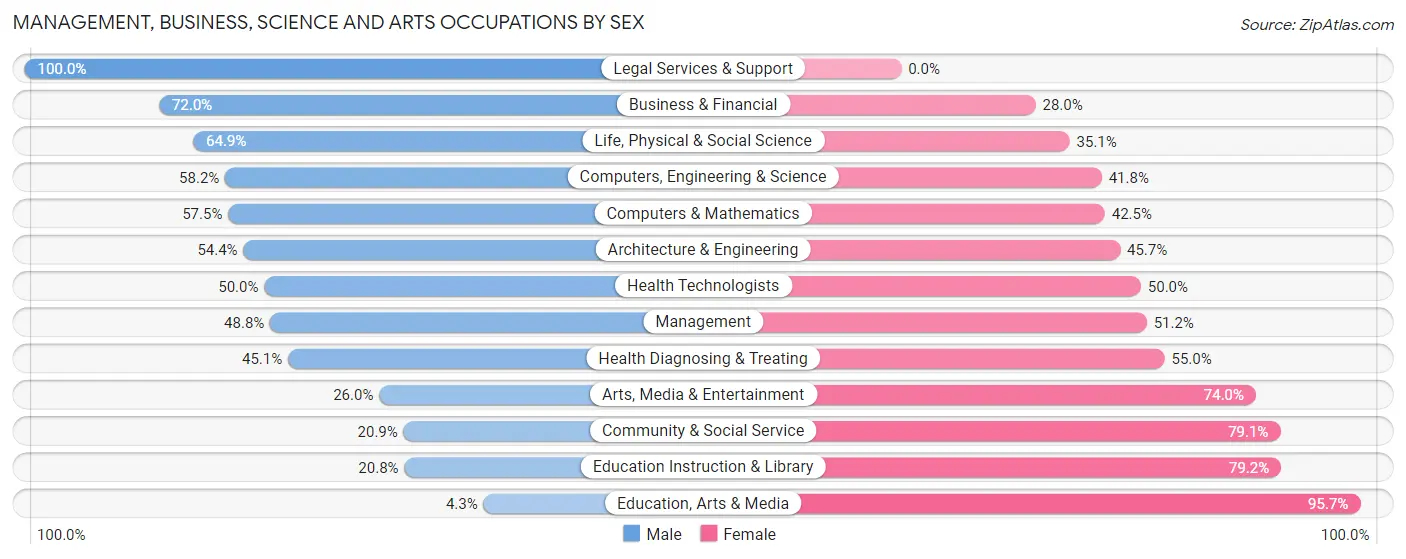
| Occupation | Male | Female |
| Management | 140 (48.8%) | 147 (51.2%) |
| Business & Financial | 95 (72.0%) | 37 (28.0%) |
| Computers, Engineering & Science | 114 (58.2%) | 82 (41.8%) |
| Computers & Mathematics | 65 (57.5%) | 48 (42.5%) |
| Architecture & Engineering | 25 (54.3%) | 21 (45.7%) |
| Life, Physical & Social Science | 24 (64.9%) | 13 (35.1%) |
| Community & Social Service | 152 (20.9%) | 574 (79.1%) |
| Education, Arts & Media | 4 (4.3%) | 90 (95.7%) |
| Legal Services & Support | 13 (100.0%) | 0 (0.0%) |
| Education Instruction & Library | 103 (20.8%) | 393 (79.2%) |
| Arts, Media & Entertainment | 32 (26.0%) | 91 (74.0%) |
| Health Diagnosing & Treating | 50 (45.1%) | 61 (54.9%) |
| Health Technologists | 38 (50.0%) | 38 (50.0%) |
| Total (Category) | 551 (38.0%) | 901 (62.1%) |
| Total (Overall) | 1,193 (40.1%) | 1,786 (60.0%) |
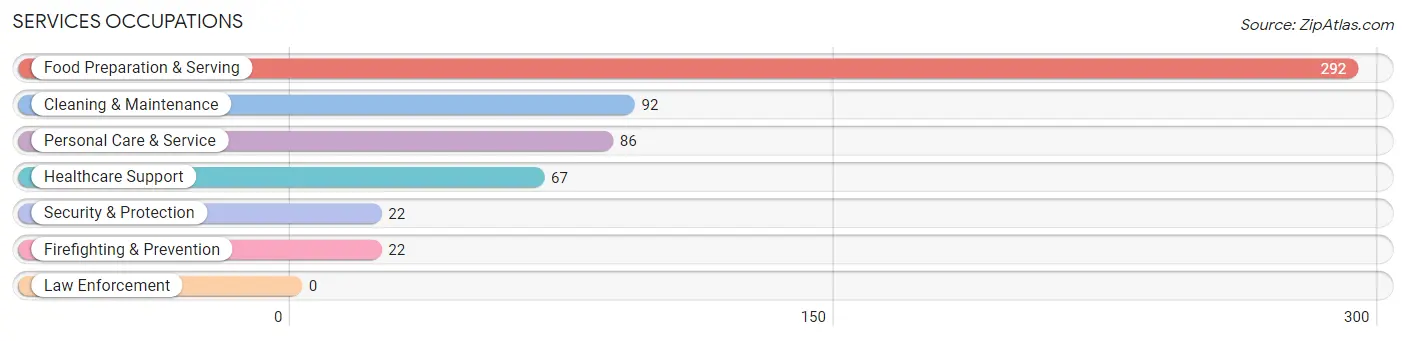
Services Occupations
The most common Services occupations in Bryn Mawr are Food Preparation & Serving (292 | 9.8%), Cleaning & Maintenance (92 | 3.1%), Personal Care & Service (86 | 2.9%), Healthcare Support (67 | 2.2%), and Security & Protection (22 | 0.7%).
Services Occupations by Sex
Within the Services occupations in Bryn Mawr, the most male-oriented occupations are Cleaning & Maintenance (31.5%), Food Preparation & Serving (25.0%), and Security & Protection (22.7%), while the most female-oriented occupations are Healthcare Support (100.0%), Personal Care & Service (87.2%), and Security & Protection (77.3%).
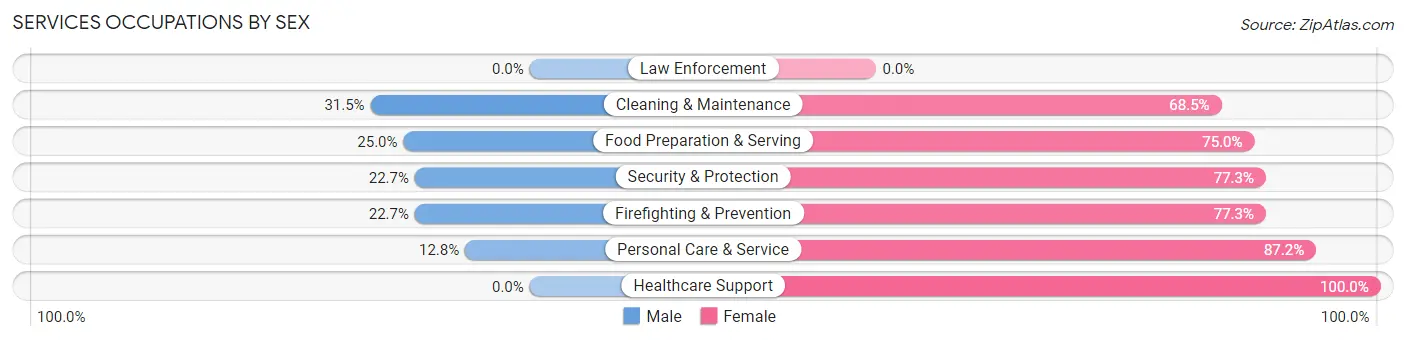
| Occupation | Male | Female |
| Healthcare Support | 0 (0.0%) | 67 (100.0%) |
| Security & Protection | 5 (22.7%) | 17 (77.3%) |
| Firefighting & Prevention | 5 (22.7%) | 17 (77.3%) |
| Law Enforcement | 0 (0.0%) | 0 (0.0%) |
| Food Preparation & Serving | 73 (25.0%) | 219 (75.0%) |
| Cleaning & Maintenance | 29 (31.5%) | 63 (68.5%) |
| Personal Care & Service | 11 (12.8%) | 75 (87.2%) |
| Total (Category) | 118 (21.1%) | 441 (78.9%) |
| Total (Overall) | 1,193 (40.1%) | 1,786 (60.0%) |
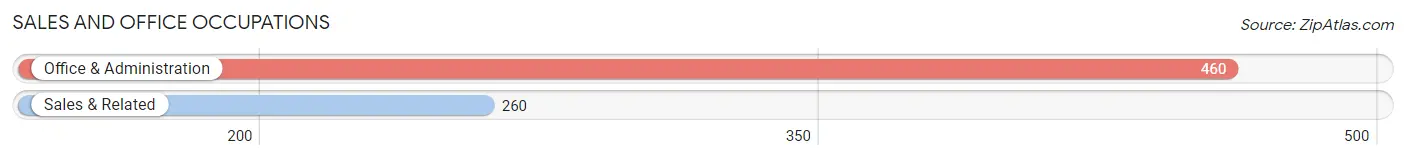
Sales and Office Occupations
The most common Sales and Office occupations in Bryn Mawr are Office & Administration (460 | 15.4%), and Sales & Related (260 | 8.7%).
Sales and Office Occupations by Sex
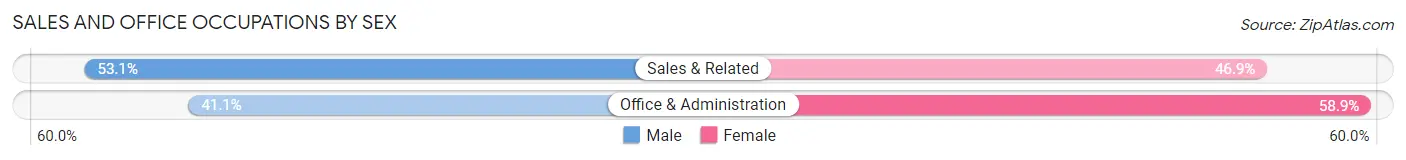
| Occupation | Male | Female |
| Sales & Related | 138 (53.1%) | 122 (46.9%) |
| Office & Administration | 189 (41.1%) | 271 (58.9%) |
| Total (Category) | 327 (45.4%) | 393 (54.6%) |
| Total (Overall) | 1,193 (40.1%) | 1,786 (60.0%) |
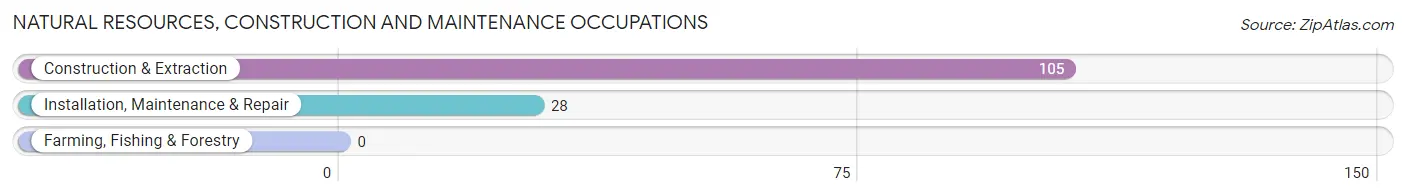
Natural Resources, Construction and Maintenance Occupations
The most common Natural Resources, Construction and Maintenance occupations in Bryn Mawr are Construction & Extraction (105 | 3.5%), and Installation, Maintenance & Repair (28 | 0.9%).
Natural Resources, Construction and Maintenance Occupations by Sex
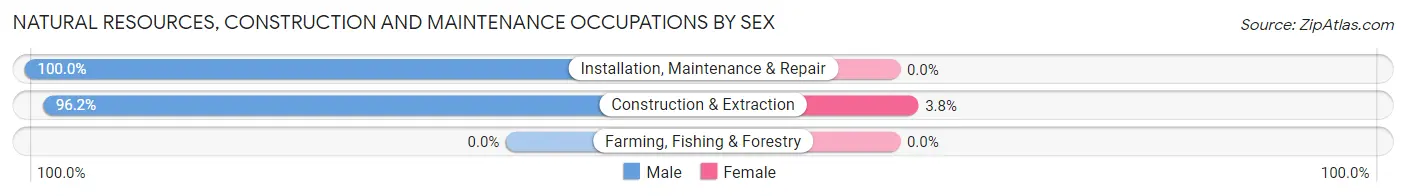
| Occupation | Male | Female |
| Farming, Fishing & Forestry | 0 (0.0%) | 0 (0.0%) |
| Construction & Extraction | 101 (96.2%) | 4 (3.8%) |
| Installation, Maintenance & Repair | 28 (100.0%) | 0 (0.0%) |
| Total (Category) | 129 (97.0%) | 4 (3.0%) |
| Total (Overall) | 1,193 (40.1%) | 1,786 (60.0%) |
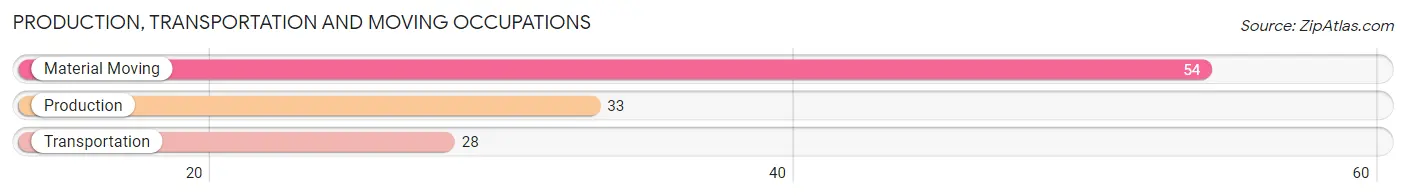
Production, Transportation and Moving Occupations
The most common Production, Transportation and Moving occupations in Bryn Mawr are Material Moving (54 | 1.8%), Production (33 | 1.1%), and Transportation (28 | 0.9%).
Production, Transportation and Moving Occupations by Sex
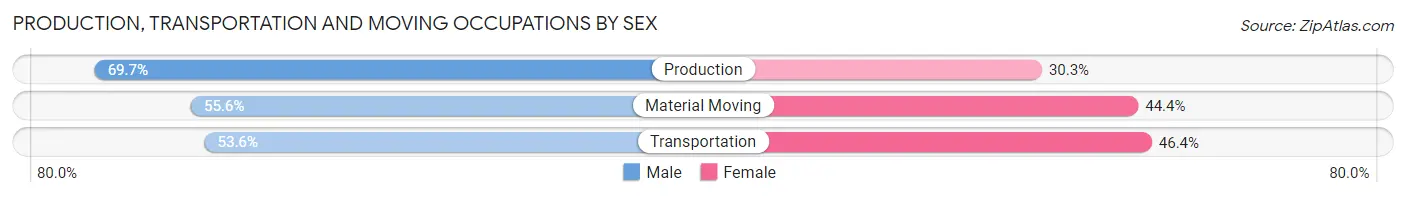
| Occupation | Male | Female |
| Production | 23 (69.7%) | 10 (30.3%) |
| Transportation | 15 (53.6%) | 13 (46.4%) |
| Material Moving | 30 (55.6%) | 24 (44.4%) |
| Total (Category) | 68 (59.1%) | 47 (40.9%) |
| Total (Overall) | 1,193 (40.1%) | 1,786 (60.0%) |
Employment Industries by Sex in Bryn Mawr
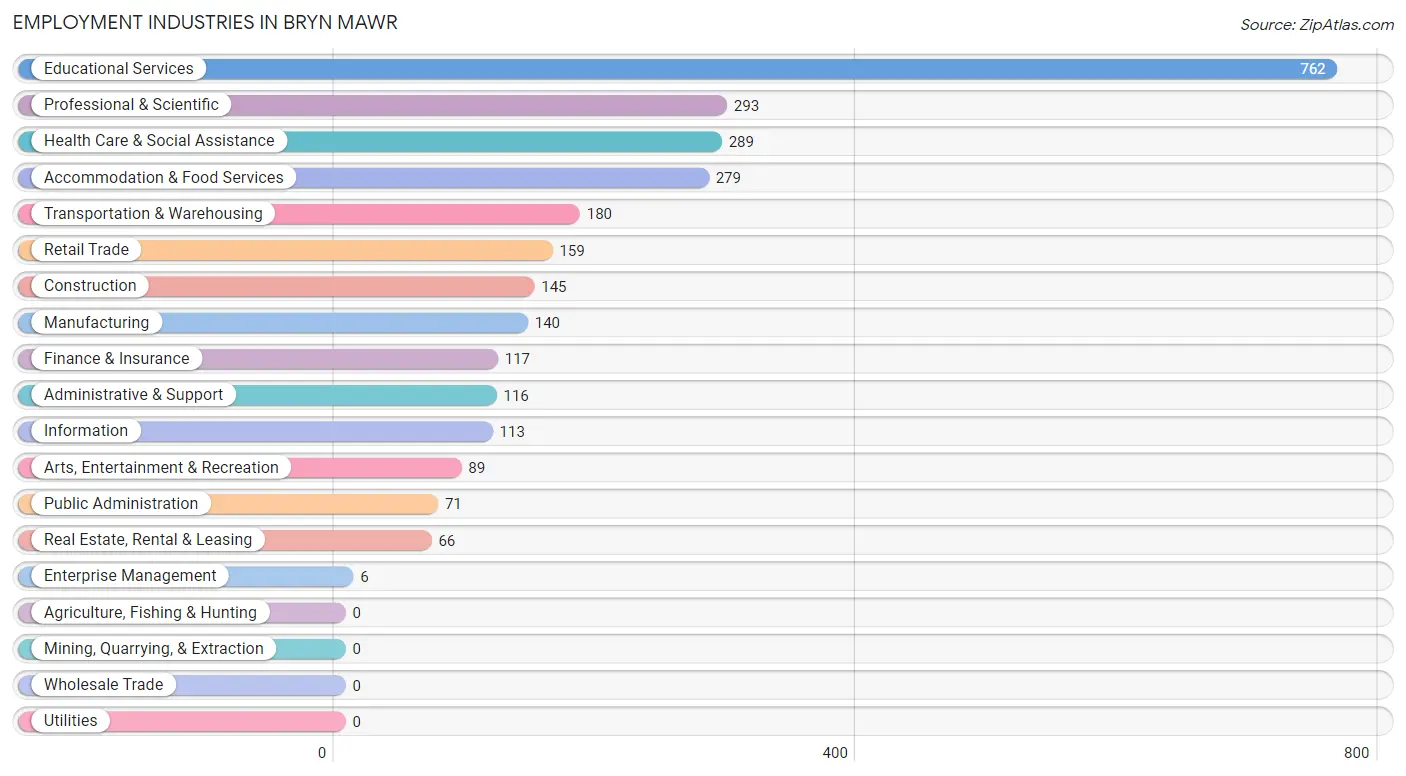
Employment Industries in Bryn Mawr
The major employment industries in Bryn Mawr include Educational Services (762 | 25.6%), Professional & Scientific (293 | 9.8%), Health Care & Social Assistance (289 | 9.7%), Accommodation & Food Services (279 | 9.4%), and Transportation & Warehousing (180 | 6.0%).
Employment Industries by Sex in Bryn Mawr
The Bryn Mawr industries that see more men than women are Enterprise Management (100.0%), Construction (80.7%), and Transportation & Warehousing (77.8%), whereas the industries that tend to have a higher number of women are Information (81.4%), Public Administration (80.3%), and Health Care & Social Assistance (76.8%).
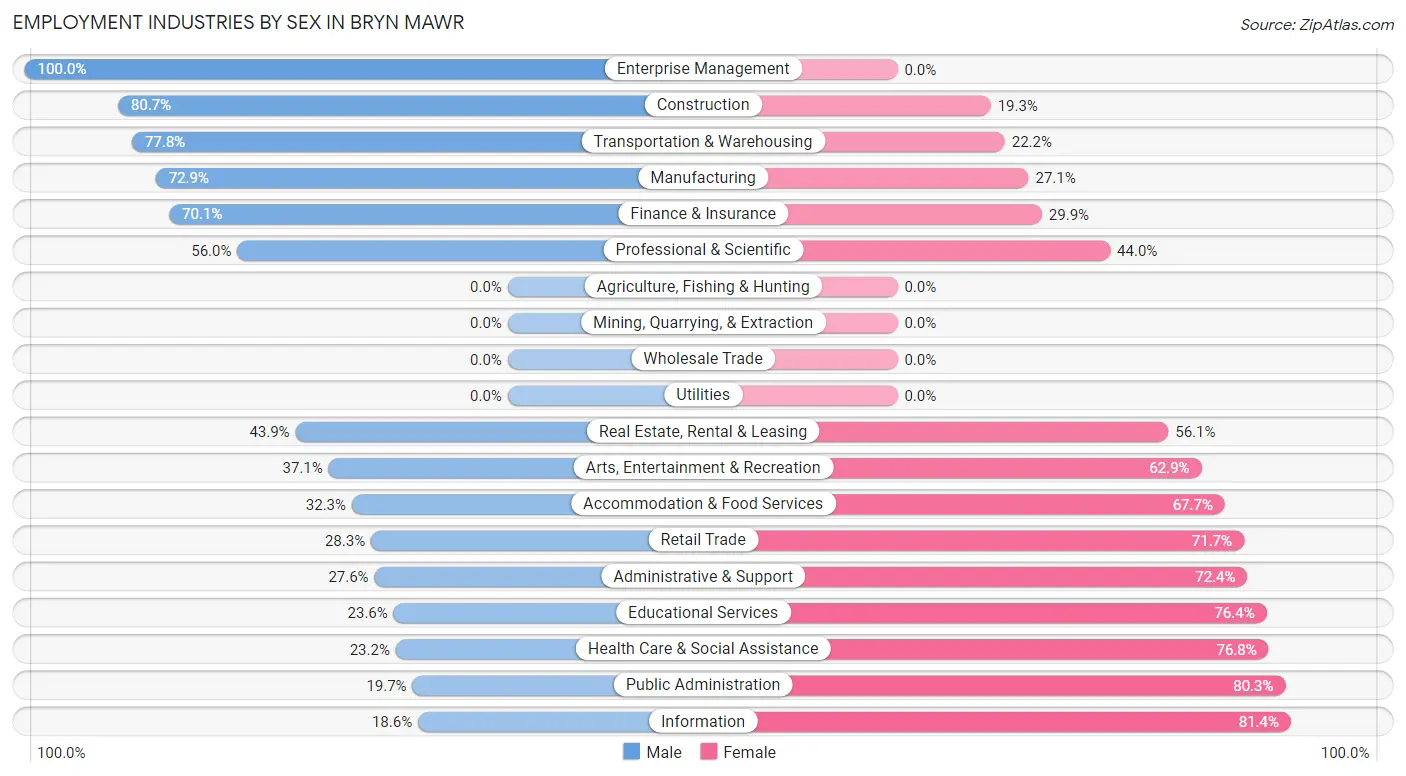
| Industry | Male | Female |
| Agriculture, Fishing & Hunting | 0 (0.0%) | 0 (0.0%) |
| Mining, Quarrying, & Extraction | 0 (0.0%) | 0 (0.0%) |
| Construction | 117 (80.7%) | 28 (19.3%) |
| Manufacturing | 102 (72.9%) | 38 (27.1%) |
| Wholesale Trade | 0 (0.0%) | 0 (0.0%) |
| Retail Trade | 45 (28.3%) | 114 (71.7%) |
| Transportation & Warehousing | 140 (77.8%) | 40 (22.2%) |
| Utilities | 0 (0.0%) | 0 (0.0%) |
| Information | 21 (18.6%) | 92 (81.4%) |
| Finance & Insurance | 82 (70.1%) | 35 (29.9%) |
| Real Estate, Rental & Leasing | 29 (43.9%) | 37 (56.1%) |
| Professional & Scientific | 164 (56.0%) | 129 (44.0%) |
| Enterprise Management | 6 (100.0%) | 0 (0.0%) |
| Administrative & Support | 32 (27.6%) | 84 (72.4%) |
| Educational Services | 180 (23.6%) | 582 (76.4%) |
| Health Care & Social Assistance | 67 (23.2%) | 222 (76.8%) |
| Arts, Entertainment & Recreation | 33 (37.1%) | 56 (62.9%) |
| Accommodation & Food Services | 90 (32.3%) | 189 (67.7%) |
| Public Administration | 14 (19.7%) | 57 (80.3%) |
| Total | 1,193 (40.1%) | 1,786 (60.0%) |
Education in Bryn Mawr
School Enrollment in Bryn Mawr
The most common levels of schooling among the 2,564 students in Bryn Mawr are college / undergraduate (1,979 | 77.2%), graduate / professional (208 | 8.1%), and middle school (141 | 5.5%).
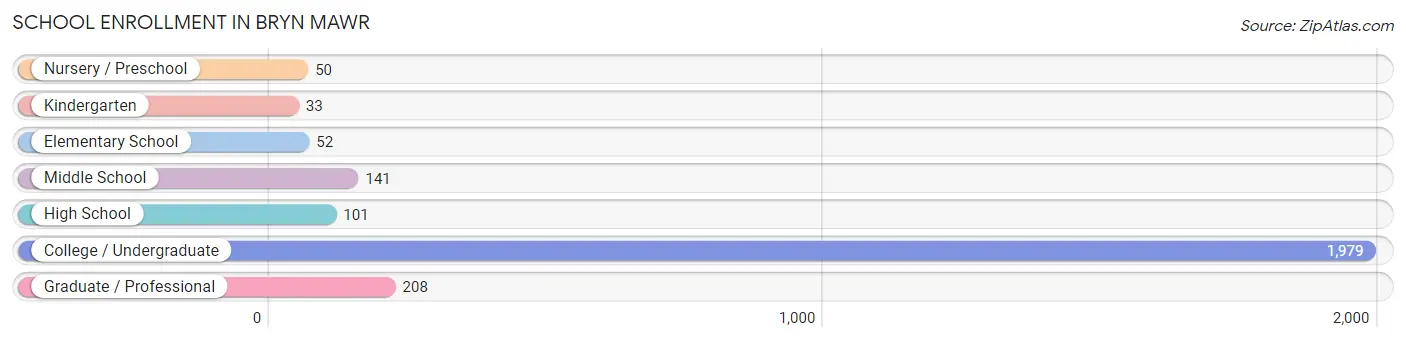
| School Level | # Students | % Students |
| Nursery / Preschool | 50 | 1.9% |
| Kindergarten | 33 | 1.3% |
| Elementary School | 52 | 2.0% |
| Middle School | 141 | 5.5% |
| High School | 101 | 3.9% |
| College / Undergraduate | 1,979 | 77.2% |
| Graduate / Professional | 208 | 8.1% |
| Total | 2,564 | 100.0% |
School Enrollment by Age by Funding Source in Bryn Mawr
Out of a total of 2,564 students who are enrolled in schools in Bryn Mawr, 2,167 (84.5%) attend a private institution, while the remaining 397 (15.5%) are enrolled in public schools. The age group of 3 to 4 year olds has the highest likelihood of being enrolled in private schools, with 33 (100.0% in the age bracket) enrolled. Conversely, the age group of 10 to 14 year olds has the lowest likelihood of being enrolled in a private school, with 99 (82.5% in the age bracket) attending a public institution.
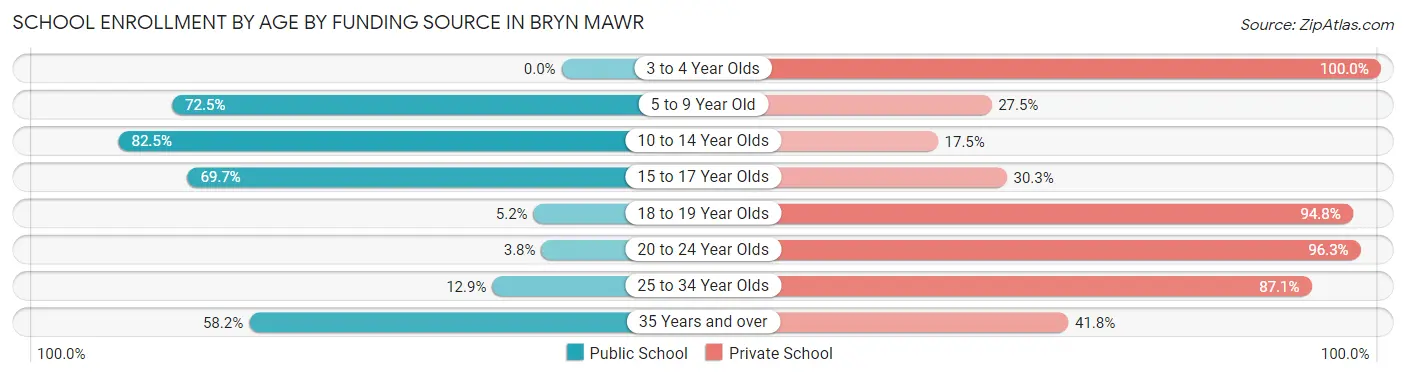
| Age Bracket | Public School | Private School |
| 3 to 4 Year Olds | 0 (0.0%) | 33 (100.0%) |
| 5 to 9 Year Old | 95 (72.5%) | 36 (27.5%) |
| 10 to 14 Year Olds | 99 (82.5%) | 21 (17.5%) |
| 15 to 17 Year Olds | 62 (69.7%) | 27 (30.3%) |
| 18 to 19 Year Olds | 39 (5.2%) | 708 (94.8%) |
| 20 to 24 Year Olds | 47 (3.7%) | 1,206 (96.3%) |
| 25 to 34 Year Olds | 16 (12.9%) | 108 (87.1%) |
| 35 Years and over | 39 (58.2%) | 28 (41.8%) |
| Total | 397 (15.5%) | 2,167 (84.5%) |
Educational Attainment by Field of Study in Bryn Mawr
Business (323 | 15.5%), social sciences (231 | 11.1%), literature & languages (227 | 10.9%), education (212 | 10.2%), and bio, nature & agricultural (189 | 9.1%) are the most common fields of study among 2,085 individuals in Bryn Mawr who have obtained a bachelor's degree or higher.
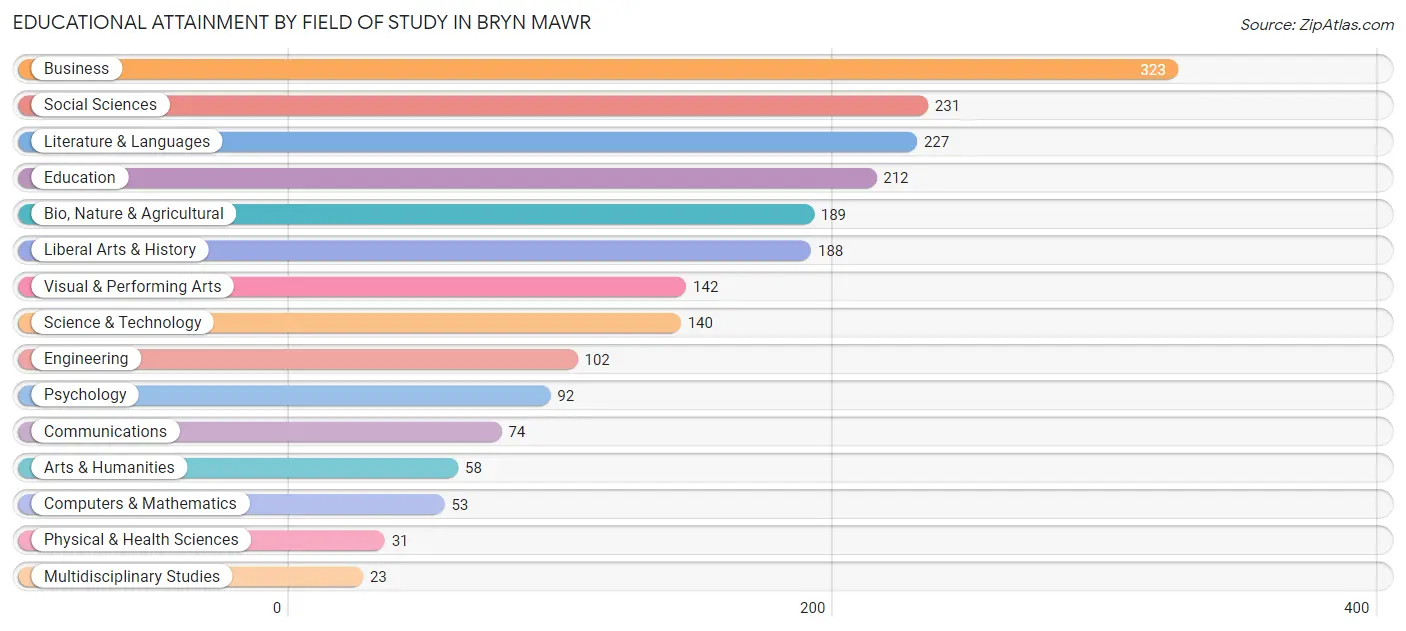
| Field of Study | # Graduates | % Graduates |
| Computers & Mathematics | 53 | 2.5% |
| Bio, Nature & Agricultural | 189 | 9.1% |
| Physical & Health Sciences | 31 | 1.5% |
| Psychology | 92 | 4.4% |
| Social Sciences | 231 | 11.1% |
| Engineering | 102 | 4.9% |
| Multidisciplinary Studies | 23 | 1.1% |
| Science & Technology | 140 | 6.7% |
| Business | 323 | 15.5% |
| Education | 212 | 10.2% |
| Literature & Languages | 227 | 10.9% |
| Liberal Arts & History | 188 | 9.0% |
| Visual & Performing Arts | 142 | 6.8% |
| Communications | 74 | 3.5% |
| Arts & Humanities | 58 | 2.8% |
| Total | 2,085 | 100.0% |
Transportation & Commute in Bryn Mawr
Vehicle Availability by Sex in Bryn Mawr
The most prevalent vehicle ownership categories in Bryn Mawr are males with 2 vehicles (545, accounting for 49.0%) and females with 2 vehicles (580, making up 48.2%).
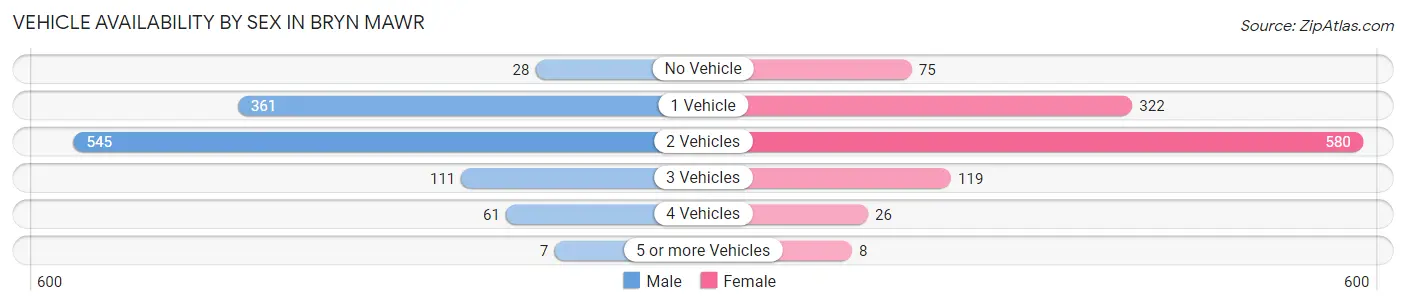
| Vehicles Available | Male | Female |
| No Vehicle | 28 (2.5%) | 75 (6.6%) |
| 1 Vehicle | 361 (32.4%) | 322 (28.5%) |
| 2 Vehicles | 545 (49.0%) | 580 (51.3%) |
| 3 Vehicles | 111 (10.0%) | 119 (10.5%) |
| 4 Vehicles | 61 (5.5%) | 26 (2.3%) |
| 5 or more Vehicles | 7 (0.6%) | 8 (0.7%) |
| Total | 1,113 (100.0%) | 1,130 (100.0%) |
Commute Time in Bryn Mawr
The most frequently occuring commute durations in Bryn Mawr are 10 to 14 minutes (534 commuters, 23.2%), 5 to 9 minutes (450 commuters, 19.5%), and 30 to 34 minutes (265 commuters, 11.5%).
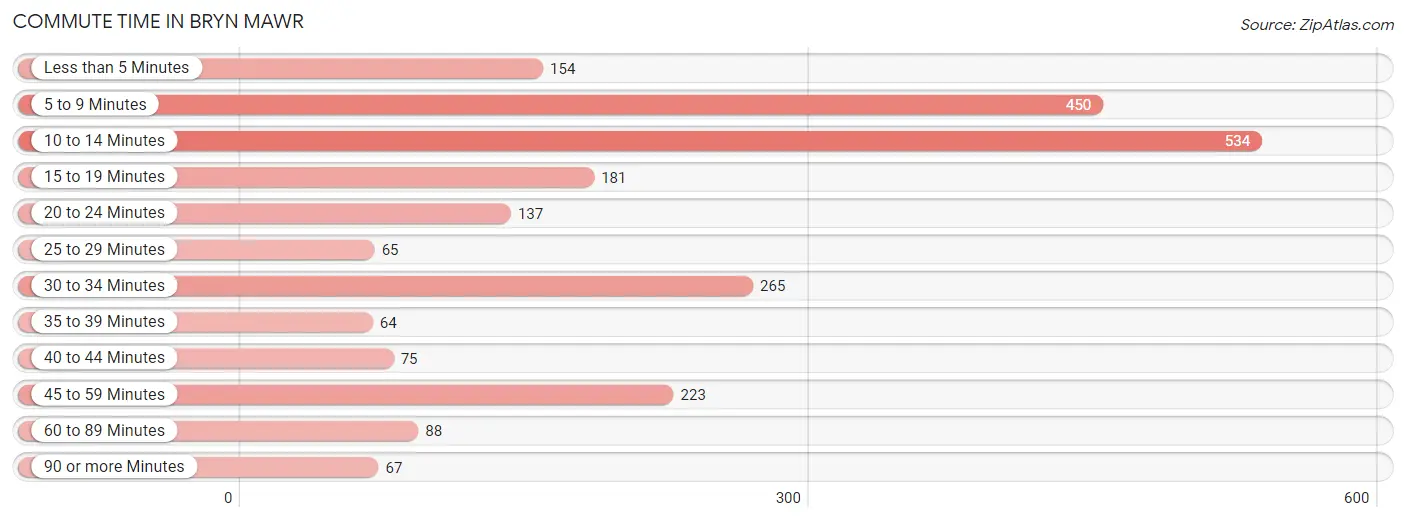
| Commute Time | # Commuters | % Commuters |
| Less than 5 Minutes | 154 | 6.7% |
| 5 to 9 Minutes | 450 | 19.5% |
| 10 to 14 Minutes | 534 | 23.2% |
| 15 to 19 Minutes | 181 | 7.9% |
| 20 to 24 Minutes | 137 | 5.9% |
| 25 to 29 Minutes | 65 | 2.8% |
| 30 to 34 Minutes | 265 | 11.5% |
| 35 to 39 Minutes | 64 | 2.8% |
| 40 to 44 Minutes | 75 | 3.3% |
| 45 to 59 Minutes | 223 | 9.7% |
| 60 to 89 Minutes | 88 | 3.8% |
| 90 or more Minutes | 67 | 2.9% |
Commute Time by Sex in Bryn Mawr
The most common commute times in Bryn Mawr are 30 to 34 minutes (239 commuters, 24.6%) for males and 5 to 9 minutes (380 commuters, 28.5%) for females.
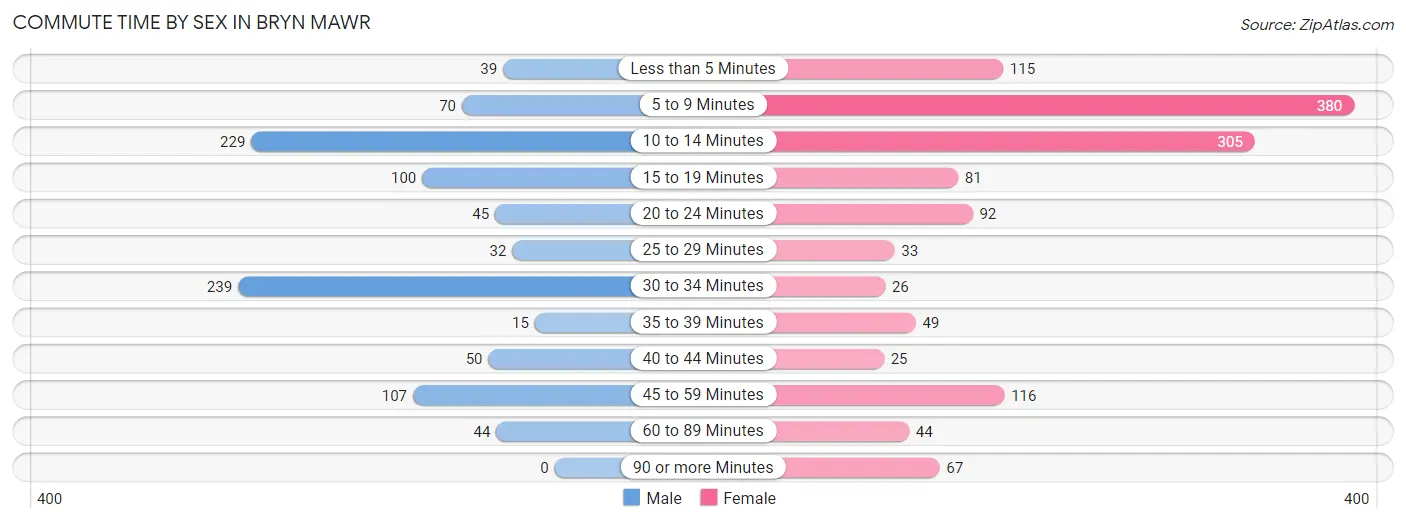
| Commute Time | Male | Female |
| Less than 5 Minutes | 39 (4.0%) | 115 (8.6%) |
| 5 to 9 Minutes | 70 (7.2%) | 380 (28.5%) |
| 10 to 14 Minutes | 229 (23.6%) | 305 (22.9%) |
| 15 to 19 Minutes | 100 (10.3%) | 81 (6.1%) |
| 20 to 24 Minutes | 45 (4.6%) | 92 (6.9%) |
| 25 to 29 Minutes | 32 (3.3%) | 33 (2.5%) |
| 30 to 34 Minutes | 239 (24.6%) | 26 (1.9%) |
| 35 to 39 Minutes | 15 (1.5%) | 49 (3.7%) |
| 40 to 44 Minutes | 50 (5.1%) | 25 (1.9%) |
| 45 to 59 Minutes | 107 (11.0%) | 116 (8.7%) |
| 60 to 89 Minutes | 44 (4.5%) | 44 (3.3%) |
| 90 or more Minutes | 0 (0.0%) | 67 (5.0%) |
Time of Departure to Work by Sex in Bryn Mawr
The most frequent times of departure to work in Bryn Mawr are 7:30 AM to 7:59 AM (220, 22.7%) for males and 9:00 AM to 9:59 AM (269, 20.2%) for females.
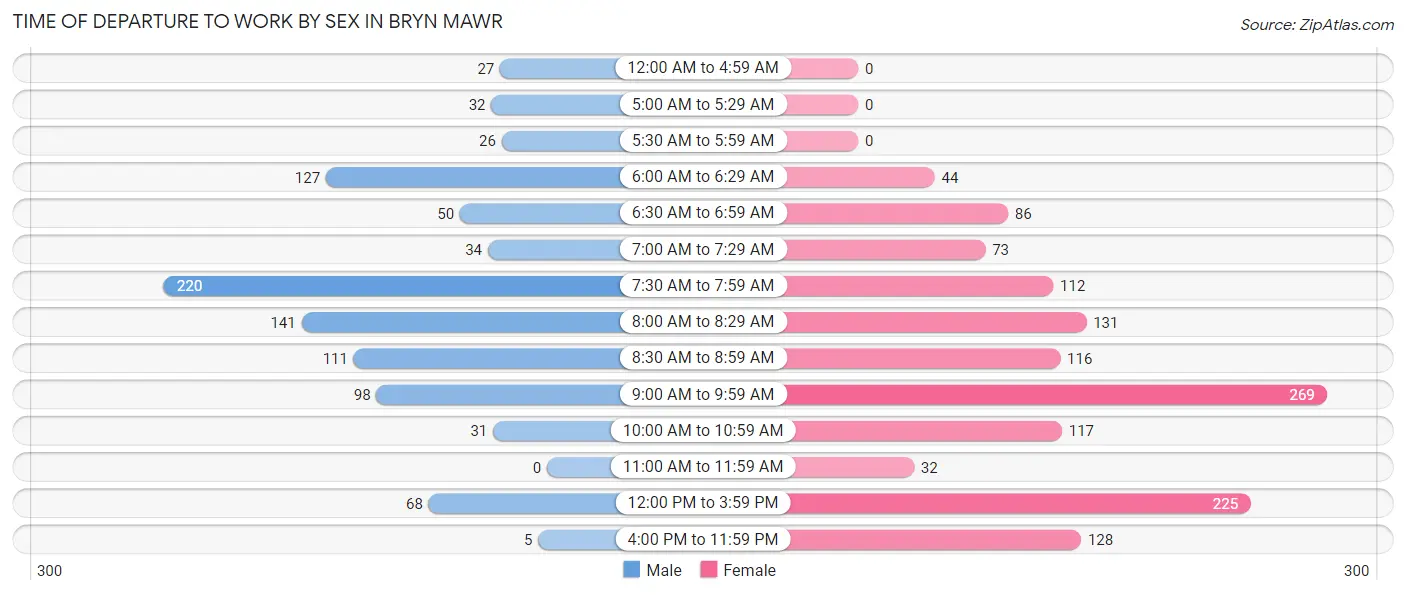
| Time of Departure | Male | Female |
| 12:00 AM to 4:59 AM | 27 (2.8%) | 0 (0.0%) |
| 5:00 AM to 5:29 AM | 32 (3.3%) | 0 (0.0%) |
| 5:30 AM to 5:59 AM | 26 (2.7%) | 0 (0.0%) |
| 6:00 AM to 6:29 AM | 127 (13.1%) | 44 (3.3%) |
| 6:30 AM to 6:59 AM | 50 (5.1%) | 86 (6.5%) |
| 7:00 AM to 7:29 AM | 34 (3.5%) | 73 (5.5%) |
| 7:30 AM to 7:59 AM | 220 (22.7%) | 112 (8.4%) |
| 8:00 AM to 8:29 AM | 141 (14.5%) | 131 (9.8%) |
| 8:30 AM to 8:59 AM | 111 (11.4%) | 116 (8.7%) |
| 9:00 AM to 9:59 AM | 98 (10.1%) | 269 (20.2%) |
| 10:00 AM to 10:59 AM | 31 (3.2%) | 117 (8.8%) |
| 11:00 AM to 11:59 AM | 0 (0.0%) | 32 (2.4%) |
| 12:00 PM to 3:59 PM | 68 (7.0%) | 225 (16.9%) |
| 4:00 PM to 11:59 PM | 5 (0.5%) | 128 (9.6%) |
| Total | 970 (100.0%) | 1,333 (100.0%) |
Housing Occupancy in Bryn Mawr
Occupancy by Ownership in Bryn Mawr
Of the total 1,862 dwellings in Bryn Mawr, owner-occupied units account for 805 (43.2%), while renter-occupied units make up 1,057 (56.8%).
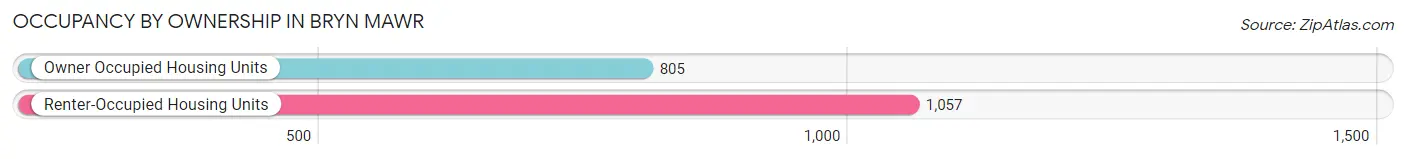
| Occupancy | # Housing Units | % Housing Units |
| Owner Occupied Housing Units | 805 | 43.2% |
| Renter-Occupied Housing Units | 1,057 | 56.8% |
| Total Occupied Housing Units | 1,862 | 100.0% |
Occupancy by Household Size in Bryn Mawr
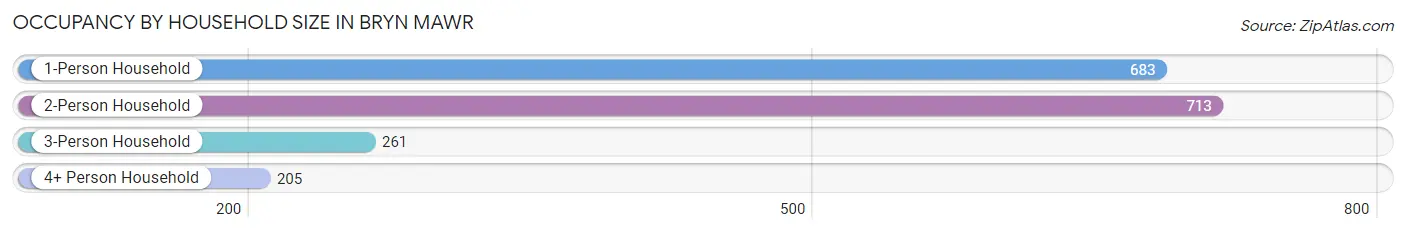
| Household Size | # Housing Units | % Housing Units |
| 1-Person Household | 683 | 36.7% |
| 2-Person Household | 713 | 38.3% |
| 3-Person Household | 261 | 14.0% |
| 4+ Person Household | 205 | 11.0% |
| Total Housing Units | 1,862 | 100.0% |
Occupancy by Ownership by Household Size in Bryn Mawr
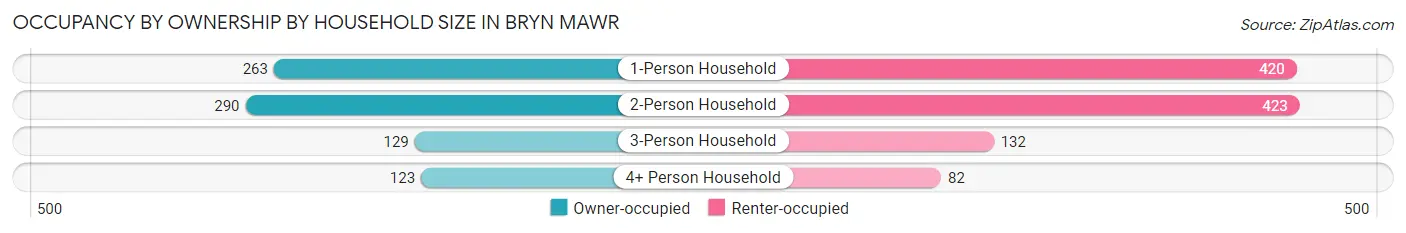
| Household Size | Owner-occupied | Renter-occupied |
| 1-Person Household | 263 (38.5%) | 420 (61.5%) |
| 2-Person Household | 290 (40.7%) | 423 (59.3%) |
| 3-Person Household | 129 (49.4%) | 132 (50.6%) |
| 4+ Person Household | 123 (60.0%) | 82 (40.0%) |
| Total Housing Units | 805 (43.2%) | 1,057 (56.8%) |
Occupancy by Educational Attainment in Bryn Mawr
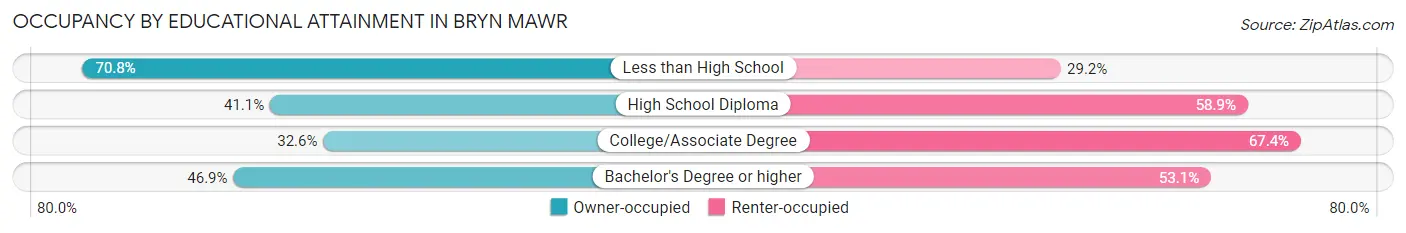
| Household Size | Owner-occupied | Renter-occupied |
| Less than High School | 17 (70.8%) | 7 (29.2%) |
| High School Diploma | 92 (41.1%) | 132 (58.9%) |
| College/Associate Degree | 139 (32.6%) | 287 (67.4%) |
| Bachelor's Degree or higher | 557 (46.9%) | 631 (53.1%) |
Occupancy by Age of Householder in Bryn Mawr
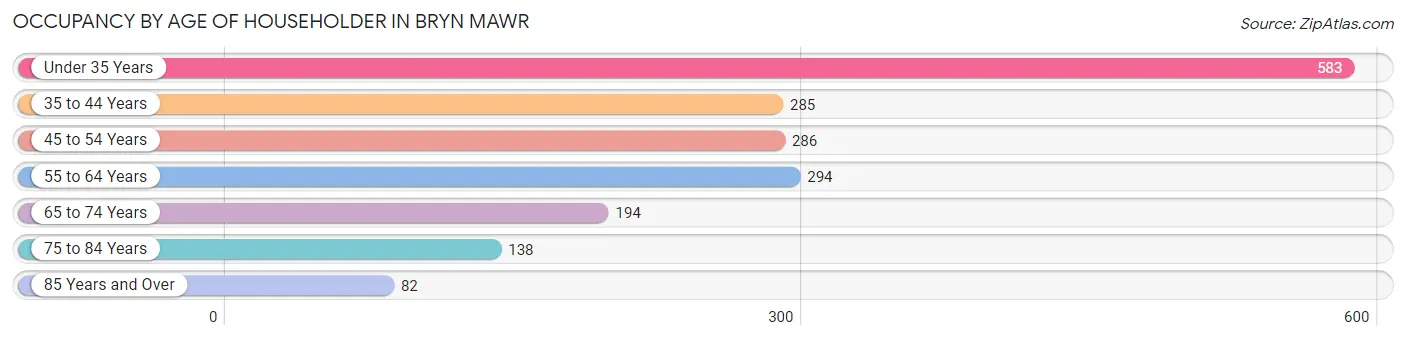
| Age Bracket | # Households | % Households |
| Under 35 Years | 583 | 31.3% |
| 35 to 44 Years | 285 | 15.3% |
| 45 to 54 Years | 286 | 15.4% |
| 55 to 64 Years | 294 | 15.8% |
| 65 to 74 Years | 194 | 10.4% |
| 75 to 84 Years | 138 | 7.4% |
| 85 Years and Over | 82 | 4.4% |
| Total | 1,862 | 100.0% |
Housing Finances in Bryn Mawr
Median Income by Occupancy in Bryn Mawr
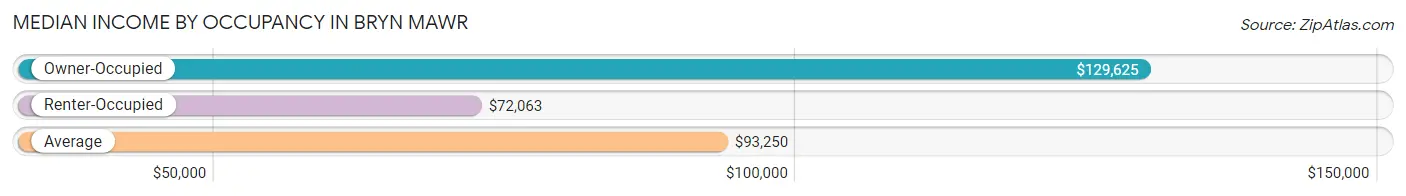
| Occupancy Type | # Households | Median Income |
| Owner-Occupied | 805 (43.2%) | $129,625 |
| Renter-Occupied | 1,057 (56.8%) | $72,063 |
| Average | 1,862 (100.0%) | $93,250 |
Occupancy by Householder Income Bracket in Bryn Mawr
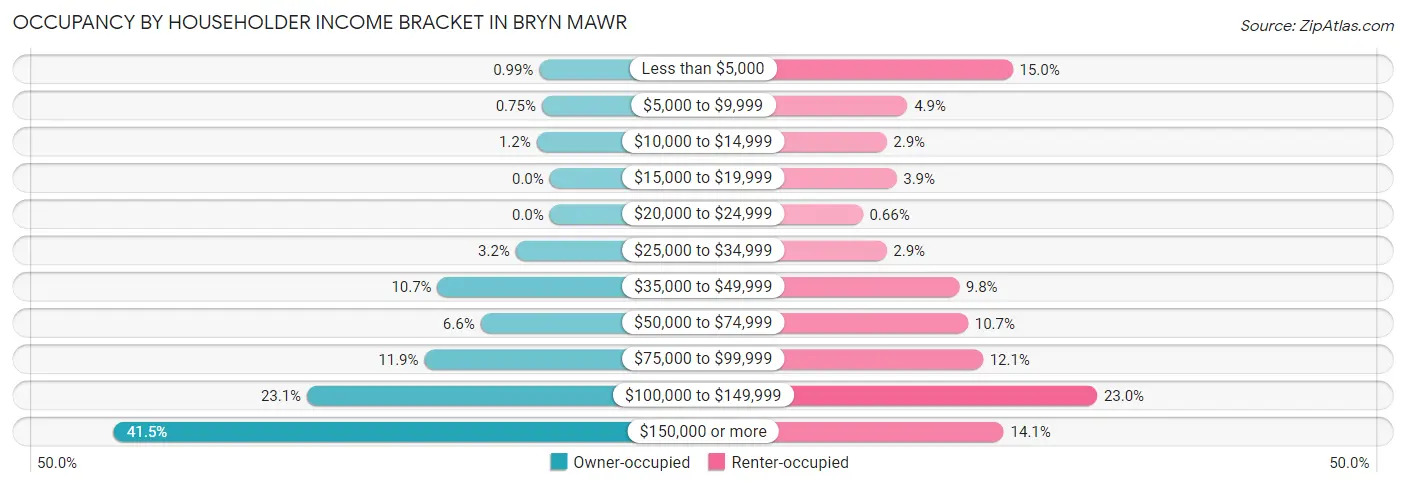
| Income Bracket | Owner-occupied | Renter-occupied |
| Less than $5,000 | 8 (1.0%) | 158 (14.9%) |
| $5,000 to $9,999 | 6 (0.7%) | 52 (4.9%) |
| $10,000 to $14,999 | 10 (1.2%) | 31 (2.9%) |
| $15,000 to $19,999 | 0 (0.0%) | 41 (3.9%) |
| $20,000 to $24,999 | 0 (0.0%) | 7 (0.7%) |
| $25,000 to $34,999 | 26 (3.2%) | 31 (2.9%) |
| $35,000 to $49,999 | 86 (10.7%) | 104 (9.8%) |
| $50,000 to $74,999 | 53 (6.6%) | 113 (10.7%) |
| $75,000 to $99,999 | 96 (11.9%) | 128 (12.1%) |
| $100,000 to $149,999 | 186 (23.1%) | 243 (23.0%) |
| $150,000 or more | 334 (41.5%) | 149 (14.1%) |
| Total | 805 (100.0%) | 1,057 (100.0%) |
Monthly Housing Cost Tiers in Bryn Mawr
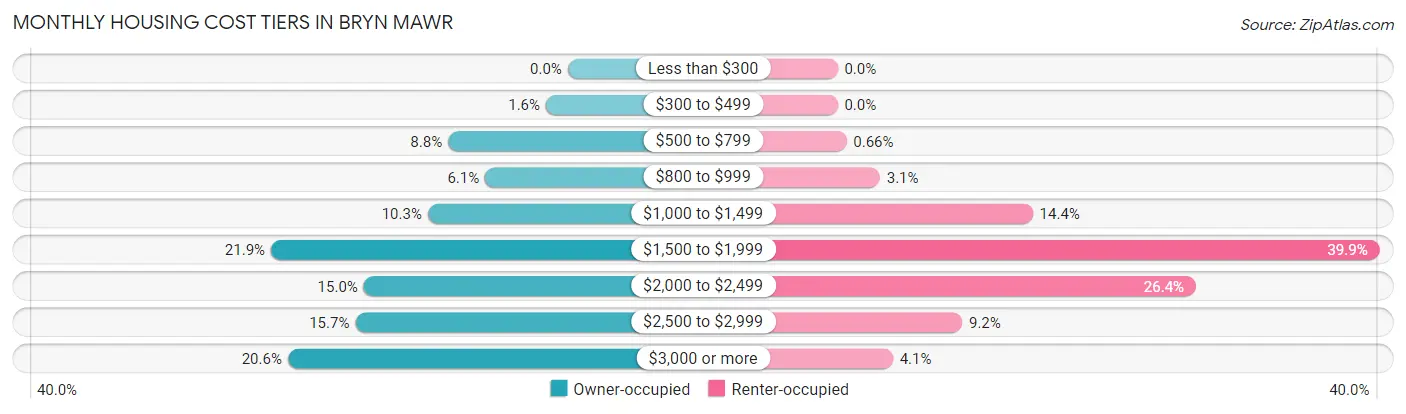
| Monthly Cost | Owner-occupied | Renter-occupied |
| Less than $300 | 0 (0.0%) | 0 (0.0%) |
| $300 to $499 | 13 (1.6%) | 0 (0.0%) |
| $500 to $799 | 71 (8.8%) | 7 (0.7%) |
| $800 to $999 | 49 (6.1%) | 33 (3.1%) |
| $1,000 to $1,499 | 83 (10.3%) | 152 (14.4%) |
| $1,500 to $1,999 | 176 (21.9%) | 422 (39.9%) |
| $2,000 to $2,499 | 121 (15.0%) | 279 (26.4%) |
| $2,500 to $2,999 | 126 (15.7%) | 97 (9.2%) |
| $3,000 or more | 166 (20.6%) | 43 (4.1%) |
| Total | 805 (100.0%) | 1,057 (100.0%) |
Physical Housing Characteristics in Bryn Mawr
Housing Structures in Bryn Mawr
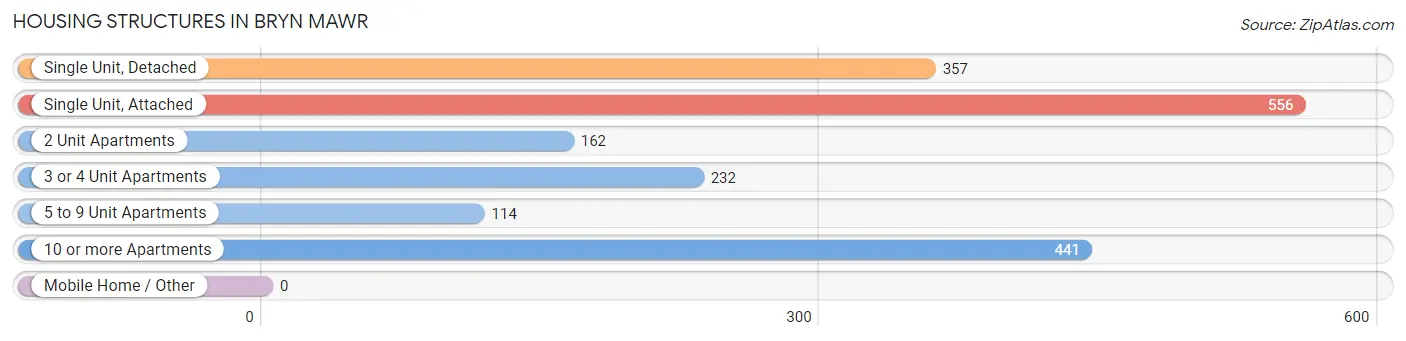
| Structure Type | # Housing Units | % Housing Units |
| Single Unit, Detached | 357 | 19.2% |
| Single Unit, Attached | 556 | 29.9% |
| 2 Unit Apartments | 162 | 8.7% |
| 3 or 4 Unit Apartments | 232 | 12.5% |
| 5 to 9 Unit Apartments | 114 | 6.1% |
| 10 or more Apartments | 441 | 23.7% |
| Mobile Home / Other | 0 | 0.0% |
| Total | 1,862 | 100.0% |
Housing Structures by Occupancy in Bryn Mawr
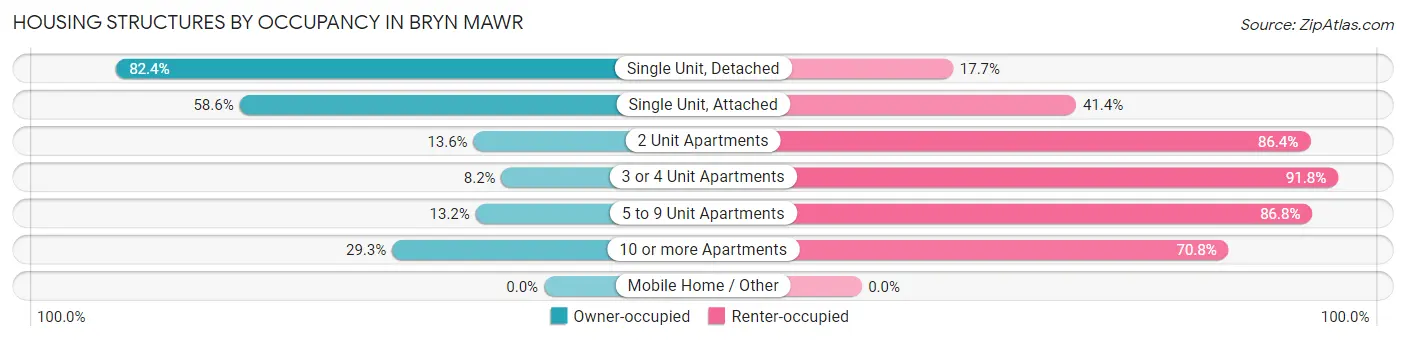
| Structure Type | Owner-occupied | Renter-occupied |
| Single Unit, Detached | 294 (82.4%) | 63 (17.6%) |
| Single Unit, Attached | 326 (58.6%) | 230 (41.4%) |
| 2 Unit Apartments | 22 (13.6%) | 140 (86.4%) |
| 3 or 4 Unit Apartments | 19 (8.2%) | 213 (91.8%) |
| 5 to 9 Unit Apartments | 15 (13.2%) | 99 (86.8%) |
| 10 or more Apartments | 129 (29.2%) | 312 (70.8%) |
| Mobile Home / Other | 0 (0.0%) | 0 (0.0%) |
| Total | 805 (43.2%) | 1,057 (56.8%) |
Housing Structures by Number of Rooms in Bryn Mawr
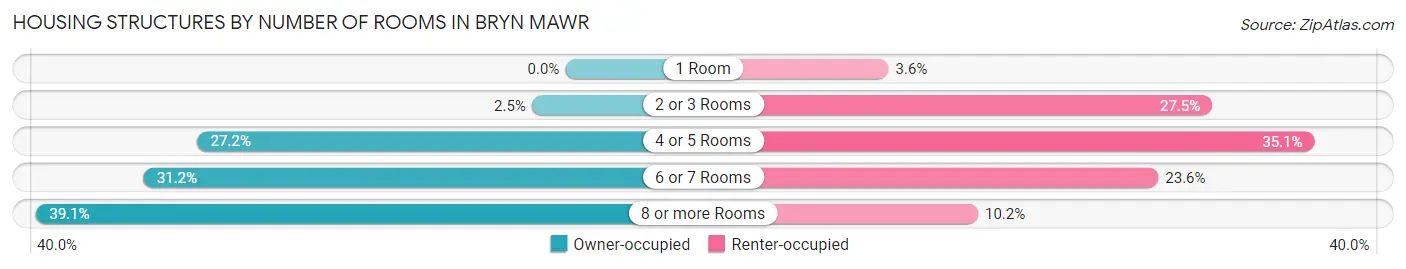
| Number of Rooms | Owner-occupied | Renter-occupied |
| 1 Room | 0 (0.0%) | 38 (3.6%) |
| 2 or 3 Rooms | 20 (2.5%) | 291 (27.5%) |
| 4 or 5 Rooms | 219 (27.2%) | 371 (35.1%) |
| 6 or 7 Rooms | 251 (31.2%) | 249 (23.6%) |
| 8 or more Rooms | 315 (39.1%) | 108 (10.2%) |
| Total | 805 (100.0%) | 1,057 (100.0%) |
Housing Structure by Heating Type in Bryn Mawr
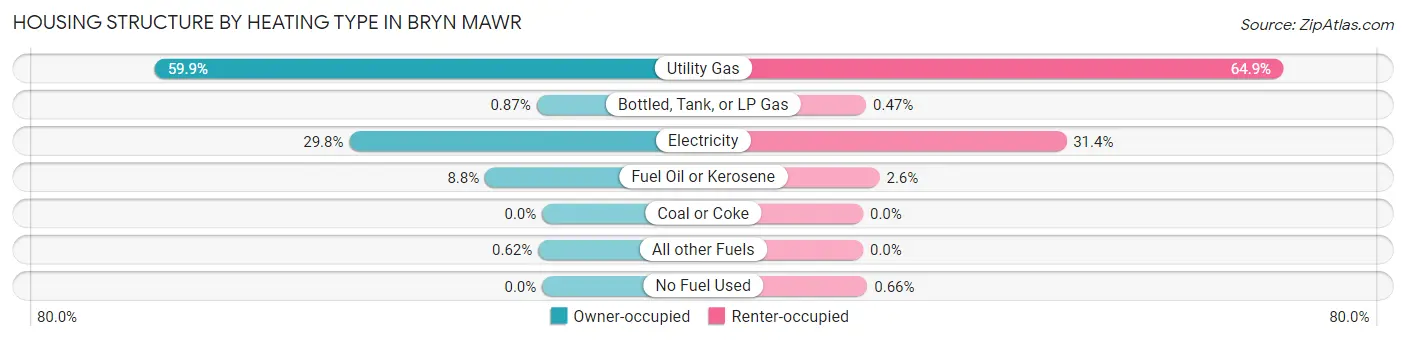
| Heating Type | Owner-occupied | Renter-occupied |
| Utility Gas | 482 (59.9%) | 686 (64.9%) |
| Bottled, Tank, or LP Gas | 7 (0.9%) | 5 (0.5%) |
| Electricity | 240 (29.8%) | 332 (31.4%) |
| Fuel Oil or Kerosene | 71 (8.8%) | 27 (2.5%) |
| Coal or Coke | 0 (0.0%) | 0 (0.0%) |
| All other Fuels | 5 (0.6%) | 0 (0.0%) |
| No Fuel Used | 0 (0.0%) | 7 (0.7%) |
| Total | 805 (100.0%) | 1,057 (100.0%) |
Household Vehicle Usage in Bryn Mawr
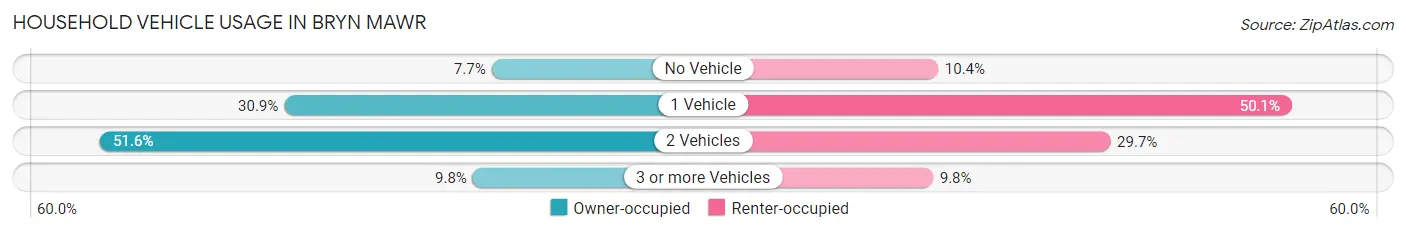
| Vehicles per Household | Owner-occupied | Renter-occupied |
| No Vehicle | 62 (7.7%) | 110 (10.4%) |
| 1 Vehicle | 249 (30.9%) | 529 (50.0%) |
| 2 Vehicles | 415 (51.5%) | 314 (29.7%) |
| 3 or more Vehicles | 79 (9.8%) | 104 (9.8%) |
| Total | 805 (100.0%) | 1,057 (100.0%) |
Real Estate & Mortgages in Bryn Mawr
Real Estate and Mortgage Overview in Bryn Mawr
| Characteristic | Without Mortgage | With Mortgage |
| Housing Units | 211 | 594 |
| Median Property Value | $453,000 | $368,700 |
| Median Household Income | $79,708 | $284 |
| Monthly Housing Costs | $969 | $161 |
| Real Estate Taxes | $6,181 | $0 |
Property Value by Mortgage Status in Bryn Mawr
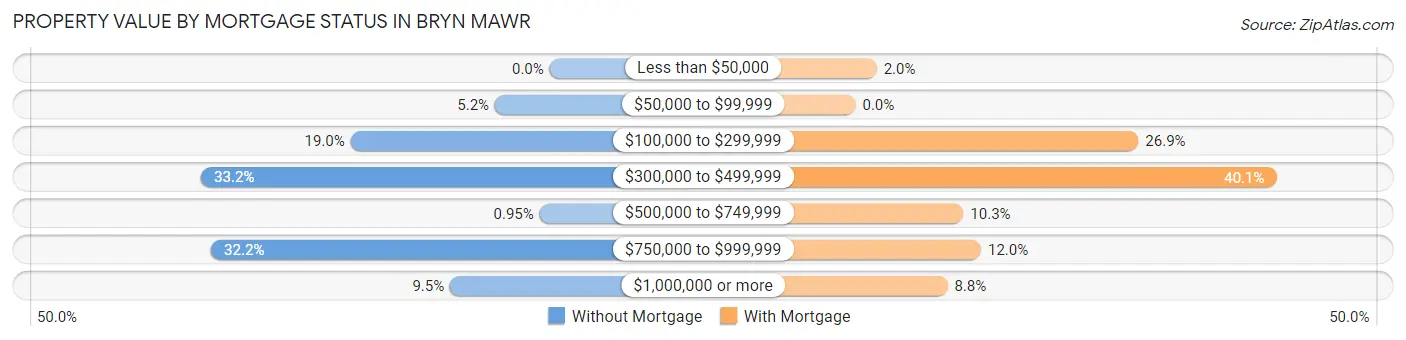
| Property Value | Without Mortgage | With Mortgage |
| Less than $50,000 | 0 (0.0%) | 12 (2.0%) |
| $50,000 to $99,999 | 11 (5.2%) | 0 (0.0%) |
| $100,000 to $299,999 | 40 (19.0%) | 160 (26.9%) |
| $300,000 to $499,999 | 70 (33.2%) | 238 (40.1%) |
| $500,000 to $749,999 | 2 (0.9%) | 61 (10.3%) |
| $750,000 to $999,999 | 68 (32.2%) | 71 (11.9%) |
| $1,000,000 or more | 20 (9.5%) | 52 (8.7%) |
| Total | 211 (100.0%) | 594 (100.0%) |
Household Income by Mortgage Status in Bryn Mawr
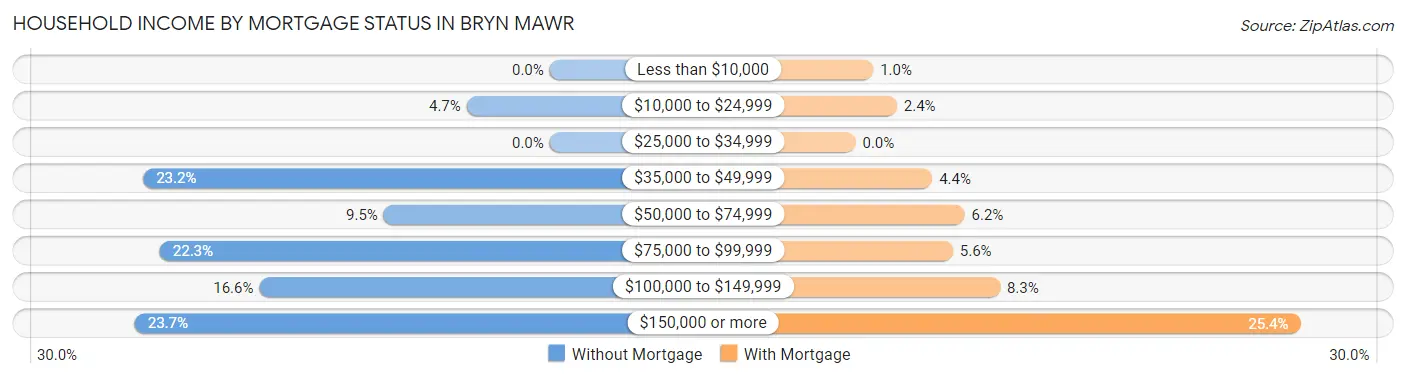
| Household Income | Without Mortgage | With Mortgage |
| Less than $10,000 | 0 (0.0%) | 6 (1.0%) |
| $10,000 to $24,999 | 10 (4.7%) | 14 (2.4%) |
| $25,000 to $34,999 | 0 (0.0%) | 0 (0.0%) |
| $35,000 to $49,999 | 49 (23.2%) | 26 (4.4%) |
| $50,000 to $74,999 | 20 (9.5%) | 37 (6.2%) |
| $75,000 to $99,999 | 47 (22.3%) | 33 (5.6%) |
| $100,000 to $149,999 | 35 (16.6%) | 49 (8.3%) |
| $150,000 or more | 50 (23.7%) | 151 (25.4%) |
| Total | 211 (100.0%) | 594 (100.0%) |
Property Value to Household Income Ratio in Bryn Mawr
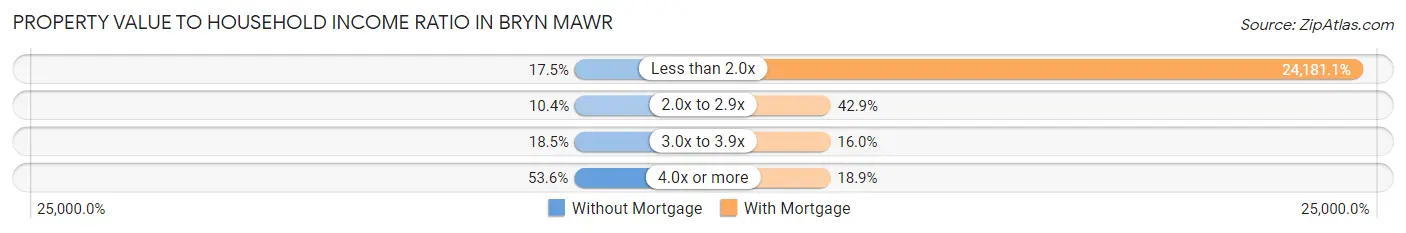
| Value-to-Income Ratio | Without Mortgage | With Mortgage |
| Less than 2.0x | 37 (17.5%) | 143,636 (24,181.1%) |
| 2.0x to 2.9x | 22 (10.4%) | 255 (42.9%) |
| 3.0x to 3.9x | 39 (18.5%) | 95 (16.0%) |
| 4.0x or more | 113 (53.5%) | 112 (18.9%) |
| Total | 211 (100.0%) | 594 (100.0%) |
Real Estate Taxes by Mortgage Status in Bryn Mawr
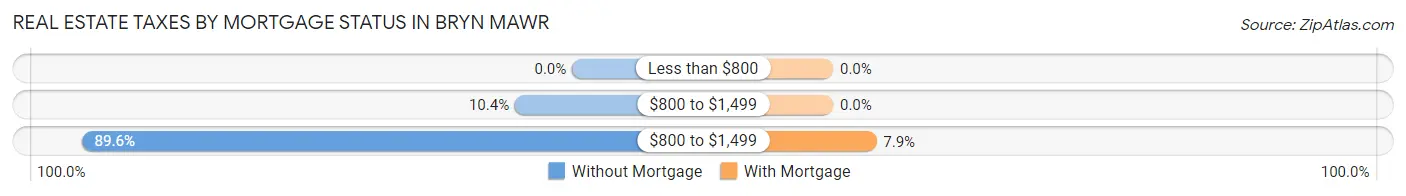
| Property Taxes | Without Mortgage | With Mortgage |
| Less than $800 | 0 (0.0%) | 0 (0.0%) |
| $800 to $1,499 | 22 (10.4%) | 0 (0.0%) |
| $800 to $1,499 | 189 (89.6%) | 47 (7.9%) |
| Total | 211 (100.0%) | 594 (100.0%) |
Health & Disability in Bryn Mawr
Health Insurance Coverage by Age in Bryn Mawr
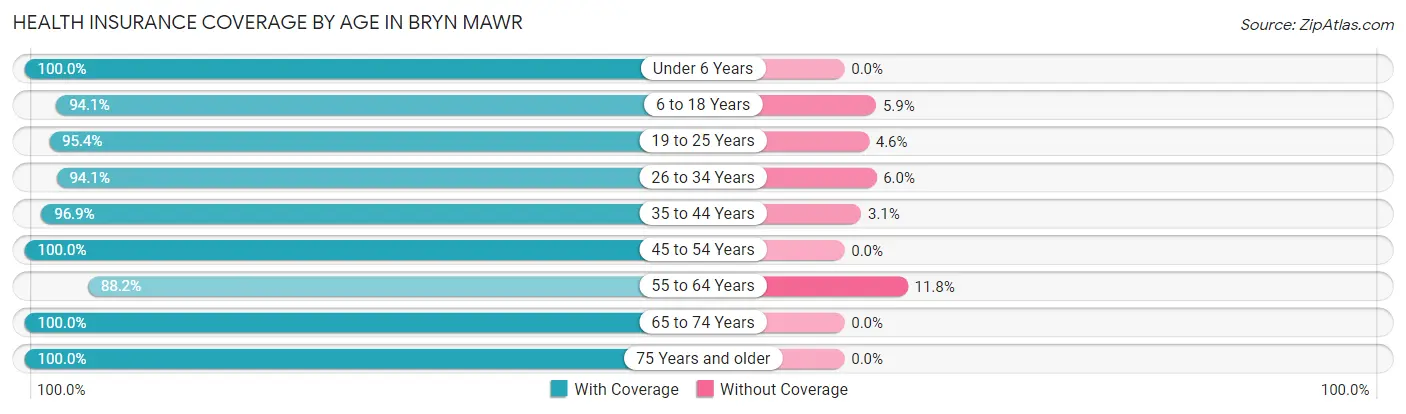
| Age Bracket | With Coverage | Without Coverage |
| Under 6 Years | 168 (100.0%) | 0 (0.0%) |
| 6 to 18 Years | 509 (94.1%) | 32 (5.9%) |
| 19 to 25 Years | 1,857 (95.4%) | 89 (4.6%) |
| 26 to 34 Years | 569 (94.1%) | 36 (5.9%) |
| 35 to 44 Years | 497 (96.9%) | 16 (3.1%) |
| 45 to 54 Years | 406 (100.0%) | 0 (0.0%) |
| 55 to 64 Years | 411 (88.2%) | 55 (11.8%) |
| 65 to 74 Years | 339 (100.0%) | 0 (0.0%) |
| 75 Years and older | 301 (100.0%) | 0 (0.0%) |
| Total | 5,057 (95.7%) | 228 (4.3%) |
Health Insurance Coverage by Citizenship Status in Bryn Mawr
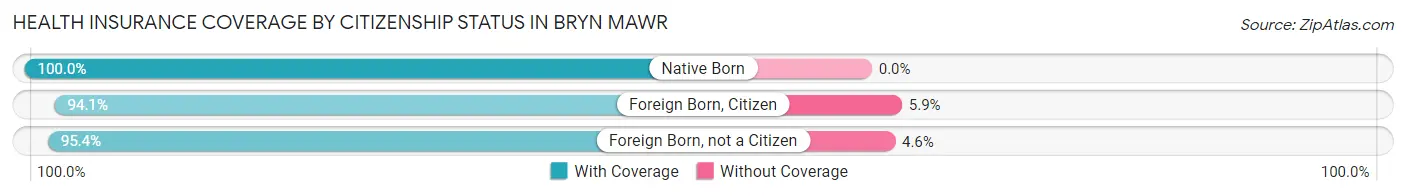
| Citizenship Status | With Coverage | Without Coverage |
| Native Born | 168 (100.0%) | 0 (0.0%) |
| Foreign Born, Citizen | 509 (94.1%) | 32 (5.9%) |
| Foreign Born, not a Citizen | 1,857 (95.4%) | 89 (4.6%) |
Health Insurance Coverage by Household Income in Bryn Mawr
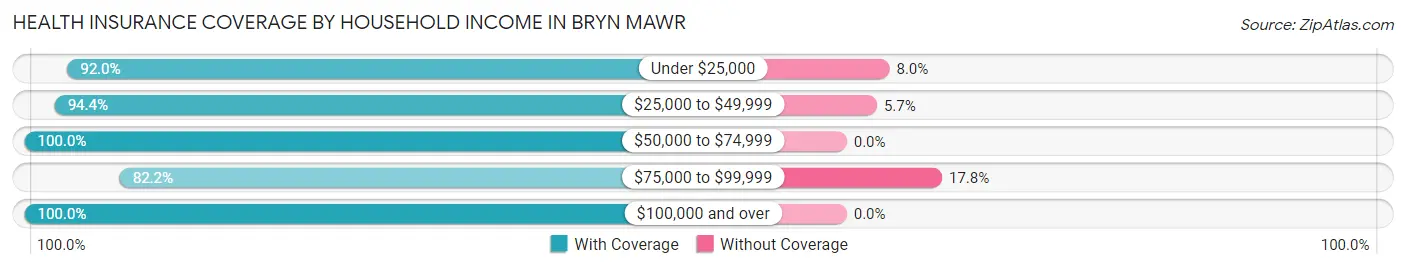
| Household Income | With Coverage | Without Coverage |
| Under $25,000 | 425 (92.0%) | 37 (8.0%) |
| $25,000 to $49,999 | 451 (94.4%) | 27 (5.7%) |
| $50,000 to $74,999 | 303 (100.0%) | 0 (0.0%) |
| $75,000 to $99,999 | 350 (82.2%) | 76 (17.8%) |
| $100,000 and over | 2,123 (100.0%) | 0 (0.0%) |
Public vs Private Health Insurance Coverage by Age in Bryn Mawr
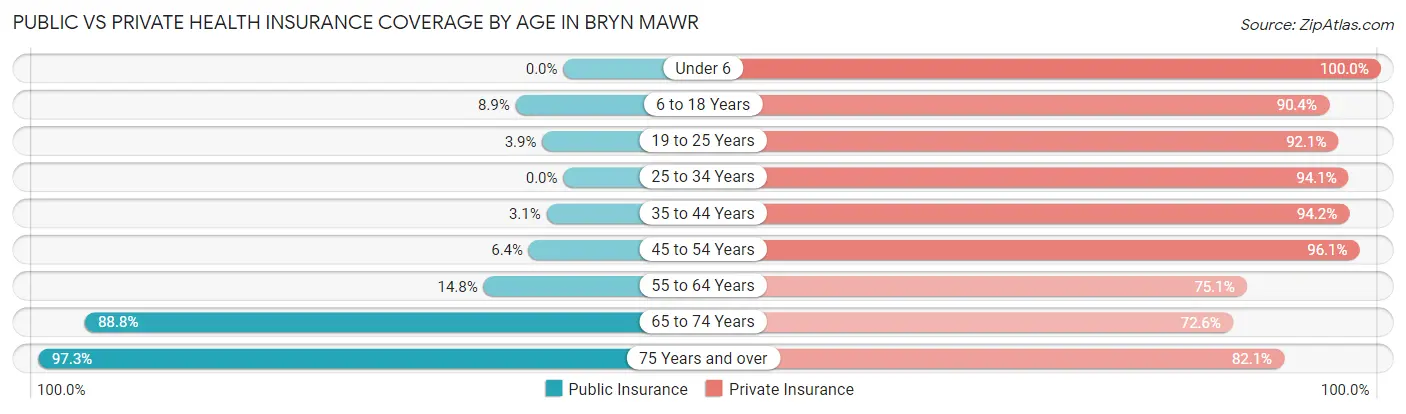
| Age Bracket | Public Insurance | Private Insurance |
| Under 6 | 0 (0.0%) | 168 (100.0%) |
| 6 to 18 Years | 48 (8.9%) | 489 (90.4%) |
| 19 to 25 Years | 76 (3.9%) | 1,793 (92.1%) |
| 25 to 34 Years | 0 (0.0%) | 569 (94.1%) |
| 35 to 44 Years | 16 (3.1%) | 483 (94.2%) |
| 45 to 54 Years | 26 (6.4%) | 390 (96.1%) |
| 55 to 64 Years | 69 (14.8%) | 350 (75.1%) |
| 65 to 74 Years | 301 (88.8%) | 246 (72.6%) |
| 75 Years and over | 293 (97.3%) | 247 (82.1%) |
| Total | 829 (15.7%) | 4,735 (89.6%) |
Disability Status by Sex by Age in Bryn Mawr
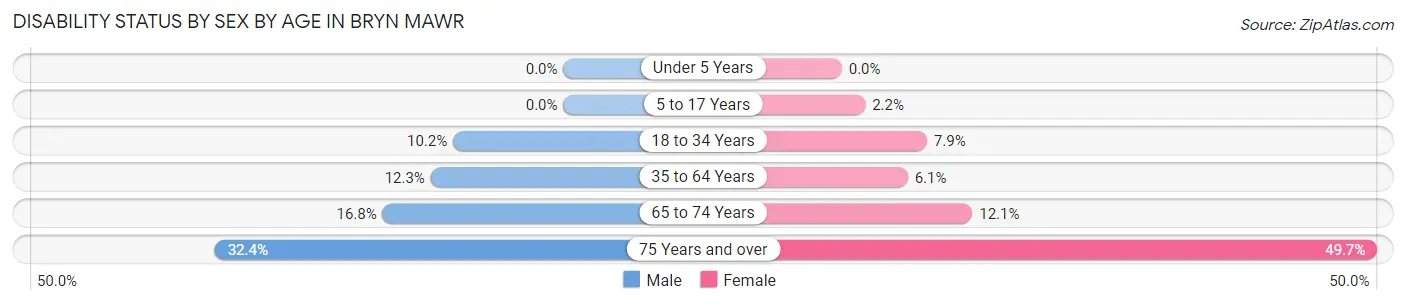
| Age Bracket | Male | Female |
| Under 5 Years | 0 (0.0%) | 0 (0.0%) |
| 5 to 17 Years | 0 (0.0%) | 3 (2.2%) |
| 18 to 34 Years | 73 (10.2%) | 165 (7.9%) |
| 35 to 64 Years | 82 (12.3%) | 44 (6.1%) |
| 65 to 74 Years | 25 (16.8%) | 23 (12.1%) |
| 75 Years and over | 44 (32.4%) | 82 (49.7%) |
Disability Class by Sex by Age in Bryn Mawr
Disability Class: Hearing Difficulty
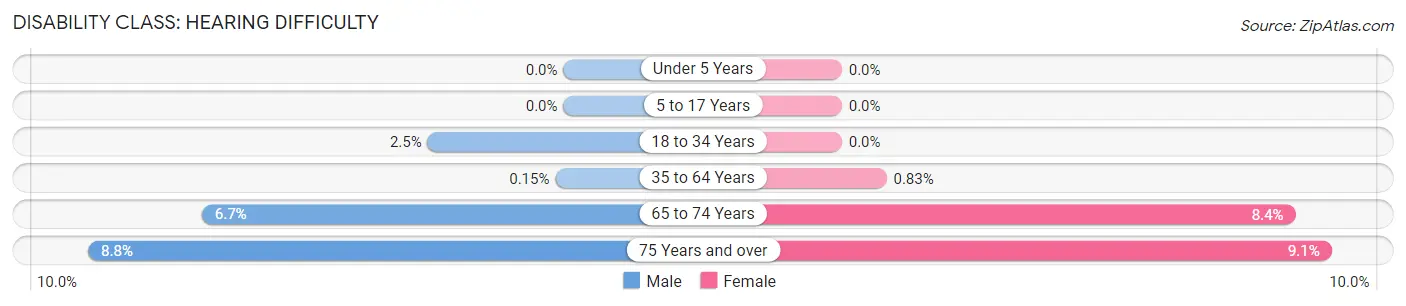
| Age Bracket | Male | Female |
| Under 5 Years | 0 (0.0%) | 0 (0.0%) |
| 5 to 17 Years | 0 (0.0%) | 0 (0.0%) |
| 18 to 34 Years | 18 (2.5%) | 0 (0.0%) |
| 35 to 64 Years | 1 (0.2%) | 6 (0.8%) |
| 65 to 74 Years | 10 (6.7%) | 16 (8.4%) |
| 75 Years and over | 12 (8.8%) | 15 (9.1%) |
Disability Class: Vision Difficulty
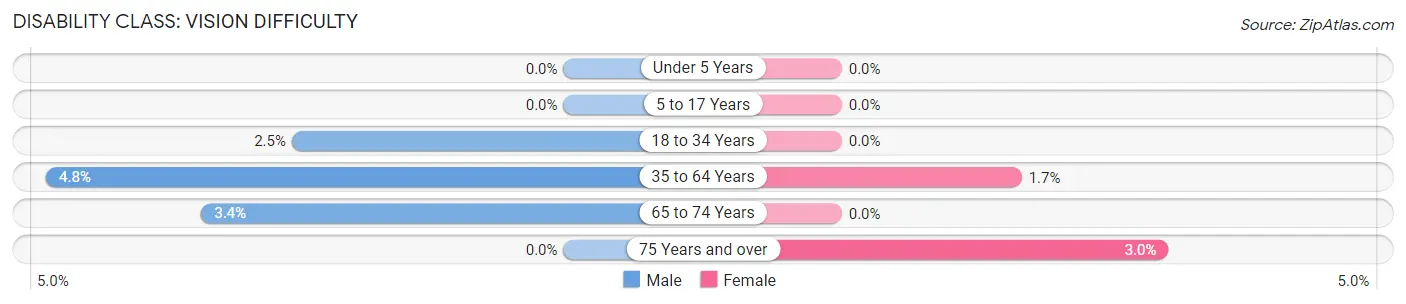
| Age Bracket | Male | Female |
| Under 5 Years | 0 (0.0%) | 0 (0.0%) |
| 5 to 17 Years | 0 (0.0%) | 0 (0.0%) |
| 18 to 34 Years | 18 (2.5%) | 0 (0.0%) |
| 35 to 64 Years | 32 (4.8%) | 12 (1.7%) |
| 65 to 74 Years | 5 (3.4%) | 0 (0.0%) |
| 75 Years and over | 0 (0.0%) | 5 (3.0%) |
Disability Class: Cognitive Difficulty
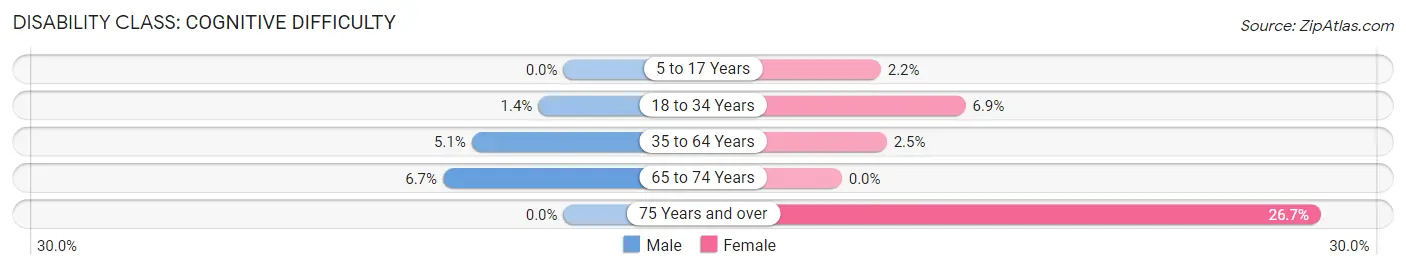
| Age Bracket | Male | Female |
| 5 to 17 Years | 0 (0.0%) | 3 (2.2%) |
| 18 to 34 Years | 10 (1.4%) | 144 (6.9%) |
| 35 to 64 Years | 34 (5.1%) | 18 (2.5%) |
| 65 to 74 Years | 10 (6.7%) | 0 (0.0%) |
| 75 Years and over | 0 (0.0%) | 44 (26.7%) |
Disability Class: Ambulatory Difficulty
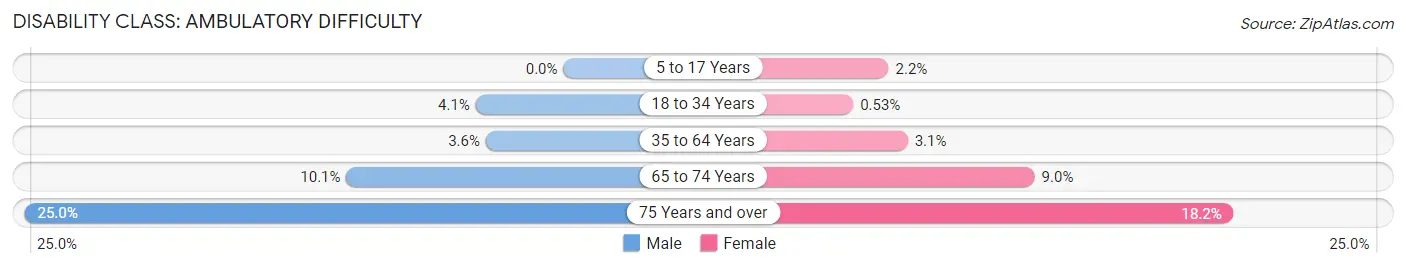
| Age Bracket | Male | Female |
| 5 to 17 Years | 0 (0.0%) | 3 (2.2%) |
| 18 to 34 Years | 29 (4.1%) | 11 (0.5%) |
| 35 to 64 Years | 24 (3.6%) | 22 (3.1%) |
| 65 to 74 Years | 15 (10.1%) | 17 (8.9%) |
| 75 Years and over | 34 (25.0%) | 30 (18.2%) |
Disability Class: Self-Care Difficulty
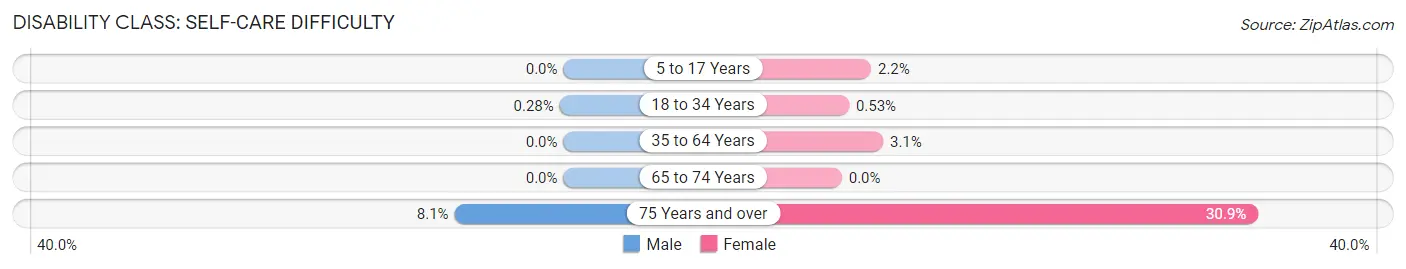
| Age Bracket | Male | Female |
| 5 to 17 Years | 0 (0.0%) | 3 (2.2%) |
| 18 to 34 Years | 2 (0.3%) | 11 (0.5%) |
| 35 to 64 Years | 0 (0.0%) | 22 (3.1%) |
| 65 to 74 Years | 0 (0.0%) | 0 (0.0%) |
| 75 Years and over | 11 (8.1%) | 51 (30.9%) |
Technology Access in Bryn Mawr
Computing Device Access in Bryn Mawr
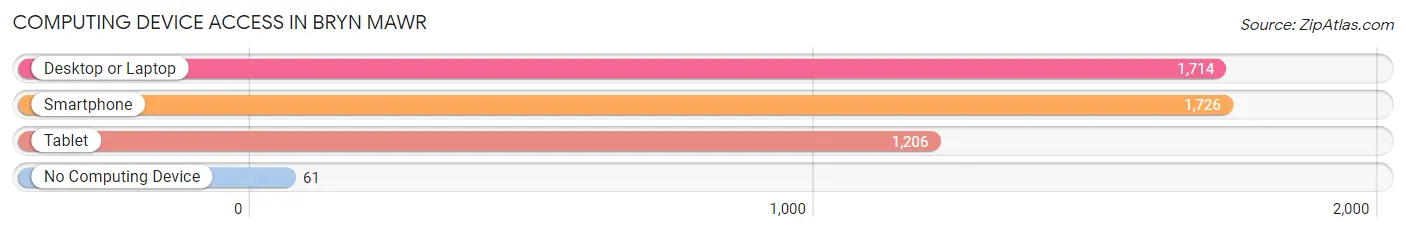
| Device Type | # Households | % Households |
| Desktop or Laptop | 1,714 | 92.0% |
| Smartphone | 1,726 | 92.7% |
| Tablet | 1,206 | 64.8% |
| No Computing Device | 61 | 3.3% |
| Total | 1,862 | 100.0% |
Internet Access in Bryn Mawr
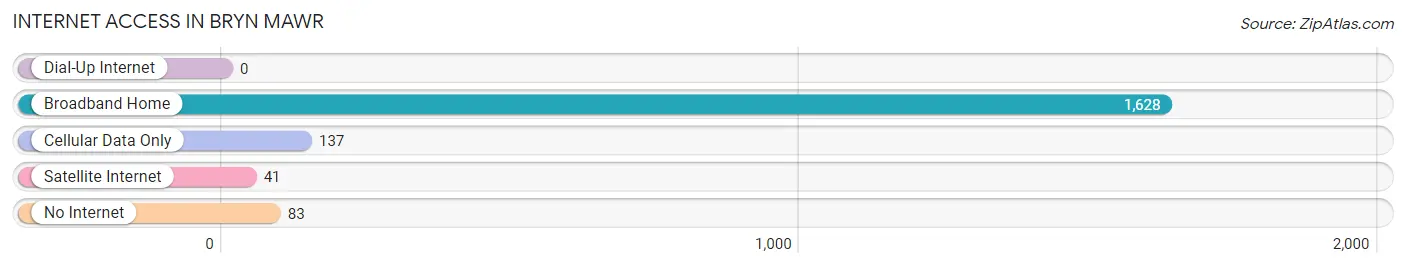
| Internet Type | # Households | % Households |
| Dial-Up Internet | 0 | 0.0% |
| Broadband Home | 1,628 | 87.4% |
| Cellular Data Only | 137 | 7.4% |
| Satellite Internet | 41 | 2.2% |
| No Internet | 83 | 4.5% |
| Total | 1,862 | 100.0% |
Bryn Mawr Summary
Bryn Mawr is a small, affluent town located in Montgomery County, Pennsylvania. It is situated approximately 15 miles northwest of Philadelphia and is part of the Main Line, a group of affluent suburbs located along the railroad line that runs from Philadelphia to the western suburbs. The town has a population of 3,779 as of the 2010 census, and is known for its historic homes, excellent schools, and vibrant downtown.
History
Bryn Mawr was founded in 1869 by Rowland Ellis, a Welsh immigrant who named the town after his ancestral home in Wales. The town was originally a farming community, but it quickly developed into a residential suburb of Philadelphia. In the late 19th century, the town became a popular destination for wealthy Philadelphians, who built large estates and mansions in the area.
In the early 20th century, Bryn Mawr was home to several prominent institutions, including Bryn Mawr College, the first women’s college in the United States, and the Bryn Mawr Hospital, which was founded in 1895. The town also became a popular destination for wealthy Philadelphians, who built large estates and mansions in the area.
Geography
Bryn Mawr is located in southeastern Pennsylvania, approximately 15 miles northwest of Philadelphia. It is situated in Montgomery County, and is part of the Main Line, a group of affluent suburbs located along the railroad line that runs from Philadelphia to the western suburbs. The town is bordered by Lower Merion Township to the north, Haverford Township to the east, Radnor Township to the south, and Tredyffrin Township to the west.
The town covers an area of 1.6 square miles, and is located at an elevation of approximately 300 feet above sea level. The terrain is mostly flat, with some rolling hills in the northern part of town. The climate is humid subtropical, with hot, humid summers and cold, wet winters.
Economy
Bryn Mawr is a wealthy, affluent town, and its economy is largely based on the service industry. The town is home to several large employers, including Bryn Mawr Hospital, Bryn Mawr College, and the Bryn Mawr Trust Company. The town also has a thriving retail sector, with several upscale shops and restaurants located in the downtown area.
Demographics
As of the 2010 census, Bryn Mawr had a population of 3,779. The racial makeup of the town was 87.3% White, 5.2% Asian, 4.2% African American, and 2.3% Hispanic or Latino. The median household income was $112,917, and the median family income was $133,917. The town has a highly educated population, with over 90% of adults having a bachelor’s degree or higher.
Conclusion
Bryn Mawr is a small, affluent town located in Montgomery County, Pennsylvania. It is situated approximately 15 miles northwest of Philadelphia and is part of the Main Line, a group of affluent suburbs located along the railroad line that runs from Philadelphia to the western suburbs. The town has a population of 3,779 as of the 2010 census, and is known for its historic homes, excellent schools, and vibrant downtown. The economy is largely based on the service industry, and the town has a highly educated population.
Common Questions
What is Per Capita Income in Bryn Mawr?
Per Capita income in Bryn Mawr is $43,309.
What is the Median Family Income in Bryn Mawr?
Median Family Income in Bryn Mawr is $125,948.
What is the Median Household income in Bryn Mawr?
Median Household Income in Bryn Mawr is $93,250.
What is Income or Wage Gap in Bryn Mawr?
Income or Wage Gap in Bryn Mawr is 86.9%.
Women in Bryn Mawr earn 13.1 cents for every dollar earned by a man.
What is Inequality or Gini Index in Bryn Mawr?
Inequality or Gini Index in Bryn Mawr is 0.50.
What is the Total Population of Bryn Mawr?
Total Population of Bryn Mawr is 5,508.
What is the Total Male Population of Bryn Mawr?
Total Male Population of Bryn Mawr is 2,051.
What is the Total Female Population of Bryn Mawr?
Total Female Population of Bryn Mawr is 3,457.
What is the Ratio of Males per 100 Females in Bryn Mawr?
There are 59.33 Males per 100 Females in Bryn Mawr.
What is the Ratio of Females per 100 Males in Bryn Mawr?
There are 168.55 Females per 100 Males in Bryn Mawr.
What is the Median Population Age in Bryn Mawr?
Median Population Age in Bryn Mawr is 27.5 Years.
What is the Average Family Size in Bryn Mawr
Average Family Size in Bryn Mawr is 2.7 People.
What is the Average Household Size in Bryn Mawr
Average Household Size in Bryn Mawr is 2.0 People.
How Large is the Labor Force in Bryn Mawr?
There are 3,227 People in the Labor Forcein in Bryn Mawr.
What is the Percentage of People in the Labor Force in Bryn Mawr?
63.0% of People are in the Labor Force in Bryn Mawr.
What is the Unemployment Rate in Bryn Mawr?
Unemployment Rate in Bryn Mawr is 7.4%.