Goldsboro borough, PA Map & Demographics
Goldsboro borough Overview
$38,433
PER CAPITA INCOME
$71,667
AVG FAMILY INCOME
$74,440
AVG HOUSEHOLD INCOME
37.1%
WAGE / INCOME GAP [ % ]
62.9¢/ $1
WAGE / INCOME GAP [ $ ]
0.33
INEQUALITY / GINI INDEX
716
TOTAL POPULATION
376
MALE POPULATION
340
FEMALE POPULATION
110.59
MALES / 100 FEMALES
90.43
FEMALES / 100 MALES
37.5
MEDIAN AGE
2.6
AVG FAMILY SIZE
2.4
AVG HOUSEHOLD SIZE
426
LABOR FORCE [ PEOPLE ]
74.5%
PERCENT IN LABOR FORCE
5.2%
UNEMPLOYMENT RATE
Income in Goldsboro borough
Income Overview in Goldsboro borough
Per Capita Income in Goldsboro borough is $38,433, while median incomes of families and households are $71,667 and $74,440 respectively.
| Characteristic | Number | Measure |
| Per Capita Income | 716 | $38,433 |
| Median Family Income | 230 | $71,667 |
| Mean Family Income | 230 | $94,565 |
| Median Household Income | 302 | $74,440 |
| Mean Household Income | 302 | $91,413 |
| Income Deficit | 230 | $0 |
| Wage / Income Gap (%) | 716 | 37.14% |
| Wage / Income Gap ($) | 716 | 62.86¢ per $1 |
| Gini / Inequality Index | 716 | 0.33 |
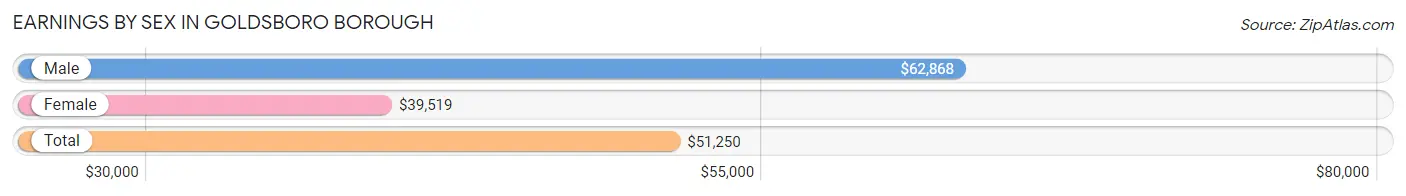
Earnings by Sex in Goldsboro borough
Average Earnings in Goldsboro borough are $51,250, $62,868 for men and $39,519 for women, a difference of 37.1%.
| Sex | Number | Average Earnings |
| Male | 229 (52.5%) | $62,868 |
| Female | 207 (47.5%) | $39,519 |
| Total | 436 (100.0%) | $51,250 |
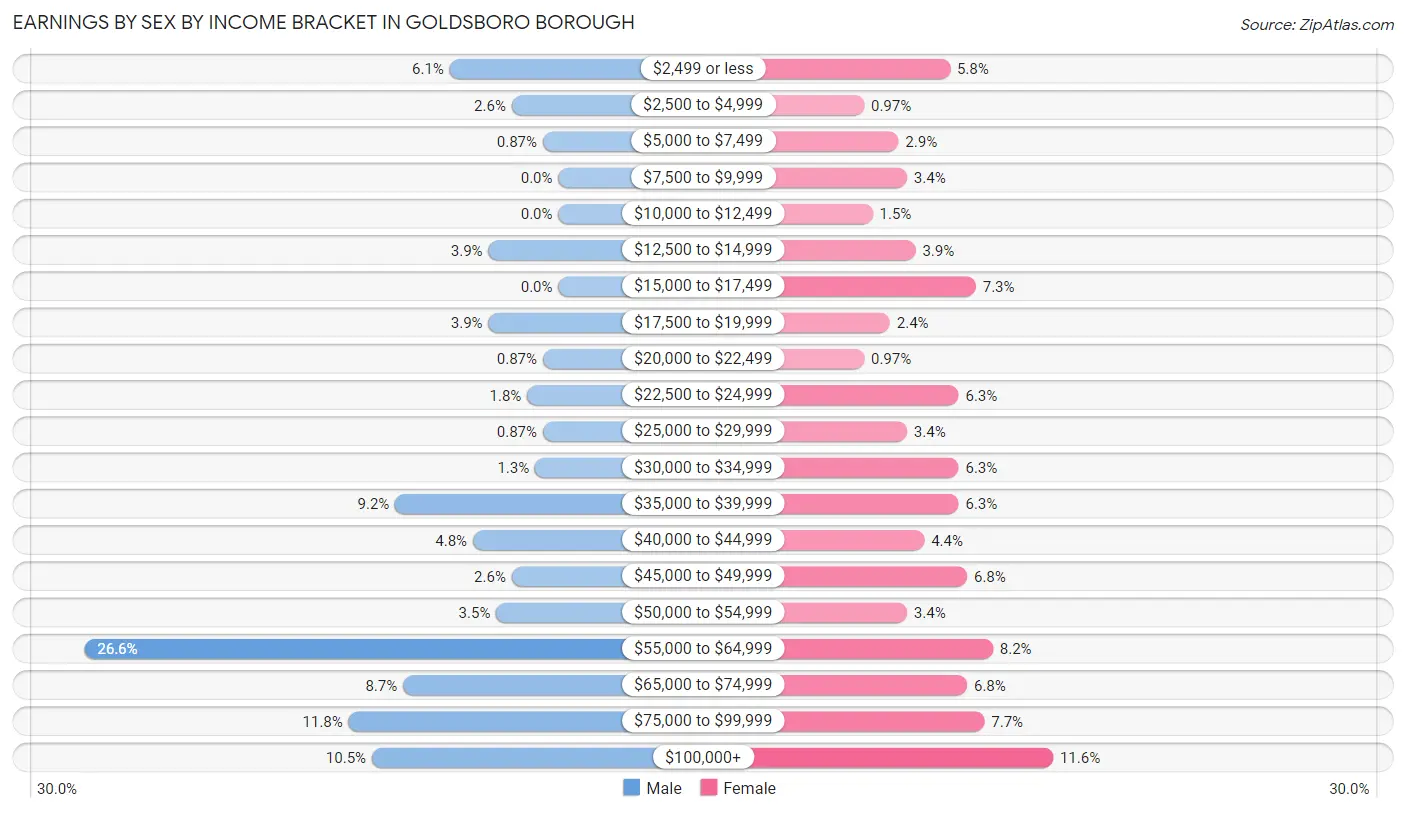
Earnings by Sex by Income Bracket in Goldsboro borough
The most common earnings brackets in Goldsboro borough are $55,000 to $64,999 for men (61 | 26.6%) and $100,000+ for women (24 | 11.6%).
| Income | Male | Female |
| $2,499 or less | 14 (6.1%) | 12 (5.8%) |
| $2,500 to $4,999 | 6 (2.6%) | 2 (1.0%) |
| $5,000 to $7,499 | 2 (0.9%) | 6 (2.9%) |
| $7,500 to $9,999 | 0 (0.0%) | 7 (3.4%) |
| $10,000 to $12,499 | 0 (0.0%) | 3 (1.5%) |
| $12,500 to $14,999 | 9 (3.9%) | 8 (3.9%) |
| $15,000 to $17,499 | 0 (0.0%) | 15 (7.2%) |
| $17,500 to $19,999 | 9 (3.9%) | 5 (2.4%) |
| $20,000 to $22,499 | 2 (0.9%) | 2 (1.0%) |
| $22,500 to $24,999 | 4 (1.8%) | 13 (6.3%) |
| $25,000 to $29,999 | 2 (0.9%) | 7 (3.4%) |
| $30,000 to $34,999 | 3 (1.3%) | 13 (6.3%) |
| $35,000 to $39,999 | 21 (9.2%) | 13 (6.3%) |
| $40,000 to $44,999 | 11 (4.8%) | 9 (4.3%) |
| $45,000 to $49,999 | 6 (2.6%) | 14 (6.8%) |
| $50,000 to $54,999 | 8 (3.5%) | 7 (3.4%) |
| $55,000 to $64,999 | 61 (26.6%) | 17 (8.2%) |
| $65,000 to $74,999 | 20 (8.7%) | 14 (6.8%) |
| $75,000 to $99,999 | 27 (11.8%) | 16 (7.7%) |
| $100,000+ | 24 (10.5%) | 24 (11.6%) |
| Total | 229 (100.0%) | 207 (100.0%) |
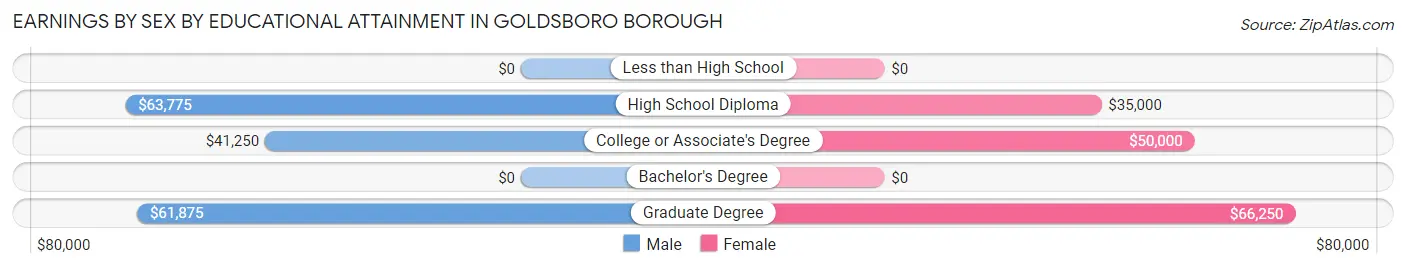
Earnings by Sex by Educational Attainment in Goldsboro borough
Average earnings in Goldsboro borough are $63,309 for men and $45,833 for women, a difference of 27.6%. Men with an educational attainment of high school diploma enjoy the highest average annual earnings of $63,775, while those with college or associate's degree education earn the least with $41,250. Women with an educational attainment of graduate degree earn the most with the average annual earnings of $66,250, while those with high school diploma education have the smallest earnings of $35,000.
| Educational Attainment | Male Income | Female Income |
| Less than High School | - | - |
| High School Diploma | $63,775 | $35,000 |
| College or Associate's Degree | $41,250 | $50,000 |
| Bachelor's Degree | - | - |
| Graduate Degree | $61,875 | $66,250 |
| Total | $63,309 | $45,833 |
Family Income in Goldsboro borough
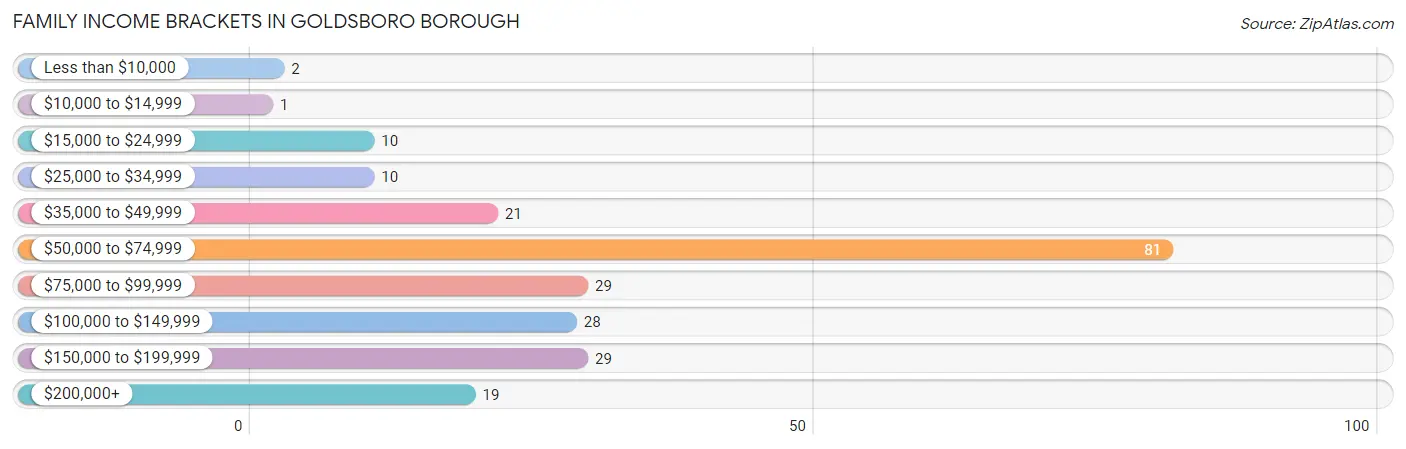
Family Income Brackets in Goldsboro borough
According to the Goldsboro borough family income data, there are 81 families falling into the $50,000 to $74,999 income range, which is the most common income bracket and makes up 35.2% of all families. Conversely, the $10,000 to $14,999 income bracket is the least frequent group with only 1 families (0.4%) belonging to this category.
| Income Bracket | # Families | % Families |
| Less than $10,000 | 2 | 0.9% |
| $10,000 to $14,999 | 1 | 0.4% |
| $15,000 to $24,999 | 10 | 4.3% |
| $25,000 to $34,999 | 10 | 4.3% |
| $35,000 to $49,999 | 21 | 9.1% |
| $50,000 to $74,999 | 81 | 35.2% |
| $75,000 to $99,999 | 29 | 12.6% |
| $100,000 to $149,999 | 28 | 12.2% |
| $150,000 to $199,999 | 29 | 12.6% |
| $200,000+ | 19 | 8.3% |
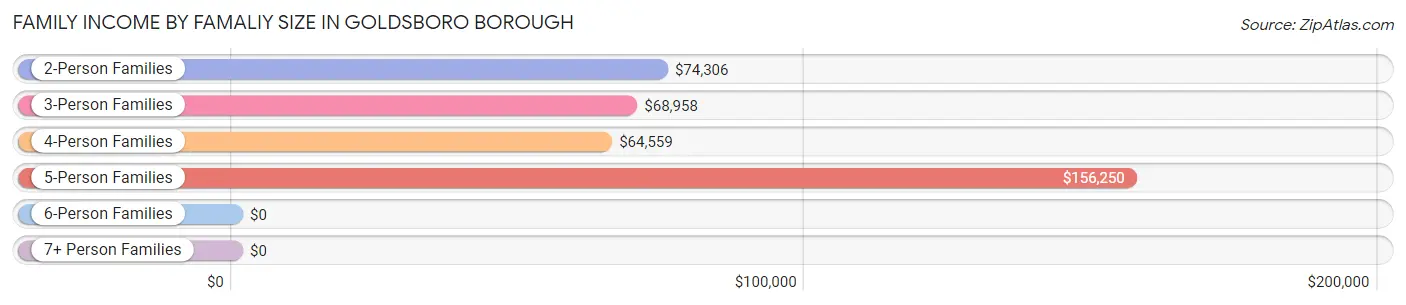
Family Income by Famaliy Size in Goldsboro borough
5-person families (6 | 2.6%) account for the highest median family income in Goldsboro borough with $156,250 per family, while 2-person families (101 | 43.9%) have the highest median income of $37,153 per family member.
| Income Bracket | # Families | Median Income |
| 2-Person Families | 101 (43.9%) | $74,306 |
| 3-Person Families | 33 (14.3%) | $68,958 |
| 4-Person Families | 88 (38.3%) | $64,559 |
| 5-Person Families | 6 (2.6%) | $156,250 |
| 6-Person Families | 2 (0.9%) | $0 |
| 7+ Person Families | 0 (0.0%) | $0 |
| Total | 230 (100.0%) | $71,667 |
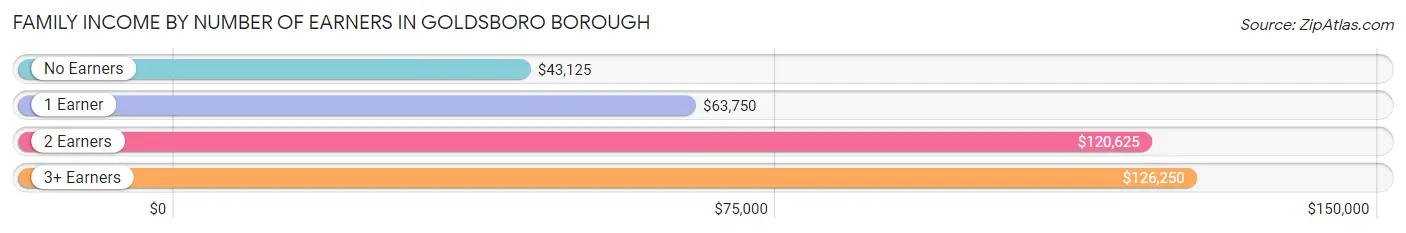
Family Income by Number of Earners in Goldsboro borough
The median family income in Goldsboro borough is $71,667, with families comprising 3+ earners (30) having the highest median family income of $126,250, while families with no earners (29) have the lowest median family income of $43,125, accounting for 13.0% and 12.6% of families, respectively.
| Number of Earners | # Families | Median Income |
| No Earners | 29 (12.6%) | $43,125 |
| 1 Earner | 105 (45.7%) | $63,750 |
| 2 Earners | 66 (28.7%) | $120,625 |
| 3+ Earners | 30 (13.0%) | $126,250 |
| Total | 230 (100.0%) | $71,667 |
Household Income in Goldsboro borough
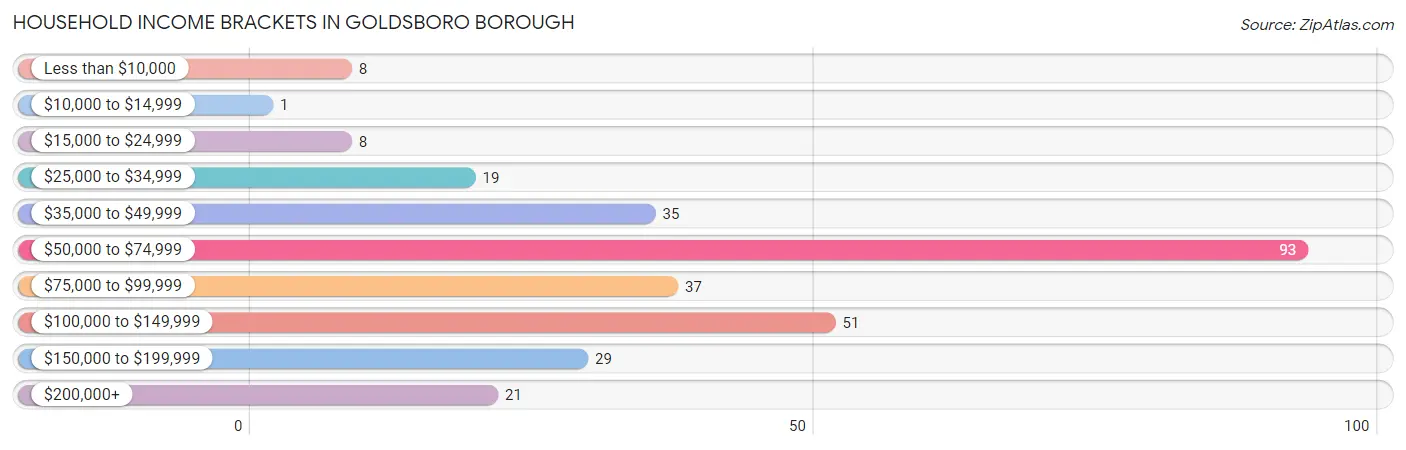
Household Income Brackets in Goldsboro borough
With 93 households falling in the category, the $50,000 to $74,999 income range is the most frequent in Goldsboro borough, accounting for 30.8% of all households. In contrast, only 1 households (0.3%) fall into the $10,000 to $14,999 income bracket, making it the least populous group.
| Income Bracket | # Households | % Households |
| Less than $10,000 | 8 | 2.6% |
| $10,000 to $14,999 | 1 | 0.3% |
| $15,000 to $24,999 | 8 | 2.6% |
| $25,000 to $34,999 | 19 | 6.3% |
| $35,000 to $49,999 | 35 | 11.6% |
| $50,000 to $74,999 | 93 | 30.8% |
| $75,000 to $99,999 | 37 | 12.3% |
| $100,000 to $149,999 | 51 | 16.9% |
| $150,000 to $199,999 | 29 | 9.6% |
| $200,000+ | 21 | 7.0% |
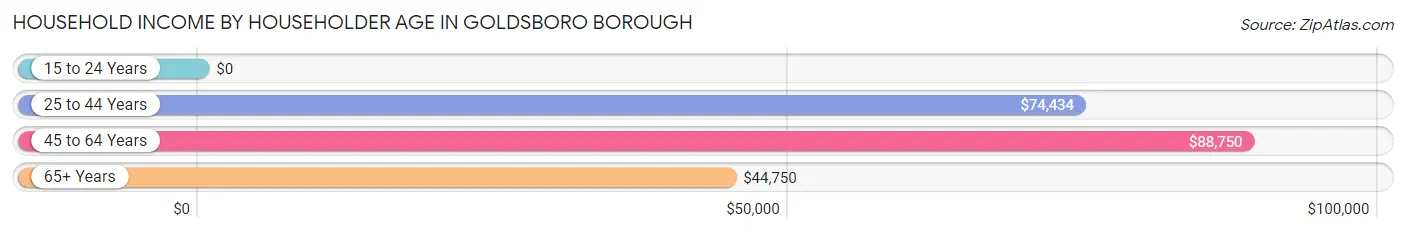
Household Income by Householder Age in Goldsboro borough
The median household income in Goldsboro borough is $74,440, with the highest median household income of $88,750 found in the 45 to 64 years age bracket for the primary householder. A total of 120 households (39.7%) fall into this category. Meanwhile, the 15 to 24 years age bracket for the primary householder has the lowest median household income of $0, with 5 households (1.7%) in this group.
| Income Bracket | # Households | Median Income |
| 15 to 24 Years | 5 (1.7%) | $0 |
| 25 to 44 Years | 122 (40.4%) | $74,434 |
| 45 to 64 Years | 120 (39.7%) | $88,750 |
| 65+ Years | 55 (18.2%) | $44,750 |
| Total | 302 (100.0%) | $74,440 |
Poverty in Goldsboro borough
Income Below Poverty by Sex and Age in Goldsboro borough
With 6.7% poverty level for males and 14.2% for females among the residents of Goldsboro borough, 12 to 14 year old males and under 5 year old females are the most vulnerable to poverty, with 2 males (33.3%) and 5 females (55.6%) in their respective age groups living below the poverty level.
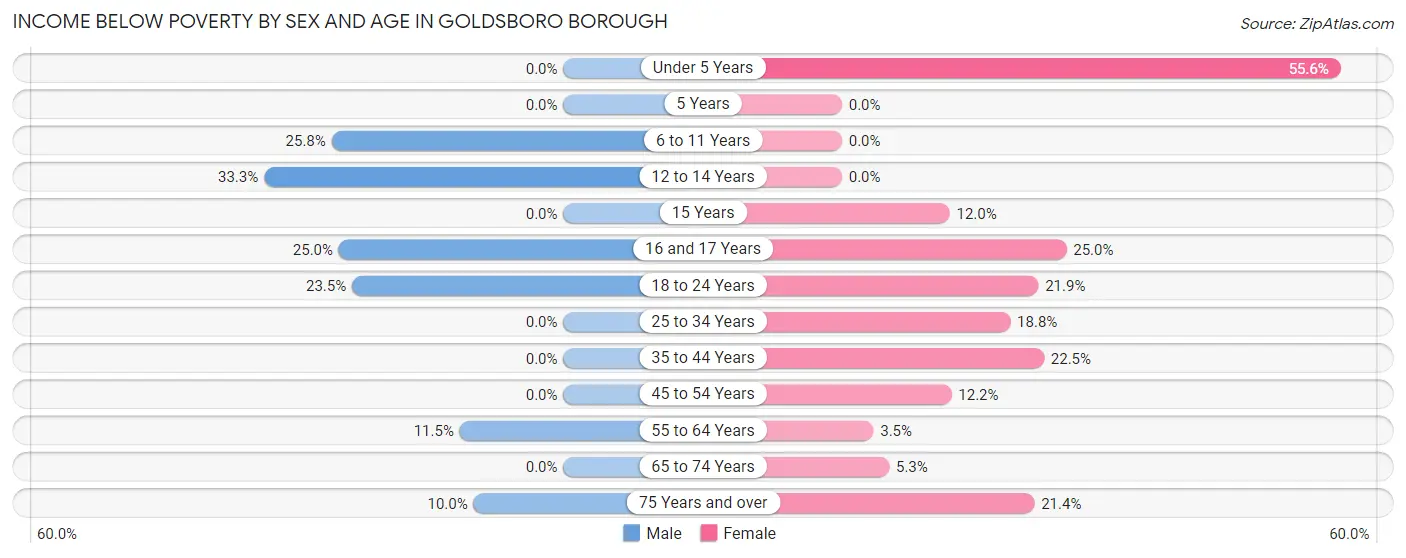
| Age Bracket | Male | Female |
| Under 5 Years | 0 (0.0%) | 5 (55.6%) |
| 5 Years | 0 (0.0%) | 0 (0.0%) |
| 6 to 11 Years | 8 (25.8%) | 0 (0.0%) |
| 12 to 14 Years | 2 (33.3%) | 0 (0.0%) |
| 15 Years | 0 (0.0%) | 3 (12.0%) |
| 16 and 17 Years | 4 (25.0%) | 2 (25.0%) |
| 18 to 24 Years | 4 (23.5%) | 7 (21.9%) |
| 25 to 34 Years | 0 (0.0%) | 9 (18.8%) |
| 35 to 44 Years | 0 (0.0%) | 9 (22.5%) |
| 45 to 54 Years | 0 (0.0%) | 5 (12.2%) |
| 55 to 64 Years | 6 (11.5%) | 2 (3.5%) |
| 65 to 74 Years | 0 (0.0%) | 2 (5.3%) |
| 75 Years and over | 1 (10.0%) | 3 (21.4%) |
| Total | 25 (6.7%) | 47 (14.2%) |
Income Above Poverty by Sex and Age in Goldsboro borough
According to the poverty statistics in Goldsboro borough, males aged under 5 years and females aged 6 to 11 years are the age groups that are most secure financially, with 100.0% of males and 100.0% of females in these age groups living above the poverty line.
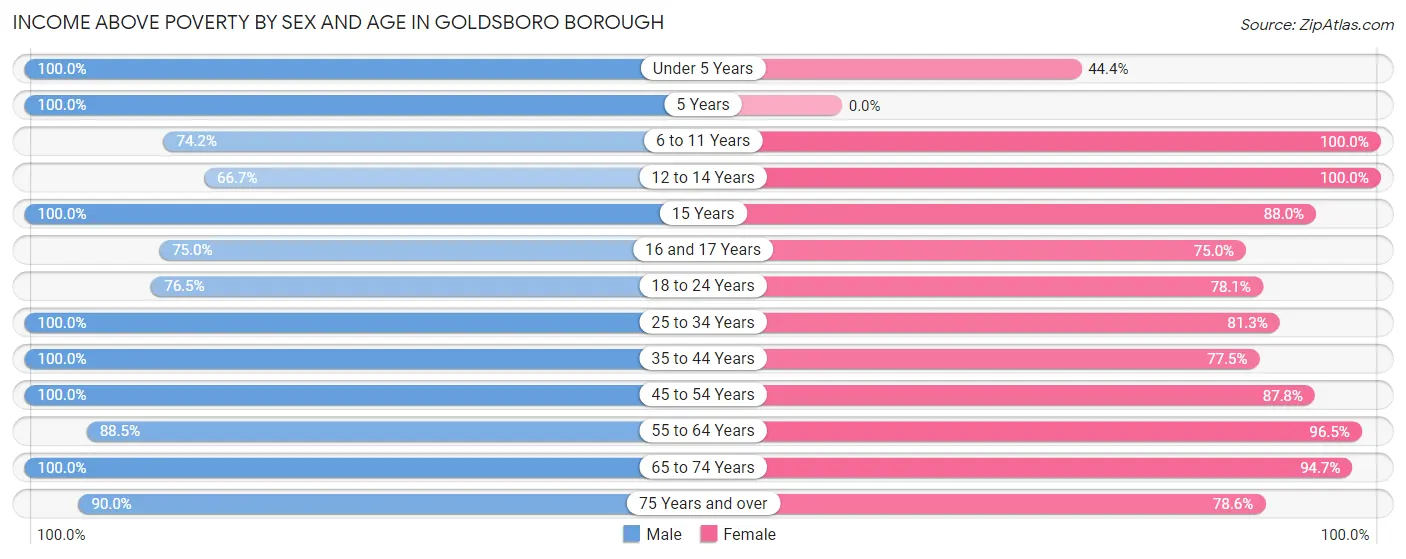
| Age Bracket | Male | Female |
| Under 5 Years | 35 (100.0%) | 4 (44.4%) |
| 5 Years | 5 (100.0%) | 0 (0.0%) |
| 6 to 11 Years | 23 (74.2%) | 18 (100.0%) |
| 12 to 14 Years | 4 (66.7%) | 2 (100.0%) |
| 15 Years | 5 (100.0%) | 22 (88.0%) |
| 16 and 17 Years | 12 (75.0%) | 6 (75.0%) |
| 18 to 24 Years | 13 (76.5%) | 25 (78.1%) |
| 25 to 34 Years | 40 (100.0%) | 39 (81.2%) |
| 35 to 44 Years | 77 (100.0%) | 31 (77.5%) |
| 45 to 54 Years | 48 (100.0%) | 36 (87.8%) |
| 55 to 64 Years | 46 (88.5%) | 55 (96.5%) |
| 65 to 74 Years | 34 (100.0%) | 36 (94.7%) |
| 75 Years and over | 9 (90.0%) | 11 (78.6%) |
| Total | 351 (93.3%) | 285 (85.8%) |
Income Below Poverty Among Married-Couple Families in Goldsboro borough
The poverty statistics for married-couple families in Goldsboro borough show that 0.8% or 1 of the total 128 families live below the poverty line. Families with no children have the highest poverty rate of 1.1%, comprising of 1 families. On the other hand, families with 1 or 2 children have the lowest poverty rate of 0.0%, which includes 0 families.
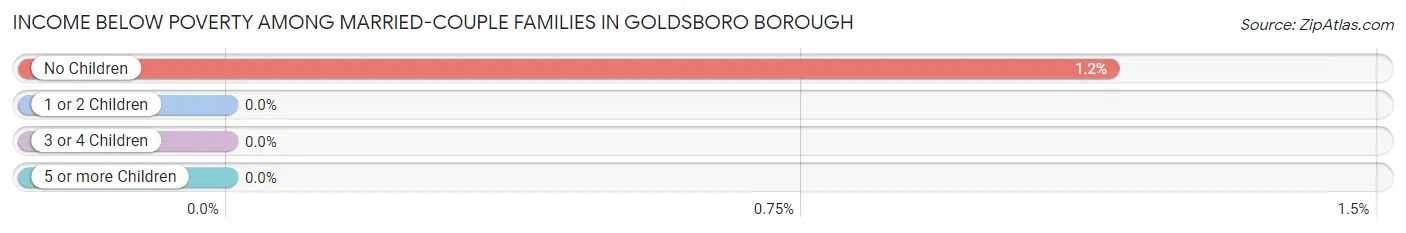
| Children | Above Poverty | Below Poverty |
| No Children | 86 (98.9%) | 1 (1.1%) |
| 1 or 2 Children | 33 (100.0%) | 0 (0.0%) |
| 3 or 4 Children | 8 (100.0%) | 0 (0.0%) |
| 5 or more Children | 0 (0.0%) | 0 (0.0%) |
| Total | 127 (99.2%) | 1 (0.8%) |
Income Below Poverty Among Single-Parent Households in Goldsboro borough
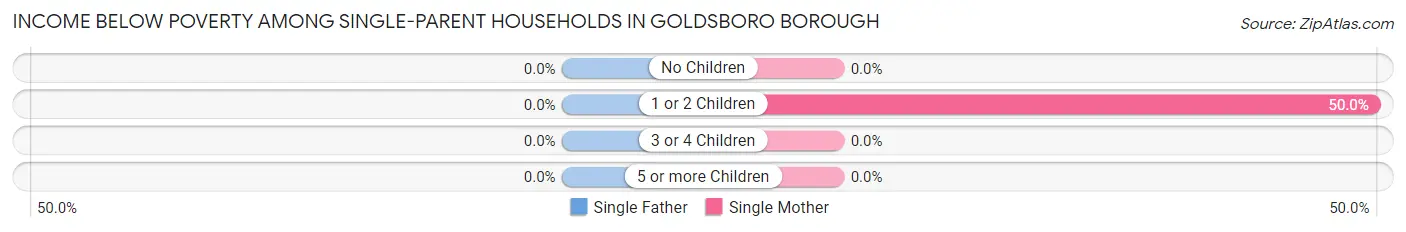
| Children | Single Father | Single Mother |
| No Children | 0 (0.0%) | 0 (0.0%) |
| 1 or 2 Children | 0 (0.0%) | 12 (50.0%) |
| 3 or 4 Children | 0 (0.0%) | 0 (0.0%) |
| 5 or more Children | 0 (0.0%) | 0 (0.0%) |
| Total | 0 (0.0%) | 12 (32.4%) |
Income Below Poverty Among Married-Couple vs Single-Parent Households in Goldsboro borough
The poverty data for Goldsboro borough shows that 1 of the married-couple family households (0.8%) and 12 of the single-parent households (11.8%) are living below the poverty level. Within the married-couple family households, those with no children have the highest poverty rate, with 1 households (1.1%) falling below the poverty line. Among the single-parent households, those with 1 or 2 children have the highest poverty rate, with 12 household (40.0%) living below poverty.
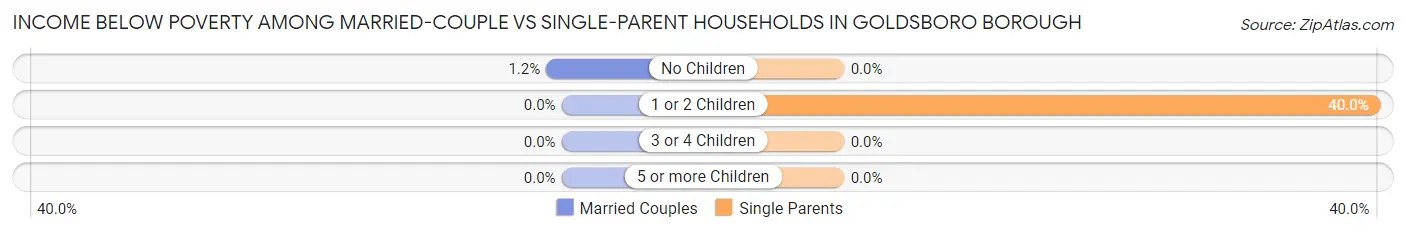
| Children | Married-Couple Families | Single-Parent Households |
| No Children | 1 (1.1%) | 0 (0.0%) |
| 1 or 2 Children | 0 (0.0%) | 12 (40.0%) |
| 3 or 4 Children | 0 (0.0%) | 0 (0.0%) |
| 5 or more Children | 0 (0.0%) | 0 (0.0%) |
| Total | 1 (0.8%) | 12 (11.8%) |
Race in Goldsboro borough
The most populous races in Goldsboro borough are White / Caucasian (596 | 83.2%), Two or more Races (101 | 14.1%), and Hispanic or Latino (30 | 4.2%).
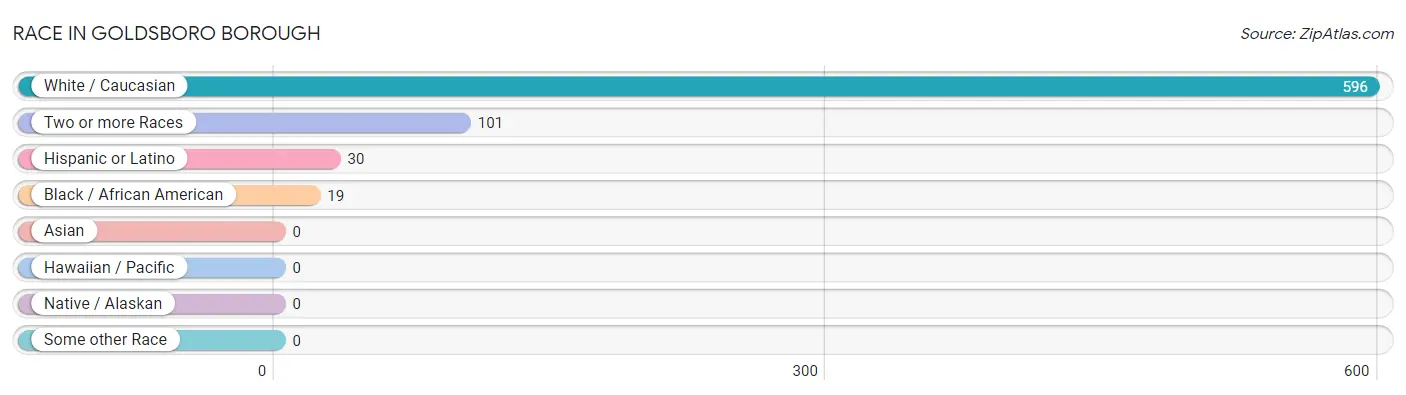
| Race | # Population | % Population |
| Asian | 0 | 0.0% |
| Black / African American | 19 | 2.6% |
| Hawaiian / Pacific | 0 | 0.0% |
| Hispanic or Latino | 30 | 4.2% |
| Native / Alaskan | 0 | 0.0% |
| White / Caucasian | 596 | 83.2% |
| Two or more Races | 101 | 14.1% |
| Some other Race | 0 | 0.0% |
| Total | 716 | 100.0% |
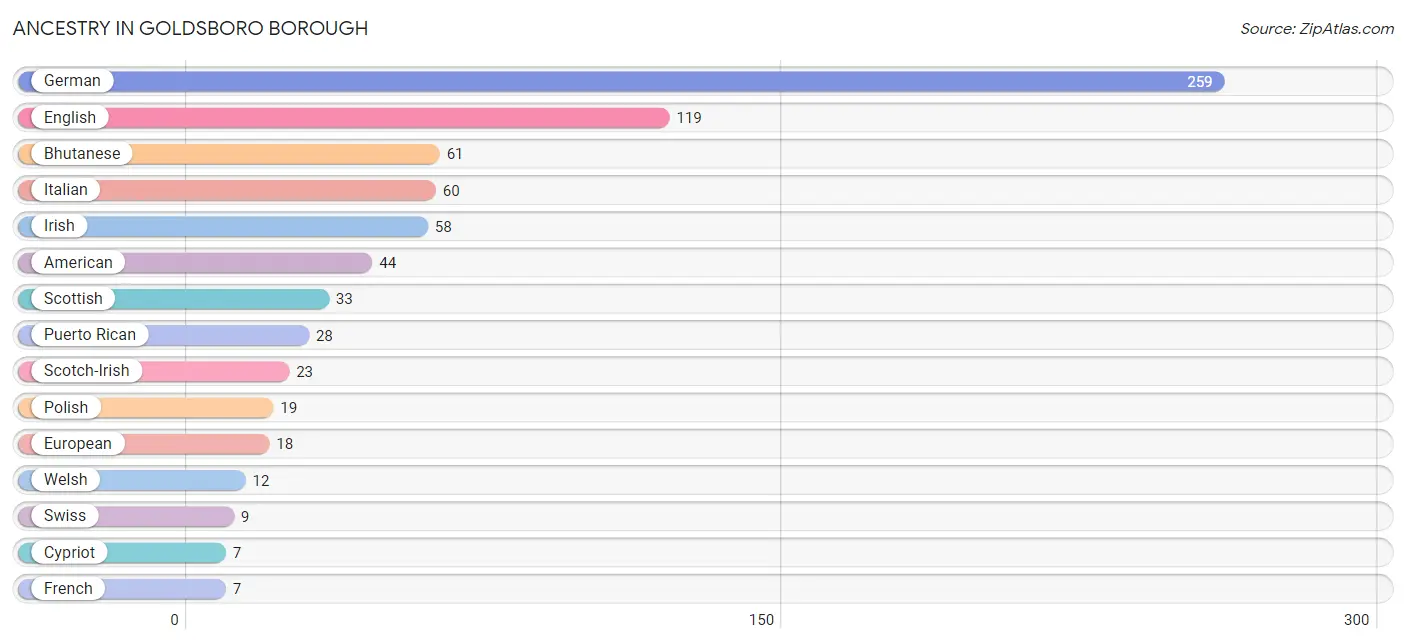
Ancestry in Goldsboro borough
The most populous ancestries reported in Goldsboro borough are German (259 | 36.2%), English (119 | 16.6%), Bhutanese (61 | 8.5%), Italian (60 | 8.4%), and Irish (58 | 8.1%), together accounting for 77.8% of all Goldsboro borough residents.
| Ancestry | # Population | % Population |
| African | 4 | 0.6% |
| American | 44 | 6.1% |
| Austrian | 2 | 0.3% |
| Bhutanese | 61 | 8.5% |
| Choctaw | 3 | 0.4% |
| Comanche | 2 | 0.3% |
| Cypriot | 7 | 1.0% |
| Czechoslovakian | 2 | 0.3% |
| Dutch | 5 | 0.7% |
| Eastern European | 3 | 0.4% |
| English | 119 | 16.6% |
| European | 18 | 2.5% |
| French | 7 | 1.0% |
| German | 259 | 36.2% |
| Irish | 58 | 8.1% |
| Italian | 60 | 8.4% |
| Lithuanian | 4 | 0.6% |
| Macedonian | 6 | 0.8% |
| Mexican | 2 | 0.3% |
| Pennsylvania German | 7 | 1.0% |
| Polish | 19 | 2.6% |
| Puerto Rican | 28 | 3.9% |
| Romanian | 4 | 0.6% |
| Russian | 2 | 0.3% |
| Scotch-Irish | 23 | 3.2% |
| Scottish | 33 | 4.6% |
| Slovak | 2 | 0.3% |
| Slovene | 7 | 1.0% |
| Subsaharan African | 4 | 0.6% |
| Swedish | 2 | 0.3% |
| Swiss | 9 | 1.3% |
| Ukrainian | 4 | 0.6% |
| Welsh | 12 | 1.7% | View All 33 Rows |
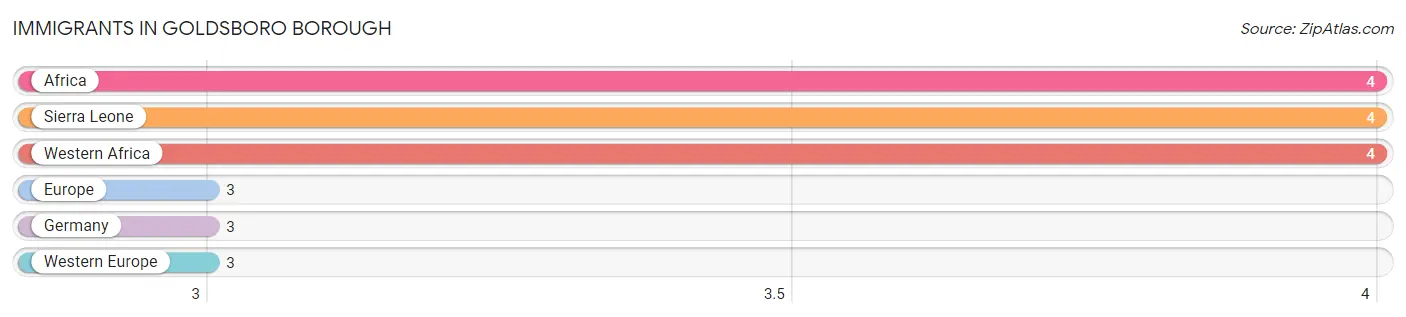
Immigrants in Goldsboro borough
The most numerous immigrant groups reported in Goldsboro borough came from Africa (4 | 0.6%), Sierra Leone (4 | 0.6%), Western Africa (4 | 0.6%), Europe (3 | 0.4%), and Germany (3 | 0.4%), together accounting for 2.5% of all Goldsboro borough residents.
| Immigration Origin | # Population | % Population |
| Africa | 4 | 0.6% |
| Europe | 3 | 0.4% |
| Germany | 3 | 0.4% |
| Sierra Leone | 4 | 0.6% |
| Western Africa | 4 | 0.6% |
| Western Europe | 3 | 0.4% | View All 6 Rows |
Sex and Age in Goldsboro borough
Sex and Age in Goldsboro borough
The most populous age groups in Goldsboro borough are 35 to 39 Years (69 | 18.3%) for men and 55 to 59 Years (42 | 12.3%) for women.
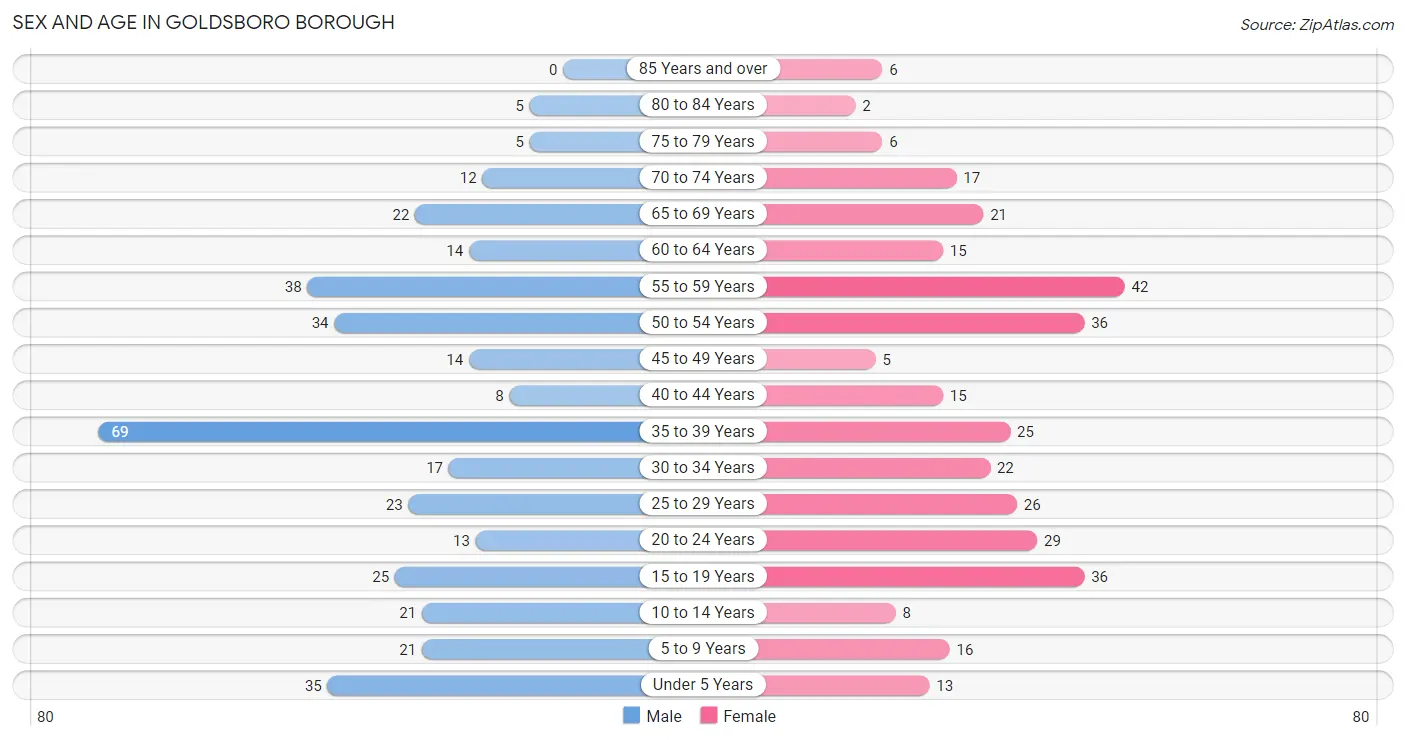
| Age Bracket | Male | Female |
| Under 5 Years | 35 (9.3%) | 13 (3.8%) |
| 5 to 9 Years | 21 (5.6%) | 16 (4.7%) |
| 10 to 14 Years | 21 (5.6%) | 8 (2.4%) |
| 15 to 19 Years | 25 (6.7%) | 36 (10.6%) |
| 20 to 24 Years | 13 (3.5%) | 29 (8.5%) |
| 25 to 29 Years | 23 (6.1%) | 26 (7.6%) |
| 30 to 34 Years | 17 (4.5%) | 22 (6.5%) |
| 35 to 39 Years | 69 (18.3%) | 25 (7.3%) |
| 40 to 44 Years | 8 (2.1%) | 15 (4.4%) |
| 45 to 49 Years | 14 (3.7%) | 5 (1.5%) |
| 50 to 54 Years | 34 (9.0%) | 36 (10.6%) |
| 55 to 59 Years | 38 (10.1%) | 42 (12.3%) |
| 60 to 64 Years | 14 (3.7%) | 15 (4.4%) |
| 65 to 69 Years | 22 (5.9%) | 21 (6.2%) |
| 70 to 74 Years | 12 (3.2%) | 17 (5.0%) |
| 75 to 79 Years | 5 (1.3%) | 6 (1.8%) |
| 80 to 84 Years | 5 (1.3%) | 2 (0.6%) |
| 85 Years and over | 0 (0.0%) | 6 (1.8%) |
| Total | 376 (100.0%) | 340 (100.0%) |
Families and Households in Goldsboro borough
Median Family Size in Goldsboro borough
The median family size in Goldsboro borough is 2.57 persons per family, with married-couple families (128 | 55.6%) accounting for the largest median family size of 2.98 persons per family. On the other hand, single male/father families (65 | 28.3%) represent the smallest median family size with 1.74 persons per family.
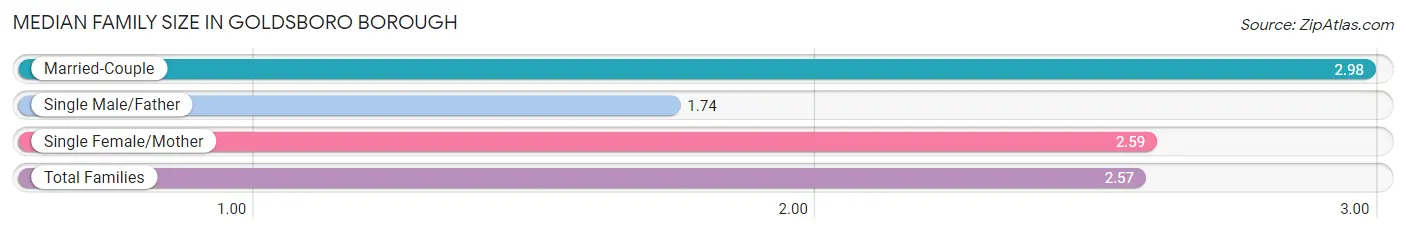
| Family Type | # Families | Family Size |
| Married-Couple | 128 (55.6%) | 2.98 |
| Single Male/Father | 65 (28.3%) | 1.74 |
| Single Female/Mother | 37 (16.1%) | 2.59 |
| Total Families | 230 (100.0%) | 2.57 |
Median Household Size in Goldsboro borough
The median household size in Goldsboro borough is 2.37 persons per household, with married-couple households (128 | 42.4%) accounting for the largest median household size of 3 persons per household. non-family households (72 | 23.8%) represent the smallest median household size with 1.26 persons per household.
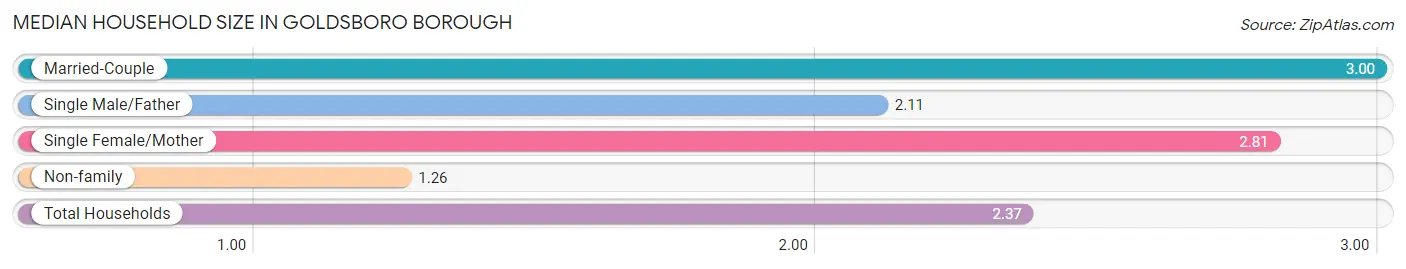
| Household Type | # Households | Household Size |
| Married-Couple | 128 (42.4%) | 3.00 |
| Single Male/Father | 65 (21.5%) | 2.11 |
| Single Female/Mother | 37 (12.2%) | 2.81 |
| Non-family | 72 (23.8%) | 1.26 |
| Total Households | 302 (100.0%) | 2.37 |
Household Size by Marriage Status in Goldsboro borough
Out of a total of 302 households in Goldsboro borough, 230 (76.2%) are family households, while 72 (23.8%) are nonfamily households. The most numerous type of family households are 2-person households, comprising 91, and the most common type of nonfamily households are 1-person households, comprising 56.
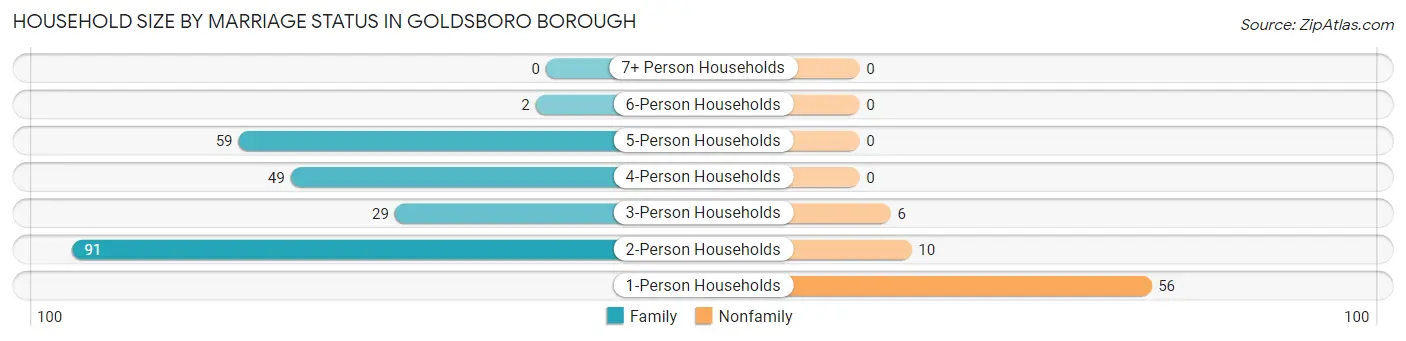
| Household Size | Family Households | Nonfamily Households |
| 1-Person Households | - | 56 (18.5%) |
| 2-Person Households | 91 (30.1%) | 10 (3.3%) |
| 3-Person Households | 29 (9.6%) | 6 (2.0%) |
| 4-Person Households | 49 (16.2%) | 0 (0.0%) |
| 5-Person Households | 59 (19.5%) | 0 (0.0%) |
| 6-Person Households | 2 (0.7%) | 0 (0.0%) |
| 7+ Person Households | 0 (0.0%) | 0 (0.0%) |
| Total | 230 (76.2%) | 72 (23.8%) |
Female Fertility in Goldsboro borough
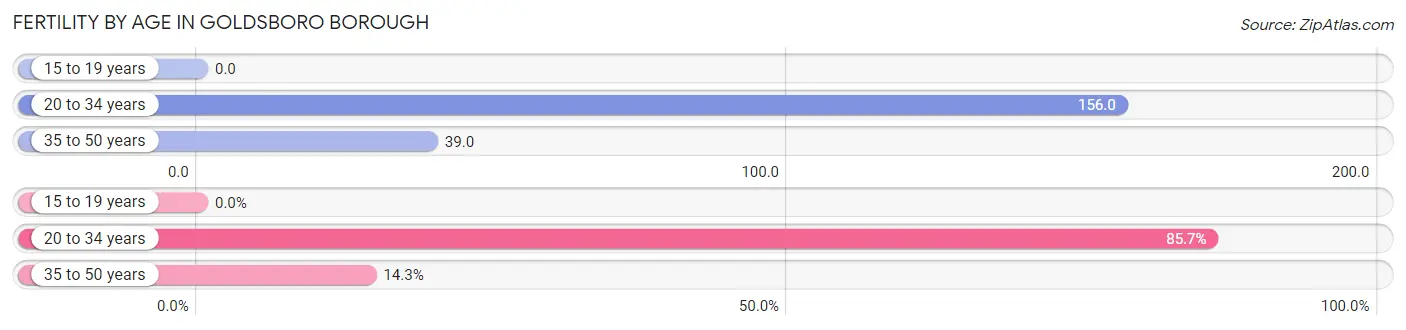
Fertility by Age in Goldsboro borough
Average fertility rate in Goldsboro borough is 85.0 births per 1,000 women. Women in the age bracket of 20 to 34 years have the highest fertility rate with 156.0 births per 1,000 women. Women in the age bracket of 20 to 34 years acount for 85.7% of all women with births.
| Age Bracket | Women with Births | Births / 1,000 Women |
| 15 to 19 years | 0 (0.0%) | 0.0 |
| 20 to 34 years | 12 (85.7%) | 156.0 |
| 35 to 50 years | 2 (14.3%) | 39.0 |
| Total | 14 (100.0%) | 85.0 |
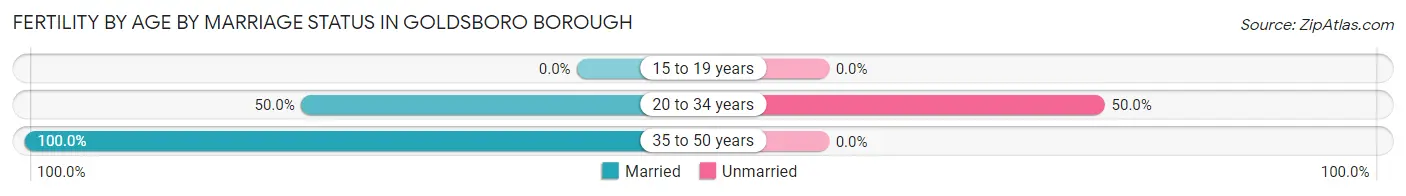
Fertility by Age by Marriage Status in Goldsboro borough
57.1% of women with births (14) in Goldsboro borough are married. The highest percentage of unmarried women with births falls into 20 to 34 years age bracket with 50.0% of them unmarried at the time of birth, while the lowest percentage of unmarried women with births belong to 35 to 50 years age bracket with 0.0% of them unmarried.
| Age Bracket | Married | Unmarried |
| 15 to 19 years | 0 (0.0%) | 0 (0.0%) |
| 20 to 34 years | 6 (50.0%) | 6 (50.0%) |
| 35 to 50 years | 2 (100.0%) | 0 (0.0%) |
| Total | 8 (57.1%) | 6 (42.9%) |
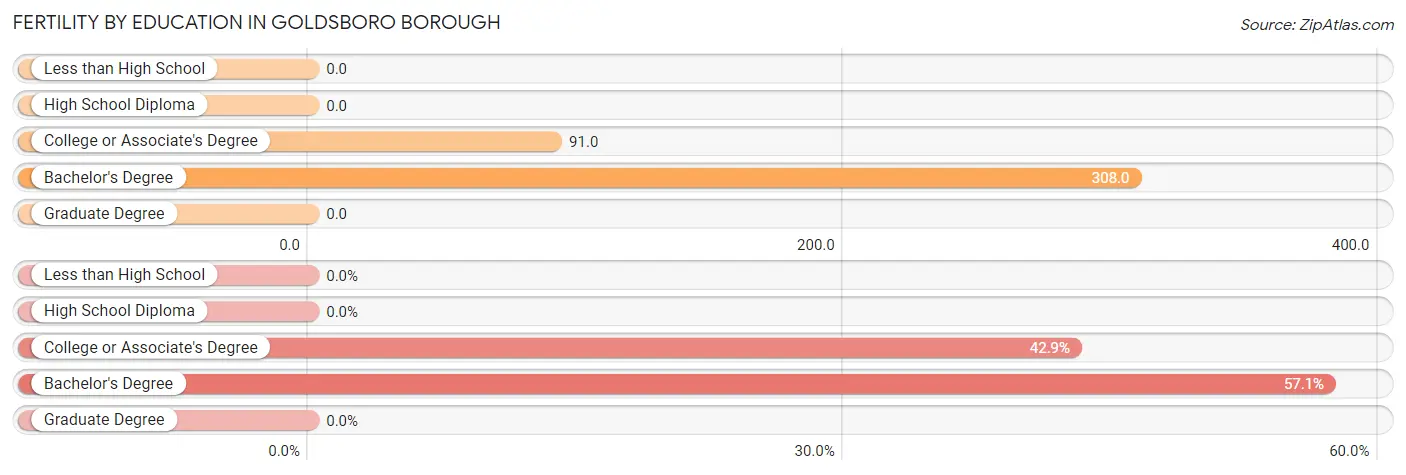
Fertility by Education in Goldsboro borough
| Educational Attainment | Women with Births | Births / 1,000 Women |
| Less than High School | 0 (0.0%) | 0.0 |
| High School Diploma | 0 (0.0%) | 0.0 |
| College or Associate's Degree | 6 (42.9%) | 91.0 |
| Bachelor's Degree | 8 (57.1%) | 308.0 |
| Graduate Degree | 0 (0.0%) | 0.0 |
| Total | 14 (100.0%) | 85.0 |
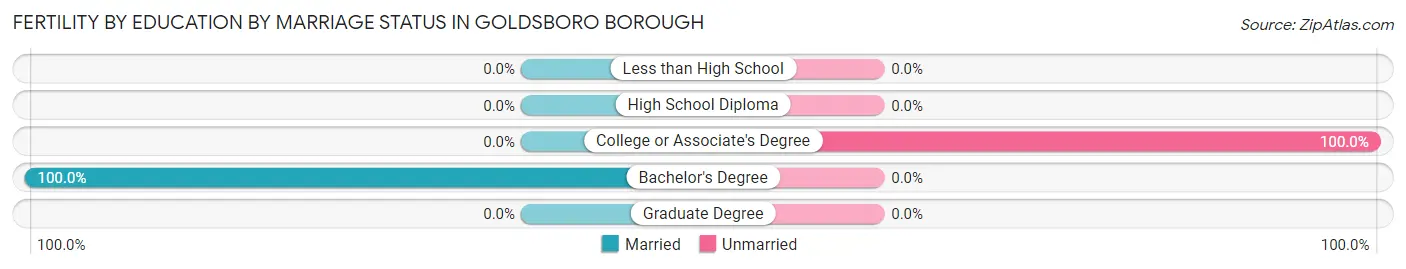
Fertility by Education by Marriage Status in Goldsboro borough
42.9% of women with births in Goldsboro borough are unmarried. Women with the educational attainment of bachelor's degree are most likely to be married with 100.0% of them married at childbirth, while women with the educational attainment of college or associate's degree are least likely to be married with 100.0% of them unmarried at childbirth.
| Educational Attainment | Married | Unmarried |
| Less than High School | 0 (0.0%) | 0 (0.0%) |
| High School Diploma | 0 (0.0%) | 0 (0.0%) |
| College or Associate's Degree | 0 (0.0%) | 6 (100.0%) |
| Bachelor's Degree | 8 (100.0%) | 0 (0.0%) |
| Graduate Degree | 0 (0.0%) | 0 (0.0%) |
| Total | 8 (57.1%) | 6 (42.9%) |
Employment Characteristics in Goldsboro borough
Employment by Class of Employer in Goldsboro borough
Among the 398 employed individuals in Goldsboro borough, private company employees (242 | 60.8%), state government employees (45 | 11.3%), and not-for-profit organizations (43 | 10.8%) make up the most common classes of employment.
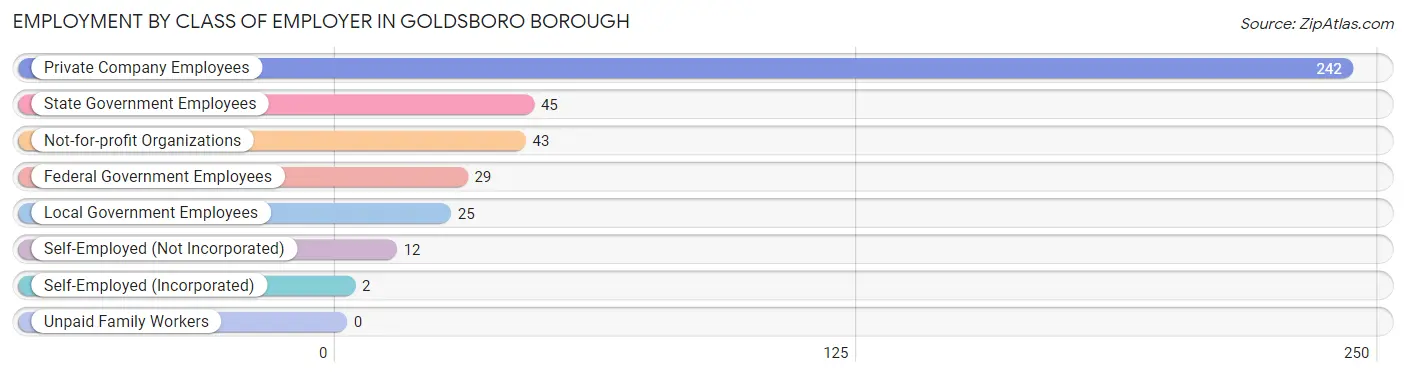
| Employer Class | # Employees | % Employees |
| Private Company Employees | 242 | 60.8% |
| Self-Employed (Incorporated) | 2 | 0.5% |
| Self-Employed (Not Incorporated) | 12 | 3.0% |
| Not-for-profit Organizations | 43 | 10.8% |
| Local Government Employees | 25 | 6.3% |
| State Government Employees | 45 | 11.3% |
| Federal Government Employees | 29 | 7.3% |
| Unpaid Family Workers | 0 | 0.0% |
| Total | 398 | 100.0% |
Employment Status by Age in Goldsboro borough
According to the labor force statistics for Goldsboro borough, out of the total population over 16 years of age (572), 74.5% or 426 individuals are in the labor force, with 5.2% or 22 of them unemployed. The age group with the highest labor force participation rate is 30 to 34 years, with 94.9% or 37 individuals in the labor force. Within the labor force, the 16 to 19 years age range has the highest percentage of unemployed individuals, with 66.7% or 14 of them being unemployed.
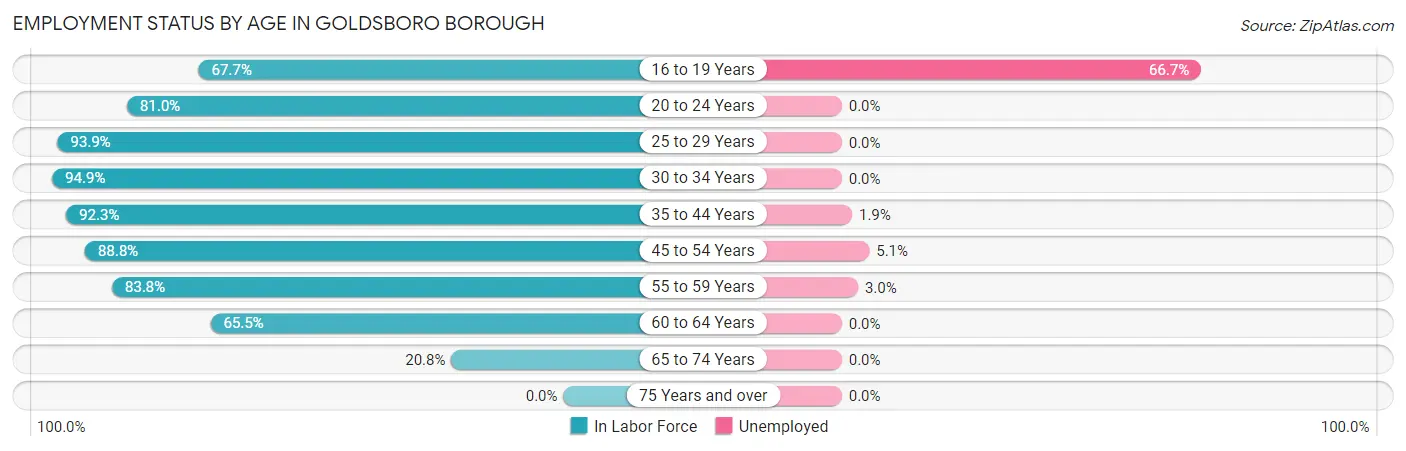
| Age Bracket | In Labor Force | Unemployed |
| 16 to 19 Years | 21 (67.7%) | 14 (66.7%) |
| 20 to 24 Years | 34 (81.0%) | 0 (0.0%) |
| 25 to 29 Years | 46 (93.9%) | 0 (0.0%) |
| 30 to 34 Years | 37 (94.9%) | 0 (0.0%) |
| 35 to 44 Years | 108 (92.3%) | 2 (1.9%) |
| 45 to 54 Years | 79 (88.8%) | 4 (5.1%) |
| 55 to 59 Years | 67 (83.8%) | 2 (3.0%) |
| 60 to 64 Years | 19 (65.5%) | 0 (0.0%) |
| 65 to 74 Years | 15 (20.8%) | 0 (0.0%) |
| 75 Years and over | 0 (0.0%) | 0 (0.0%) |
| Total | 426 (74.5%) | 22 (5.2%) |
Employment Status by Educational Attainment in Goldsboro borough
According to labor force statistics for Goldsboro borough, 88.3% of individuals (356) out of the total population between 25 and 64 years of age (403) are in the labor force, with 2.2% or 8 of them being unemployed. The group with the highest labor force participation rate are those with the educational attainment of bachelor's degree or higher, with 94.9% or 74 individuals in the labor force. Within the labor force, individuals with bachelor's degree or higher education have the highest percentage of unemployment, with 2.7% or 2 of them being unemployed.
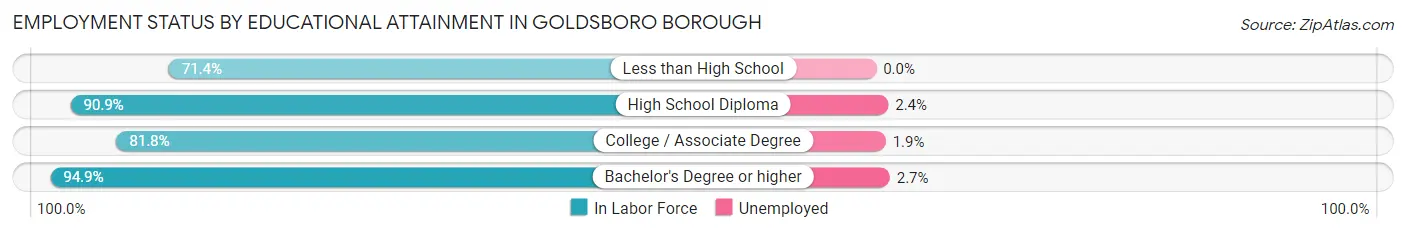
| Educational Attainment | In Labor Force | Unemployed |
| Less than High School | 5 (71.4%) | 0 (0.0%) |
| High School Diploma | 169 (90.9%) | 4 (2.4%) |
| College / Associate Degree | 108 (81.8%) | 3 (1.9%) |
| Bachelor's Degree or higher | 74 (94.9%) | 2 (2.7%) |
| Total | 356 (88.3%) | 9 (2.2%) |
Employment Occupations by Sex in Goldsboro borough
Management, Business, Science and Arts Occupations
The most common Management, Business, Science and Arts occupations in Goldsboro borough are Community & Social Service (35 | 8.7%), Management (31 | 7.7%), Computers, Engineering & Science (23 | 5.7%), Health Diagnosing & Treating (16 | 4.0%), and Business & Financial (14 | 3.5%).
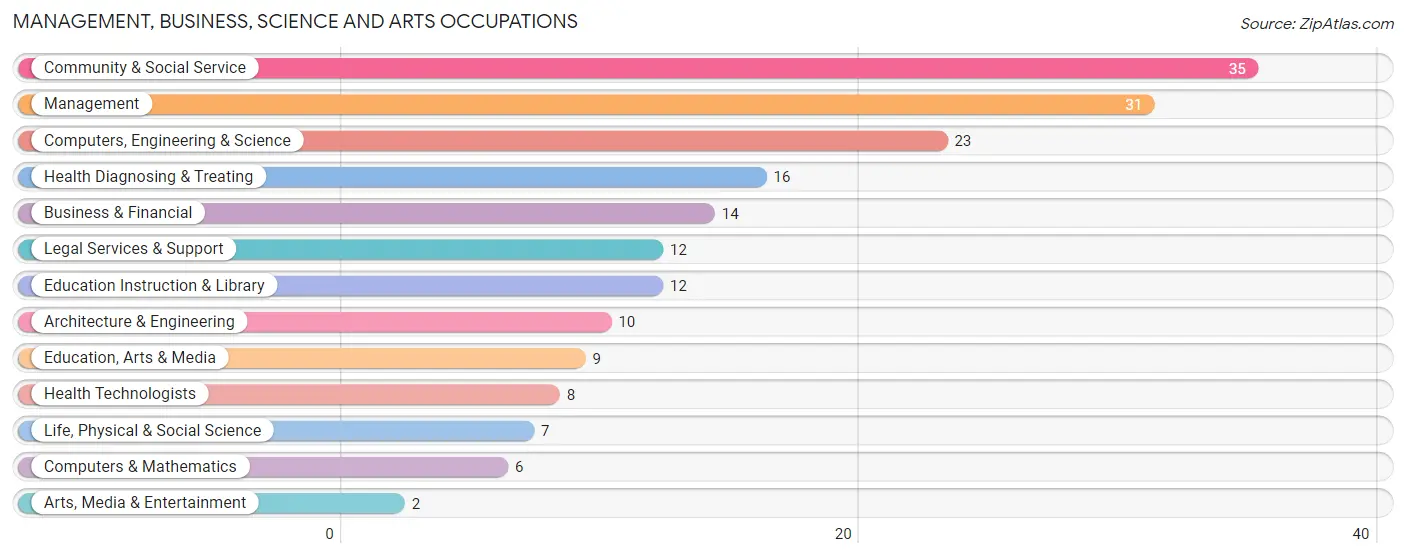
Management, Business, Science and Arts Occupations by Sex
Within the Management, Business, Science and Arts occupations in Goldsboro borough, the most male-oriented occupations are Arts, Media & Entertainment (100.0%), Architecture & Engineering (60.0%), and Business & Financial (42.9%), while the most female-oriented occupations are Life, Physical & Social Science (100.0%), Education, Arts & Media (100.0%), and Legal Services & Support (100.0%).
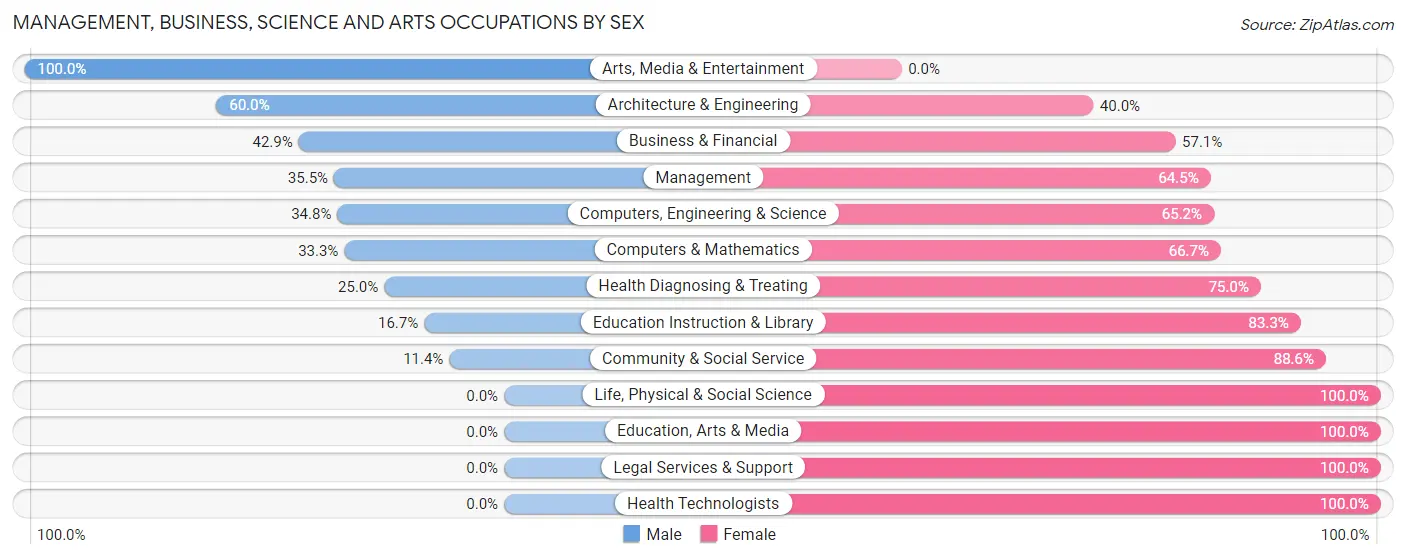
| Occupation | Male | Female |
| Management | 11 (35.5%) | 20 (64.5%) |
| Business & Financial | 6 (42.9%) | 8 (57.1%) |
| Computers, Engineering & Science | 8 (34.8%) | 15 (65.2%) |
| Computers & Mathematics | 2 (33.3%) | 4 (66.7%) |
| Architecture & Engineering | 6 (60.0%) | 4 (40.0%) |
| Life, Physical & Social Science | 0 (0.0%) | 7 (100.0%) |
| Community & Social Service | 4 (11.4%) | 31 (88.6%) |
| Education, Arts & Media | 0 (0.0%) | 9 (100.0%) |
| Legal Services & Support | 0 (0.0%) | 12 (100.0%) |
| Education Instruction & Library | 2 (16.7%) | 10 (83.3%) |
| Arts, Media & Entertainment | 2 (100.0%) | 0 (0.0%) |
| Health Diagnosing & Treating | 4 (25.0%) | 12 (75.0%) |
| Health Technologists | 0 (0.0%) | 8 (100.0%) |
| Total (Category) | 33 (27.7%) | 86 (72.3%) |
| Total (Overall) | 208 (51.5%) | 196 (48.5%) |
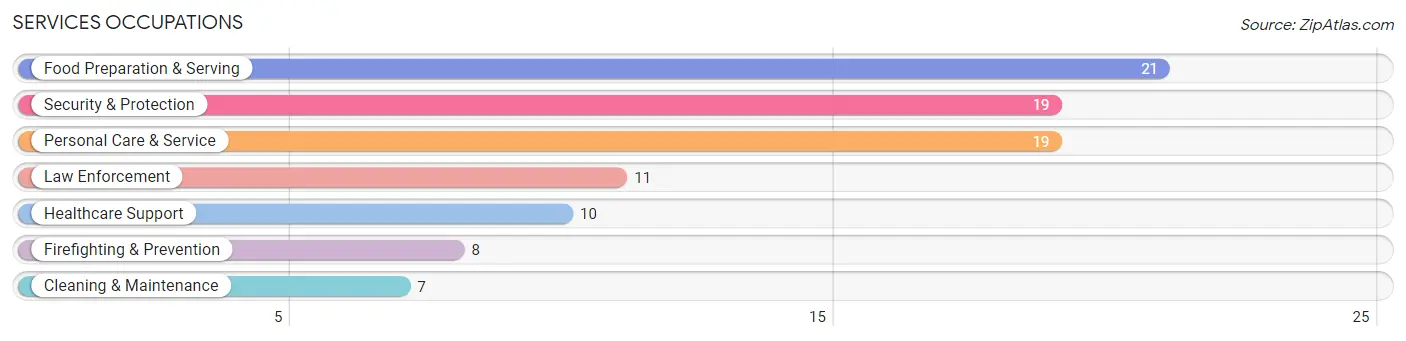
Services Occupations
The most common Services occupations in Goldsboro borough are Food Preparation & Serving (21 | 5.2%), Security & Protection (19 | 4.7%), Personal Care & Service (19 | 4.7%), Law Enforcement (11 | 2.7%), and Healthcare Support (10 | 2.5%).
Services Occupations by Sex
Within the Services occupations in Goldsboro borough, the most male-oriented occupations are Law Enforcement (81.8%), Security & Protection (68.4%), and Cleaning & Maintenance (57.1%), while the most female-oriented occupations are Healthcare Support (100.0%), Personal Care & Service (100.0%), and Food Preparation & Serving (80.9%).
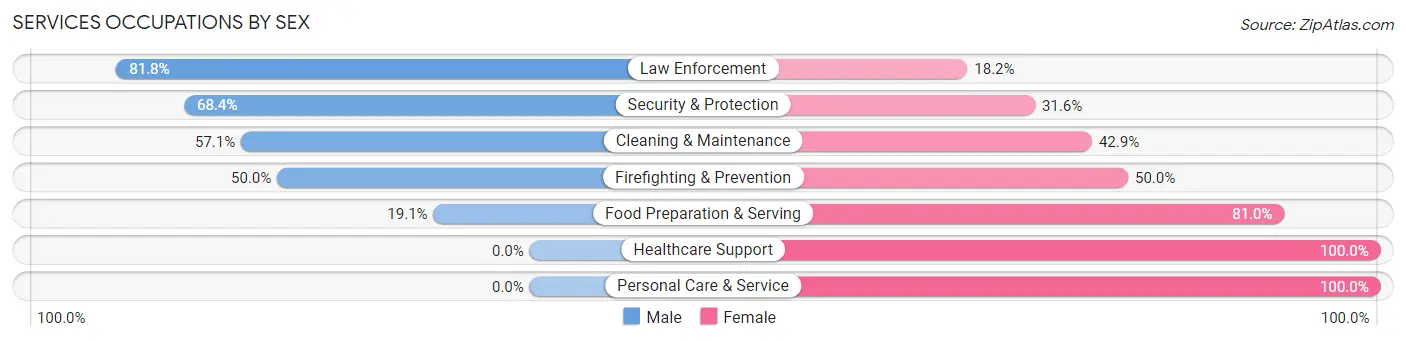
| Occupation | Male | Female |
| Healthcare Support | 0 (0.0%) | 10 (100.0%) |
| Security & Protection | 13 (68.4%) | 6 (31.6%) |
| Firefighting & Prevention | 4 (50.0%) | 4 (50.0%) |
| Law Enforcement | 9 (81.8%) | 2 (18.2%) |
| Food Preparation & Serving | 4 (19.1%) | 17 (80.9%) |
| Cleaning & Maintenance | 4 (57.1%) | 3 (42.9%) |
| Personal Care & Service | 0 (0.0%) | 19 (100.0%) |
| Total (Category) | 21 (27.6%) | 55 (72.4%) |
| Total (Overall) | 208 (51.5%) | 196 (48.5%) |
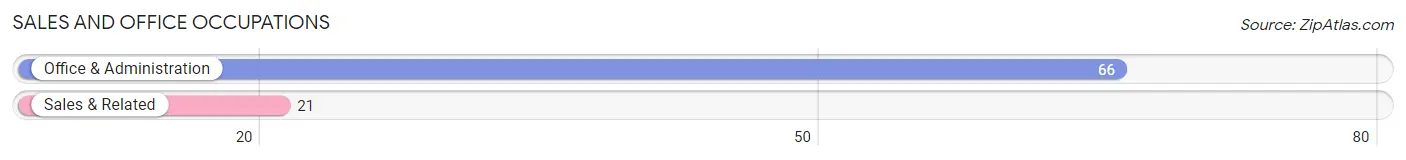
Sales and Office Occupations
The most common Sales and Office occupations in Goldsboro borough are Office & Administration (66 | 16.3%), and Sales & Related (21 | 5.2%).
Sales and Office Occupations by Sex
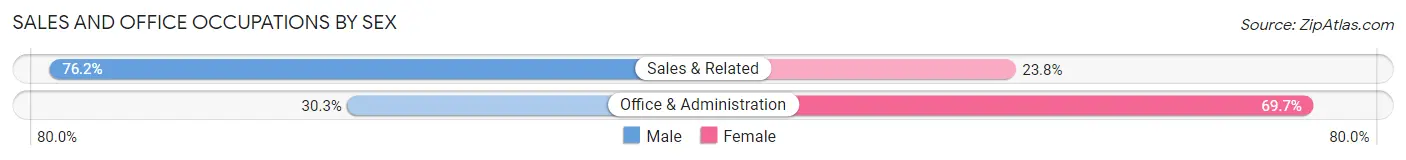
| Occupation | Male | Female |
| Sales & Related | 16 (76.2%) | 5 (23.8%) |
| Office & Administration | 20 (30.3%) | 46 (69.7%) |
| Total (Category) | 36 (41.4%) | 51 (58.6%) |
| Total (Overall) | 208 (51.5%) | 196 (48.5%) |
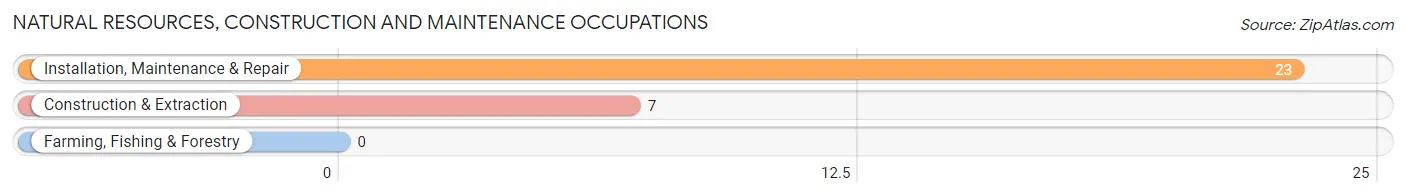
Natural Resources, Construction and Maintenance Occupations
The most common Natural Resources, Construction and Maintenance occupations in Goldsboro borough are Installation, Maintenance & Repair (23 | 5.7%), and Construction & Extraction (7 | 1.7%).
Natural Resources, Construction and Maintenance Occupations by Sex
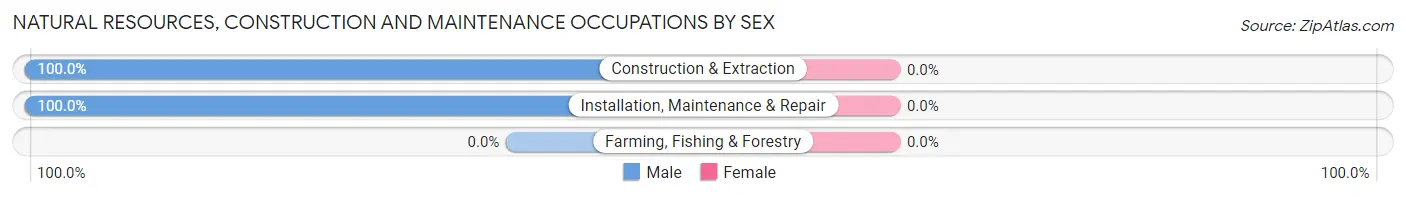
| Occupation | Male | Female |
| Farming, Fishing & Forestry | 0 (0.0%) | 0 (0.0%) |
| Construction & Extraction | 7 (100.0%) | 0 (0.0%) |
| Installation, Maintenance & Repair | 23 (100.0%) | 0 (0.0%) |
| Total (Category) | 30 (100.0%) | 0 (0.0%) |
| Total (Overall) | 208 (51.5%) | 196 (48.5%) |
Production, Transportation and Moving Occupations
The most common Production, Transportation and Moving occupations in Goldsboro borough are Material Moving (66 | 16.3%), Production (18 | 4.5%), and Transportation (8 | 2.0%).
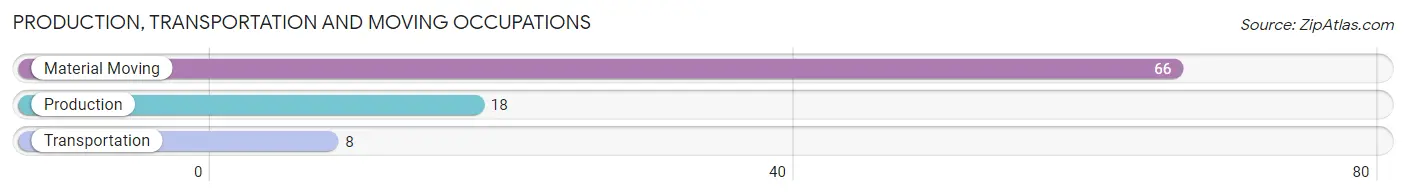
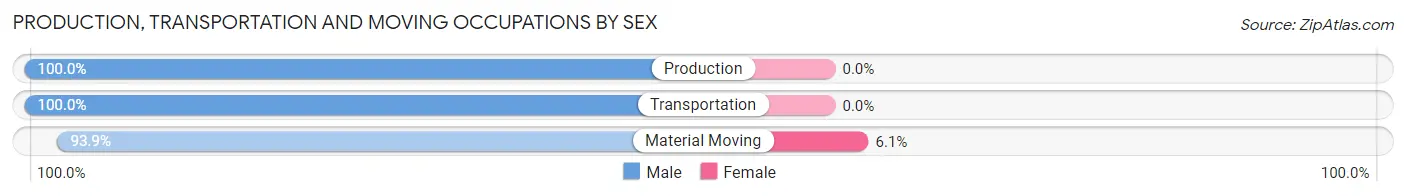
Production, Transportation and Moving Occupations by Sex
| Occupation | Male | Female |
| Production | 18 (100.0%) | 0 (0.0%) |
| Transportation | 8 (100.0%) | 0 (0.0%) |
| Material Moving | 62 (93.9%) | 4 (6.1%) |
| Total (Category) | 88 (95.7%) | 4 (4.3%) |
| Total (Overall) | 208 (51.5%) | 196 (48.5%) |
Employment Industries by Sex in Goldsboro borough
Employment Industries in Goldsboro borough
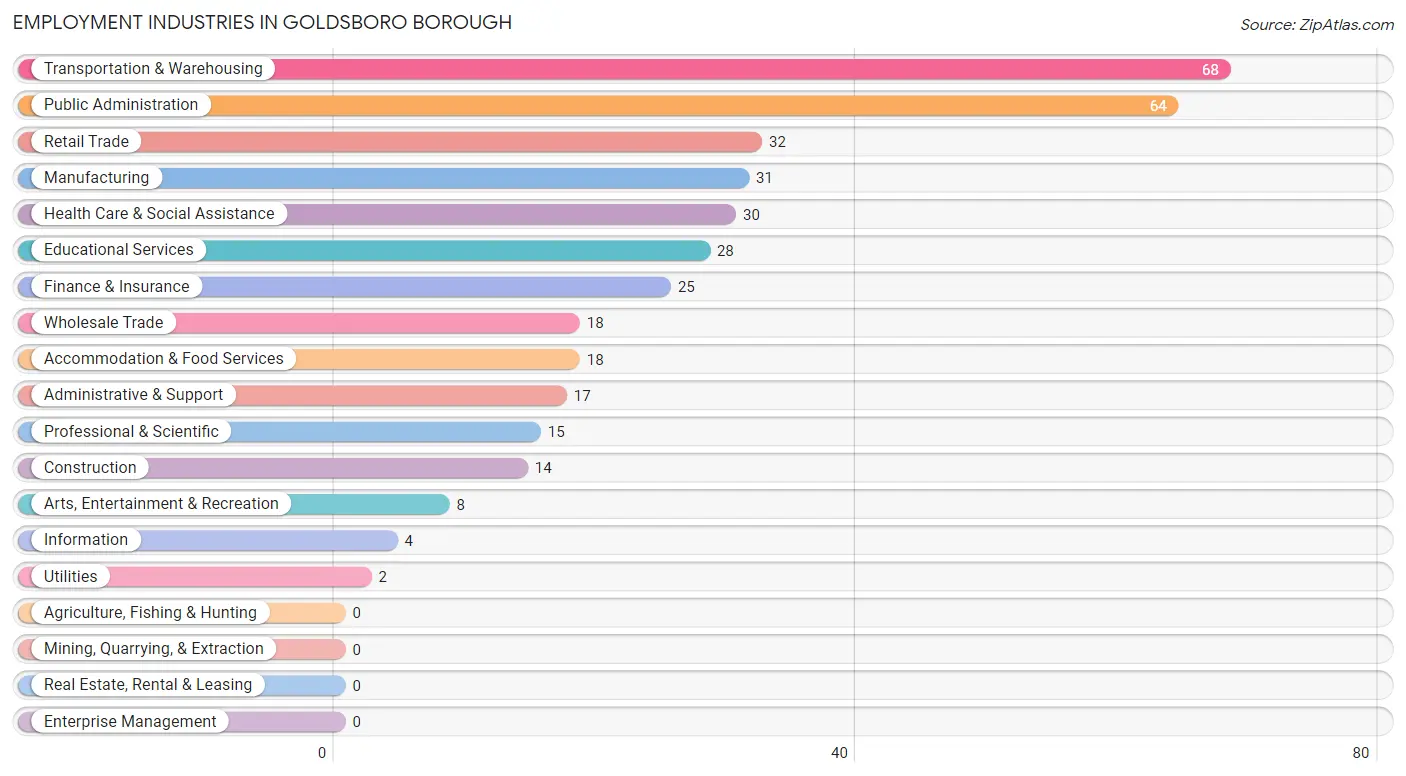
The major employment industries in Goldsboro borough include Transportation & Warehousing (68 | 16.8%), Public Administration (64 | 15.8%), Retail Trade (32 | 7.9%), Manufacturing (31 | 7.7%), and Health Care & Social Assistance (30 | 7.4%).
Employment Industries by Sex in Goldsboro borough
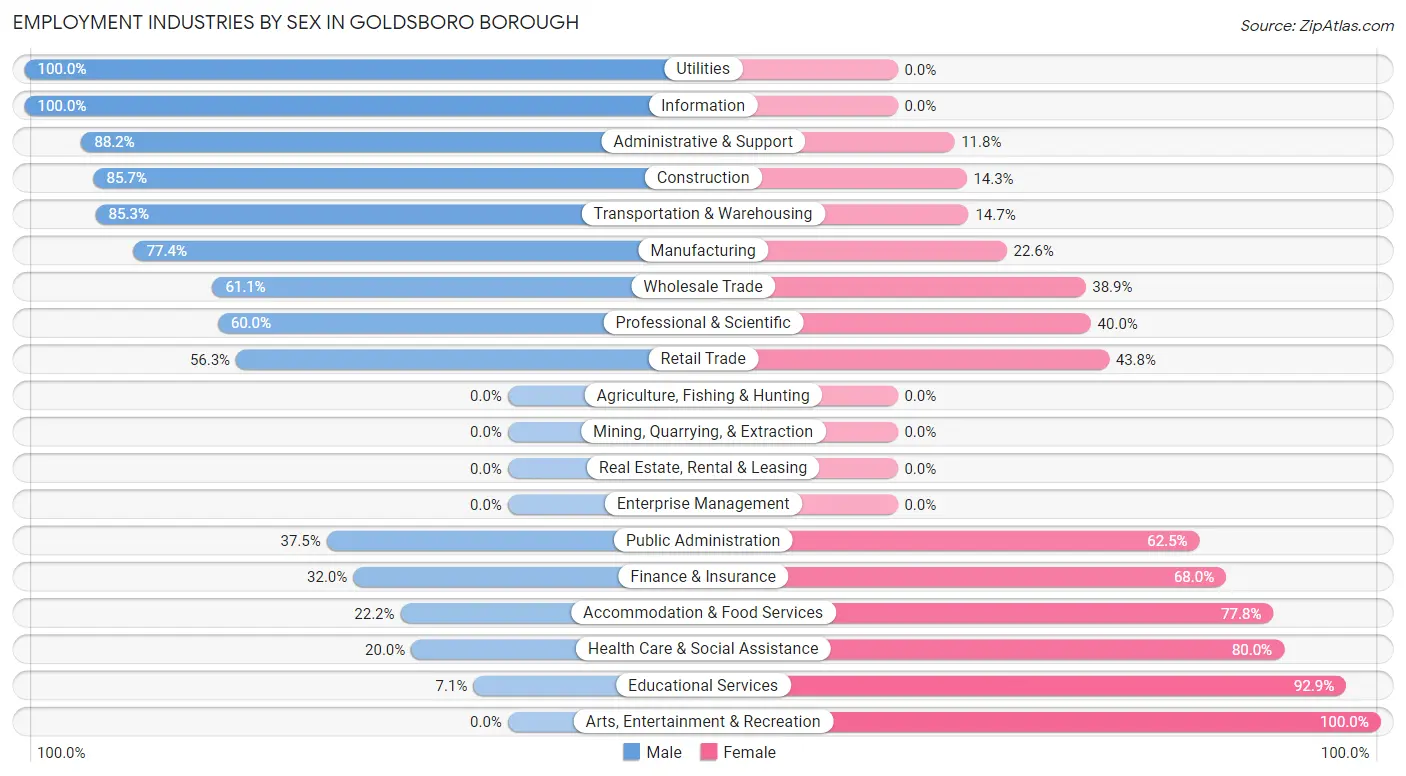
The Goldsboro borough industries that see more men than women are Utilities (100.0%), Information (100.0%), and Administrative & Support (88.2%), whereas the industries that tend to have a higher number of women are Arts, Entertainment & Recreation (100.0%), Educational Services (92.9%), and Health Care & Social Assistance (80.0%).
| Industry | Male | Female |
| Agriculture, Fishing & Hunting | 0 (0.0%) | 0 (0.0%) |
| Mining, Quarrying, & Extraction | 0 (0.0%) | 0 (0.0%) |
| Construction | 12 (85.7%) | 2 (14.3%) |
| Manufacturing | 24 (77.4%) | 7 (22.6%) |
| Wholesale Trade | 11 (61.1%) | 7 (38.9%) |
| Retail Trade | 18 (56.2%) | 14 (43.8%) |
| Transportation & Warehousing | 58 (85.3%) | 10 (14.7%) |
| Utilities | 2 (100.0%) | 0 (0.0%) |
| Information | 4 (100.0%) | 0 (0.0%) |
| Finance & Insurance | 8 (32.0%) | 17 (68.0%) |
| Real Estate, Rental & Leasing | 0 (0.0%) | 0 (0.0%) |
| Professional & Scientific | 9 (60.0%) | 6 (40.0%) |
| Enterprise Management | 0 (0.0%) | 0 (0.0%) |
| Administrative & Support | 15 (88.2%) | 2 (11.8%) |
| Educational Services | 2 (7.1%) | 26 (92.9%) |
| Health Care & Social Assistance | 6 (20.0%) | 24 (80.0%) |
| Arts, Entertainment & Recreation | 0 (0.0%) | 8 (100.0%) |
| Accommodation & Food Services | 4 (22.2%) | 14 (77.8%) |
| Public Administration | 24 (37.5%) | 40 (62.5%) |
| Total | 208 (51.5%) | 196 (48.5%) |
Education in Goldsboro borough
School Enrollment in Goldsboro borough
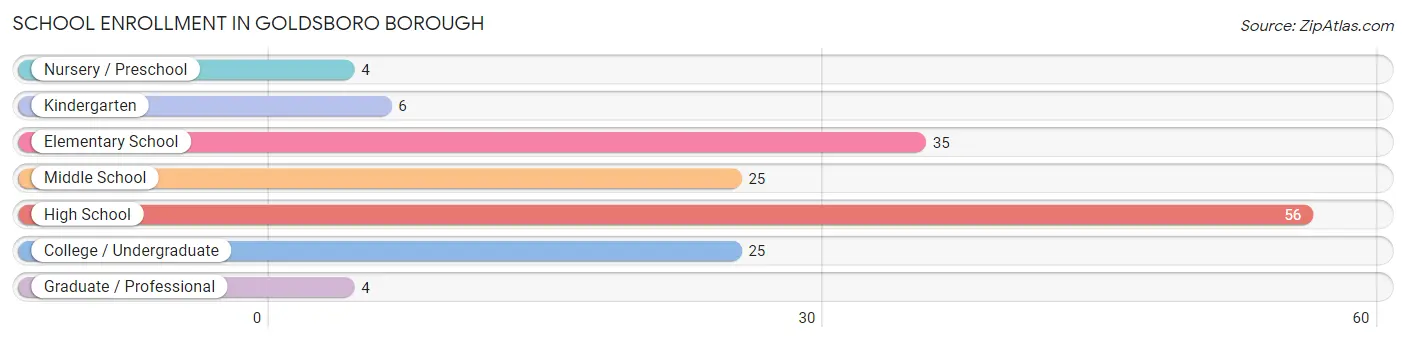
The most common levels of schooling among the 155 students in Goldsboro borough are high school (56 | 36.1%), elementary school (35 | 22.6%), and middle school (25 | 16.1%).
| School Level | # Students | % Students |
| Nursery / Preschool | 4 | 2.6% |
| Kindergarten | 6 | 3.9% |
| Elementary School | 35 | 22.6% |
| Middle School | 25 | 16.1% |
| High School | 56 | 36.1% |
| College / Undergraduate | 25 | 16.1% |
| Graduate / Professional | 4 | 2.6% |
| Total | 155 | 100.0% |
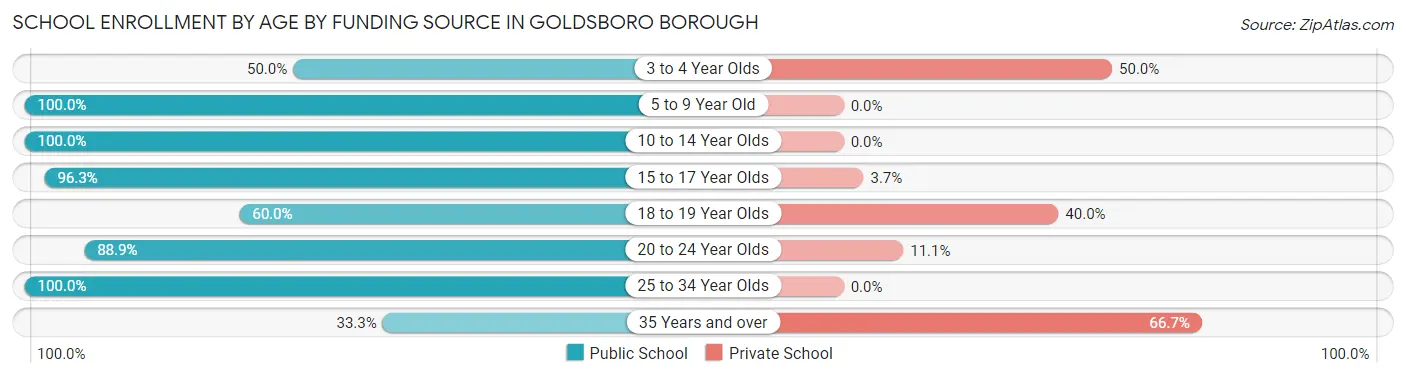
School Enrollment by Age by Funding Source in Goldsboro borough
Out of a total of 155 students who are enrolled in schools in Goldsboro borough, 12 (7.7%) attend a private institution, while the remaining 143 (92.3%) are enrolled in public schools. The age group of 35 years and over has the highest likelihood of being enrolled in private schools, with 4 (66.7% in the age bracket) enrolled. Conversely, the age group of 5 to 9 year old has the lowest likelihood of being enrolled in a private school, with 37 (100.0% in the age bracket) attending a public institution.
| Age Bracket | Public School | Private School |
| 3 to 4 Year Olds | 2 (50.0%) | 2 (50.0%) |
| 5 to 9 Year Old | 37 (100.0%) | 0 (0.0%) |
| 10 to 14 Year Olds | 29 (100.0%) | 0 (0.0%) |
| 15 to 17 Year Olds | 52 (96.3%) | 2 (3.7%) |
| 18 to 19 Year Olds | 3 (60.0%) | 2 (40.0%) |
| 20 to 24 Year Olds | 16 (88.9%) | 2 (11.1%) |
| 25 to 34 Year Olds | 2 (100.0%) | 0 (0.0%) |
| 35 Years and over | 2 (33.3%) | 4 (66.7%) |
| Total | 143 (92.3%) | 12 (7.7%) |
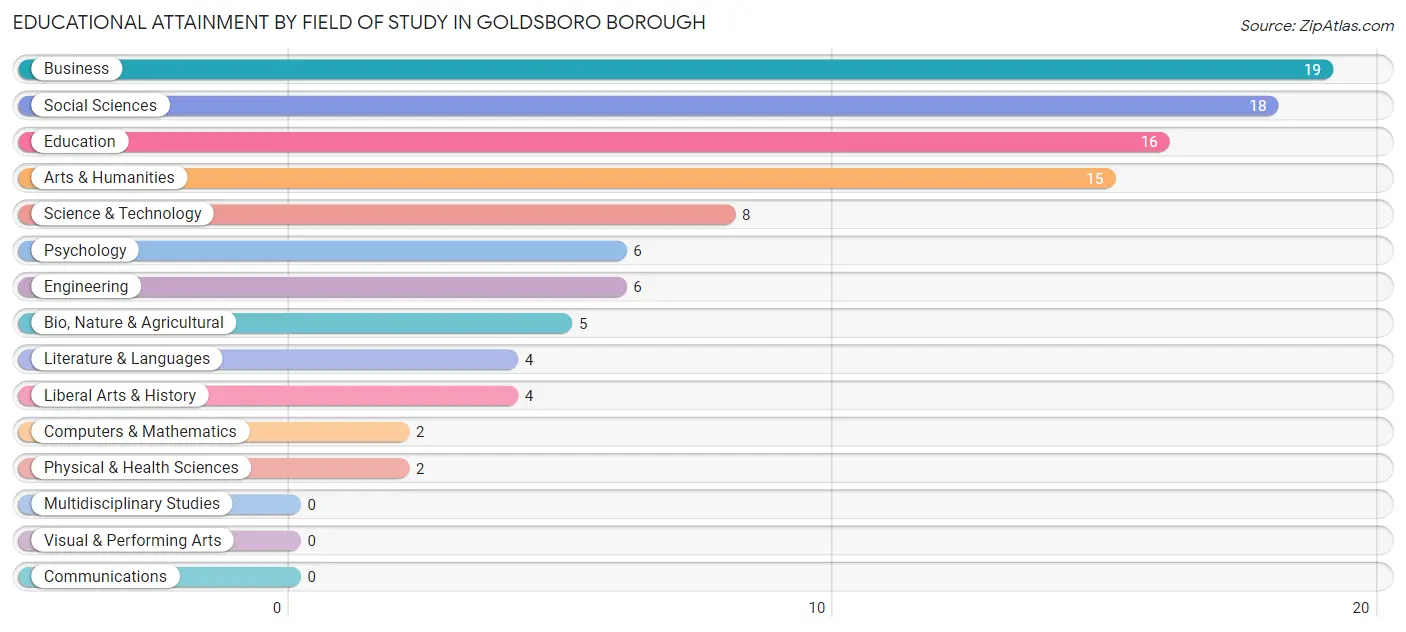
Educational Attainment by Field of Study in Goldsboro borough
Business (19 | 18.1%), social sciences (18 | 17.1%), education (16 | 15.2%), arts & humanities (15 | 14.3%), and science & technology (8 | 7.6%) are the most common fields of study among 105 individuals in Goldsboro borough who have obtained a bachelor's degree or higher.
| Field of Study | # Graduates | % Graduates |
| Computers & Mathematics | 2 | 1.9% |
| Bio, Nature & Agricultural | 5 | 4.8% |
| Physical & Health Sciences | 2 | 1.9% |
| Psychology | 6 | 5.7% |
| Social Sciences | 18 | 17.1% |
| Engineering | 6 | 5.7% |
| Multidisciplinary Studies | 0 | 0.0% |
| Science & Technology | 8 | 7.6% |
| Business | 19 | 18.1% |
| Education | 16 | 15.2% |
| Literature & Languages | 4 | 3.8% |
| Liberal Arts & History | 4 | 3.8% |
| Visual & Performing Arts | 0 | 0.0% |
| Communications | 0 | 0.0% |
| Arts & Humanities | 15 | 14.3% |
| Total | 105 | 100.0% |
Transportation & Commute in Goldsboro borough
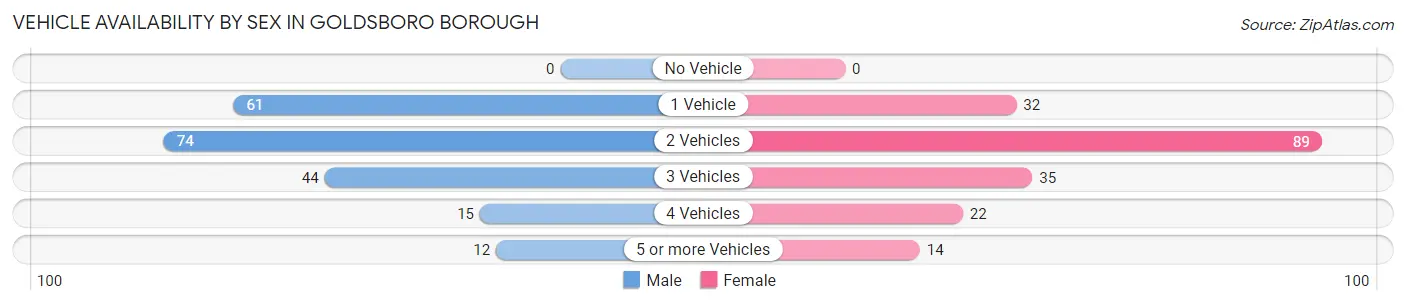
Vehicle Availability by Sex in Goldsboro borough
The most prevalent vehicle ownership categories in Goldsboro borough are males with 2 vehicles (74, accounting for 35.9%) and females with 2 vehicles (89, making up 38.5%).
| Vehicles Available | Male | Female |
| No Vehicle | 0 (0.0%) | 0 (0.0%) |
| 1 Vehicle | 61 (29.6%) | 32 (16.7%) |
| 2 Vehicles | 74 (35.9%) | 89 (46.4%) |
| 3 Vehicles | 44 (21.4%) | 35 (18.2%) |
| 4 Vehicles | 15 (7.3%) | 22 (11.5%) |
| 5 or more Vehicles | 12 (5.8%) | 14 (7.3%) |
| Total | 206 (100.0%) | 192 (100.0%) |
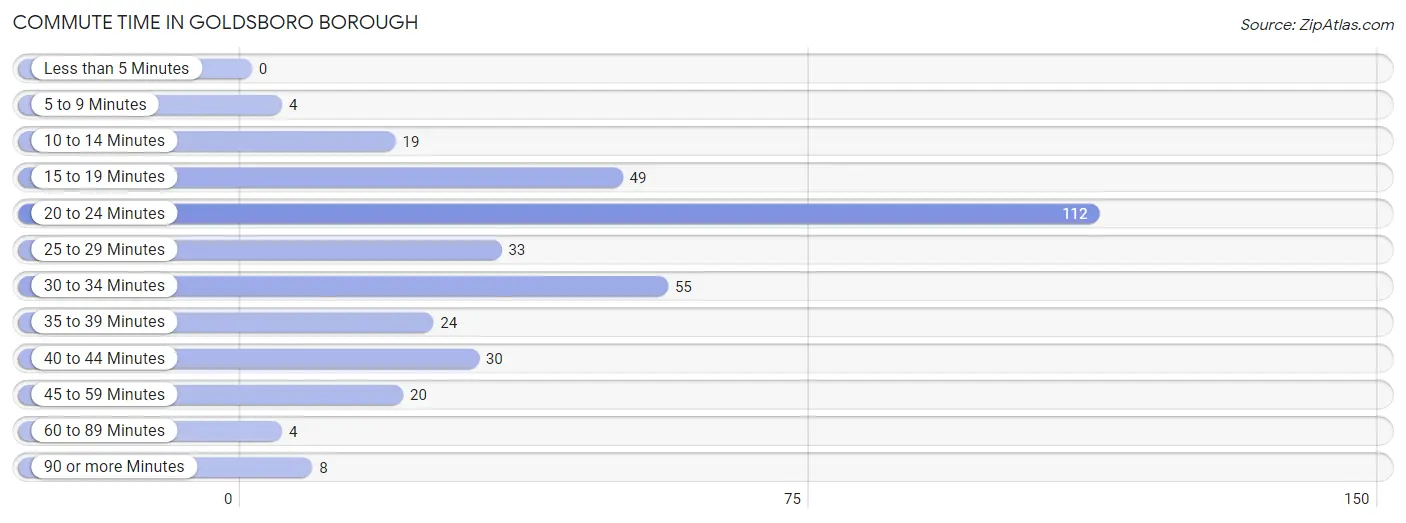
Commute Time in Goldsboro borough
The most frequently occuring commute durations in Goldsboro borough are 20 to 24 minutes (112 commuters, 31.3%), 30 to 34 minutes (55 commuters, 15.4%), and 15 to 19 minutes (49 commuters, 13.7%).
| Commute Time | # Commuters | % Commuters |
| Less than 5 Minutes | 0 | 0.0% |
| 5 to 9 Minutes | 4 | 1.1% |
| 10 to 14 Minutes | 19 | 5.3% |
| 15 to 19 Minutes | 49 | 13.7% |
| 20 to 24 Minutes | 112 | 31.3% |
| 25 to 29 Minutes | 33 | 9.2% |
| 30 to 34 Minutes | 55 | 15.4% |
| 35 to 39 Minutes | 24 | 6.7% |
| 40 to 44 Minutes | 30 | 8.4% |
| 45 to 59 Minutes | 20 | 5.6% |
| 60 to 89 Minutes | 4 | 1.1% |
| 90 or more Minutes | 8 | 2.2% |
Commute Time by Sex in Goldsboro borough
The most common commute times in Goldsboro borough are 20 to 24 minutes (79 commuters, 41.1%) for males and 20 to 24 minutes (33 commuters, 19.9%) for females.
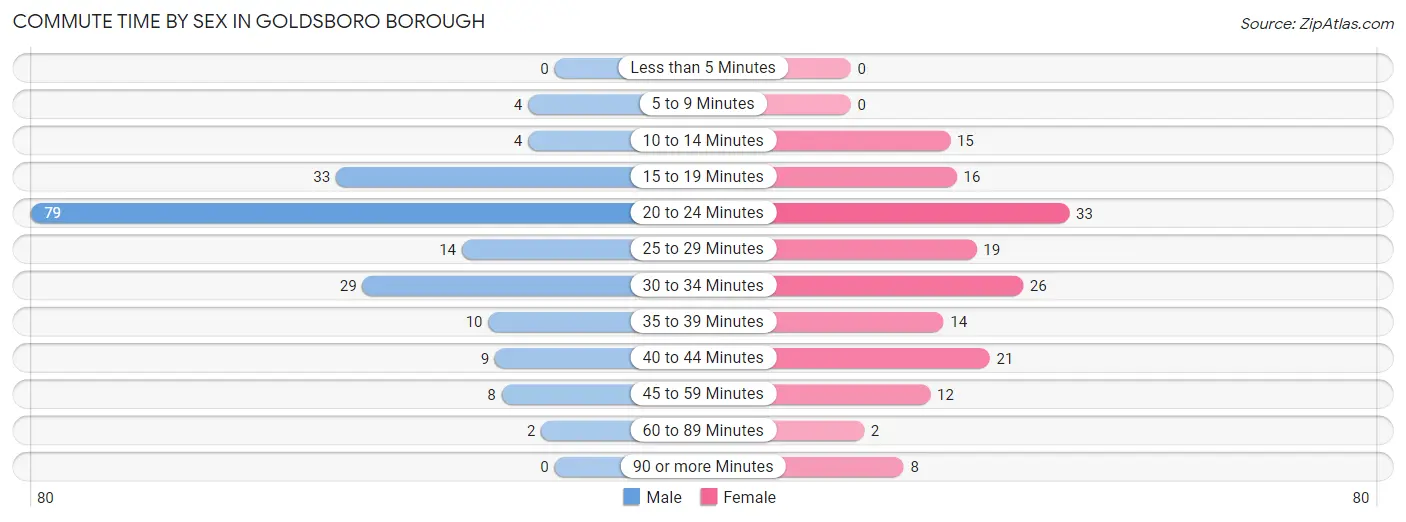
| Commute Time | Male | Female |
| Less than 5 Minutes | 0 (0.0%) | 0 (0.0%) |
| 5 to 9 Minutes | 4 (2.1%) | 0 (0.0%) |
| 10 to 14 Minutes | 4 (2.1%) | 15 (9.0%) |
| 15 to 19 Minutes | 33 (17.2%) | 16 (9.6%) |
| 20 to 24 Minutes | 79 (41.1%) | 33 (19.9%) |
| 25 to 29 Minutes | 14 (7.3%) | 19 (11.5%) |
| 30 to 34 Minutes | 29 (15.1%) | 26 (15.7%) |
| 35 to 39 Minutes | 10 (5.2%) | 14 (8.4%) |
| 40 to 44 Minutes | 9 (4.7%) | 21 (12.7%) |
| 45 to 59 Minutes | 8 (4.2%) | 12 (7.2%) |
| 60 to 89 Minutes | 2 (1.0%) | 2 (1.2%) |
| 90 or more Minutes | 0 (0.0%) | 8 (4.8%) |
Time of Departure to Work by Sex in Goldsboro borough
The most frequent times of departure to work in Goldsboro borough are 4:00 PM to 11:59 PM (69, 35.9%) for males and 7:00 AM to 7:29 AM (29, 17.5%) for females.
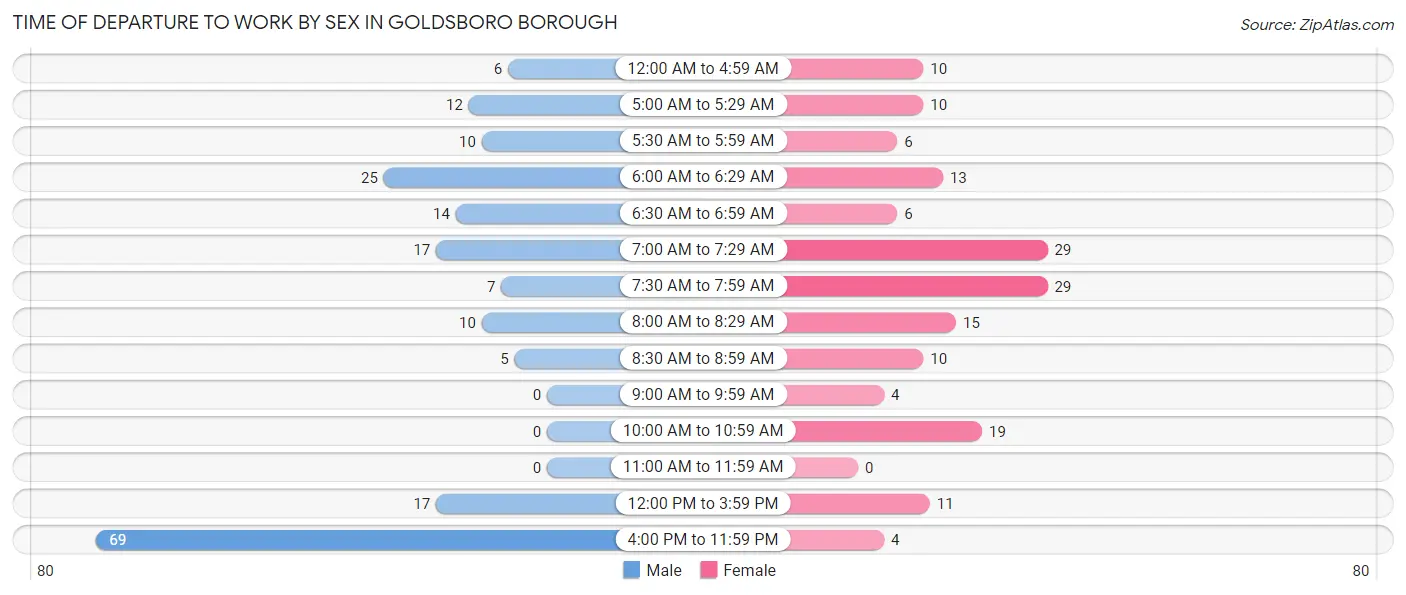
| Time of Departure | Male | Female |
| 12:00 AM to 4:59 AM | 6 (3.1%) | 10 (6.0%) |
| 5:00 AM to 5:29 AM | 12 (6.2%) | 10 (6.0%) |
| 5:30 AM to 5:59 AM | 10 (5.2%) | 6 (3.6%) |
| 6:00 AM to 6:29 AM | 25 (13.0%) | 13 (7.8%) |
| 6:30 AM to 6:59 AM | 14 (7.3%) | 6 (3.6%) |
| 7:00 AM to 7:29 AM | 17 (8.8%) | 29 (17.5%) |
| 7:30 AM to 7:59 AM | 7 (3.6%) | 29 (17.5%) |
| 8:00 AM to 8:29 AM | 10 (5.2%) | 15 (9.0%) |
| 8:30 AM to 8:59 AM | 5 (2.6%) | 10 (6.0%) |
| 9:00 AM to 9:59 AM | 0 (0.0%) | 4 (2.4%) |
| 10:00 AM to 10:59 AM | 0 (0.0%) | 19 (11.5%) |
| 11:00 AM to 11:59 AM | 0 (0.0%) | 0 (0.0%) |
| 12:00 PM to 3:59 PM | 17 (8.8%) | 11 (6.6%) |
| 4:00 PM to 11:59 PM | 69 (35.9%) | 4 (2.4%) |
| Total | 192 (100.0%) | 166 (100.0%) |
Housing Occupancy in Goldsboro borough
Occupancy by Ownership in Goldsboro borough
Of the total 302 dwellings in Goldsboro borough, owner-occupied units account for 271 (89.7%), while renter-occupied units make up 31 (10.3%).
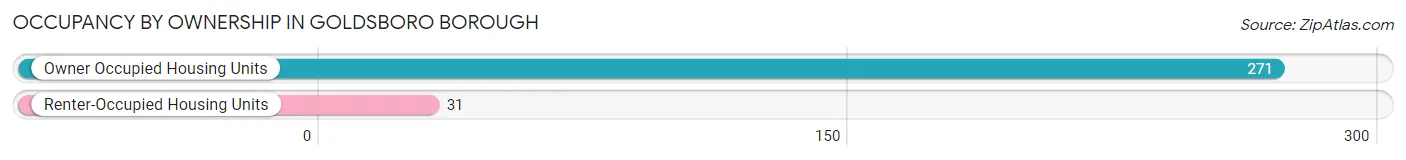
| Occupancy | # Housing Units | % Housing Units |
| Owner Occupied Housing Units | 271 | 89.7% |
| Renter-Occupied Housing Units | 31 | 10.3% |
| Total Occupied Housing Units | 302 | 100.0% |
Occupancy by Household Size in Goldsboro borough
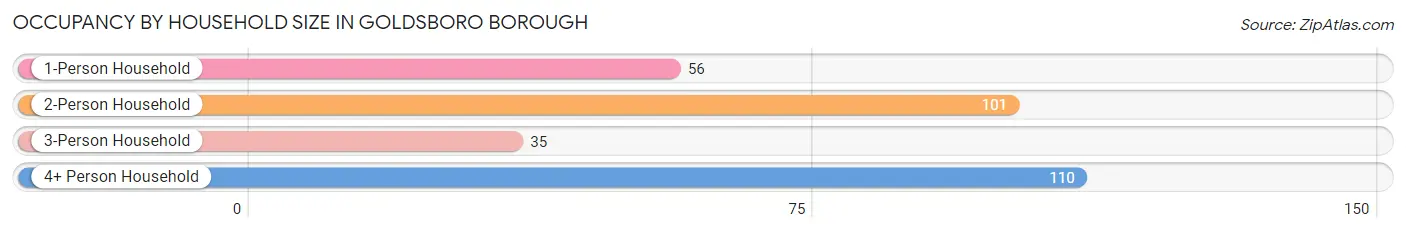
| Household Size | # Housing Units | % Housing Units |
| 1-Person Household | 56 | 18.5% |
| 2-Person Household | 101 | 33.4% |
| 3-Person Household | 35 | 11.6% |
| 4+ Person Household | 110 | 36.4% |
| Total Housing Units | 302 | 100.0% |
Occupancy by Ownership by Household Size in Goldsboro borough
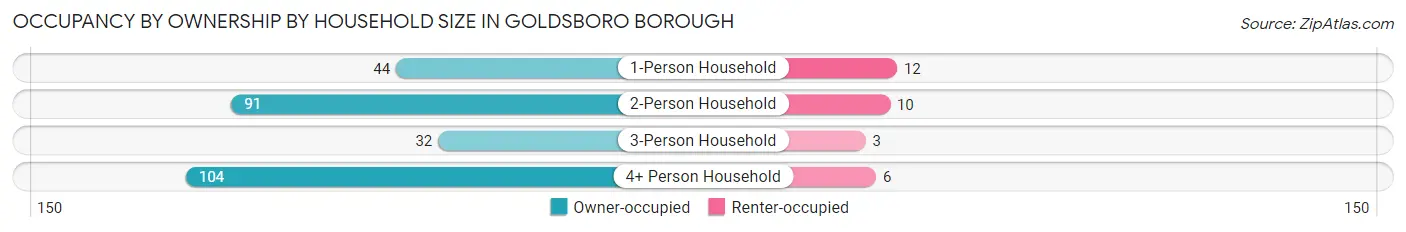
| Household Size | Owner-occupied | Renter-occupied |
| 1-Person Household | 44 (78.6%) | 12 (21.4%) |
| 2-Person Household | 91 (90.1%) | 10 (9.9%) |
| 3-Person Household | 32 (91.4%) | 3 (8.6%) |
| 4+ Person Household | 104 (94.6%) | 6 (5.4%) |
| Total Housing Units | 271 (89.7%) | 31 (10.3%) |
Occupancy by Educational Attainment in Goldsboro borough
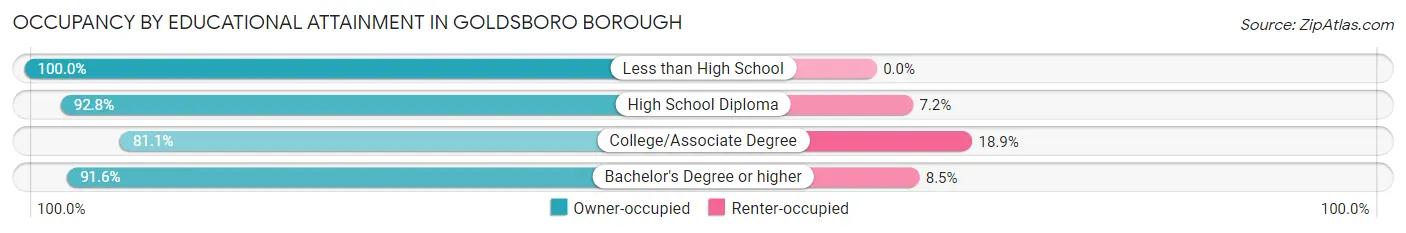
| Household Size | Owner-occupied | Renter-occupied |
| Less than High School | 4 (100.0%) | 0 (0.0%) |
| High School Diploma | 142 (92.8%) | 11 (7.2%) |
| College/Associate Degree | 60 (81.1%) | 14 (18.9%) |
| Bachelor's Degree or higher | 65 (91.5%) | 6 (8.5%) |
Occupancy by Age of Householder in Goldsboro borough
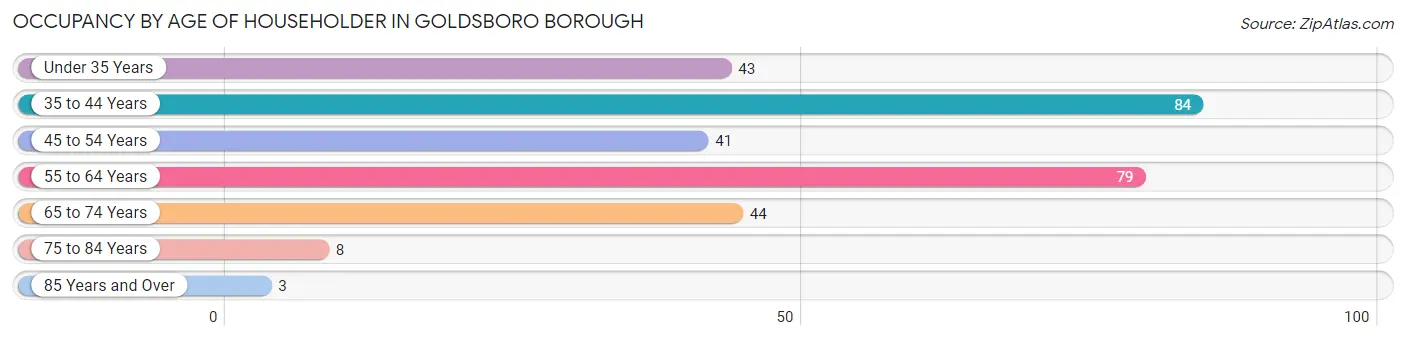
| Age Bracket | # Households | % Households |
| Under 35 Years | 43 | 14.2% |
| 35 to 44 Years | 84 | 27.8% |
| 45 to 54 Years | 41 | 13.6% |
| 55 to 64 Years | 79 | 26.2% |
| 65 to 74 Years | 44 | 14.6% |
| 75 to 84 Years | 8 | 2.6% |
| 85 Years and Over | 3 | 1.0% |
| Total | 302 | 100.0% |
Housing Finances in Goldsboro borough
Median Income by Occupancy in Goldsboro borough
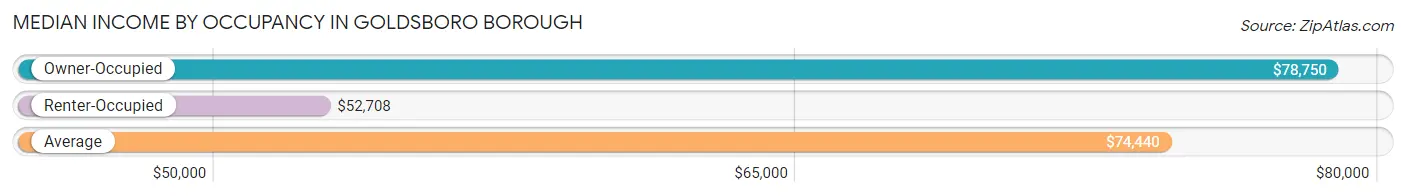
| Occupancy Type | # Households | Median Income |
| Owner-Occupied | 271 (89.7%) | $78,750 |
| Renter-Occupied | 31 (10.3%) | $52,708 |
| Average | 302 (100.0%) | $74,440 |
Occupancy by Householder Income Bracket in Goldsboro borough
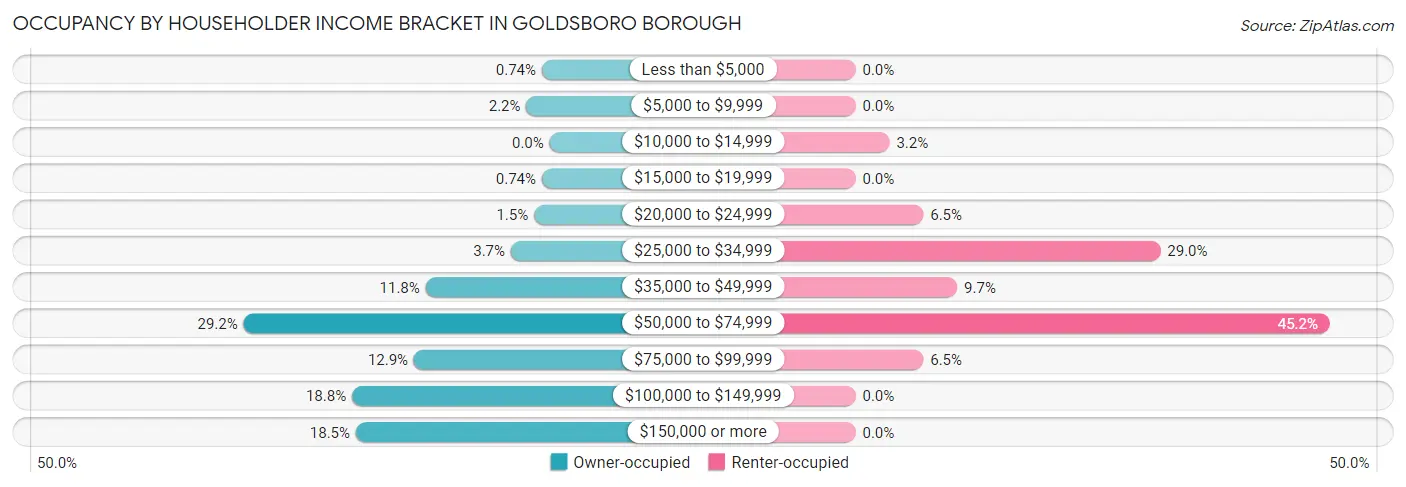
| Income Bracket | Owner-occupied | Renter-occupied |
| Less than $5,000 | 2 (0.7%) | 0 (0.0%) |
| $5,000 to $9,999 | 6 (2.2%) | 0 (0.0%) |
| $10,000 to $14,999 | 0 (0.0%) | 1 (3.2%) |
| $15,000 to $19,999 | 2 (0.7%) | 0 (0.0%) |
| $20,000 to $24,999 | 4 (1.5%) | 2 (6.5%) |
| $25,000 to $34,999 | 10 (3.7%) | 9 (29.0%) |
| $35,000 to $49,999 | 32 (11.8%) | 3 (9.7%) |
| $50,000 to $74,999 | 79 (29.1%) | 14 (45.2%) |
| $75,000 to $99,999 | 35 (12.9%) | 2 (6.5%) |
| $100,000 to $149,999 | 51 (18.8%) | 0 (0.0%) |
| $150,000 or more | 50 (18.4%) | 0 (0.0%) |
| Total | 271 (100.0%) | 31 (100.0%) |
Monthly Housing Cost Tiers in Goldsboro borough
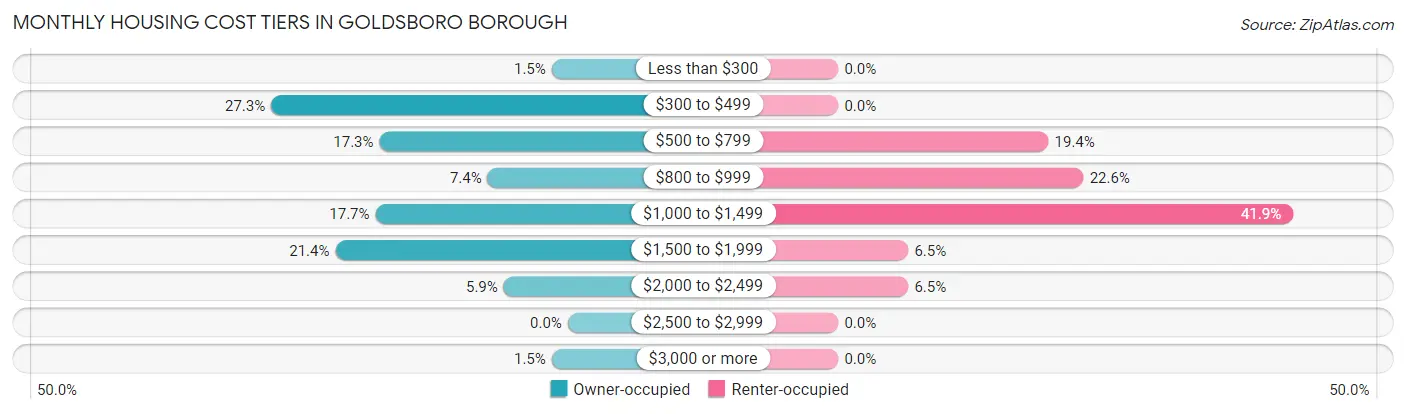
| Monthly Cost | Owner-occupied | Renter-occupied |
| Less than $300 | 4 (1.5%) | 0 (0.0%) |
| $300 to $499 | 74 (27.3%) | 0 (0.0%) |
| $500 to $799 | 47 (17.3%) | 6 (19.4%) |
| $800 to $999 | 20 (7.4%) | 7 (22.6%) |
| $1,000 to $1,499 | 48 (17.7%) | 13 (41.9%) |
| $1,500 to $1,999 | 58 (21.4%) | 2 (6.5%) |
| $2,000 to $2,499 | 16 (5.9%) | 2 (6.5%) |
| $2,500 to $2,999 | 0 (0.0%) | 0 (0.0%) |
| $3,000 or more | 4 (1.5%) | 0 (0.0%) |
| Total | 271 (100.0%) | 31 (100.0%) |
Physical Housing Characteristics in Goldsboro borough
Housing Structures in Goldsboro borough
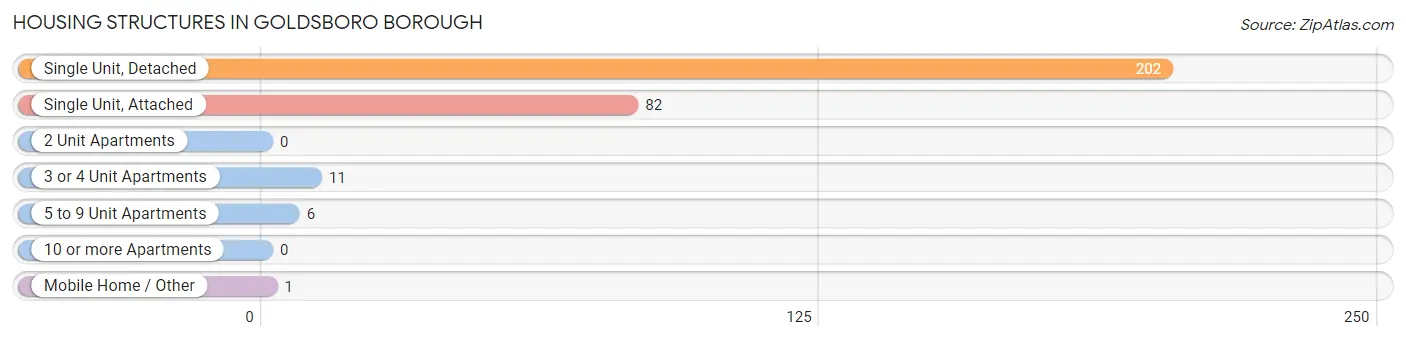
| Structure Type | # Housing Units | % Housing Units |
| Single Unit, Detached | 202 | 66.9% |
| Single Unit, Attached | 82 | 27.2% |
| 2 Unit Apartments | 0 | 0.0% |
| 3 or 4 Unit Apartments | 11 | 3.6% |
| 5 to 9 Unit Apartments | 6 | 2.0% |
| 10 or more Apartments | 0 | 0.0% |
| Mobile Home / Other | 1 | 0.3% |
| Total | 302 | 100.0% |
Housing Structures by Occupancy in Goldsboro borough
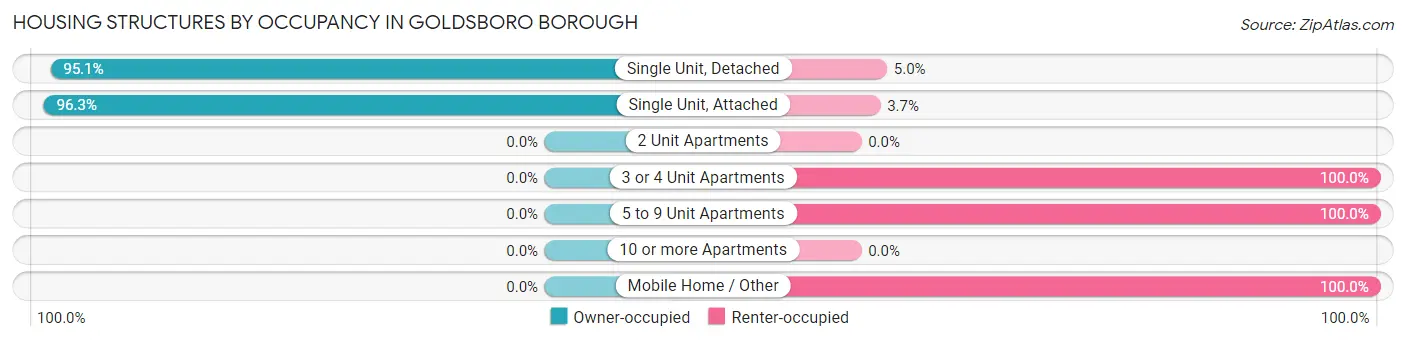
| Structure Type | Owner-occupied | Renter-occupied |
| Single Unit, Detached | 192 (95.1%) | 10 (5.0%) |
| Single Unit, Attached | 79 (96.3%) | 3 (3.7%) |
| 2 Unit Apartments | 0 (0.0%) | 0 (0.0%) |
| 3 or 4 Unit Apartments | 0 (0.0%) | 11 (100.0%) |
| 5 to 9 Unit Apartments | 0 (0.0%) | 6 (100.0%) |
| 10 or more Apartments | 0 (0.0%) | 0 (0.0%) |
| Mobile Home / Other | 0 (0.0%) | 1 (100.0%) |
| Total | 271 (89.7%) | 31 (10.3%) |
Housing Structures by Number of Rooms in Goldsboro borough
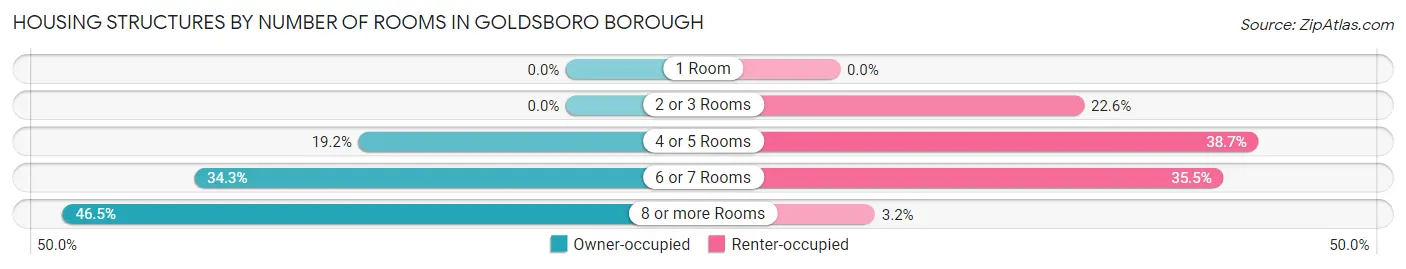
| Number of Rooms | Owner-occupied | Renter-occupied |
| 1 Room | 0 (0.0%) | 0 (0.0%) |
| 2 or 3 Rooms | 0 (0.0%) | 7 (22.6%) |
| 4 or 5 Rooms | 52 (19.2%) | 12 (38.7%) |
| 6 or 7 Rooms | 93 (34.3%) | 11 (35.5%) |
| 8 or more Rooms | 126 (46.5%) | 1 (3.2%) |
| Total | 271 (100.0%) | 31 (100.0%) |
Housing Structure by Heating Type in Goldsboro borough
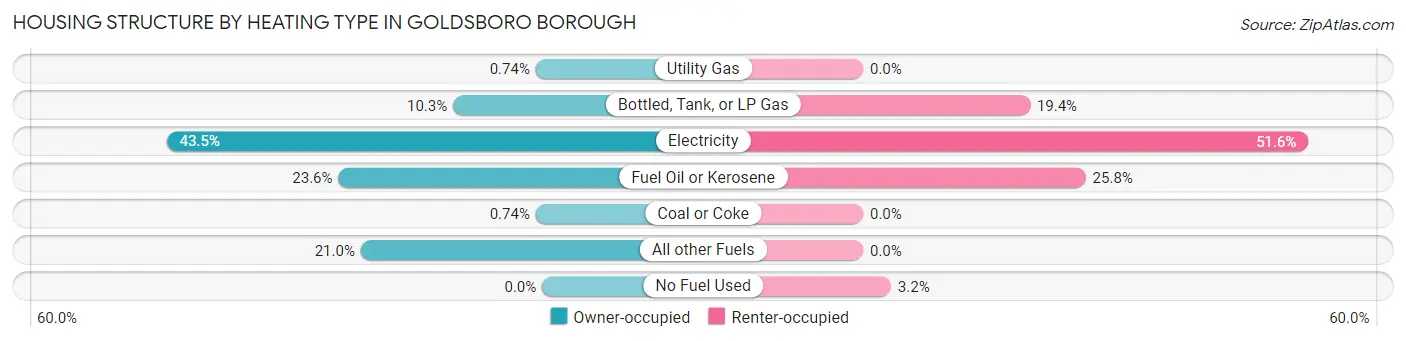
| Heating Type | Owner-occupied | Renter-occupied |
| Utility Gas | 2 (0.7%) | 0 (0.0%) |
| Bottled, Tank, or LP Gas | 28 (10.3%) | 6 (19.4%) |
| Electricity | 118 (43.5%) | 16 (51.6%) |
| Fuel Oil or Kerosene | 64 (23.6%) | 8 (25.8%) |
| Coal or Coke | 2 (0.7%) | 0 (0.0%) |
| All other Fuels | 57 (21.0%) | 0 (0.0%) |
| No Fuel Used | 0 (0.0%) | 1 (3.2%) |
| Total | 271 (100.0%) | 31 (100.0%) |
Household Vehicle Usage in Goldsboro borough
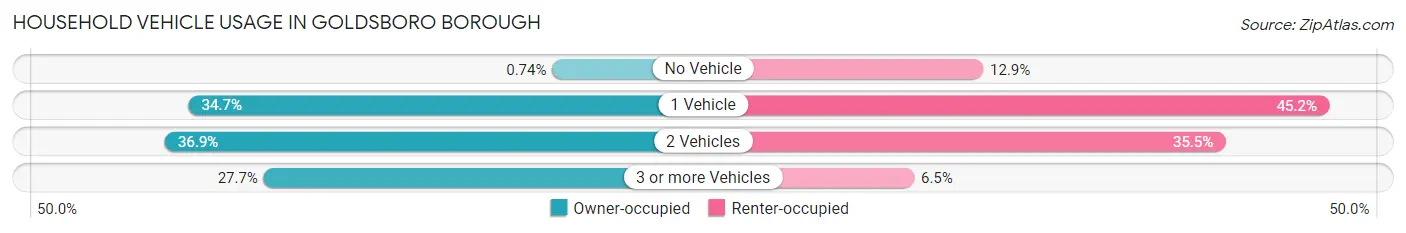
| Vehicles per Household | Owner-occupied | Renter-occupied |
| No Vehicle | 2 (0.7%) | 4 (12.9%) |
| 1 Vehicle | 94 (34.7%) | 14 (45.2%) |
| 2 Vehicles | 100 (36.9%) | 11 (35.5%) |
| 3 or more Vehicles | 75 (27.7%) | 2 (6.5%) |
| Total | 271 (100.0%) | 31 (100.0%) |
Real Estate & Mortgages in Goldsboro borough
Real Estate and Mortgage Overview in Goldsboro borough
| Characteristic | Without Mortgage | With Mortgage |
| Housing Units | 119 | 152 |
| Median Property Value | - | - |
| Median Household Income | $73,373 | $37 |
| Monthly Housing Costs | $476 | $4 |
| Real Estate Taxes | $1,871 | $0 |
Property Value by Mortgage Status in Goldsboro borough
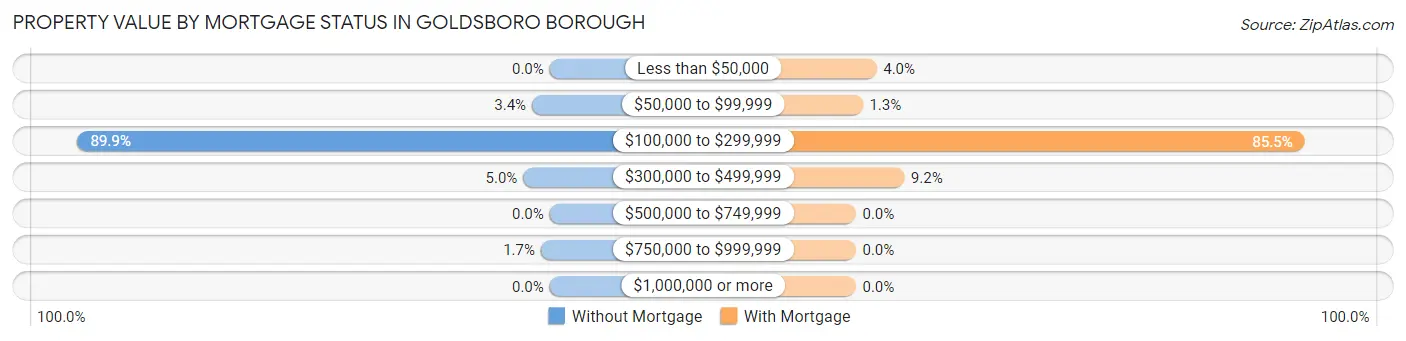
| Property Value | Without Mortgage | With Mortgage |
| Less than $50,000 | 0 (0.0%) | 6 (4.0%) |
| $50,000 to $99,999 | 4 (3.4%) | 2 (1.3%) |
| $100,000 to $299,999 | 107 (89.9%) | 130 (85.5%) |
| $300,000 to $499,999 | 6 (5.0%) | 14 (9.2%) |
| $500,000 to $749,999 | 0 (0.0%) | 0 (0.0%) |
| $750,000 to $999,999 | 2 (1.7%) | 0 (0.0%) |
| $1,000,000 or more | 0 (0.0%) | 0 (0.0%) |
| Total | 119 (100.0%) | 152 (100.0%) |
Household Income by Mortgage Status in Goldsboro borough
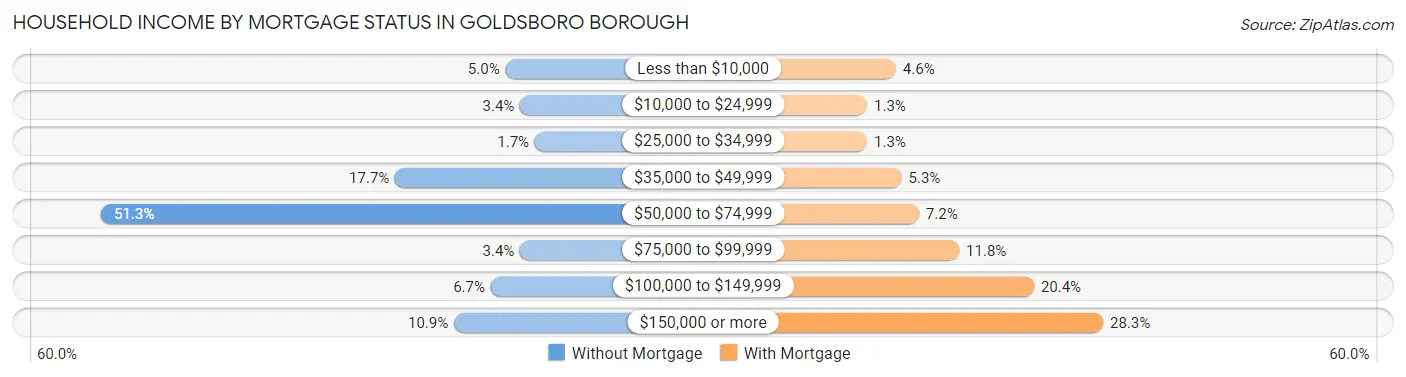
| Household Income | Without Mortgage | With Mortgage |
| Less than $10,000 | 6 (5.0%) | 7 (4.6%) |
| $10,000 to $24,999 | 4 (3.4%) | 2 (1.3%) |
| $25,000 to $34,999 | 2 (1.7%) | 2 (1.3%) |
| $35,000 to $49,999 | 21 (17.6%) | 8 (5.3%) |
| $50,000 to $74,999 | 61 (51.3%) | 11 (7.2%) |
| $75,000 to $99,999 | 4 (3.4%) | 18 (11.8%) |
| $100,000 to $149,999 | 8 (6.7%) | 31 (20.4%) |
| $150,000 or more | 13 (10.9%) | 43 (28.3%) |
| Total | 119 (100.0%) | 152 (100.0%) |
Property Value to Household Income Ratio in Goldsboro borough
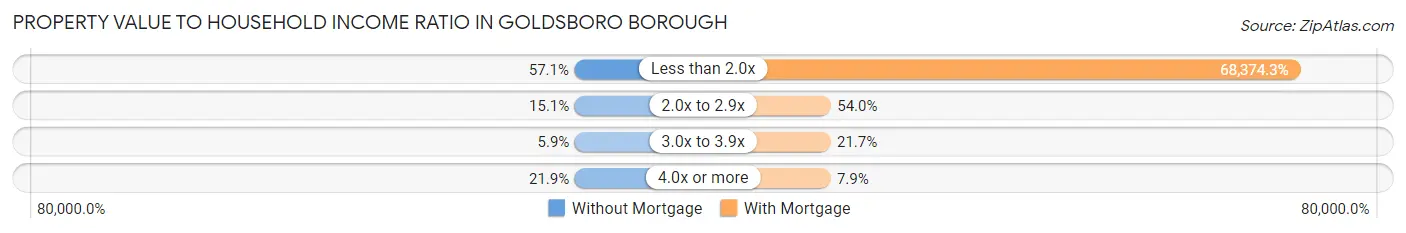
| Value-to-Income Ratio | Without Mortgage | With Mortgage |
| Less than 2.0x | 68 (57.1%) | 103,929 (68,374.3%) |
| 2.0x to 2.9x | 18 (15.1%) | 82 (53.9%) |
| 3.0x to 3.9x | 7 (5.9%) | 33 (21.7%) |
| 4.0x or more | 26 (21.8%) | 12 (7.9%) |
| Total | 119 (100.0%) | 152 (100.0%) |
Real Estate Taxes by Mortgage Status in Goldsboro borough
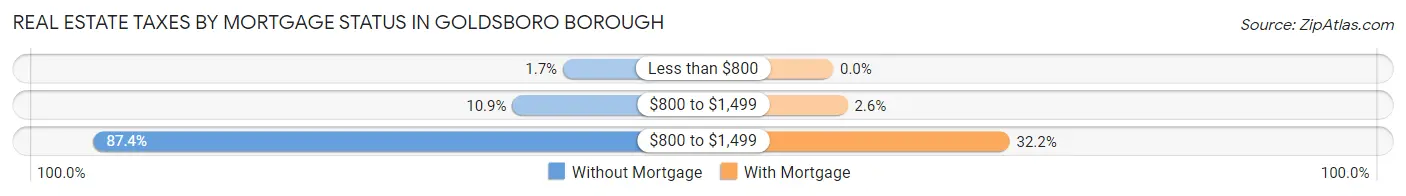
| Property Taxes | Without Mortgage | With Mortgage |
| Less than $800 | 2 (1.7%) | 0 (0.0%) |
| $800 to $1,499 | 13 (10.9%) | 4 (2.6%) |
| $800 to $1,499 | 104 (87.4%) | 49 (32.2%) |
| Total | 119 (100.0%) | 152 (100.0%) |
Health & Disability in Goldsboro borough
Health Insurance Coverage by Age in Goldsboro borough
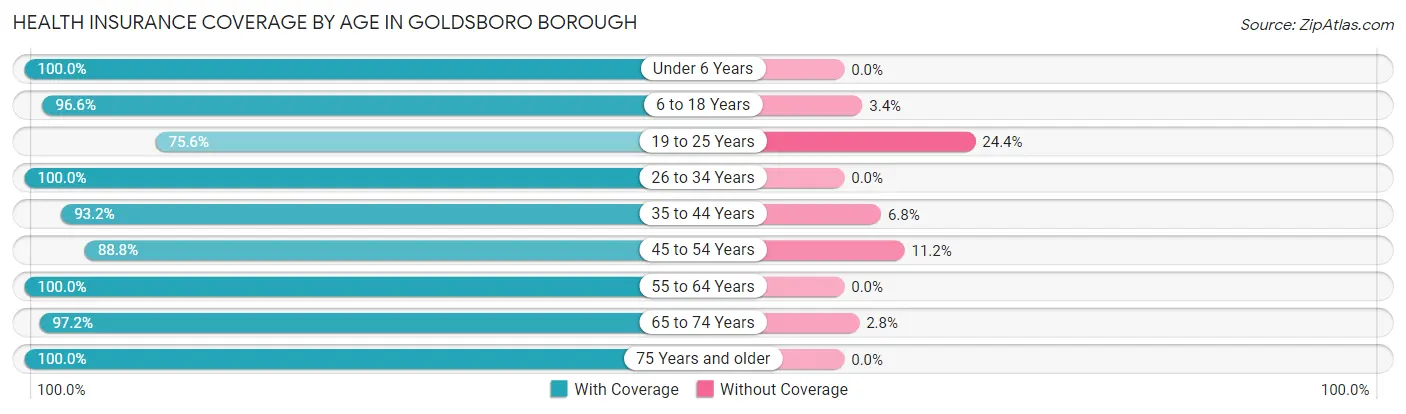
| Age Bracket | With Coverage | Without Coverage |
| Under 6 Years | 53 (100.0%) | 0 (0.0%) |
| 6 to 18 Years | 115 (96.6%) | 4 (3.4%) |
| 19 to 25 Years | 34 (75.6%) | 11 (24.4%) |
| 26 to 34 Years | 88 (100.0%) | 0 (0.0%) |
| 35 to 44 Years | 109 (93.2%) | 8 (6.8%) |
| 45 to 54 Years | 79 (88.8%) | 10 (11.2%) |
| 55 to 64 Years | 109 (100.0%) | 0 (0.0%) |
| 65 to 74 Years | 70 (97.2%) | 2 (2.8%) |
| 75 Years and older | 24 (100.0%) | 0 (0.0%) |
| Total | 681 (95.1%) | 35 (4.9%) |
Health Insurance Coverage by Citizenship Status in Goldsboro borough
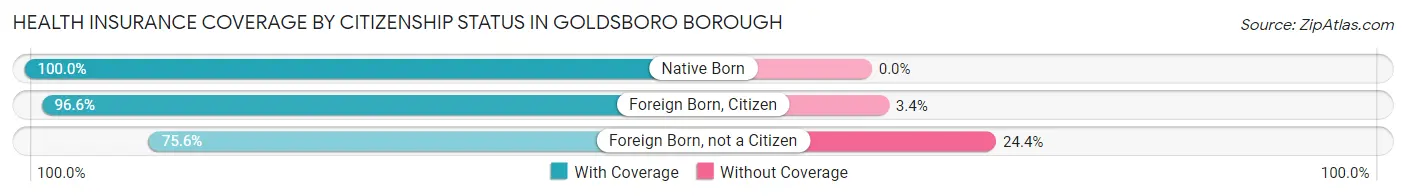
| Citizenship Status | With Coverage | Without Coverage |
| Native Born | 53 (100.0%) | 0 (0.0%) |
| Foreign Born, Citizen | 115 (96.6%) | 4 (3.4%) |
| Foreign Born, not a Citizen | 34 (75.6%) | 11 (24.4%) |
Health Insurance Coverage by Household Income in Goldsboro borough
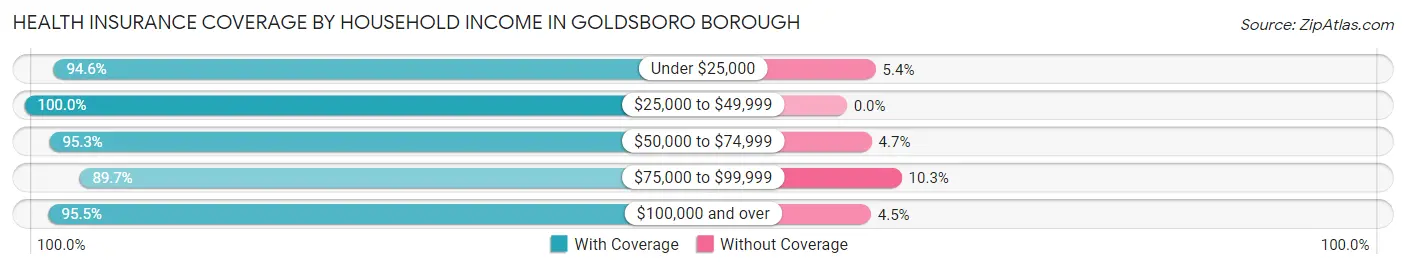
| Household Income | With Coverage | Without Coverage |
| Under $25,000 | 35 (94.6%) | 2 (5.4%) |
| $25,000 to $49,999 | 91 (100.0%) | 0 (0.0%) |
| $50,000 to $74,999 | 184 (95.3%) | 9 (4.7%) |
| $75,000 to $99,999 | 96 (89.7%) | 11 (10.3%) |
| $100,000 and over | 275 (95.5%) | 13 (4.5%) |
Public vs Private Health Insurance Coverage by Age in Goldsboro borough
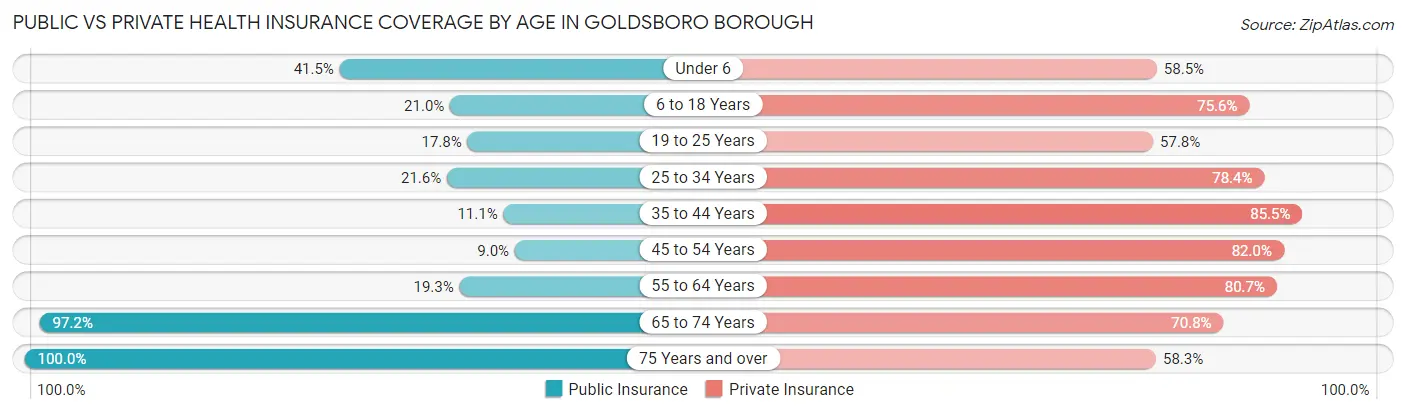
| Age Bracket | Public Insurance | Private Insurance |
| Under 6 | 22 (41.5%) | 31 (58.5%) |
| 6 to 18 Years | 25 (21.0%) | 90 (75.6%) |
| 19 to 25 Years | 8 (17.8%) | 26 (57.8%) |
| 25 to 34 Years | 19 (21.6%) | 69 (78.4%) |
| 35 to 44 Years | 13 (11.1%) | 100 (85.5%) |
| 45 to 54 Years | 8 (9.0%) | 73 (82.0%) |
| 55 to 64 Years | 21 (19.3%) | 88 (80.7%) |
| 65 to 74 Years | 70 (97.2%) | 51 (70.8%) |
| 75 Years and over | 24 (100.0%) | 14 (58.3%) |
| Total | 210 (29.3%) | 542 (75.7%) |
Disability Status by Sex by Age in Goldsboro borough
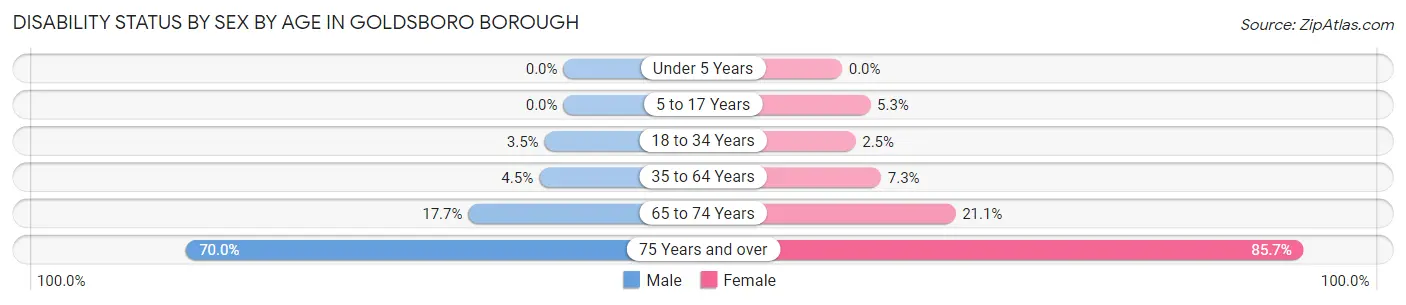
| Age Bracket | Male | Female |
| Under 5 Years | 0 (0.0%) | 0 (0.0%) |
| 5 to 17 Years | 0 (0.0%) | 3 (5.3%) |
| 18 to 34 Years | 2 (3.5%) | 2 (2.5%) |
| 35 to 64 Years | 8 (4.5%) | 10 (7.2%) |
| 65 to 74 Years | 6 (17.6%) | 8 (21.0%) |
| 75 Years and over | 7 (70.0%) | 12 (85.7%) |
Disability Class by Sex by Age in Goldsboro borough
Disability Class: Hearing Difficulty
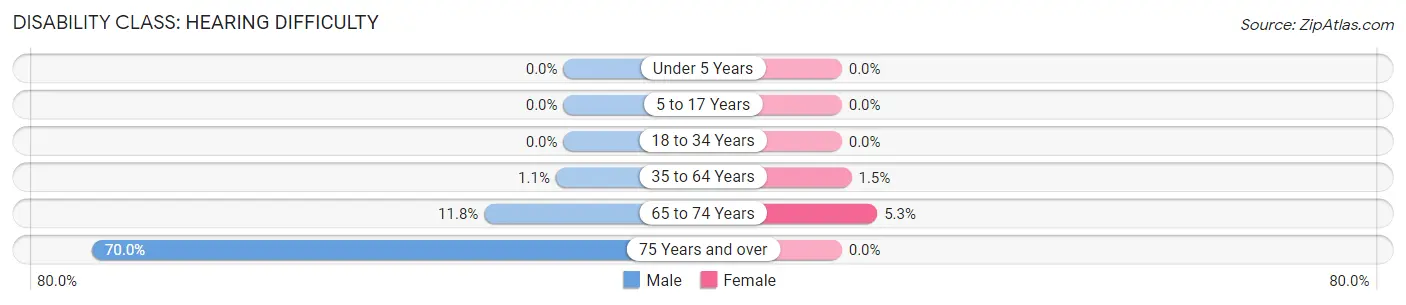
| Age Bracket | Male | Female |
| Under 5 Years | 0 (0.0%) | 0 (0.0%) |
| 5 to 17 Years | 0 (0.0%) | 0 (0.0%) |
| 18 to 34 Years | 0 (0.0%) | 0 (0.0%) |
| 35 to 64 Years | 2 (1.1%) | 2 (1.5%) |
| 65 to 74 Years | 4 (11.8%) | 2 (5.3%) |
| 75 Years and over | 7 (70.0%) | 0 (0.0%) |
Disability Class: Vision Difficulty
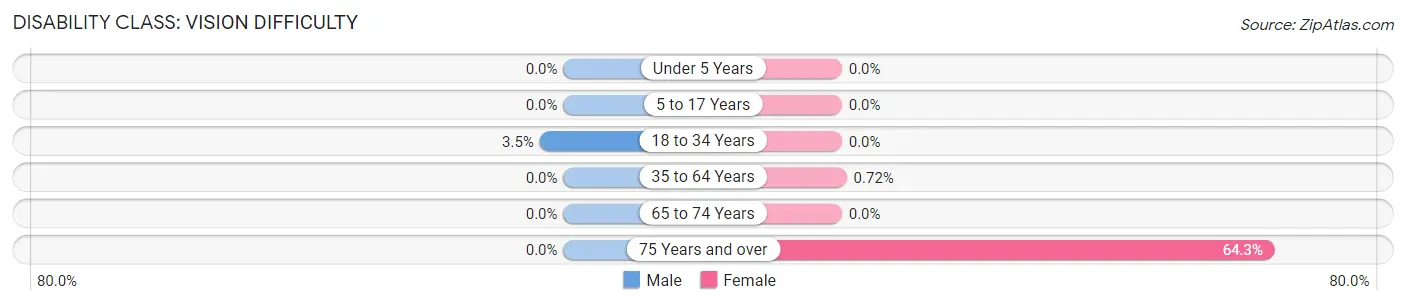
| Age Bracket | Male | Female |
| Under 5 Years | 0 (0.0%) | 0 (0.0%) |
| 5 to 17 Years | 0 (0.0%) | 0 (0.0%) |
| 18 to 34 Years | 2 (3.5%) | 0 (0.0%) |
| 35 to 64 Years | 0 (0.0%) | 1 (0.7%) |
| 65 to 74 Years | 0 (0.0%) | 0 (0.0%) |
| 75 Years and over | 0 (0.0%) | 9 (64.3%) |
Disability Class: Cognitive Difficulty
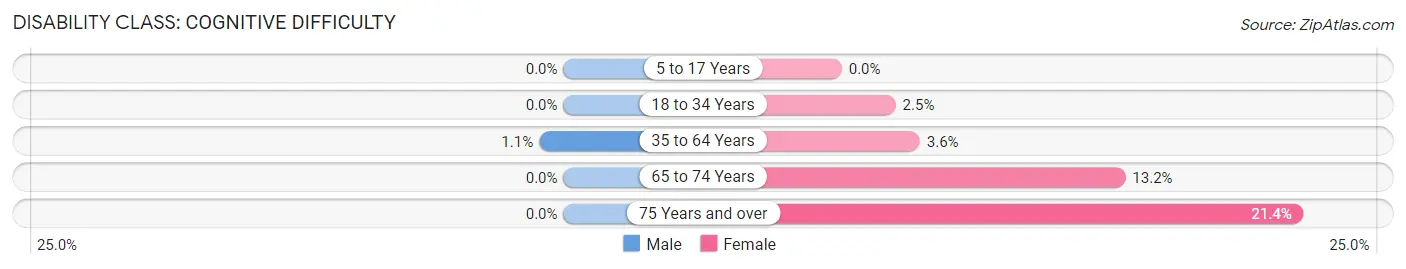
| Age Bracket | Male | Female |
| 5 to 17 Years | 0 (0.0%) | 0 (0.0%) |
| 18 to 34 Years | 0 (0.0%) | 2 (2.5%) |
| 35 to 64 Years | 2 (1.1%) | 5 (3.6%) |
| 65 to 74 Years | 0 (0.0%) | 5 (13.2%) |
| 75 Years and over | 0 (0.0%) | 3 (21.4%) |
Disability Class: Ambulatory Difficulty
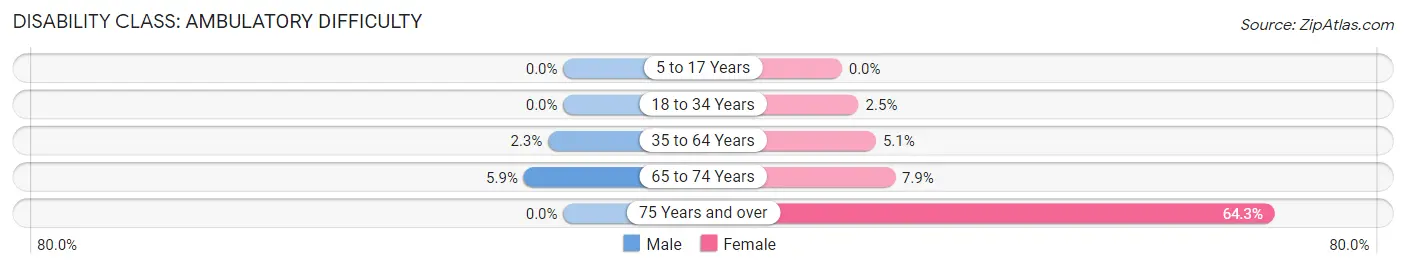
| Age Bracket | Male | Female |
| 5 to 17 Years | 0 (0.0%) | 0 (0.0%) |
| 18 to 34 Years | 0 (0.0%) | 2 (2.5%) |
| 35 to 64 Years | 4 (2.3%) | 7 (5.1%) |
| 65 to 74 Years | 2 (5.9%) | 3 (7.9%) |
| 75 Years and over | 0 (0.0%) | 9 (64.3%) |
Disability Class: Self-Care Difficulty
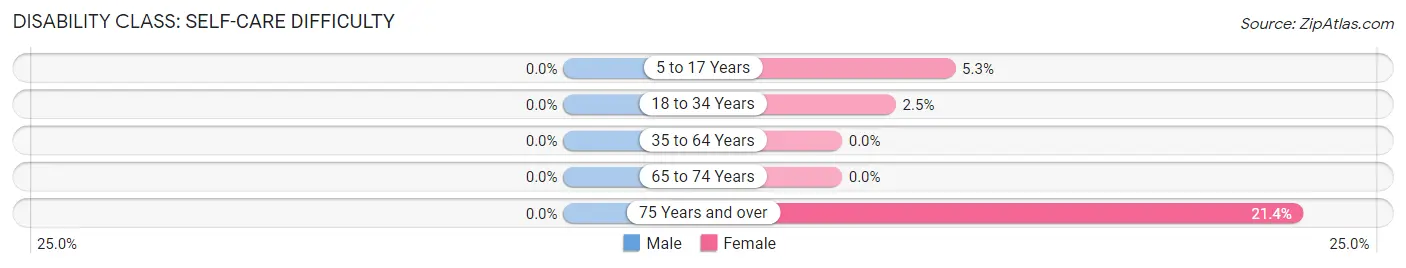
| Age Bracket | Male | Female |
| 5 to 17 Years | 0 (0.0%) | 3 (5.3%) |
| 18 to 34 Years | 0 (0.0%) | 2 (2.5%) |
| 35 to 64 Years | 0 (0.0%) | 0 (0.0%) |
| 65 to 74 Years | 0 (0.0%) | 0 (0.0%) |
| 75 Years and over | 0 (0.0%) | 3 (21.4%) |
Technology Access in Goldsboro borough
Computing Device Access in Goldsboro borough
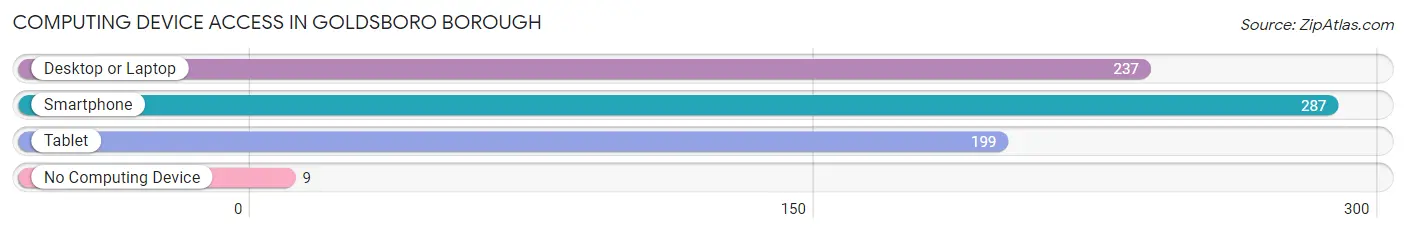
| Device Type | # Households | % Households |
| Desktop or Laptop | 237 | 78.5% |
| Smartphone | 287 | 95.0% |
| Tablet | 199 | 65.9% |
| No Computing Device | 9 | 3.0% |
| Total | 302 | 100.0% |
Internet Access in Goldsboro borough
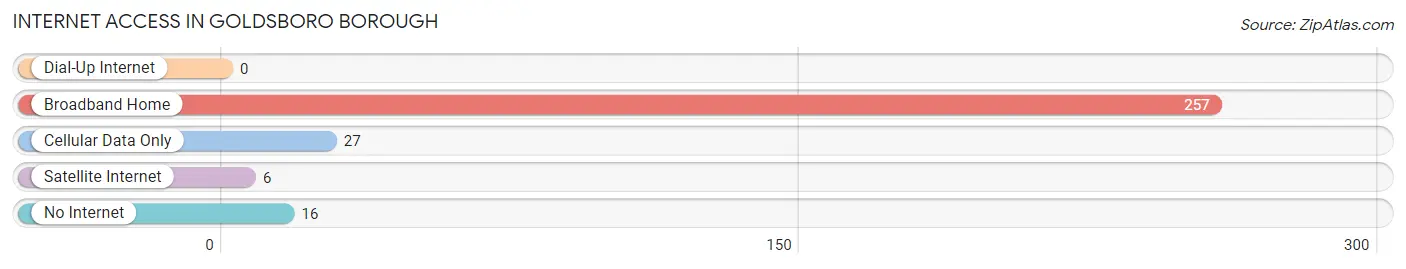
| Internet Type | # Households | % Households |
| Dial-Up Internet | 0 | 0.0% |
| Broadband Home | 257 | 85.1% |
| Cellular Data Only | 27 | 8.9% |
| Satellite Internet | 6 | 2.0% |
| No Internet | 16 | 5.3% |
| Total | 302 | 100.0% |
Goldsboro borough Summary
Goldsboro Borough is a small borough located in York County, Pennsylvania. It is situated in the southeastern corner of the county, approximately 10 miles south of the city of York. The borough is bordered by the townships of East Hopewell, North Hopewell, and Chanceford. According to the 2010 census, the population of Goldsboro was 1,093.
Geography
Goldsboro Borough is located at 39°45'45"N, 76°37'45"W (39.7625, -76.6292). It has a total area of 0.3 square miles, all of which is land. The borough is situated in the southeastern corner of York County, approximately 10 miles south of the city of York. It is bordered by the townships of East Hopewell, North Hopewell, and Chanceford.
The borough is located in the Piedmont region of Pennsylvania, which is characterized by rolling hills and valleys. The terrain is generally flat, with some areas of higher elevation. The climate is temperate, with hot summers and cold winters.
Demographics
According to the 2010 census, the population of Goldsboro was 1,093. The racial makeup of the borough was 95.2% White, 1.2% African American, 0.2% Native American, 0.7% Asian, 0.1% Pacific Islander, 0.9% from other races, and 1.7% from two or more races. Hispanic or Latino of any race were 2.2% of the population.
The median age in Goldsboro was 43.2 years. About 24.2% of residents were under the age of 18, 6.2% were between the ages of 18 and 24, 24.2% were from 25 to 44, 28.2% were from 45 to 64, and 17.2% were 65 years of age or older. The gender makeup of the borough was 48.2% male and 51.8% female.
Economy
Goldsboro Borough is a small, rural community with a primarily agricultural economy. The primary industries in the area are farming, livestock, and dairy production. The borough is also home to several small businesses, including a grocery store, a hardware store, and a few restaurants.
The median household income in Goldsboro was $45,938 in 2019, and the median family income was $51,938. About 8.2% of families and 10.2% of the population were below the poverty line, including 14.2% of those under age 18 and 8.2% of those age 65 or over.
History
Goldsboro Borough was founded in 1845 by a group of settlers from Maryland. The borough was named after the Goldsborough family, who were among the first settlers in the area. The borough was incorporated in 1851.
In the late 19th century, Goldsboro was a thriving agricultural community. The borough was home to several mills, including a grist mill, a saw mill, and a woolen mill. The borough also had a post office, a blacksmith shop, and several stores.
In the early 20th century, the borough began to decline as the population shifted to larger cities. The mills closed, and the post office was discontinued in the 1950s. The borough has since become a quiet, rural community.
Common Questions
What is Per Capita Income in Goldsboro borough?
Per Capita income in Goldsboro borough is $38,433.
What is the Median Family Income in Goldsboro borough?
Median Family Income in Goldsboro borough is $71,667.
What is the Median Household income in Goldsboro borough?
Median Household Income in Goldsboro borough is $74,440.
What is Income or Wage Gap in Goldsboro borough?
Income or Wage Gap in Goldsboro borough is 37.1%.
Women in Goldsboro borough earn 62.9 cents for every dollar earned by a man.
What is Inequality or Gini Index in Goldsboro borough?
Inequality or Gini Index in Goldsboro borough is 0.33.
What is the Total Population of Goldsboro borough?
Total Population of Goldsboro borough is 716.
What is the Total Male Population of Goldsboro borough?
Total Male Population of Goldsboro borough is 376.
What is the Total Female Population of Goldsboro borough?
Total Female Population of Goldsboro borough is 340.
What is the Ratio of Males per 100 Females in Goldsboro borough?
There are 110.59 Males per 100 Females in Goldsboro borough.
What is the Ratio of Females per 100 Males in Goldsboro borough?
There are 90.43 Females per 100 Males in Goldsboro borough.
What is the Median Population Age in Goldsboro borough?
Median Population Age in Goldsboro borough is 37.5 Years.
What is the Average Family Size in Goldsboro borough
Average Family Size in Goldsboro borough is 2.6 People.
What is the Average Household Size in Goldsboro borough
Average Household Size in Goldsboro borough is 2.4 People.
How Large is the Labor Force in Goldsboro borough?
There are 426 People in the Labor Forcein in Goldsboro borough.
What is the Percentage of People in the Labor Force in Goldsboro borough?
74.5% of People are in the Labor Force in Goldsboro borough.
What is the Unemployment Rate in Goldsboro borough?
Unemployment Rate in Goldsboro borough is 5.2%.