Langhorne borough, PA Map & Demographics
Langhorne borough Overview
$43,817
PER CAPITA INCOME
$115,956
AVG FAMILY INCOME
$83,125
AVG HOUSEHOLD INCOME
23.8%
WAGE / INCOME GAP [ % ]
76.2¢/ $1
WAGE / INCOME GAP [ $ ]
0.41
INEQUALITY / GINI INDEX
1,578
TOTAL POPULATION
787
MALE POPULATION
791
FEMALE POPULATION
99.49
MALES / 100 FEMALES
100.51
FEMALES / 100 MALES
46.4
MEDIAN AGE
2.9
AVG FAMILY SIZE
2.2
AVG HOUSEHOLD SIZE
852
LABOR FORCE [ PEOPLE ]
63.8%
PERCENT IN LABOR FORCE
7.4%
UNEMPLOYMENT RATE
Income in Langhorne borough
Income Overview in Langhorne borough
Per Capita Income in Langhorne borough is $43,817, while median incomes of families and households are $115,956 and $83,125 respectively.
| Characteristic | Number | Measure |
| Per Capita Income | 1,578 | $43,817 |
| Median Family Income | 351 | $115,956 |
| Mean Family Income | 351 | $137,698 |
| Median Household Income | 591 | $83,125 |
| Mean Household Income | 591 | $110,212 |
| Income Deficit | 351 | $0 |
| Wage / Income Gap (%) | 1,578 | 23.79% |
| Wage / Income Gap ($) | 1,578 | 76.21¢ per $1 |
| Gini / Inequality Index | 1,578 | 0.41 |
Earnings by Sex in Langhorne borough
Average Earnings in Langhorne borough are $51,167, $59,655 for men and $45,463 for women, a difference of 23.8%.
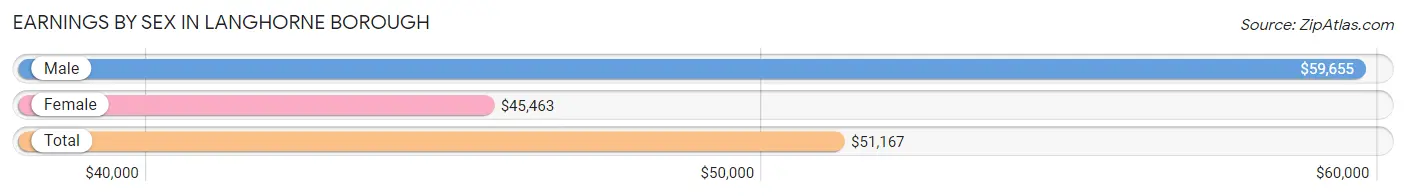
| Sex | Number | Average Earnings |
| Male | 432 (48.6%) | $59,655 |
| Female | 456 (51.3%) | $45,463 |
| Total | 888 (100.0%) | $51,167 |
Earnings by Sex by Income Bracket in Langhorne borough
The most common earnings brackets in Langhorne borough are $100,000+ for men (115 | 26.6%) and $65,000 to $74,999 for women (64 | 14.0%).
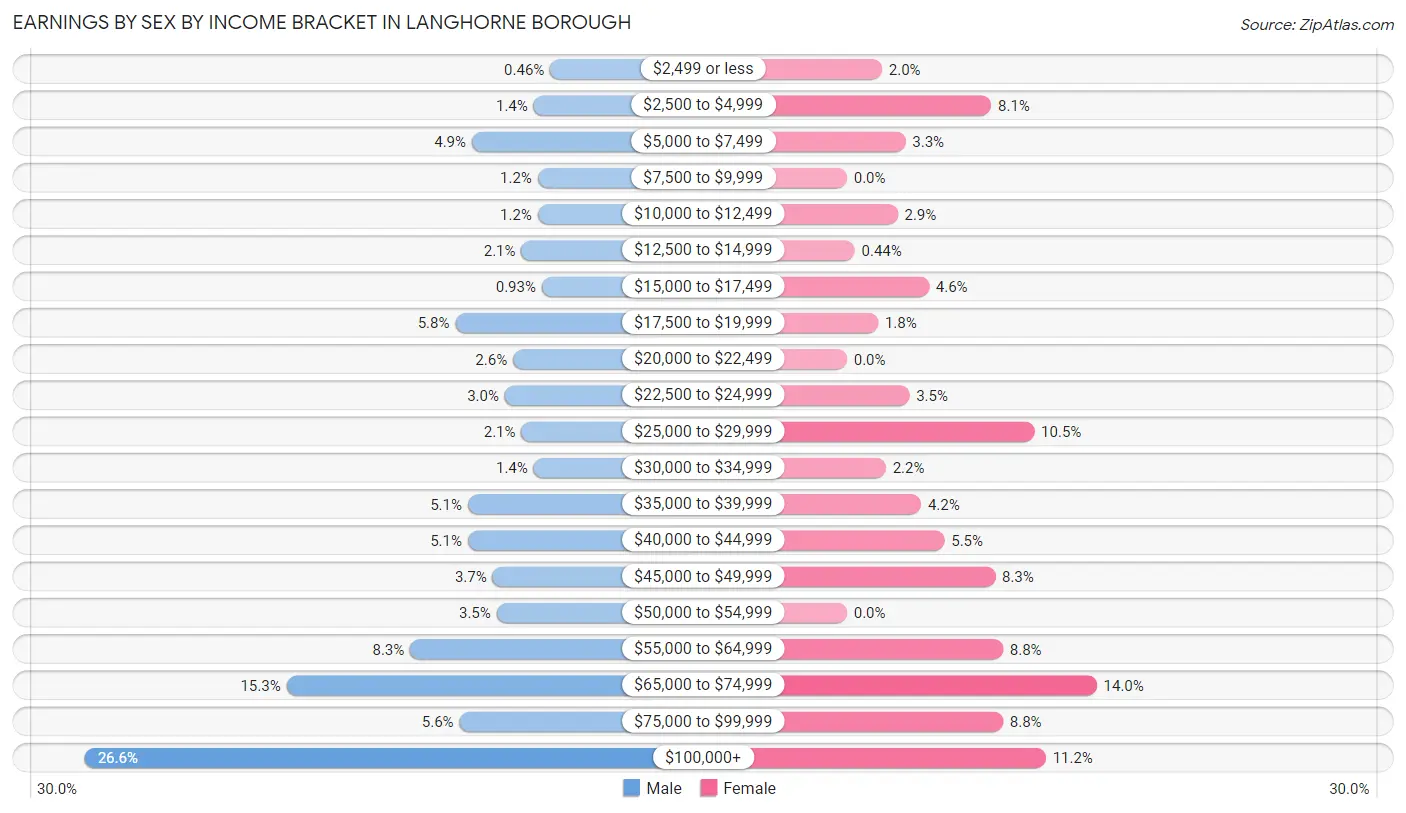
| Income | Male | Female |
| $2,499 or less | 2 (0.5%) | 9 (2.0%) |
| $2,500 to $4,999 | 6 (1.4%) | 37 (8.1%) |
| $5,000 to $7,499 | 21 (4.9%) | 15 (3.3%) |
| $7,500 to $9,999 | 5 (1.2%) | 0 (0.0%) |
| $10,000 to $12,499 | 5 (1.2%) | 13 (2.9%) |
| $12,500 to $14,999 | 9 (2.1%) | 2 (0.4%) |
| $15,000 to $17,499 | 4 (0.9%) | 21 (4.6%) |
| $17,500 to $19,999 | 25 (5.8%) | 8 (1.8%) |
| $20,000 to $22,499 | 11 (2.5%) | 0 (0.0%) |
| $22,500 to $24,999 | 13 (3.0%) | 16 (3.5%) |
| $25,000 to $29,999 | 9 (2.1%) | 48 (10.5%) |
| $30,000 to $34,999 | 6 (1.4%) | 10 (2.2%) |
| $35,000 to $39,999 | 22 (5.1%) | 19 (4.2%) |
| $40,000 to $44,999 | 22 (5.1%) | 25 (5.5%) |
| $45,000 to $49,999 | 16 (3.7%) | 38 (8.3%) |
| $50,000 to $54,999 | 15 (3.5%) | 0 (0.0%) |
| $55,000 to $64,999 | 36 (8.3%) | 40 (8.8%) |
| $65,000 to $74,999 | 66 (15.3%) | 64 (14.0%) |
| $75,000 to $99,999 | 24 (5.6%) | 40 (8.8%) |
| $100,000+ | 115 (26.6%) | 51 (11.2%) |
| Total | 432 (100.0%) | 456 (100.0%) |
Earnings by Sex by Educational Attainment in Langhorne borough
Average earnings in Langhorne borough are $70,491 for men and $55,096 for women, a difference of 21.8%. Men with an educational attainment of graduate degree enjoy the highest average annual earnings of $133,125, while those with less than high school education earn the least with $45,833. Women with an educational attainment of graduate degree earn the most with the average annual earnings of $66,776, while those with high school diploma education have the smallest earnings of $37,125.
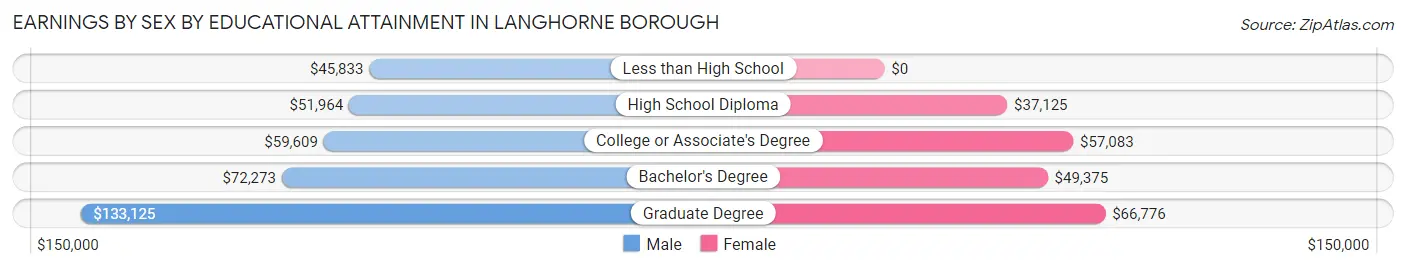
| Educational Attainment | Male Income | Female Income |
| Less than High School | $45,833 | $0 |
| High School Diploma | $51,964 | $37,125 |
| College or Associate's Degree | $59,609 | $57,083 |
| Bachelor's Degree | $72,273 | $49,375 |
| Graduate Degree | $133,125 | $66,776 |
| Total | $70,491 | $55,096 |
Family Income in Langhorne borough
Family Income Brackets in Langhorne borough
According to the Langhorne borough family income data, there are 101 families falling into the $200,000+ income range, which is the most common income bracket and makes up 28.8% of all families.
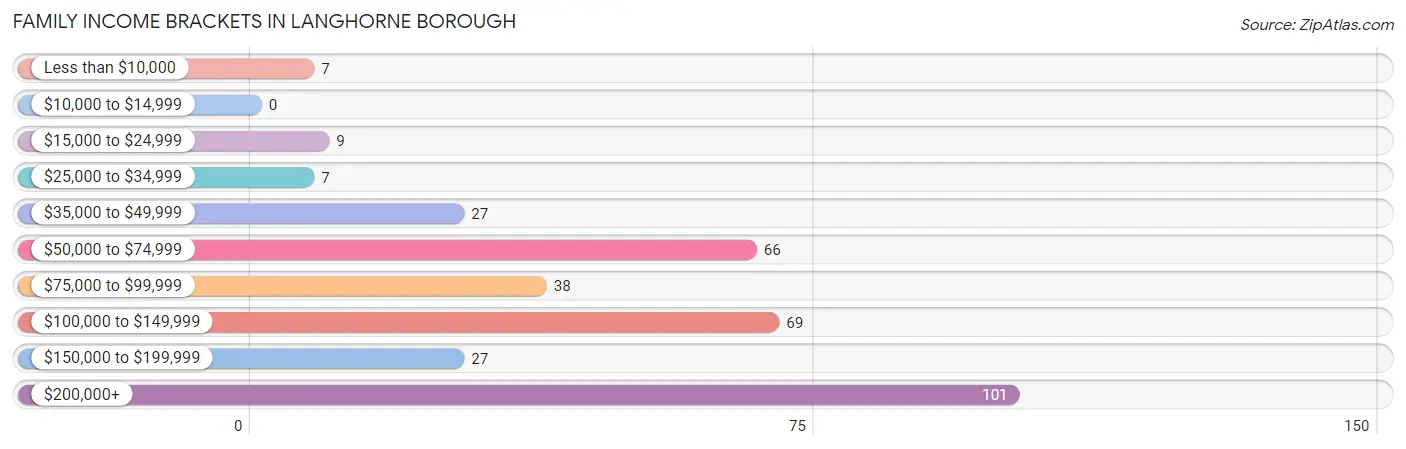
| Income Bracket | # Families | % Families |
| Less than $10,000 | 7 | 2.0% |
| $10,000 to $14,999 | 0 | 0.0% |
| $15,000 to $24,999 | 9 | 2.6% |
| $25,000 to $34,999 | 7 | 2.0% |
| $35,000 to $49,999 | 27 | 7.7% |
| $50,000 to $74,999 | 66 | 18.8% |
| $75,000 to $99,999 | 38 | 10.8% |
| $100,000 to $149,999 | 69 | 19.7% |
| $150,000 to $199,999 | 27 | 7.7% |
| $200,000+ | 101 | 28.8% |
Family Income by Famaliy Size in Langhorne borough
5-person families (27 | 7.7%) account for the highest median family income in Langhorne borough with $238,250 per family, while 4-person families (66 | 18.8%) have the highest median income of $54,698 per family member.
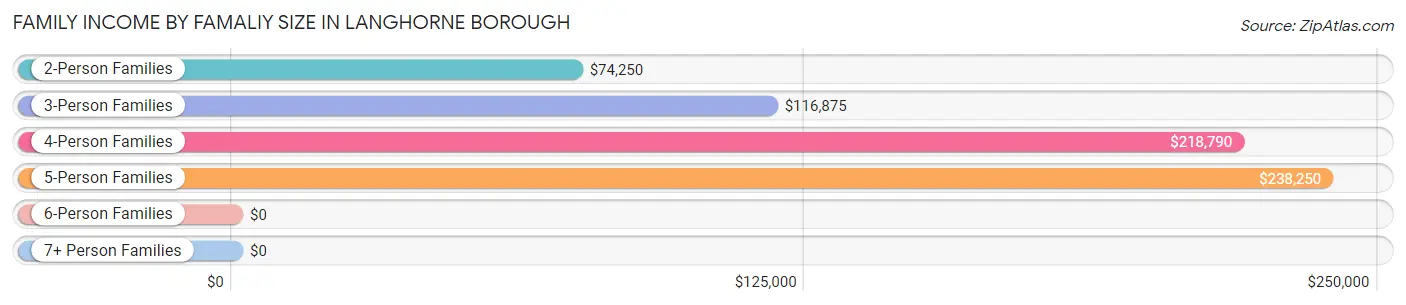
| Income Bracket | # Families | Median Income |
| 2-Person Families | 192 (54.7%) | $74,250 |
| 3-Person Families | 60 (17.1%) | $116,875 |
| 4-Person Families | 66 (18.8%) | $218,790 |
| 5-Person Families | 27 (7.7%) | $238,250 |
| 6-Person Families | 6 (1.7%) | $0 |
| 7+ Person Families | 0 (0.0%) | $0 |
| Total | 351 (100.0%) | $115,956 |
Family Income by Number of Earners in Langhorne borough
The median family income in Langhorne borough is $115,956, with families comprising 3+ earners (48) having the highest median family income of $219,300, while families with 1 earner (78) have the lowest median family income of $66,094, accounting for 13.7% and 22.2% of families, respectively.
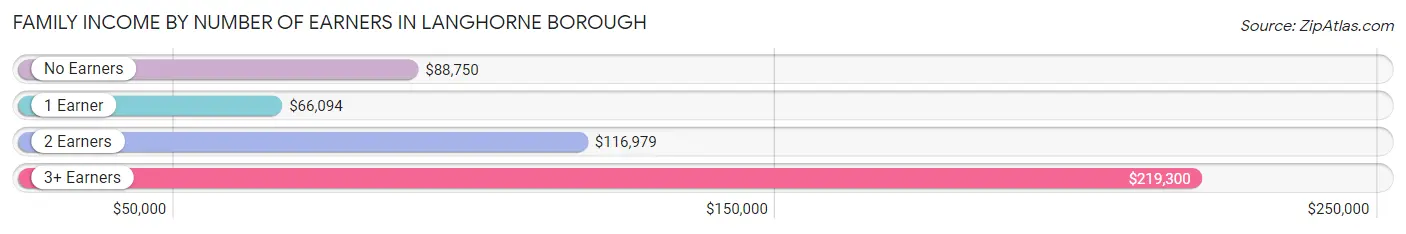
| Number of Earners | # Families | Median Income |
| No Earners | 52 (14.8%) | $88,750 |
| 1 Earner | 78 (22.2%) | $66,094 |
| 2 Earners | 173 (49.3%) | $116,979 |
| 3+ Earners | 48 (13.7%) | $219,300 |
| Total | 351 (100.0%) | $115,956 |
Household Income in Langhorne borough
Household Income Brackets in Langhorne borough
With 122 households falling in the category, the $50,000 to $74,999 income range is the most frequent in Langhorne borough, accounting for 20.6% of all households. In contrast, only 3 households (0.5%) fall into the $10,000 to $14,999 income bracket, making it the least populous group.
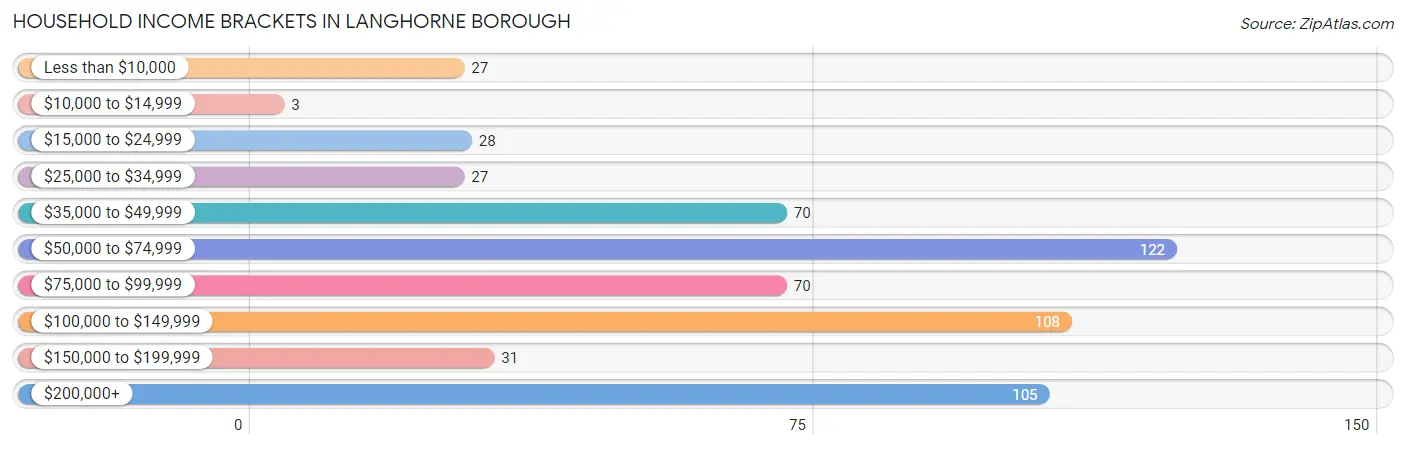
| Income Bracket | # Households | % Households |
| Less than $10,000 | 27 | 4.6% |
| $10,000 to $14,999 | 3 | 0.5% |
| $15,000 to $24,999 | 28 | 4.7% |
| $25,000 to $34,999 | 27 | 4.6% |
| $35,000 to $49,999 | 70 | 11.8% |
| $50,000 to $74,999 | 122 | 20.6% |
| $75,000 to $99,999 | 70 | 11.8% |
| $100,000 to $149,999 | 108 | 18.3% |
| $150,000 to $199,999 | 31 | 5.2% |
| $200,000+ | 105 | 17.8% |
Household Income by Householder Age in Langhorne borough
The median household income in Langhorne borough is $83,125, with the highest median household income of $98,333 found in the 45 to 64 years age bracket for the primary householder. A total of 252 households (42.6%) fall into this category. Meanwhile, the 15 to 24 years age bracket for the primary householder has the lowest median household income of $0, with 22 households (3.7%) in this group.
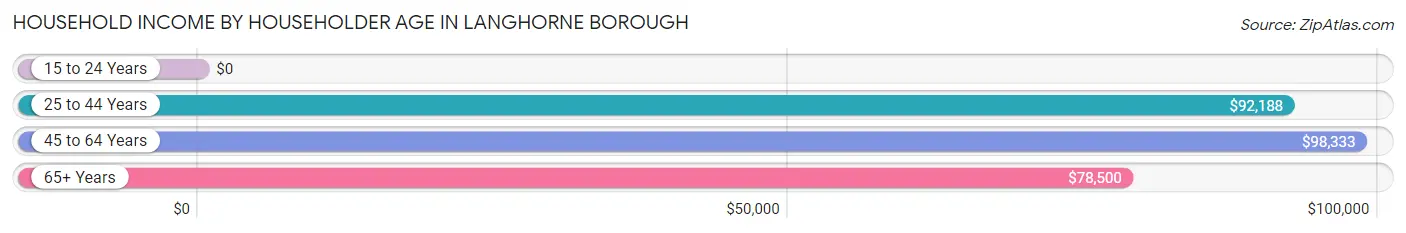
| Income Bracket | # Households | Median Income |
| 15 to 24 Years | 22 (3.7%) | $0 |
| 25 to 44 Years | 171 (28.9%) | $92,188 |
| 45 to 64 Years | 252 (42.6%) | $98,333 |
| 65+ Years | 146 (24.7%) | $78,500 |
| Total | 591 (100.0%) | $83,125 |
Poverty in Langhorne borough
Income Below Poverty by Sex and Age in Langhorne borough
With 12.5% poverty level for males and 6.5% for females among the residents of Langhorne borough, 55 to 64 year old males and 65 to 74 year old females are the most vulnerable to poverty, with 46 males (28.6%) and 14 females (17.3%) in their respective age groups living below the poverty level.
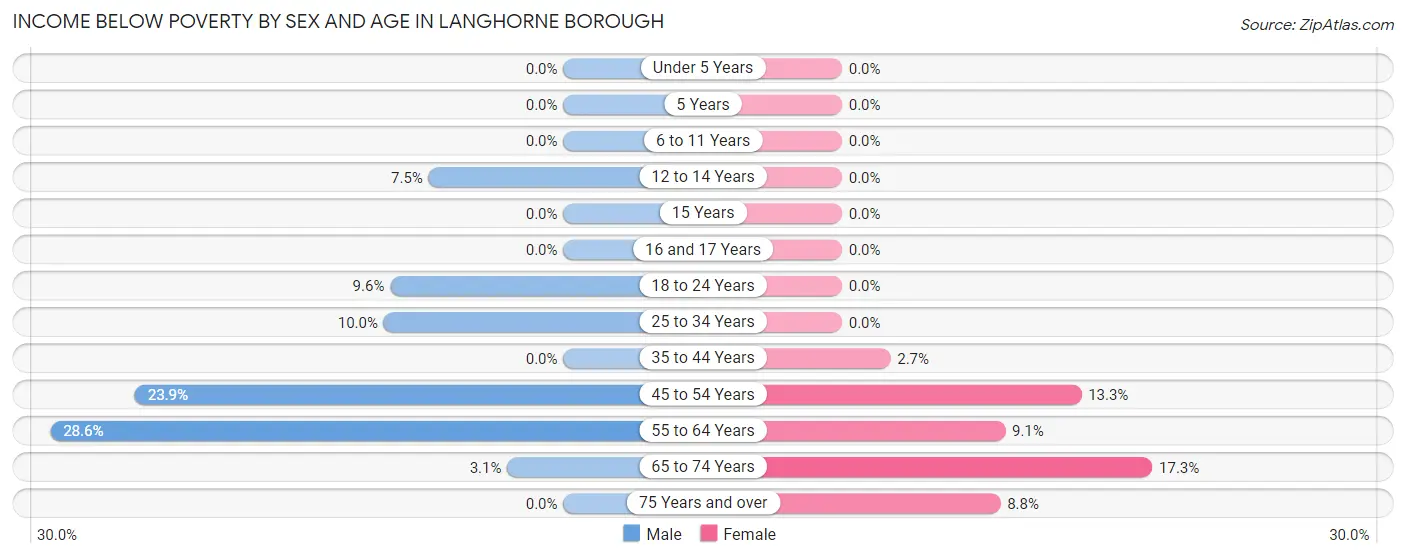
| Age Bracket | Male | Female |
| Under 5 Years | 0 (0.0%) | 0 (0.0%) |
| 5 Years | 0 (0.0%) | 0 (0.0%) |
| 6 to 11 Years | 0 (0.0%) | 0 (0.0%) |
| 12 to 14 Years | 3 (7.5%) | 0 (0.0%) |
| 15 Years | 0 (0.0%) | 0 (0.0%) |
| 16 and 17 Years | 0 (0.0%) | 0 (0.0%) |
| 18 to 24 Years | 8 (9.6%) | 0 (0.0%) |
| 25 to 34 Years | 8 (10.0%) | 0 (0.0%) |
| 35 to 44 Years | 0 (0.0%) | 3 (2.7%) |
| 45 to 54 Years | 21 (23.9%) | 14 (13.3%) |
| 55 to 64 Years | 46 (28.6%) | 9 (9.1%) |
| 65 to 74 Years | 2 (3.1%) | 14 (17.3%) |
| 75 Years and over | 0 (0.0%) | 6 (8.8%) |
| Total | 88 (12.5%) | 46 (6.5%) |
Income Above Poverty by Sex and Age in Langhorne borough
According to the poverty statistics in Langhorne borough, males aged under 5 years and females aged under 5 years are the age groups that are most secure financially, with 100.0% of males and 100.0% of females in these age groups living above the poverty line.
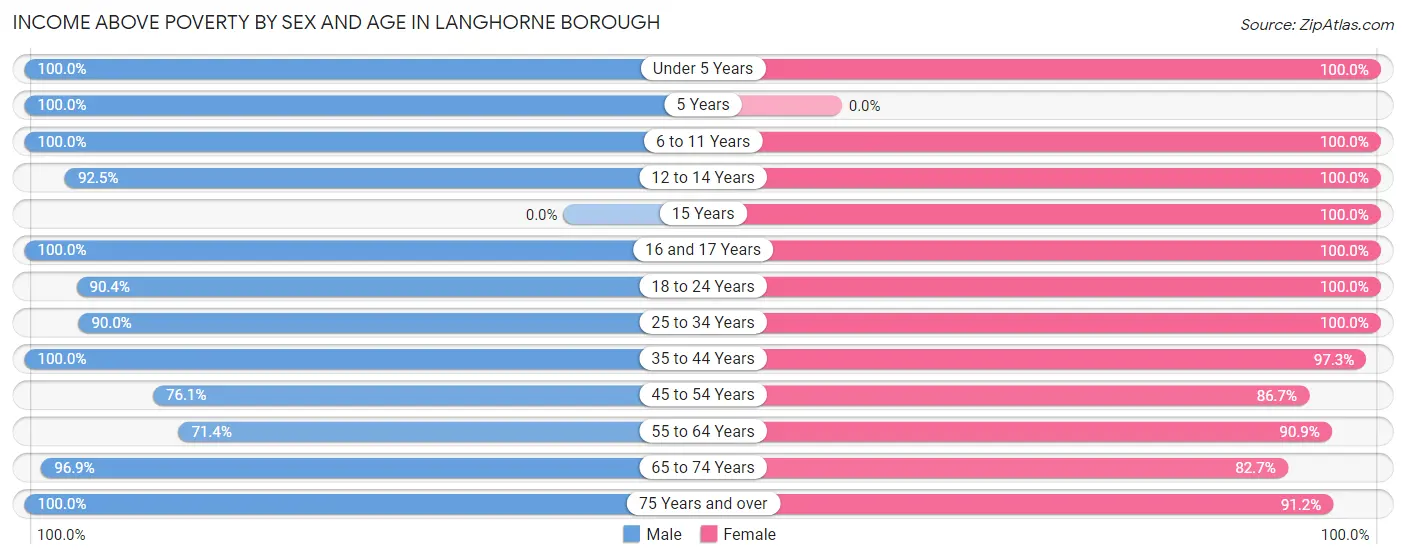
| Age Bracket | Male | Female |
| Under 5 Years | 39 (100.0%) | 29 (100.0%) |
| 5 Years | 5 (100.0%) | 0 (0.0%) |
| 6 to 11 Years | 21 (100.0%) | 34 (100.0%) |
| 12 to 14 Years | 37 (92.5%) | 9 (100.0%) |
| 15 Years | 0 (0.0%) | 16 (100.0%) |
| 16 and 17 Years | 4 (100.0%) | 12 (100.0%) |
| 18 to 24 Years | 75 (90.4%) | 63 (100.0%) |
| 25 to 34 Years | 72 (90.0%) | 84 (100.0%) |
| 35 to 44 Years | 83 (100.0%) | 108 (97.3%) |
| 45 to 54 Years | 67 (76.1%) | 91 (86.7%) |
| 55 to 64 Years | 115 (71.4%) | 90 (90.9%) |
| 65 to 74 Years | 62 (96.9%) | 67 (82.7%) |
| 75 Years and over | 36 (100.0%) | 62 (91.2%) |
| Total | 616 (87.5%) | 665 (93.5%) |
Income Below Poverty Among Married-Couple Families in Langhorne borough
The poverty statistics for married-couple families in Langhorne borough show that 0.7% or 2 of the total 282 families live below the poverty line. Families with no children have the highest poverty rate of 1.0%, comprising of 2 families. On the other hand, families with 1 or 2 children have the lowest poverty rate of 0.0%, which includes 0 families.
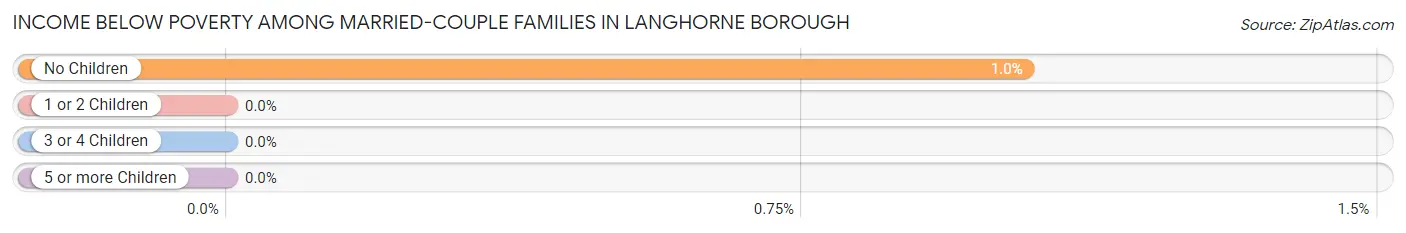
| Children | Above Poverty | Below Poverty |
| No Children | 191 (99.0%) | 2 (1.0%) |
| 1 or 2 Children | 67 (100.0%) | 0 (0.0%) |
| 3 or 4 Children | 22 (100.0%) | 0 (0.0%) |
| 5 or more Children | 0 (0.0%) | 0 (0.0%) |
| Total | 280 (99.3%) | 2 (0.7%) |
Income Below Poverty Among Single-Parent Households in Langhorne borough
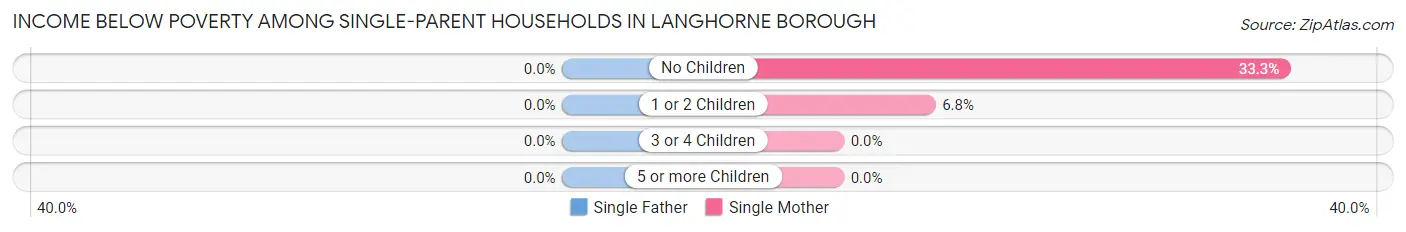
| Children | Single Father | Single Mother |
| No Children | 0 (0.0%) | 5 (33.3%) |
| 1 or 2 Children | 0 (0.0%) | 3 (6.8%) |
| 3 or 4 Children | 0 (0.0%) | 0 (0.0%) |
| 5 or more Children | 0 (0.0%) | 0 (0.0%) |
| Total | 0 (0.0%) | 8 (13.6%) |
Income Below Poverty Among Married-Couple vs Single-Parent Households in Langhorne borough
The poverty data for Langhorne borough shows that 2 of the married-couple family households (0.7%) and 8 of the single-parent households (11.6%) are living below the poverty level. Within the married-couple family households, those with no children have the highest poverty rate, with 2 households (1.0%) falling below the poverty line. Among the single-parent households, those with no children have the highest poverty rate, with 5 household (20.0%) living below poverty.
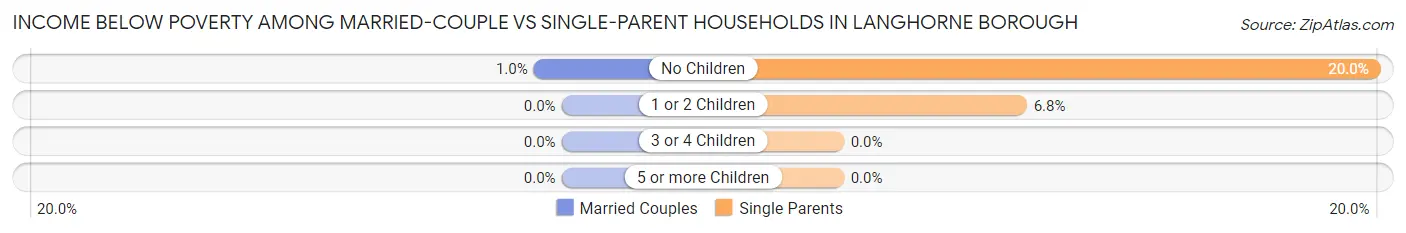
| Children | Married-Couple Families | Single-Parent Households |
| No Children | 2 (1.0%) | 5 (20.0%) |
| 1 or 2 Children | 0 (0.0%) | 3 (6.8%) |
| 3 or 4 Children | 0 (0.0%) | 0 (0.0%) |
| 5 or more Children | 0 (0.0%) | 0 (0.0%) |
| Total | 2 (0.7%) | 8 (11.6%) |
Race in Langhorne borough
The most populous races in Langhorne borough are White / Caucasian (1,456 | 92.3%), Hispanic or Latino (63 | 4.0%), and Black / African American (54 | 3.4%).
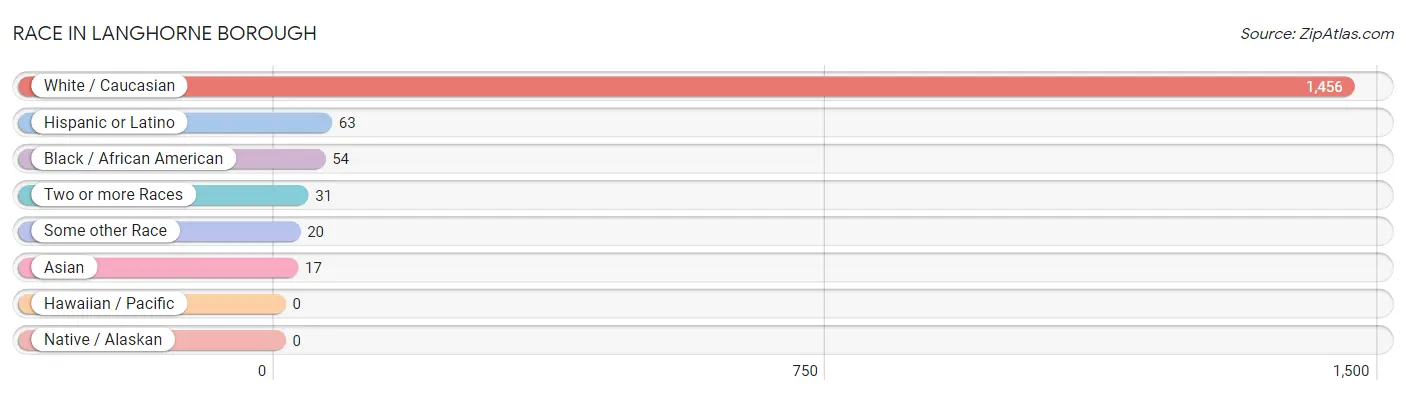
| Race | # Population | % Population |
| Asian | 17 | 1.1% |
| Black / African American | 54 | 3.4% |
| Hawaiian / Pacific | 0 | 0.0% |
| Hispanic or Latino | 63 | 4.0% |
| Native / Alaskan | 0 | 0.0% |
| White / Caucasian | 1,456 | 92.3% |
| Two or more Races | 31 | 2.0% |
| Some other Race | 20 | 1.3% |
| Total | 1,578 | 100.0% |
Ancestry in Langhorne borough
The most populous ancestries reported in Langhorne borough are Irish (447 | 28.3%), German (400 | 25.4%), English (253 | 16.0%), Italian (212 | 13.4%), and American (137 | 8.7%), together accounting for 91.8% of all Langhorne borough residents.
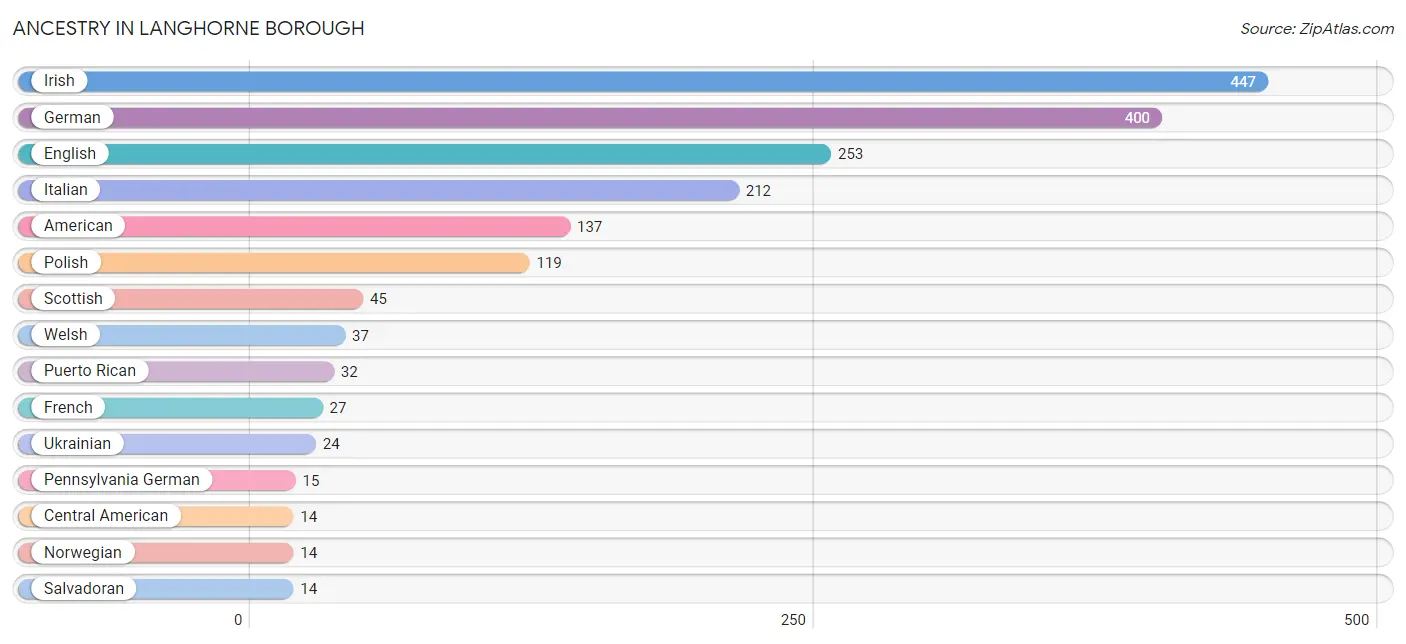
| Ancestry | # Population | % Population |
| African | 9 | 0.6% |
| American | 137 | 8.7% |
| Austrian | 9 | 0.6% |
| Basque | 5 | 0.3% |
| Bhutanese | 12 | 0.8% |
| Brazilian | 6 | 0.4% |
| British | 4 | 0.3% |
| Central American | 14 | 0.9% |
| Dominican | 9 | 0.6% |
| Dutch | 13 | 0.8% |
| Eastern European | 10 | 0.6% |
| English | 253 | 16.0% |
| European | 9 | 0.6% |
| French | 27 | 1.7% |
| French Canadian | 10 | 0.6% |
| German | 400 | 25.4% |
| Hungarian | 11 | 0.7% |
| Irish | 447 | 28.3% |
| Italian | 212 | 13.4% |
| Korean | 5 | 0.3% |
| Lithuanian | 9 | 0.6% |
| Mexican | 3 | 0.2% |
| Nigerian | 5 | 0.3% |
| Norwegian | 14 | 0.9% |
| Pennsylvania German | 15 | 0.9% |
| Polish | 119 | 7.5% |
| Puerto Rican | 32 | 2.0% |
| Russian | 8 | 0.5% |
| Salvadoran | 14 | 0.9% |
| Scotch-Irish | 13 | 0.8% |
| Scottish | 45 | 2.9% |
| Serbian | 4 | 0.3% |
| Slovak | 2 | 0.1% |
| Slovene | 3 | 0.2% |
| Subsaharan African | 14 | 0.9% |
| Swedish | 4 | 0.3% |
| Swiss | 3 | 0.2% |
| Turkish | 3 | 0.2% |
| Ukrainian | 24 | 1.5% |
| Welsh | 37 | 2.3% | View All 40 Rows |
Immigrants in Langhorne borough
The most numerous immigrant groups reported in Langhorne borough came from Asia (17 | 1.1%), Europe (13 | 0.8%), Northern Europe (13 | 0.8%), Africa (12 | 0.8%), and Eastern Asia (12 | 0.8%), together accounting for 4.2% of all Langhorne borough residents.
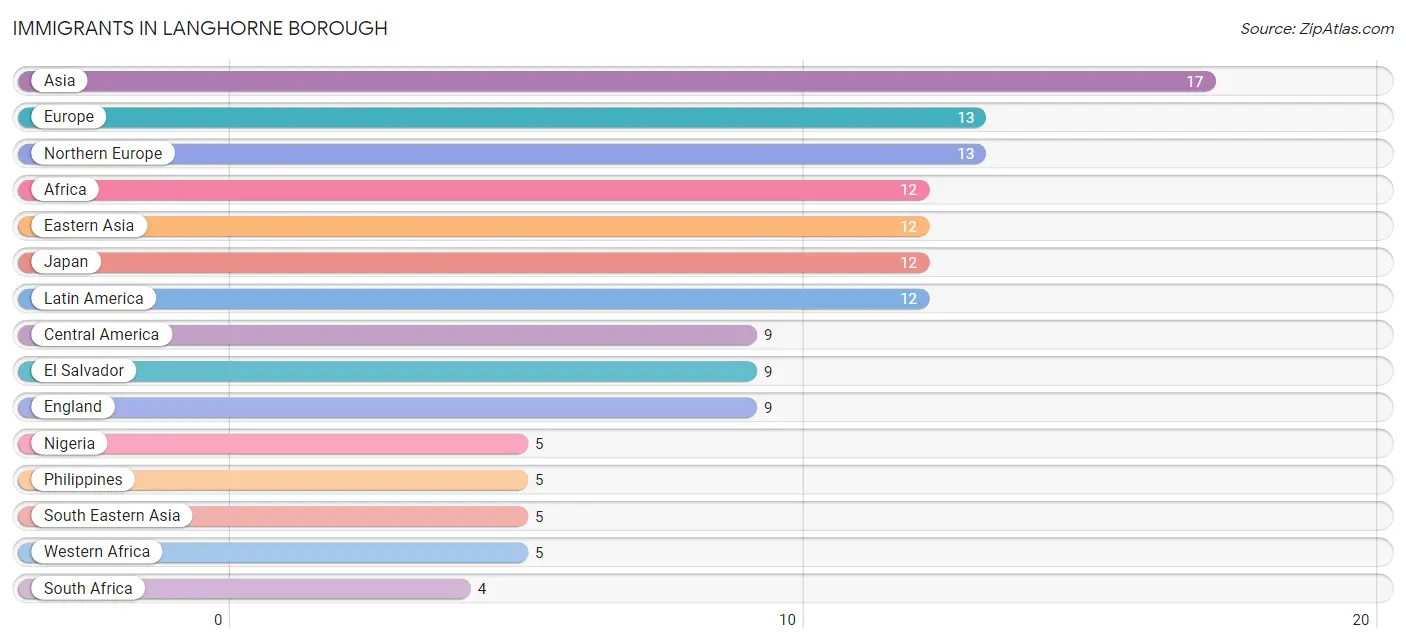
| Immigration Origin | # Population | % Population |
| Africa | 12 | 0.8% |
| Asia | 17 | 1.1% |
| Brazil | 3 | 0.2% |
| Central America | 9 | 0.6% |
| Eastern Africa | 3 | 0.2% |
| Eastern Asia | 12 | 0.8% |
| El Salvador | 9 | 0.6% |
| England | 9 | 0.6% |
| Europe | 13 | 0.8% |
| Japan | 12 | 0.8% |
| Latin America | 12 | 0.8% |
| Nigeria | 5 | 0.3% |
| Northern Europe | 13 | 0.8% |
| Philippines | 5 | 0.3% |
| South Africa | 4 | 0.3% |
| South America | 3 | 0.2% |
| South Eastern Asia | 5 | 0.3% |
| Western Africa | 5 | 0.3% | View All 18 Rows |
Sex and Age in Langhorne borough
Sex and Age in Langhorne borough
The most populous age groups in Langhorne borough are 60 to 64 Years (95 | 12.1%) for men and 85 Years and over (70 | 8.8%) for women.
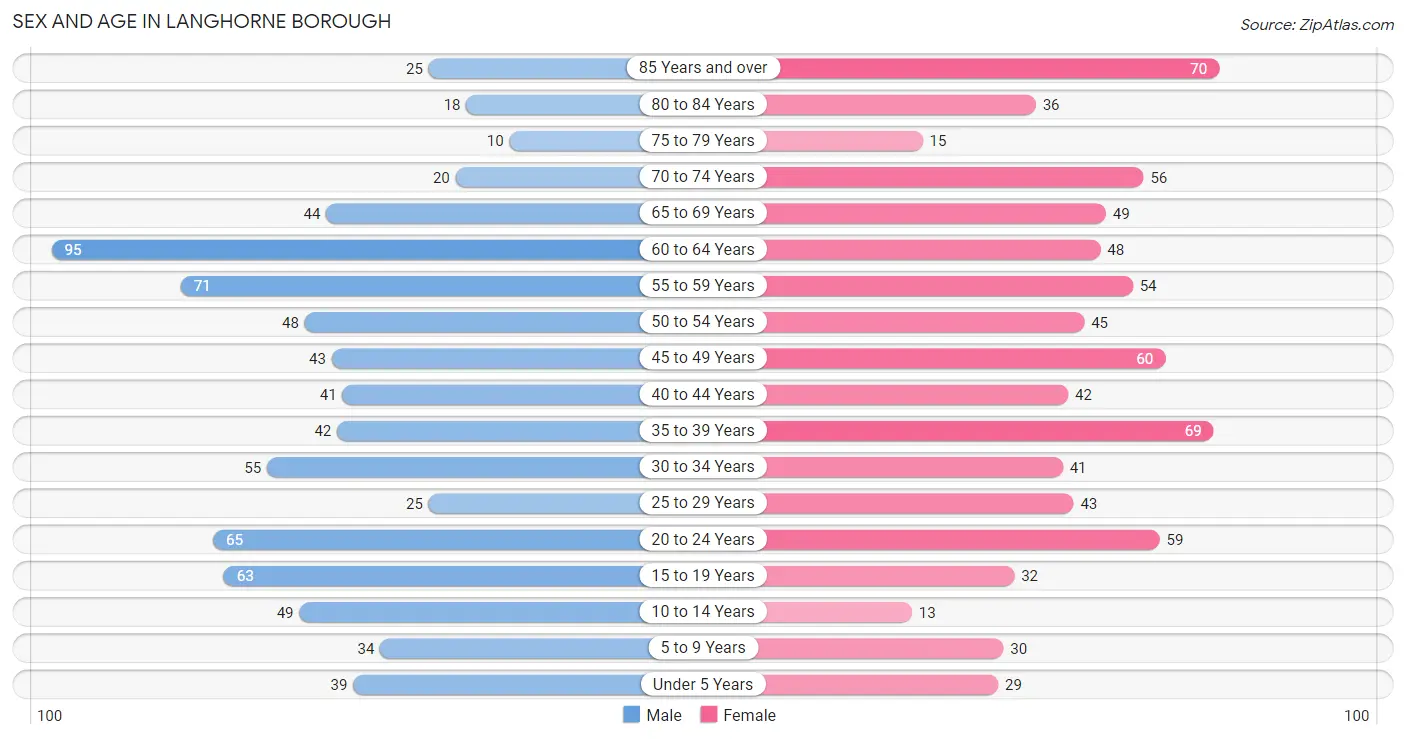
| Age Bracket | Male | Female |
| Under 5 Years | 39 (5.0%) | 29 (3.7%) |
| 5 to 9 Years | 34 (4.3%) | 30 (3.8%) |
| 10 to 14 Years | 49 (6.2%) | 13 (1.6%) |
| 15 to 19 Years | 63 (8.0%) | 32 (4.1%) |
| 20 to 24 Years | 65 (8.3%) | 59 (7.5%) |
| 25 to 29 Years | 25 (3.2%) | 43 (5.4%) |
| 30 to 34 Years | 55 (7.0%) | 41 (5.2%) |
| 35 to 39 Years | 42 (5.3%) | 69 (8.7%) |
| 40 to 44 Years | 41 (5.2%) | 42 (5.3%) |
| 45 to 49 Years | 43 (5.5%) | 60 (7.6%) |
| 50 to 54 Years | 48 (6.1%) | 45 (5.7%) |
| 55 to 59 Years | 71 (9.0%) | 54 (6.8%) |
| 60 to 64 Years | 95 (12.1%) | 48 (6.1%) |
| 65 to 69 Years | 44 (5.6%) | 49 (6.2%) |
| 70 to 74 Years | 20 (2.5%) | 56 (7.1%) |
| 75 to 79 Years | 10 (1.3%) | 15 (1.9%) |
| 80 to 84 Years | 18 (2.3%) | 36 (4.5%) |
| 85 Years and over | 25 (3.2%) | 70 (8.8%) |
| Total | 787 (100.0%) | 791 (100.0%) |
Families and Households in Langhorne borough
Median Family Size in Langhorne borough
The median family size in Langhorne borough is 2.86 persons per family, with married-couple families (282 | 80.3%) accounting for the largest median family size of 3.02 persons per family. On the other hand, single male/father families (10 | 2.9%) represent the smallest median family size with 2.10 persons per family.
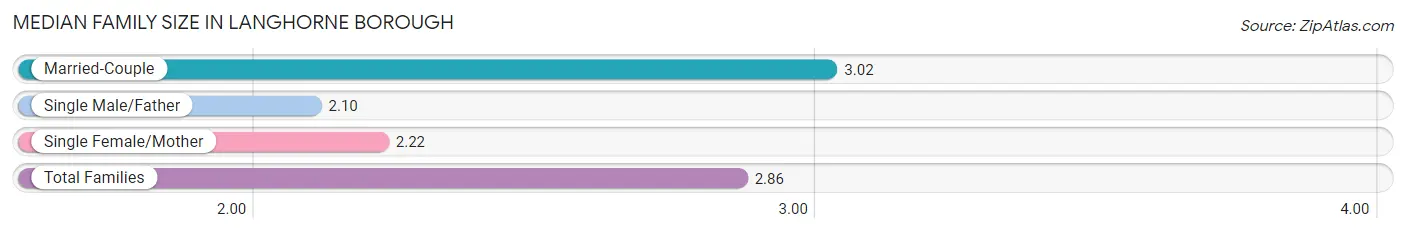
| Family Type | # Families | Family Size |
| Married-Couple | 282 (80.3%) | 3.02 |
| Single Male/Father | 10 (2.9%) | 2.10 |
| Single Female/Mother | 59 (16.8%) | 2.22 |
| Total Families | 351 (100.0%) | 2.86 |
Median Household Size in Langhorne borough
The median household size in Langhorne borough is 2.23 persons per household, with married-couple households (282 | 47.7%) accounting for the largest median household size of 3.03 persons per household. non-family households (240 | 40.6%) represent the smallest median household size with 1.23 persons per household.
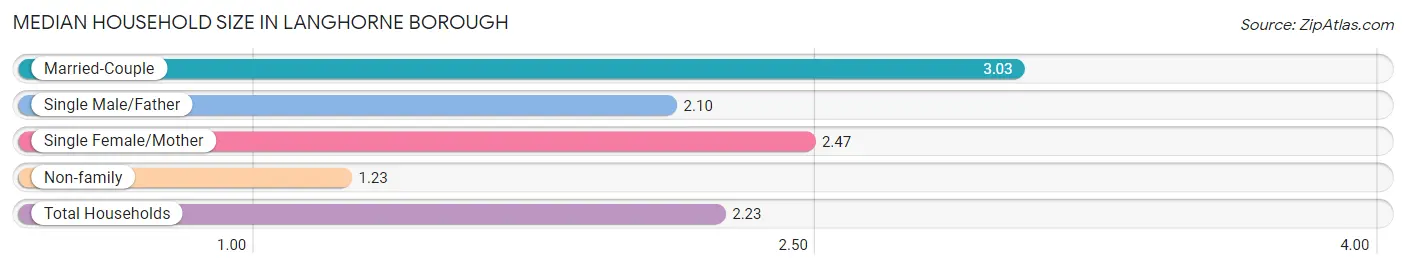
| Household Type | # Households | Household Size |
| Married-Couple | 282 (47.7%) | 3.03 |
| Single Male/Father | 10 (1.7%) | 2.10 |
| Single Female/Mother | 59 (10.0%) | 2.47 |
| Non-family | 240 (40.6%) | 1.23 |
| Total Households | 591 (100.0%) | 2.23 |
Household Size by Marriage Status in Langhorne borough
Out of a total of 591 households in Langhorne borough, 351 (59.4%) are family households, while 240 (40.6%) are nonfamily households. The most numerous type of family households are 2-person households, comprising 176, and the most common type of nonfamily households are 1-person households, comprising 188.
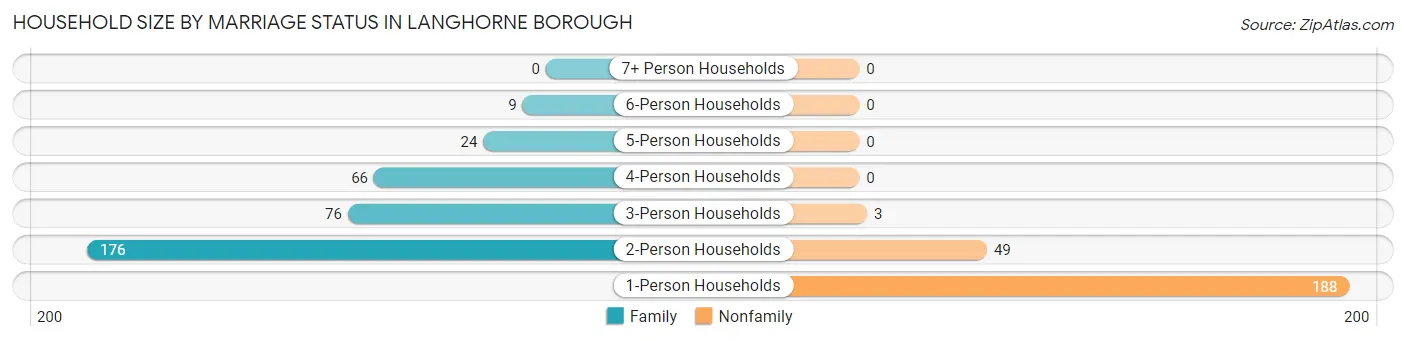
| Household Size | Family Households | Nonfamily Households |
| 1-Person Households | - | 188 (31.8%) |
| 2-Person Households | 176 (29.8%) | 49 (8.3%) |
| 3-Person Households | 76 (12.9%) | 3 (0.5%) |
| 4-Person Households | 66 (11.2%) | 0 (0.0%) |
| 5-Person Households | 24 (4.1%) | 0 (0.0%) |
| 6-Person Households | 9 (1.5%) | 0 (0.0%) |
| 7+ Person Households | 0 (0.0%) | 0 (0.0%) |
| Total | 351 (59.4%) | 240 (40.6%) |
Female Fertility in Langhorne borough
Fertility by Age in Langhorne borough
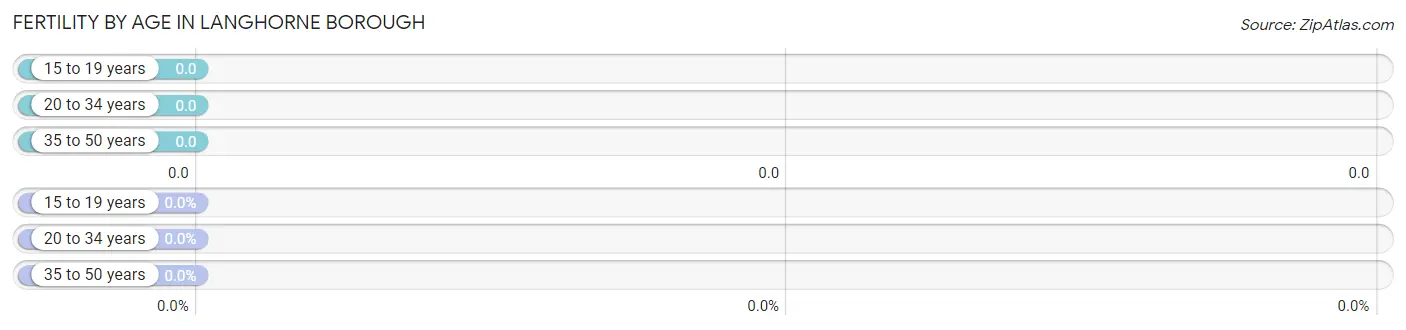
| Age Bracket | Women with Births | Births / 1,000 Women |
| 15 to 19 years | 0 (0.0%) | 0.0 |
| 20 to 34 years | 0 (0.0%) | 0.0 |
| 35 to 50 years | 0 (0.0%) | 0.0 |
| Total | 0 (0.0%) | 0.0 |
Fertility by Age by Marriage Status in Langhorne borough
| Age Bracket | Married | Unmarried |
| 15 to 19 years | 0 (0.0%) | 0 (0.0%) |
| 20 to 34 years | 0 (0.0%) | 0 (0.0%) |
| 35 to 50 years | 0 (0.0%) | 0 (0.0%) |
| Total | 0 (0.0%) | 0 (0.0%) |
Fertility by Education in Langhorne borough
| Educational Attainment | Women with Births | Births / 1,000 Women |
| Less than High School | 0 (0.0%) | 0.0 |
| High School Diploma | 0 (0.0%) | 0.0 |
| College or Associate's Degree | 0 (0.0%) | 0.0 |
| Bachelor's Degree | 0 (0.0%) | 0.0 |
| Graduate Degree | 0 (0.0%) | 0.0 |
| Total | 0 (0.0%) | 0.0 |
Fertility by Education by Marriage Status in Langhorne borough
| Educational Attainment | Married | Unmarried |
| Less than High School | 0 (0.0%) | 0 (0.0%) |
| High School Diploma | 0 (0.0%) | 0 (0.0%) |
| College or Associate's Degree | 0 (0.0%) | 0 (0.0%) |
| Bachelor's Degree | 0 (0.0%) | 0 (0.0%) |
| Graduate Degree | 0 (0.0%) | 0 (0.0%) |
| Total | 0 (0.0%) | 0 (0.0%) |
Employment Characteristics in Langhorne borough
Employment by Class of Employer in Langhorne borough
Among the 785 employed individuals in Langhorne borough, private company employees (494 | 62.9%), not-for-profit organizations (116 | 14.8%), and local government employees (67 | 8.5%) make up the most common classes of employment.
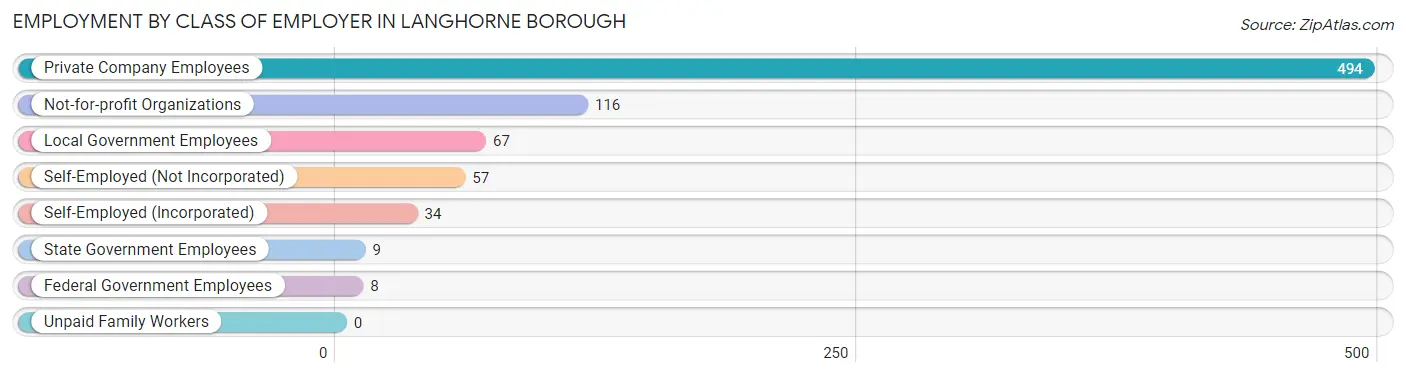
| Employer Class | # Employees | % Employees |
| Private Company Employees | 494 | 62.9% |
| Self-Employed (Incorporated) | 34 | 4.3% |
| Self-Employed (Not Incorporated) | 57 | 7.3% |
| Not-for-profit Organizations | 116 | 14.8% |
| Local Government Employees | 67 | 8.5% |
| State Government Employees | 9 | 1.1% |
| Federal Government Employees | 8 | 1.0% |
| Unpaid Family Workers | 0 | 0.0% |
| Total | 785 | 100.0% |
Employment Status by Age in Langhorne borough
According to the labor force statistics for Langhorne borough, out of the total population over 16 years of age (1,336), 63.8% or 852 individuals are in the labor force, with 7.4% or 63 of them unemployed. The age group with the highest labor force participation rate is 35 to 44 years, with 97.9% or 190 individuals in the labor force. Within the labor force, the 20 to 24 years age range has the highest percentage of unemployed individuals, with 24.8% or 29 of them being unemployed.
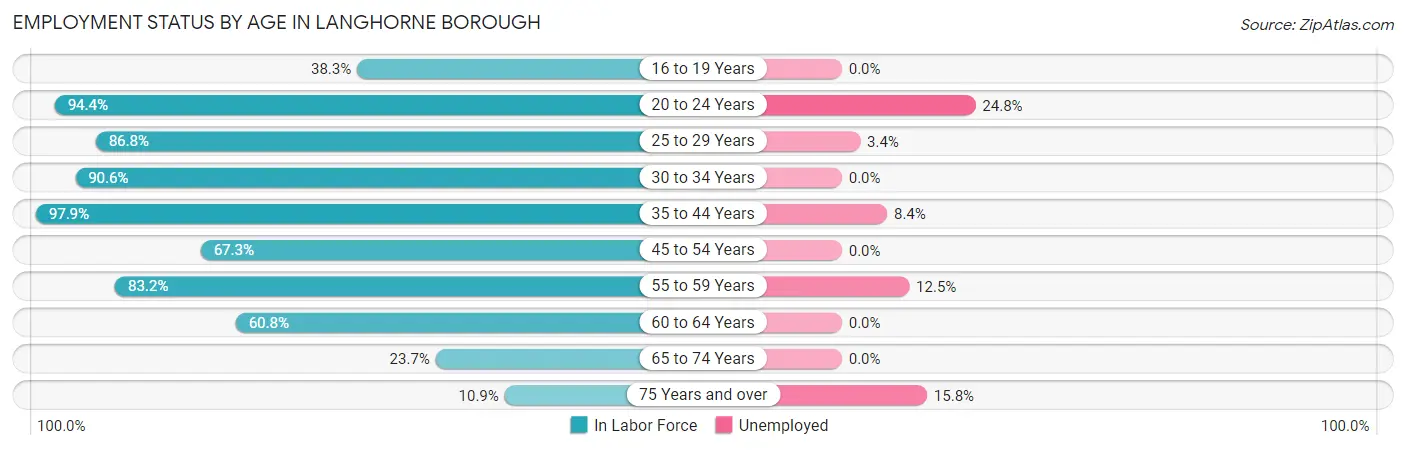
| Age Bracket | In Labor Force | Unemployed |
| 16 to 19 Years | 18 (38.3%) | 0 (0.0%) |
| 20 to 24 Years | 117 (94.4%) | 29 (24.8%) |
| 25 to 29 Years | 59 (86.8%) | 2 (3.4%) |
| 30 to 34 Years | 87 (90.6%) | 0 (0.0%) |
| 35 to 44 Years | 190 (97.9%) | 16 (8.4%) |
| 45 to 54 Years | 132 (67.3%) | 0 (0.0%) |
| 55 to 59 Years | 104 (83.2%) | 13 (12.5%) |
| 60 to 64 Years | 87 (60.8%) | 0 (0.0%) |
| 65 to 74 Years | 40 (23.7%) | 0 (0.0%) |
| 75 Years and over | 19 (10.9%) | 3 (15.8%) |
| Total | 852 (63.8%) | 63 (7.4%) |
Employment Status by Educational Attainment in Langhorne borough
According to labor force statistics for Langhorne borough, 80.2% of individuals (659) out of the total population between 25 and 64 years of age (822) are in the labor force, with 4.7% or 31 of them being unemployed. The group with the highest labor force participation rate are those with the educational attainment of bachelor's degree or higher, with 88.5% or 292 individuals in the labor force. Within the labor force, individuals with high school diploma education have the highest percentage of unemployment, with 13.6% or 19 of them being unemployed.
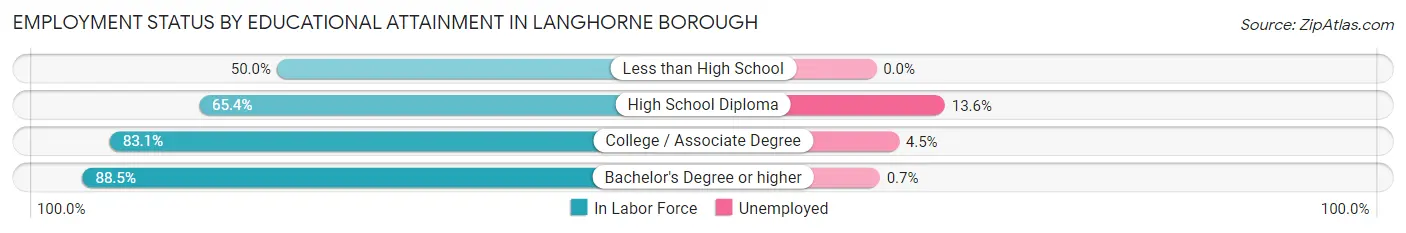
| Educational Attainment | In Labor Force | Unemployed |
| Less than High School | 6 (50.0%) | 0 (0.0%) |
| High School Diploma | 140 (65.4%) | 29 (13.6%) |
| College / Associate Degree | 221 (83.1%) | 12 (4.5%) |
| Bachelor's Degree or higher | 292 (88.5%) | 2 (0.7%) |
| Total | 659 (80.2%) | 39 (4.7%) |
Employment Occupations by Sex in Langhorne borough
Management, Business, Science and Arts Occupations
The most common Management, Business, Science and Arts occupations in Langhorne borough are Community & Social Service (112 | 14.2%), Business & Financial (101 | 12.8%), Education Instruction & Library (73 | 9.2%), Management (70 | 8.9%), and Health Diagnosing & Treating (61 | 7.7%).
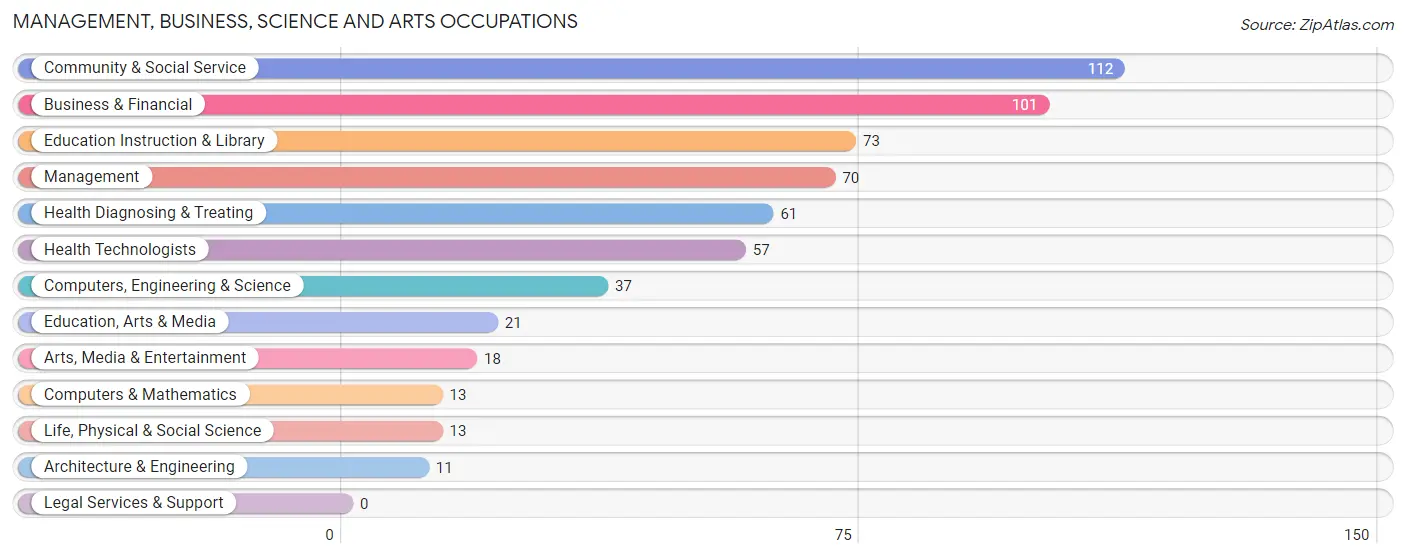
Management, Business, Science and Arts Occupations by Sex
Within the Management, Business, Science and Arts occupations in Langhorne borough, the most male-oriented occupations are Computers & Mathematics (100.0%), Architecture & Engineering (100.0%), and Computers, Engineering & Science (89.2%), while the most female-oriented occupations are Education Instruction & Library (86.3%), Education, Arts & Media (80.9%), and Community & Social Service (80.4%).
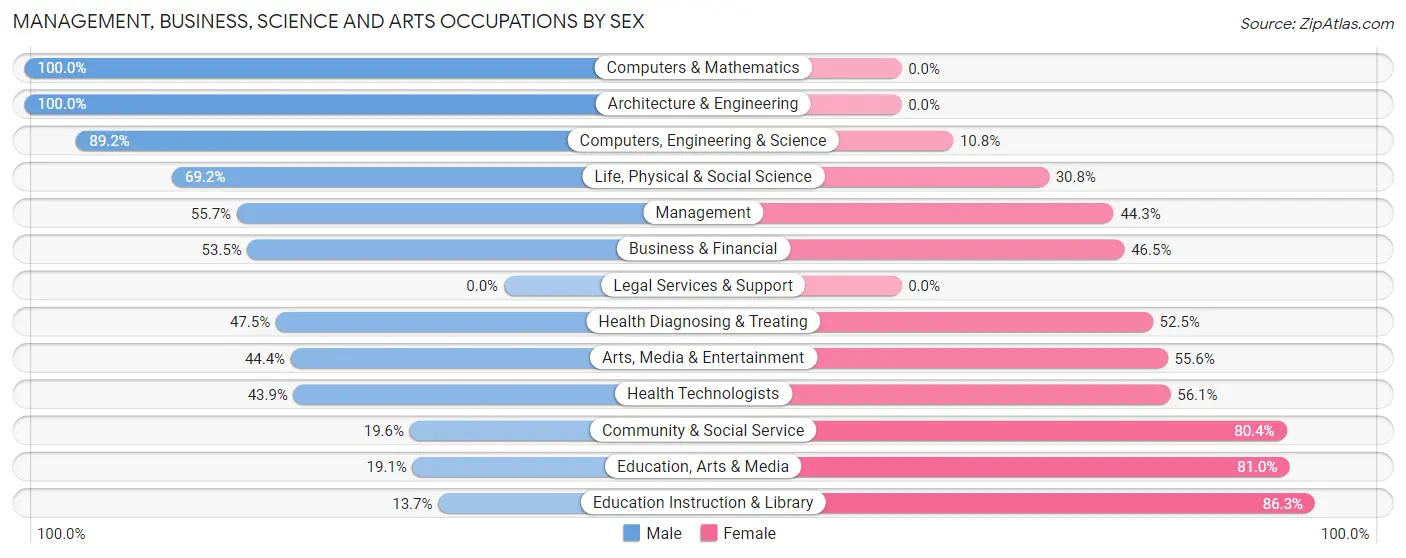
| Occupation | Male | Female |
| Management | 39 (55.7%) | 31 (44.3%) |
| Business & Financial | 54 (53.5%) | 47 (46.5%) |
| Computers, Engineering & Science | 33 (89.2%) | 4 (10.8%) |
| Computers & Mathematics | 13 (100.0%) | 0 (0.0%) |
| Architecture & Engineering | 11 (100.0%) | 0 (0.0%) |
| Life, Physical & Social Science | 9 (69.2%) | 4 (30.8%) |
| Community & Social Service | 22 (19.6%) | 90 (80.4%) |
| Education, Arts & Media | 4 (19.1%) | 17 (80.9%) |
| Legal Services & Support | 0 (0.0%) | 0 (0.0%) |
| Education Instruction & Library | 10 (13.7%) | 63 (86.3%) |
| Arts, Media & Entertainment | 8 (44.4%) | 10 (55.6%) |
| Health Diagnosing & Treating | 29 (47.5%) | 32 (52.5%) |
| Health Technologists | 25 (43.9%) | 32 (56.1%) |
| Total (Category) | 177 (46.5%) | 204 (53.5%) |
| Total (Overall) | 374 (47.3%) | 416 (52.7%) |
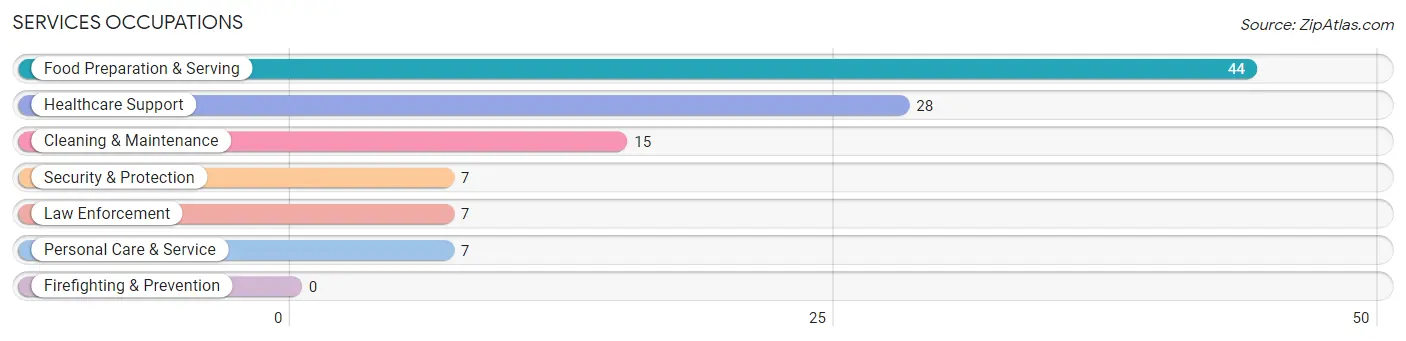
Services Occupations
The most common Services occupations in Langhorne borough are Food Preparation & Serving (44 | 5.6%), Healthcare Support (28 | 3.5%), Cleaning & Maintenance (15 | 1.9%), Security & Protection (7 | 0.9%), and Law Enforcement (7 | 0.9%).
Services Occupations by Sex
Within the Services occupations in Langhorne borough, the most male-oriented occupations are Security & Protection (100.0%), Law Enforcement (100.0%), and Cleaning & Maintenance (80.0%), while the most female-oriented occupations are Personal Care & Service (100.0%), Healthcare Support (71.4%), and Food Preparation & Serving (63.6%).
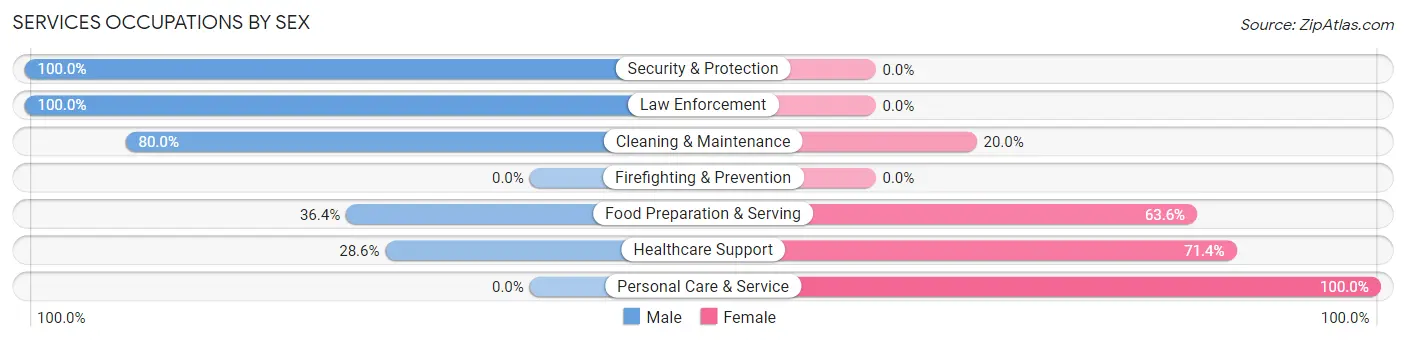
| Occupation | Male | Female |
| Healthcare Support | 8 (28.6%) | 20 (71.4%) |
| Security & Protection | 7 (100.0%) | 0 (0.0%) |
| Firefighting & Prevention | 0 (0.0%) | 0 (0.0%) |
| Law Enforcement | 7 (100.0%) | 0 (0.0%) |
| Food Preparation & Serving | 16 (36.4%) | 28 (63.6%) |
| Cleaning & Maintenance | 12 (80.0%) | 3 (20.0%) |
| Personal Care & Service | 0 (0.0%) | 7 (100.0%) |
| Total (Category) | 43 (42.6%) | 58 (57.4%) |
| Total (Overall) | 374 (47.3%) | 416 (52.7%) |
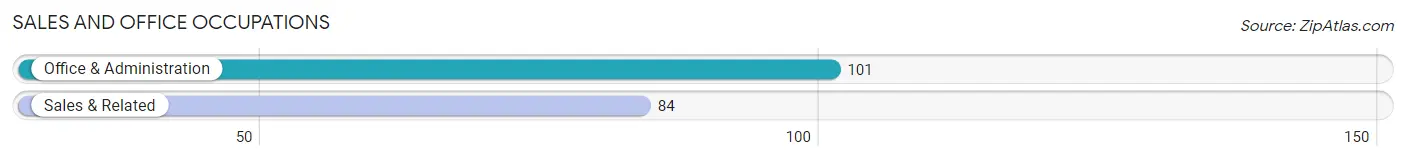
Sales and Office Occupations
The most common Sales and Office occupations in Langhorne borough are Office & Administration (101 | 12.8%), and Sales & Related (84 | 10.6%).
Sales and Office Occupations by Sex
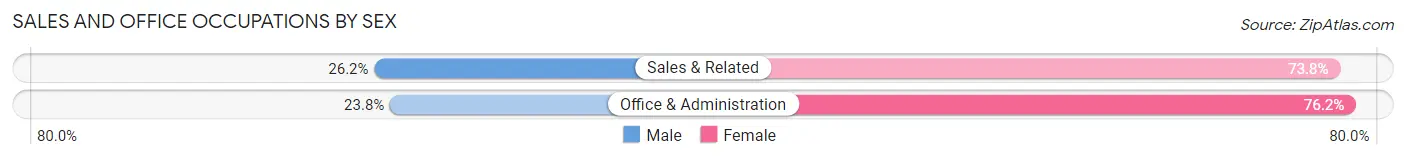
| Occupation | Male | Female |
| Sales & Related | 22 (26.2%) | 62 (73.8%) |
| Office & Administration | 24 (23.8%) | 77 (76.2%) |
| Total (Category) | 46 (24.9%) | 139 (75.1%) |
| Total (Overall) | 374 (47.3%) | 416 (52.7%) |
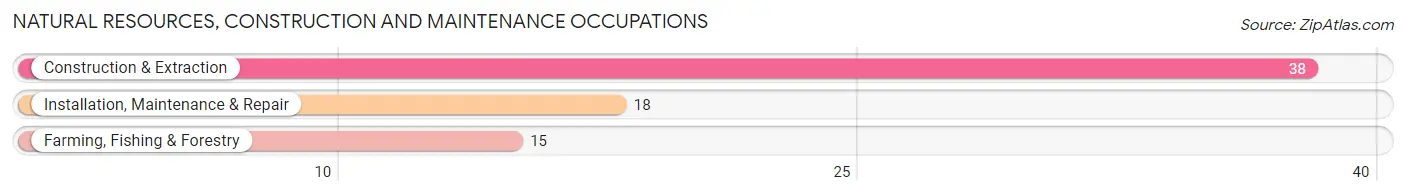
Natural Resources, Construction and Maintenance Occupations
The most common Natural Resources, Construction and Maintenance occupations in Langhorne borough are Construction & Extraction (38 | 4.8%), Installation, Maintenance & Repair (18 | 2.3%), and Farming, Fishing & Forestry (15 | 1.9%).
Natural Resources, Construction and Maintenance Occupations by Sex
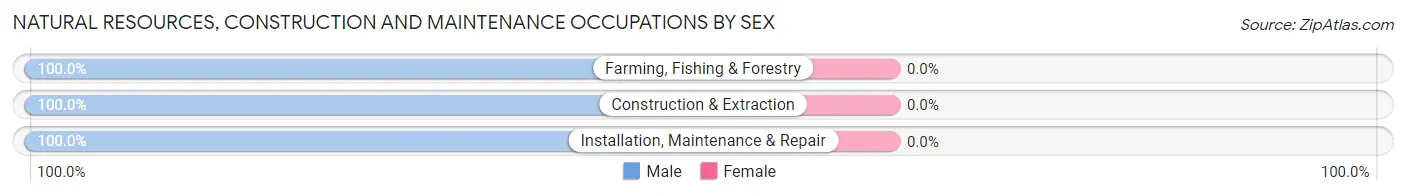
| Occupation | Male | Female |
| Farming, Fishing & Forestry | 15 (100.0%) | 0 (0.0%) |
| Construction & Extraction | 38 (100.0%) | 0 (0.0%) |
| Installation, Maintenance & Repair | 18 (100.0%) | 0 (0.0%) |
| Total (Category) | 71 (100.0%) | 0 (0.0%) |
| Total (Overall) | 374 (47.3%) | 416 (52.7%) |
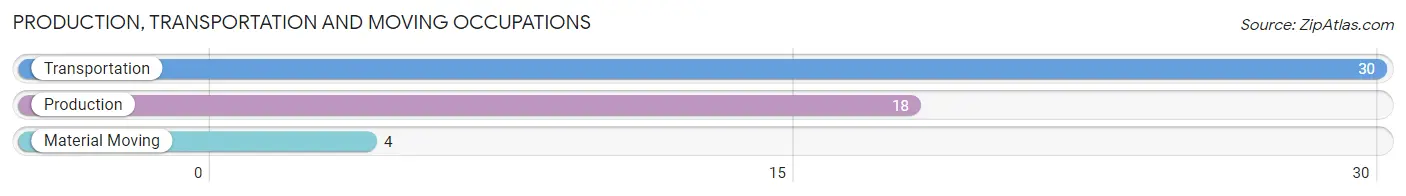
Production, Transportation and Moving Occupations
The most common Production, Transportation and Moving occupations in Langhorne borough are Transportation (30 | 3.8%), Production (18 | 2.3%), and Material Moving (4 | 0.5%).
Production, Transportation and Moving Occupations by Sex
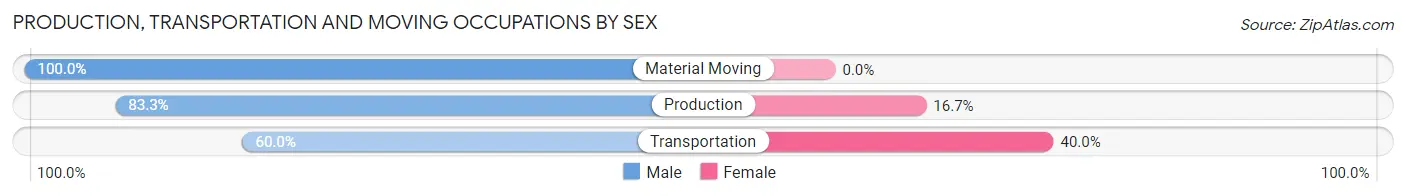
| Occupation | Male | Female |
| Production | 15 (83.3%) | 3 (16.7%) |
| Transportation | 18 (60.0%) | 12 (40.0%) |
| Material Moving | 4 (100.0%) | 0 (0.0%) |
| Total (Category) | 37 (71.2%) | 15 (28.8%) |
| Total (Overall) | 374 (47.3%) | 416 (52.7%) |
Employment Industries by Sex in Langhorne borough
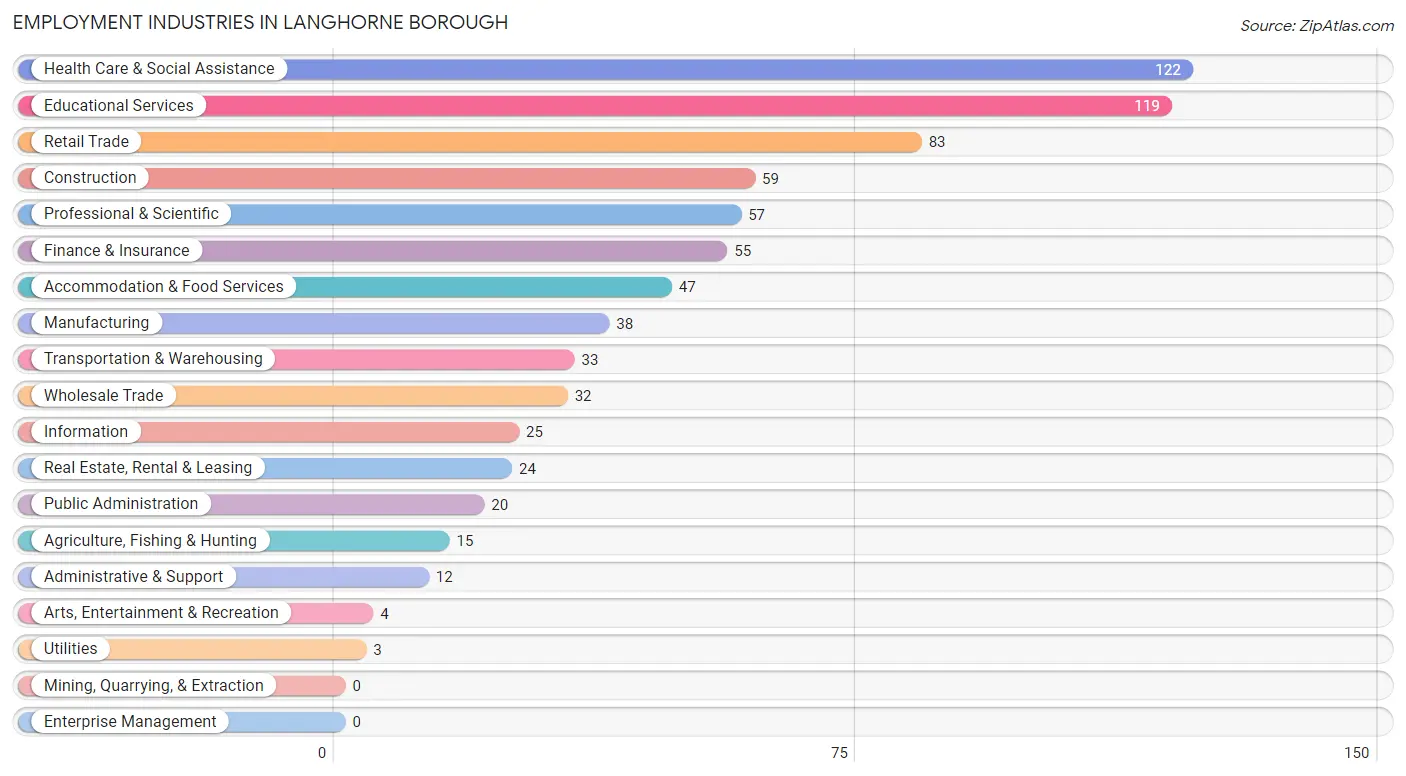
Employment Industries in Langhorne borough
The major employment industries in Langhorne borough include Health Care & Social Assistance (122 | 15.4%), Educational Services (119 | 15.1%), Retail Trade (83 | 10.5%), Construction (59 | 7.5%), and Professional & Scientific (57 | 7.2%).
Employment Industries by Sex in Langhorne borough
The Langhorne borough industries that see more men than women are Agriculture, Fishing & Hunting (100.0%), Utilities (100.0%), and Administrative & Support (100.0%), whereas the industries that tend to have a higher number of women are Wholesale Trade (87.5%), Information (84.0%), and Educational Services (72.3%).
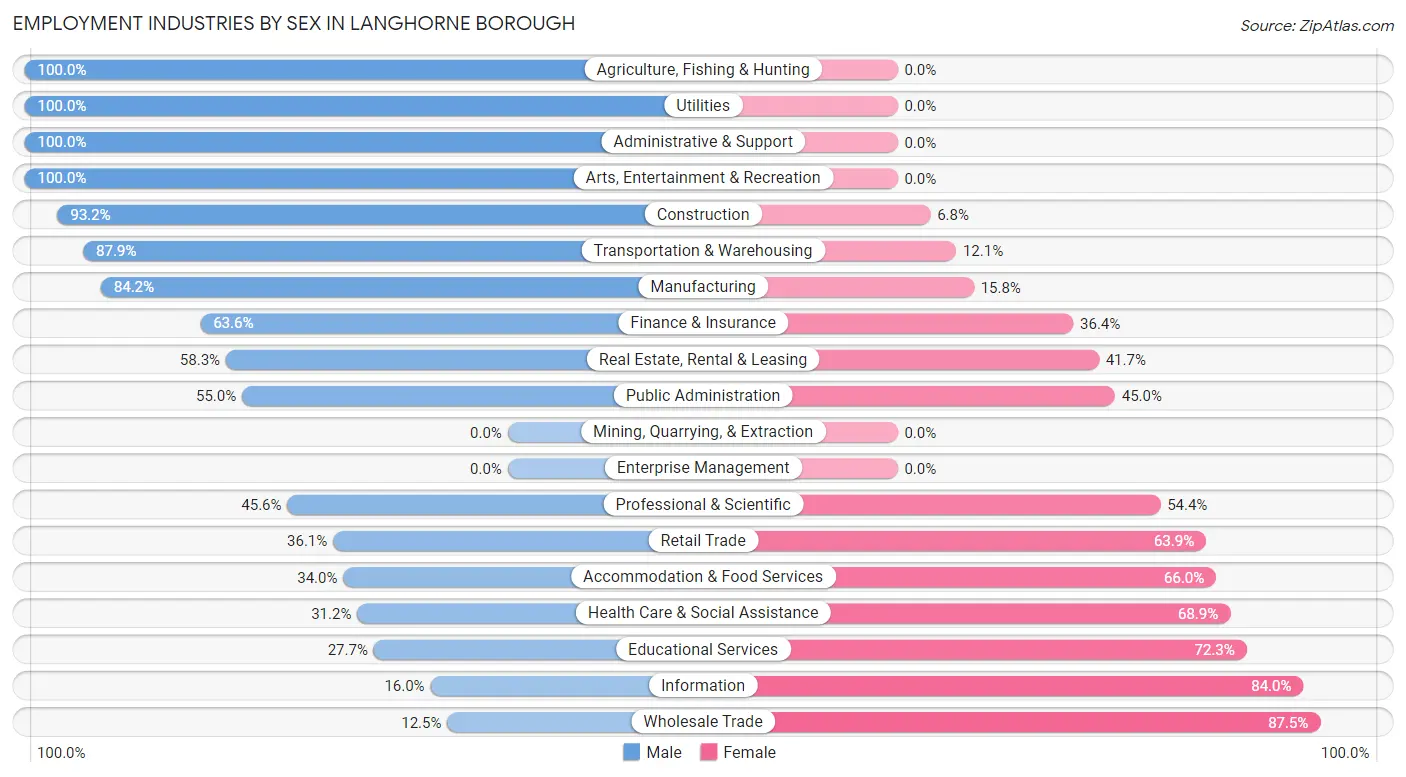
| Industry | Male | Female |
| Agriculture, Fishing & Hunting | 15 (100.0%) | 0 (0.0%) |
| Mining, Quarrying, & Extraction | 0 (0.0%) | 0 (0.0%) |
| Construction | 55 (93.2%) | 4 (6.8%) |
| Manufacturing | 32 (84.2%) | 6 (15.8%) |
| Wholesale Trade | 4 (12.5%) | 28 (87.5%) |
| Retail Trade | 30 (36.1%) | 53 (63.9%) |
| Transportation & Warehousing | 29 (87.9%) | 4 (12.1%) |
| Utilities | 3 (100.0%) | 0 (0.0%) |
| Information | 4 (16.0%) | 21 (84.0%) |
| Finance & Insurance | 35 (63.6%) | 20 (36.4%) |
| Real Estate, Rental & Leasing | 14 (58.3%) | 10 (41.7%) |
| Professional & Scientific | 26 (45.6%) | 31 (54.4%) |
| Enterprise Management | 0 (0.0%) | 0 (0.0%) |
| Administrative & Support | 12 (100.0%) | 0 (0.0%) |
| Educational Services | 33 (27.7%) | 86 (72.3%) |
| Health Care & Social Assistance | 38 (31.1%) | 84 (68.9%) |
| Arts, Entertainment & Recreation | 4 (100.0%) | 0 (0.0%) |
| Accommodation & Food Services | 16 (34.0%) | 31 (66.0%) |
| Public Administration | 11 (55.0%) | 9 (45.0%) |
| Total | 374 (47.3%) | 416 (52.7%) |
Education in Langhorne borough
School Enrollment in Langhorne borough
The most common levels of schooling among the 308 students in Langhorne borough are college / undergraduate (89 | 28.9%), middle school (66 | 21.4%), and high school (57 | 18.5%).
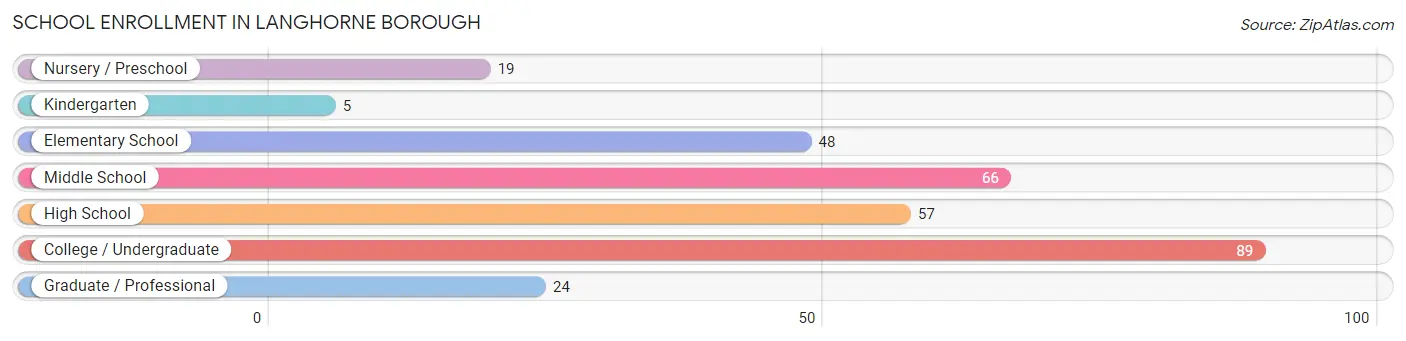
| School Level | # Students | % Students |
| Nursery / Preschool | 19 | 6.2% |
| Kindergarten | 5 | 1.6% |
| Elementary School | 48 | 15.6% |
| Middle School | 66 | 21.4% |
| High School | 57 | 18.5% |
| College / Undergraduate | 89 | 28.9% |
| Graduate / Professional | 24 | 7.8% |
| Total | 308 | 100.0% |
School Enrollment by Age by Funding Source in Langhorne borough
Out of a total of 308 students who are enrolled in schools in Langhorne borough, 92 (29.9%) attend a private institution, while the remaining 216 (70.1%) are enrolled in public schools. The age group of 3 to 4 year olds has the highest likelihood of being enrolled in private schools, with 14 (100.0% in the age bracket) enrolled. Conversely, the age group of 15 to 17 year olds has the lowest likelihood of being enrolled in a private school, with 51 (100.0% in the age bracket) attending a public institution.
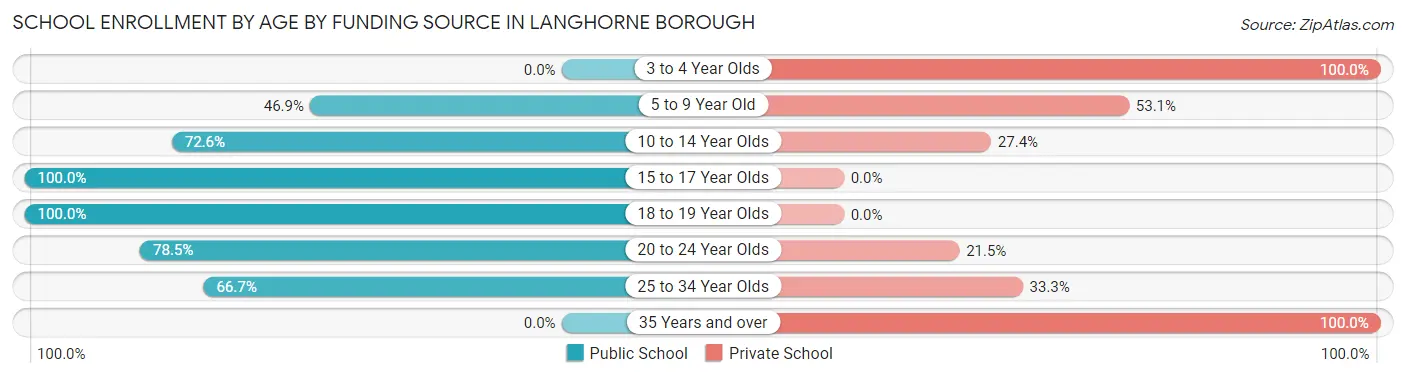
| Age Bracket | Public School | Private School |
| 3 to 4 Year Olds | 0 (0.0%) | 14 (100.0%) |
| 5 to 9 Year Old | 30 (46.9%) | 34 (53.1%) |
| 10 to 14 Year Olds | 45 (72.6%) | 17 (27.4%) |
| 15 to 17 Year Olds | 51 (100.0%) | 0 (0.0%) |
| 18 to 19 Year Olds | 14 (100.0%) | 0 (0.0%) |
| 20 to 24 Year Olds | 62 (78.5%) | 17 (21.5%) |
| 25 to 34 Year Olds | 14 (66.7%) | 7 (33.3%) |
| 35 Years and over | 0 (0.0%) | 3 (100.0%) |
| Total | 216 (70.1%) | 92 (29.9%) |
Educational Attainment by Field of Study in Langhorne borough
Education (102 | 23.2%), business (85 | 19.3%), science & technology (48 | 10.9%), bio, nature & agricultural (34 | 7.7%), and communications (27 | 6.1%) are the most common fields of study among 440 individuals in Langhorne borough who have obtained a bachelor's degree or higher.
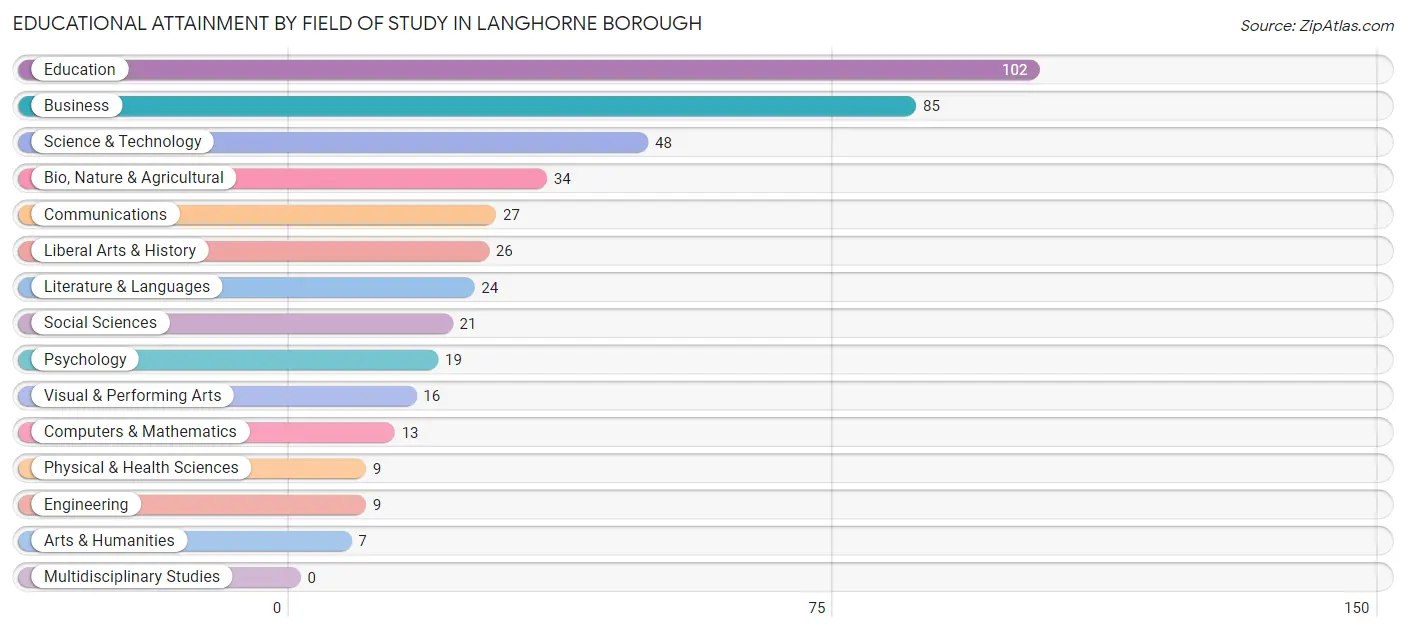
| Field of Study | # Graduates | % Graduates |
| Computers & Mathematics | 13 | 2.9% |
| Bio, Nature & Agricultural | 34 | 7.7% |
| Physical & Health Sciences | 9 | 2.1% |
| Psychology | 19 | 4.3% |
| Social Sciences | 21 | 4.8% |
| Engineering | 9 | 2.1% |
| Multidisciplinary Studies | 0 | 0.0% |
| Science & Technology | 48 | 10.9% |
| Business | 85 | 19.3% |
| Education | 102 | 23.2% |
| Literature & Languages | 24 | 5.4% |
| Liberal Arts & History | 26 | 5.9% |
| Visual & Performing Arts | 16 | 3.6% |
| Communications | 27 | 6.1% |
| Arts & Humanities | 7 | 1.6% |
| Total | 440 | 100.0% |
Transportation & Commute in Langhorne borough
Vehicle Availability by Sex in Langhorne borough
The most prevalent vehicle ownership categories in Langhorne borough are males with 2 vehicles (199, accounting for 53.9%) and females with 2 vehicles (177, making up 47.8%).
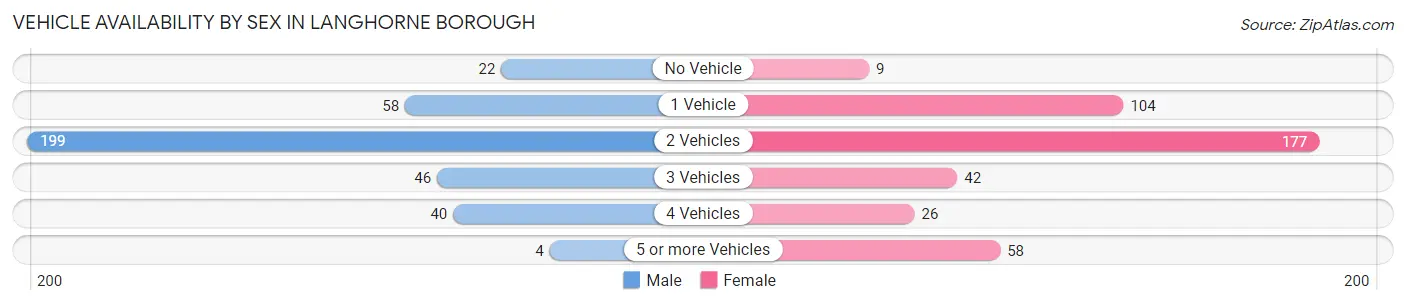
| Vehicles Available | Male | Female |
| No Vehicle | 22 (6.0%) | 9 (2.2%) |
| 1 Vehicle | 58 (15.7%) | 104 (25.0%) |
| 2 Vehicles | 199 (53.9%) | 177 (42.5%) |
| 3 Vehicles | 46 (12.5%) | 42 (10.1%) |
| 4 Vehicles | 40 (10.8%) | 26 (6.2%) |
| 5 or more Vehicles | 4 (1.1%) | 58 (13.9%) |
| Total | 369 (100.0%) | 416 (100.0%) |
Commute Time in Langhorne borough
The most frequently occuring commute durations in Langhorne borough are 15 to 19 minutes (163 commuters, 23.3%), 10 to 14 minutes (122 commuters, 17.4%), and 25 to 29 minutes (101 commuters, 14.4%).
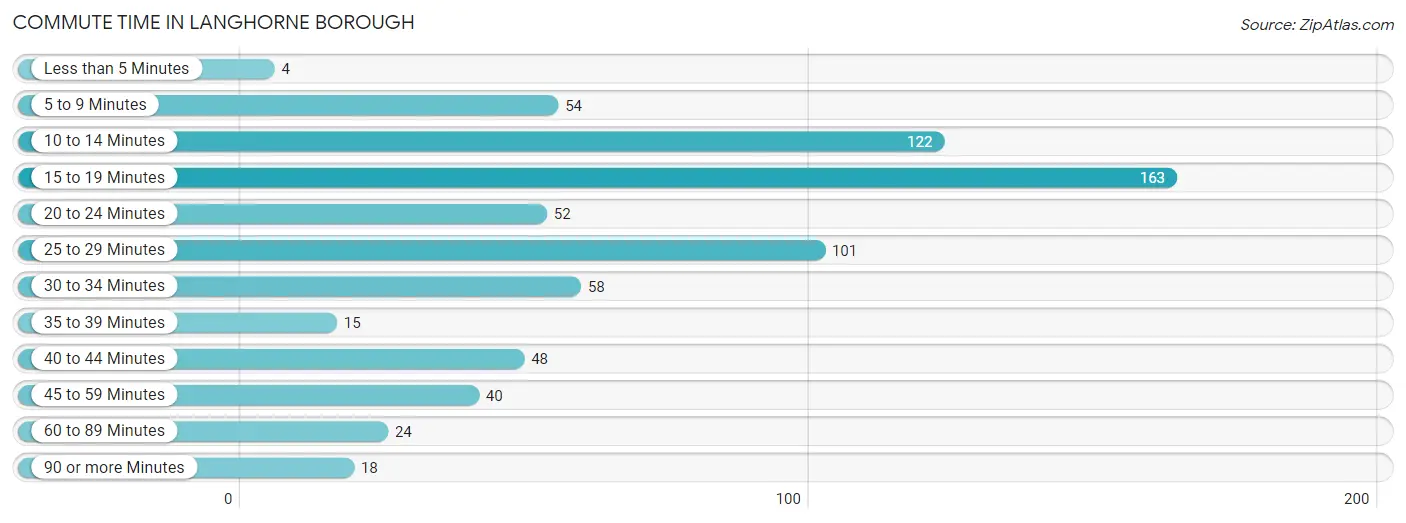
| Commute Time | # Commuters | % Commuters |
| Less than 5 Minutes | 4 | 0.6% |
| 5 to 9 Minutes | 54 | 7.7% |
| 10 to 14 Minutes | 122 | 17.4% |
| 15 to 19 Minutes | 163 | 23.3% |
| 20 to 24 Minutes | 52 | 7.4% |
| 25 to 29 Minutes | 101 | 14.4% |
| 30 to 34 Minutes | 58 | 8.3% |
| 35 to 39 Minutes | 15 | 2.1% |
| 40 to 44 Minutes | 48 | 6.9% |
| 45 to 59 Minutes | 40 | 5.7% |
| 60 to 89 Minutes | 24 | 3.4% |
| 90 or more Minutes | 18 | 2.6% |
Commute Time by Sex in Langhorne borough
The most common commute times in Langhorne borough are 10 to 14 minutes (100 commuters, 30.9%) for males and 15 to 19 minutes (95 commuters, 25.3%) for females.
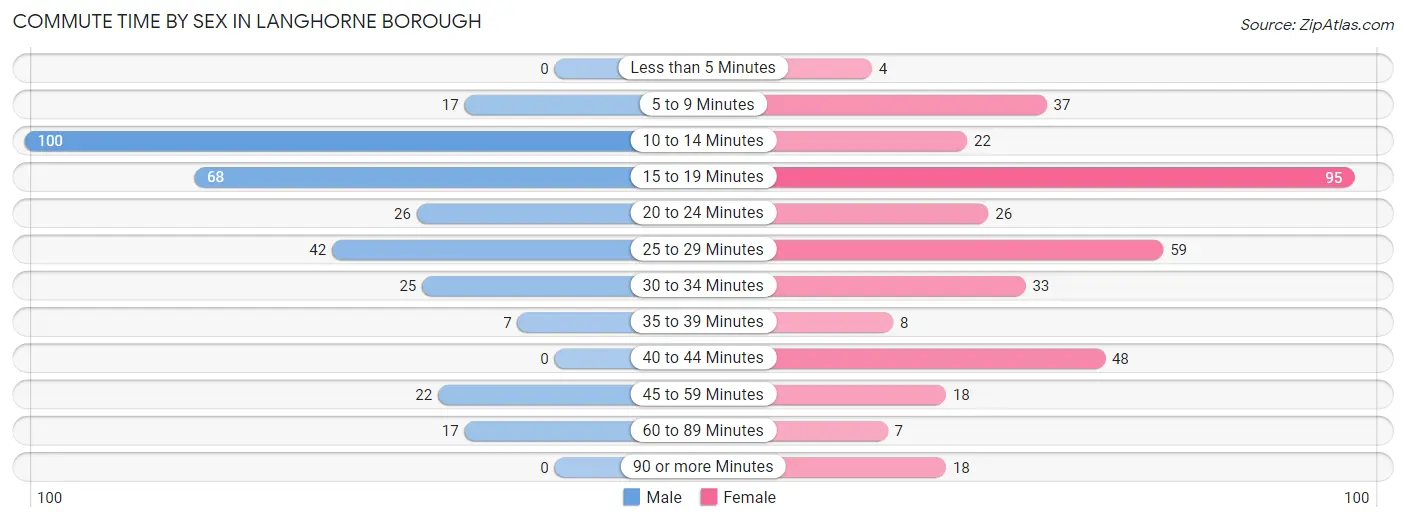
| Commute Time | Male | Female |
| Less than 5 Minutes | 0 (0.0%) | 4 (1.1%) |
| 5 to 9 Minutes | 17 (5.2%) | 37 (9.9%) |
| 10 to 14 Minutes | 100 (30.9%) | 22 (5.9%) |
| 15 to 19 Minutes | 68 (21.0%) | 95 (25.3%) |
| 20 to 24 Minutes | 26 (8.0%) | 26 (6.9%) |
| 25 to 29 Minutes | 42 (13.0%) | 59 (15.7%) |
| 30 to 34 Minutes | 25 (7.7%) | 33 (8.8%) |
| 35 to 39 Minutes | 7 (2.2%) | 8 (2.1%) |
| 40 to 44 Minutes | 0 (0.0%) | 48 (12.8%) |
| 45 to 59 Minutes | 22 (6.8%) | 18 (4.8%) |
| 60 to 89 Minutes | 17 (5.2%) | 7 (1.9%) |
| 90 or more Minutes | 0 (0.0%) | 18 (4.8%) |
Time of Departure to Work by Sex in Langhorne borough
The most frequent times of departure to work in Langhorne borough are 6:00 AM to 6:29 AM (45, 13.9%) for males and 8:30 AM to 8:59 AM (87, 23.2%) for females.
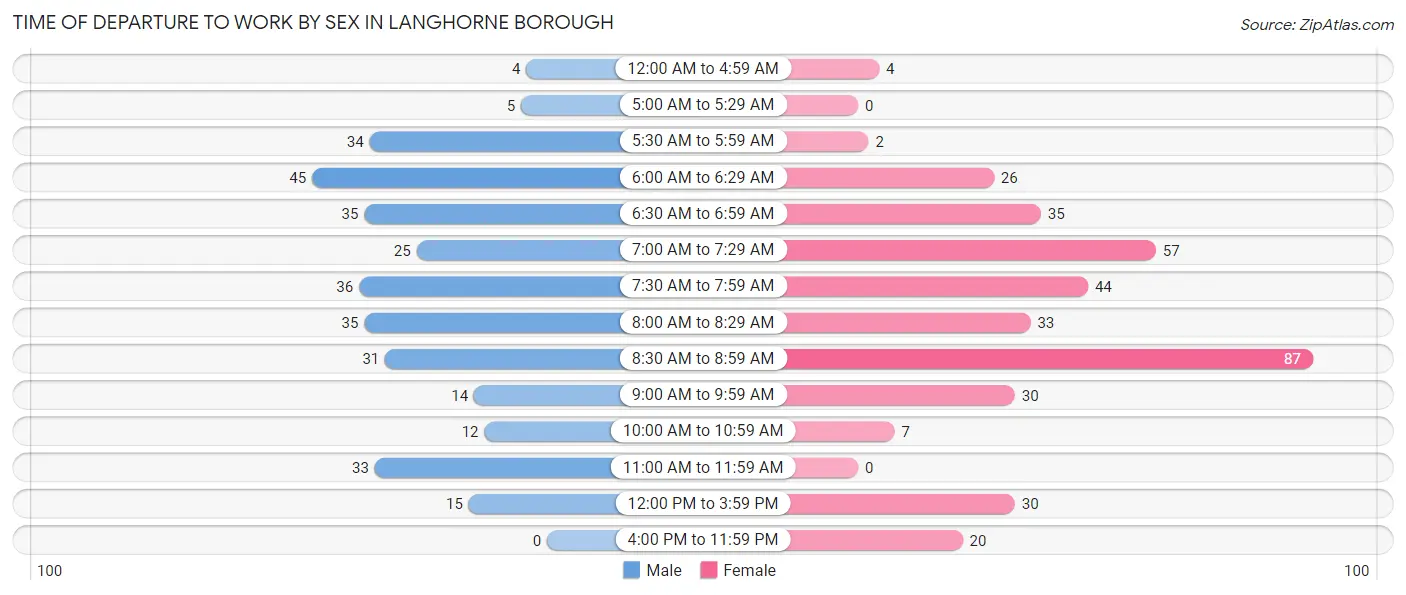
| Time of Departure | Male | Female |
| 12:00 AM to 4:59 AM | 4 (1.2%) | 4 (1.1%) |
| 5:00 AM to 5:29 AM | 5 (1.5%) | 0 (0.0%) |
| 5:30 AM to 5:59 AM | 34 (10.5%) | 2 (0.5%) |
| 6:00 AM to 6:29 AM | 45 (13.9%) | 26 (6.9%) |
| 6:30 AM to 6:59 AM | 35 (10.8%) | 35 (9.3%) |
| 7:00 AM to 7:29 AM | 25 (7.7%) | 57 (15.2%) |
| 7:30 AM to 7:59 AM | 36 (11.1%) | 44 (11.7%) |
| 8:00 AM to 8:29 AM | 35 (10.8%) | 33 (8.8%) |
| 8:30 AM to 8:59 AM | 31 (9.6%) | 87 (23.2%) |
| 9:00 AM to 9:59 AM | 14 (4.3%) | 30 (8.0%) |
| 10:00 AM to 10:59 AM | 12 (3.7%) | 7 (1.9%) |
| 11:00 AM to 11:59 AM | 33 (10.2%) | 0 (0.0%) |
| 12:00 PM to 3:59 PM | 15 (4.6%) | 30 (8.0%) |
| 4:00 PM to 11:59 PM | 0 (0.0%) | 20 (5.3%) |
| Total | 324 (100.0%) | 375 (100.0%) |
Housing Occupancy in Langhorne borough
Occupancy by Ownership in Langhorne borough
Of the total 591 dwellings in Langhorne borough, owner-occupied units account for 309 (52.3%), while renter-occupied units make up 282 (47.7%).
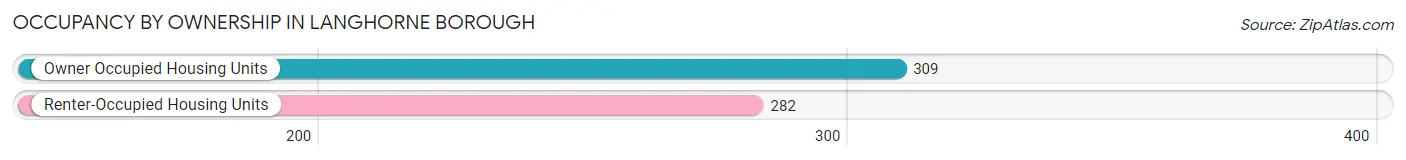
| Occupancy | # Housing Units | % Housing Units |
| Owner Occupied Housing Units | 309 | 52.3% |
| Renter-Occupied Housing Units | 282 | 47.7% |
| Total Occupied Housing Units | 591 | 100.0% |
Occupancy by Household Size in Langhorne borough
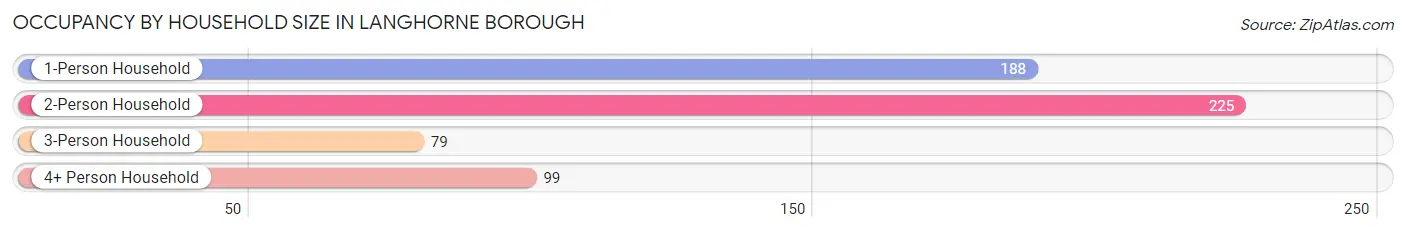
| Household Size | # Housing Units | % Housing Units |
| 1-Person Household | 188 | 31.8% |
| 2-Person Household | 225 | 38.1% |
| 3-Person Household | 79 | 13.4% |
| 4+ Person Household | 99 | 16.8% |
| Total Housing Units | 591 | 100.0% |
Occupancy by Ownership by Household Size in Langhorne borough
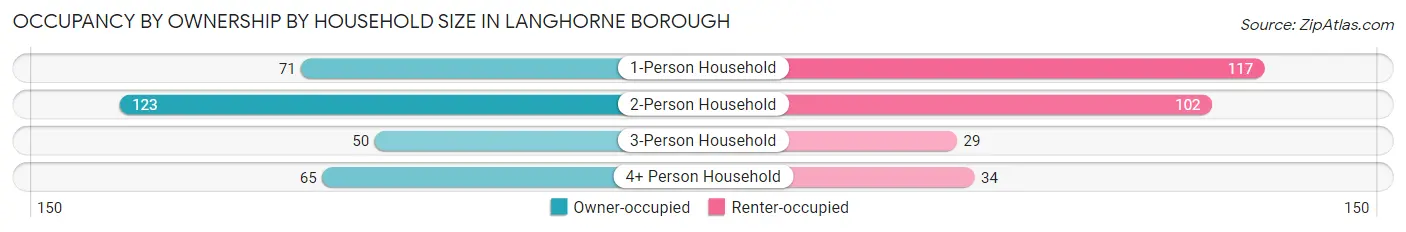
| Household Size | Owner-occupied | Renter-occupied |
| 1-Person Household | 71 (37.8%) | 117 (62.2%) |
| 2-Person Household | 123 (54.7%) | 102 (45.3%) |
| 3-Person Household | 50 (63.3%) | 29 (36.7%) |
| 4+ Person Household | 65 (65.7%) | 34 (34.3%) |
| Total Housing Units | 309 (52.3%) | 282 (47.7%) |
Occupancy by Educational Attainment in Langhorne borough
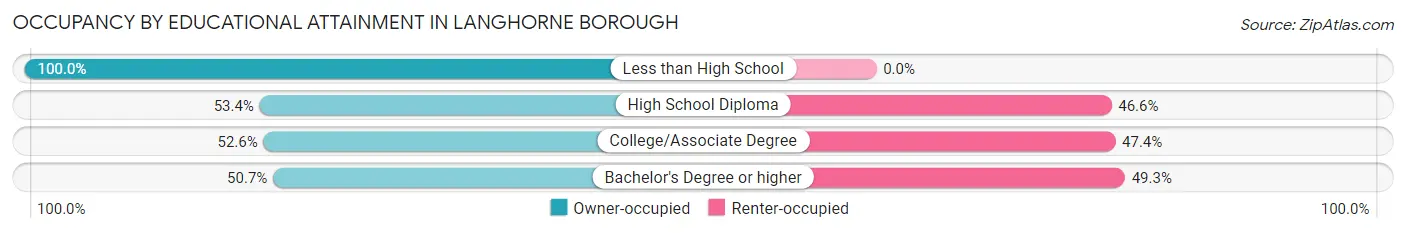
| Household Size | Owner-occupied | Renter-occupied |
| Less than High School | 5 (100.0%) | 0 (0.0%) |
| High School Diploma | 63 (53.4%) | 55 (46.6%) |
| College/Associate Degree | 100 (52.6%) | 90 (47.4%) |
| Bachelor's Degree or higher | 141 (50.7%) | 137 (49.3%) |
Occupancy by Age of Householder in Langhorne borough
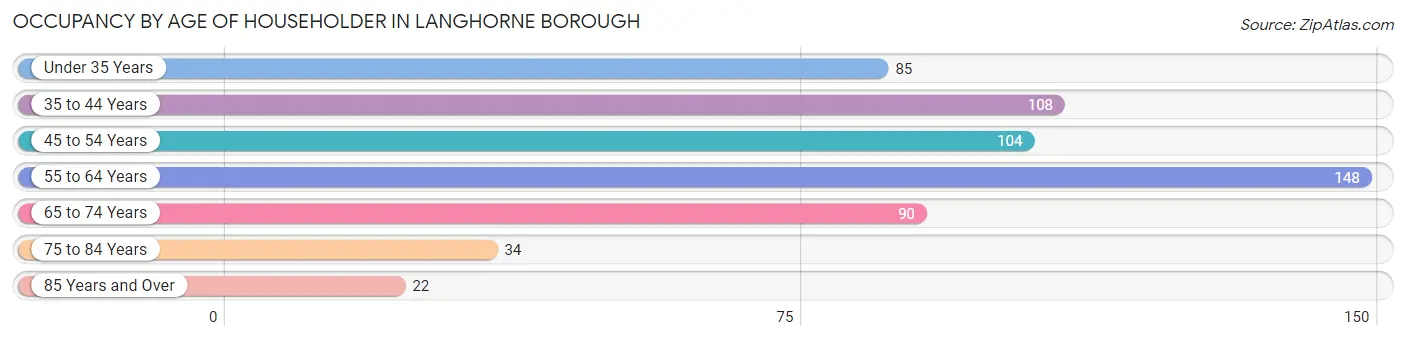
| Age Bracket | # Households | % Households |
| Under 35 Years | 85 | 14.4% |
| 35 to 44 Years | 108 | 18.3% |
| 45 to 54 Years | 104 | 17.6% |
| 55 to 64 Years | 148 | 25.0% |
| 65 to 74 Years | 90 | 15.2% |
| 75 to 84 Years | 34 | 5.8% |
| 85 Years and Over | 22 | 3.7% |
| Total | 591 | 100.0% |
Housing Finances in Langhorne borough
Median Income by Occupancy in Langhorne borough
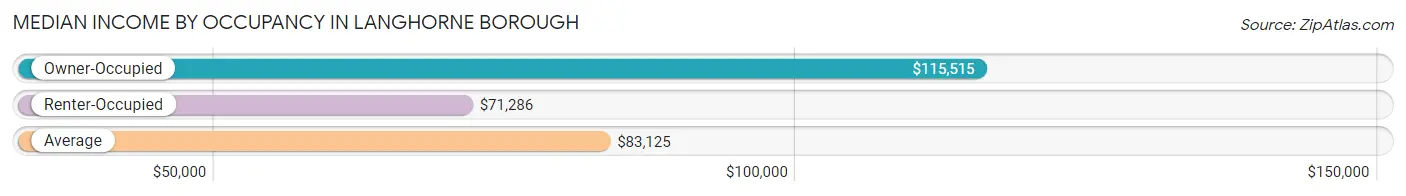
| Occupancy Type | # Households | Median Income |
| Owner-Occupied | 309 (52.3%) | $115,515 |
| Renter-Occupied | 282 (47.7%) | $71,286 |
| Average | 591 (100.0%) | $83,125 |
Occupancy by Householder Income Bracket in Langhorne borough
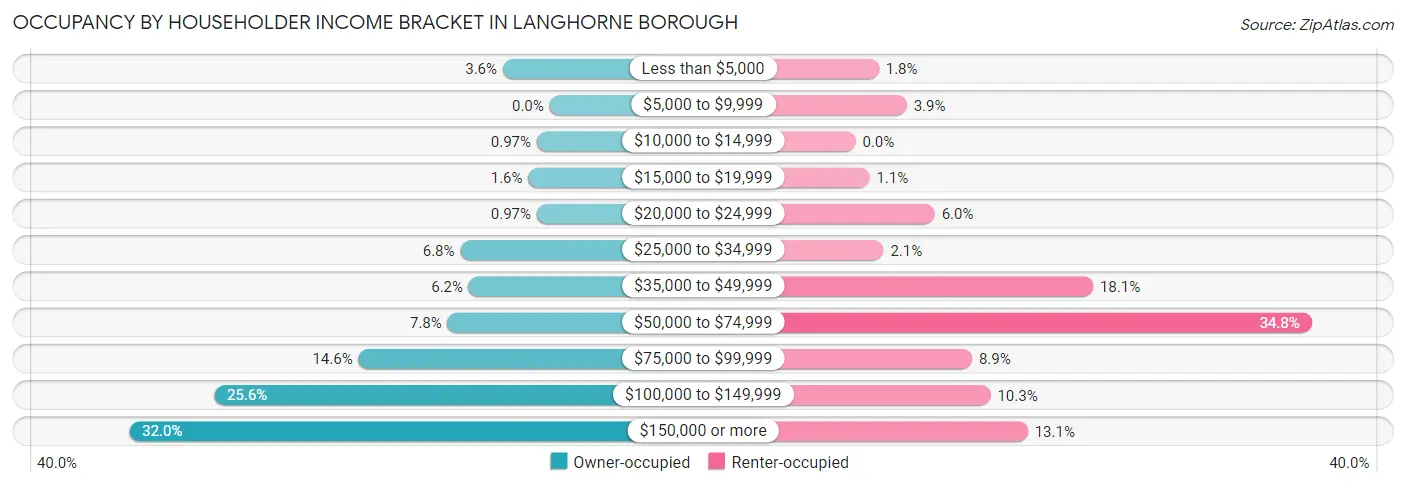
| Income Bracket | Owner-occupied | Renter-occupied |
| Less than $5,000 | 11 (3.6%) | 5 (1.8%) |
| $5,000 to $9,999 | 0 (0.0%) | 11 (3.9%) |
| $10,000 to $14,999 | 3 (1.0%) | 0 (0.0%) |
| $15,000 to $19,999 | 5 (1.6%) | 3 (1.1%) |
| $20,000 to $24,999 | 3 (1.0%) | 17 (6.0%) |
| $25,000 to $34,999 | 21 (6.8%) | 6 (2.1%) |
| $35,000 to $49,999 | 19 (6.1%) | 51 (18.1%) |
| $50,000 to $74,999 | 24 (7.8%) | 98 (34.7%) |
| $75,000 to $99,999 | 45 (14.6%) | 25 (8.9%) |
| $100,000 to $149,999 | 79 (25.6%) | 29 (10.3%) |
| $150,000 or more | 99 (32.0%) | 37 (13.1%) |
| Total | 309 (100.0%) | 282 (100.0%) |
Monthly Housing Cost Tiers in Langhorne borough
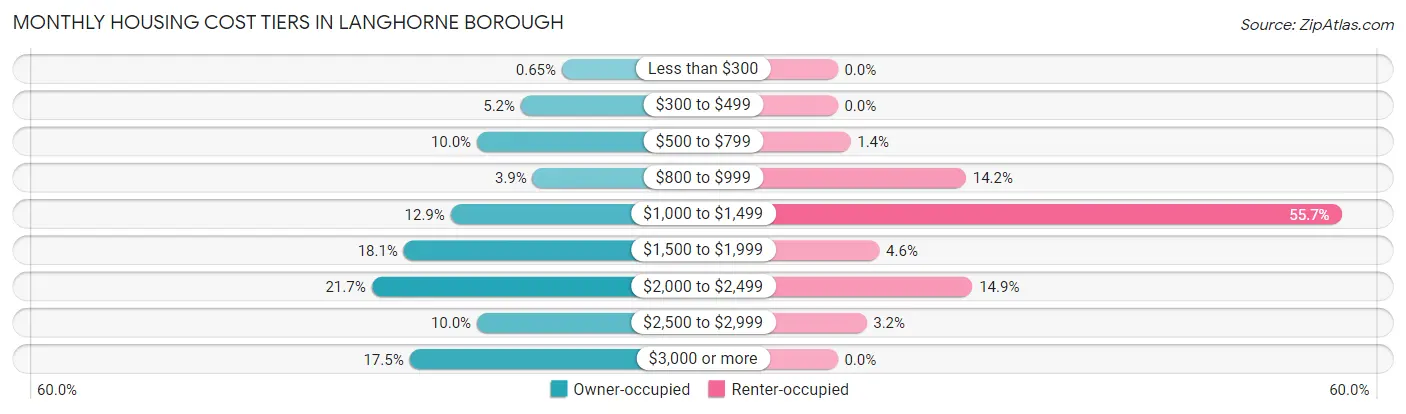
| Monthly Cost | Owner-occupied | Renter-occupied |
| Less than $300 | 2 (0.6%) | 0 (0.0%) |
| $300 to $499 | 16 (5.2%) | 0 (0.0%) |
| $500 to $799 | 31 (10.0%) | 4 (1.4%) |
| $800 to $999 | 12 (3.9%) | 40 (14.2%) |
| $1,000 to $1,499 | 40 (12.9%) | 157 (55.7%) |
| $1,500 to $1,999 | 56 (18.1%) | 13 (4.6%) |
| $2,000 to $2,499 | 67 (21.7%) | 42 (14.9%) |
| $2,500 to $2,999 | 31 (10.0%) | 9 (3.2%) |
| $3,000 or more | 54 (17.5%) | 0 (0.0%) |
| Total | 309 (100.0%) | 282 (100.0%) |
Physical Housing Characteristics in Langhorne borough
Housing Structures in Langhorne borough
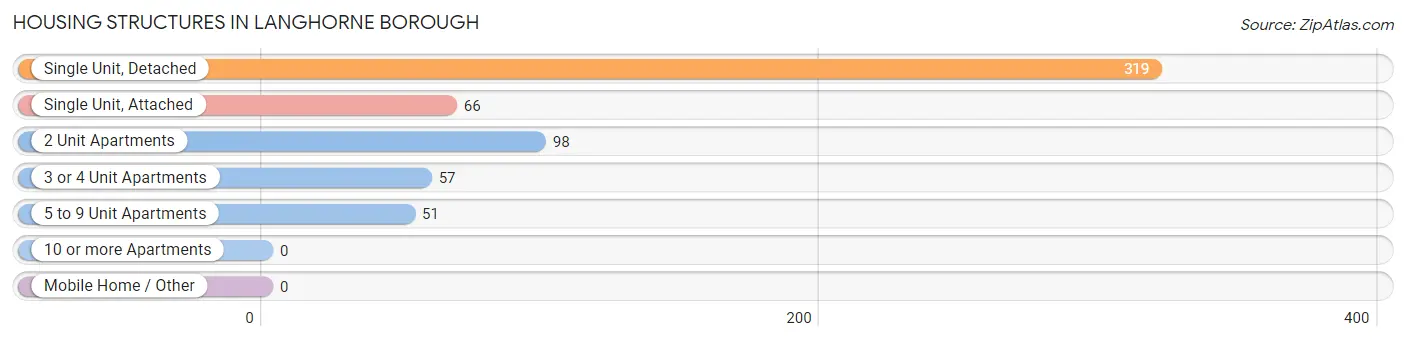
| Structure Type | # Housing Units | % Housing Units |
| Single Unit, Detached | 319 | 54.0% |
| Single Unit, Attached | 66 | 11.2% |
| 2 Unit Apartments | 98 | 16.6% |
| 3 or 4 Unit Apartments | 57 | 9.6% |
| 5 to 9 Unit Apartments | 51 | 8.6% |
| 10 or more Apartments | 0 | 0.0% |
| Mobile Home / Other | 0 | 0.0% |
| Total | 591 | 100.0% |
Housing Structures by Occupancy in Langhorne borough
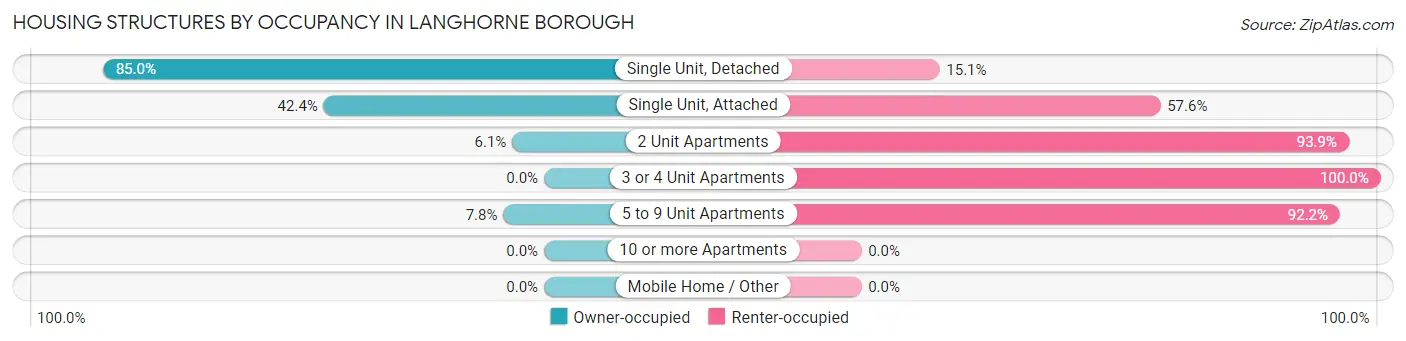
| Structure Type | Owner-occupied | Renter-occupied |
| Single Unit, Detached | 271 (85.0%) | 48 (15.0%) |
| Single Unit, Attached | 28 (42.4%) | 38 (57.6%) |
| 2 Unit Apartments | 6 (6.1%) | 92 (93.9%) |
| 3 or 4 Unit Apartments | 0 (0.0%) | 57 (100.0%) |
| 5 to 9 Unit Apartments | 4 (7.8%) | 47 (92.2%) |
| 10 or more Apartments | 0 (0.0%) | 0 (0.0%) |
| Mobile Home / Other | 0 (0.0%) | 0 (0.0%) |
| Total | 309 (52.3%) | 282 (47.7%) |
Housing Structures by Number of Rooms in Langhorne borough
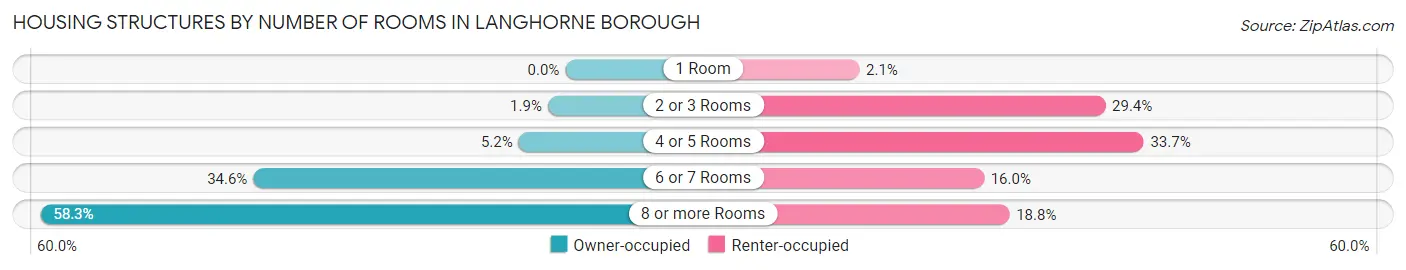
| Number of Rooms | Owner-occupied | Renter-occupied |
| 1 Room | 0 (0.0%) | 6 (2.1%) |
| 2 or 3 Rooms | 6 (1.9%) | 83 (29.4%) |
| 4 or 5 Rooms | 16 (5.2%) | 95 (33.7%) |
| 6 or 7 Rooms | 107 (34.6%) | 45 (16.0%) |
| 8 or more Rooms | 180 (58.3%) | 53 (18.8%) |
| Total | 309 (100.0%) | 282 (100.0%) |
Housing Structure by Heating Type in Langhorne borough
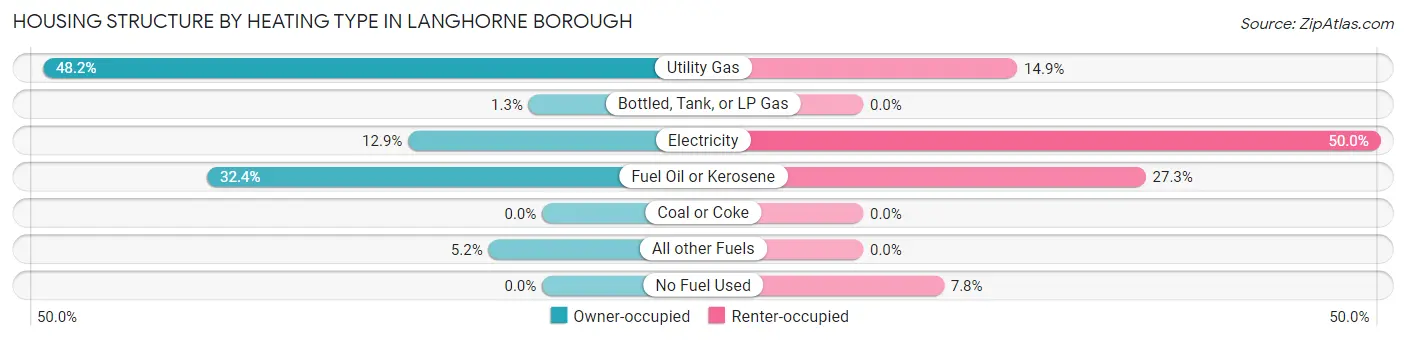
| Heating Type | Owner-occupied | Renter-occupied |
| Utility Gas | 149 (48.2%) | 42 (14.9%) |
| Bottled, Tank, or LP Gas | 4 (1.3%) | 0 (0.0%) |
| Electricity | 40 (12.9%) | 141 (50.0%) |
| Fuel Oil or Kerosene | 100 (32.4%) | 77 (27.3%) |
| Coal or Coke | 0 (0.0%) | 0 (0.0%) |
| All other Fuels | 16 (5.2%) | 0 (0.0%) |
| No Fuel Used | 0 (0.0%) | 22 (7.8%) |
| Total | 309 (100.0%) | 282 (100.0%) |
Household Vehicle Usage in Langhorne borough
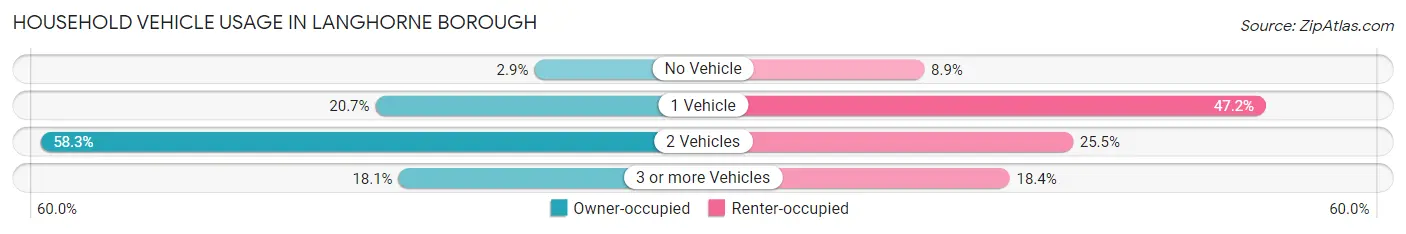
| Vehicles per Household | Owner-occupied | Renter-occupied |
| No Vehicle | 9 (2.9%) | 25 (8.9%) |
| 1 Vehicle | 64 (20.7%) | 133 (47.2%) |
| 2 Vehicles | 180 (58.3%) | 72 (25.5%) |
| 3 or more Vehicles | 56 (18.1%) | 52 (18.4%) |
| Total | 309 (100.0%) | 282 (100.0%) |
Real Estate & Mortgages in Langhorne borough
Real Estate and Mortgage Overview in Langhorne borough
| Characteristic | Without Mortgage | With Mortgage |
| Housing Units | 91 | 218 |
| Median Property Value | $371,100 | $424,700 |
| Median Household Income | $82,083 | $83 |
| Monthly Housing Costs | $775 | $54 |
| Real Estate Taxes | $4,794 | $0 |
Property Value by Mortgage Status in Langhorne borough
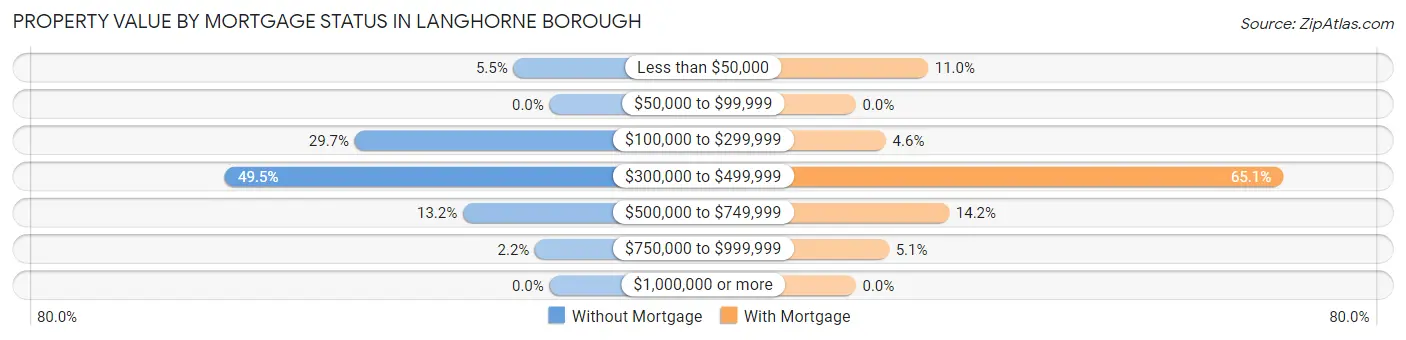
| Property Value | Without Mortgage | With Mortgage |
| Less than $50,000 | 5 (5.5%) | 24 (11.0%) |
| $50,000 to $99,999 | 0 (0.0%) | 0 (0.0%) |
| $100,000 to $299,999 | 27 (29.7%) | 10 (4.6%) |
| $300,000 to $499,999 | 45 (49.4%) | 142 (65.1%) |
| $500,000 to $749,999 | 12 (13.2%) | 31 (14.2%) |
| $750,000 to $999,999 | 2 (2.2%) | 11 (5.1%) |
| $1,000,000 or more | 0 (0.0%) | 0 (0.0%) |
| Total | 91 (100.0%) | 218 (100.0%) |
Household Income by Mortgage Status in Langhorne borough
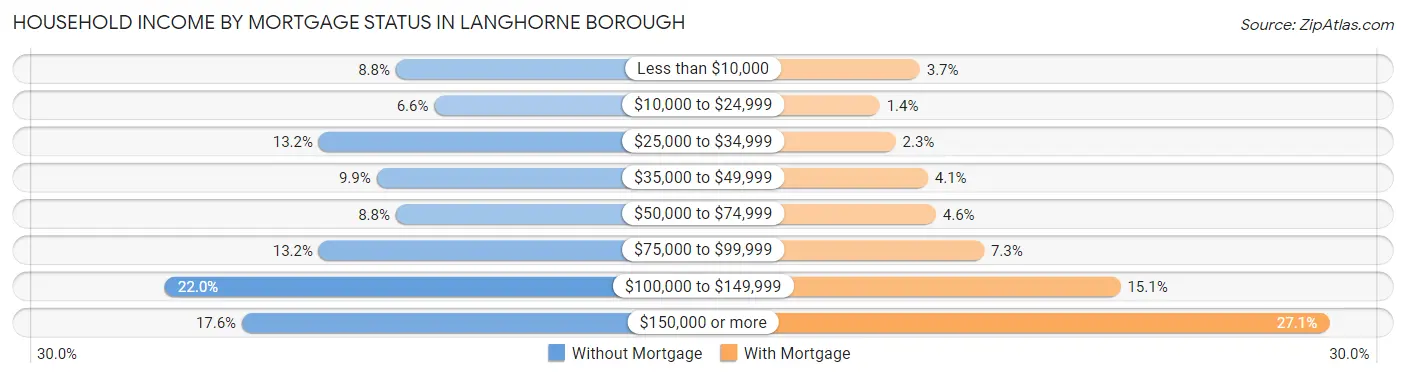
| Household Income | Without Mortgage | With Mortgage |
| Less than $10,000 | 8 (8.8%) | 8 (3.7%) |
| $10,000 to $24,999 | 6 (6.6%) | 3 (1.4%) |
| $25,000 to $34,999 | 12 (13.2%) | 5 (2.3%) |
| $35,000 to $49,999 | 9 (9.9%) | 9 (4.1%) |
| $50,000 to $74,999 | 8 (8.8%) | 10 (4.6%) |
| $75,000 to $99,999 | 12 (13.2%) | 16 (7.3%) |
| $100,000 to $149,999 | 20 (22.0%) | 33 (15.1%) |
| $150,000 or more | 16 (17.6%) | 59 (27.1%) |
| Total | 91 (100.0%) | 218 (100.0%) |
Property Value to Household Income Ratio in Langhorne borough
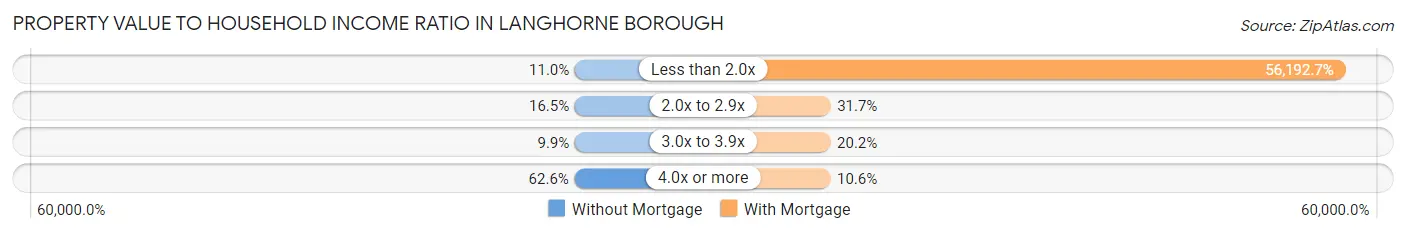
| Value-to-Income Ratio | Without Mortgage | With Mortgage |
| Less than 2.0x | 10 (11.0%) | 122,500 (56,192.7%) |
| 2.0x to 2.9x | 15 (16.5%) | 69 (31.7%) |
| 3.0x to 3.9x | 9 (9.9%) | 44 (20.2%) |
| 4.0x or more | 57 (62.6%) | 23 (10.5%) |
| Total | 91 (100.0%) | 218 (100.0%) |
Real Estate Taxes by Mortgage Status in Langhorne borough
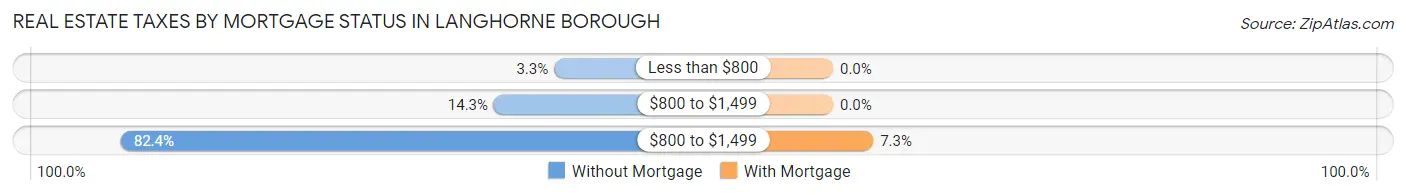
| Property Taxes | Without Mortgage | With Mortgage |
| Less than $800 | 3 (3.3%) | 0 (0.0%) |
| $800 to $1,499 | 13 (14.3%) | 0 (0.0%) |
| $800 to $1,499 | 75 (82.4%) | 16 (7.3%) |
| Total | 91 (100.0%) | 218 (100.0%) |
Health & Disability in Langhorne borough
Health Insurance Coverage by Age in Langhorne borough
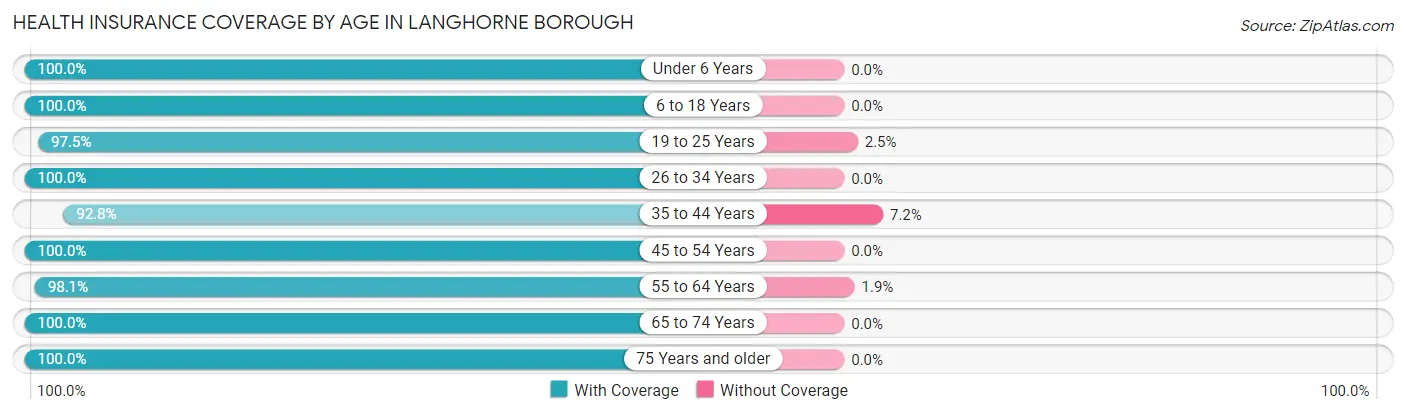
| Age Bracket | With Coverage | Without Coverage |
| Under 6 Years | 73 (100.0%) | 0 (0.0%) |
| 6 to 18 Years | 140 (100.0%) | 0 (0.0%) |
| 19 to 25 Years | 155 (97.5%) | 4 (2.5%) |
| 26 to 34 Years | 147 (100.0%) | 0 (0.0%) |
| 35 to 44 Years | 180 (92.8%) | 14 (7.2%) |
| 45 to 54 Years | 193 (100.0%) | 0 (0.0%) |
| 55 to 64 Years | 255 (98.1%) | 5 (1.9%) |
| 65 to 74 Years | 145 (100.0%) | 0 (0.0%) |
| 75 Years and older | 104 (100.0%) | 0 (0.0%) |
| Total | 1,392 (98.4%) | 23 (1.6%) |
Health Insurance Coverage by Citizenship Status in Langhorne borough
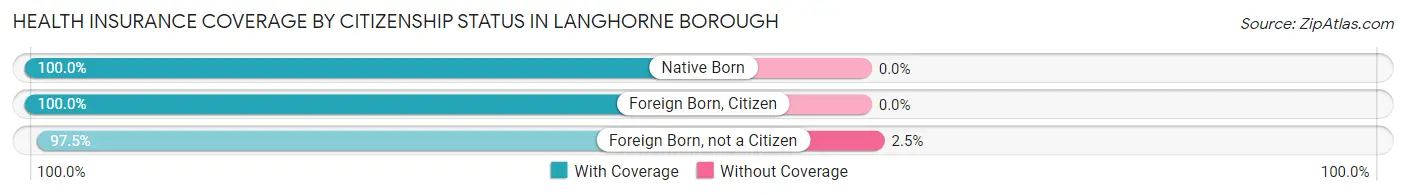
| Citizenship Status | With Coverage | Without Coverage |
| Native Born | 73 (100.0%) | 0 (0.0%) |
| Foreign Born, Citizen | 140 (100.0%) | 0 (0.0%) |
| Foreign Born, not a Citizen | 155 (97.5%) | 4 (2.5%) |
Health Insurance Coverage by Household Income in Langhorne borough
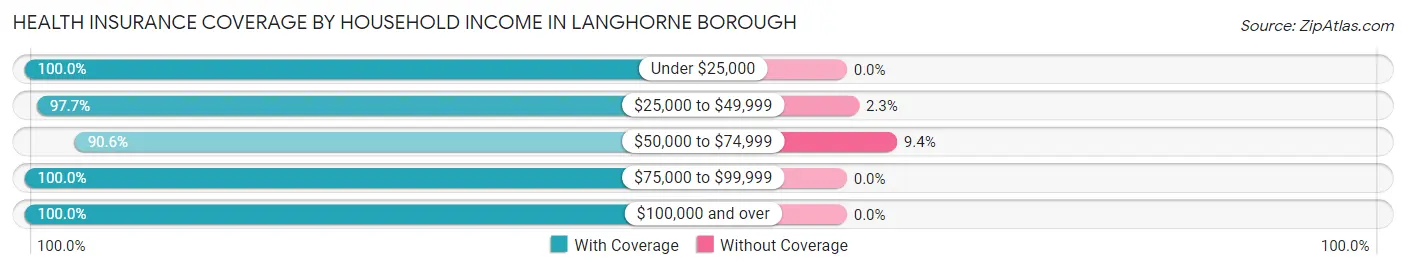
| Household Income | With Coverage | Without Coverage |
| Under $25,000 | 77 (100.0%) | 0 (0.0%) |
| $25,000 to $49,999 | 128 (97.7%) | 3 (2.3%) |
| $50,000 to $74,999 | 193 (90.6%) | 20 (9.4%) |
| $75,000 to $99,999 | 132 (100.0%) | 0 (0.0%) |
| $100,000 and over | 764 (100.0%) | 0 (0.0%) |
Public vs Private Health Insurance Coverage by Age in Langhorne borough
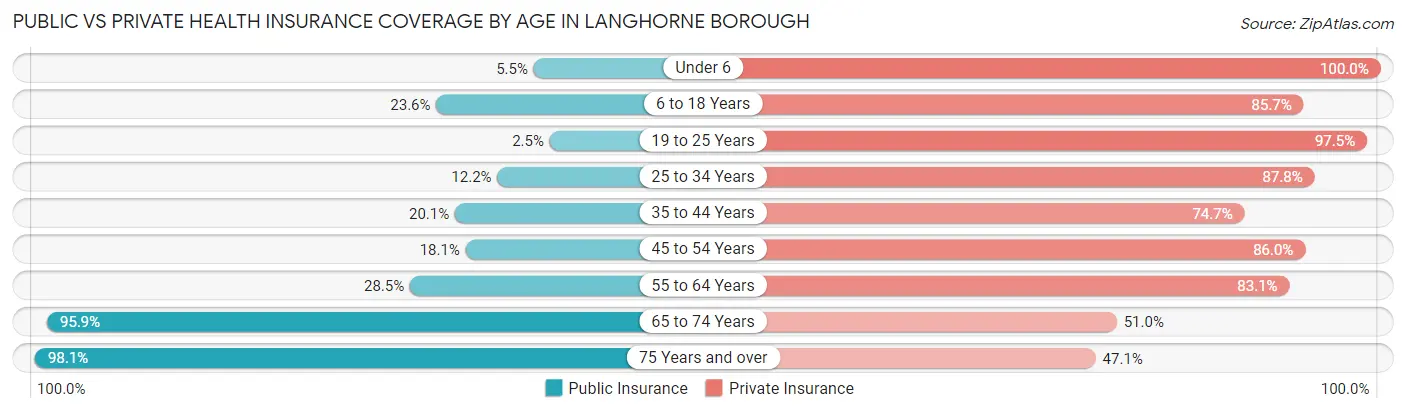
| Age Bracket | Public Insurance | Private Insurance |
| Under 6 | 4 (5.5%) | 73 (100.0%) |
| 6 to 18 Years | 33 (23.6%) | 120 (85.7%) |
| 19 to 25 Years | 4 (2.5%) | 155 (97.5%) |
| 25 to 34 Years | 18 (12.2%) | 129 (87.8%) |
| 35 to 44 Years | 39 (20.1%) | 145 (74.7%) |
| 45 to 54 Years | 35 (18.1%) | 166 (86.0%) |
| 55 to 64 Years | 74 (28.5%) | 216 (83.1%) |
| 65 to 74 Years | 139 (95.9%) | 74 (51.0%) |
| 75 Years and over | 102 (98.1%) | 49 (47.1%) |
| Total | 448 (31.7%) | 1,127 (79.6%) |
Disability Status by Sex by Age in Langhorne borough
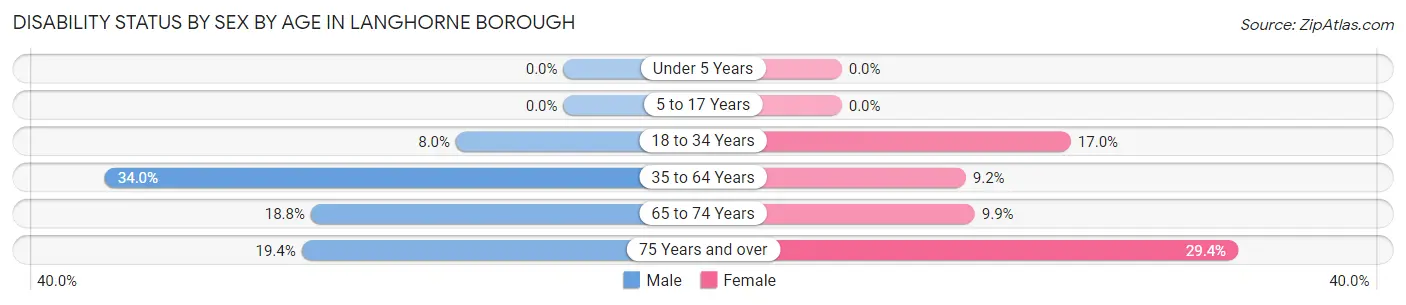
| Age Bracket | Male | Female |
| Under 5 Years | 0 (0.0%) | 0 (0.0%) |
| 5 to 17 Years | 0 (0.0%) | 0 (0.0%) |
| 18 to 34 Years | 13 (8.0%) | 25 (17.0%) |
| 35 to 64 Years | 113 (34.0%) | 29 (9.2%) |
| 65 to 74 Years | 12 (18.8%) | 8 (9.9%) |
| 75 Years and over | 7 (19.4%) | 20 (29.4%) |
Disability Class by Sex by Age in Langhorne borough
Disability Class: Hearing Difficulty
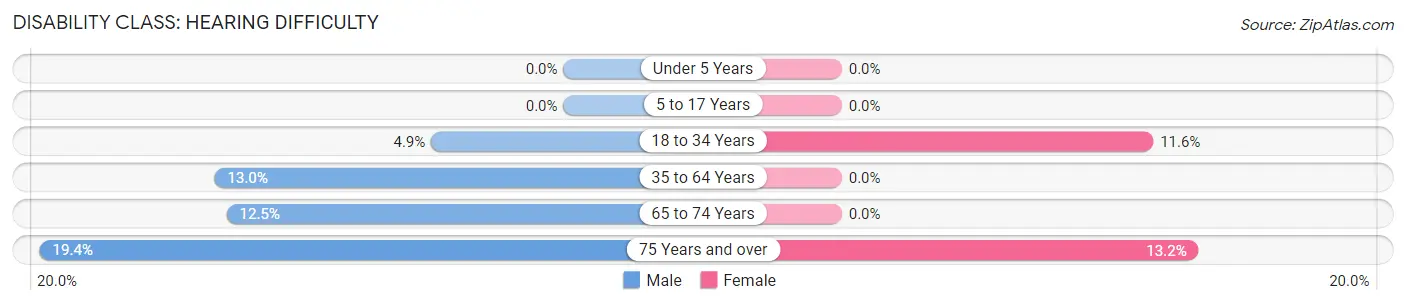
| Age Bracket | Male | Female |
| Under 5 Years | 0 (0.0%) | 0 (0.0%) |
| 5 to 17 Years | 0 (0.0%) | 0 (0.0%) |
| 18 to 34 Years | 8 (4.9%) | 17 (11.6%) |
| 35 to 64 Years | 43 (13.0%) | 0 (0.0%) |
| 65 to 74 Years | 8 (12.5%) | 0 (0.0%) |
| 75 Years and over | 7 (19.4%) | 9 (13.2%) |
Disability Class: Vision Difficulty
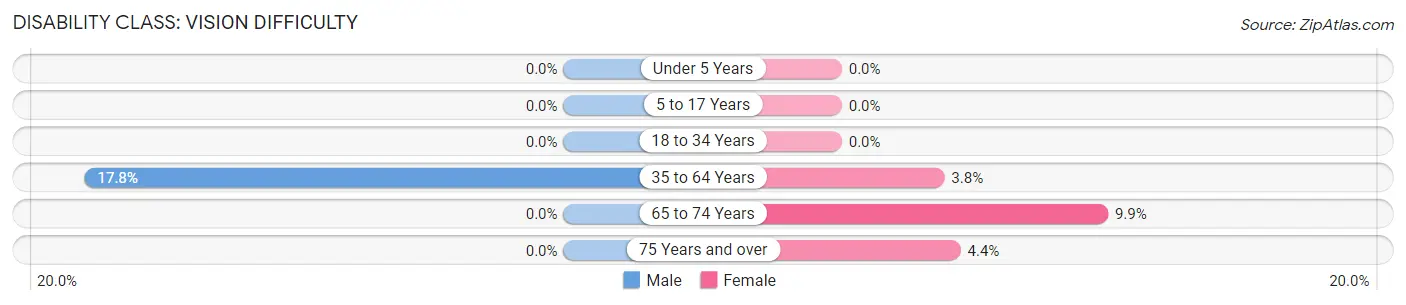
| Age Bracket | Male | Female |
| Under 5 Years | 0 (0.0%) | 0 (0.0%) |
| 5 to 17 Years | 0 (0.0%) | 0 (0.0%) |
| 18 to 34 Years | 0 (0.0%) | 0 (0.0%) |
| 35 to 64 Years | 59 (17.8%) | 12 (3.8%) |
| 65 to 74 Years | 0 (0.0%) | 8 (9.9%) |
| 75 Years and over | 0 (0.0%) | 3 (4.4%) |
Disability Class: Cognitive Difficulty
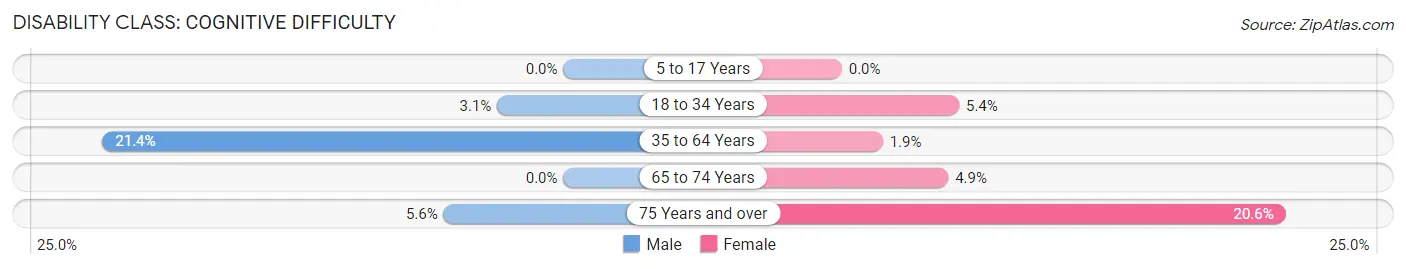
| Age Bracket | Male | Female |
| 5 to 17 Years | 0 (0.0%) | 0 (0.0%) |
| 18 to 34 Years | 5 (3.1%) | 8 (5.4%) |
| 35 to 64 Years | 71 (21.4%) | 6 (1.9%) |
| 65 to 74 Years | 0 (0.0%) | 4 (4.9%) |
| 75 Years and over | 2 (5.6%) | 14 (20.6%) |
Disability Class: Ambulatory Difficulty
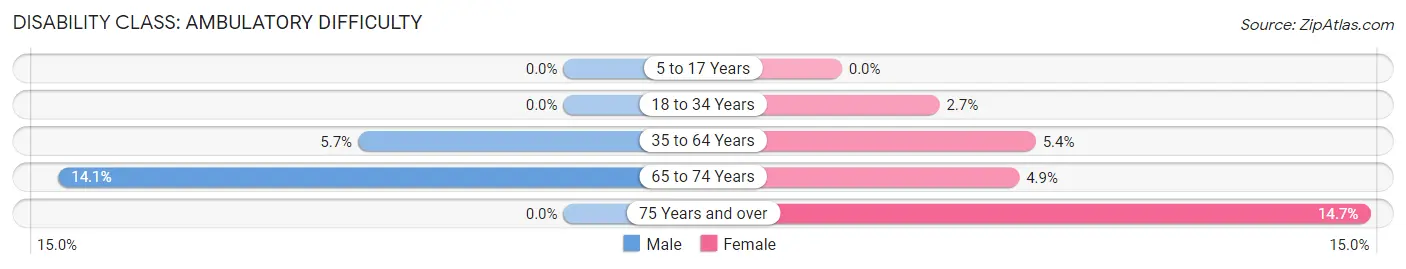
| Age Bracket | Male | Female |
| 5 to 17 Years | 0 (0.0%) | 0 (0.0%) |
| 18 to 34 Years | 0 (0.0%) | 4 (2.7%) |
| 35 to 64 Years | 19 (5.7%) | 17 (5.4%) |
| 65 to 74 Years | 9 (14.1%) | 4 (4.9%) |
| 75 Years and over | 0 (0.0%) | 10 (14.7%) |
Disability Class: Self-Care Difficulty
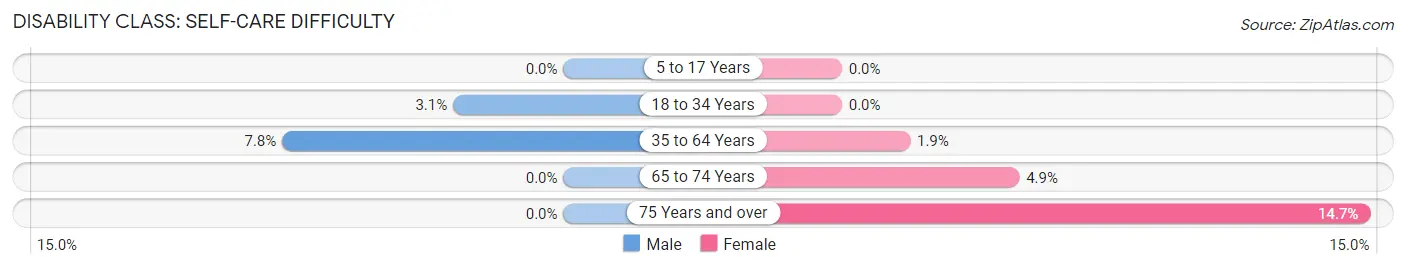
| Age Bracket | Male | Female |
| 5 to 17 Years | 0 (0.0%) | 0 (0.0%) |
| 18 to 34 Years | 5 (3.1%) | 0 (0.0%) |
| 35 to 64 Years | 26 (7.8%) | 6 (1.9%) |
| 65 to 74 Years | 0 (0.0%) | 4 (4.9%) |
| 75 Years and over | 0 (0.0%) | 10 (14.7%) |
Technology Access in Langhorne borough
Computing Device Access in Langhorne borough
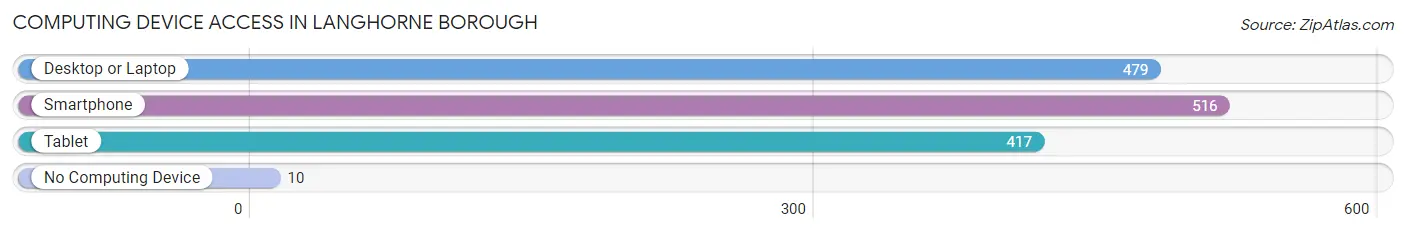
| Device Type | # Households | % Households |
| Desktop or Laptop | 479 | 81.0% |
| Smartphone | 516 | 87.3% |
| Tablet | 417 | 70.6% |
| No Computing Device | 10 | 1.7% |
| Total | 591 | 100.0% |
Internet Access in Langhorne borough
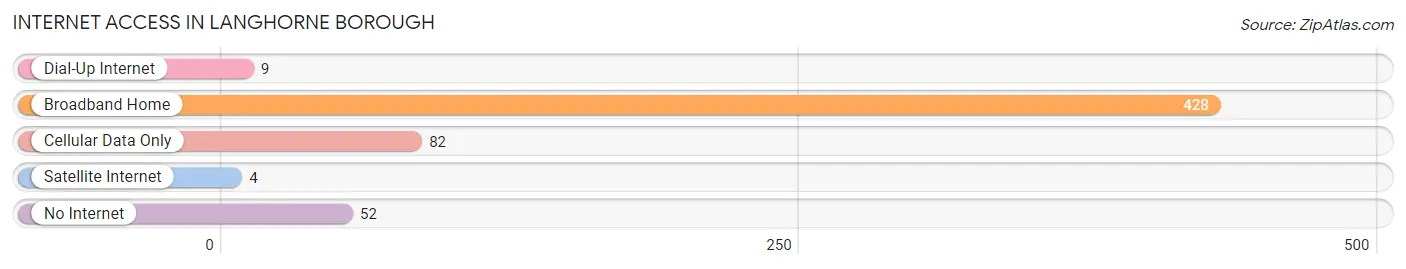
| Internet Type | # Households | % Households |
| Dial-Up Internet | 9 | 1.5% |
| Broadband Home | 428 | 72.4% |
| Cellular Data Only | 82 | 13.9% |
| Satellite Internet | 4 | 0.7% |
| No Internet | 52 | 8.8% |
| Total | 591 | 100.0% |
Langhorne borough Summary
Langhorne Borough is a small borough located in Bucks County, Pennsylvania. It is situated in the northeast corner of the county, just south of the city of Philadelphia. The borough is bordered by Middletown Township to the north, Lower Southampton Township to the east, and Falls Township to the south and west. The population of Langhorne Borough was 2,945 at the 2010 census.
History
Langhorne Borough was founded in 1722 by Thomas Langhorne, a Quaker from England. The borough was originally part of Middletown Township, but was incorporated as a separate borough in 1876. The borough was named after Thomas Langhorne, who had purchased the land from William Penn in 1701.
The borough was a rural farming community until the late 19th century, when the Pennsylvania Railroad built a line through the area. This brought an influx of new residents and businesses to the area, and the borough began to grow.
In the early 20th century, Langhorne Borough was a popular summer resort destination. The borough was home to several large hotels, including the Langhorne Hotel, which was built in 1891 and was one of the largest hotels in the area. The Langhorne Hotel was destroyed by fire in 1929.
Geography
Langhorne Borough is located at 40°10'45" North, 74°54'45" West (40.179167, -74.912500). According to the United States Census Bureau, the borough has a total area of 0.7 square miles (1.8 km2), all of it land.
The borough is located in the northeast corner of Bucks County, just south of the city of Philadelphia. It is bordered by Middletown Township to the north, Lower Southampton Township to the east, and Falls Township to the south and west.
Economy
The economy of Langhorne Borough is largely based on retail and services. The borough is home to several small businesses, including restaurants, shops, and professional services. The borough is also home to several large employers, including the Langhorne Gardens Shopping Center, which is home to several large retailers, and the Langhorne Plaza Shopping Center, which is home to several smaller retailers.
Demographics
As of the 2010 census, there were 2,945 people, 1,093 households, and 745 families residing in the borough. The population density was 4,093.3 people per square mile (1,579.2/km2). There were 1,164 housing units at an average density of 1,637.3 per square mile (631.2/km2). The racial makeup of the borough was 94.2% White, 2.2% African American, 0.1% Native American, 1.3% Asian, 0.7% from other races, and 1.5% from two or more races. Hispanic or Latino of any race were 2.7% of the population.
There were 1,093 households, out of which 33.2% had children under the age of 18 living with them, 51.2% were married couples living together, 11.7% had a female householder with no husband present, and 32.2% were non-families. 26.7% of all households were made up of individuals, and 10.2% had someone living alone who was 65 years of age or older. The average household size was 2.60 and the average family size was 3.17.
In the borough, the population was spread out, with 24.3% under the age of 18, 7.2% from 18 to 24, 30.2% from 25 to 44, 24.2% from 45 to 64, and 14.1% who were 65 years of age or older. The median age was 38 years. For every 100 females, there were 94.2 males. For every 100 females age 18 and over, there were 91.2 males.
The median income for a household in the borough was $50,938, and the median income for a family was $60,938. Males had a median income of $41,250 versus $30,000 for females. The per capita income for the borough was $23,945. About 4.2% of families and 5.7% of the population were below the poverty line, including 6.3% of those under age 18 and 5.2% of those age 65 or over.
Common Questions
What is Per Capita Income in Langhorne borough?
Per Capita income in Langhorne borough is $43,817.
What is the Median Family Income in Langhorne borough?
Median Family Income in Langhorne borough is $115,956.
What is the Median Household income in Langhorne borough?
Median Household Income in Langhorne borough is $83,125.
What is Income or Wage Gap in Langhorne borough?
Income or Wage Gap in Langhorne borough is 23.8%.
Women in Langhorne borough earn 76.2 cents for every dollar earned by a man.
What is Inequality or Gini Index in Langhorne borough?
Inequality or Gini Index in Langhorne borough is 0.41.
What is the Total Population of Langhorne borough?
Total Population of Langhorne borough is 1,578.
What is the Total Male Population of Langhorne borough?
Total Male Population of Langhorne borough is 787.
What is the Total Female Population of Langhorne borough?
Total Female Population of Langhorne borough is 791.
What is the Ratio of Males per 100 Females in Langhorne borough?
There are 99.49 Males per 100 Females in Langhorne borough.
What is the Ratio of Females per 100 Males in Langhorne borough?
There are 100.51 Females per 100 Males in Langhorne borough.
What is the Median Population Age in Langhorne borough?
Median Population Age in Langhorne borough is 46.4 Years.
What is the Average Family Size in Langhorne borough
Average Family Size in Langhorne borough is 2.9 People.
What is the Average Household Size in Langhorne borough
Average Household Size in Langhorne borough is 2.2 People.
How Large is the Labor Force in Langhorne borough?
There are 852 People in the Labor Forcein in Langhorne borough.
What is the Percentage of People in the Labor Force in Langhorne borough?
63.8% of People are in the Labor Force in Langhorne borough.
What is the Unemployment Rate in Langhorne borough?
Unemployment Rate in Langhorne borough is 7.4%.