Lake Meade, PA Map & Demographics
Lake Meade Map
Lake Meade Overview
$50,401
PER CAPITA INCOME
$135,625
AVG FAMILY INCOME
$116,417
AVG HOUSEHOLD INCOME
24.6%
WAGE / INCOME GAP [ % ]
75.4¢/ $1
WAGE / INCOME GAP [ $ ]
0.31
INEQUALITY / GINI INDEX
2,504
TOTAL POPULATION
1,260
MALE POPULATION
1,244
FEMALE POPULATION
101.29
MALES / 100 FEMALES
98.73
FEMALES / 100 MALES
47.7
MEDIAN AGE
3.1
AVG FAMILY SIZE
2.9
AVG HOUSEHOLD SIZE
1,521
LABOR FORCE [ PEOPLE ]
74.4%
PERCENT IN LABOR FORCE
2.6%
UNEMPLOYMENT RATE
Income in Lake Meade
Income Overview in Lake Meade
Per Capita Income in Lake Meade is $50,401, while median incomes of families and households are $135,625 and $116,417 respectively.
| Characteristic | Number | Measure |
| Per Capita Income | 2,504 | $50,401 |
| Median Family Income | 713 | $135,625 |
| Mean Family Income | 713 | $150,877 |
| Median Household Income | 878 | $116,417 |
| Mean Household Income | 878 | $140,065 |
| Income Deficit | 713 | $0 |
| Wage / Income Gap (%) | 2,504 | 24.61% |
| Wage / Income Gap ($) | 2,504 | 75.39¢ per $1 |
| Gini / Inequality Index | 2,504 | 0.31 |
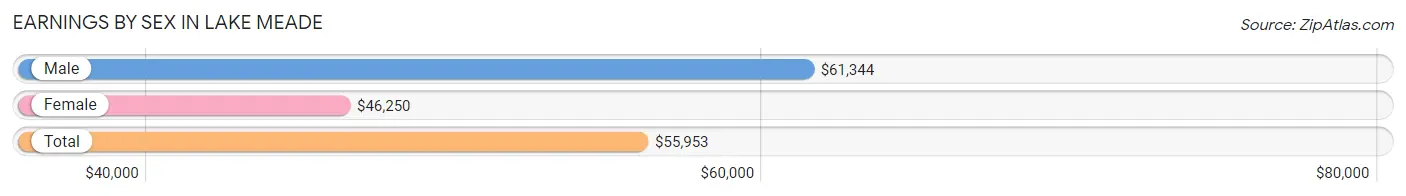
Earnings by Sex in Lake Meade
Average Earnings in Lake Meade are $55,953, $61,344 for men and $46,250 for women, a difference of 24.6%.
| Sex | Number | Average Earnings |
| Male | 789 (50.5%) | $61,344 |
| Female | 772 (49.5%) | $46,250 |
| Total | 1,561 (100.0%) | $55,953 |
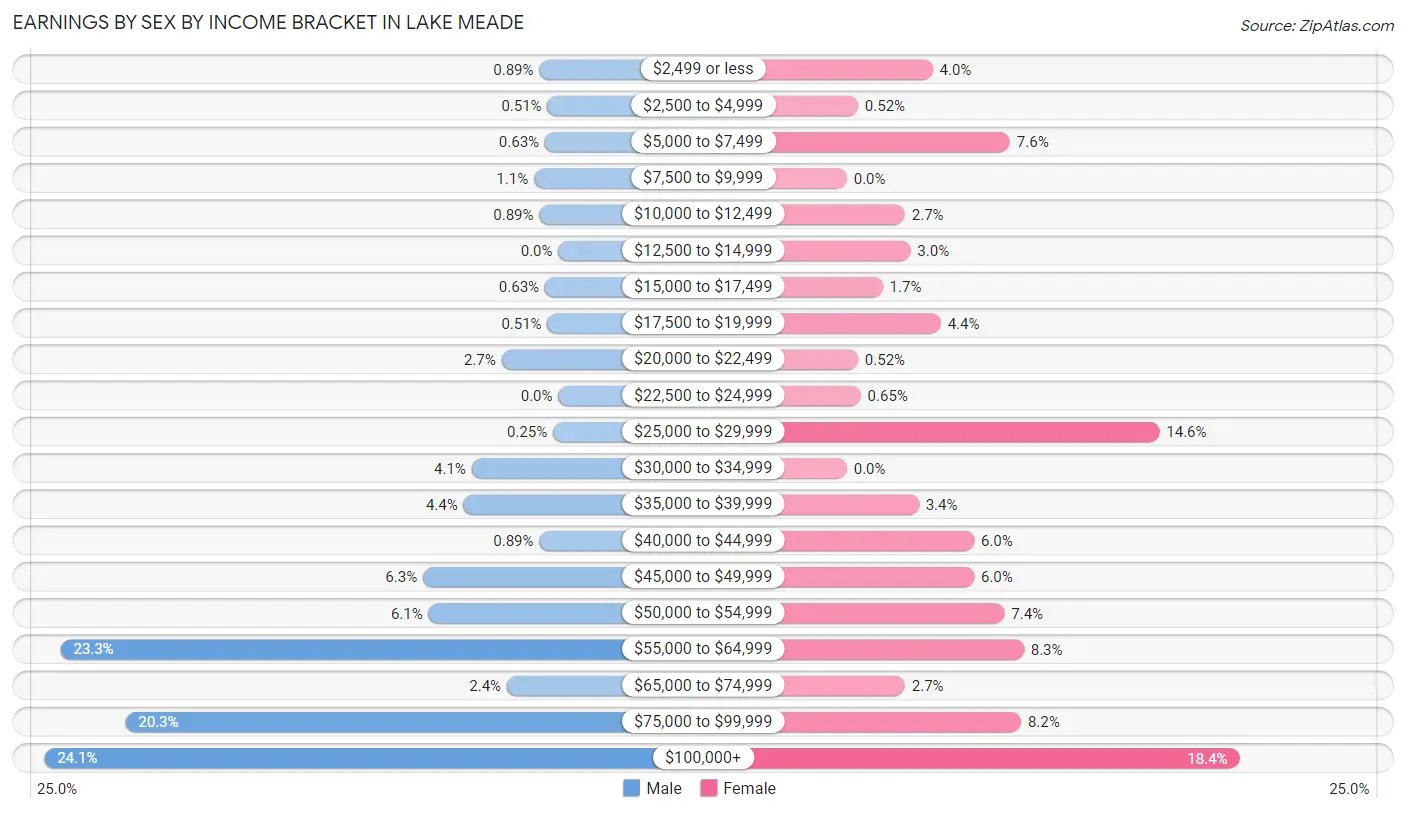
Earnings by Sex by Income Bracket in Lake Meade
The most common earnings brackets in Lake Meade are $100,000+ for men (190 | 24.1%) and $100,000+ for women (142 | 18.4%).
| Income | Male | Female |
| $2,499 or less | 7 (0.9%) | 31 (4.0%) |
| $2,500 to $4,999 | 4 (0.5%) | 4 (0.5%) |
| $5,000 to $7,499 | 5 (0.6%) | 59 (7.6%) |
| $7,500 to $9,999 | 9 (1.1%) | 0 (0.0%) |
| $10,000 to $12,499 | 7 (0.9%) | 21 (2.7%) |
| $12,500 to $14,999 | 0 (0.0%) | 23 (3.0%) |
| $15,000 to $17,499 | 5 (0.6%) | 13 (1.7%) |
| $17,500 to $19,999 | 4 (0.5%) | 34 (4.4%) |
| $20,000 to $22,499 | 21 (2.7%) | 4 (0.5%) |
| $22,500 to $24,999 | 0 (0.0%) | 5 (0.6%) |
| $25,000 to $29,999 | 2 (0.3%) | 113 (14.6%) |
| $30,000 to $34,999 | 32 (4.1%) | 0 (0.0%) |
| $35,000 to $39,999 | 35 (4.4%) | 26 (3.4%) |
| $40,000 to $44,999 | 7 (0.9%) | 46 (6.0%) |
| $45,000 to $49,999 | 50 (6.3%) | 46 (6.0%) |
| $50,000 to $54,999 | 48 (6.1%) | 57 (7.4%) |
| $55,000 to $64,999 | 184 (23.3%) | 64 (8.3%) |
| $65,000 to $74,999 | 19 (2.4%) | 21 (2.7%) |
| $75,000 to $99,999 | 160 (20.3%) | 63 (8.2%) |
| $100,000+ | 190 (24.1%) | 142 (18.4%) |
| Total | 789 (100.0%) | 772 (100.0%) |
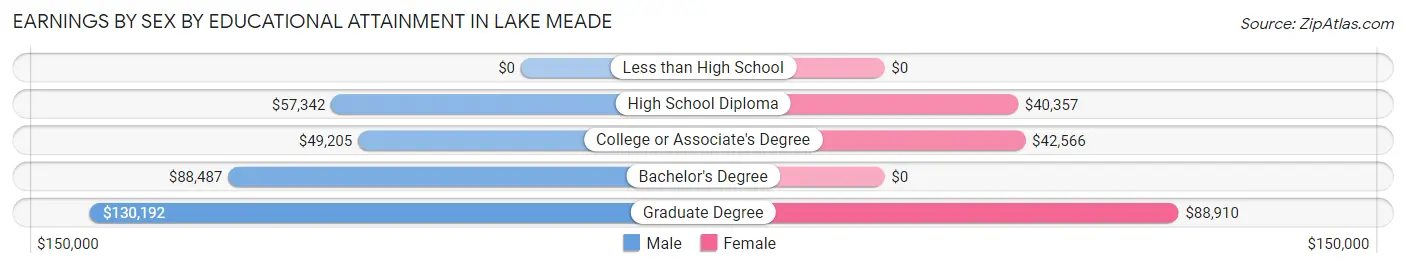
Earnings by Sex by Educational Attainment in Lake Meade
Average earnings in Lake Meade are $74,145 for men and $49,453 for women, a difference of 33.3%. Men with an educational attainment of graduate degree enjoy the highest average annual earnings of $130,192, while those with college or associate's degree education earn the least with $49,205. Women with an educational attainment of graduate degree earn the most with the average annual earnings of $88,910, while those with high school diploma education have the smallest earnings of $40,357.
| Educational Attainment | Male Income | Female Income |
| Less than High School | - | - |
| High School Diploma | $57,342 | $40,357 |
| College or Associate's Degree | $49,205 | $42,566 |
| Bachelor's Degree | $88,487 | $0 |
| Graduate Degree | $130,192 | $88,910 |
| Total | $74,145 | $49,453 |
Family Income in Lake Meade
Family Income Brackets in Lake Meade
According to the Lake Meade family income data, there are 182 families falling into the $100,000 to $149,999 income range, which is the most common income bracket and makes up 25.5% of all families.
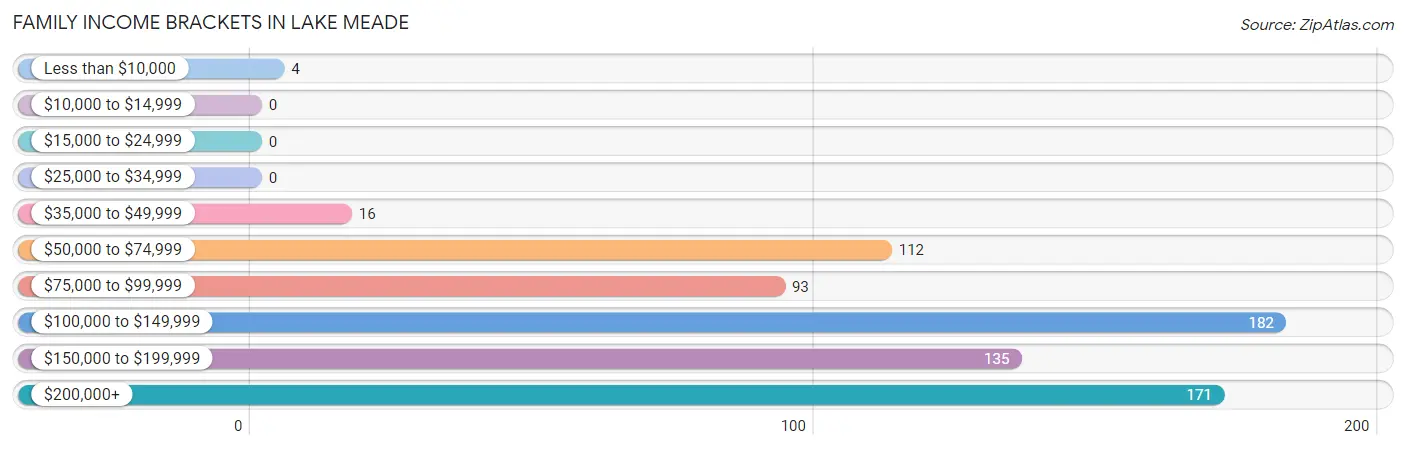
| Income Bracket | # Families | % Families |
| Less than $10,000 | 4 | 0.6% |
| $10,000 to $14,999 | 0 | 0.0% |
| $15,000 to $24,999 | 0 | 0.0% |
| $25,000 to $34,999 | 0 | 0.0% |
| $35,000 to $49,999 | 16 | 2.2% |
| $50,000 to $74,999 | 112 | 15.7% |
| $75,000 to $99,999 | 93 | 13.0% |
| $100,000 to $149,999 | 182 | 25.5% |
| $150,000 to $199,999 | 135 | 18.9% |
| $200,000+ | 171 | 24.0% |
Family Income by Famaliy Size in Lake Meade
5-person families (104 | 14.6%) account for the highest median family income in Lake Meade with $208,782 per family, while 2-person families (377 | 52.9%) have the highest median income of $46,216 per family member.
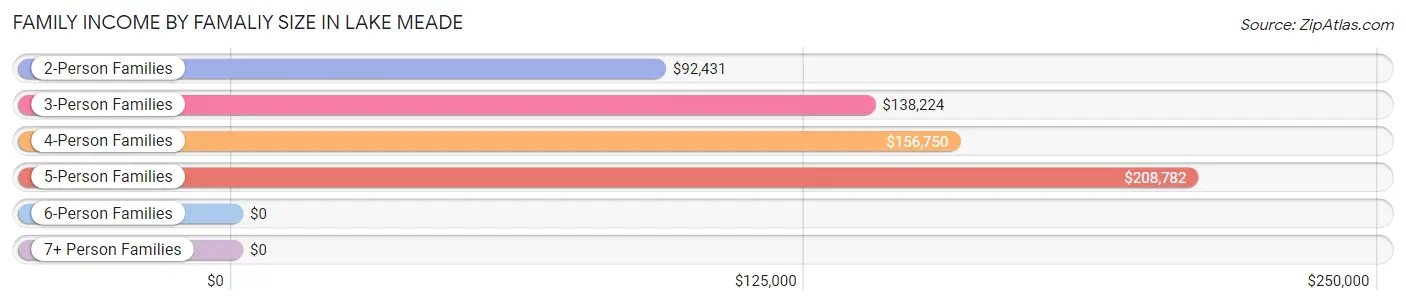
| Income Bracket | # Families | Median Income |
| 2-Person Families | 377 (52.9%) | $92,431 |
| 3-Person Families | 107 (15.0%) | $138,224 |
| 4-Person Families | 107 (15.0%) | $156,750 |
| 5-Person Families | 104 (14.6%) | $208,782 |
| 6-Person Families | 14 (2.0%) | $0 |
| 7+ Person Families | 4 (0.6%) | $0 |
| Total | 713 (100.0%) | $135,625 |
Family Income by Number of Earners in Lake Meade
The median family income in Lake Meade is $135,625, with families comprising 3+ earners (139) having the highest median family income of $208,429, while families with no earners (94) have the lowest median family income of $65,789, accounting for 19.5% and 13.2% of families, respectively.
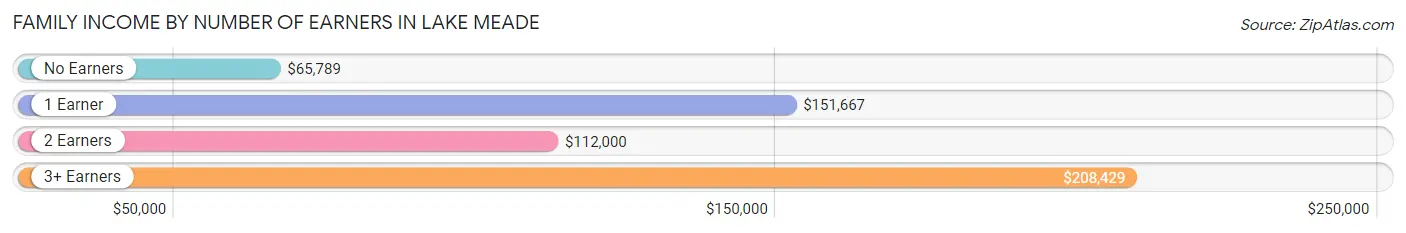
| Number of Earners | # Families | Median Income |
| No Earners | 94 (13.2%) | $65,789 |
| 1 Earner | 154 (21.6%) | $151,667 |
| 2 Earners | 326 (45.7%) | $112,000 |
| 3+ Earners | 139 (19.5%) | $208,429 |
| Total | 713 (100.0%) | $135,625 |
Household Income in Lake Meade
Household Income Brackets in Lake Meade
With 273 households falling in the category, the $100,000 to $149,999 income range is the most frequent in Lake Meade, accounting for 31.1% of all households.
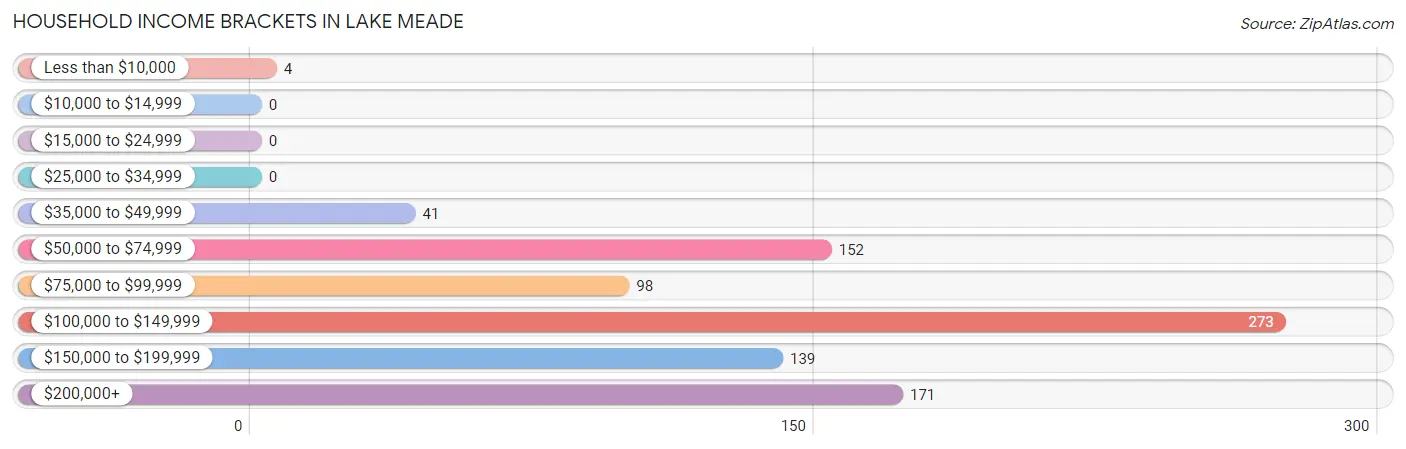
| Income Bracket | # Households | % Households |
| Less than $10,000 | 4 | 0.5% |
| $10,000 to $14,999 | 0 | 0.0% |
| $15,000 to $24,999 | 0 | 0.0% |
| $25,000 to $34,999 | 0 | 0.0% |
| $35,000 to $49,999 | 41 | 4.7% |
| $50,000 to $74,999 | 152 | 17.3% |
| $75,000 to $99,999 | 98 | 11.2% |
| $100,000 to $149,999 | 273 | 31.1% |
| $150,000 to $199,999 | 139 | 15.8% |
| $200,000+ | 171 | 19.5% |
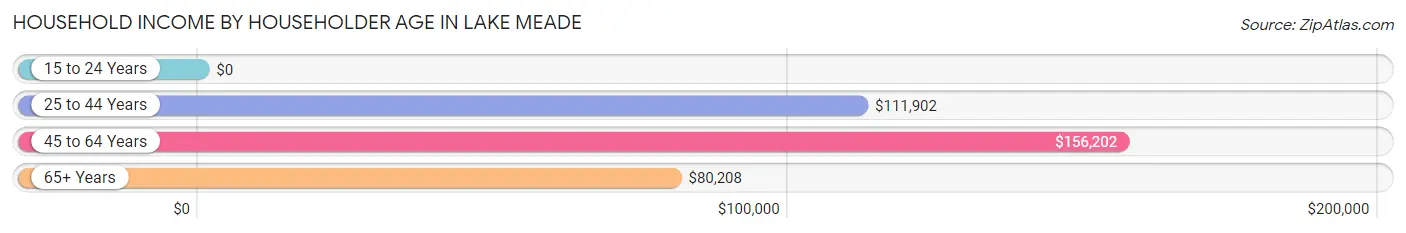
Household Income by Householder Age in Lake Meade
The median household income in Lake Meade is $116,417, with the highest median household income of $156,202 found in the 45 to 64 years age bracket for the primary householder. A total of 403 households (45.9%) fall into this category.
| Income Bracket | # Households | Median Income |
| 15 to 24 Years | 0 (0.0%) | $0 |
| 25 to 44 Years | 204 (23.2%) | $111,902 |
| 45 to 64 Years | 403 (45.9%) | $156,202 |
| 65+ Years | 271 (30.9%) | $80,208 |
| Total | 878 (100.0%) | $116,417 |
Poverty in Lake Meade
Income Below Poverty by Sex and Age in Lake Meade
With 1.1% poverty level for males and 1.6% for females among the residents of Lake Meade, 6 to 11 year old males and under 5 year old females are the most vulnerable to poverty, with 6 males (5.8%) and 6 females (27.3%) in their respective age groups living below the poverty level.
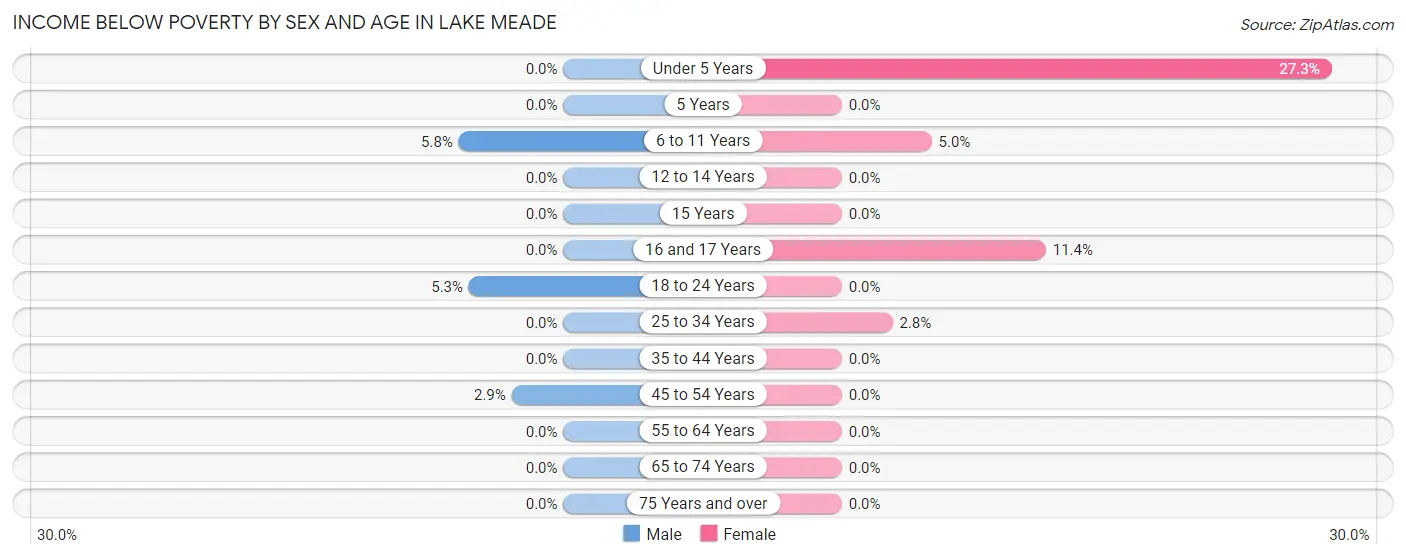
| Age Bracket | Male | Female |
| Under 5 Years | 0 (0.0%) | 6 (27.3%) |
| 5 Years | 0 (0.0%) | 0 (0.0%) |
| 6 to 11 Years | 6 (5.8%) | 5 (5.0%) |
| 12 to 14 Years | 0 (0.0%) | 0 (0.0%) |
| 15 Years | 0 (0.0%) | 0 (0.0%) |
| 16 and 17 Years | 0 (0.0%) | 5 (11.4%) |
| 18 to 24 Years | 4 (5.3%) | 0 (0.0%) |
| 25 to 34 Years | 0 (0.0%) | 4 (2.8%) |
| 35 to 44 Years | 0 (0.0%) | 0 (0.0%) |
| 45 to 54 Years | 4 (2.9%) | 0 (0.0%) |
| 55 to 64 Years | 0 (0.0%) | 0 (0.0%) |
| 65 to 74 Years | 0 (0.0%) | 0 (0.0%) |
| 75 Years and over | 0 (0.0%) | 0 (0.0%) |
| Total | 14 (1.1%) | 20 (1.6%) |
Income Above Poverty by Sex and Age in Lake Meade
According to the poverty statistics in Lake Meade, males aged under 5 years and females aged 12 to 14 years are the age groups that are most secure financially, with 100.0% of males and 100.0% of females in these age groups living above the poverty line.
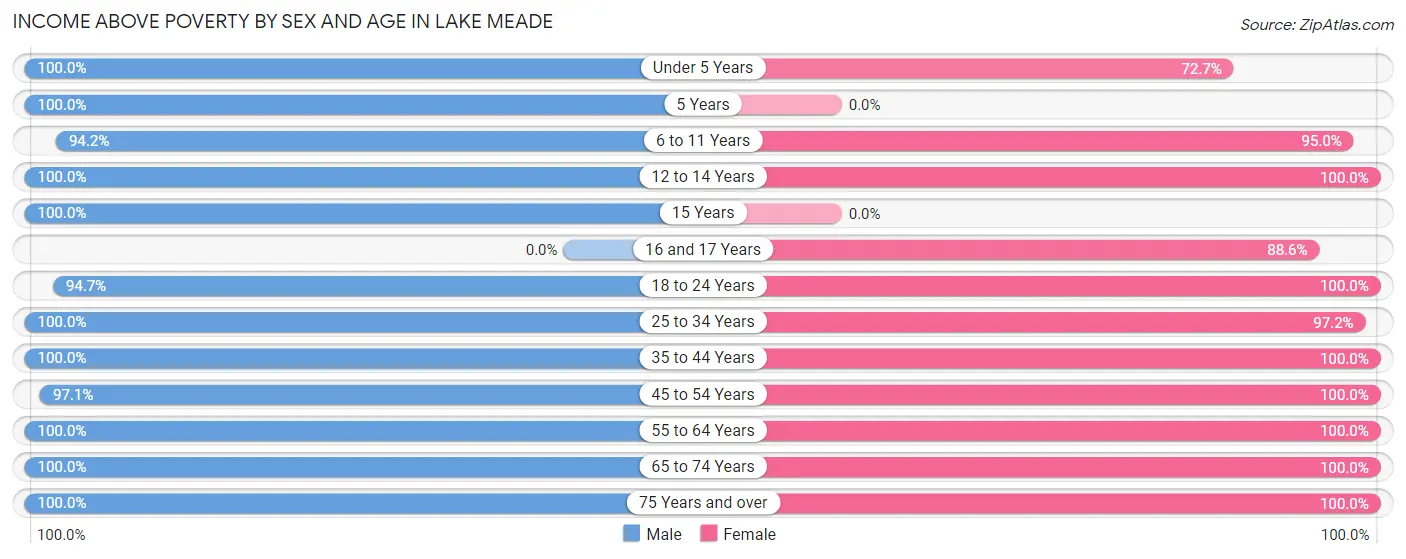
| Age Bracket | Male | Female |
| Under 5 Years | 46 (100.0%) | 16 (72.7%) |
| 5 Years | 9 (100.0%) | 0 (0.0%) |
| 6 to 11 Years | 97 (94.2%) | 95 (95.0%) |
| 12 to 14 Years | 25 (100.0%) | 90 (100.0%) |
| 15 Years | 59 (100.0%) | 0 (0.0%) |
| 16 and 17 Years | 0 (0.0%) | 39 (88.6%) |
| 18 to 24 Years | 72 (94.7%) | 32 (100.0%) |
| 25 to 34 Years | 138 (100.0%) | 138 (97.2%) |
| 35 to 44 Years | 138 (100.0%) | 146 (100.0%) |
| 45 to 54 Years | 135 (97.1%) | 208 (100.0%) |
| 55 to 64 Years | 237 (100.0%) | 309 (100.0%) |
| 65 to 74 Years | 170 (100.0%) | 67 (100.0%) |
| 75 Years and over | 114 (100.0%) | 84 (100.0%) |
| Total | 1,240 (98.9%) | 1,224 (98.4%) |
Income Below Poverty Among Married-Couple Families in Lake Meade
The poverty statistics for married-couple families in Lake Meade show that 0.6% or 4 of the total 706 families live below the poverty line. Families with 3 or 4 children have the highest poverty rate of 4.9%, comprising of 4 families. On the other hand, families with no children have the lowest poverty rate of 0.0%, which includes 0 families.
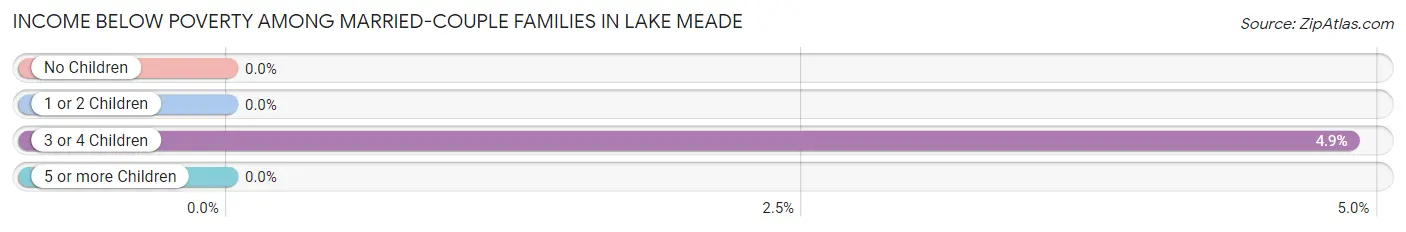
| Children | Above Poverty | Below Poverty |
| No Children | 507 (100.0%) | 0 (0.0%) |
| 1 or 2 Children | 117 (100.0%) | 0 (0.0%) |
| 3 or 4 Children | 78 (95.1%) | 4 (4.9%) |
| 5 or more Children | 0 (0.0%) | 0 (0.0%) |
| Total | 702 (99.4%) | 4 (0.6%) |
Income Below Poverty Among Single-Parent Households in Lake Meade
| Children | Single Father | Single Mother |
| No Children | 0 (0.0%) | 0 (0.0%) |
| 1 or 2 Children | 0 (0.0%) | 0 (0.0%) |
| 3 or 4 Children | 0 (0.0%) | 0 (0.0%) |
| 5 or more Children | 0 (0.0%) | 0 (0.0%) |
| Total | 0 (0.0%) | 0 (0.0%) |
Income Below Poverty Among Married-Couple vs Single-Parent Households in Lake Meade
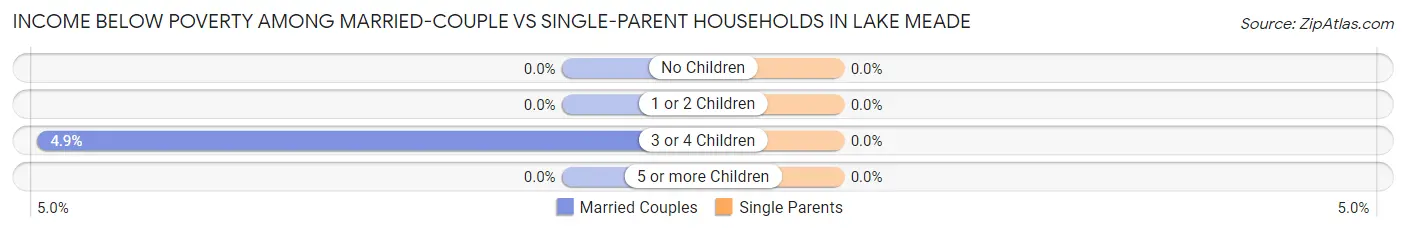
| Children | Married-Couple Families | Single-Parent Households |
| No Children | 0 (0.0%) | 0 (0.0%) |
| 1 or 2 Children | 0 (0.0%) | 0 (0.0%) |
| 3 or 4 Children | 4 (4.9%) | 0 (0.0%) |
| 5 or more Children | 0 (0.0%) | 0 (0.0%) |
| Total | 4 (0.6%) | 0 (0.0%) |
Race in Lake Meade
The most populous races in Lake Meade are White / Caucasian (2,376 | 94.9%), Two or more Races (92 | 3.7%), and Asian (25 | 1.0%).
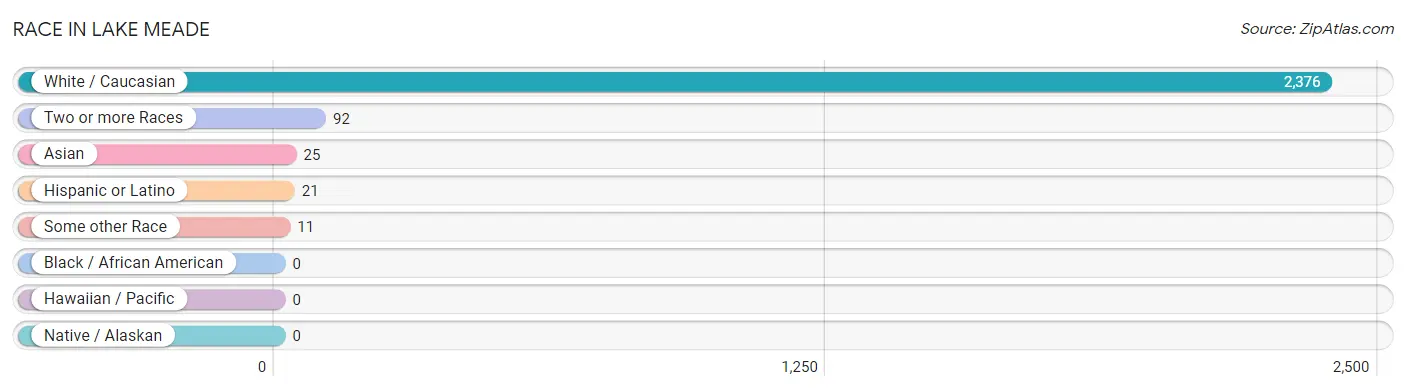
| Race | # Population | % Population |
| Asian | 25 | 1.0% |
| Black / African American | 0 | 0.0% |
| Hawaiian / Pacific | 0 | 0.0% |
| Hispanic or Latino | 21 | 0.8% |
| Native / Alaskan | 0 | 0.0% |
| White / Caucasian | 2,376 | 94.9% |
| Two or more Races | 92 | 3.7% |
| Some other Race | 11 | 0.4% |
| Total | 2,504 | 100.0% |
Ancestry in Lake Meade
The most populous ancestries reported in Lake Meade are German (582 | 23.2%), American (493 | 19.7%), Italian (326 | 13.0%), English (219 | 8.7%), and Polish (114 | 4.5%), together accounting for 69.3% of all Lake Meade residents.
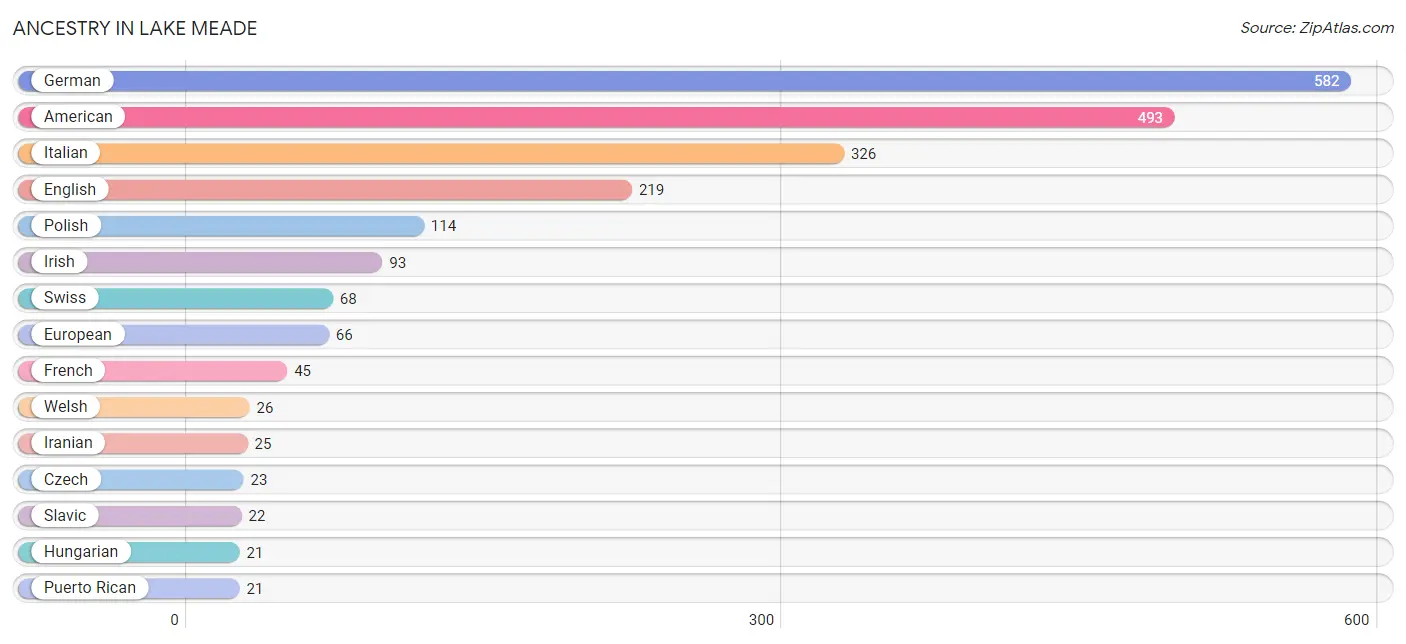
| Ancestry | # Population | % Population |
| American | 493 | 19.7% |
| Czech | 23 | 0.9% |
| Czechoslovakian | 6 | 0.2% |
| Eastern European | 4 | 0.2% |
| English | 219 | 8.7% |
| European | 66 | 2.6% |
| French | 45 | 1.8% |
| German | 582 | 23.2% |
| Greek | 18 | 0.7% |
| Hungarian | 21 | 0.8% |
| Iranian | 25 | 1.0% |
| Irish | 93 | 3.7% |
| Italian | 326 | 13.0% |
| Northern European | 13 | 0.5% |
| Norwegian | 16 | 0.6% |
| Pennsylvania German | 6 | 0.2% |
| Polish | 114 | 4.5% |
| Puerto Rican | 21 | 0.8% |
| Scotch-Irish | 5 | 0.2% |
| Scottish | 18 | 0.7% |
| Slavic | 22 | 0.9% |
| Slovak | 4 | 0.2% |
| Swedish | 10 | 0.4% |
| Swiss | 68 | 2.7% |
| Welsh | 26 | 1.0% | View All 25 Rows |
Immigrants in Lake Meade
The most numerous immigrant groups reported in Lake Meade came from Afghanistan (8 | 0.3%), Asia (8 | 0.3%), South Central Asia (8 | 0.3%), Europe (5 | 0.2%), and Germany (5 | 0.2%), together accounting for 1.4% of all Lake Meade residents.
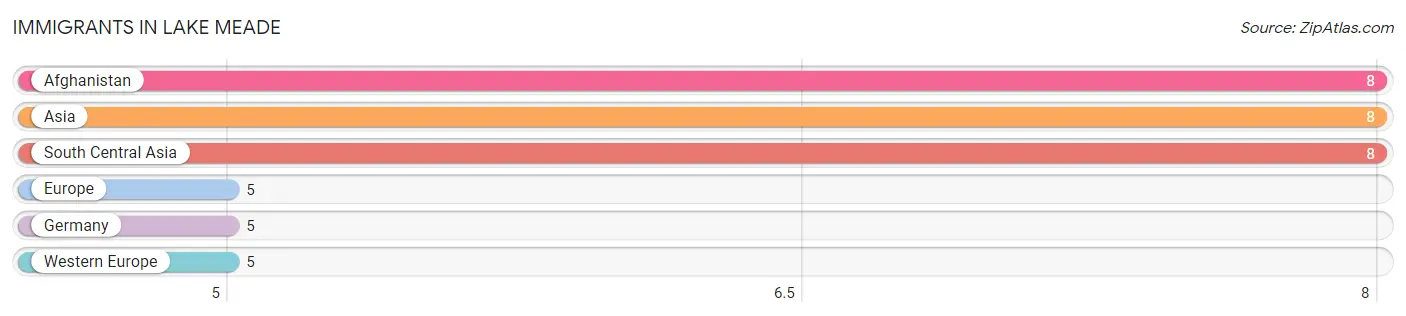
| Immigration Origin | # Population | % Population |
| Afghanistan | 8 | 0.3% |
| Asia | 8 | 0.3% |
| Europe | 5 | 0.2% |
| Germany | 5 | 0.2% |
| South Central Asia | 8 | 0.3% |
| Western Europe | 5 | 0.2% | View All 6 Rows |
Sex and Age in Lake Meade
Sex and Age in Lake Meade
The most populous age groups in Lake Meade are 55 to 59 Years (155 | 12.3%) for men and 55 to 59 Years (155 | 12.5%) for women.
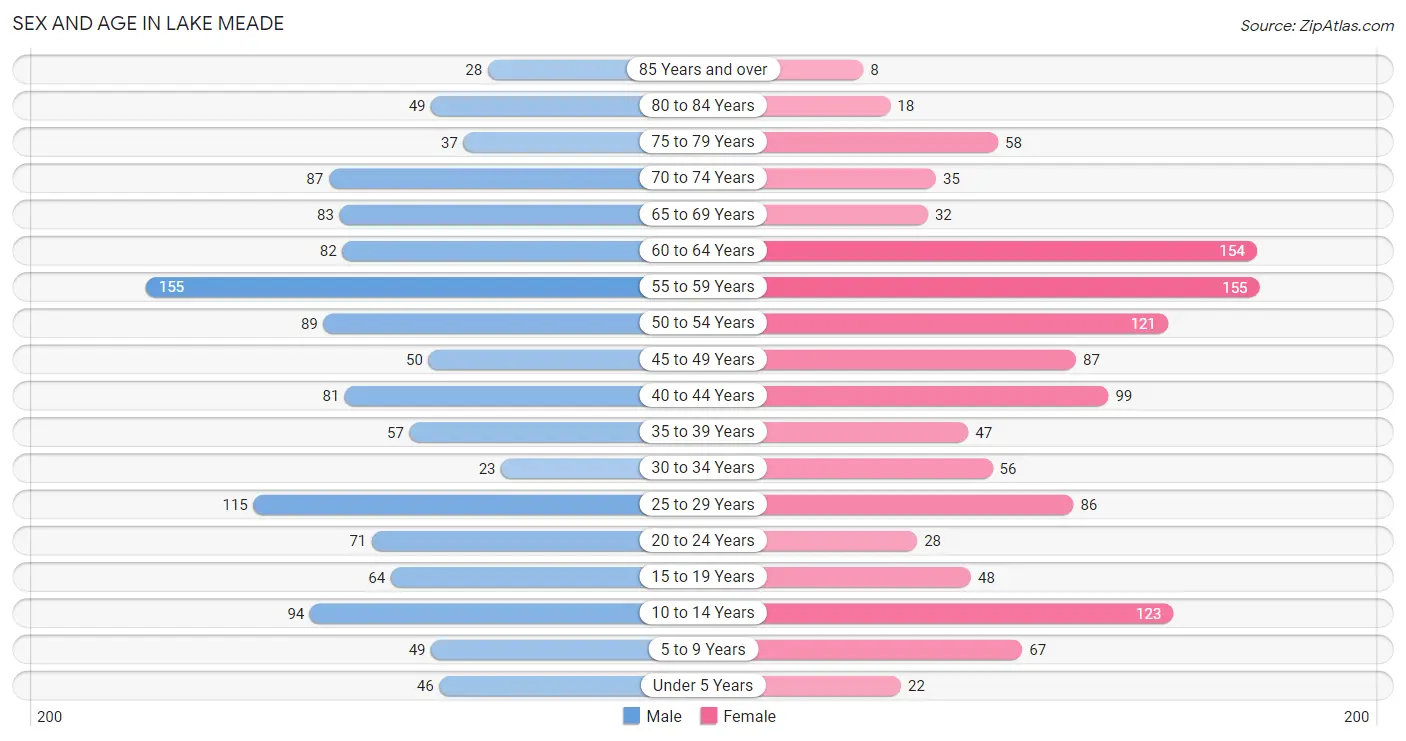
| Age Bracket | Male | Female |
| Under 5 Years | 46 (3.6%) | 22 (1.8%) |
| 5 to 9 Years | 49 (3.9%) | 67 (5.4%) |
| 10 to 14 Years | 94 (7.5%) | 123 (9.9%) |
| 15 to 19 Years | 64 (5.1%) | 48 (3.9%) |
| 20 to 24 Years | 71 (5.6%) | 28 (2.2%) |
| 25 to 29 Years | 115 (9.1%) | 86 (6.9%) |
| 30 to 34 Years | 23 (1.8%) | 56 (4.5%) |
| 35 to 39 Years | 57 (4.5%) | 47 (3.8%) |
| 40 to 44 Years | 81 (6.4%) | 99 (8.0%) |
| 45 to 49 Years | 50 (4.0%) | 87 (7.0%) |
| 50 to 54 Years | 89 (7.1%) | 121 (9.7%) |
| 55 to 59 Years | 155 (12.3%) | 155 (12.5%) |
| 60 to 64 Years | 82 (6.5%) | 154 (12.4%) |
| 65 to 69 Years | 83 (6.6%) | 32 (2.6%) |
| 70 to 74 Years | 87 (6.9%) | 35 (2.8%) |
| 75 to 79 Years | 37 (2.9%) | 58 (4.7%) |
| 80 to 84 Years | 49 (3.9%) | 18 (1.5%) |
| 85 Years and over | 28 (2.2%) | 8 (0.6%) |
| Total | 1,260 (100.0%) | 1,244 (100.0%) |
Families and Households in Lake Meade
Median Family Size in Lake Meade
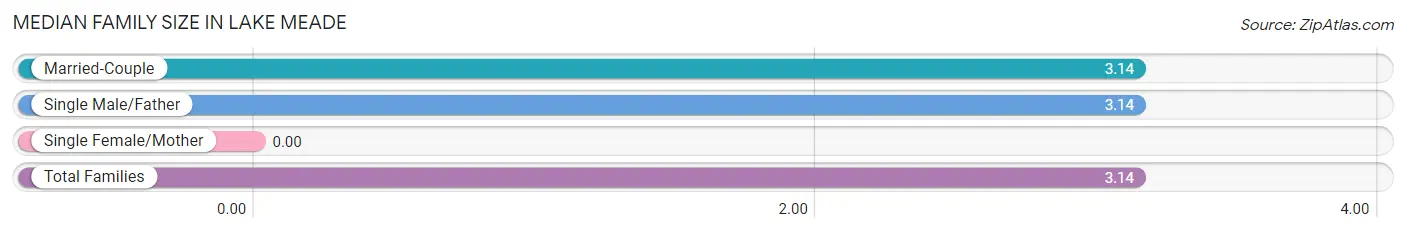
| Family Type | # Families | Family Size |
| Married-Couple | 706 (99.0%) | 3.14 |
| Single Male/Father | 7 (1.0%) | 3.14 |
| Single Female/Mother | 0 (0.0%) | - |
| Total Families | 713 (100.0%) | 3.14 |
Median Household Size in Lake Meade
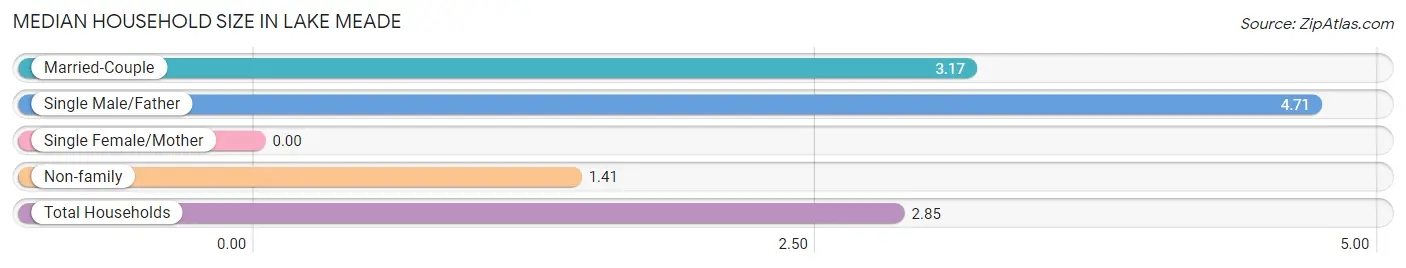
| Household Type | # Households | Household Size |
| Married-Couple | 706 (80.4%) | 3.17 |
| Single Male/Father | 7 (0.8%) | 4.71 |
| Single Female/Mother | 0 (0.0%) | - |
| Non-family | 165 (18.8%) | 1.41 |
| Total Households | 878 (100.0%) | 2.85 |
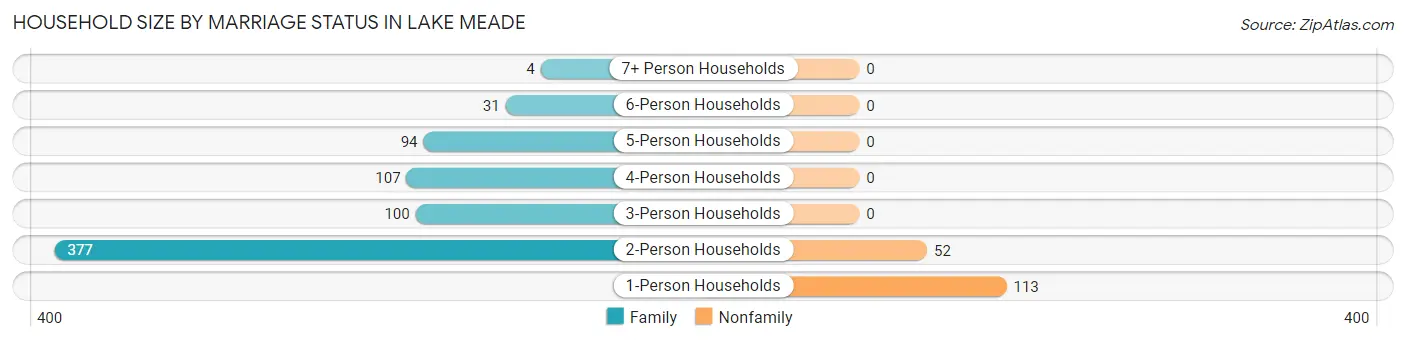
Household Size by Marriage Status in Lake Meade
Out of a total of 878 households in Lake Meade, 713 (81.2%) are family households, while 165 (18.8%) are nonfamily households. The most numerous type of family households are 2-person households, comprising 377, and the most common type of nonfamily households are 1-person households, comprising 113.
| Household Size | Family Households | Nonfamily Households |
| 1-Person Households | - | 113 (12.9%) |
| 2-Person Households | 377 (42.9%) | 52 (5.9%) |
| 3-Person Households | 100 (11.4%) | 0 (0.0%) |
| 4-Person Households | 107 (12.2%) | 0 (0.0%) |
| 5-Person Households | 94 (10.7%) | 0 (0.0%) |
| 6-Person Households | 31 (3.5%) | 0 (0.0%) |
| 7+ Person Households | 4 (0.5%) | 0 (0.0%) |
| Total | 713 (81.2%) | 165 (18.8%) |
Female Fertility in Lake Meade
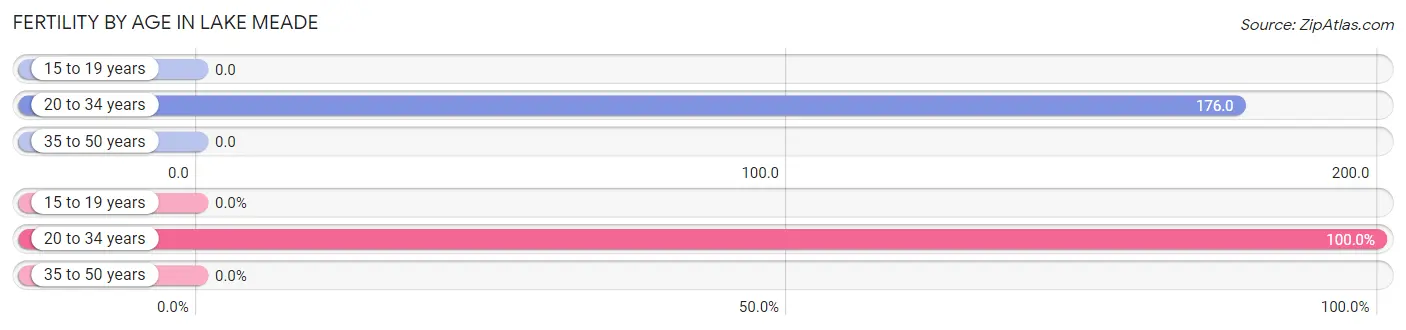
Fertility by Age in Lake Meade
Average fertility rate in Lake Meade is 64.0 births per 1,000 women. Women in the age bracket of 20 to 34 years have the highest fertility rate with 176.0 births per 1,000 women. Women in the age bracket of 20 to 34 years acount for 100.0% of all women with births.
| Age Bracket | Women with Births | Births / 1,000 Women |
| 15 to 19 years | 0 (0.0%) | 0.0 |
| 20 to 34 years | 30 (100.0%) | 176.0 |
| 35 to 50 years | 0 (0.0%) | 0.0 |
| Total | 30 (100.0%) | 64.0 |
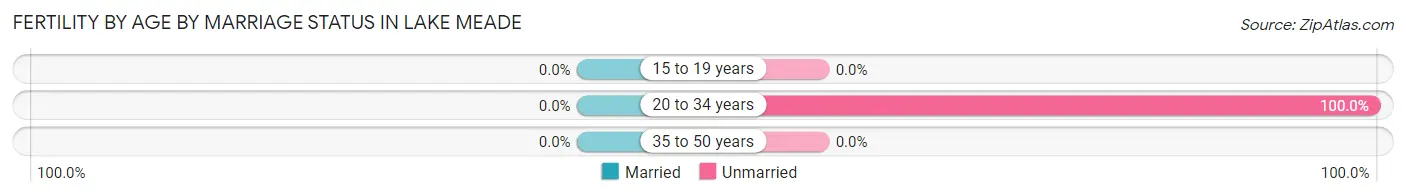
Fertility by Age by Marriage Status in Lake Meade
| Age Bracket | Married | Unmarried |
| 15 to 19 years | 0 (0.0%) | 0 (0.0%) |
| 20 to 34 years | 0 (0.0%) | 30 (100.0%) |
| 35 to 50 years | 0 (0.0%) | 0 (0.0%) |
| Total | 0 (0.0%) | 30 (100.0%) |
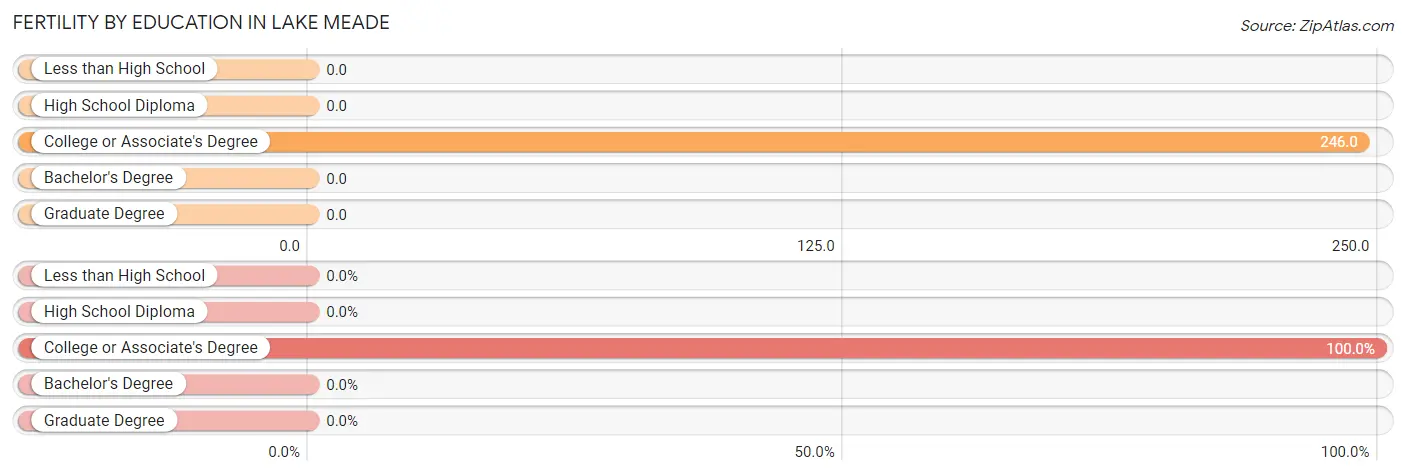
Fertility by Education in Lake Meade
| Educational Attainment | Women with Births | Births / 1,000 Women |
| Less than High School | 0 (0.0%) | 0.0 |
| High School Diploma | 0 (0.0%) | 0.0 |
| College or Associate's Degree | 30 (100.0%) | 246.0 |
| Bachelor's Degree | 0 (0.0%) | 0.0 |
| Graduate Degree | 0 (0.0%) | 0.0 |
| Total | 30 (100.0%) | 64.0 |
Fertility by Education by Marriage Status in Lake Meade
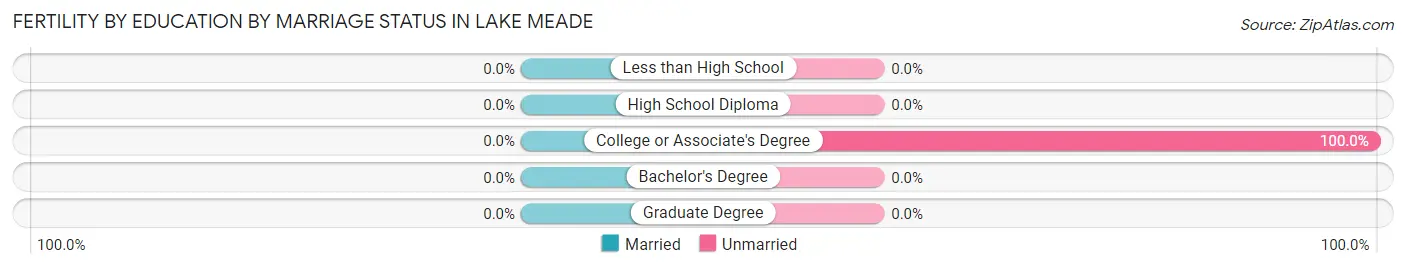
| Educational Attainment | Married | Unmarried |
| Less than High School | 0 (0.0%) | 0 (0.0%) |
| High School Diploma | 0 (0.0%) | 0 (0.0%) |
| College or Associate's Degree | 0 (0.0%) | 30 (100.0%) |
| Bachelor's Degree | 0 (0.0%) | 0 (0.0%) |
| Graduate Degree | 0 (0.0%) | 0 (0.0%) |
| Total | 0 (0.0%) | 30 (100.0%) |
Employment Characteristics in Lake Meade
Employment by Class of Employer in Lake Meade
Among the 1,442 employed individuals in Lake Meade, private company employees (944 | 65.5%), self-employed (not incorporated) (134 | 9.3%), and not-for-profit organizations (131 | 9.1%) make up the most common classes of employment.
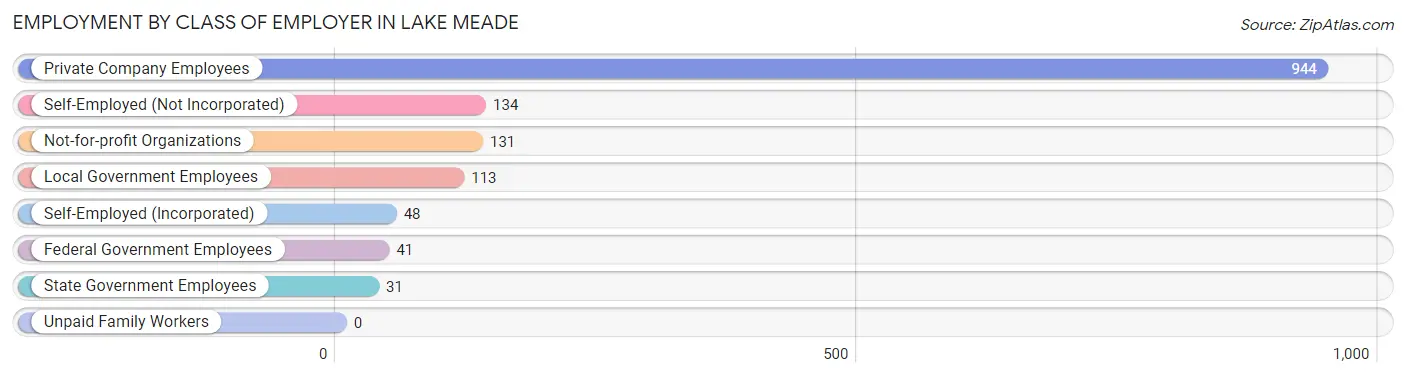
| Employer Class | # Employees | % Employees |
| Private Company Employees | 944 | 65.5% |
| Self-Employed (Incorporated) | 48 | 3.3% |
| Self-Employed (Not Incorporated) | 134 | 9.3% |
| Not-for-profit Organizations | 131 | 9.1% |
| Local Government Employees | 113 | 7.8% |
| State Government Employees | 31 | 2.1% |
| Federal Government Employees | 41 | 2.8% |
| Unpaid Family Workers | 0 | 0.0% |
| Total | 1,442 | 100.0% |
Employment Status by Age in Lake Meade
According to the labor force statistics for Lake Meade, out of the total population over 16 years of age (2,044), 74.4% or 1,521 individuals are in the labor force, with 2.6% or 40 of them unemployed. The age group with the highest labor force participation rate is 20 to 24 years, with 100.0% or 99 individuals in the labor force. Within the labor force, the 16 to 19 years age range has the highest percentage of unemployed individuals, with 70.5% or 31 of them being unemployed.
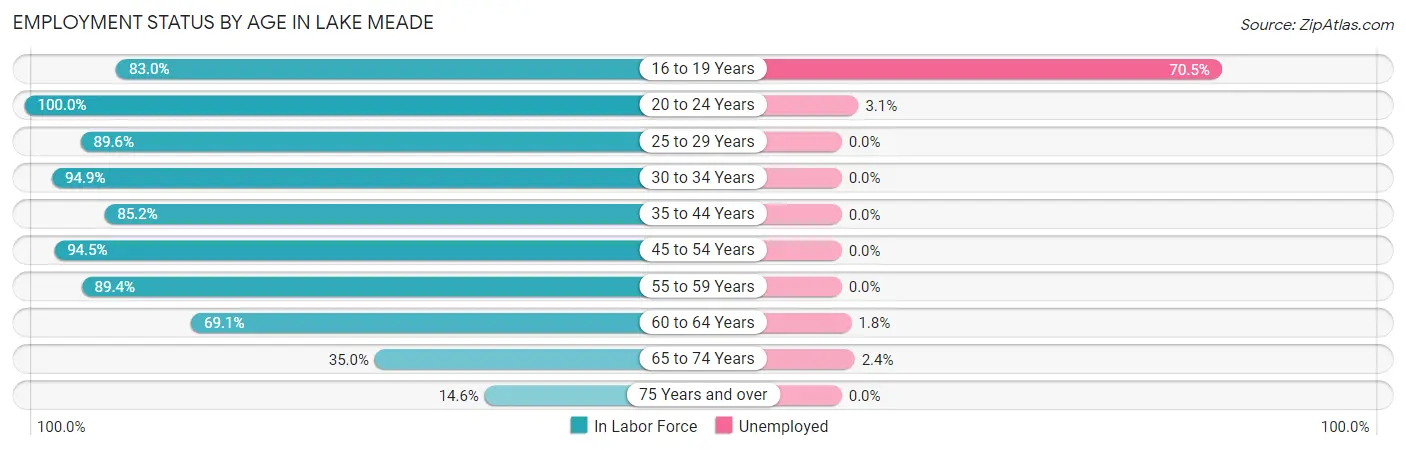
| Age Bracket | In Labor Force | Unemployed |
| 16 to 19 Years | 44 (83.0%) | 31 (70.5%) |
| 20 to 24 Years | 99 (100.0%) | 3 (3.1%) |
| 25 to 29 Years | 180 (89.6%) | 0 (0.0%) |
| 30 to 34 Years | 75 (94.9%) | 0 (0.0%) |
| 35 to 44 Years | 242 (85.2%) | 0 (0.0%) |
| 45 to 54 Years | 328 (94.5%) | 0 (0.0%) |
| 55 to 59 Years | 277 (89.4%) | 0 (0.0%) |
| 60 to 64 Years | 163 (69.1%) | 3 (1.8%) |
| 65 to 74 Years | 83 (35.0%) | 2 (2.4%) |
| 75 Years and over | 29 (14.6%) | 0 (0.0%) |
| Total | 1,521 (74.4%) | 40 (2.6%) |
Employment Status by Educational Attainment in Lake Meade
According to labor force statistics for Lake Meade, 86.8% of individuals (1,265) out of the total population between 25 and 64 years of age (1,457) are in the labor force, with 0.2% or 3 of them being unemployed. The group with the highest labor force participation rate are those with the educational attainment of bachelor's degree or higher, with 93.1% or 608 individuals in the labor force. Within the labor force, individuals with bachelor's degree or higher education have the highest percentage of unemployment, with 0.5% or 3 of them being unemployed.
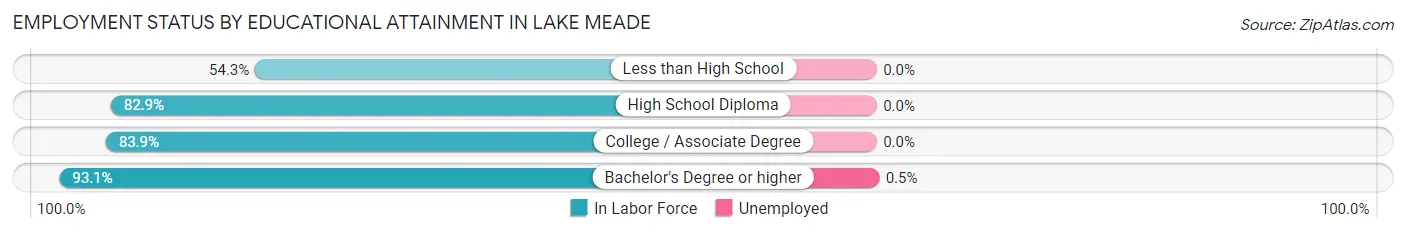
| Educational Attainment | In Labor Force | Unemployed |
| Less than High School | 25 (54.3%) | 0 (0.0%) |
| High School Diploma | 330 (82.9%) | 0 (0.0%) |
| College / Associate Degree | 302 (83.9%) | 0 (0.0%) |
| Bachelor's Degree or higher | 608 (93.1%) | 3 (0.5%) |
| Total | 1,265 (86.8%) | 3 (0.2%) |
Employment Occupations by Sex in Lake Meade
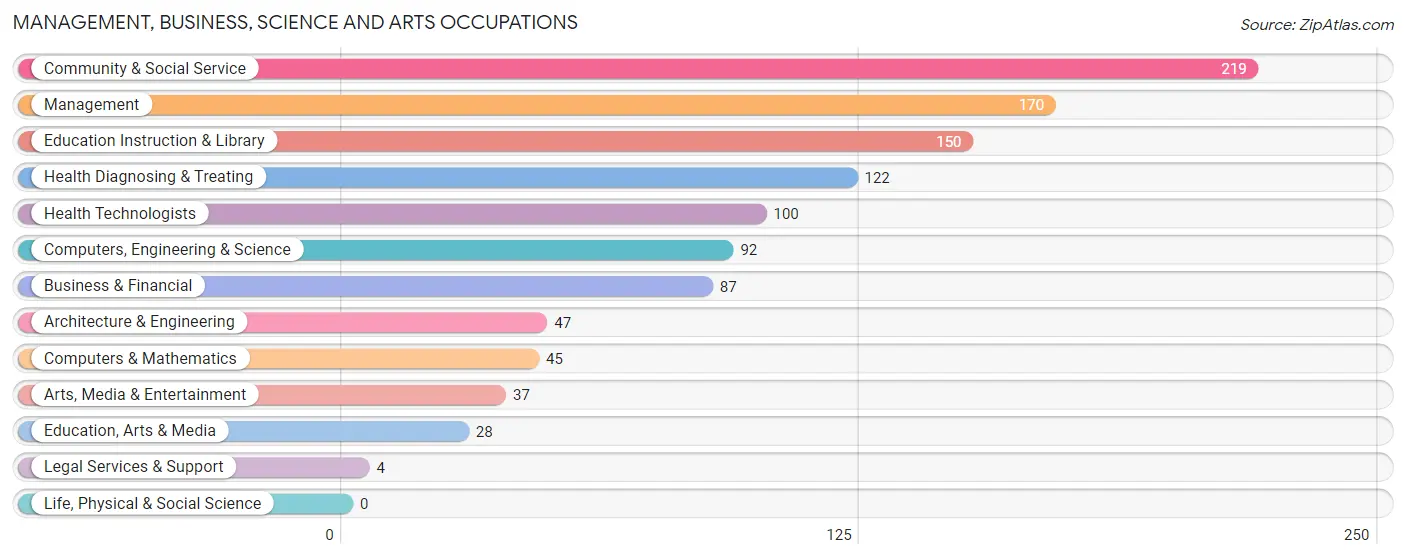
Management, Business, Science and Arts Occupations
The most common Management, Business, Science and Arts occupations in Lake Meade are Community & Social Service (219 | 14.8%), Management (170 | 11.5%), Education Instruction & Library (150 | 10.1%), Health Diagnosing & Treating (122 | 8.2%), and Health Technologists (100 | 6.8%).
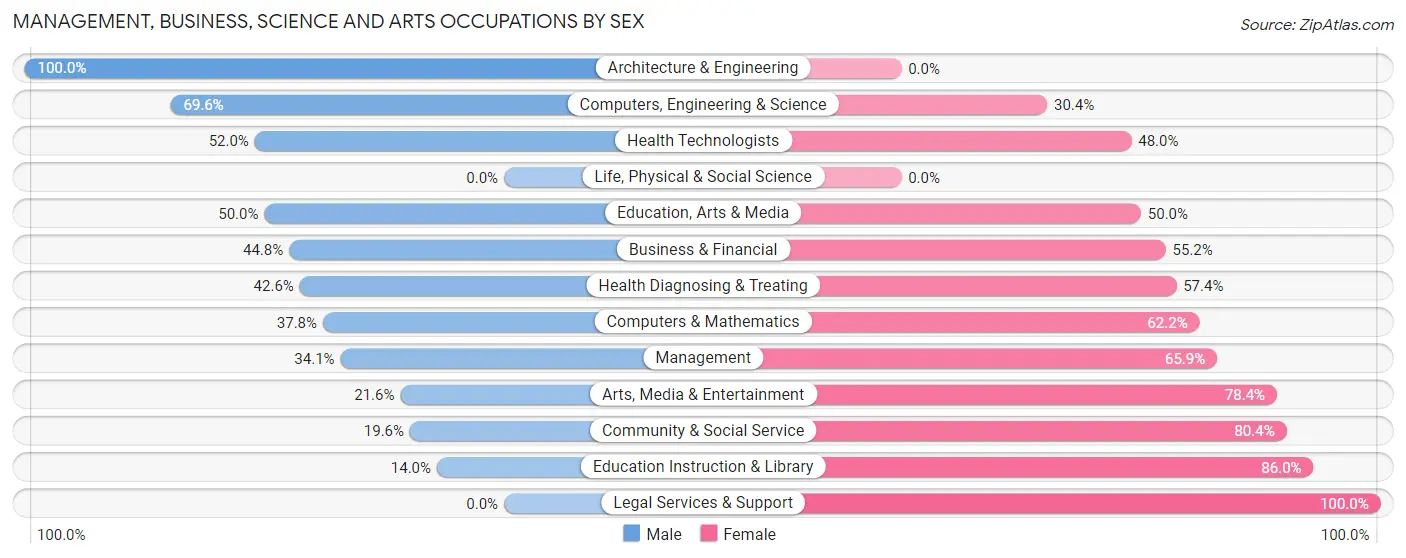
Management, Business, Science and Arts Occupations by Sex
Within the Management, Business, Science and Arts occupations in Lake Meade, the most male-oriented occupations are Architecture & Engineering (100.0%), Computers, Engineering & Science (69.6%), and Health Technologists (52.0%), while the most female-oriented occupations are Legal Services & Support (100.0%), Education Instruction & Library (86.0%), and Community & Social Service (80.4%).
| Occupation | Male | Female |
| Management | 58 (34.1%) | 112 (65.9%) |
| Business & Financial | 39 (44.8%) | 48 (55.2%) |
| Computers, Engineering & Science | 64 (69.6%) | 28 (30.4%) |
| Computers & Mathematics | 17 (37.8%) | 28 (62.2%) |
| Architecture & Engineering | 47 (100.0%) | 0 (0.0%) |
| Life, Physical & Social Science | 0 (0.0%) | 0 (0.0%) |
| Community & Social Service | 43 (19.6%) | 176 (80.4%) |
| Education, Arts & Media | 14 (50.0%) | 14 (50.0%) |
| Legal Services & Support | 0 (0.0%) | 4 (100.0%) |
| Education Instruction & Library | 21 (14.0%) | 129 (86.0%) |
| Arts, Media & Entertainment | 8 (21.6%) | 29 (78.4%) |
| Health Diagnosing & Treating | 52 (42.6%) | 70 (57.4%) |
| Health Technologists | 52 (52.0%) | 48 (48.0%) |
| Total (Category) | 256 (37.1%) | 434 (62.9%) |
| Total (Overall) | 748 (50.5%) | 732 (49.5%) |
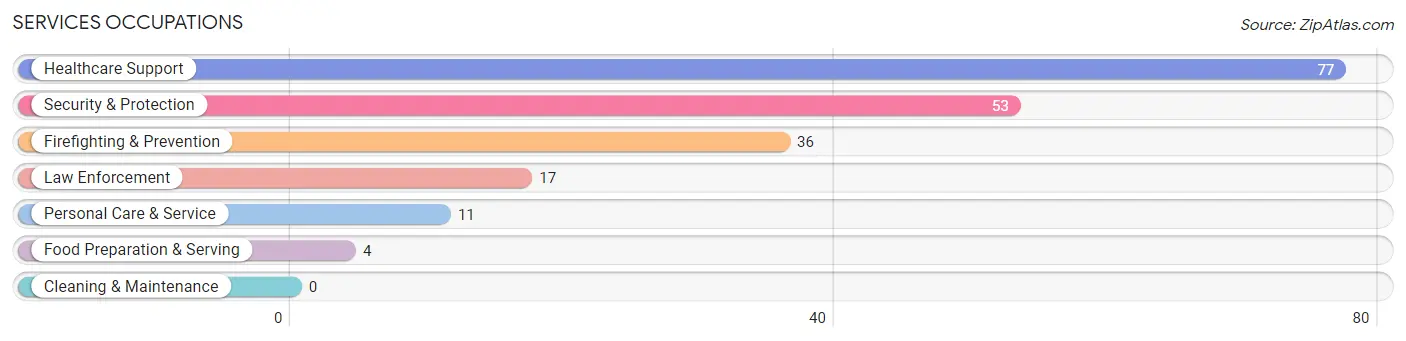
Services Occupations
The most common Services occupations in Lake Meade are Healthcare Support (77 | 5.2%), Security & Protection (53 | 3.6%), Firefighting & Prevention (36 | 2.4%), Law Enforcement (17 | 1.1%), and Personal Care & Service (11 | 0.7%).
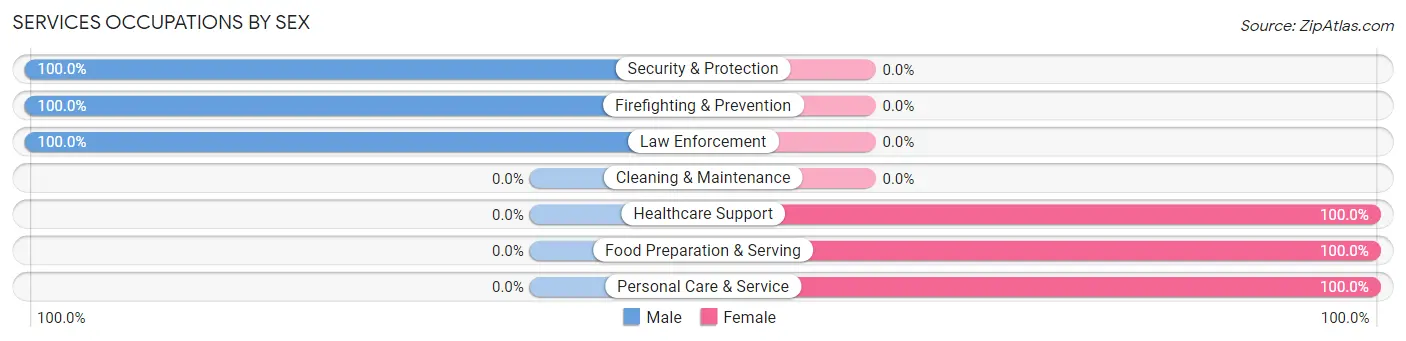
Services Occupations by Sex
Within the Services occupations in Lake Meade, the most male-oriented occupations are Security & Protection (100.0%), Firefighting & Prevention (100.0%), and Law Enforcement (100.0%), while the most female-oriented occupations are Healthcare Support (100.0%), Food Preparation & Serving (100.0%), and Personal Care & Service (100.0%).
| Occupation | Male | Female |
| Healthcare Support | 0 (0.0%) | 77 (100.0%) |
| Security & Protection | 53 (100.0%) | 0 (0.0%) |
| Firefighting & Prevention | 36 (100.0%) | 0 (0.0%) |
| Law Enforcement | 17 (100.0%) | 0 (0.0%) |
| Food Preparation & Serving | 0 (0.0%) | 4 (100.0%) |
| Cleaning & Maintenance | 0 (0.0%) | 0 (0.0%) |
| Personal Care & Service | 0 (0.0%) | 11 (100.0%) |
| Total (Category) | 53 (36.5%) | 92 (63.4%) |
| Total (Overall) | 748 (50.5%) | 732 (49.5%) |
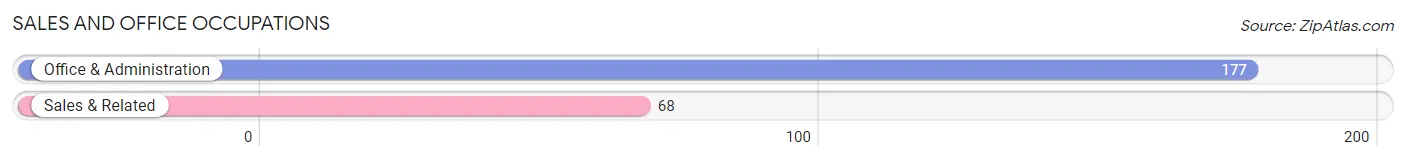
Sales and Office Occupations
The most common Sales and Office occupations in Lake Meade are Office & Administration (177 | 12.0%), and Sales & Related (68 | 4.6%).
Sales and Office Occupations by Sex
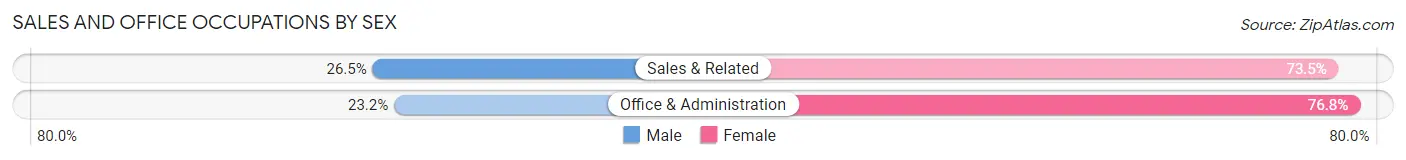
| Occupation | Male | Female |
| Sales & Related | 18 (26.5%) | 50 (73.5%) |
| Office & Administration | 41 (23.2%) | 136 (76.8%) |
| Total (Category) | 59 (24.1%) | 186 (75.9%) |
| Total (Overall) | 748 (50.5%) | 732 (49.5%) |
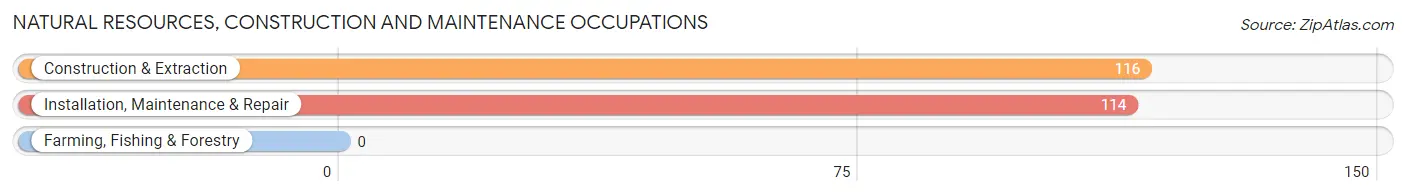
Natural Resources, Construction and Maintenance Occupations
The most common Natural Resources, Construction and Maintenance occupations in Lake Meade are Construction & Extraction (116 | 7.8%), and Installation, Maintenance & Repair (114 | 7.7%).
Natural Resources, Construction and Maintenance Occupations by Sex
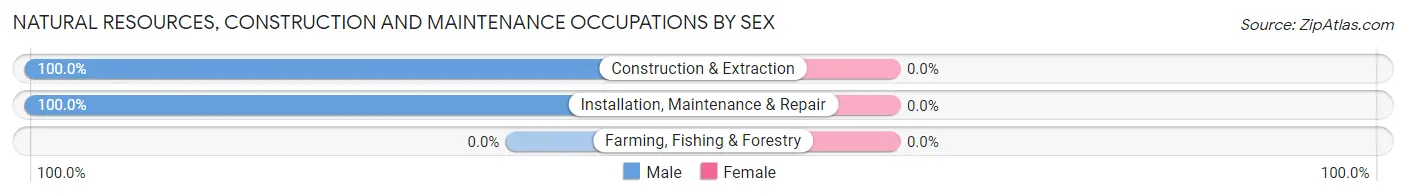
| Occupation | Male | Female |
| Farming, Fishing & Forestry | 0 (0.0%) | 0 (0.0%) |
| Construction & Extraction | 116 (100.0%) | 0 (0.0%) |
| Installation, Maintenance & Repair | 114 (100.0%) | 0 (0.0%) |
| Total (Category) | 230 (100.0%) | 0 (0.0%) |
| Total (Overall) | 748 (50.5%) | 732 (49.5%) |
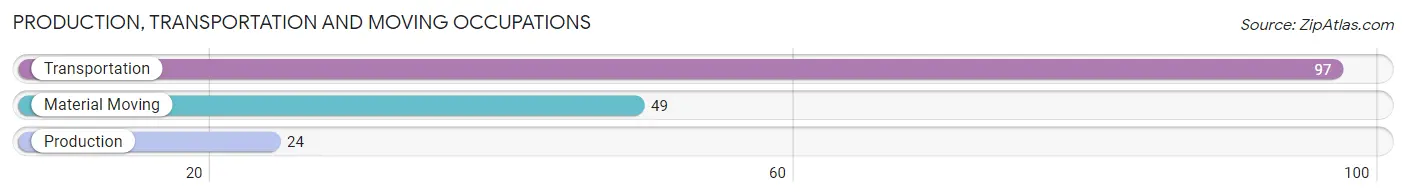
Production, Transportation and Moving Occupations
The most common Production, Transportation and Moving occupations in Lake Meade are Transportation (97 | 6.6%), Material Moving (49 | 3.3%), and Production (24 | 1.6%).
Production, Transportation and Moving Occupations by Sex
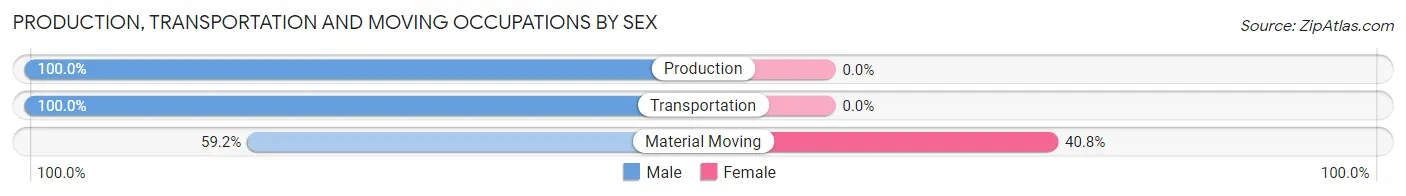
| Occupation | Male | Female |
| Production | 24 (100.0%) | 0 (0.0%) |
| Transportation | 97 (100.0%) | 0 (0.0%) |
| Material Moving | 29 (59.2%) | 20 (40.8%) |
| Total (Category) | 150 (88.2%) | 20 (11.8%) |
| Total (Overall) | 748 (50.5%) | 732 (49.5%) |
Employment Industries by Sex in Lake Meade
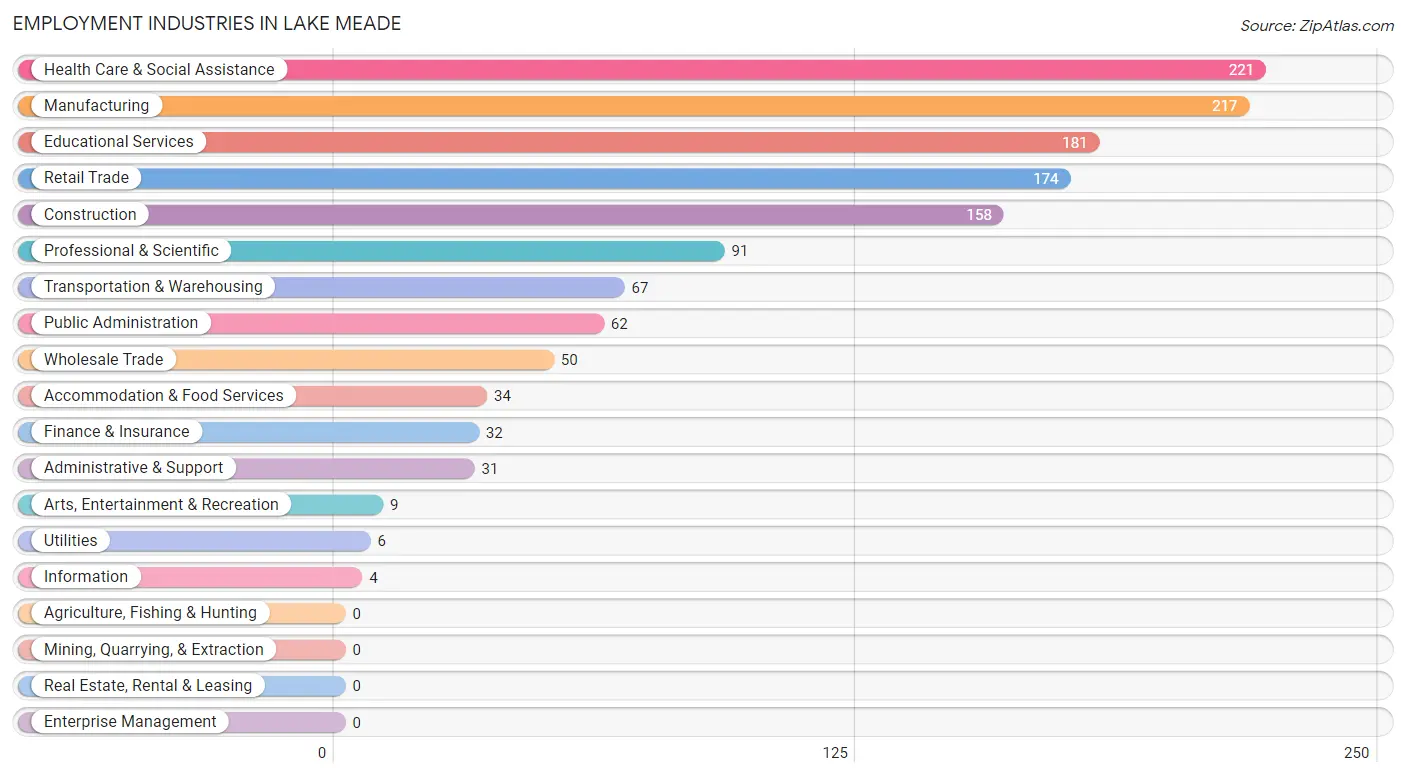
Employment Industries in Lake Meade
The major employment industries in Lake Meade include Health Care & Social Assistance (221 | 14.9%), Manufacturing (217 | 14.7%), Educational Services (181 | 12.2%), Retail Trade (174 | 11.8%), and Construction (158 | 10.7%).
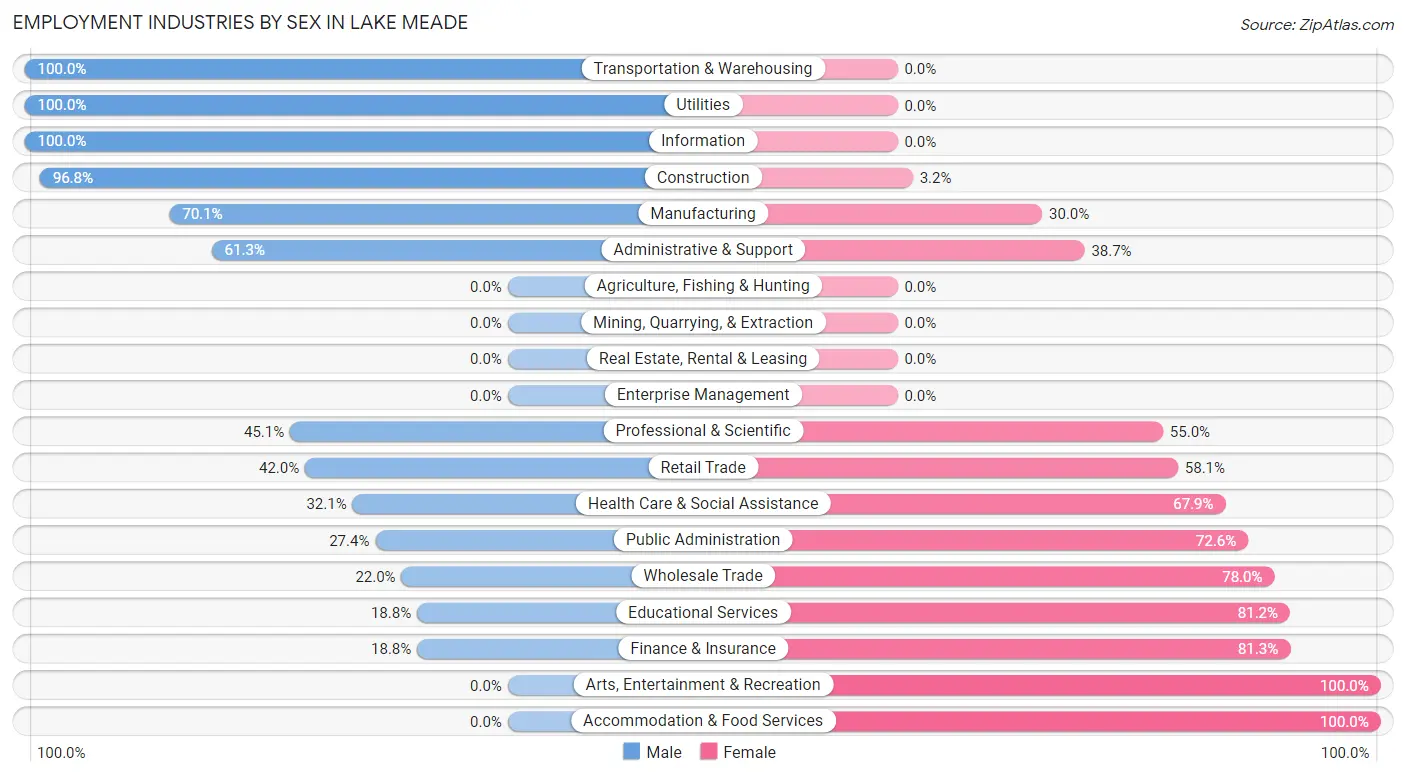
Employment Industries by Sex in Lake Meade
The Lake Meade industries that see more men than women are Transportation & Warehousing (100.0%), Utilities (100.0%), and Information (100.0%), whereas the industries that tend to have a higher number of women are Arts, Entertainment & Recreation (100.0%), Accommodation & Food Services (100.0%), and Finance & Insurance (81.2%).
| Industry | Male | Female |
| Agriculture, Fishing & Hunting | 0 (0.0%) | 0 (0.0%) |
| Mining, Quarrying, & Extraction | 0 (0.0%) | 0 (0.0%) |
| Construction | 153 (96.8%) | 5 (3.2%) |
| Manufacturing | 152 (70.1%) | 65 (29.9%) |
| Wholesale Trade | 11 (22.0%) | 39 (78.0%) |
| Retail Trade | 73 (41.9%) | 101 (58.1%) |
| Transportation & Warehousing | 67 (100.0%) | 0 (0.0%) |
| Utilities | 6 (100.0%) | 0 (0.0%) |
| Information | 4 (100.0%) | 0 (0.0%) |
| Finance & Insurance | 6 (18.8%) | 26 (81.2%) |
| Real Estate, Rental & Leasing | 0 (0.0%) | 0 (0.0%) |
| Professional & Scientific | 41 (45.1%) | 50 (54.9%) |
| Enterprise Management | 0 (0.0%) | 0 (0.0%) |
| Administrative & Support | 19 (61.3%) | 12 (38.7%) |
| Educational Services | 34 (18.8%) | 147 (81.2%) |
| Health Care & Social Assistance | 71 (32.1%) | 150 (67.9%) |
| Arts, Entertainment & Recreation | 0 (0.0%) | 9 (100.0%) |
| Accommodation & Food Services | 0 (0.0%) | 34 (100.0%) |
| Public Administration | 17 (27.4%) | 45 (72.6%) |
| Total | 748 (50.5%) | 732 (49.5%) |
Education in Lake Meade
School Enrollment in Lake Meade
The most common levels of schooling among the 504 students in Lake Meade are middle school (172 | 34.1%), elementary school (145 | 28.8%), and high school (103 | 20.4%).
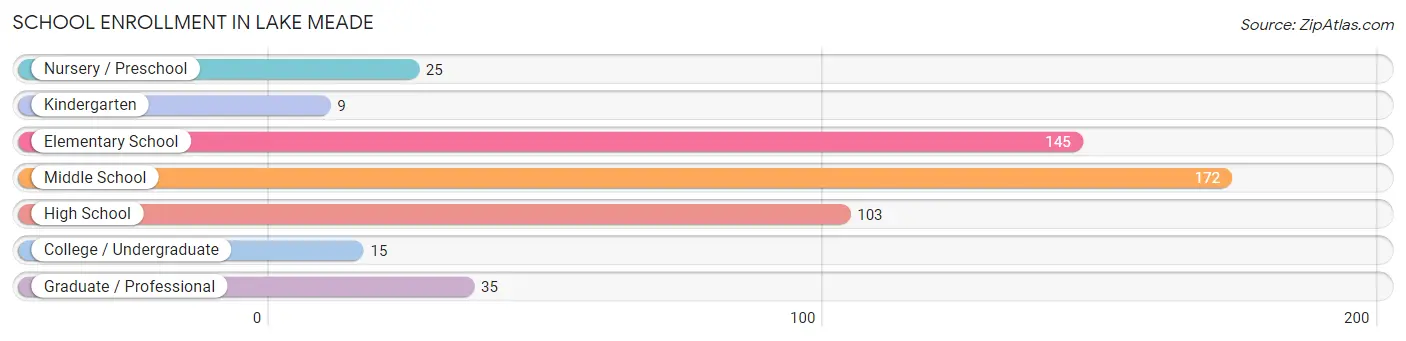
| School Level | # Students | % Students |
| Nursery / Preschool | 25 | 5.0% |
| Kindergarten | 9 | 1.8% |
| Elementary School | 145 | 28.8% |
| Middle School | 172 | 34.1% |
| High School | 103 | 20.4% |
| College / Undergraduate | 15 | 3.0% |
| Graduate / Professional | 35 | 6.9% |
| Total | 504 | 100.0% |
School Enrollment by Age by Funding Source in Lake Meade
Out of a total of 504 students who are enrolled in schools in Lake Meade, 46 (9.1%) attend a private institution, while the remaining 458 (90.9%) are enrolled in public schools. The age group of 18 to 19 year olds has the highest likelihood of being enrolled in private schools, with 9 (100.0% in the age bracket) enrolled. Conversely, the age group of 3 to 4 year olds has the lowest likelihood of being enrolled in a private school, with 25 (100.0% in the age bracket) attending a public institution.
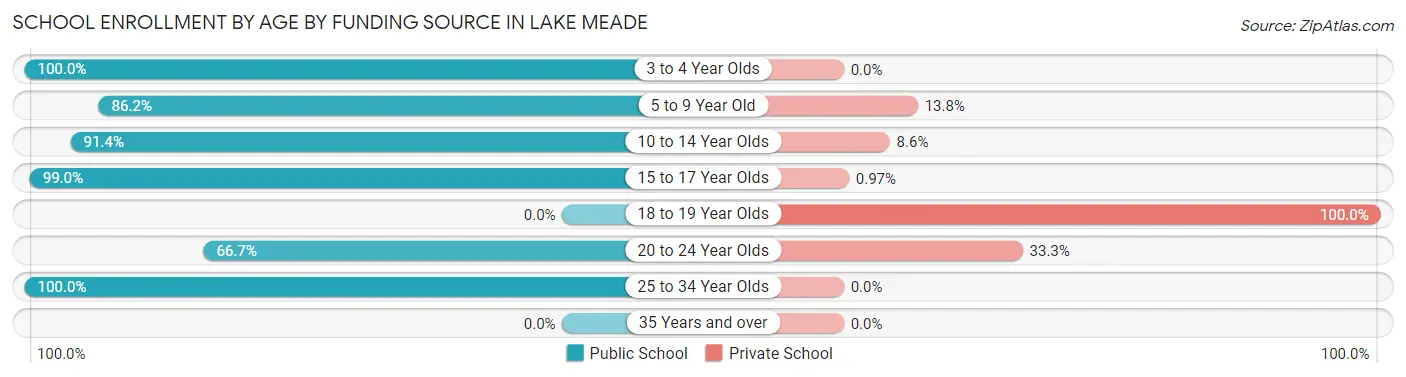
| Age Bracket | Public School | Private School |
| 3 to 4 Year Olds | 25 (100.0%) | 0 (0.0%) |
| 5 to 9 Year Old | 100 (86.2%) | 16 (13.8%) |
| 10 to 14 Year Olds | 192 (91.4%) | 18 (8.6%) |
| 15 to 17 Year Olds | 102 (99.0%) | 1 (1.0%) |
| 18 to 19 Year Olds | 0 (0.0%) | 9 (100.0%) |
| 20 to 24 Year Olds | 4 (66.7%) | 2 (33.3%) |
| 25 to 34 Year Olds | 35 (100.0%) | 0 (0.0%) |
| 35 Years and over | 0 (0.0%) | 0 (0.0%) |
| Total | 458 (90.9%) | 46 (9.1%) |
Educational Attainment by Field of Study in Lake Meade
Education (192 | 22.7%), business (173 | 20.4%), science & technology (138 | 16.3%), liberal arts & history (76 | 9.0%), and engineering (61 | 7.2%) are the most common fields of study among 847 individuals in Lake Meade who have obtained a bachelor's degree or higher.
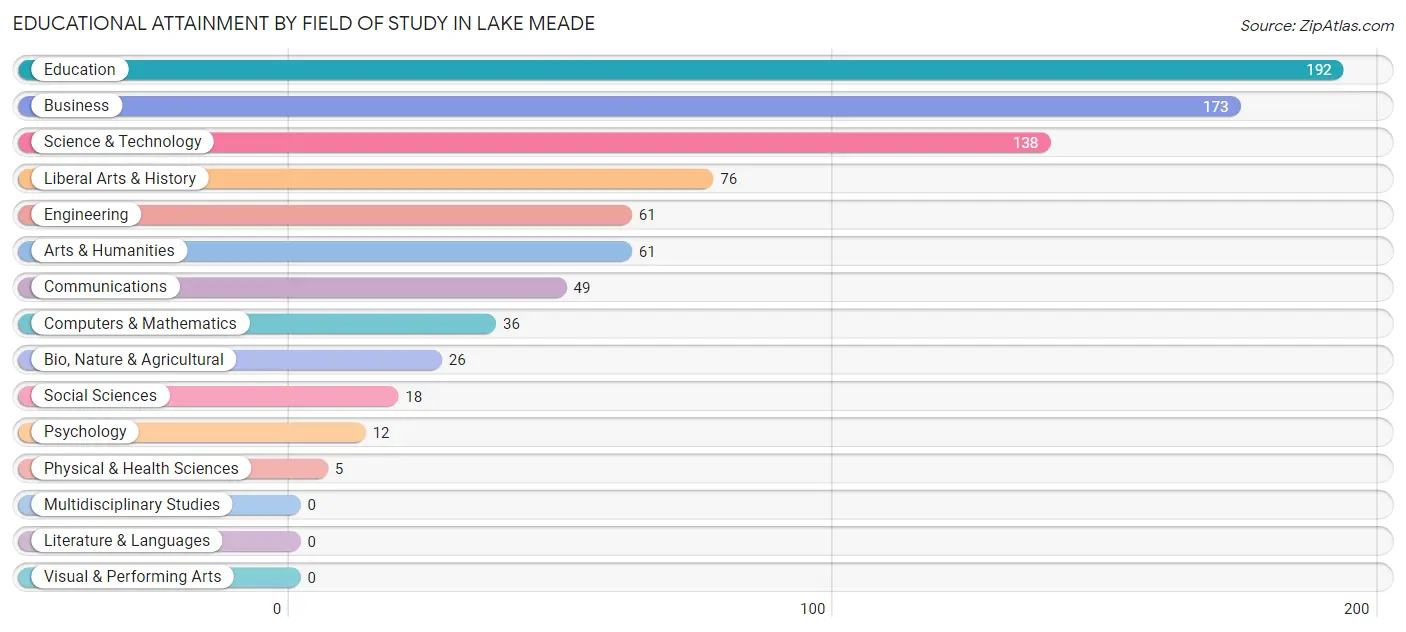
| Field of Study | # Graduates | % Graduates |
| Computers & Mathematics | 36 | 4.3% |
| Bio, Nature & Agricultural | 26 | 3.1% |
| Physical & Health Sciences | 5 | 0.6% |
| Psychology | 12 | 1.4% |
| Social Sciences | 18 | 2.1% |
| Engineering | 61 | 7.2% |
| Multidisciplinary Studies | 0 | 0.0% |
| Science & Technology | 138 | 16.3% |
| Business | 173 | 20.4% |
| Education | 192 | 22.7% |
| Literature & Languages | 0 | 0.0% |
| Liberal Arts & History | 76 | 9.0% |
| Visual & Performing Arts | 0 | 0.0% |
| Communications | 49 | 5.8% |
| Arts & Humanities | 61 | 7.2% |
| Total | 847 | 100.0% |
Transportation & Commute in Lake Meade
Vehicle Availability by Sex in Lake Meade
The most prevalent vehicle ownership categories in Lake Meade are males with 2 vehicles (297, accounting for 39.9%) and females with 2 vehicles (275, making up 42.5%).
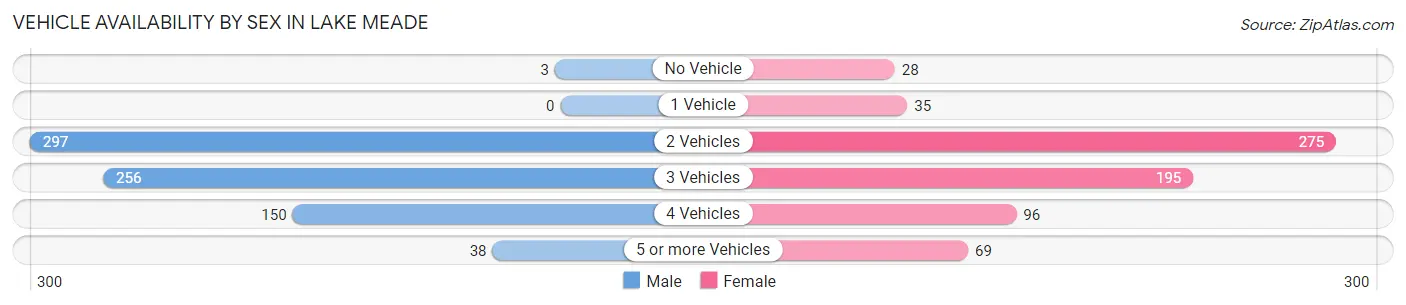
| Vehicles Available | Male | Female |
| No Vehicle | 3 (0.4%) | 28 (4.0%) |
| 1 Vehicle | 0 (0.0%) | 35 (5.0%) |
| 2 Vehicles | 297 (39.9%) | 275 (39.4%) |
| 3 Vehicles | 256 (34.4%) | 195 (27.9%) |
| 4 Vehicles | 150 (20.2%) | 96 (13.8%) |
| 5 or more Vehicles | 38 (5.1%) | 69 (9.9%) |
| Total | 744 (100.0%) | 698 (100.0%) |
Commute Time in Lake Meade
The most frequently occuring commute durations in Lake Meade are 45 to 59 minutes (273 commuters, 20.3%), 30 to 34 minutes (224 commuters, 16.6%), and 25 to 29 minutes (180 commuters, 13.4%).
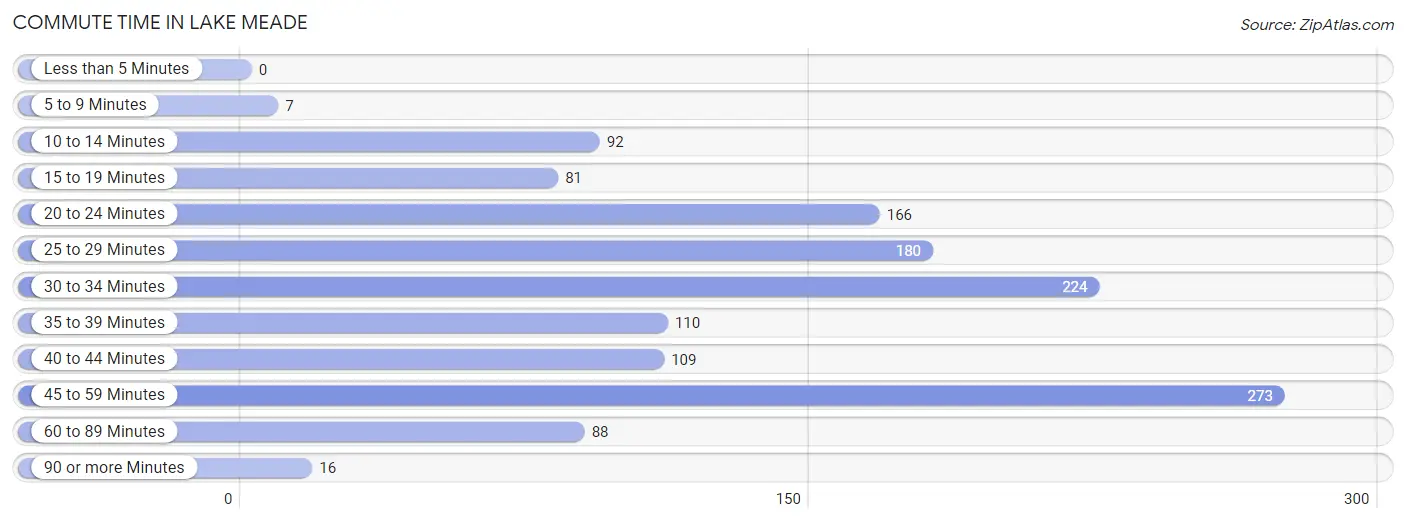
| Commute Time | # Commuters | % Commuters |
| Less than 5 Minutes | 0 | 0.0% |
| 5 to 9 Minutes | 7 | 0.5% |
| 10 to 14 Minutes | 92 | 6.8% |
| 15 to 19 Minutes | 81 | 6.0% |
| 20 to 24 Minutes | 166 | 12.3% |
| 25 to 29 Minutes | 180 | 13.4% |
| 30 to 34 Minutes | 224 | 16.6% |
| 35 to 39 Minutes | 110 | 8.2% |
| 40 to 44 Minutes | 109 | 8.1% |
| 45 to 59 Minutes | 273 | 20.3% |
| 60 to 89 Minutes | 88 | 6.5% |
| 90 or more Minutes | 16 | 1.2% |
Commute Time by Sex in Lake Meade
The most common commute times in Lake Meade are 45 to 59 minutes (160 commuters, 22.8%) for males and 45 to 59 minutes (113 commuters, 17.5%) for females.
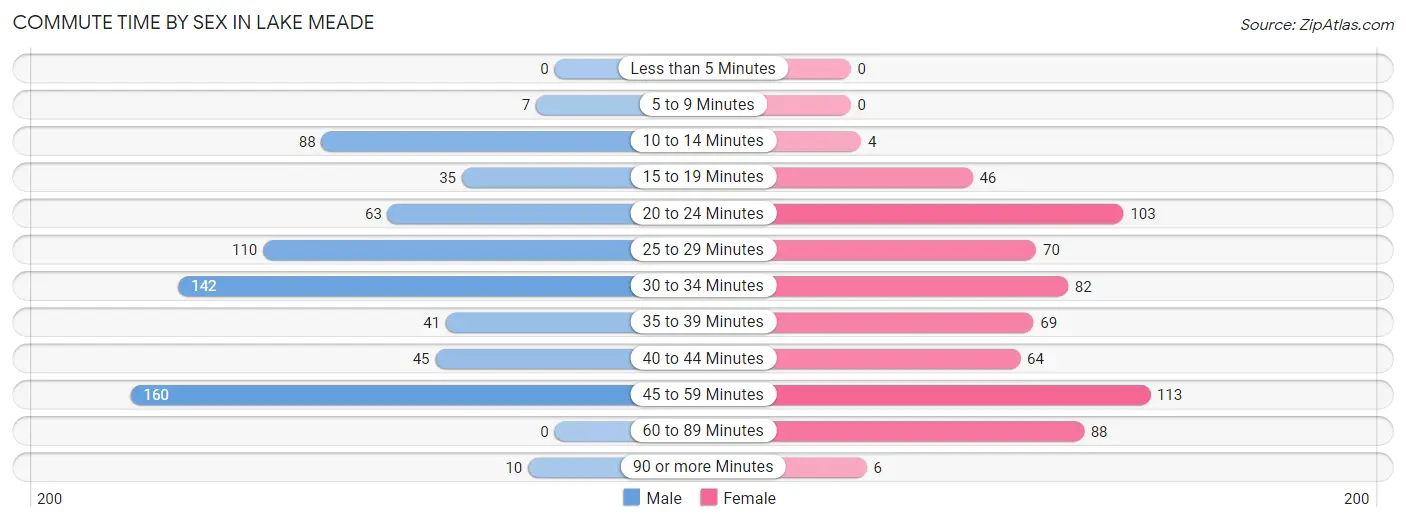
| Commute Time | Male | Female |
| Less than 5 Minutes | 0 (0.0%) | 0 (0.0%) |
| 5 to 9 Minutes | 7 (1.0%) | 0 (0.0%) |
| 10 to 14 Minutes | 88 (12.6%) | 4 (0.6%) |
| 15 to 19 Minutes | 35 (5.0%) | 46 (7.1%) |
| 20 to 24 Minutes | 63 (9.0%) | 103 (16.0%) |
| 25 to 29 Minutes | 110 (15.7%) | 70 (10.8%) |
| 30 to 34 Minutes | 142 (20.3%) | 82 (12.7%) |
| 35 to 39 Minutes | 41 (5.9%) | 69 (10.7%) |
| 40 to 44 Minutes | 45 (6.4%) | 64 (9.9%) |
| 45 to 59 Minutes | 160 (22.8%) | 113 (17.5%) |
| 60 to 89 Minutes | 0 (0.0%) | 88 (13.6%) |
| 90 or more Minutes | 10 (1.4%) | 6 (0.9%) |
Time of Departure to Work by Sex in Lake Meade
The most frequent times of departure to work in Lake Meade are 6:00 AM to 6:29 AM (142, 20.3%) for males and 7:00 AM to 7:29 AM (161, 25.0%) for females.
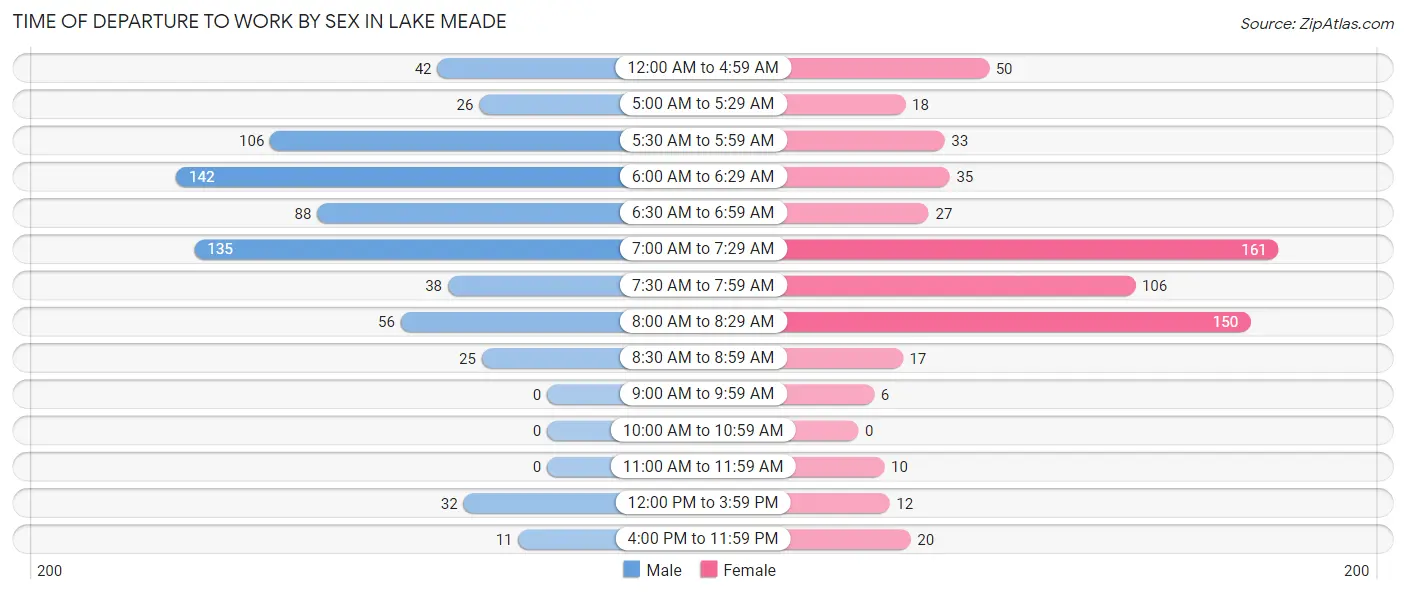
| Time of Departure | Male | Female |
| 12:00 AM to 4:59 AM | 42 (6.0%) | 50 (7.7%) |
| 5:00 AM to 5:29 AM | 26 (3.7%) | 18 (2.8%) |
| 5:30 AM to 5:59 AM | 106 (15.1%) | 33 (5.1%) |
| 6:00 AM to 6:29 AM | 142 (20.3%) | 35 (5.4%) |
| 6:30 AM to 6:59 AM | 88 (12.6%) | 27 (4.2%) |
| 7:00 AM to 7:29 AM | 135 (19.3%) | 161 (25.0%) |
| 7:30 AM to 7:59 AM | 38 (5.4%) | 106 (16.4%) |
| 8:00 AM to 8:29 AM | 56 (8.0%) | 150 (23.3%) |
| 8:30 AM to 8:59 AM | 25 (3.6%) | 17 (2.6%) |
| 9:00 AM to 9:59 AM | 0 (0.0%) | 6 (0.9%) |
| 10:00 AM to 10:59 AM | 0 (0.0%) | 0 (0.0%) |
| 11:00 AM to 11:59 AM | 0 (0.0%) | 10 (1.5%) |
| 12:00 PM to 3:59 PM | 32 (4.6%) | 12 (1.9%) |
| 4:00 PM to 11:59 PM | 11 (1.6%) | 20 (3.1%) |
| Total | 701 (100.0%) | 645 (100.0%) |
Housing Occupancy in Lake Meade
Occupancy by Ownership in Lake Meade
Of the total 878 dwellings in Lake Meade, owner-occupied units account for 874 (99.5%), while renter-occupied units make up 4 (0.5%).
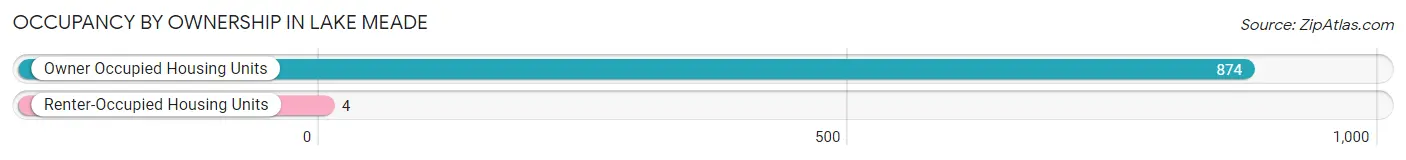
| Occupancy | # Housing Units | % Housing Units |
| Owner Occupied Housing Units | 874 | 99.5% |
| Renter-Occupied Housing Units | 4 | 0.5% |
| Total Occupied Housing Units | 878 | 100.0% |
Occupancy by Household Size in Lake Meade
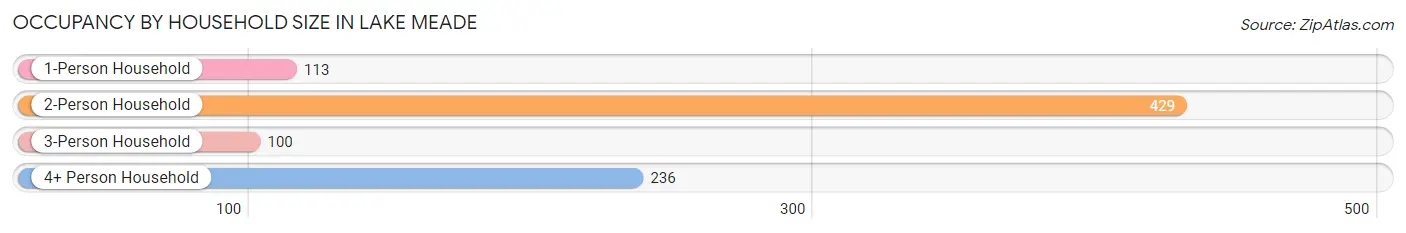
| Household Size | # Housing Units | % Housing Units |
| 1-Person Household | 113 | 12.9% |
| 2-Person Household | 429 | 48.9% |
| 3-Person Household | 100 | 11.4% |
| 4+ Person Household | 236 | 26.9% |
| Total Housing Units | 878 | 100.0% |
Occupancy by Ownership by Household Size in Lake Meade
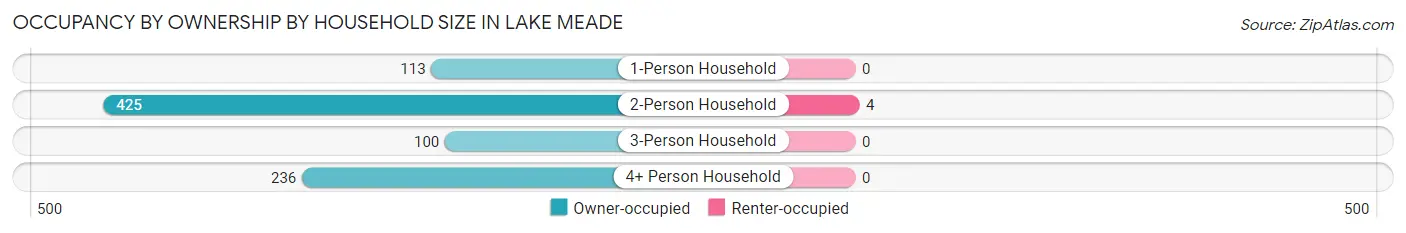
| Household Size | Owner-occupied | Renter-occupied |
| 1-Person Household | 113 (100.0%) | 0 (0.0%) |
| 2-Person Household | 425 (99.1%) | 4 (0.9%) |
| 3-Person Household | 100 (100.0%) | 0 (0.0%) |
| 4+ Person Household | 236 (100.0%) | 0 (0.0%) |
| Total Housing Units | 874 (99.5%) | 4 (0.5%) |
Occupancy by Educational Attainment in Lake Meade
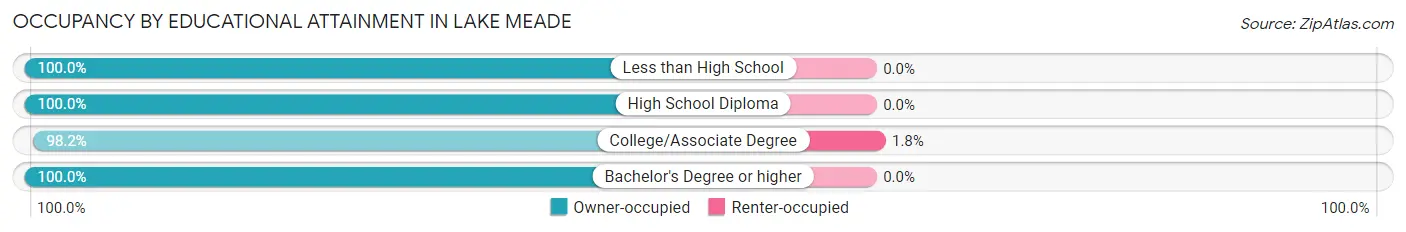
| Household Size | Owner-occupied | Renter-occupied |
| Less than High School | 45 (100.0%) | 0 (0.0%) |
| High School Diploma | 187 (100.0%) | 0 (0.0%) |
| College/Associate Degree | 223 (98.2%) | 4 (1.8%) |
| Bachelor's Degree or higher | 419 (100.0%) | 0 (0.0%) |
Occupancy by Age of Householder in Lake Meade
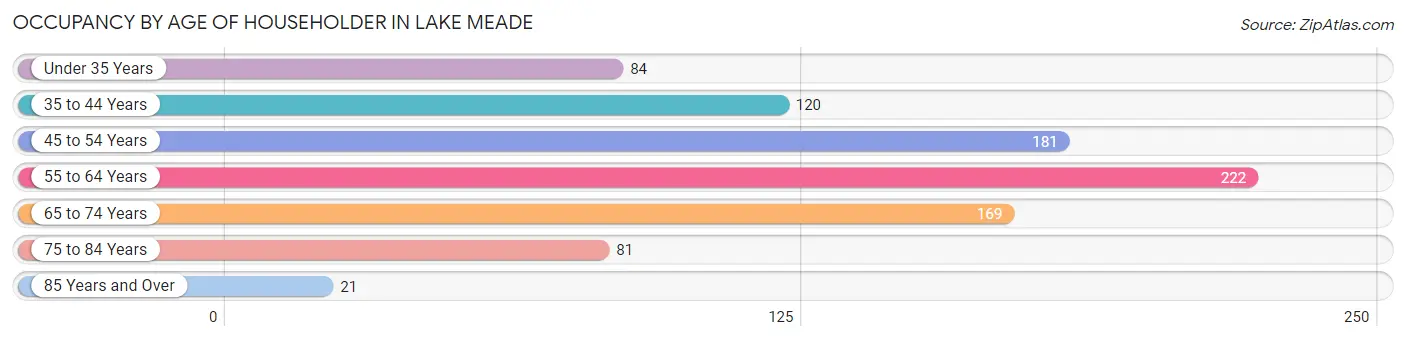
| Age Bracket | # Households | % Households |
| Under 35 Years | 84 | 9.6% |
| 35 to 44 Years | 120 | 13.7% |
| 45 to 54 Years | 181 | 20.6% |
| 55 to 64 Years | 222 | 25.3% |
| 65 to 74 Years | 169 | 19.3% |
| 75 to 84 Years | 81 | 9.2% |
| 85 Years and Over | 21 | 2.4% |
| Total | 878 | 100.0% |
Housing Finances in Lake Meade
Median Income by Occupancy in Lake Meade
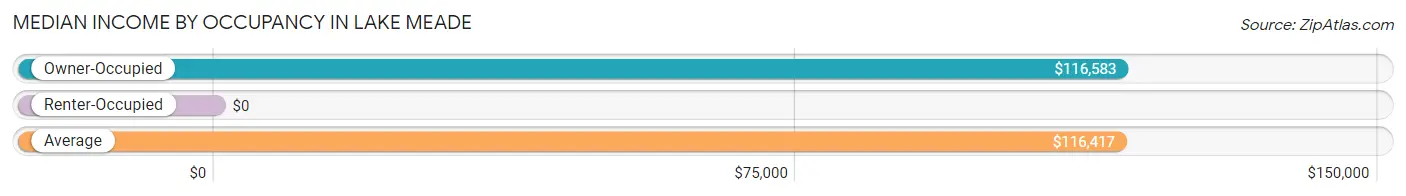
| Occupancy Type | # Households | Median Income |
| Owner-Occupied | 874 (99.5%) | $116,583 |
| Renter-Occupied | 4 (0.5%) | $0 |
| Average | 878 (100.0%) | $116,417 |
Occupancy by Householder Income Bracket in Lake Meade
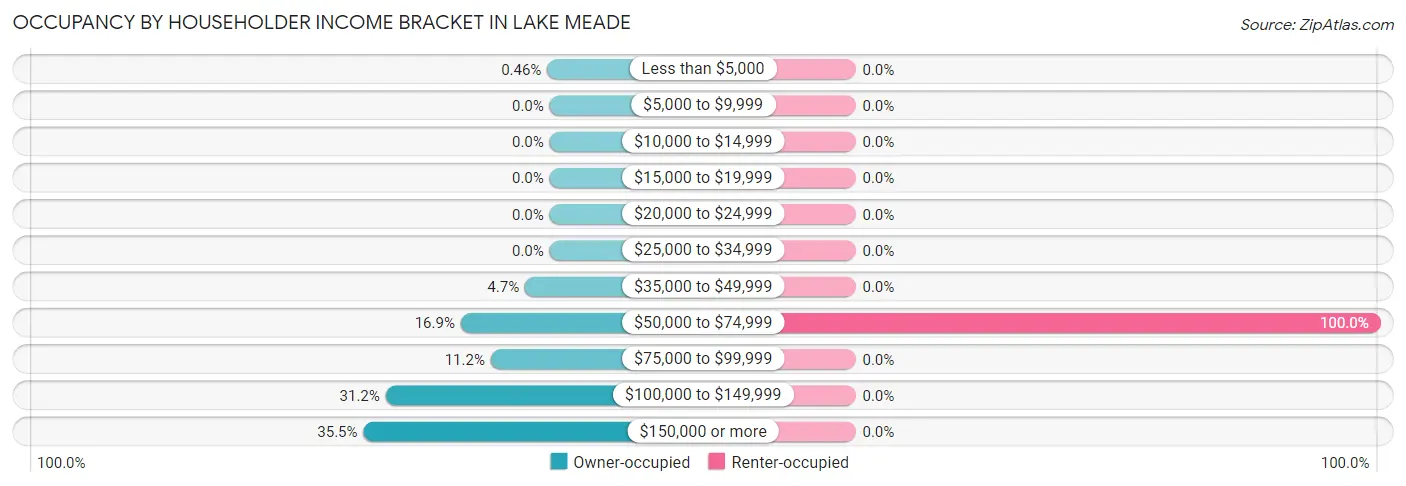
| Income Bracket | Owner-occupied | Renter-occupied |
| Less than $5,000 | 4 (0.5%) | 0 (0.0%) |
| $5,000 to $9,999 | 0 (0.0%) | 0 (0.0%) |
| $10,000 to $14,999 | 0 (0.0%) | 0 (0.0%) |
| $15,000 to $19,999 | 0 (0.0%) | 0 (0.0%) |
| $20,000 to $24,999 | 0 (0.0%) | 0 (0.0%) |
| $25,000 to $34,999 | 0 (0.0%) | 0 (0.0%) |
| $35,000 to $49,999 | 41 (4.7%) | 0 (0.0%) |
| $50,000 to $74,999 | 148 (16.9%) | 4 (100.0%) |
| $75,000 to $99,999 | 98 (11.2%) | 0 (0.0%) |
| $100,000 to $149,999 | 273 (31.2%) | 0 (0.0%) |
| $150,000 or more | 310 (35.5%) | 0 (0.0%) |
| Total | 874 (100.0%) | 4 (100.0%) |
Monthly Housing Cost Tiers in Lake Meade
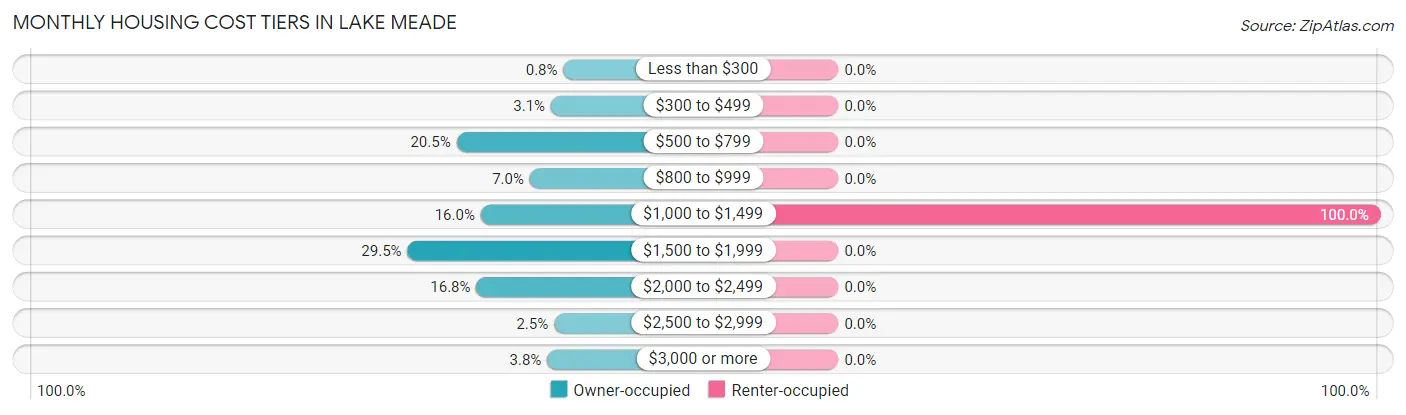
| Monthly Cost | Owner-occupied | Renter-occupied |
| Less than $300 | 7 (0.8%) | 0 (0.0%) |
| $300 to $499 | 27 (3.1%) | 0 (0.0%) |
| $500 to $799 | 179 (20.5%) | 0 (0.0%) |
| $800 to $999 | 61 (7.0%) | 0 (0.0%) |
| $1,000 to $1,499 | 140 (16.0%) | 4 (100.0%) |
| $1,500 to $1,999 | 258 (29.5%) | 0 (0.0%) |
| $2,000 to $2,499 | 147 (16.8%) | 0 (0.0%) |
| $2,500 to $2,999 | 22 (2.5%) | 0 (0.0%) |
| $3,000 or more | 33 (3.8%) | 0 (0.0%) |
| Total | 874 (100.0%) | 4 (100.0%) |
Physical Housing Characteristics in Lake Meade
Housing Structures in Lake Meade
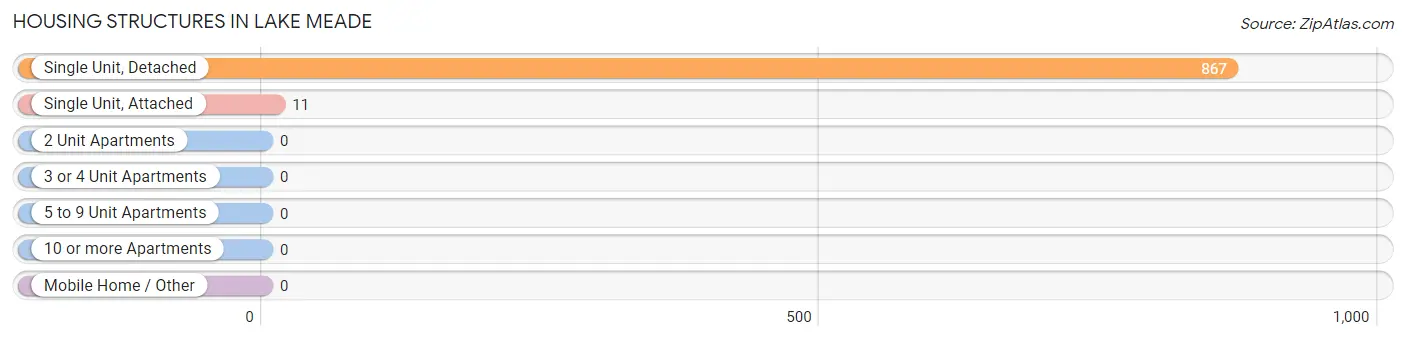
| Structure Type | # Housing Units | % Housing Units |
| Single Unit, Detached | 867 | 98.8% |
| Single Unit, Attached | 11 | 1.3% |
| 2 Unit Apartments | 0 | 0.0% |
| 3 or 4 Unit Apartments | 0 | 0.0% |
| 5 to 9 Unit Apartments | 0 | 0.0% |
| 10 or more Apartments | 0 | 0.0% |
| Mobile Home / Other | 0 | 0.0% |
| Total | 878 | 100.0% |
Housing Structures by Occupancy in Lake Meade
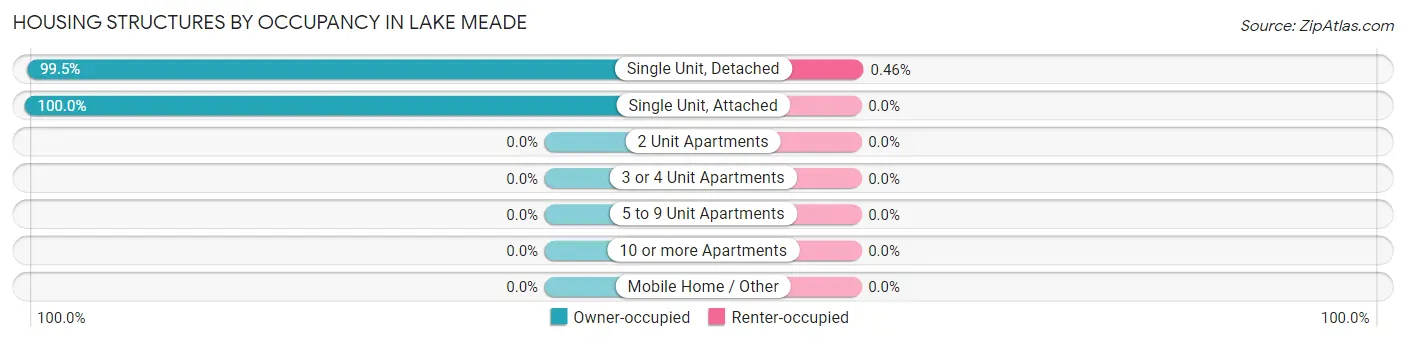
| Structure Type | Owner-occupied | Renter-occupied |
| Single Unit, Detached | 863 (99.5%) | 4 (0.5%) |
| Single Unit, Attached | 11 (100.0%) | 0 (0.0%) |
| 2 Unit Apartments | 0 (0.0%) | 0 (0.0%) |
| 3 or 4 Unit Apartments | 0 (0.0%) | 0 (0.0%) |
| 5 to 9 Unit Apartments | 0 (0.0%) | 0 (0.0%) |
| 10 or more Apartments | 0 (0.0%) | 0 (0.0%) |
| Mobile Home / Other | 0 (0.0%) | 0 (0.0%) |
| Total | 874 (99.5%) | 4 (0.5%) |
Housing Structures by Number of Rooms in Lake Meade
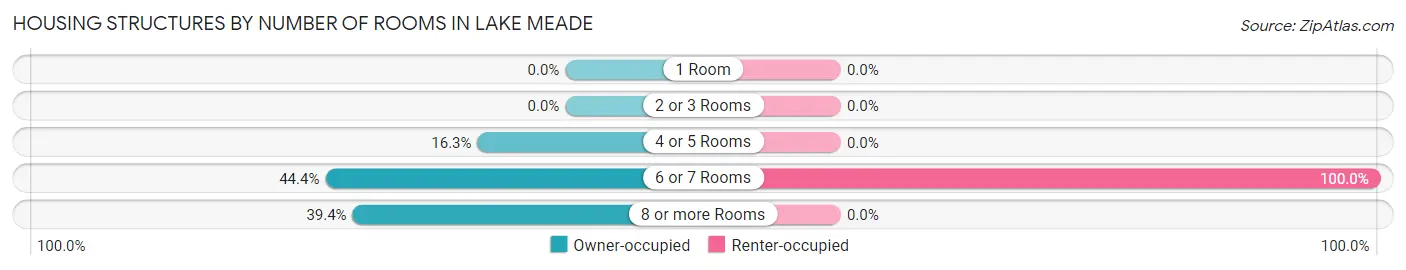
| Number of Rooms | Owner-occupied | Renter-occupied |
| 1 Room | 0 (0.0%) | 0 (0.0%) |
| 2 or 3 Rooms | 0 (0.0%) | 0 (0.0%) |
| 4 or 5 Rooms | 142 (16.3%) | 0 (0.0%) |
| 6 or 7 Rooms | 388 (44.4%) | 4 (100.0%) |
| 8 or more Rooms | 344 (39.4%) | 0 (0.0%) |
| Total | 874 (100.0%) | 4 (100.0%) |
Housing Structure by Heating Type in Lake Meade
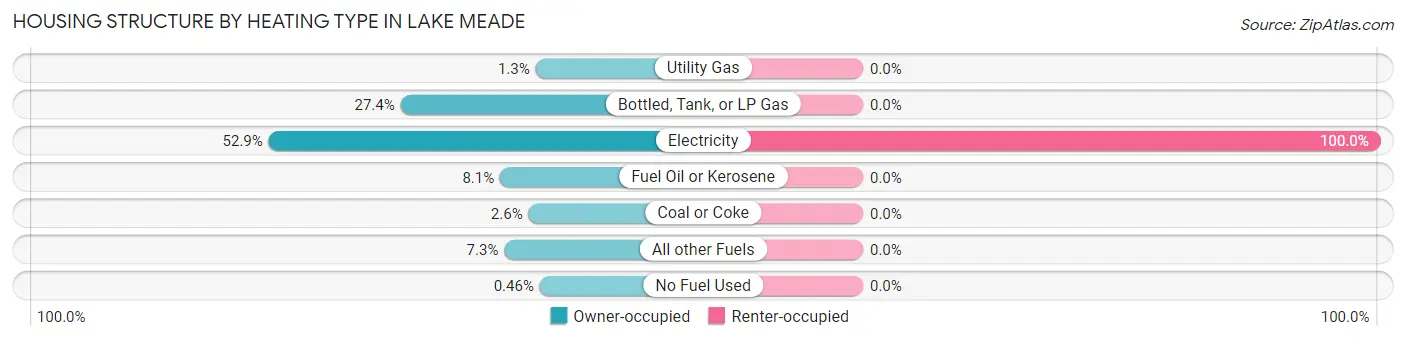
| Heating Type | Owner-occupied | Renter-occupied |
| Utility Gas | 11 (1.3%) | 0 (0.0%) |
| Bottled, Tank, or LP Gas | 239 (27.4%) | 0 (0.0%) |
| Electricity | 462 (52.9%) | 4 (100.0%) |
| Fuel Oil or Kerosene | 71 (8.1%) | 0 (0.0%) |
| Coal or Coke | 23 (2.6%) | 0 (0.0%) |
| All other Fuels | 64 (7.3%) | 0 (0.0%) |
| No Fuel Used | 4 (0.5%) | 0 (0.0%) |
| Total | 874 (100.0%) | 4 (100.0%) |
Household Vehicle Usage in Lake Meade
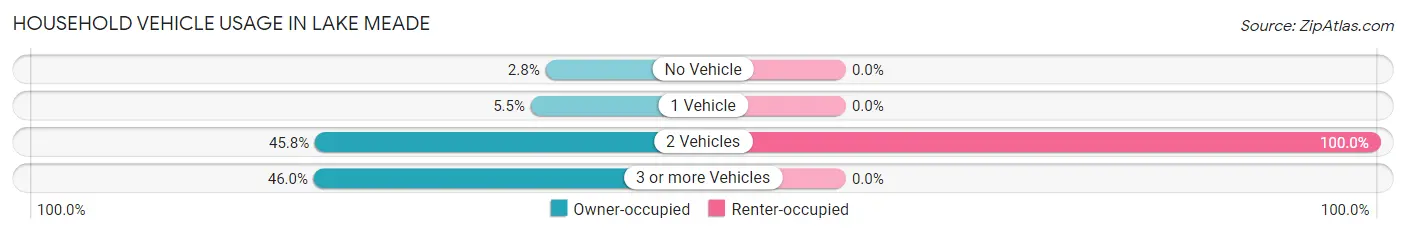
| Vehicles per Household | Owner-occupied | Renter-occupied |
| No Vehicle | 24 (2.8%) | 0 (0.0%) |
| 1 Vehicle | 48 (5.5%) | 0 (0.0%) |
| 2 Vehicles | 400 (45.8%) | 4 (100.0%) |
| 3 or more Vehicles | 402 (46.0%) | 0 (0.0%) |
| Total | 874 (100.0%) | 4 (100.0%) |
Real Estate & Mortgages in Lake Meade
Real Estate and Mortgage Overview in Lake Meade
| Characteristic | Without Mortgage | With Mortgage |
| Housing Units | 292 | 582 |
| Median Property Value | $223,300 | $293,800 |
| Median Household Income | $86,250 | $297 |
| Monthly Housing Costs | $673 | $33 |
| Real Estate Taxes | $3,422 | $0 |
Property Value by Mortgage Status in Lake Meade
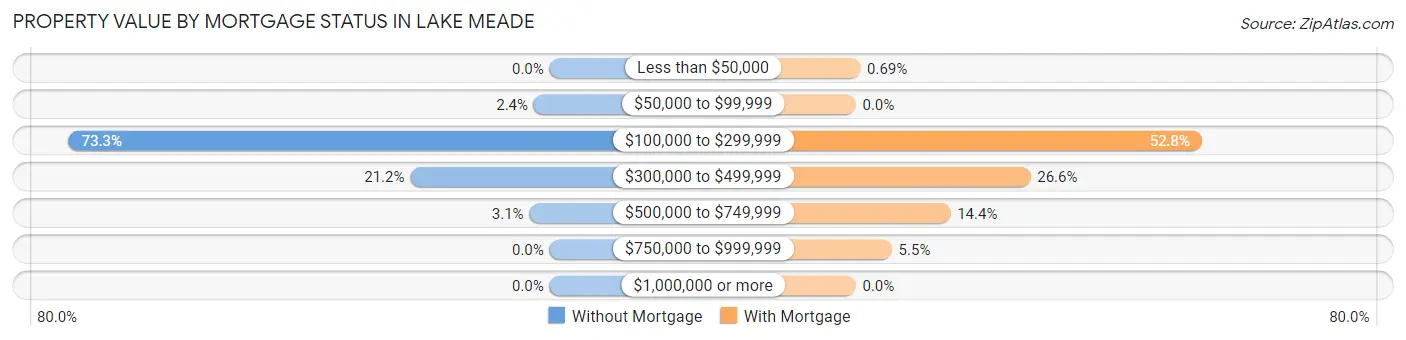
| Property Value | Without Mortgage | With Mortgage |
| Less than $50,000 | 0 (0.0%) | 4 (0.7%) |
| $50,000 to $99,999 | 7 (2.4%) | 0 (0.0%) |
| $100,000 to $299,999 | 214 (73.3%) | 307 (52.7%) |
| $300,000 to $499,999 | 62 (21.2%) | 155 (26.6%) |
| $500,000 to $749,999 | 9 (3.1%) | 84 (14.4%) |
| $750,000 to $999,999 | 0 (0.0%) | 32 (5.5%) |
| $1,000,000 or more | 0 (0.0%) | 0 (0.0%) |
| Total | 292 (100.0%) | 582 (100.0%) |
Household Income by Mortgage Status in Lake Meade
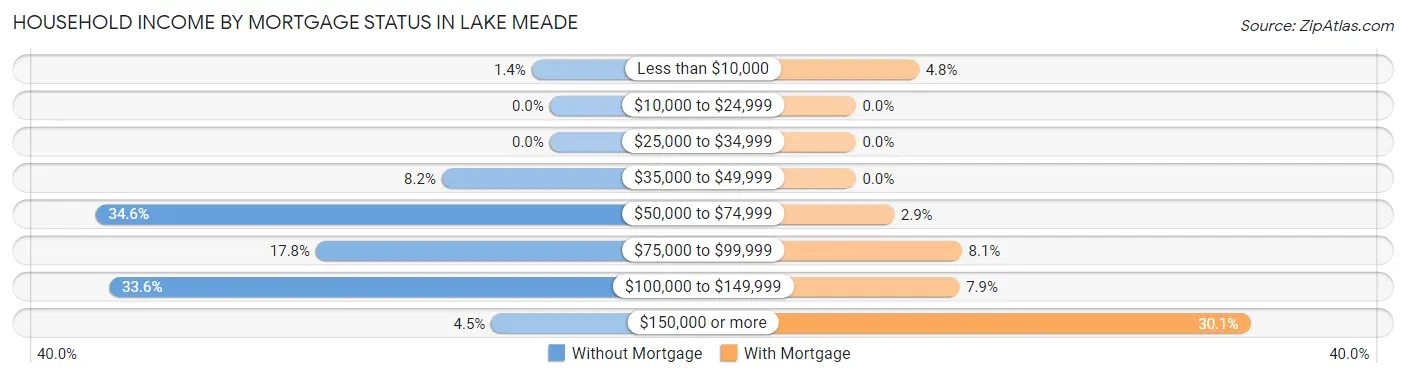
| Household Income | Without Mortgage | With Mortgage |
| Less than $10,000 | 4 (1.4%) | 28 (4.8%) |
| $10,000 to $24,999 | 0 (0.0%) | 0 (0.0%) |
| $25,000 to $34,999 | 0 (0.0%) | 0 (0.0%) |
| $35,000 to $49,999 | 24 (8.2%) | 0 (0.0%) |
| $50,000 to $74,999 | 101 (34.6%) | 17 (2.9%) |
| $75,000 to $99,999 | 52 (17.8%) | 47 (8.1%) |
| $100,000 to $149,999 | 98 (33.6%) | 46 (7.9%) |
| $150,000 or more | 13 (4.4%) | 175 (30.1%) |
| Total | 292 (100.0%) | 582 (100.0%) |
Property Value to Household Income Ratio in Lake Meade
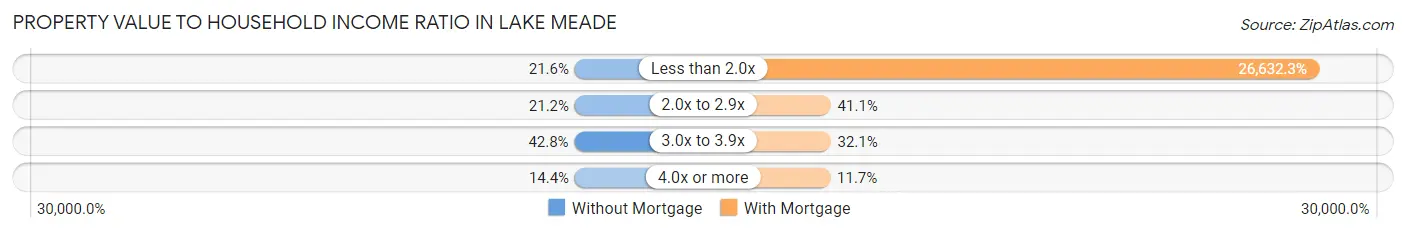
| Value-to-Income Ratio | Without Mortgage | With Mortgage |
| Less than 2.0x | 63 (21.6%) | 155,000 (26,632.3%) |
| 2.0x to 2.9x | 62 (21.2%) | 239 (41.1%) |
| 3.0x to 3.9x | 125 (42.8%) | 187 (32.1%) |
| 4.0x or more | 42 (14.4%) | 68 (11.7%) |
| Total | 292 (100.0%) | 582 (100.0%) |
Real Estate Taxes by Mortgage Status in Lake Meade
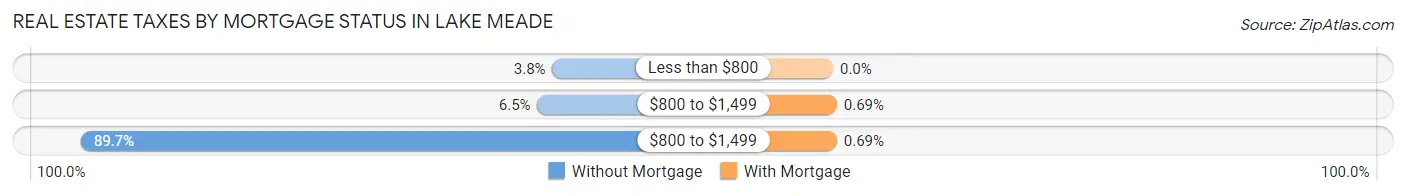
| Property Taxes | Without Mortgage | With Mortgage |
| Less than $800 | 11 (3.8%) | 0 (0.0%) |
| $800 to $1,499 | 19 (6.5%) | 4 (0.7%) |
| $800 to $1,499 | 262 (89.7%) | 4 (0.7%) |
| Total | 292 (100.0%) | 582 (100.0%) |
Health & Disability in Lake Meade
Health Insurance Coverage by Age in Lake Meade
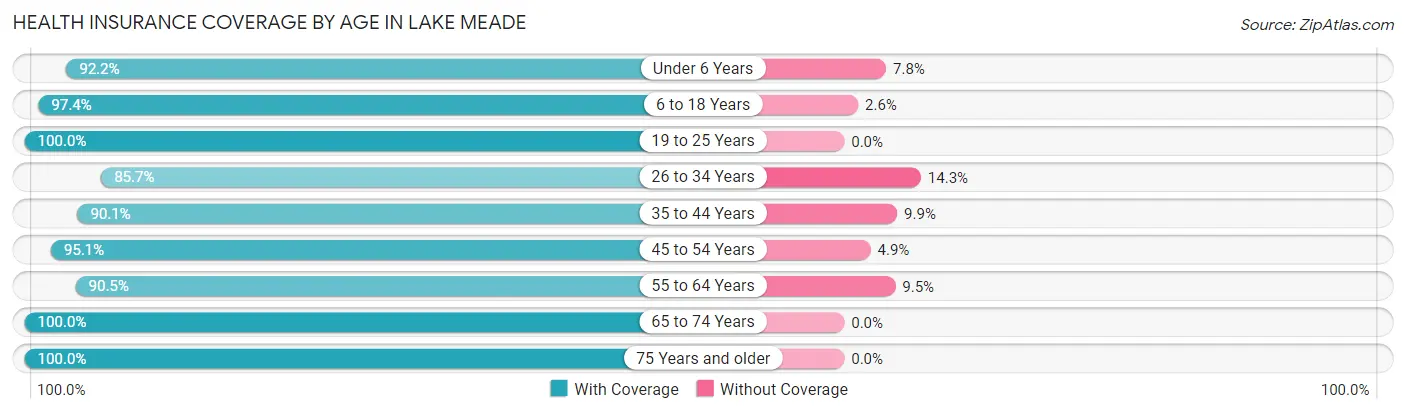
| Age Bracket | With Coverage | Without Coverage |
| Under 6 Years | 71 (92.2%) | 6 (7.8%) |
| 6 to 18 Years | 416 (97.4%) | 11 (2.6%) |
| 19 to 25 Years | 107 (100.0%) | 0 (0.0%) |
| 26 to 34 Years | 240 (85.7%) | 40 (14.3%) |
| 35 to 44 Years | 256 (90.1%) | 28 (9.9%) |
| 45 to 54 Years | 330 (95.1%) | 17 (4.9%) |
| 55 to 64 Years | 494 (90.5%) | 52 (9.5%) |
| 65 to 74 Years | 237 (100.0%) | 0 (0.0%) |
| 75 Years and older | 198 (100.0%) | 0 (0.0%) |
| Total | 2,349 (93.9%) | 154 (6.1%) |
Health Insurance Coverage by Citizenship Status in Lake Meade
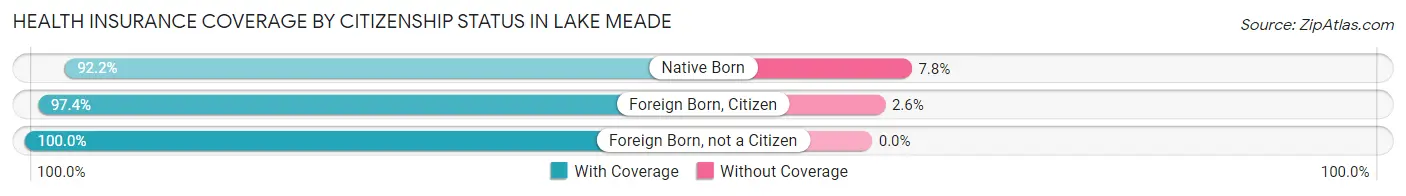
| Citizenship Status | With Coverage | Without Coverage |
| Native Born | 71 (92.2%) | 6 (7.8%) |
| Foreign Born, Citizen | 416 (97.4%) | 11 (2.6%) |
| Foreign Born, not a Citizen | 107 (100.0%) | 0 (0.0%) |
Health Insurance Coverage by Household Income in Lake Meade
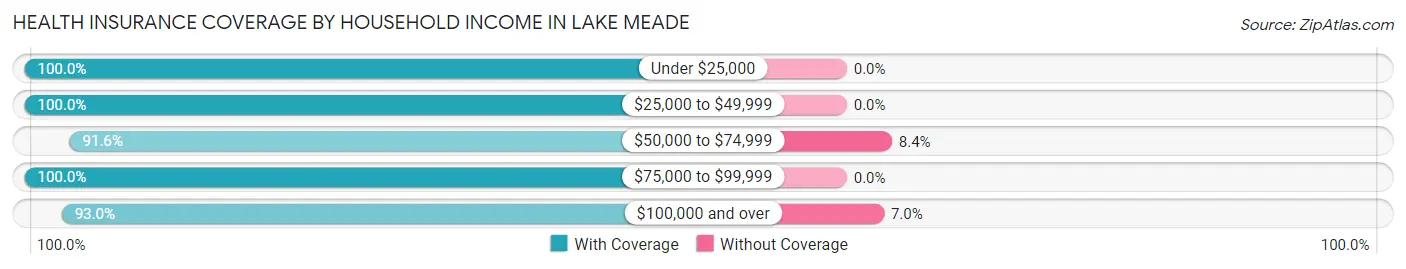
| Household Income | With Coverage | Without Coverage |
| Under $25,000 | 25 (100.0%) | 0 (0.0%) |
| $25,000 to $49,999 | 58 (100.0%) | 0 (0.0%) |
| $50,000 to $74,999 | 282 (91.6%) | 26 (8.4%) |
| $75,000 to $99,999 | 273 (100.0%) | 0 (0.0%) |
| $100,000 and over | 1,711 (93.0%) | 128 (7.0%) |
Public vs Private Health Insurance Coverage by Age in Lake Meade
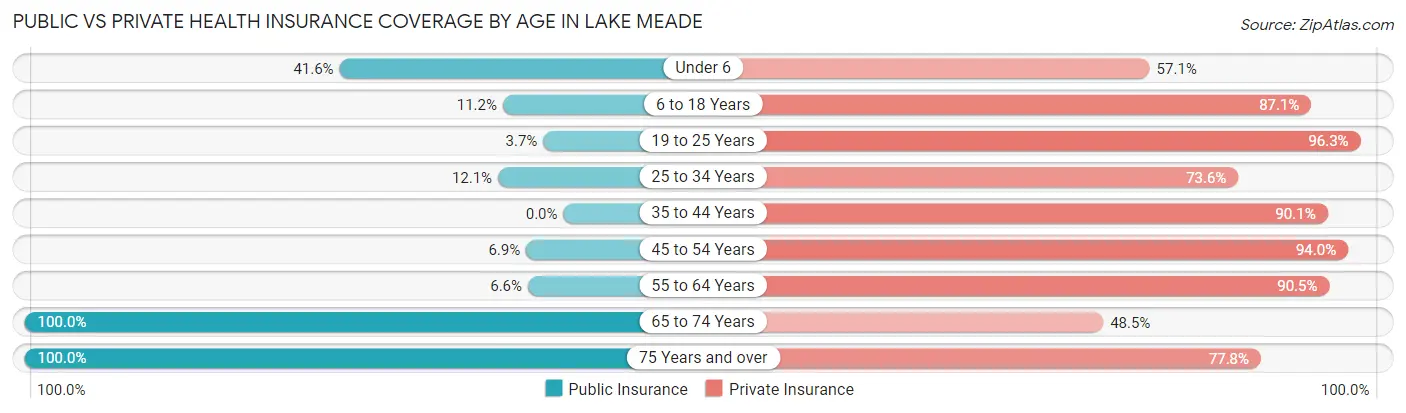
| Age Bracket | Public Insurance | Private Insurance |
| Under 6 | 32 (41.6%) | 44 (57.1%) |
| 6 to 18 Years | 48 (11.2%) | 372 (87.1%) |
| 19 to 25 Years | 4 (3.7%) | 103 (96.3%) |
| 25 to 34 Years | 34 (12.1%) | 206 (73.6%) |
| 35 to 44 Years | 0 (0.0%) | 256 (90.1%) |
| 45 to 54 Years | 24 (6.9%) | 326 (94.0%) |
| 55 to 64 Years | 36 (6.6%) | 494 (90.5%) |
| 65 to 74 Years | 237 (100.0%) | 115 (48.5%) |
| 75 Years and over | 198 (100.0%) | 154 (77.8%) |
| Total | 613 (24.5%) | 2,070 (82.7%) |
Disability Status by Sex by Age in Lake Meade
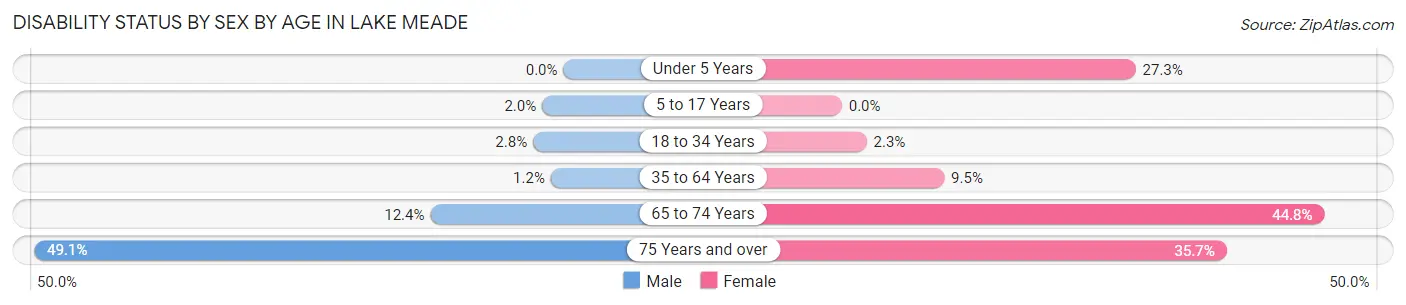
| Age Bracket | Male | Female |
| Under 5 Years | 0 (0.0%) | 6 (27.3%) |
| 5 to 17 Years | 4 (2.0%) | 0 (0.0%) |
| 18 to 34 Years | 6 (2.8%) | 4 (2.3%) |
| 35 to 64 Years | 6 (1.2%) | 63 (9.5%) |
| 65 to 74 Years | 21 (12.3%) | 30 (44.8%) |
| 75 Years and over | 56 (49.1%) | 30 (35.7%) |
Disability Class by Sex by Age in Lake Meade
Disability Class: Hearing Difficulty
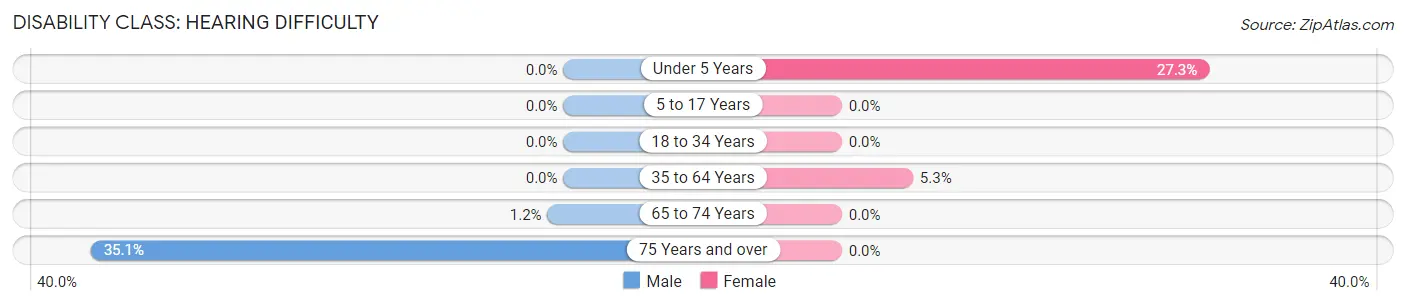
| Age Bracket | Male | Female |
| Under 5 Years | 0 (0.0%) | 6 (27.3%) |
| 5 to 17 Years | 0 (0.0%) | 0 (0.0%) |
| 18 to 34 Years | 0 (0.0%) | 0 (0.0%) |
| 35 to 64 Years | 0 (0.0%) | 35 (5.3%) |
| 65 to 74 Years | 2 (1.2%) | 0 (0.0%) |
| 75 Years and over | 40 (35.1%) | 0 (0.0%) |
Disability Class: Vision Difficulty
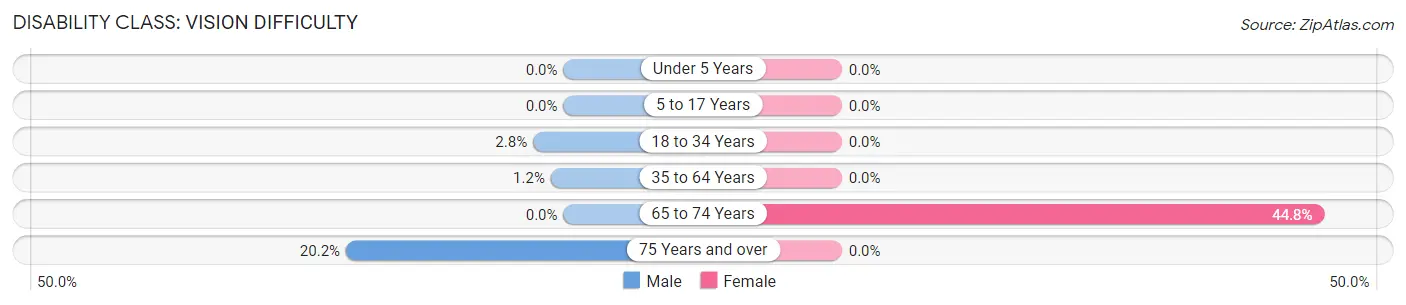
| Age Bracket | Male | Female |
| Under 5 Years | 0 (0.0%) | 0 (0.0%) |
| 5 to 17 Years | 0 (0.0%) | 0 (0.0%) |
| 18 to 34 Years | 6 (2.8%) | 0 (0.0%) |
| 35 to 64 Years | 6 (1.2%) | 0 (0.0%) |
| 65 to 74 Years | 0 (0.0%) | 30 (44.8%) |
| 75 Years and over | 23 (20.2%) | 0 (0.0%) |
Disability Class: Cognitive Difficulty
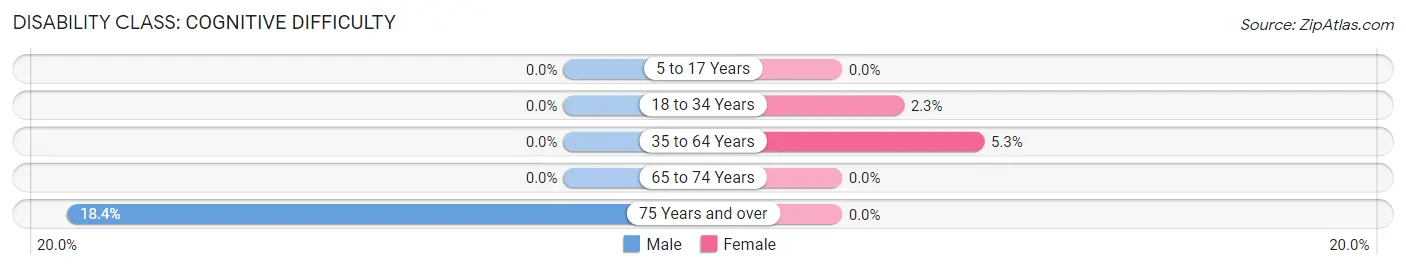
| Age Bracket | Male | Female |
| 5 to 17 Years | 0 (0.0%) | 0 (0.0%) |
| 18 to 34 Years | 0 (0.0%) | 4 (2.3%) |
| 35 to 64 Years | 0 (0.0%) | 35 (5.3%) |
| 65 to 74 Years | 0 (0.0%) | 0 (0.0%) |
| 75 Years and over | 21 (18.4%) | 0 (0.0%) |
Disability Class: Ambulatory Difficulty
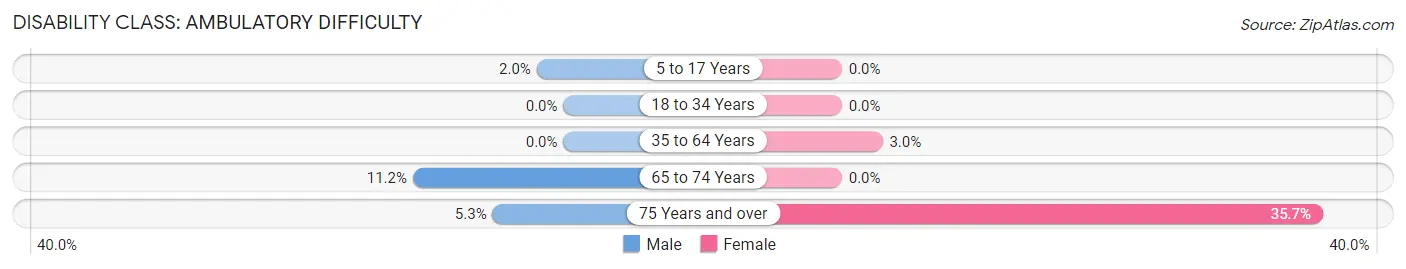
| Age Bracket | Male | Female |
| 5 to 17 Years | 4 (2.0%) | 0 (0.0%) |
| 18 to 34 Years | 0 (0.0%) | 0 (0.0%) |
| 35 to 64 Years | 0 (0.0%) | 20 (3.0%) |
| 65 to 74 Years | 19 (11.2%) | 0 (0.0%) |
| 75 Years and over | 6 (5.3%) | 30 (35.7%) |
Disability Class: Self-Care Difficulty
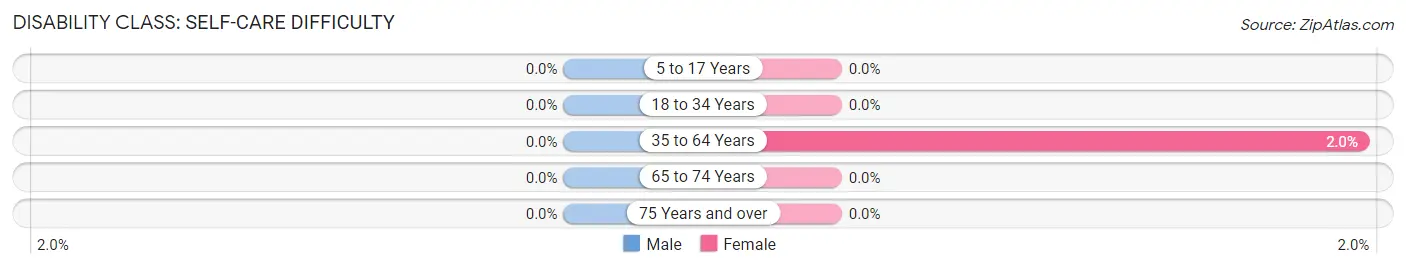
| Age Bracket | Male | Female |
| 5 to 17 Years | 0 (0.0%) | 0 (0.0%) |
| 18 to 34 Years | 0 (0.0%) | 0 (0.0%) |
| 35 to 64 Years | 0 (0.0%) | 13 (2.0%) |
| 65 to 74 Years | 0 (0.0%) | 0 (0.0%) |
| 75 Years and over | 0 (0.0%) | 0 (0.0%) |
Technology Access in Lake Meade
Computing Device Access in Lake Meade
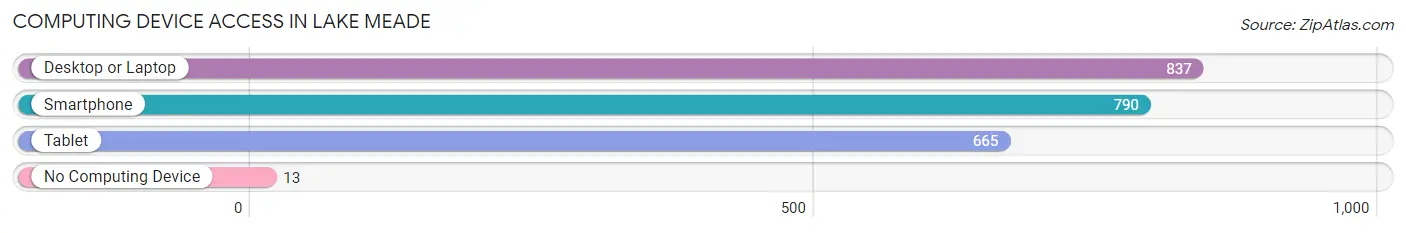
| Device Type | # Households | % Households |
| Desktop or Laptop | 837 | 95.3% |
| Smartphone | 790 | 90.0% |
| Tablet | 665 | 75.7% |
| No Computing Device | 13 | 1.5% |
| Total | 878 | 100.0% |
Internet Access in Lake Meade
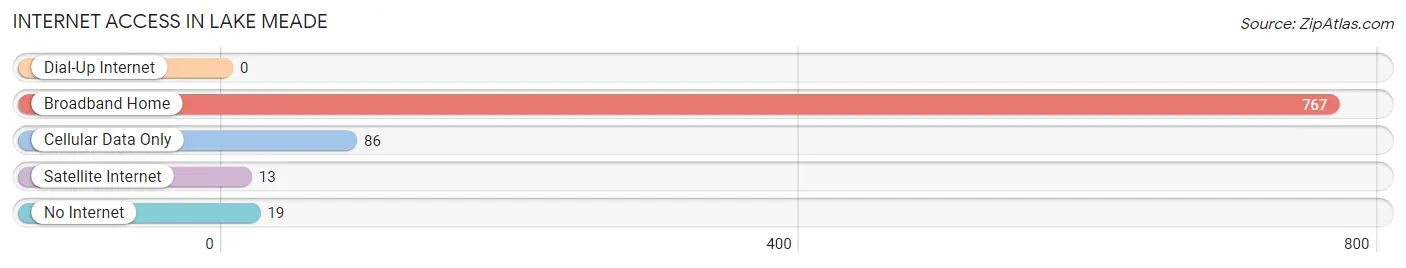
| Internet Type | # Households | % Households |
| Dial-Up Internet | 0 | 0.0% |
| Broadband Home | 767 | 87.4% |
| Cellular Data Only | 86 | 9.8% |
| Satellite Internet | 13 | 1.5% |
| No Internet | 19 | 2.2% |
| Total | 878 | 100.0% |
Lake Meade Summary
Lake Meade is a small borough located in Adams County, Pennsylvania. It is situated in the Cumberland Valley, approximately 10 miles west of Gettysburg. The borough was incorporated in 1891 and has a population of approximately 1,000 people.
History
The area that is now Lake Meade was originally inhabited by Native Americans, including the Susquehannock and Iroquois tribes. The first European settlers arrived in the area in the late 1700s, and the town was officially established in 1891. The town was named after the nearby lake, which was named after General George Meade, who commanded the Union forces at the Battle of Gettysburg.
The town was originally a farming community, but in the early 1900s, the town began to develop into a resort community. The lake was a popular destination for fishing and swimming, and the town was home to several hotels and resorts. The town also had a trolley line that connected it to Gettysburg and other nearby towns.
In the 1950s, the town began to decline as the popularity of the lake and resorts began to wane. The trolley line was discontinued in the 1960s, and the town began to transition into a bedroom community for nearby cities.
Geography
Lake Meade is located in Adams County, Pennsylvania, in the Cumberland Valley. The borough is situated on the eastern shore of Lake Meade, a man-made lake that was created in the early 1900s. The lake is approximately 1,000 acres in size and is a popular destination for fishing and swimming.
The borough is located approximately 10 miles west of Gettysburg and is bordered by the townships of Cumberland, Straban, and Mount Joy. The borough is situated at an elevation of approximately 500 feet above sea level.
Economy
The economy of Lake Meade is largely based on tourism and agriculture. The lake is a popular destination for fishing and swimming, and the town is home to several hotels and resorts. The town also has several small businesses, including restaurants, shops, and other services.
The town is also home to several farms, which produce a variety of crops, including corn, soybeans, and hay. The town is also home to several wineries, which produce a variety of wines.
Demographics
As of the 2010 census, the population of Lake Meade was 1,000 people. The racial makeup of the town was 97.2% White, 0.7% African American, 0.2% Native American, 0.2% Asian, 0.2% from other races, and 1.7% from two or more races. Hispanic or Latino of any race were 0.7% of the population.
The median household income in the town was $45,000, and the median family income was $50,000. The per capita income in the town was $20,000. Approximately 8.7% of the population was below the poverty line.
Conclusion
Lake Meade is a small borough located in Adams County, Pennsylvania. It is situated in the Cumberland Valley, approximately 10 miles west of Gettysburg. The town was originally a farming community, but in the early 1900s, it began to develop into a resort community. The lake is a popular destination for fishing and swimming, and the town is home to several hotels and resorts. The economy of Lake Meade is largely based on tourism and agriculture. As of the 2010 census, the population of Lake Meade was 1,000 people. The median household income in the town was $45,000, and the median family income was $50,000.
Common Questions
What is Per Capita Income in Lake Meade?
Per Capita income in Lake Meade is $50,401.
What is the Median Family Income in Lake Meade?
Median Family Income in Lake Meade is $135,625.
What is the Median Household income in Lake Meade?
Median Household Income in Lake Meade is $116,417.
What is Income or Wage Gap in Lake Meade?
Income or Wage Gap in Lake Meade is 24.6%.
Women in Lake Meade earn 75.4 cents for every dollar earned by a man.
What is Inequality or Gini Index in Lake Meade?
Inequality or Gini Index in Lake Meade is 0.31.
What is the Total Population of Lake Meade?
Total Population of Lake Meade is 2,504.
What is the Total Male Population of Lake Meade?
Total Male Population of Lake Meade is 1,260.
What is the Total Female Population of Lake Meade?
Total Female Population of Lake Meade is 1,244.
What is the Ratio of Males per 100 Females in Lake Meade?
There are 101.29 Males per 100 Females in Lake Meade.
What is the Ratio of Females per 100 Males in Lake Meade?
There are 98.73 Females per 100 Males in Lake Meade.
What is the Median Population Age in Lake Meade?
Median Population Age in Lake Meade is 47.7 Years.
What is the Average Family Size in Lake Meade
Average Family Size in Lake Meade is 3.1 People.
What is the Average Household Size in Lake Meade
Average Household Size in Lake Meade is 2.9 People.
How Large is the Labor Force in Lake Meade?
There are 1,521 People in the Labor Forcein in Lake Meade.
What is the Percentage of People in the Labor Force in Lake Meade?
74.4% of People are in the Labor Force in Lake Meade.
What is the Unemployment Rate in Lake Meade?
Unemployment Rate in Lake Meade is 2.6%.