Stormstown, PA Map & Demographics
Stormstown Map
Stormstown Overview
$54,096
PER CAPITA INCOME
$139,094
AVG FAMILY INCOME
$138,313
AVG HOUSEHOLD INCOME
40.2%
WAGE / INCOME GAP [ % ]
59.8¢/ $1
WAGE / INCOME GAP [ $ ]
0.37
INEQUALITY / GINI INDEX
2,464
TOTAL POPULATION
1,327
MALE POPULATION
1,137
FEMALE POPULATION
116.71
MALES / 100 FEMALES
85.68
FEMALES / 100 MALES
41.5
MEDIAN AGE
3.2
AVG FAMILY SIZE
3.0
AVG HOUSEHOLD SIZE
1,396
LABOR FORCE [ PEOPLE ]
77.5%
PERCENT IN LABOR FORCE
4.6%
UNEMPLOYMENT RATE
Income in Stormstown
Income Overview in Stormstown
Per Capita Income in Stormstown is $54,096, while median incomes of families and households are $139,094 and $138,313 respectively.
| Characteristic | Number | Measure |
| Per Capita Income | 2,464 | $54,096 |
| Median Family Income | 719 | $139,094 |
| Mean Family Income | 719 | $160,259 |
| Median Household Income | 834 | $138,313 |
| Mean Household Income | 834 | $156,271 |
| Income Deficit | 719 | $0 |
| Wage / Income Gap (%) | 2,464 | 40.17% |
| Wage / Income Gap ($) | 2,464 | 59.83¢ per $1 |
| Gini / Inequality Index | 2,464 | 0.37 |
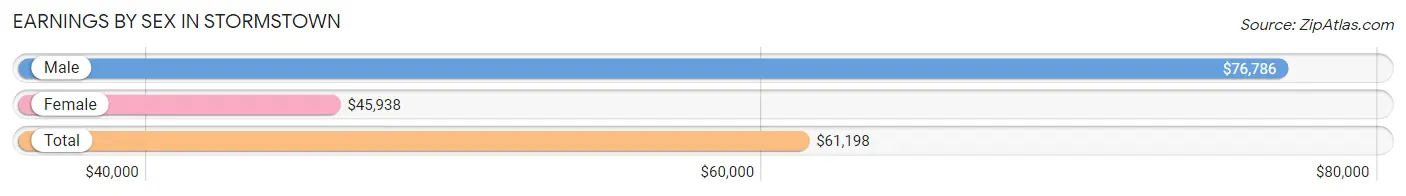
Earnings by Sex in Stormstown
Average Earnings in Stormstown are $61,198, $76,786 for men and $45,938 for women, a difference of 40.2%.
| Sex | Number | Average Earnings |
| Male | 812 (58.3%) | $76,786 |
| Female | 581 (41.7%) | $45,938 |
| Total | 1,393 (100.0%) | $61,198 |
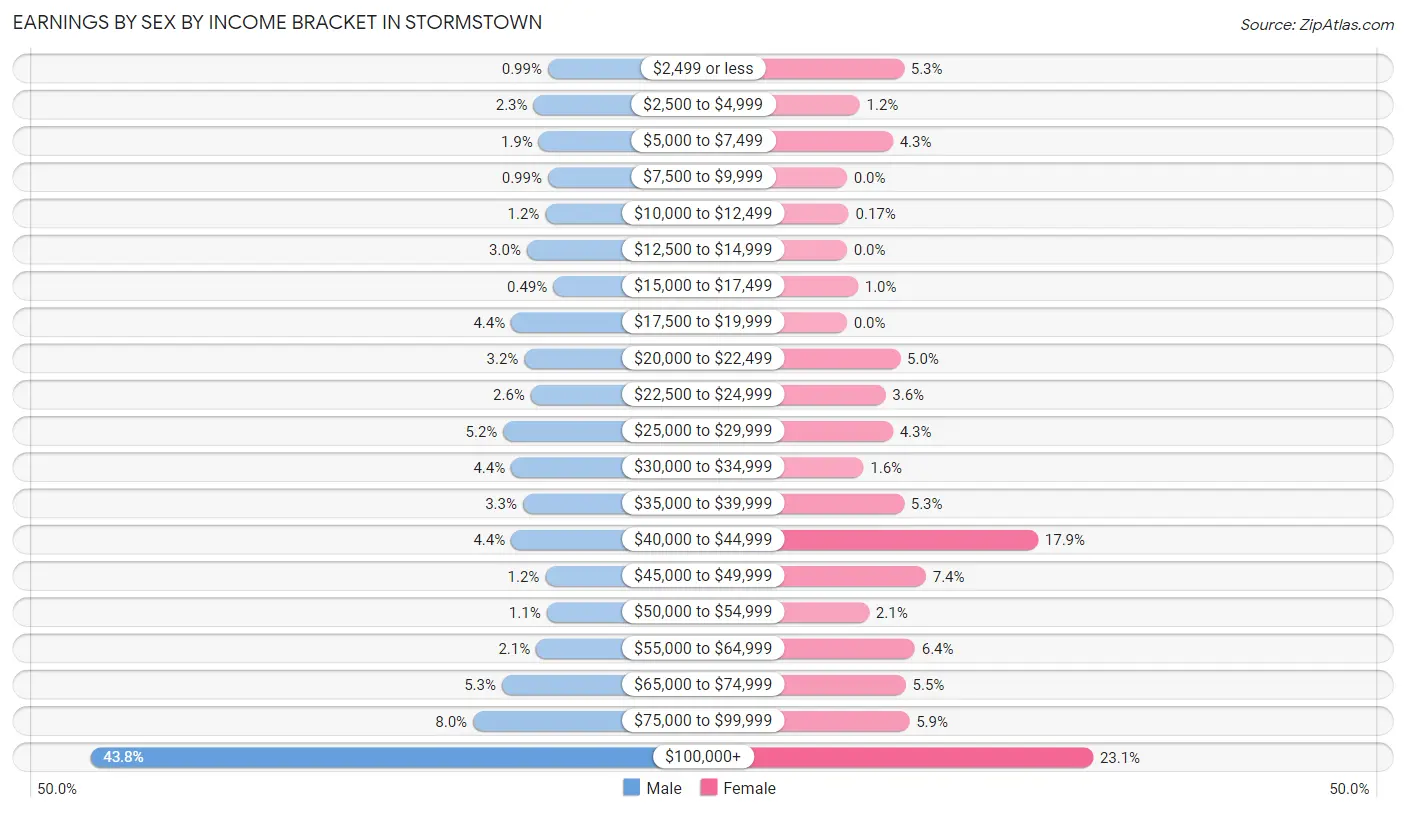
Earnings by Sex by Income Bracket in Stormstown
The most common earnings brackets in Stormstown are $100,000+ for men (356 | 43.8%) and $100,000+ for women (134 | 23.1%).
| Income | Male | Female |
| $2,499 or less | 8 (1.0%) | 31 (5.3%) |
| $2,500 to $4,999 | 19 (2.3%) | 7 (1.2%) |
| $5,000 to $7,499 | 15 (1.8%) | 25 (4.3%) |
| $7,500 to $9,999 | 8 (1.0%) | 0 (0.0%) |
| $10,000 to $12,499 | 10 (1.2%) | 1 (0.2%) |
| $12,500 to $14,999 | 24 (3.0%) | 0 (0.0%) |
| $15,000 to $17,499 | 4 (0.5%) | 6 (1.0%) |
| $17,500 to $19,999 | 36 (4.4%) | 0 (0.0%) |
| $20,000 to $22,499 | 26 (3.2%) | 29 (5.0%) |
| $22,500 to $24,999 | 21 (2.6%) | 21 (3.6%) |
| $25,000 to $29,999 | 42 (5.2%) | 25 (4.3%) |
| $30,000 to $34,999 | 36 (4.4%) | 9 (1.5%) |
| $35,000 to $39,999 | 27 (3.3%) | 31 (5.3%) |
| $40,000 to $44,999 | 36 (4.4%) | 104 (17.9%) |
| $45,000 to $49,999 | 10 (1.2%) | 43 (7.4%) |
| $50,000 to $54,999 | 9 (1.1%) | 12 (2.1%) |
| $55,000 to $64,999 | 17 (2.1%) | 37 (6.4%) |
| $65,000 to $74,999 | 43 (5.3%) | 32 (5.5%) |
| $75,000 to $99,999 | 65 (8.0%) | 34 (5.9%) |
| $100,000+ | 356 (43.8%) | 134 (23.1%) |
| Total | 812 (100.0%) | 581 (100.0%) |
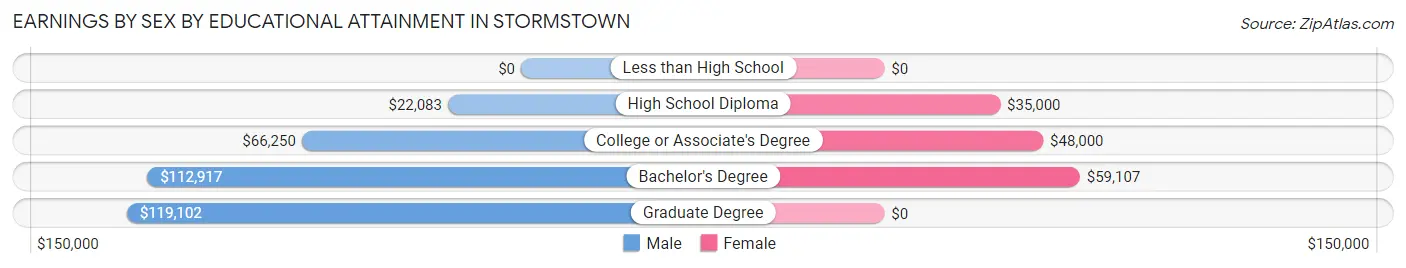
Earnings by Sex by Educational Attainment in Stormstown
Average earnings in Stormstown are $87,000 for men and $47,756 for women, a difference of 45.1%. Men with an educational attainment of graduate degree enjoy the highest average annual earnings of $119,102, while those with high school diploma education earn the least with $22,083. Women with an educational attainment of bachelor's degree earn the most with the average annual earnings of $59,107, while those with high school diploma education have the smallest earnings of $35,000.
| Educational Attainment | Male Income | Female Income |
| Less than High School | - | - |
| High School Diploma | $22,083 | $35,000 |
| College or Associate's Degree | $66,250 | $48,000 |
| Bachelor's Degree | $112,917 | $59,107 |
| Graduate Degree | $119,102 | $0 |
| Total | $87,000 | $47,756 |
Family Income in Stormstown
Family Income Brackets in Stormstown
According to the Stormstown family income data, there are 172 families falling into the $200,000+ income range, which is the most common income bracket and makes up 23.9% of all families.
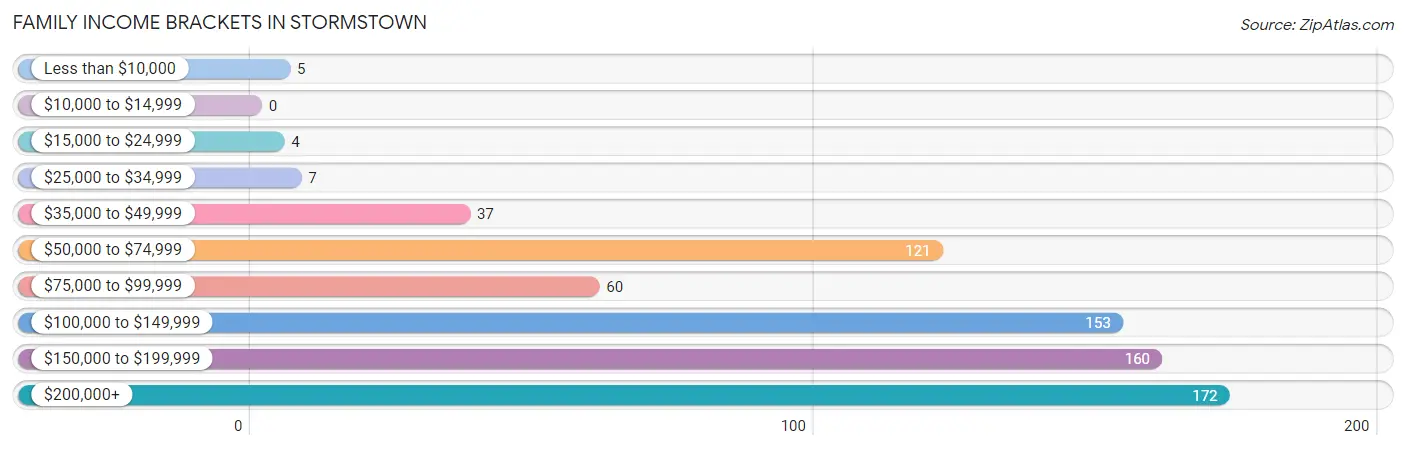
| Income Bracket | # Families | % Families |
| Less than $10,000 | 5 | 0.7% |
| $10,000 to $14,999 | 0 | 0.0% |
| $15,000 to $24,999 | 4 | 0.6% |
| $25,000 to $34,999 | 7 | 1.0% |
| $35,000 to $49,999 | 37 | 5.1% |
| $50,000 to $74,999 | 121 | 16.8% |
| $75,000 to $99,999 | 60 | 8.3% |
| $100,000 to $149,999 | 153 | 21.3% |
| $150,000 to $199,999 | 160 | 22.3% |
| $200,000+ | 172 | 23.9% |
Family Income by Famaliy Size in Stormstown
5-person families (81 | 11.3%) account for the highest median family income in Stormstown with $250,001 per family, while 3-person families (141 | 19.6%) have the highest median income of $50,417 per family member.
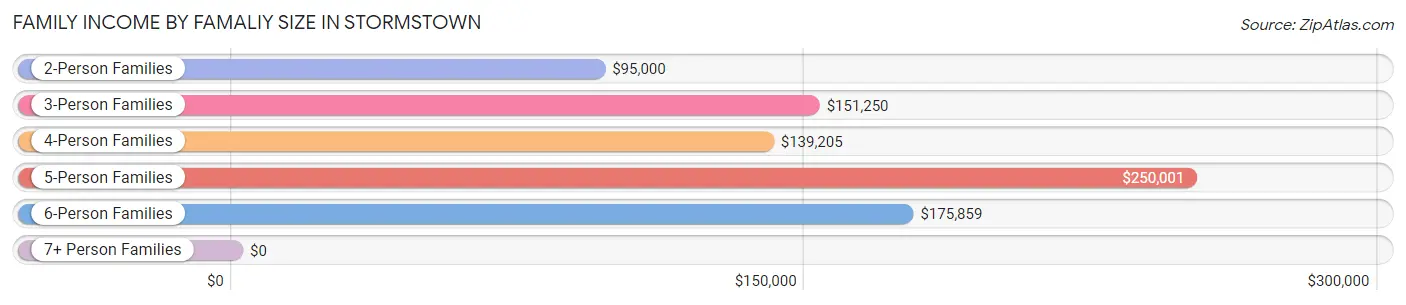
| Income Bracket | # Families | Median Income |
| 2-Person Families | 320 (44.5%) | $95,000 |
| 3-Person Families | 141 (19.6%) | $151,250 |
| 4-Person Families | 134 (18.6%) | $139,205 |
| 5-Person Families | 81 (11.3%) | $250,001 |
| 6-Person Families | 35 (4.9%) | $175,859 |
| 7+ Person Families | 8 (1.1%) | $0 |
| Total | 719 (100.0%) | $139,094 |
Family Income by Number of Earners in Stormstown
The median family income in Stormstown is $139,094, with families comprising 3+ earners (65) having the highest median family income of $218,125, while families with no earners (51) have the lowest median family income of $58,438, accounting for 9.0% and 7.1% of families, respectively.
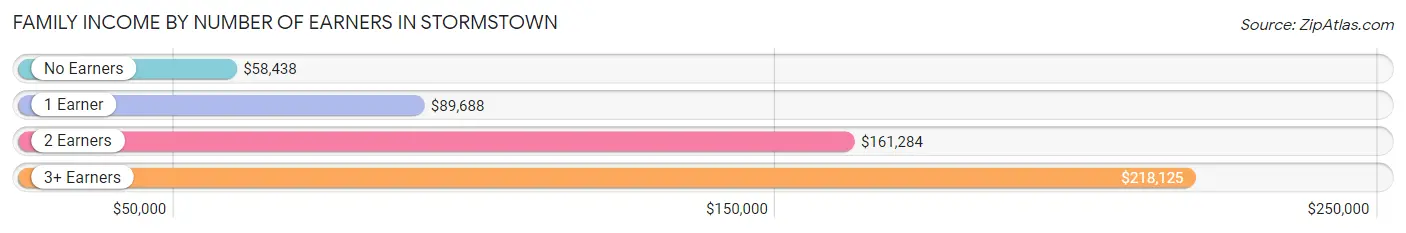
| Number of Earners | # Families | Median Income |
| No Earners | 51 (7.1%) | $58,438 |
| 1 Earner | 229 (31.9%) | $89,688 |
| 2 Earners | 374 (52.0%) | $161,284 |
| 3+ Earners | 65 (9.0%) | $218,125 |
| Total | 719 (100.0%) | $139,094 |
Household Income in Stormstown
Household Income Brackets in Stormstown
With 194 households falling in the category, the $200,000+ income range is the most frequent in Stormstown, accounting for 23.3% of all households.
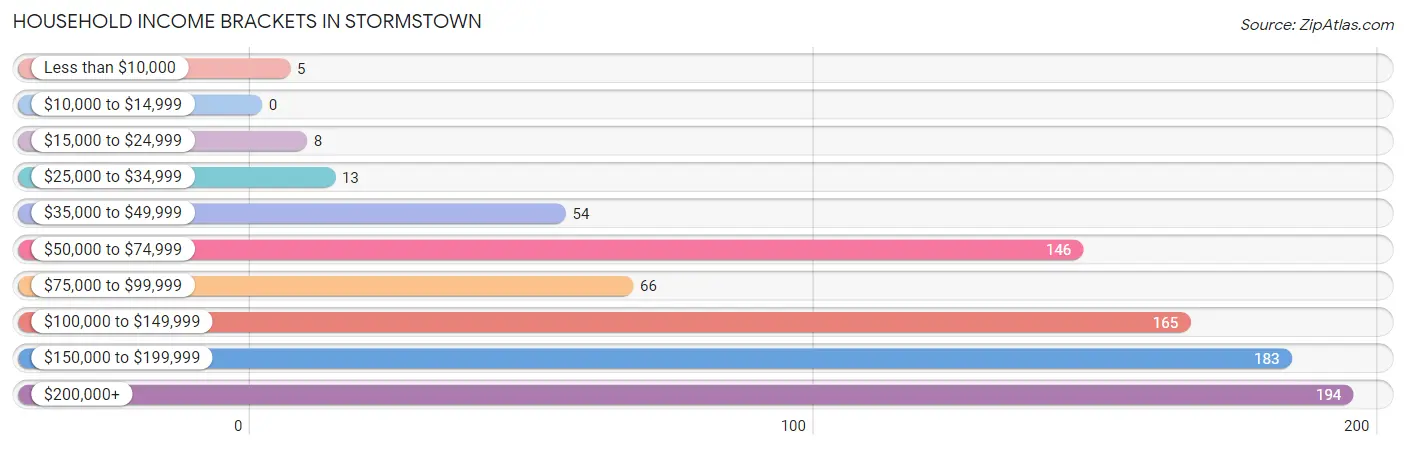
| Income Bracket | # Households | % Households |
| Less than $10,000 | 5 | 0.6% |
| $10,000 to $14,999 | 0 | 0.0% |
| $15,000 to $24,999 | 8 | 1.0% |
| $25,000 to $34,999 | 13 | 1.6% |
| $35,000 to $49,999 | 54 | 6.5% |
| $50,000 to $74,999 | 146 | 17.5% |
| $75,000 to $99,999 | 66 | 7.9% |
| $100,000 to $149,999 | 165 | 19.8% |
| $150,000 to $199,999 | 183 | 21.9% |
| $200,000+ | 194 | 23.3% |
Household Income by Householder Age in Stormstown
The median household income in Stormstown is $138,313, with the highest median household income of $175,063 found in the 25 to 44 years age bracket for the primary householder. A total of 227 households (27.2%) fall into this category.
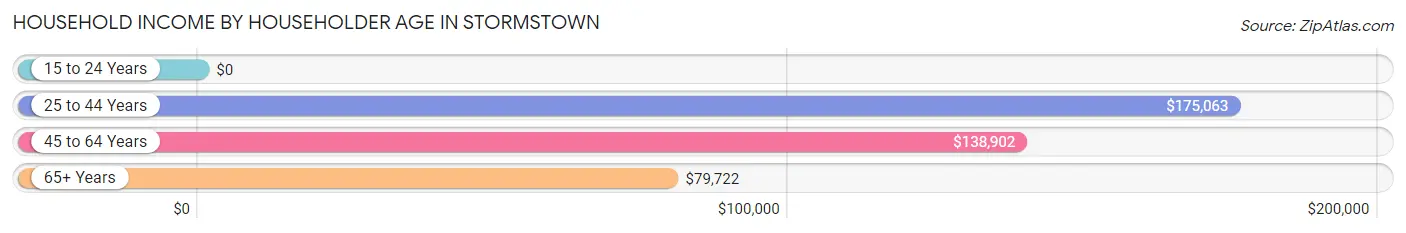
| Income Bracket | # Households | Median Income |
| 15 to 24 Years | 0 (0.0%) | $0 |
| 25 to 44 Years | 227 (27.2%) | $175,063 |
| 45 to 64 Years | 467 (56.0%) | $138,902 |
| 65+ Years | 140 (16.8%) | $79,722 |
| Total | 834 (100.0%) | $138,313 |
Poverty in Stormstown
Income Below Poverty by Sex and Age in Stormstown
With 0.4% poverty level for males and 0.5% for females among the residents of Stormstown, 75 year old and over males and 18 to 24 year old females are the most vulnerable to poverty, with 5 males (11.6%) and 1 females (5.6%) in their respective age groups living below the poverty level.
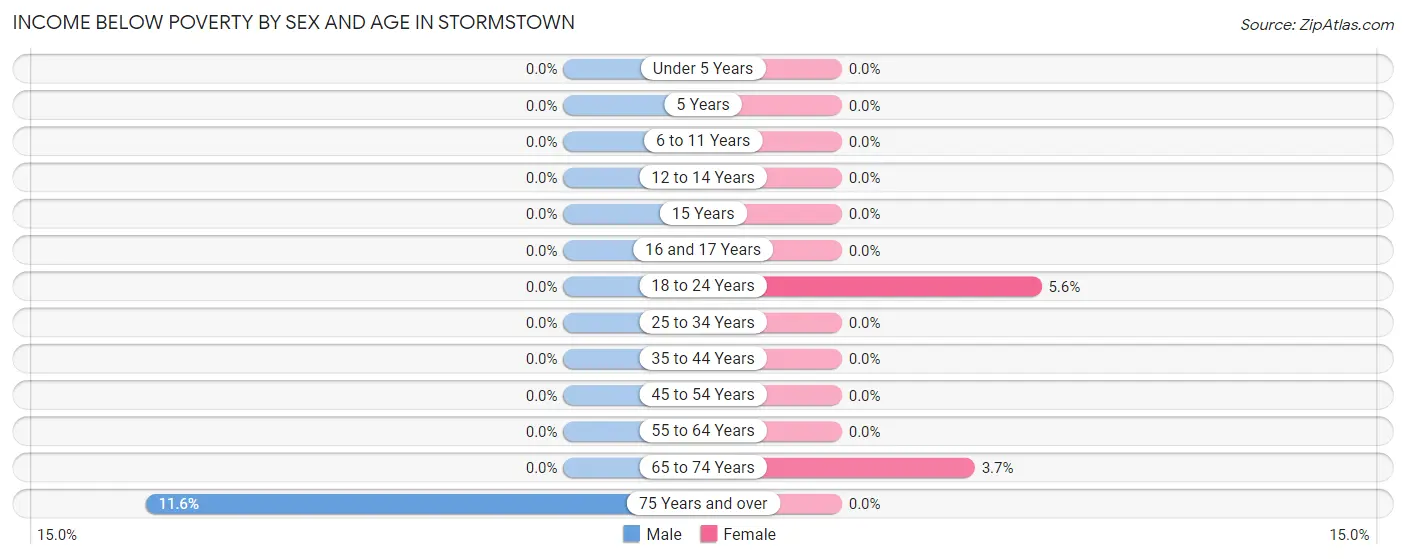
| Age Bracket | Male | Female |
| Under 5 Years | 0 (0.0%) | 0 (0.0%) |
| 5 Years | 0 (0.0%) | 0 (0.0%) |
| 6 to 11 Years | 0 (0.0%) | 0 (0.0%) |
| 12 to 14 Years | 0 (0.0%) | 0 (0.0%) |
| 15 Years | 0 (0.0%) | 0 (0.0%) |
| 16 and 17 Years | 0 (0.0%) | 0 (0.0%) |
| 18 to 24 Years | 0 (0.0%) | 1 (5.6%) |
| 25 to 34 Years | 0 (0.0%) | 0 (0.0%) |
| 35 to 44 Years | 0 (0.0%) | 0 (0.0%) |
| 45 to 54 Years | 0 (0.0%) | 0 (0.0%) |
| 55 to 64 Years | 0 (0.0%) | 0 (0.0%) |
| 65 to 74 Years | 0 (0.0%) | 5 (3.7%) |
| 75 Years and over | 5 (11.6%) | 0 (0.0%) |
| Total | 5 (0.4%) | 6 (0.5%) |
Income Above Poverty by Sex and Age in Stormstown
According to the poverty statistics in Stormstown, males aged under 5 years and females aged under 5 years are the age groups that are most secure financially, with 100.0% of males and 100.0% of females in these age groups living above the poverty line.
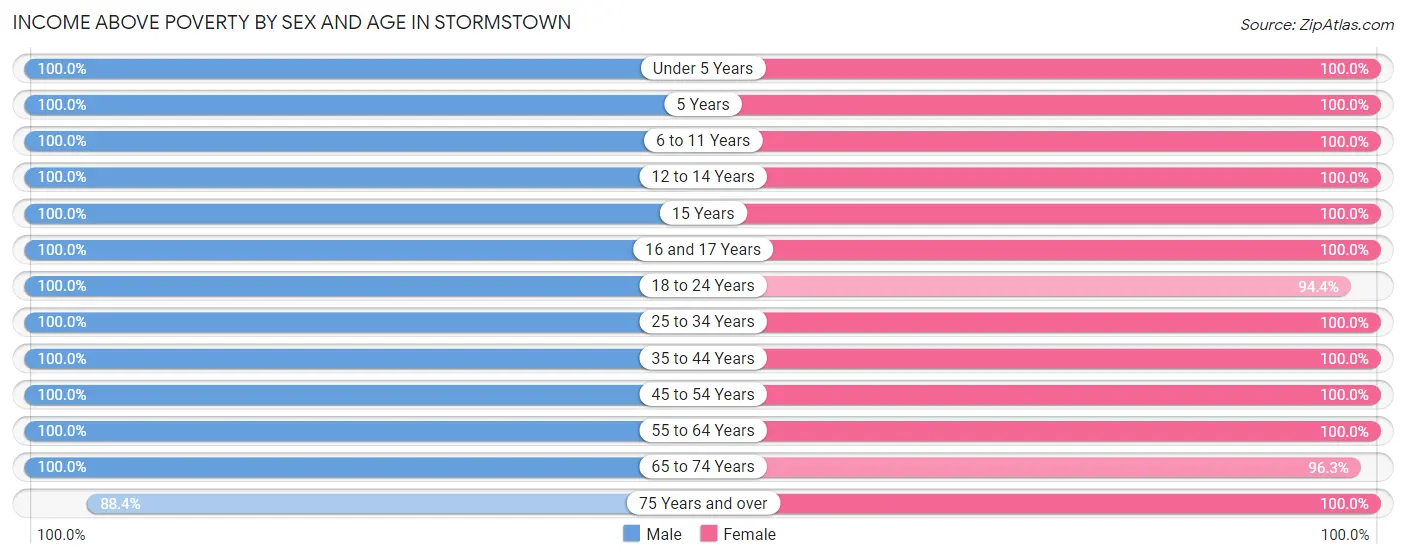
| Age Bracket | Male | Female |
| Under 5 Years | 57 (100.0%) | 45 (100.0%) |
| 5 Years | 25 (100.0%) | 12 (100.0%) |
| 6 to 11 Years | 189 (100.0%) | 109 (100.0%) |
| 12 to 14 Years | 95 (100.0%) | 56 (100.0%) |
| 15 Years | 22 (100.0%) | 53 (100.0%) |
| 16 and 17 Years | 19 (100.0%) | 46 (100.0%) |
| 18 to 24 Years | 33 (100.0%) | 17 (94.4%) |
| 25 to 34 Years | 112 (100.0%) | 83 (100.0%) |
| 35 to 44 Years | 233 (100.0%) | 161 (100.0%) |
| 45 to 54 Years | 226 (100.0%) | 242 (100.0%) |
| 55 to 64 Years | 201 (100.0%) | 160 (100.0%) |
| 65 to 74 Years | 72 (100.0%) | 130 (96.3%) |
| 75 Years and over | 38 (88.4%) | 17 (100.0%) |
| Total | 1,322 (99.6%) | 1,131 (99.5%) |
Income Below Poverty Among Married-Couple Families in Stormstown
The poverty statistics for married-couple families in Stormstown show that 0.8% or 5 of the total 638 families live below the poverty line. Families with no children have the highest poverty rate of 1.5%, comprising of 5 families. On the other hand, families with 1 or 2 children have the lowest poverty rate of 0.0%, which includes 0 families.
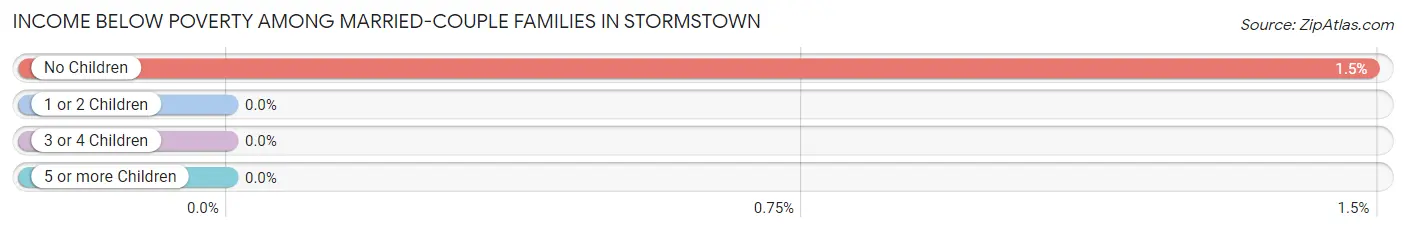
| Children | Above Poverty | Below Poverty |
| No Children | 330 (98.5%) | 5 (1.5%) |
| 1 or 2 Children | 207 (100.0%) | 0 (0.0%) |
| 3 or 4 Children | 96 (100.0%) | 0 (0.0%) |
| 5 or more Children | 0 (0.0%) | 0 (0.0%) |
| Total | 633 (99.2%) | 5 (0.8%) |
Income Below Poverty Among Single-Parent Households in Stormstown
| Children | Single Father | Single Mother |
| No Children | 0 (0.0%) | 0 (0.0%) |
| 1 or 2 Children | 0 (0.0%) | 0 (0.0%) |
| 3 or 4 Children | 0 (0.0%) | 0 (0.0%) |
| 5 or more Children | 0 (0.0%) | 0 (0.0%) |
| Total | 0 (0.0%) | 0 (0.0%) |
Income Below Poverty Among Married-Couple vs Single-Parent Households in Stormstown
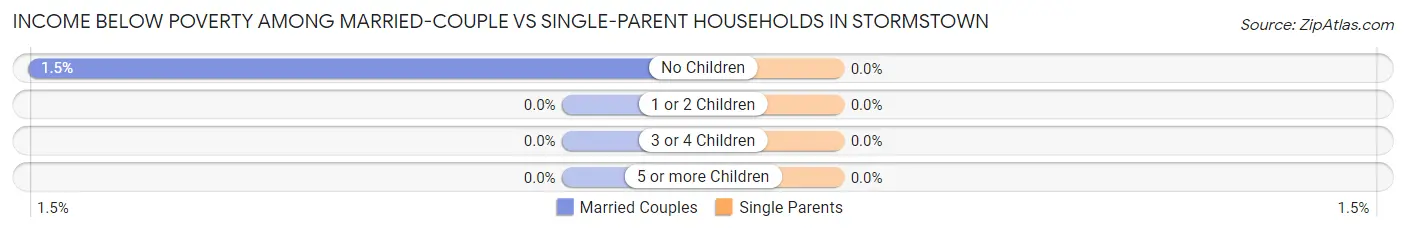
| Children | Married-Couple Families | Single-Parent Households |
| No Children | 5 (1.5%) | 0 (0.0%) |
| 1 or 2 Children | 0 (0.0%) | 0 (0.0%) |
| 3 or 4 Children | 0 (0.0%) | 0 (0.0%) |
| 5 or more Children | 0 (0.0%) | 0 (0.0%) |
| Total | 5 (0.8%) | 0 (0.0%) |
Race in Stormstown
The most populous races in Stormstown are White / Caucasian (2,185 | 88.7%), Asian (133 | 5.4%), and Two or more Races (109 | 4.4%).
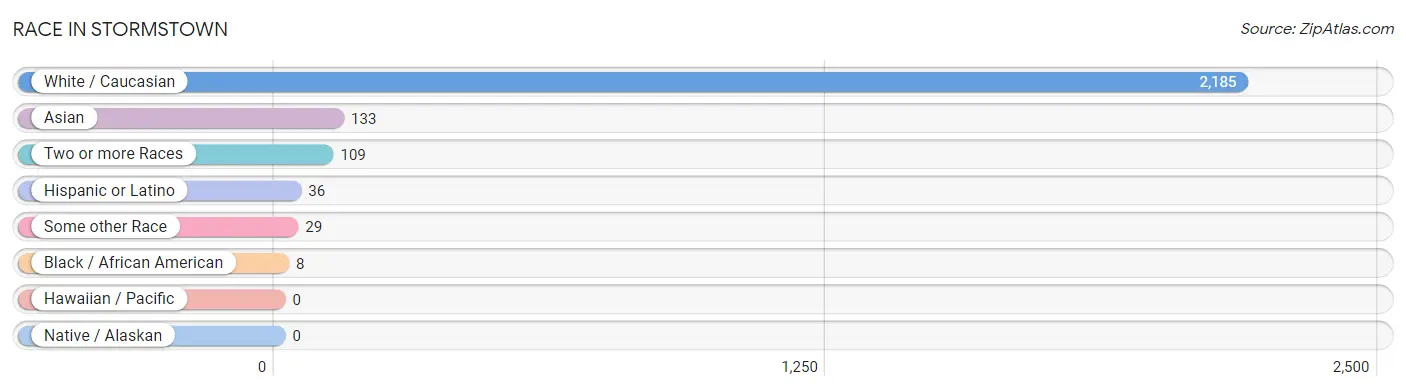
| Race | # Population | % Population |
| Asian | 133 | 5.4% |
| Black / African American | 8 | 0.3% |
| Hawaiian / Pacific | 0 | 0.0% |
| Hispanic or Latino | 36 | 1.5% |
| Native / Alaskan | 0 | 0.0% |
| White / Caucasian | 2,185 | 88.7% |
| Two or more Races | 109 | 4.4% |
| Some other Race | 29 | 1.2% |
| Total | 2,464 | 100.0% |
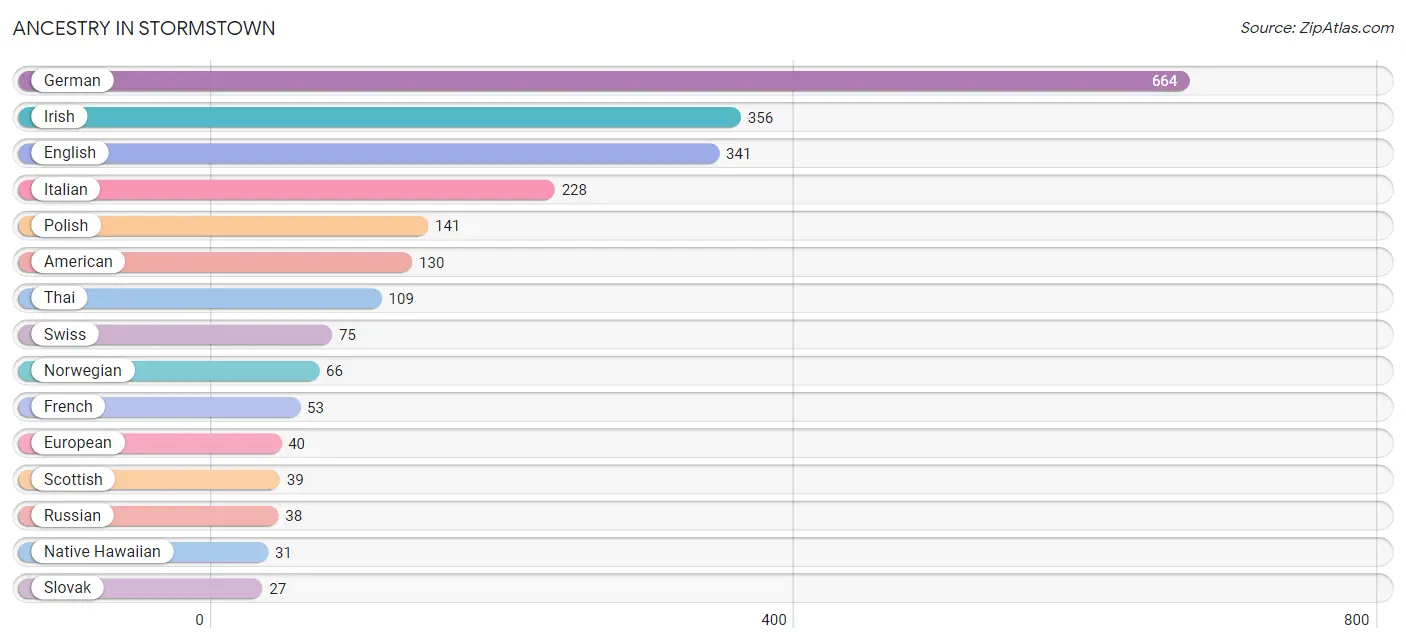
Ancestry in Stormstown
The most populous ancestries reported in Stormstown are German (664 | 27.0%), Irish (356 | 14.4%), English (341 | 13.8%), Italian (228 | 9.2%), and Polish (141 | 5.7%), together accounting for 70.2% of all Stormstown residents.
| Ancestry | # Population | % Population |
| American | 130 | 5.3% |
| Austrian | 24 | 1.0% |
| Belgian | 25 | 1.0% |
| British | 7 | 0.3% |
| Croatian | 5 | 0.2% |
| Czech | 4 | 0.2% |
| Czechoslovakian | 12 | 0.5% |
| Danish | 6 | 0.2% |
| Dominican | 20 | 0.8% |
| Dutch | 12 | 0.5% |
| Eastern European | 16 | 0.6% |
| English | 341 | 13.8% |
| European | 40 | 1.6% |
| French | 53 | 2.1% |
| German | 664 | 27.0% |
| Greek | 13 | 0.5% |
| Indian (Asian) | 16 | 0.6% |
| Irish | 356 | 14.4% |
| Italian | 228 | 9.2% |
| Korean | 7 | 0.3% |
| Lithuanian | 25 | 1.0% |
| Mexican | 8 | 0.3% |
| Native Hawaiian | 31 | 1.3% |
| Norwegian | 66 | 2.7% |
| Polish | 141 | 5.7% |
| Russian | 38 | 1.5% |
| Samoan | 12 | 0.5% |
| Scotch-Irish | 16 | 0.6% |
| Scottish | 39 | 1.6% |
| Slovak | 27 | 1.1% |
| Spaniard | 4 | 0.2% |
| Spanish | 4 | 0.2% |
| Sri Lankan | 1 | 0.0% |
| Swedish | 24 | 1.0% |
| Swiss | 75 | 3.0% |
| Thai | 109 | 4.4% |
| Welsh | 4 | 0.2% | View All 37 Rows |
Immigrants in Stormstown
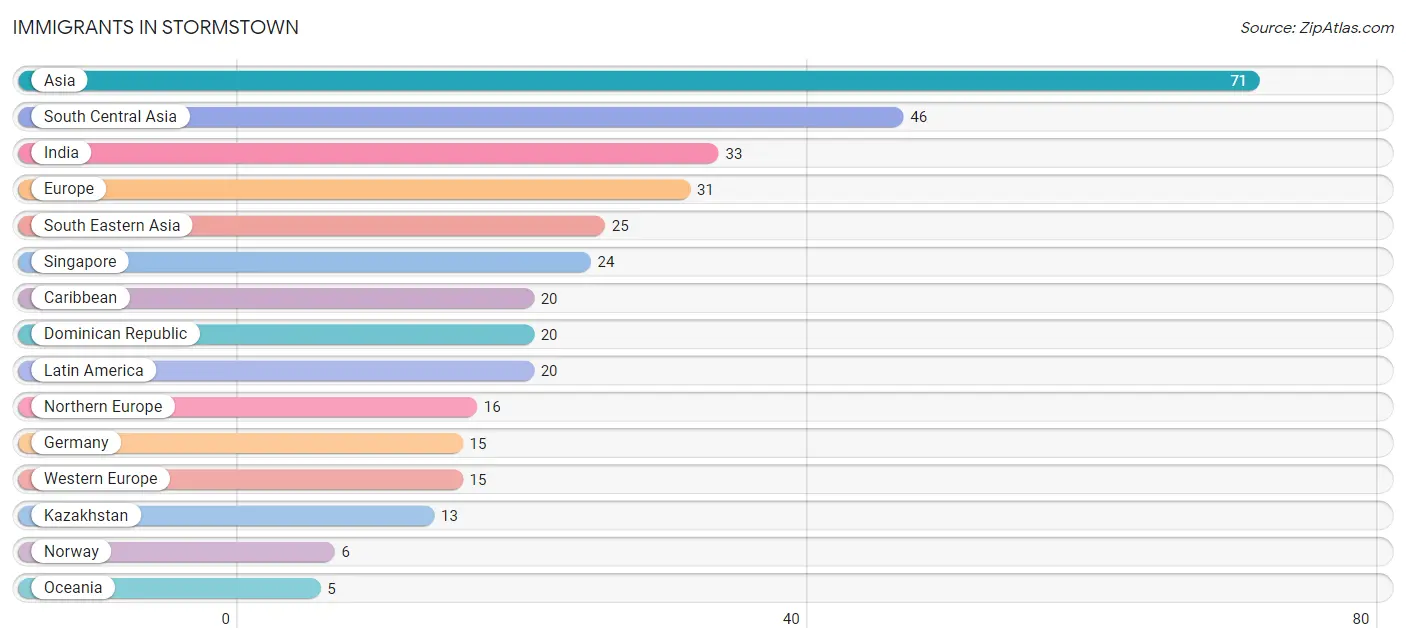
The most numerous immigrant groups reported in Stormstown came from Asia (71 | 2.9%), South Central Asia (46 | 1.9%), India (33 | 1.3%), Europe (31 | 1.3%), and South Eastern Asia (25 | 1.0%), together accounting for 8.4% of all Stormstown residents.
| Immigration Origin | # Population | % Population |
| Asia | 71 | 2.9% |
| Caribbean | 20 | 0.8% |
| Dominican Republic | 20 | 0.8% |
| Europe | 31 | 1.3% |
| Germany | 15 | 0.6% |
| India | 33 | 1.3% |
| Kazakhstan | 13 | 0.5% |
| Latin America | 20 | 0.8% |
| Northern Europe | 16 | 0.6% |
| Norway | 6 | 0.2% |
| Oceania | 5 | 0.2% |
| Singapore | 24 | 1.0% |
| South Central Asia | 46 | 1.9% |
| South Eastern Asia | 25 | 1.0% |
| Vietnam | 1 | 0.0% |
| Western Europe | 15 | 0.6% | View All 16 Rows |
Sex and Age in Stormstown
Sex and Age in Stormstown
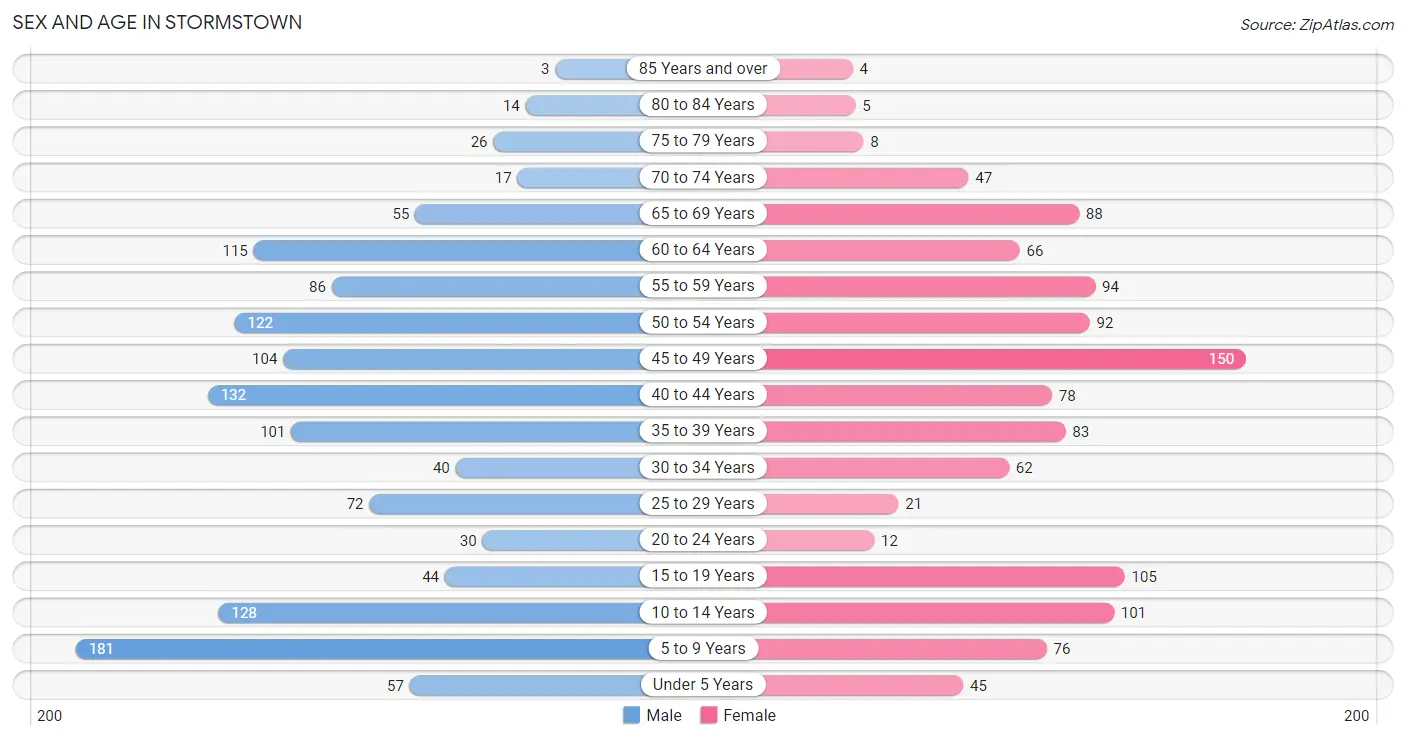
The most populous age groups in Stormstown are 5 to 9 Years (181 | 13.6%) for men and 45 to 49 Years (150 | 13.2%) for women.
| Age Bracket | Male | Female |
| Under 5 Years | 57 (4.3%) | 45 (4.0%) |
| 5 to 9 Years | 181 (13.6%) | 76 (6.7%) |
| 10 to 14 Years | 128 (9.7%) | 101 (8.9%) |
| 15 to 19 Years | 44 (3.3%) | 105 (9.2%) |
| 20 to 24 Years | 30 (2.3%) | 12 (1.1%) |
| 25 to 29 Years | 72 (5.4%) | 21 (1.8%) |
| 30 to 34 Years | 40 (3.0%) | 62 (5.4%) |
| 35 to 39 Years | 101 (7.6%) | 83 (7.3%) |
| 40 to 44 Years | 132 (10.0%) | 78 (6.9%) |
| 45 to 49 Years | 104 (7.8%) | 150 (13.2%) |
| 50 to 54 Years | 122 (9.2%) | 92 (8.1%) |
| 55 to 59 Years | 86 (6.5%) | 94 (8.3%) |
| 60 to 64 Years | 115 (8.7%) | 66 (5.8%) |
| 65 to 69 Years | 55 (4.1%) | 88 (7.7%) |
| 70 to 74 Years | 17 (1.3%) | 47 (4.1%) |
| 75 to 79 Years | 26 (2.0%) | 8 (0.7%) |
| 80 to 84 Years | 14 (1.1%) | 5 (0.4%) |
| 85 Years and over | 3 (0.2%) | 4 (0.4%) |
| Total | 1,327 (100.0%) | 1,137 (100.0%) |
Families and Households in Stormstown
Median Family Size in Stormstown
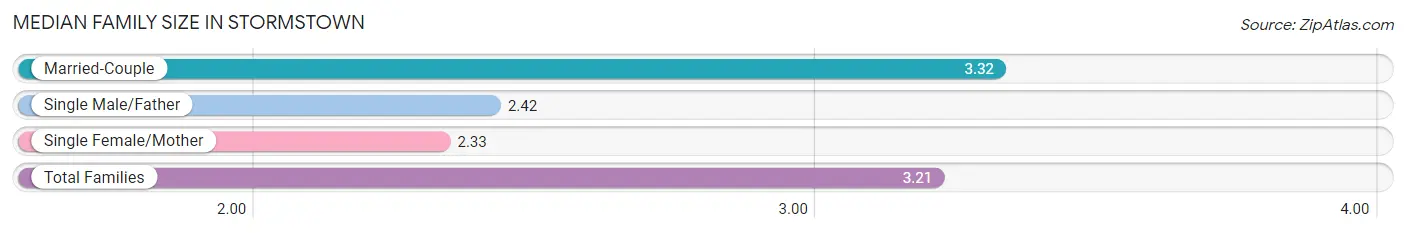
The median family size in Stormstown is 3.21 persons per family, with married-couple families (638 | 88.7%) accounting for the largest median family size of 3.32 persons per family. On the other hand, single female/mother families (69 | 9.6%) represent the smallest median family size with 2.33 persons per family.
| Family Type | # Families | Family Size |
| Married-Couple | 638 (88.7%) | 3.32 |
| Single Male/Father | 12 (1.7%) | 2.42 |
| Single Female/Mother | 69 (9.6%) | 2.33 |
| Total Families | 719 (100.0%) | 3.21 |
Median Household Size in Stormstown
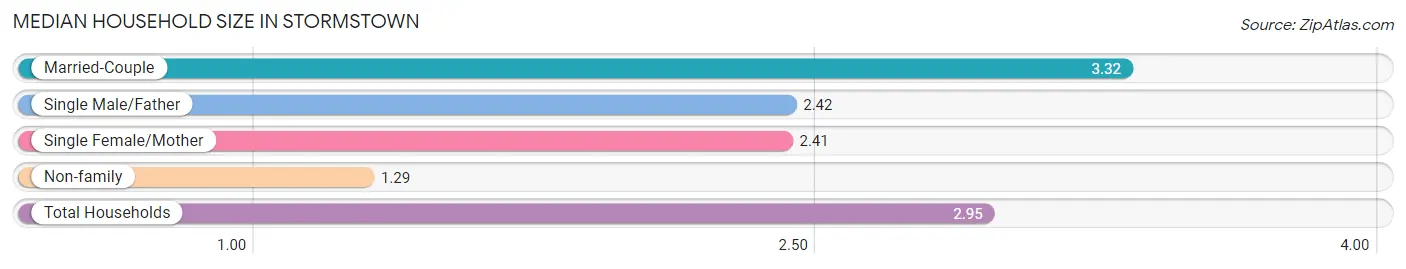
The median household size in Stormstown is 2.95 persons per household, with married-couple households (638 | 76.5%) accounting for the largest median household size of 3.32 persons per household. non-family households (115 | 13.8%) represent the smallest median household size with 1.29 persons per household.
| Household Type | # Households | Household Size |
| Married-Couple | 638 (76.5%) | 3.32 |
| Single Male/Father | 12 (1.4%) | 2.42 |
| Single Female/Mother | 69 (8.3%) | 2.41 |
| Non-family | 115 (13.8%) | 1.29 |
| Total Households | 834 (100.0%) | 2.95 |
Household Size by Marriage Status in Stormstown
Out of a total of 834 households in Stormstown, 719 (86.2%) are family households, while 115 (13.8%) are nonfamily households. The most numerous type of family households are 2-person households, comprising 316, and the most common type of nonfamily households are 1-person households, comprising 92.
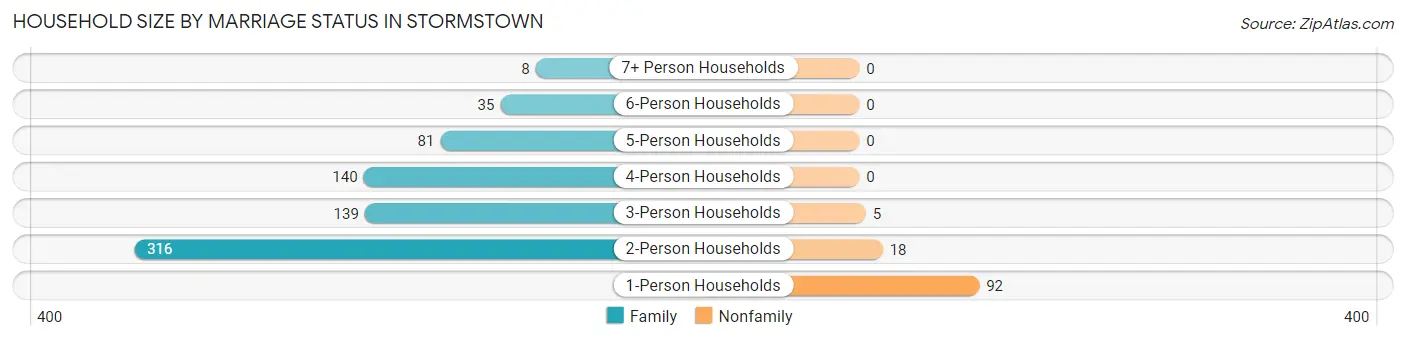
| Household Size | Family Households | Nonfamily Households |
| 1-Person Households | - | 92 (11.0%) |
| 2-Person Households | 316 (37.9%) | 18 (2.2%) |
| 3-Person Households | 139 (16.7%) | 5 (0.6%) |
| 4-Person Households | 140 (16.8%) | 0 (0.0%) |
| 5-Person Households | 81 (9.7%) | 0 (0.0%) |
| 6-Person Households | 35 (4.2%) | 0 (0.0%) |
| 7+ Person Households | 8 (1.0%) | 0 (0.0%) |
| Total | 719 (86.2%) | 115 (13.8%) |
Female Fertility in Stormstown
Fertility by Age in Stormstown
Average fertility rate in Stormstown is 47.0 births per 1,000 women. Women in the age bracket of 35 to 50 years have the highest fertility rate with 59.0 births per 1,000 women. Women in the age bracket of 35 to 50 years acount for 80.8% of all women with births.
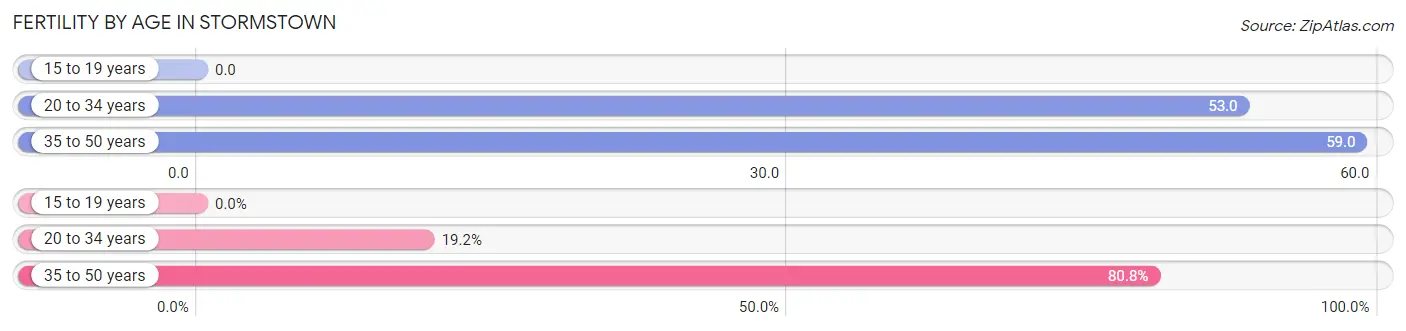
| Age Bracket | Women with Births | Births / 1,000 Women |
| 15 to 19 years | 0 (0.0%) | 0.0 |
| 20 to 34 years | 5 (19.2%) | 53.0 |
| 35 to 50 years | 21 (80.8%) | 59.0 |
| Total | 26 (100.0%) | 47.0 |
Fertility by Age by Marriage Status in Stormstown
73.1% of women with births (26) in Stormstown are married. The highest percentage of unmarried women with births falls into 35 to 50 years age bracket with 33.3% of them unmarried at the time of birth, while the lowest percentage of unmarried women with births belong to 20 to 34 years age bracket with 0.0% of them unmarried.
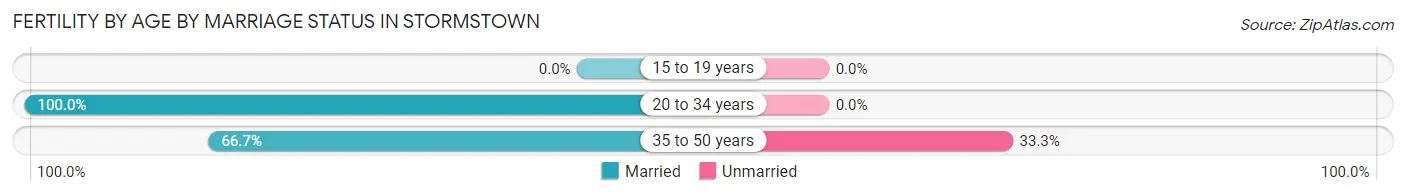
| Age Bracket | Married | Unmarried |
| 15 to 19 years | 0 (0.0%) | 0 (0.0%) |
| 20 to 34 years | 5 (100.0%) | 0 (0.0%) |
| 35 to 50 years | 14 (66.7%) | 7 (33.3%) |
| Total | 19 (73.1%) | 7 (26.9%) |
Fertility by Education in Stormstown
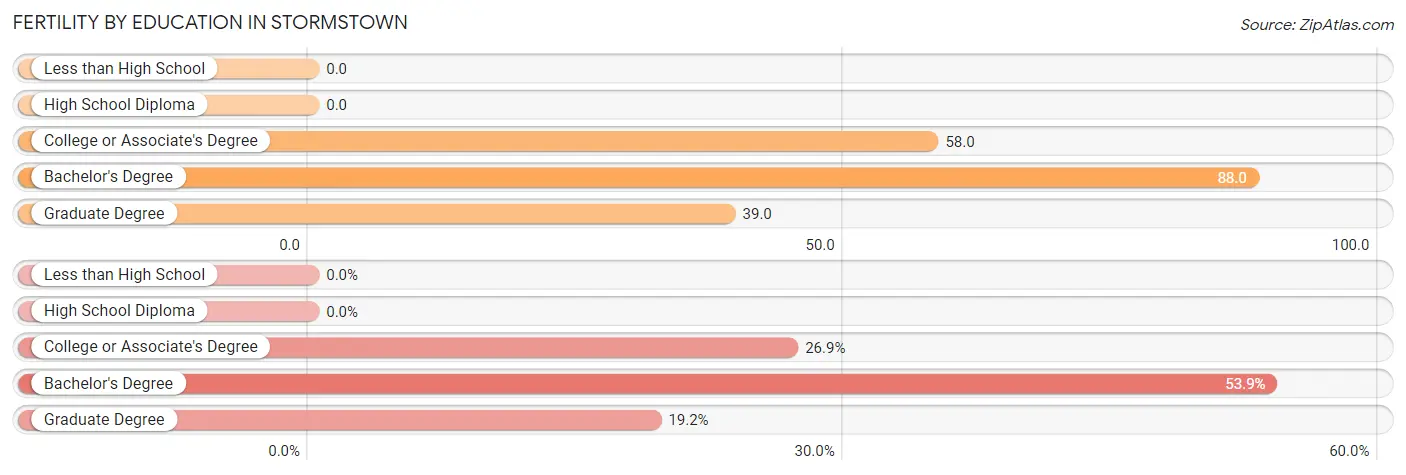
| Educational Attainment | Women with Births | Births / 1,000 Women |
| Less than High School | 0 (0.0%) | 0.0 |
| High School Diploma | 0 (0.0%) | 0.0 |
| College or Associate's Degree | 7 (26.9%) | 58.0 |
| Bachelor's Degree | 14 (53.8%) | 88.0 |
| Graduate Degree | 5 (19.2%) | 39.0 |
| Total | 26 (100.0%) | 47.0 |
Fertility by Education by Marriage Status in Stormstown
26.9% of women with births in Stormstown are unmarried. Women with the educational attainment of bachelor's degree are most likely to be married with 100.0% of them married at childbirth, while women with the educational attainment of college or associate's degree are least likely to be married with 100.0% of them unmarried at childbirth.
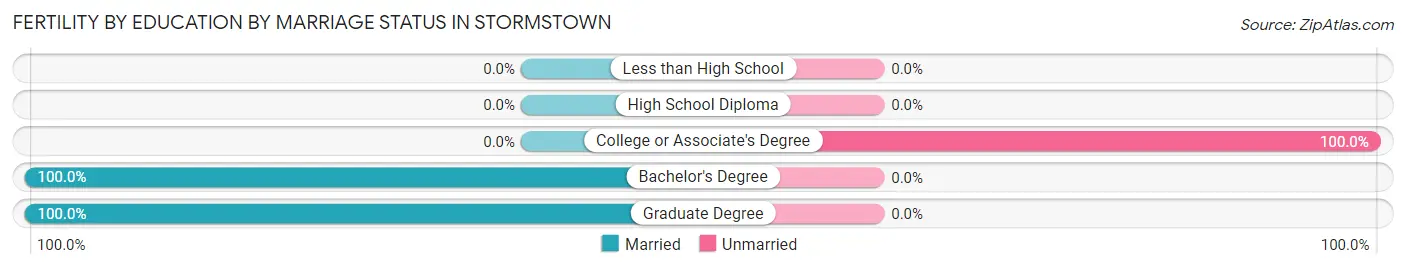
| Educational Attainment | Married | Unmarried |
| Less than High School | 0 (0.0%) | 0 (0.0%) |
| High School Diploma | 0 (0.0%) | 0 (0.0%) |
| College or Associate's Degree | 0 (0.0%) | 7 (100.0%) |
| Bachelor's Degree | 14 (100.0%) | 0 (0.0%) |
| Graduate Degree | 5 (100.0%) | 0 (0.0%) |
| Total | 19 (73.1%) | 7 (26.9%) |
Employment Characteristics in Stormstown
Employment by Class of Employer in Stormstown
Among the 1,333 employed individuals in Stormstown, private company employees (669 | 50.2%), not-for-profit organizations (265 | 19.9%), and state government employees (167 | 12.5%) make up the most common classes of employment.
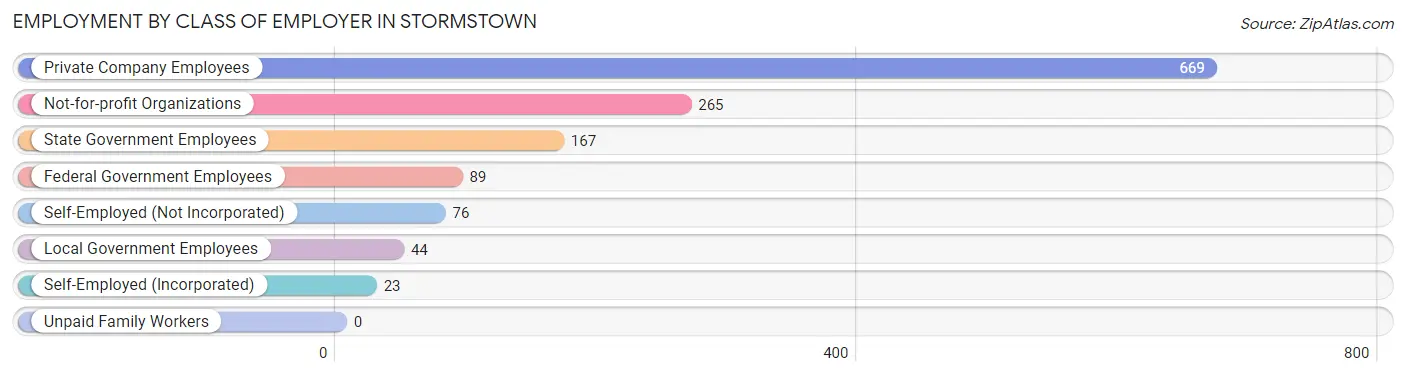
| Employer Class | # Employees | % Employees |
| Private Company Employees | 669 | 50.2% |
| Self-Employed (Incorporated) | 23 | 1.7% |
| Self-Employed (Not Incorporated) | 76 | 5.7% |
| Not-for-profit Organizations | 265 | 19.9% |
| Local Government Employees | 44 | 3.3% |
| State Government Employees | 167 | 12.5% |
| Federal Government Employees | 89 | 6.7% |
| Unpaid Family Workers | 0 | 0.0% |
| Total | 1,333 | 100.0% |
Employment Status by Age in Stormstown
According to the labor force statistics for Stormstown, out of the total population over 16 years of age (1,801), 77.5% or 1,396 individuals are in the labor force, with 4.6% or 64 of them unemployed. The age group with the highest labor force participation rate is 30 to 34 years, with 100.0% or 102 individuals in the labor force. Within the labor force, the 75 years and over age range has the highest percentage of unemployed individuals, with 100.0% or 5 of them being unemployed.
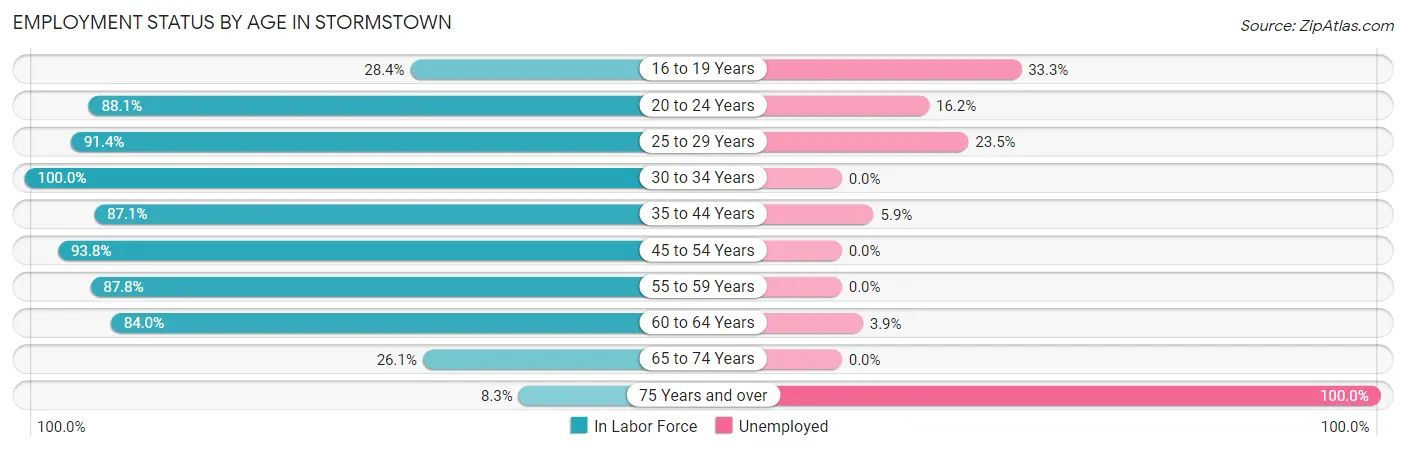
| Age Bracket | In Labor Force | Unemployed |
| 16 to 19 Years | 21 (28.4%) | 7 (33.3%) |
| 20 to 24 Years | 37 (88.1%) | 6 (16.2%) |
| 25 to 29 Years | 85 (91.4%) | 20 (23.5%) |
| 30 to 34 Years | 102 (100.0%) | 0 (0.0%) |
| 35 to 44 Years | 343 (87.1%) | 20 (5.9%) |
| 45 to 54 Years | 439 (93.8%) | 0 (0.0%) |
| 55 to 59 Years | 158 (87.8%) | 0 (0.0%) |
| 60 to 64 Years | 152 (84.0%) | 6 (3.9%) |
| 65 to 74 Years | 54 (26.1%) | 0 (0.0%) |
| 75 Years and over | 5 (8.3%) | 5 (100.0%) |
| Total | 1,396 (77.5%) | 64 (4.6%) |
Employment Status by Educational Attainment in Stormstown
According to labor force statistics for Stormstown, 90.2% of individuals (1,279) out of the total population between 25 and 64 years of age (1,418) are in the labor force, with 3.6% or 46 of them being unemployed. The group with the highest labor force participation rate are those with the educational attainment of less than high school, with 100.0% or 8 individuals in the labor force. Within the labor force, individuals with high school diploma education have the highest percentage of unemployment, with 12.3% or 25 of them being unemployed.
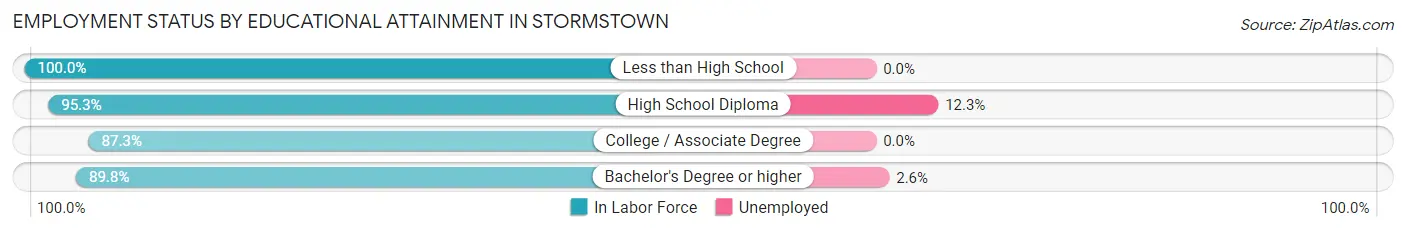
| Educational Attainment | In Labor Force | Unemployed |
| Less than High School | 8 (100.0%) | 0 (0.0%) |
| High School Diploma | 204 (95.3%) | 26 (12.3%) |
| College / Associate Degree | 254 (87.3%) | 0 (0.0%) |
| Bachelor's Degree or higher | 813 (89.8%) | 24 (2.6%) |
| Total | 1,279 (90.2%) | 51 (3.6%) |
Employment Occupations by Sex in Stormstown
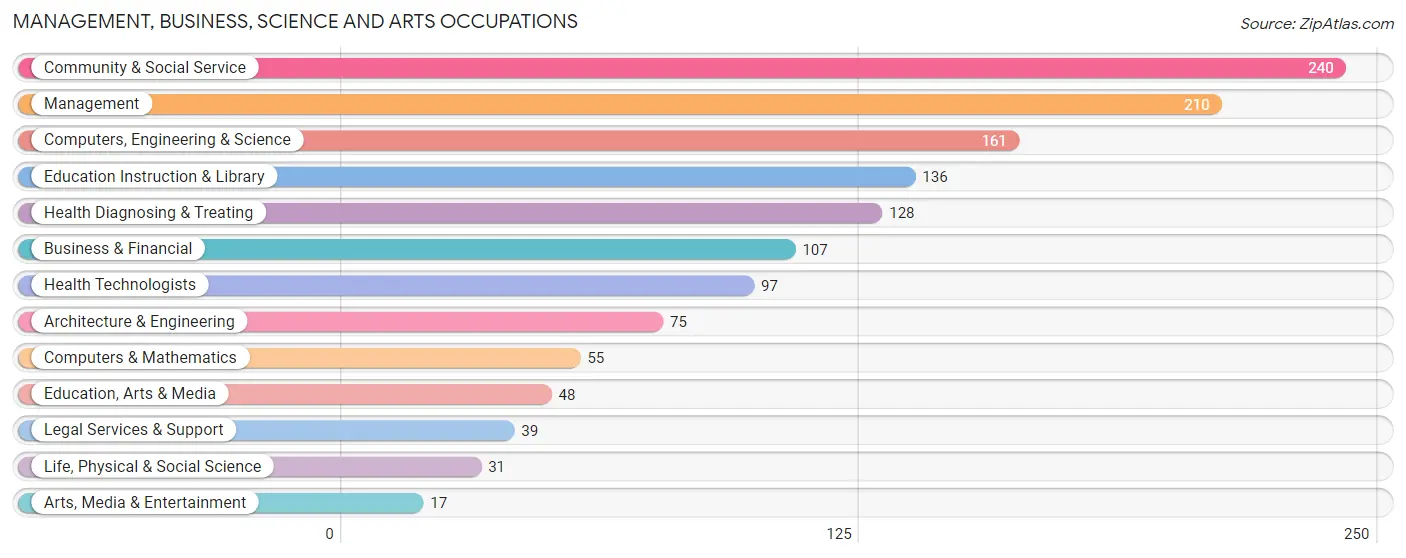
Management, Business, Science and Arts Occupations
The most common Management, Business, Science and Arts occupations in Stormstown are Community & Social Service (240 | 18.4%), Management (210 | 16.1%), Computers, Engineering & Science (161 | 12.3%), Education Instruction & Library (136 | 10.4%), and Health Diagnosing & Treating (128 | 9.8%).
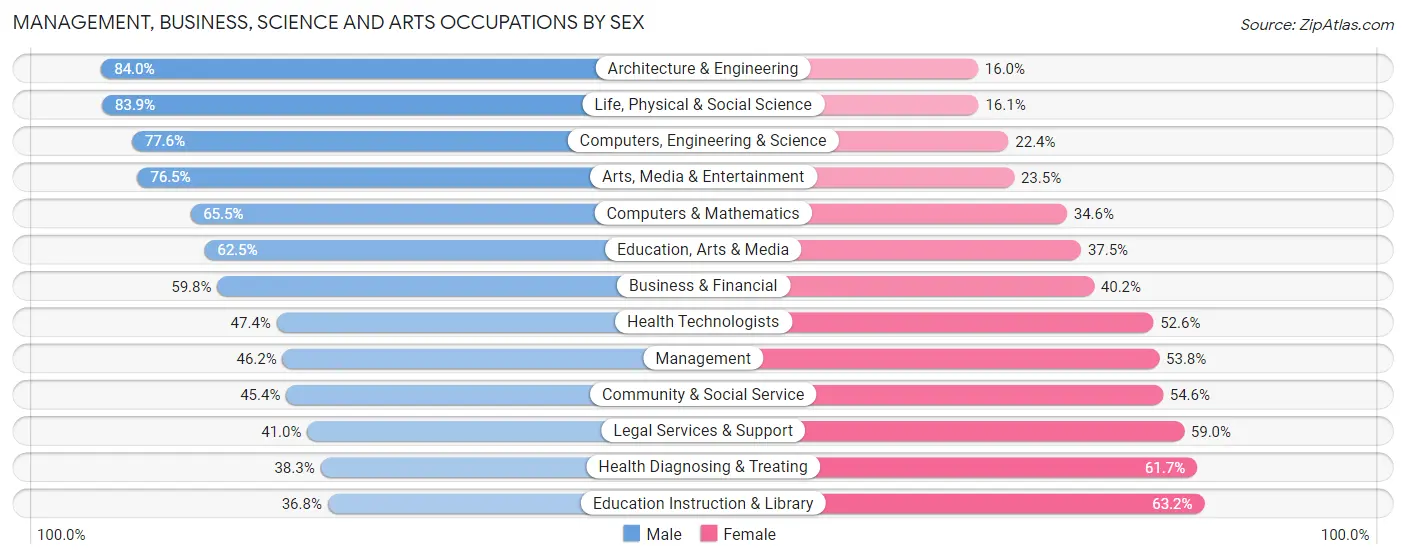
Management, Business, Science and Arts Occupations by Sex
Within the Management, Business, Science and Arts occupations in Stormstown, the most male-oriented occupations are Architecture & Engineering (84.0%), Life, Physical & Social Science (83.9%), and Computers, Engineering & Science (77.6%), while the most female-oriented occupations are Education Instruction & Library (63.2%), Health Diagnosing & Treating (61.7%), and Legal Services & Support (59.0%).
| Occupation | Male | Female |
| Management | 97 (46.2%) | 113 (53.8%) |
| Business & Financial | 64 (59.8%) | 43 (40.2%) |
| Computers, Engineering & Science | 125 (77.6%) | 36 (22.4%) |
| Computers & Mathematics | 36 (65.4%) | 19 (34.5%) |
| Architecture & Engineering | 63 (84.0%) | 12 (16.0%) |
| Life, Physical & Social Science | 26 (83.9%) | 5 (16.1%) |
| Community & Social Service | 109 (45.4%) | 131 (54.6%) |
| Education, Arts & Media | 30 (62.5%) | 18 (37.5%) |
| Legal Services & Support | 16 (41.0%) | 23 (59.0%) |
| Education Instruction & Library | 50 (36.8%) | 86 (63.2%) |
| Arts, Media & Entertainment | 13 (76.5%) | 4 (23.5%) |
| Health Diagnosing & Treating | 49 (38.3%) | 79 (61.7%) |
| Health Technologists | 46 (47.4%) | 51 (52.6%) |
| Total (Category) | 444 (52.5%) | 402 (47.5%) |
| Total (Overall) | 736 (56.4%) | 568 (43.6%) |
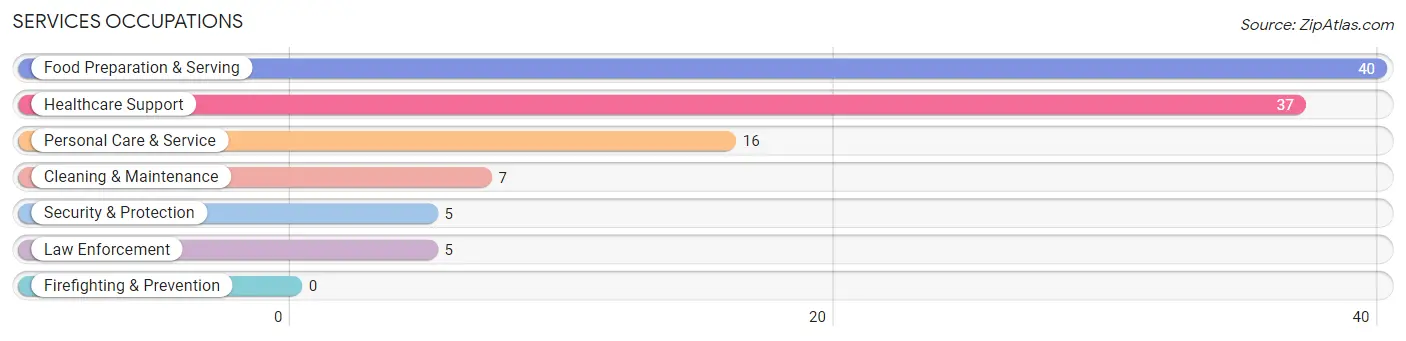
Services Occupations
The most common Services occupations in Stormstown are Food Preparation & Serving (40 | 3.1%), Healthcare Support (37 | 2.8%), Personal Care & Service (16 | 1.2%), Cleaning & Maintenance (7 | 0.5%), and Security & Protection (5 | 0.4%).
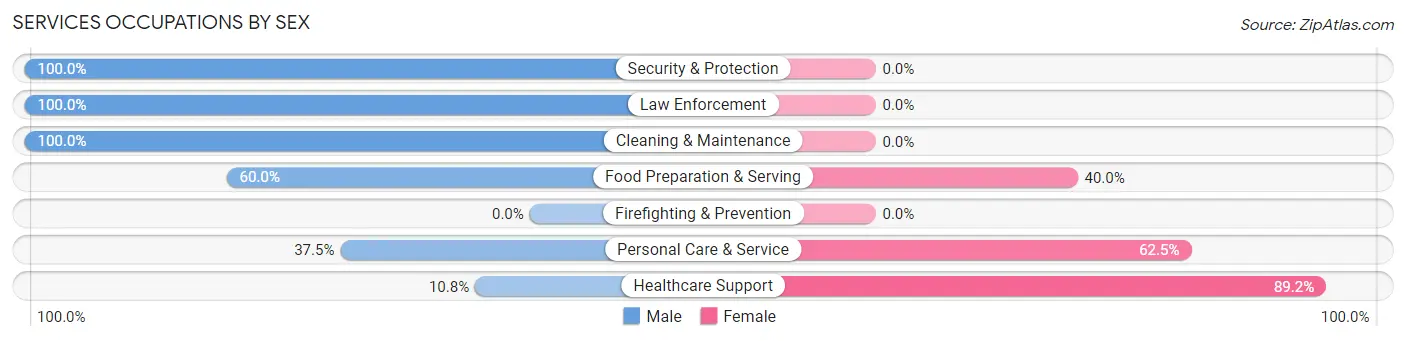
Services Occupations by Sex
Within the Services occupations in Stormstown, the most male-oriented occupations are Security & Protection (100.0%), Law Enforcement (100.0%), and Cleaning & Maintenance (100.0%), while the most female-oriented occupations are Healthcare Support (89.2%), Personal Care & Service (62.5%), and Food Preparation & Serving (40.0%).
| Occupation | Male | Female |
| Healthcare Support | 4 (10.8%) | 33 (89.2%) |
| Security & Protection | 5 (100.0%) | 0 (0.0%) |
| Firefighting & Prevention | 0 (0.0%) | 0 (0.0%) |
| Law Enforcement | 5 (100.0%) | 0 (0.0%) |
| Food Preparation & Serving | 24 (60.0%) | 16 (40.0%) |
| Cleaning & Maintenance | 7 (100.0%) | 0 (0.0%) |
| Personal Care & Service | 6 (37.5%) | 10 (62.5%) |
| Total (Category) | 46 (43.8%) | 59 (56.2%) |
| Total (Overall) | 736 (56.4%) | 568 (43.6%) |
Sales and Office Occupations
The most common Sales and Office occupations in Stormstown are Sales & Related (96 | 7.4%), and Office & Administration (85 | 6.5%).
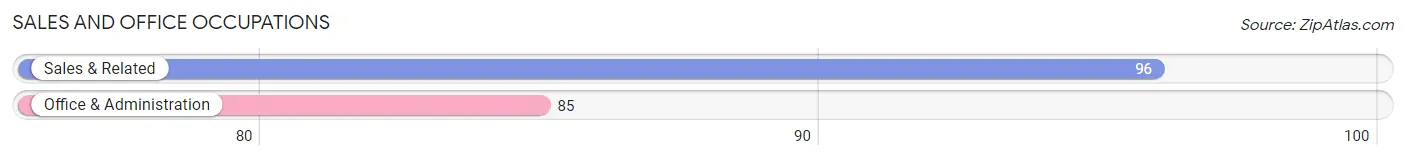
Sales and Office Occupations by Sex
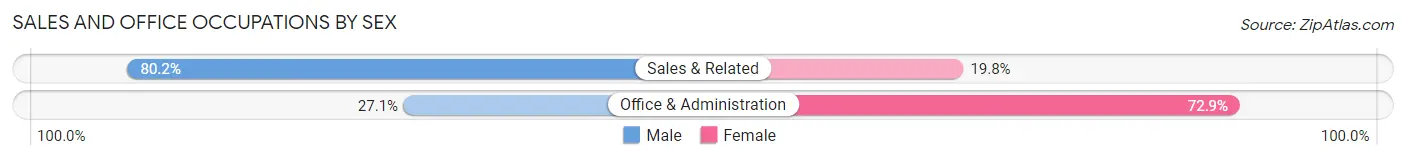
| Occupation | Male | Female |
| Sales & Related | 77 (80.2%) | 19 (19.8%) |
| Office & Administration | 23 (27.1%) | 62 (72.9%) |
| Total (Category) | 100 (55.2%) | 81 (44.8%) |
| Total (Overall) | 736 (56.4%) | 568 (43.6%) |
Natural Resources, Construction and Maintenance Occupations
The most common Natural Resources, Construction and Maintenance occupations in Stormstown are , and Construction & Extraction (53 | 4.1%).
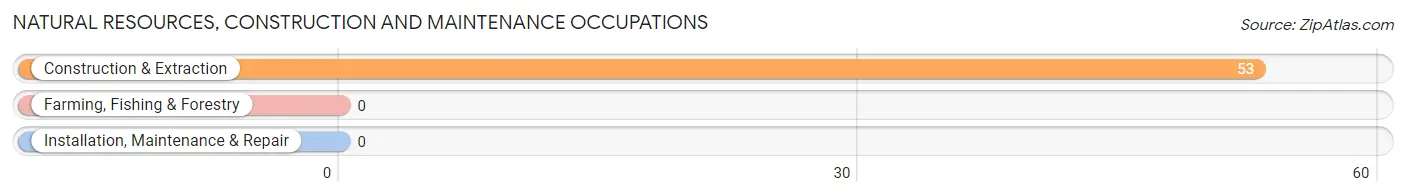
Natural Resources, Construction and Maintenance Occupations by Sex
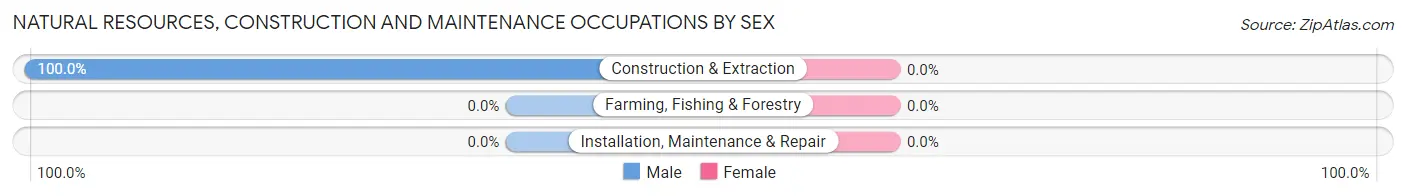
| Occupation | Male | Female |
| Farming, Fishing & Forestry | 0 (0.0%) | 0 (0.0%) |
| Construction & Extraction | 53 (100.0%) | 0 (0.0%) |
| Installation, Maintenance & Repair | 0 (0.0%) | 0 (0.0%) |
| Total (Category) | 53 (100.0%) | 0 (0.0%) |
| Total (Overall) | 736 (56.4%) | 568 (43.6%) |
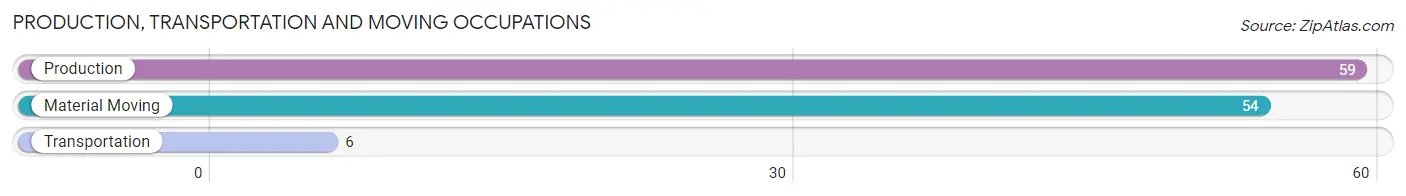
Production, Transportation and Moving Occupations
The most common Production, Transportation and Moving occupations in Stormstown are Production (59 | 4.5%), Material Moving (54 | 4.1%), and Transportation (6 | 0.5%).
Production, Transportation and Moving Occupations by Sex
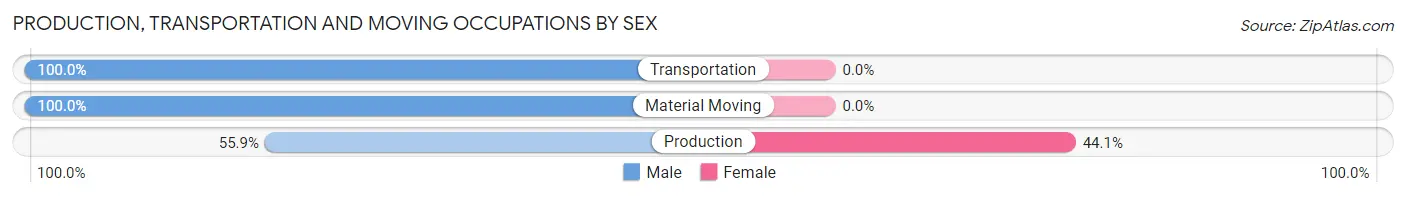
| Occupation | Male | Female |
| Production | 33 (55.9%) | 26 (44.1%) |
| Transportation | 6 (100.0%) | 0 (0.0%) |
| Material Moving | 54 (100.0%) | 0 (0.0%) |
| Total (Category) | 93 (78.1%) | 26 (21.8%) |
| Total (Overall) | 736 (56.4%) | 568 (43.6%) |
Employment Industries by Sex in Stormstown
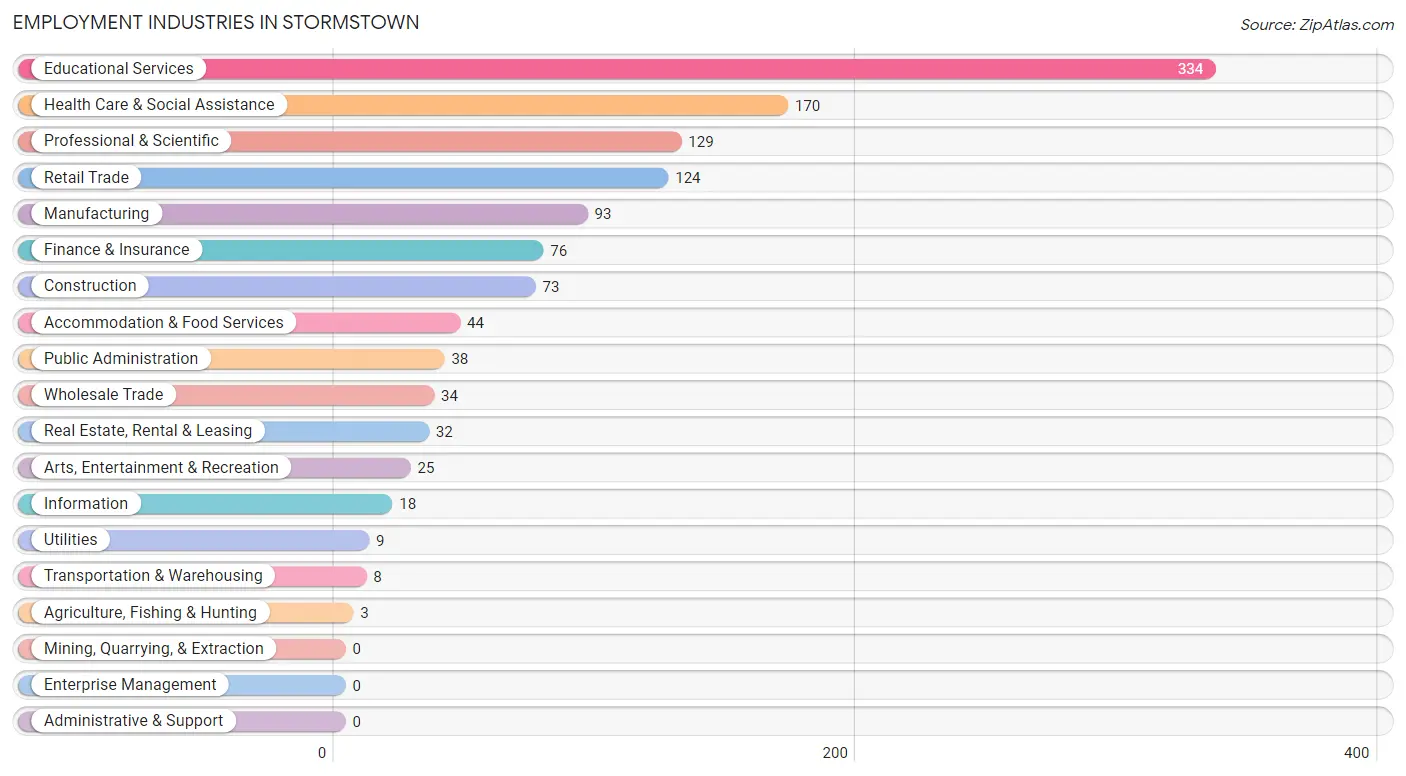
Employment Industries in Stormstown
The major employment industries in Stormstown include Educational Services (334 | 25.6%), Health Care & Social Assistance (170 | 13.0%), Professional & Scientific (129 | 9.9%), Retail Trade (124 | 9.5%), and Manufacturing (93 | 7.1%).
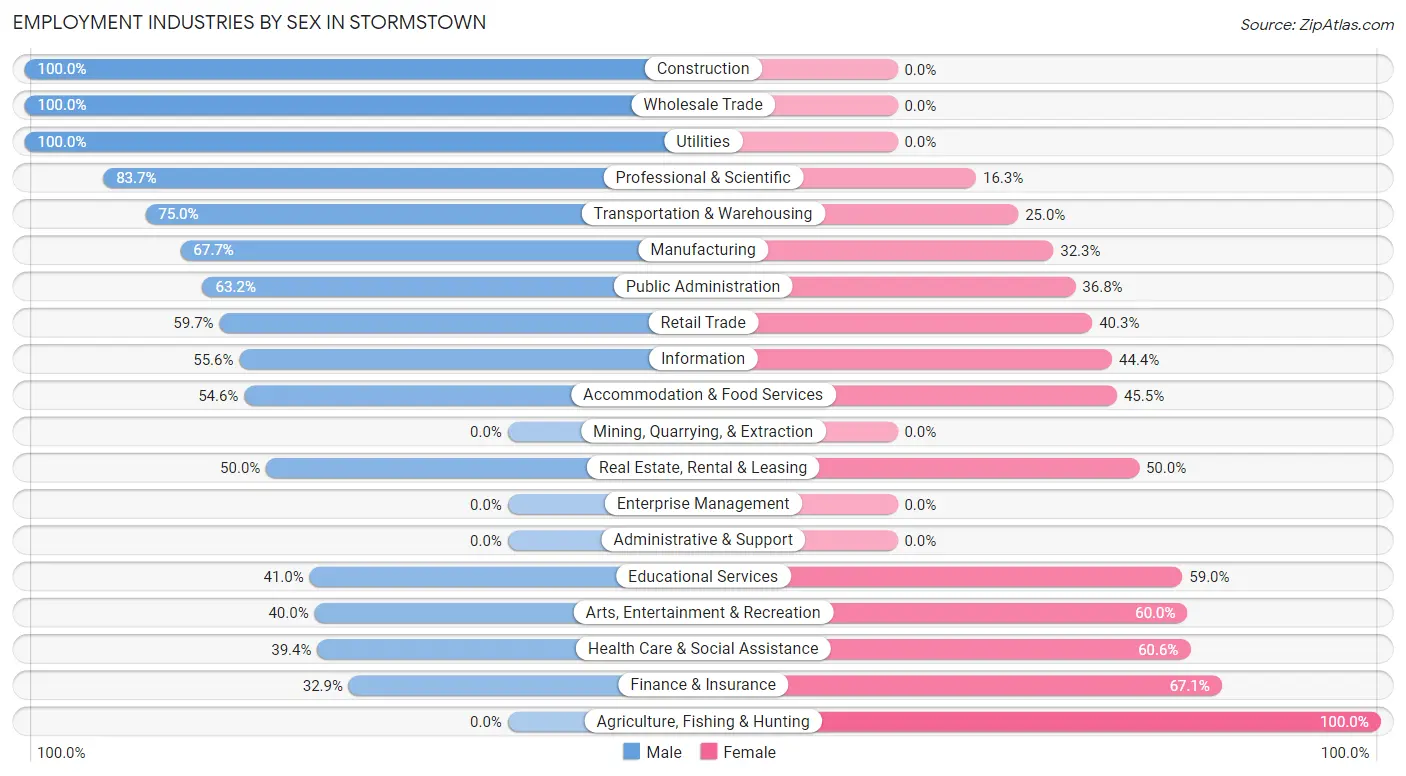
Employment Industries by Sex in Stormstown
The Stormstown industries that see more men than women are Construction (100.0%), Wholesale Trade (100.0%), and Utilities (100.0%), whereas the industries that tend to have a higher number of women are Agriculture, Fishing & Hunting (100.0%), Finance & Insurance (67.1%), and Health Care & Social Assistance (60.6%).
| Industry | Male | Female |
| Agriculture, Fishing & Hunting | 0 (0.0%) | 3 (100.0%) |
| Mining, Quarrying, & Extraction | 0 (0.0%) | 0 (0.0%) |
| Construction | 73 (100.0%) | 0 (0.0%) |
| Manufacturing | 63 (67.7%) | 30 (32.3%) |
| Wholesale Trade | 34 (100.0%) | 0 (0.0%) |
| Retail Trade | 74 (59.7%) | 50 (40.3%) |
| Transportation & Warehousing | 6 (75.0%) | 2 (25.0%) |
| Utilities | 9 (100.0%) | 0 (0.0%) |
| Information | 10 (55.6%) | 8 (44.4%) |
| Finance & Insurance | 25 (32.9%) | 51 (67.1%) |
| Real Estate, Rental & Leasing | 16 (50.0%) | 16 (50.0%) |
| Professional & Scientific | 108 (83.7%) | 21 (16.3%) |
| Enterprise Management | 0 (0.0%) | 0 (0.0%) |
| Administrative & Support | 0 (0.0%) | 0 (0.0%) |
| Educational Services | 137 (41.0%) | 197 (59.0%) |
| Health Care & Social Assistance | 67 (39.4%) | 103 (60.6%) |
| Arts, Entertainment & Recreation | 10 (40.0%) | 15 (60.0%) |
| Accommodation & Food Services | 24 (54.5%) | 20 (45.5%) |
| Public Administration | 24 (63.2%) | 14 (36.8%) |
| Total | 736 (56.4%) | 568 (43.6%) |
Education in Stormstown
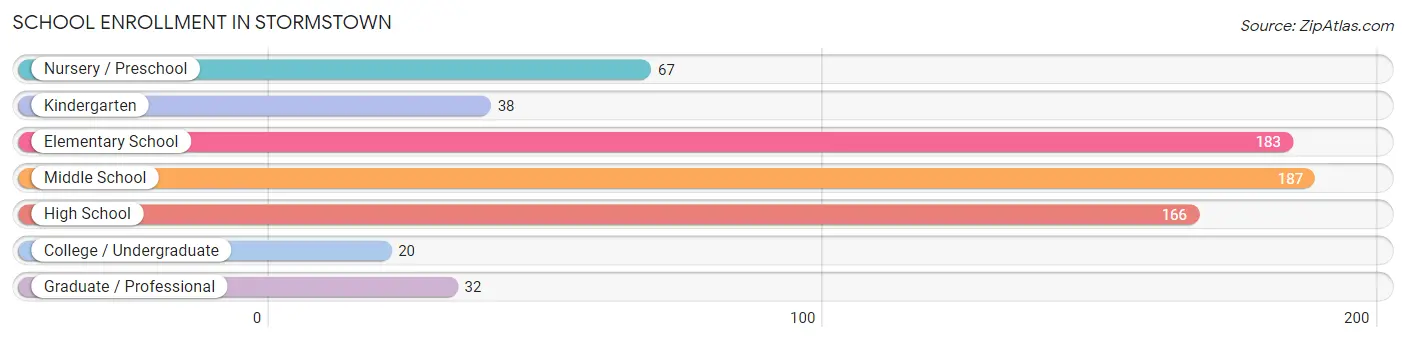
School Enrollment in Stormstown
The most common levels of schooling among the 693 students in Stormstown are middle school (187 | 27.0%), elementary school (183 | 26.4%), and high school (166 | 23.9%).
| School Level | # Students | % Students |
| Nursery / Preschool | 67 | 9.7% |
| Kindergarten | 38 | 5.5% |
| Elementary School | 183 | 26.4% |
| Middle School | 187 | 27.0% |
| High School | 166 | 23.9% |
| College / Undergraduate | 20 | 2.9% |
| Graduate / Professional | 32 | 4.6% |
| Total | 693 | 100.0% |
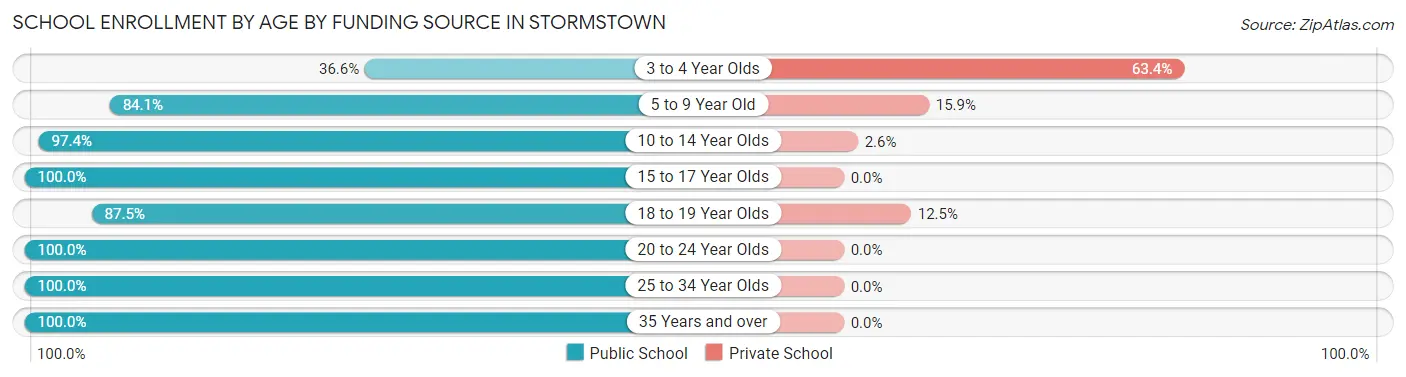
School Enrollment by Age by Funding Source in Stormstown
Out of a total of 693 students who are enrolled in schools in Stormstown, 69 (10.0%) attend a private institution, while the remaining 624 (90.0%) are enrolled in public schools. The age group of 3 to 4 year olds has the highest likelihood of being enrolled in private schools, with 26 (63.4% in the age bracket) enrolled. Conversely, the age group of 15 to 17 year olds has the lowest likelihood of being enrolled in a private school, with 136 (100.0% in the age bracket) attending a public institution.
| Age Bracket | Public School | Private School |
| 3 to 4 Year Olds | 15 (36.6%) | 26 (63.4%) |
| 5 to 9 Year Old | 191 (84.1%) | 36 (15.9%) |
| 10 to 14 Year Olds | 223 (97.4%) | 6 (2.6%) |
| 15 to 17 Year Olds | 136 (100.0%) | 0 (0.0%) |
| 18 to 19 Year Olds | 7 (87.5%) | 1 (12.5%) |
| 20 to 24 Year Olds | 14 (100.0%) | 0 (0.0%) |
| 25 to 34 Year Olds | 22 (100.0%) | 0 (0.0%) |
| 35 Years and over | 16 (100.0%) | 0 (0.0%) |
| Total | 624 (90.0%) | 69 (10.0%) |
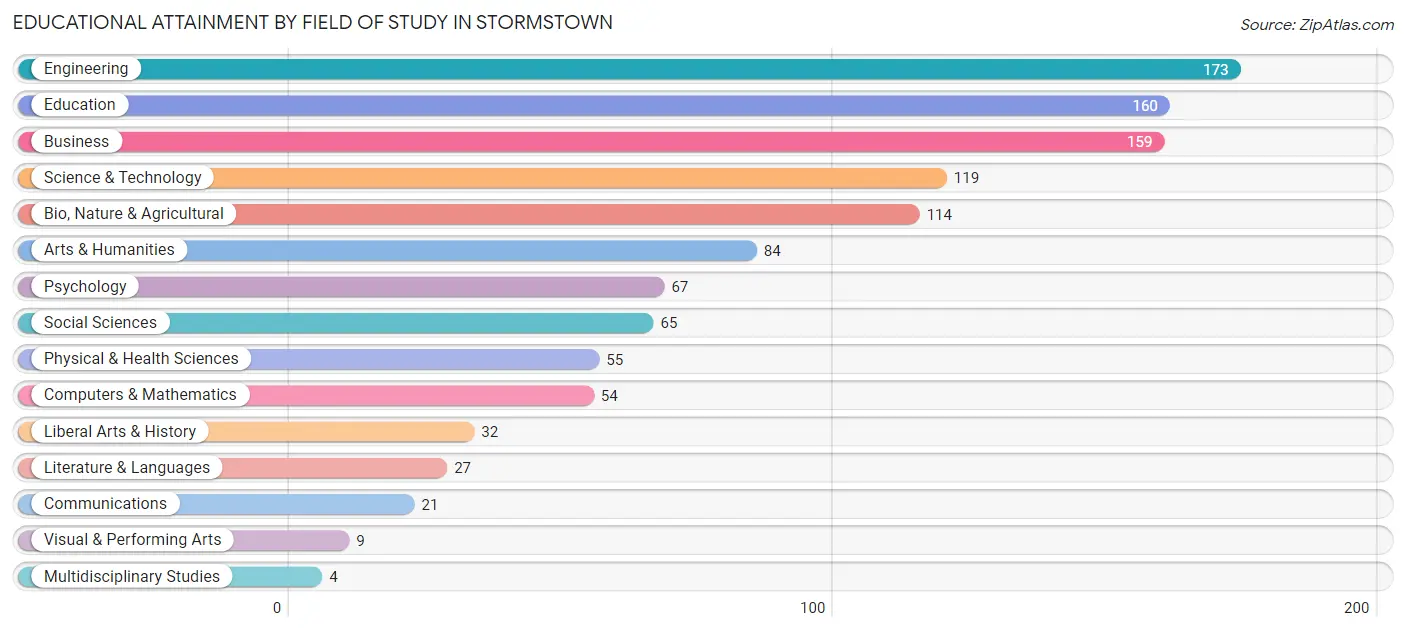
Educational Attainment by Field of Study in Stormstown
Engineering (173 | 15.1%), education (160 | 14.0%), business (159 | 13.9%), science & technology (119 | 10.4%), and bio, nature & agricultural (114 | 10.0%) are the most common fields of study among 1,143 individuals in Stormstown who have obtained a bachelor's degree or higher.
| Field of Study | # Graduates | % Graduates |
| Computers & Mathematics | 54 | 4.7% |
| Bio, Nature & Agricultural | 114 | 10.0% |
| Physical & Health Sciences | 55 | 4.8% |
| Psychology | 67 | 5.9% |
| Social Sciences | 65 | 5.7% |
| Engineering | 173 | 15.1% |
| Multidisciplinary Studies | 4 | 0.4% |
| Science & Technology | 119 | 10.4% |
| Business | 159 | 13.9% |
| Education | 160 | 14.0% |
| Literature & Languages | 27 | 2.4% |
| Liberal Arts & History | 32 | 2.8% |
| Visual & Performing Arts | 9 | 0.8% |
| Communications | 21 | 1.8% |
| Arts & Humanities | 84 | 7.3% |
| Total | 1,143 | 100.0% |
Transportation & Commute in Stormstown
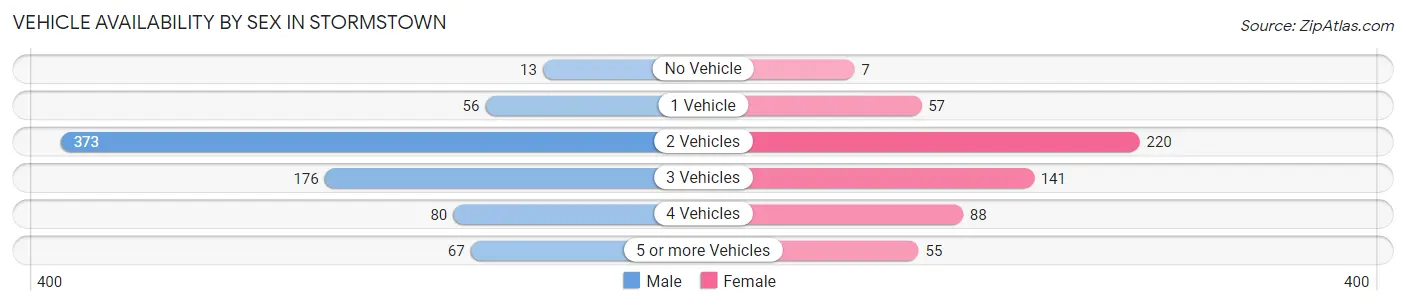
Vehicle Availability by Sex in Stormstown
The most prevalent vehicle ownership categories in Stormstown are males with 2 vehicles (373, accounting for 48.8%) and females with 2 vehicles (220, making up 65.7%).
| Vehicles Available | Male | Female |
| No Vehicle | 13 (1.7%) | 7 (1.2%) |
| 1 Vehicle | 56 (7.3%) | 57 (10.0%) |
| 2 Vehicles | 373 (48.8%) | 220 (38.7%) |
| 3 Vehicles | 176 (23.0%) | 141 (24.8%) |
| 4 Vehicles | 80 (10.5%) | 88 (15.5%) |
| 5 or more Vehicles | 67 (8.8%) | 55 (9.7%) |
| Total | 765 (100.0%) | 568 (100.0%) |
Commute Time in Stormstown
The most frequently occuring commute durations in Stormstown are 20 to 24 minutes (293 commuters, 28.0%), 15 to 19 minutes (216 commuters, 20.6%), and 30 to 34 minutes (138 commuters, 13.2%).
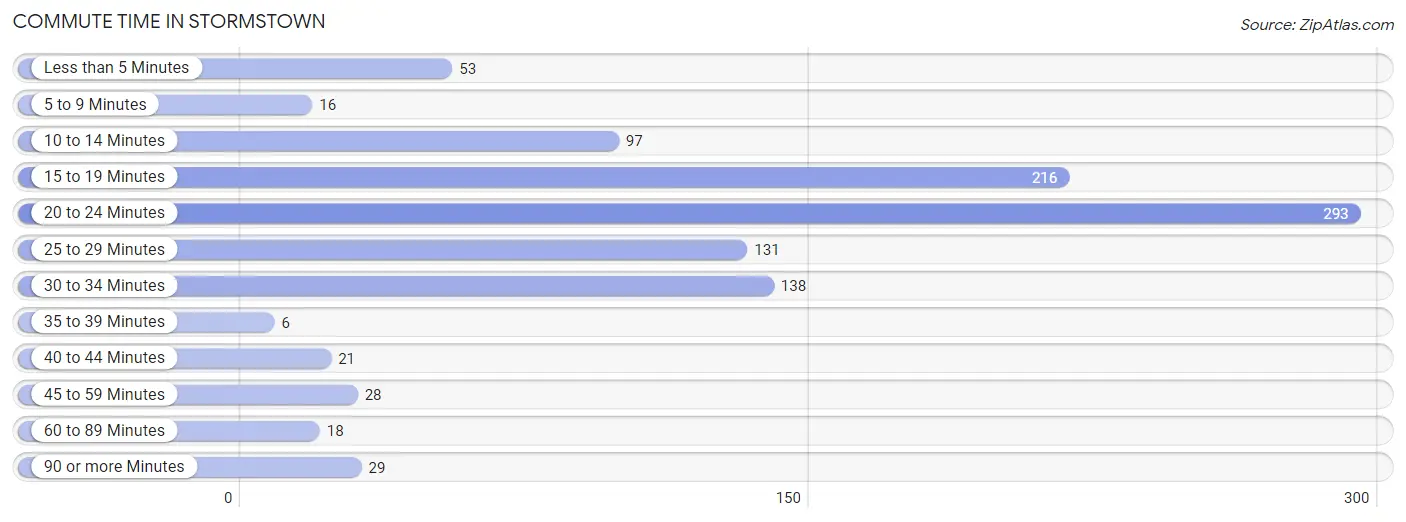
| Commute Time | # Commuters | % Commuters |
| Less than 5 Minutes | 53 | 5.1% |
| 5 to 9 Minutes | 16 | 1.5% |
| 10 to 14 Minutes | 97 | 9.3% |
| 15 to 19 Minutes | 216 | 20.6% |
| 20 to 24 Minutes | 293 | 28.0% |
| 25 to 29 Minutes | 131 | 12.5% |
| 30 to 34 Minutes | 138 | 13.2% |
| 35 to 39 Minutes | 6 | 0.6% |
| 40 to 44 Minutes | 21 | 2.0% |
| 45 to 59 Minutes | 28 | 2.7% |
| 60 to 89 Minutes | 18 | 1.7% |
| 90 or more Minutes | 29 | 2.8% |
Commute Time by Sex in Stormstown
The most common commute times in Stormstown are 20 to 24 minutes (156 commuters, 25.0%) for males and 20 to 24 minutes (137 commuters, 32.5%) for females.
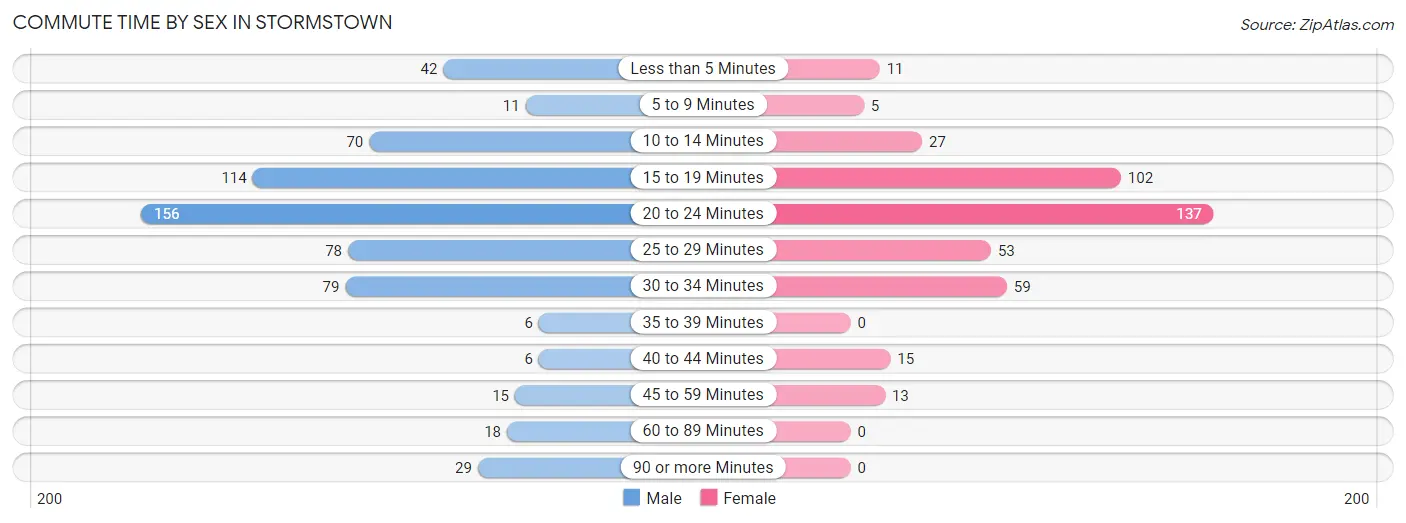
| Commute Time | Male | Female |
| Less than 5 Minutes | 42 (6.7%) | 11 (2.6%) |
| 5 to 9 Minutes | 11 (1.8%) | 5 (1.2%) |
| 10 to 14 Minutes | 70 (11.2%) | 27 (6.4%) |
| 15 to 19 Minutes | 114 (18.3%) | 102 (24.2%) |
| 20 to 24 Minutes | 156 (25.0%) | 137 (32.5%) |
| 25 to 29 Minutes | 78 (12.5%) | 53 (12.6%) |
| 30 to 34 Minutes | 79 (12.7%) | 59 (14.0%) |
| 35 to 39 Minutes | 6 (1.0%) | 0 (0.0%) |
| 40 to 44 Minutes | 6 (1.0%) | 15 (3.5%) |
| 45 to 59 Minutes | 15 (2.4%) | 13 (3.1%) |
| 60 to 89 Minutes | 18 (2.9%) | 0 (0.0%) |
| 90 or more Minutes | 29 (4.6%) | 0 (0.0%) |
Time of Departure to Work by Sex in Stormstown
The most frequent times of departure to work in Stormstown are 7:30 AM to 7:59 AM (117, 18.8%) for males and 7:30 AM to 7:59 AM (95, 22.5%) for females.
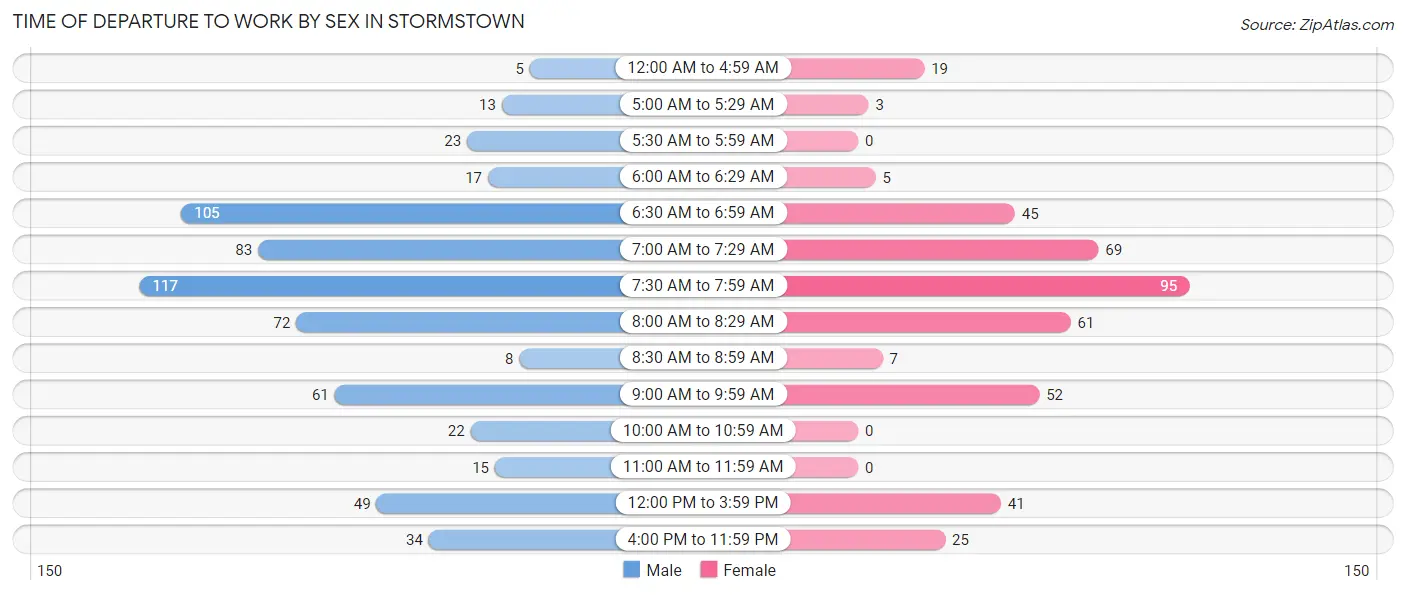
| Time of Departure | Male | Female |
| 12:00 AM to 4:59 AM | 5 (0.8%) | 19 (4.5%) |
| 5:00 AM to 5:29 AM | 13 (2.1%) | 3 (0.7%) |
| 5:30 AM to 5:59 AM | 23 (3.7%) | 0 (0.0%) |
| 6:00 AM to 6:29 AM | 17 (2.7%) | 5 (1.2%) |
| 6:30 AM to 6:59 AM | 105 (16.8%) | 45 (10.7%) |
| 7:00 AM to 7:29 AM | 83 (13.3%) | 69 (16.4%) |
| 7:30 AM to 7:59 AM | 117 (18.8%) | 95 (22.5%) |
| 8:00 AM to 8:29 AM | 72 (11.5%) | 61 (14.4%) |
| 8:30 AM to 8:59 AM | 8 (1.3%) | 7 (1.7%) |
| 9:00 AM to 9:59 AM | 61 (9.8%) | 52 (12.3%) |
| 10:00 AM to 10:59 AM | 22 (3.5%) | 0 (0.0%) |
| 11:00 AM to 11:59 AM | 15 (2.4%) | 0 (0.0%) |
| 12:00 PM to 3:59 PM | 49 (7.9%) | 41 (9.7%) |
| 4:00 PM to 11:59 PM | 34 (5.4%) | 25 (5.9%) |
| Total | 624 (100.0%) | 422 (100.0%) |
Housing Occupancy in Stormstown
Occupancy by Ownership in Stormstown
Of the total 834 dwellings in Stormstown, owner-occupied units account for 757 (90.8%), while renter-occupied units make up 77 (9.2%).
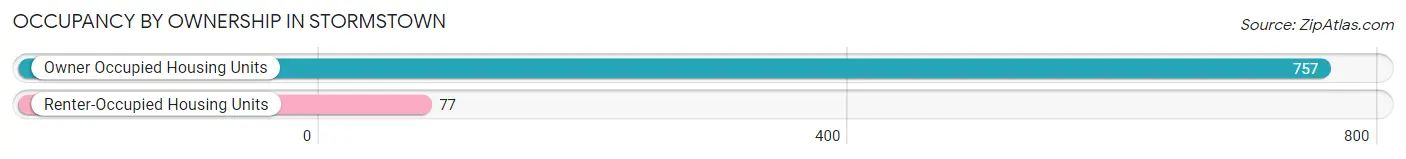
| Occupancy | # Housing Units | % Housing Units |
| Owner Occupied Housing Units | 757 | 90.8% |
| Renter-Occupied Housing Units | 77 | 9.2% |
| Total Occupied Housing Units | 834 | 100.0% |
Occupancy by Household Size in Stormstown
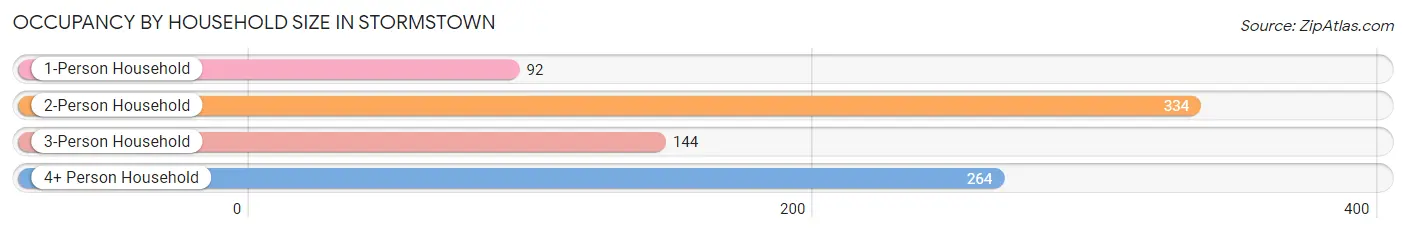
| Household Size | # Housing Units | % Housing Units |
| 1-Person Household | 92 | 11.0% |
| 2-Person Household | 334 | 40.1% |
| 3-Person Household | 144 | 17.3% |
| 4+ Person Household | 264 | 31.7% |
| Total Housing Units | 834 | 100.0% |
Occupancy by Ownership by Household Size in Stormstown
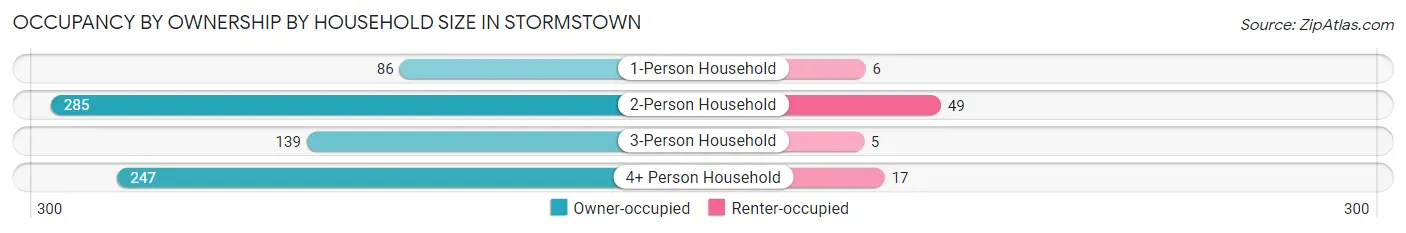
| Household Size | Owner-occupied | Renter-occupied |
| 1-Person Household | 86 (93.5%) | 6 (6.5%) |
| 2-Person Household | 285 (85.3%) | 49 (14.7%) |
| 3-Person Household | 139 (96.5%) | 5 (3.5%) |
| 4+ Person Household | 247 (93.6%) | 17 (6.4%) |
| Total Housing Units | 757 (90.8%) | 77 (9.2%) |
Occupancy by Educational Attainment in Stormstown
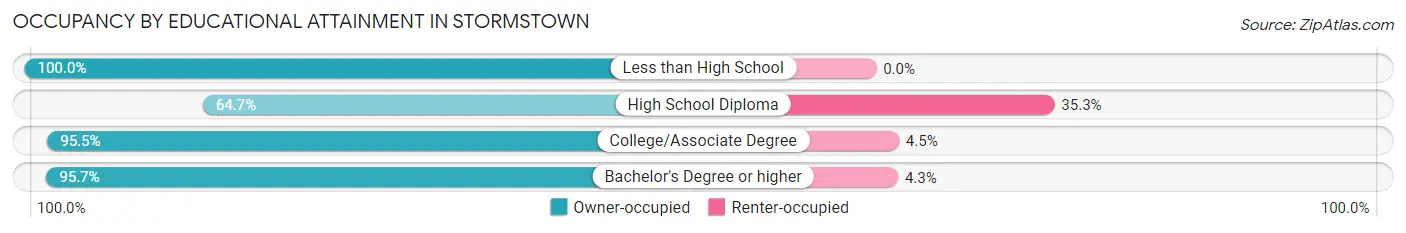
| Household Size | Owner-occupied | Renter-occupied |
| Less than High School | 13 (100.0%) | 0 (0.0%) |
| High School Diploma | 86 (64.7%) | 47 (35.3%) |
| College/Associate Degree | 127 (95.5%) | 6 (4.5%) |
| Bachelor's Degree or higher | 531 (95.7%) | 24 (4.3%) |
Occupancy by Age of Householder in Stormstown
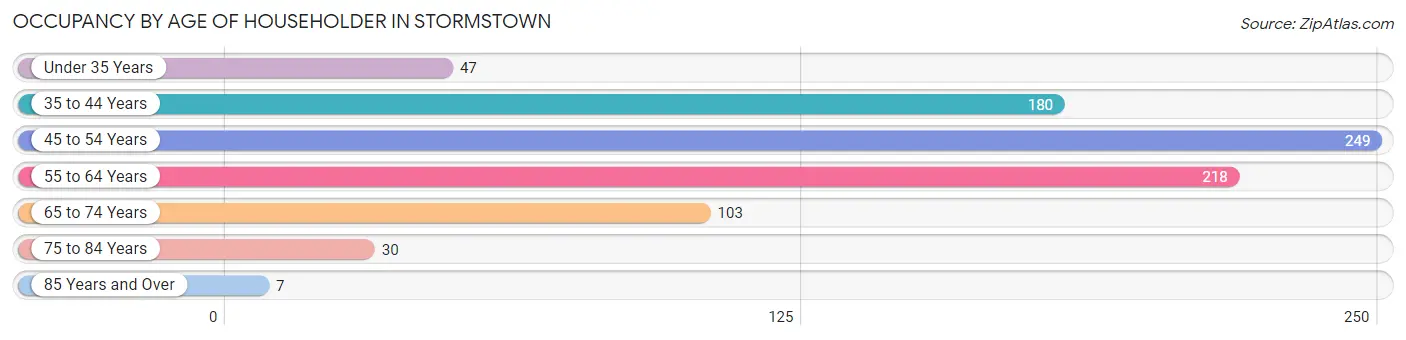
| Age Bracket | # Households | % Households |
| Under 35 Years | 47 | 5.6% |
| 35 to 44 Years | 180 | 21.6% |
| 45 to 54 Years | 249 | 29.9% |
| 55 to 64 Years | 218 | 26.1% |
| 65 to 74 Years | 103 | 12.3% |
| 75 to 84 Years | 30 | 3.6% |
| 85 Years and Over | 7 | 0.8% |
| Total | 834 | 100.0% |
Housing Finances in Stormstown
Median Income by Occupancy in Stormstown
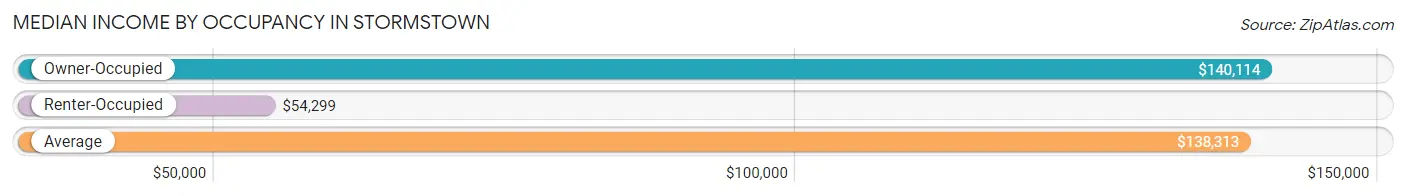
| Occupancy Type | # Households | Median Income |
| Owner-Occupied | 757 (90.8%) | $140,114 |
| Renter-Occupied | 77 (9.2%) | $54,299 |
| Average | 834 (100.0%) | $138,313 |
Occupancy by Householder Income Bracket in Stormstown
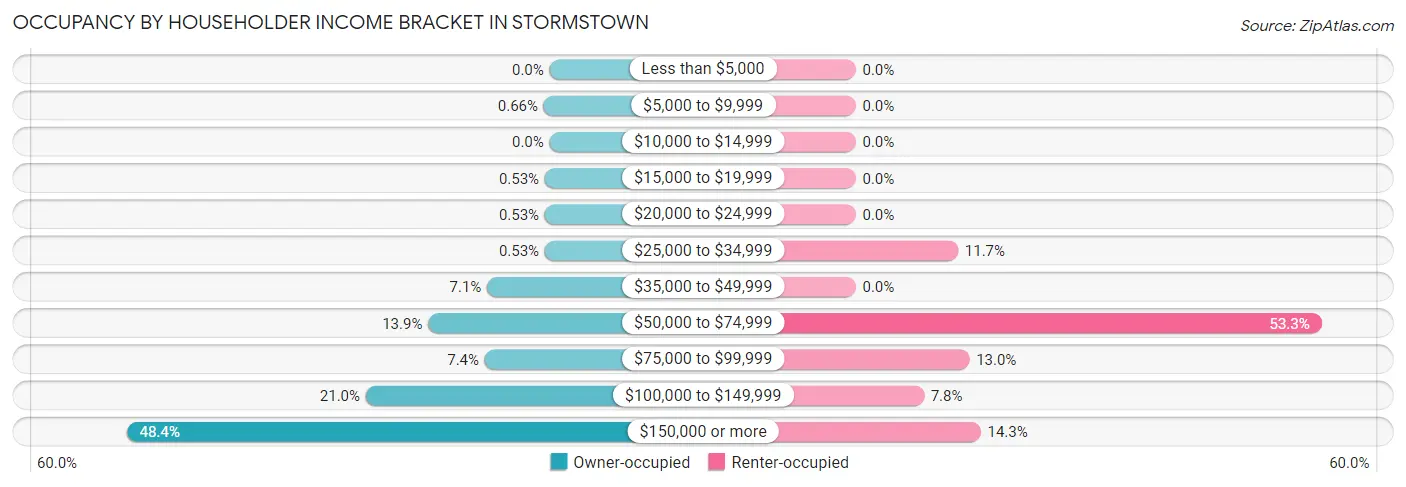
| Income Bracket | Owner-occupied | Renter-occupied |
| Less than $5,000 | 0 (0.0%) | 0 (0.0%) |
| $5,000 to $9,999 | 5 (0.7%) | 0 (0.0%) |
| $10,000 to $14,999 | 0 (0.0%) | 0 (0.0%) |
| $15,000 to $19,999 | 4 (0.5%) | 0 (0.0%) |
| $20,000 to $24,999 | 4 (0.5%) | 0 (0.0%) |
| $25,000 to $34,999 | 4 (0.5%) | 9 (11.7%) |
| $35,000 to $49,999 | 54 (7.1%) | 0 (0.0%) |
| $50,000 to $74,999 | 105 (13.9%) | 41 (53.2%) |
| $75,000 to $99,999 | 56 (7.4%) | 10 (13.0%) |
| $100,000 to $149,999 | 159 (21.0%) | 6 (7.8%) |
| $150,000 or more | 366 (48.3%) | 11 (14.3%) |
| Total | 757 (100.0%) | 77 (100.0%) |
Monthly Housing Cost Tiers in Stormstown
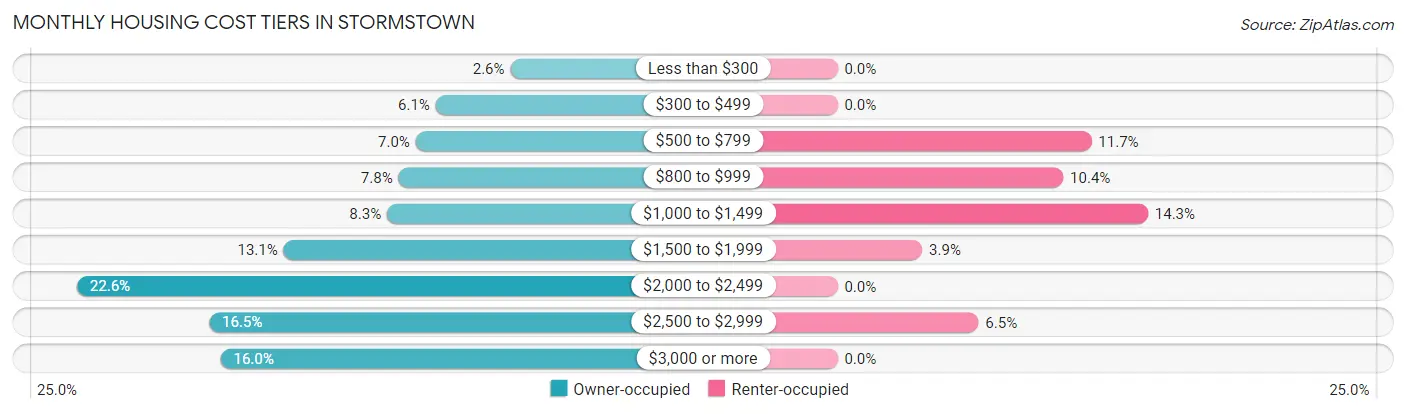
| Monthly Cost | Owner-occupied | Renter-occupied |
| Less than $300 | 20 (2.6%) | 0 (0.0%) |
| $300 to $499 | 46 (6.1%) | 0 (0.0%) |
| $500 to $799 | 53 (7.0%) | 9 (11.7%) |
| $800 to $999 | 59 (7.8%) | 8 (10.4%) |
| $1,000 to $1,499 | 63 (8.3%) | 11 (14.3%) |
| $1,500 to $1,999 | 99 (13.1%) | 3 (3.9%) |
| $2,000 to $2,499 | 171 (22.6%) | 0 (0.0%) |
| $2,500 to $2,999 | 125 (16.5%) | 5 (6.5%) |
| $3,000 or more | 121 (16.0%) | 0 (0.0%) |
| Total | 757 (100.0%) | 77 (100.0%) |
Physical Housing Characteristics in Stormstown
Housing Structures in Stormstown
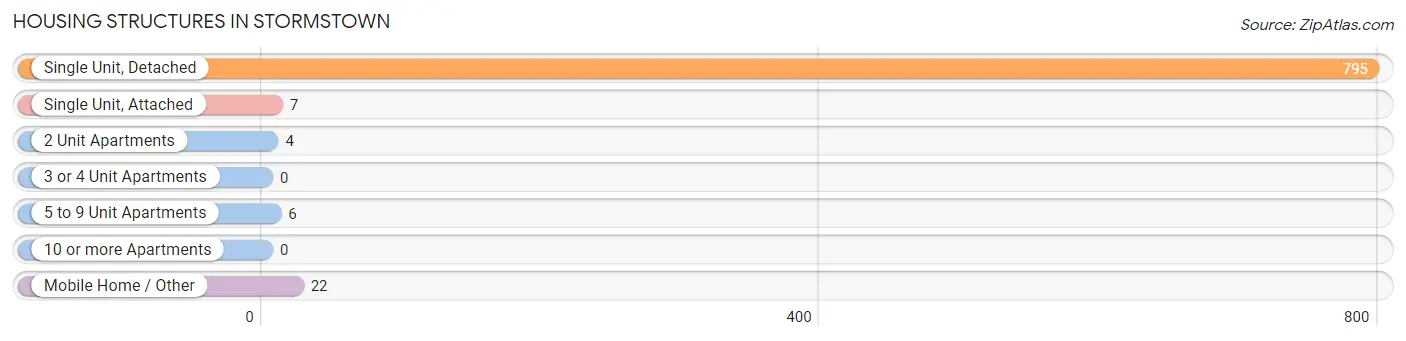
| Structure Type | # Housing Units | % Housing Units |
| Single Unit, Detached | 795 | 95.3% |
| Single Unit, Attached | 7 | 0.8% |
| 2 Unit Apartments | 4 | 0.5% |
| 3 or 4 Unit Apartments | 0 | 0.0% |
| 5 to 9 Unit Apartments | 6 | 0.7% |
| 10 or more Apartments | 0 | 0.0% |
| Mobile Home / Other | 22 | 2.6% |
| Total | 834 | 100.0% |
Housing Structures by Occupancy in Stormstown
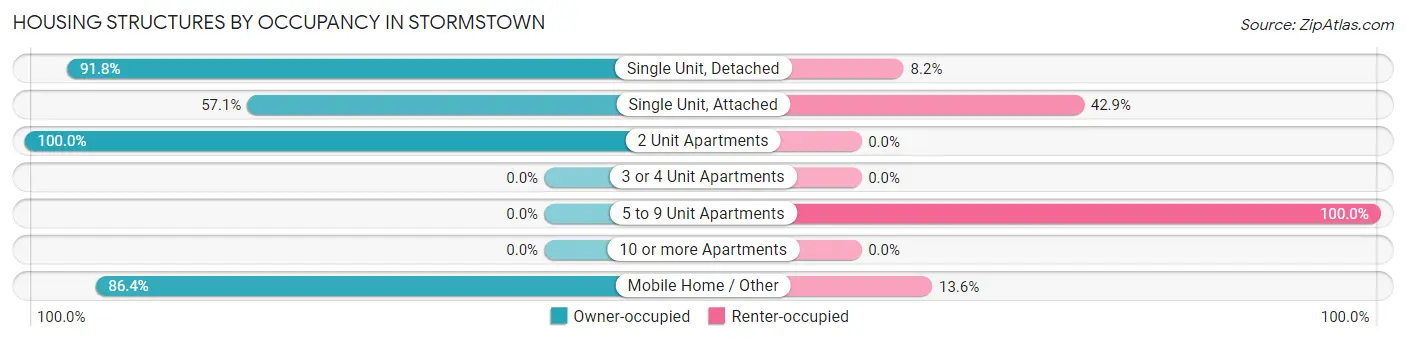
| Structure Type | Owner-occupied | Renter-occupied |
| Single Unit, Detached | 730 (91.8%) | 65 (8.2%) |
| Single Unit, Attached | 4 (57.1%) | 3 (42.9%) |
| 2 Unit Apartments | 4 (100.0%) | 0 (0.0%) |
| 3 or 4 Unit Apartments | 0 (0.0%) | 0 (0.0%) |
| 5 to 9 Unit Apartments | 0 (0.0%) | 6 (100.0%) |
| 10 or more Apartments | 0 (0.0%) | 0 (0.0%) |
| Mobile Home / Other | 19 (86.4%) | 3 (13.6%) |
| Total | 757 (90.8%) | 77 (9.2%) |
Housing Structures by Number of Rooms in Stormstown
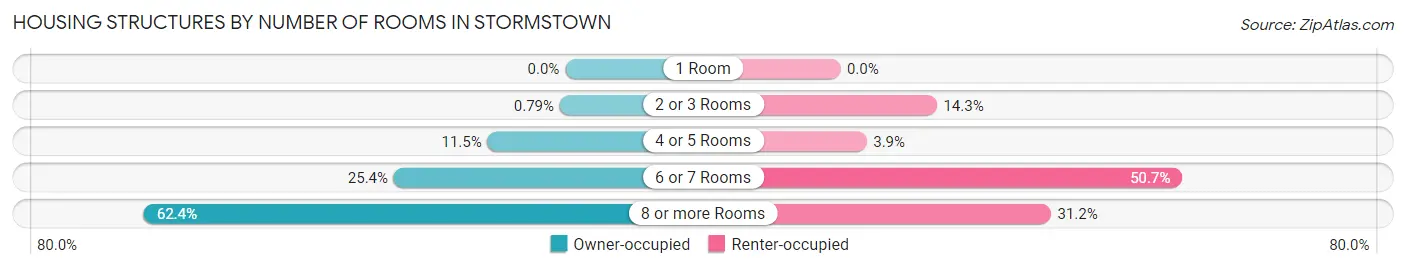
| Number of Rooms | Owner-occupied | Renter-occupied |
| 1 Room | 0 (0.0%) | 0 (0.0%) |
| 2 or 3 Rooms | 6 (0.8%) | 11 (14.3%) |
| 4 or 5 Rooms | 87 (11.5%) | 3 (3.9%) |
| 6 or 7 Rooms | 192 (25.4%) | 39 (50.6%) |
| 8 or more Rooms | 472 (62.4%) | 24 (31.2%) |
| Total | 757 (100.0%) | 77 (100.0%) |
Housing Structure by Heating Type in Stormstown
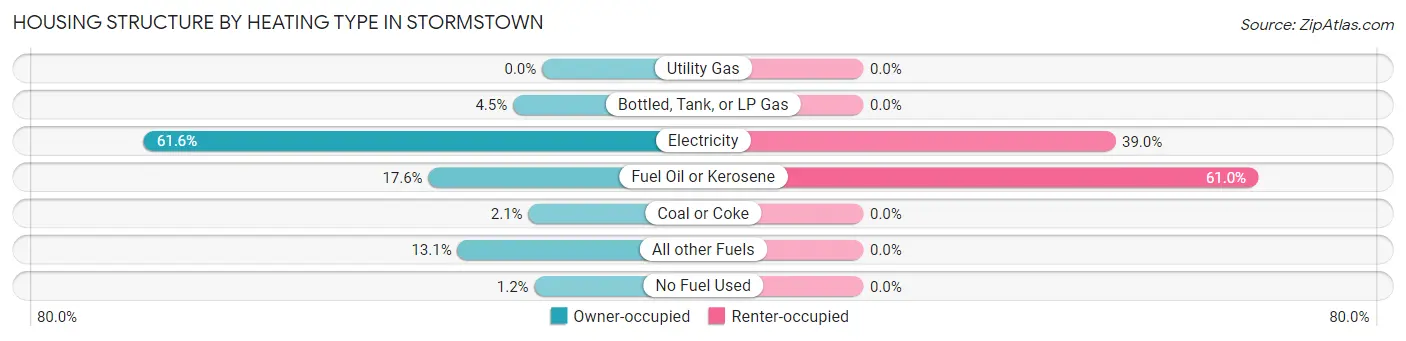
| Heating Type | Owner-occupied | Renter-occupied |
| Utility Gas | 0 (0.0%) | 0 (0.0%) |
| Bottled, Tank, or LP Gas | 34 (4.5%) | 0 (0.0%) |
| Electricity | 466 (61.6%) | 30 (39.0%) |
| Fuel Oil or Kerosene | 133 (17.6%) | 47 (61.0%) |
| Coal or Coke | 16 (2.1%) | 0 (0.0%) |
| All other Fuels | 99 (13.1%) | 0 (0.0%) |
| No Fuel Used | 9 (1.2%) | 0 (0.0%) |
| Total | 757 (100.0%) | 77 (100.0%) |
Household Vehicle Usage in Stormstown
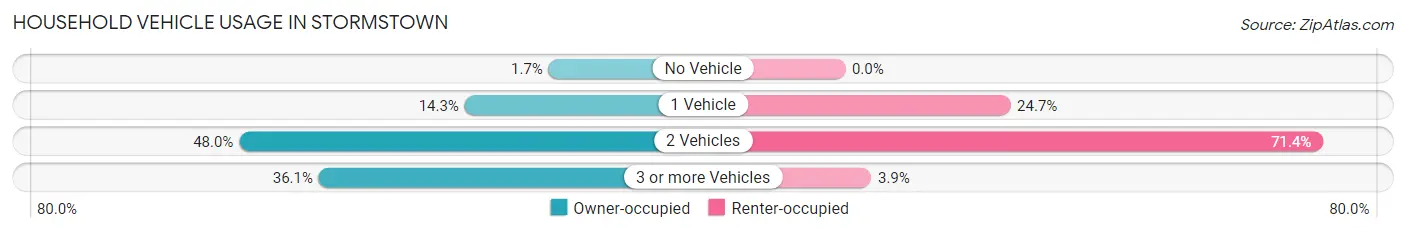
| Vehicles per Household | Owner-occupied | Renter-occupied |
| No Vehicle | 13 (1.7%) | 0 (0.0%) |
| 1 Vehicle | 108 (14.3%) | 19 (24.7%) |
| 2 Vehicles | 363 (47.9%) | 55 (71.4%) |
| 3 or more Vehicles | 273 (36.1%) | 3 (3.9%) |
| Total | 757 (100.0%) | 77 (100.0%) |
Real Estate & Mortgages in Stormstown
Real Estate and Mortgage Overview in Stormstown
| Characteristic | Without Mortgage | With Mortgage |
| Housing Units | 178 | 579 |
| Median Property Value | $355,000 | $394,500 |
| Median Household Income | $88,438 | $312 |
| Monthly Housing Costs | $707 | $121 |
| Real Estate Taxes | $4,000 | $4 |
Property Value by Mortgage Status in Stormstown
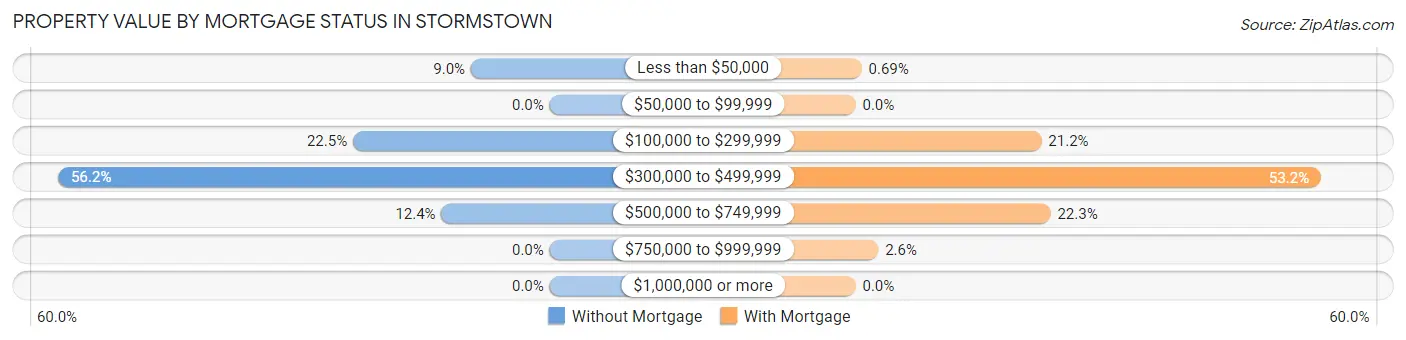
| Property Value | Without Mortgage | With Mortgage |
| Less than $50,000 | 16 (9.0%) | 4 (0.7%) |
| $50,000 to $99,999 | 0 (0.0%) | 0 (0.0%) |
| $100,000 to $299,999 | 40 (22.5%) | 123 (21.2%) |
| $300,000 to $499,999 | 100 (56.2%) | 308 (53.2%) |
| $500,000 to $749,999 | 22 (12.4%) | 129 (22.3%) |
| $750,000 to $999,999 | 0 (0.0%) | 15 (2.6%) |
| $1,000,000 or more | 0 (0.0%) | 0 (0.0%) |
| Total | 178 (100.0%) | 579 (100.0%) |
Household Income by Mortgage Status in Stormstown
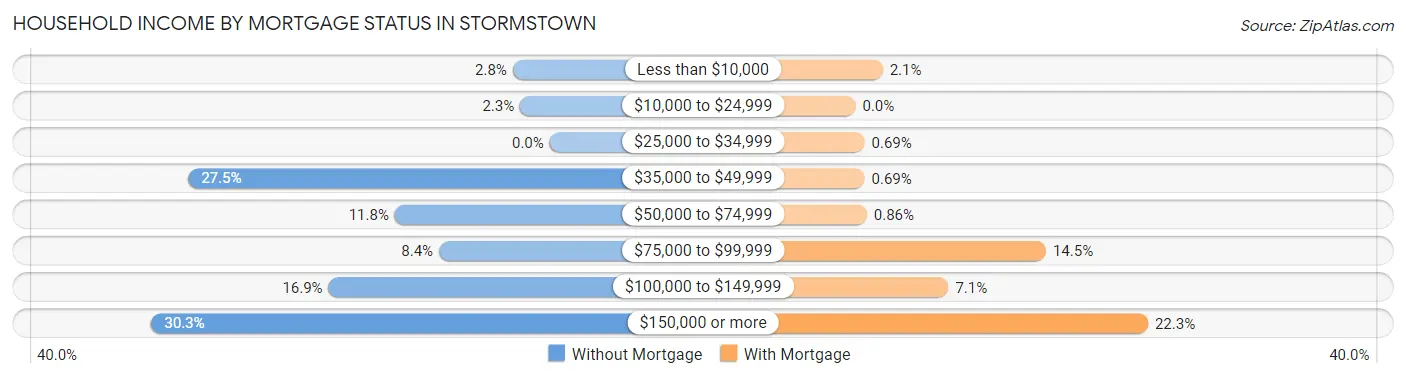
| Household Income | Without Mortgage | With Mortgage |
| Less than $10,000 | 5 (2.8%) | 12 (2.1%) |
| $10,000 to $24,999 | 4 (2.2%) | 0 (0.0%) |
| $25,000 to $34,999 | 0 (0.0%) | 4 (0.7%) |
| $35,000 to $49,999 | 49 (27.5%) | 4 (0.7%) |
| $50,000 to $74,999 | 21 (11.8%) | 5 (0.9%) |
| $75,000 to $99,999 | 15 (8.4%) | 84 (14.5%) |
| $100,000 to $149,999 | 30 (16.9%) | 41 (7.1%) |
| $150,000 or more | 54 (30.3%) | 129 (22.3%) |
| Total | 178 (100.0%) | 579 (100.0%) |
Property Value to Household Income Ratio in Stormstown
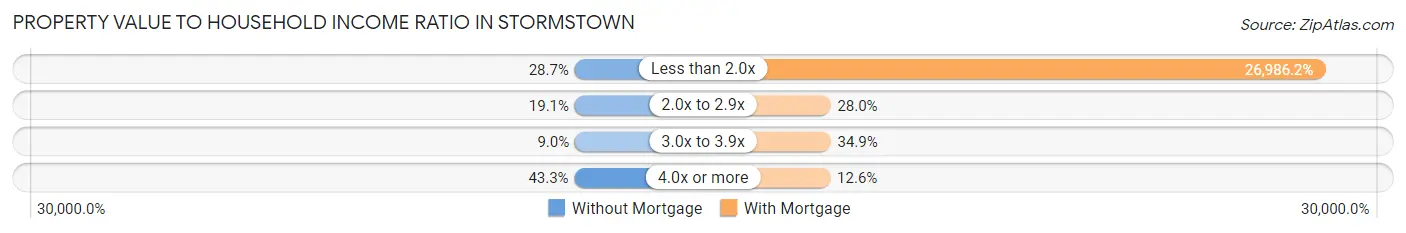
| Value-to-Income Ratio | Without Mortgage | With Mortgage |
| Less than 2.0x | 51 (28.6%) | 156,250 (26,986.2%) |
| 2.0x to 2.9x | 34 (19.1%) | 162 (28.0%) |
| 3.0x to 3.9x | 16 (9.0%) | 202 (34.9%) |
| 4.0x or more | 77 (43.3%) | 73 (12.6%) |
| Total | 178 (100.0%) | 579 (100.0%) |
Real Estate Taxes by Mortgage Status in Stormstown
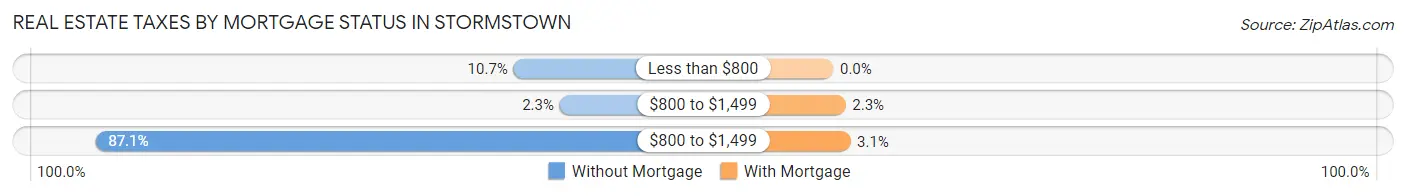
| Property Taxes | Without Mortgage | With Mortgage |
| Less than $800 | 19 (10.7%) | 0 (0.0%) |
| $800 to $1,499 | 4 (2.2%) | 13 (2.2%) |
| $800 to $1,499 | 155 (87.1%) | 18 (3.1%) |
| Total | 178 (100.0%) | 579 (100.0%) |
Health & Disability in Stormstown
Health Insurance Coverage by Age in Stormstown
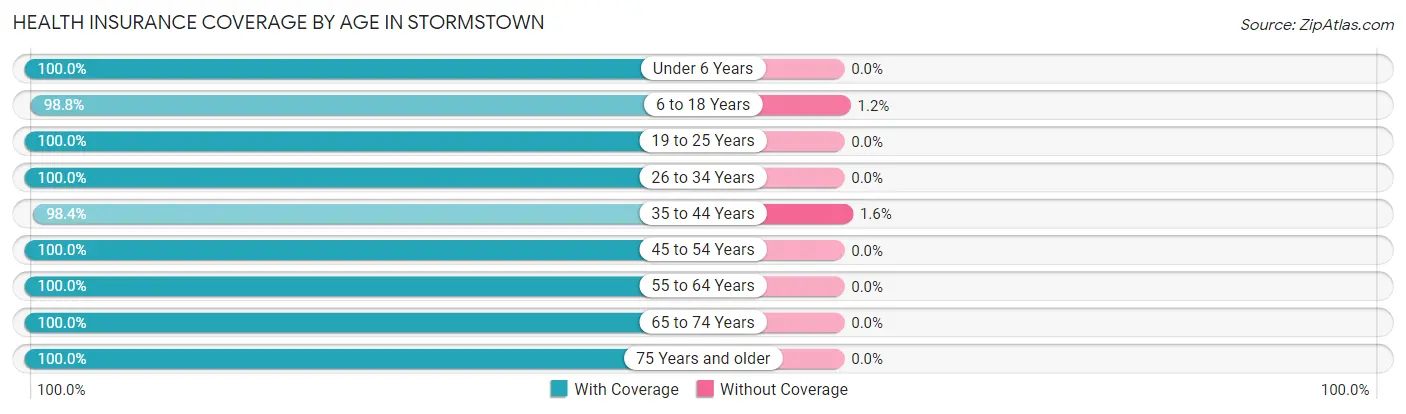
| Age Bracket | With Coverage | Without Coverage |
| Under 6 Years | 139 (100.0%) | 0 (0.0%) |
| 6 to 18 Years | 590 (98.8%) | 7 (1.2%) |
| 19 to 25 Years | 101 (100.0%) | 0 (0.0%) |
| 26 to 34 Years | 137 (100.0%) | 0 (0.0%) |
| 35 to 44 Years | 367 (98.4%) | 6 (1.6%) |
| 45 to 54 Years | 460 (100.0%) | 0 (0.0%) |
| 55 to 64 Years | 361 (100.0%) | 0 (0.0%) |
| 65 to 74 Years | 207 (100.0%) | 0 (0.0%) |
| 75 Years and older | 60 (100.0%) | 0 (0.0%) |
| Total | 2,422 (99.5%) | 13 (0.5%) |
Health Insurance Coverage by Citizenship Status in Stormstown
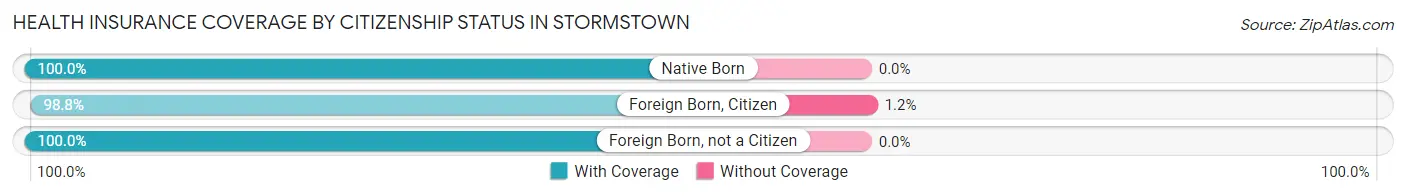
| Citizenship Status | With Coverage | Without Coverage |
| Native Born | 139 (100.0%) | 0 (0.0%) |
| Foreign Born, Citizen | 590 (98.8%) | 7 (1.2%) |
| Foreign Born, not a Citizen | 101 (100.0%) | 0 (0.0%) |
Health Insurance Coverage by Household Income in Stormstown
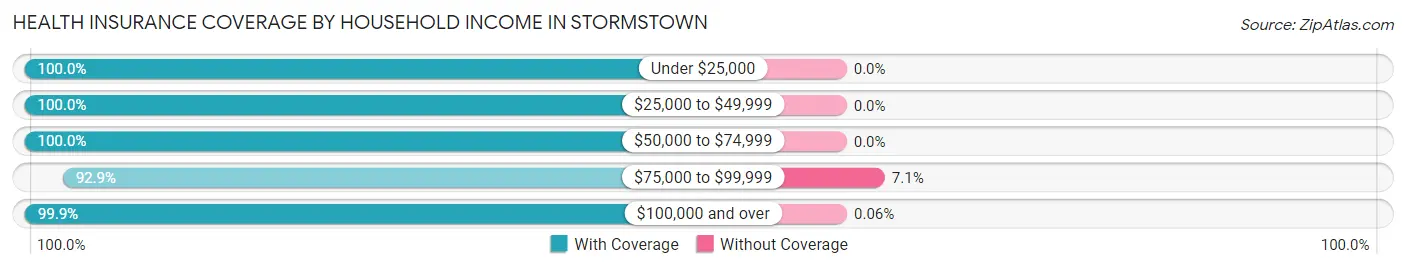
| Household Income | With Coverage | Without Coverage |
| Under $25,000 | 26 (100.0%) | 0 (0.0%) |
| $25,000 to $49,999 | 115 (100.0%) | 0 (0.0%) |
| $50,000 to $74,999 | 337 (100.0%) | 0 (0.0%) |
| $75,000 to $99,999 | 156 (92.9%) | 12 (7.1%) |
| $100,000 and over | 1,788 (99.9%) | 1 (0.1%) |
Public vs Private Health Insurance Coverage by Age in Stormstown
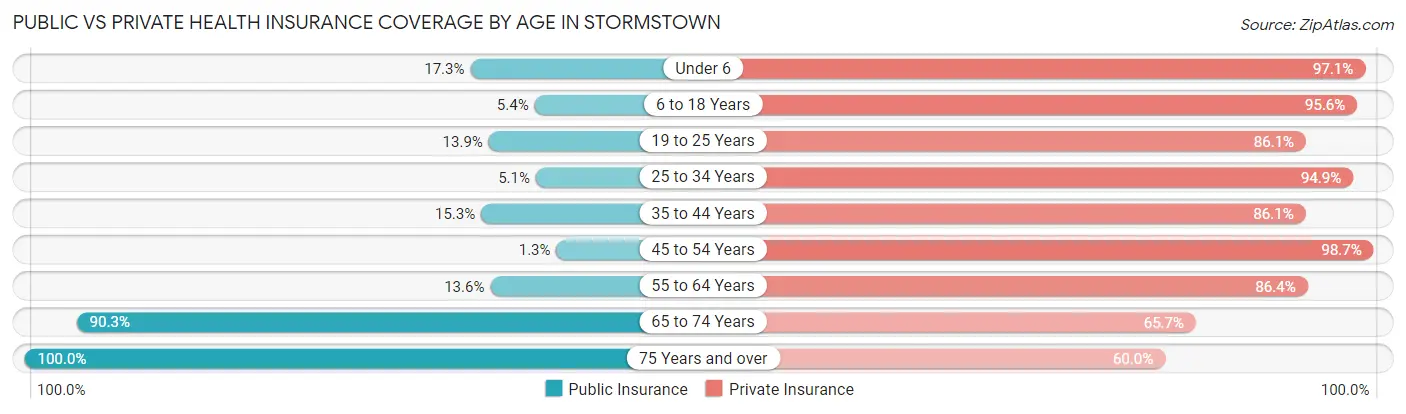
| Age Bracket | Public Insurance | Private Insurance |
| Under 6 | 24 (17.3%) | 135 (97.1%) |
| 6 to 18 Years | 32 (5.4%) | 571 (95.6%) |
| 19 to 25 Years | 14 (13.9%) | 87 (86.1%) |
| 25 to 34 Years | 7 (5.1%) | 130 (94.9%) |
| 35 to 44 Years | 57 (15.3%) | 321 (86.1%) |
| 45 to 54 Years | 6 (1.3%) | 454 (98.7%) |
| 55 to 64 Years | 49 (13.6%) | 312 (86.4%) |
| 65 to 74 Years | 187 (90.3%) | 136 (65.7%) |
| 75 Years and over | 60 (100.0%) | 36 (60.0%) |
| Total | 436 (17.9%) | 2,182 (89.6%) |
Disability Status by Sex by Age in Stormstown
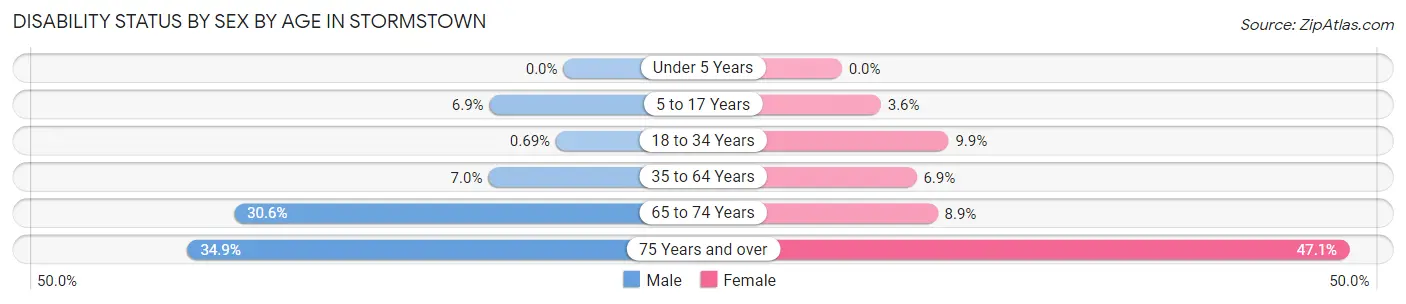
| Age Bracket | Male | Female |
| Under 5 Years | 0 (0.0%) | 0 (0.0%) |
| 5 to 17 Years | 24 (6.9%) | 10 (3.6%) |
| 18 to 34 Years | 1 (0.7%) | 10 (9.9%) |
| 35 to 64 Years | 44 (7.0%) | 39 (6.9%) |
| 65 to 74 Years | 22 (30.6%) | 12 (8.9%) |
| 75 Years and over | 15 (34.9%) | 8 (47.1%) |
Disability Class by Sex by Age in Stormstown
Disability Class: Hearing Difficulty
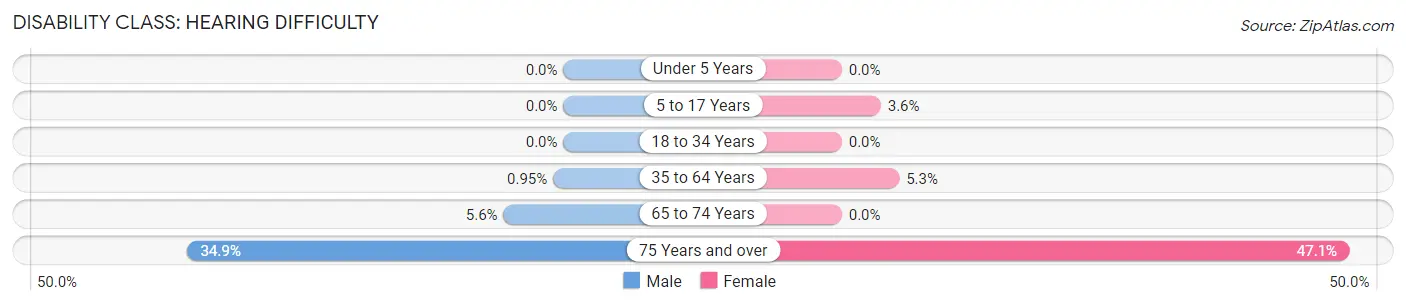
| Age Bracket | Male | Female |
| Under 5 Years | 0 (0.0%) | 0 (0.0%) |
| 5 to 17 Years | 0 (0.0%) | 10 (3.6%) |
| 18 to 34 Years | 0 (0.0%) | 0 (0.0%) |
| 35 to 64 Years | 6 (0.9%) | 30 (5.3%) |
| 65 to 74 Years | 4 (5.6%) | 0 (0.0%) |
| 75 Years and over | 15 (34.9%) | 8 (47.1%) |
Disability Class: Vision Difficulty
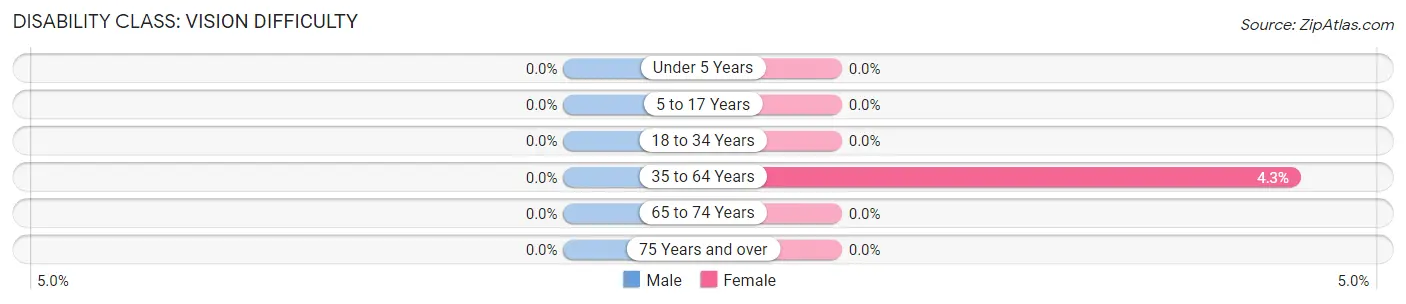
| Age Bracket | Male | Female |
| Under 5 Years | 0 (0.0%) | 0 (0.0%) |
| 5 to 17 Years | 0 (0.0%) | 0 (0.0%) |
| 18 to 34 Years | 0 (0.0%) | 0 (0.0%) |
| 35 to 64 Years | 0 (0.0%) | 24 (4.3%) |
| 65 to 74 Years | 0 (0.0%) | 0 (0.0%) |
| 75 Years and over | 0 (0.0%) | 0 (0.0%) |
Disability Class: Cognitive Difficulty
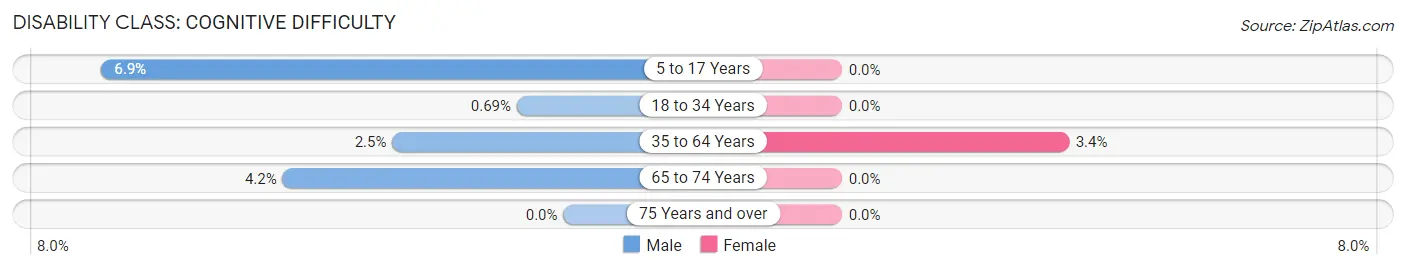
| Age Bracket | Male | Female |
| 5 to 17 Years | 24 (6.9%) | 0 (0.0%) |
| 18 to 34 Years | 1 (0.7%) | 0 (0.0%) |
| 35 to 64 Years | 16 (2.5%) | 19 (3.4%) |
| 65 to 74 Years | 3 (4.2%) | 0 (0.0%) |
| 75 Years and over | 0 (0.0%) | 0 (0.0%) |
Disability Class: Ambulatory Difficulty
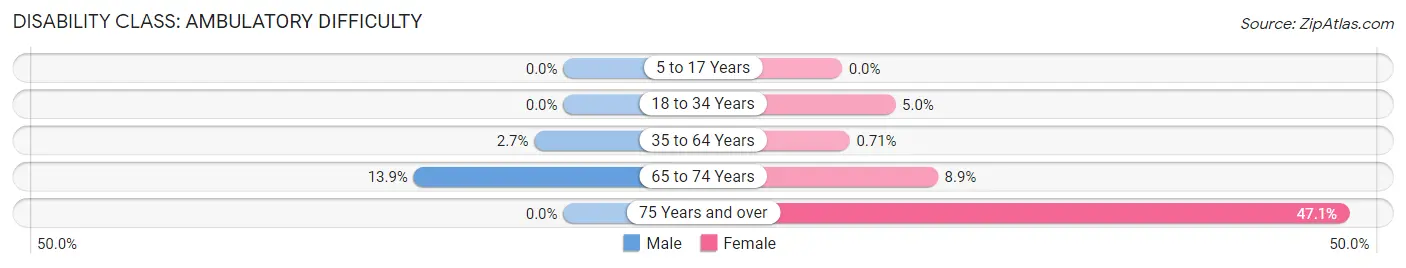
| Age Bracket | Male | Female |
| 5 to 17 Years | 0 (0.0%) | 0 (0.0%) |
| 18 to 34 Years | 0 (0.0%) | 5 (5.0%) |
| 35 to 64 Years | 17 (2.7%) | 4 (0.7%) |
| 65 to 74 Years | 10 (13.9%) | 12 (8.9%) |
| 75 Years and over | 0 (0.0%) | 8 (47.1%) |
Disability Class: Self-Care Difficulty
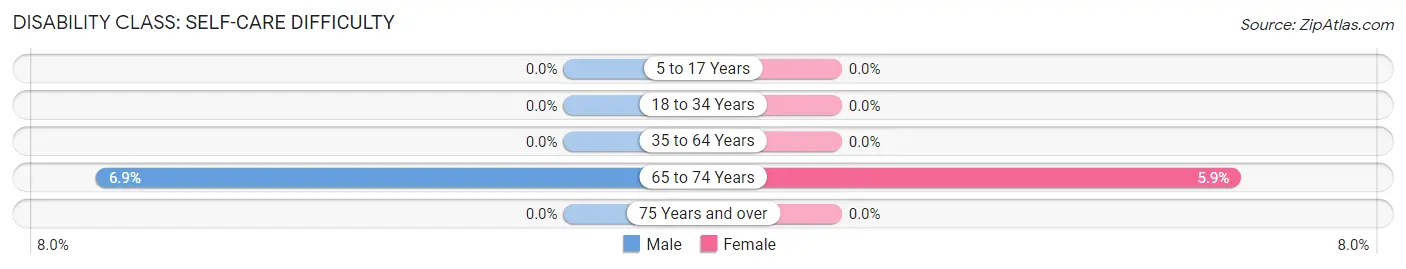
| Age Bracket | Male | Female |
| 5 to 17 Years | 0 (0.0%) | 0 (0.0%) |
| 18 to 34 Years | 0 (0.0%) | 0 (0.0%) |
| 35 to 64 Years | 0 (0.0%) | 0 (0.0%) |
| 65 to 74 Years | 5 (6.9%) | 8 (5.9%) |
| 75 Years and over | 0 (0.0%) | 0 (0.0%) |
Technology Access in Stormstown
Computing Device Access in Stormstown
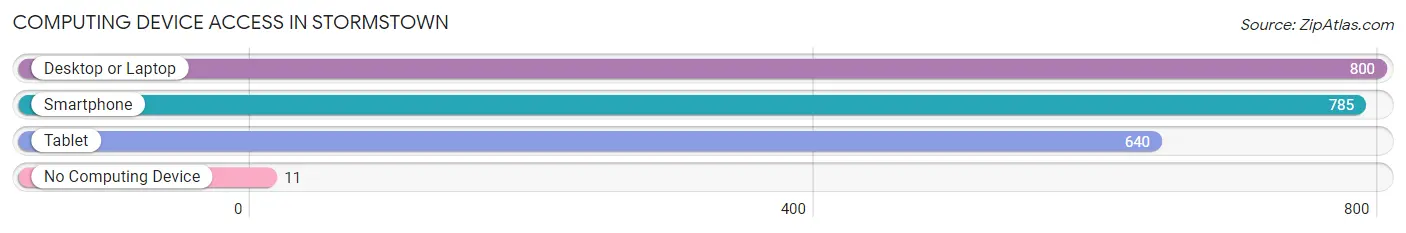
| Device Type | # Households | % Households |
| Desktop or Laptop | 800 | 95.9% |
| Smartphone | 785 | 94.1% |
| Tablet | 640 | 76.7% |
| No Computing Device | 11 | 1.3% |
| Total | 834 | 100.0% |
Internet Access in Stormstown
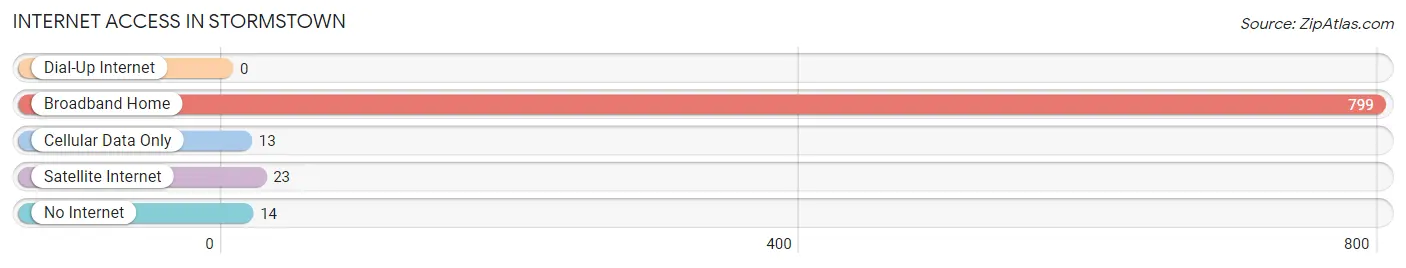
| Internet Type | # Households | % Households |
| Dial-Up Internet | 0 | 0.0% |
| Broadband Home | 799 | 95.8% |
| Cellular Data Only | 13 | 1.6% |
| Satellite Internet | 23 | 2.8% |
| No Internet | 14 | 1.7% |
| Total | 834 | 100.0% |
Stormstown Summary
History
Stormstown is a small borough located in Centre County, Pennsylvania. It is situated in the Nittany Valley, approximately 8 miles east of State College. The area was first settled in the late 1700s by German and Irish immigrants. The town was originally known as “Stormstown” after the Storm family, who were among the first settlers. The town was officially incorporated in 1876.
In the late 1800s, Stormstown was a thriving agricultural community. The town was home to several farms, a grist mill, a saw mill, and a blacksmith shop. The town also had a post office, a general store, and a hotel.
In the early 1900s, Stormstown began to experience a period of growth and development. The town was home to several businesses, including a bank, a newspaper, a furniture store, and a movie theater. The town also had a public library, a fire station, and a police station.
In the mid-1900s, Stormstown experienced a period of decline. Many of the businesses closed, and the population began to decline. In the late 1900s, the town began to experience a period of revitalization. Several new businesses opened, and the population began to increase.
Geography
Stormstown is located in Centre County, Pennsylvania. It is situated in the Nittany Valley, approximately 8 miles east of State College. The town is located in a rural area, surrounded by rolling hills and farmland. The town is located near several small towns, including Boalsburg, Lemont, and Pine Grove Mills.
The climate in Stormstown is humid continental, with cold winters and warm summers. The average annual temperature is around 50 degrees Fahrenheit. The average annual precipitation is around 40 inches.
Economy
The economy of Stormstown is largely based on agriculture. The town is home to several farms, which produce a variety of crops, including corn, soybeans, and hay. The town is also home to several small businesses, including a bank, a newspaper, a furniture store, and a movie theater.
Demographics
As of the 2010 census, the population of Stormstown was 1,845. The racial makeup of the town was 97.3% White, 0.7% African American, 0.3% Native American, 0.3% Asian, and 1.4% from other races. The median household income was $45,938, and the median family income was $54,844. The per capita income was $21,945.
Conclusion
Stormstown is a small borough located in Centre County, Pennsylvania. It is situated in the Nittany Valley, approximately 8 miles east of State College. The town was first settled in the late 1700s by German and Irish immigrants, and was officially incorporated in 1876. The economy of Stormstown is largely based on agriculture, and the town is home to several small businesses. As of the 2010 census, the population of Stormstown was 1,845. The racial makeup of the town was 97.3% White, 0.7% African American, 0.3% Native American, 0.3% Asian, and 1.4% from other races. The median household income was $45,938, and the median family income was $54,844. The per capita income was $21,945.
Common Questions
What is Per Capita Income in Stormstown?
Per Capita income in Stormstown is $54,096.
What is the Median Family Income in Stormstown?
Median Family Income in Stormstown is $139,094.
What is the Median Household income in Stormstown?
Median Household Income in Stormstown is $138,313.
What is Income or Wage Gap in Stormstown?
Income or Wage Gap in Stormstown is 40.2%.
Women in Stormstown earn 59.8 cents for every dollar earned by a man.
What is Inequality or Gini Index in Stormstown?
Inequality or Gini Index in Stormstown is 0.37.
What is the Total Population of Stormstown?
Total Population of Stormstown is 2,464.
What is the Total Male Population of Stormstown?
Total Male Population of Stormstown is 1,327.
What is the Total Female Population of Stormstown?
Total Female Population of Stormstown is 1,137.
What is the Ratio of Males per 100 Females in Stormstown?
There are 116.71 Males per 100 Females in Stormstown.
What is the Ratio of Females per 100 Males in Stormstown?
There are 85.68 Females per 100 Males in Stormstown.
What is the Median Population Age in Stormstown?
Median Population Age in Stormstown is 41.5 Years.
What is the Average Family Size in Stormstown
Average Family Size in Stormstown is 3.2 People.
What is the Average Household Size in Stormstown
Average Household Size in Stormstown is 3.0 People.
How Large is the Labor Force in Stormstown?
There are 1,396 People in the Labor Forcein in Stormstown.
What is the Percentage of People in the Labor Force in Stormstown?
77.5% of People are in the Labor Force in Stormstown.
What is the Unemployment Rate in Stormstown?
Unemployment Rate in Stormstown is 4.6%.