Lake Wynonah, PA Map & Demographics
Lake Wynonah Map
Lake Wynonah Overview
$43,816
PER CAPITA INCOME
$100,938
AVG FAMILY INCOME
$91,816
AVG HOUSEHOLD INCOME
40.6%
WAGE / INCOME GAP [ % ]
59.4¢/ $1
WAGE / INCOME GAP [ $ ]
0.34
INEQUALITY / GINI INDEX
2,975
TOTAL POPULATION
1,445
MALE POPULATION
1,530
FEMALE POPULATION
94.44
MALES / 100 FEMALES
105.88
FEMALES / 100 MALES
47.4
MEDIAN AGE
2.9
AVG FAMILY SIZE
2.6
AVG HOUSEHOLD SIZE
1,534
LABOR FORCE [ PEOPLE ]
61.2%
PERCENT IN LABOR FORCE
2.1%
UNEMPLOYMENT RATE
Income in Lake Wynonah
Income Overview in Lake Wynonah
Per Capita Income in Lake Wynonah is $43,816, while median incomes of families and households are $100,938 and $91,816 respectively.
| Characteristic | Number | Measure |
| Per Capita Income | 2,975 | $43,816 |
| Median Family Income | 927 | $100,938 |
| Mean Family Income | 927 | $120,499 |
| Median Household Income | 1,129 | $91,816 |
| Mean Household Income | 1,129 | $111,912 |
| Income Deficit | 927 | $0 |
| Wage / Income Gap (%) | 2,975 | 40.59% |
| Wage / Income Gap ($) | 2,975 | 59.41¢ per $1 |
| Gini / Inequality Index | 2,975 | 0.34 |
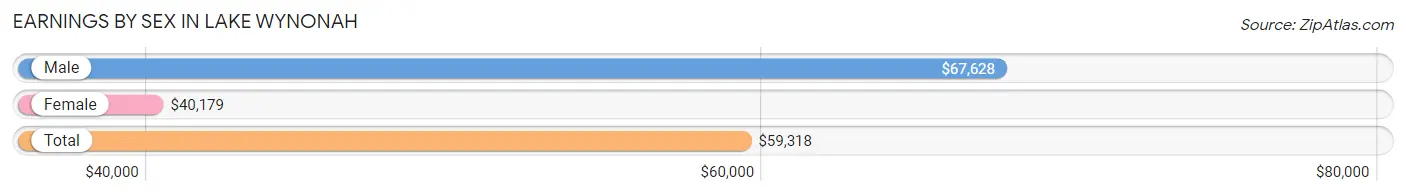
Earnings by Sex in Lake Wynonah
Average Earnings in Lake Wynonah are $59,318, $67,628 for men and $40,179 for women, a difference of 40.6%.
| Sex | Number | Average Earnings |
| Male | 851 (54.5%) | $67,628 |
| Female | 711 (45.5%) | $40,179 |
| Total | 1,562 (100.0%) | $59,318 |
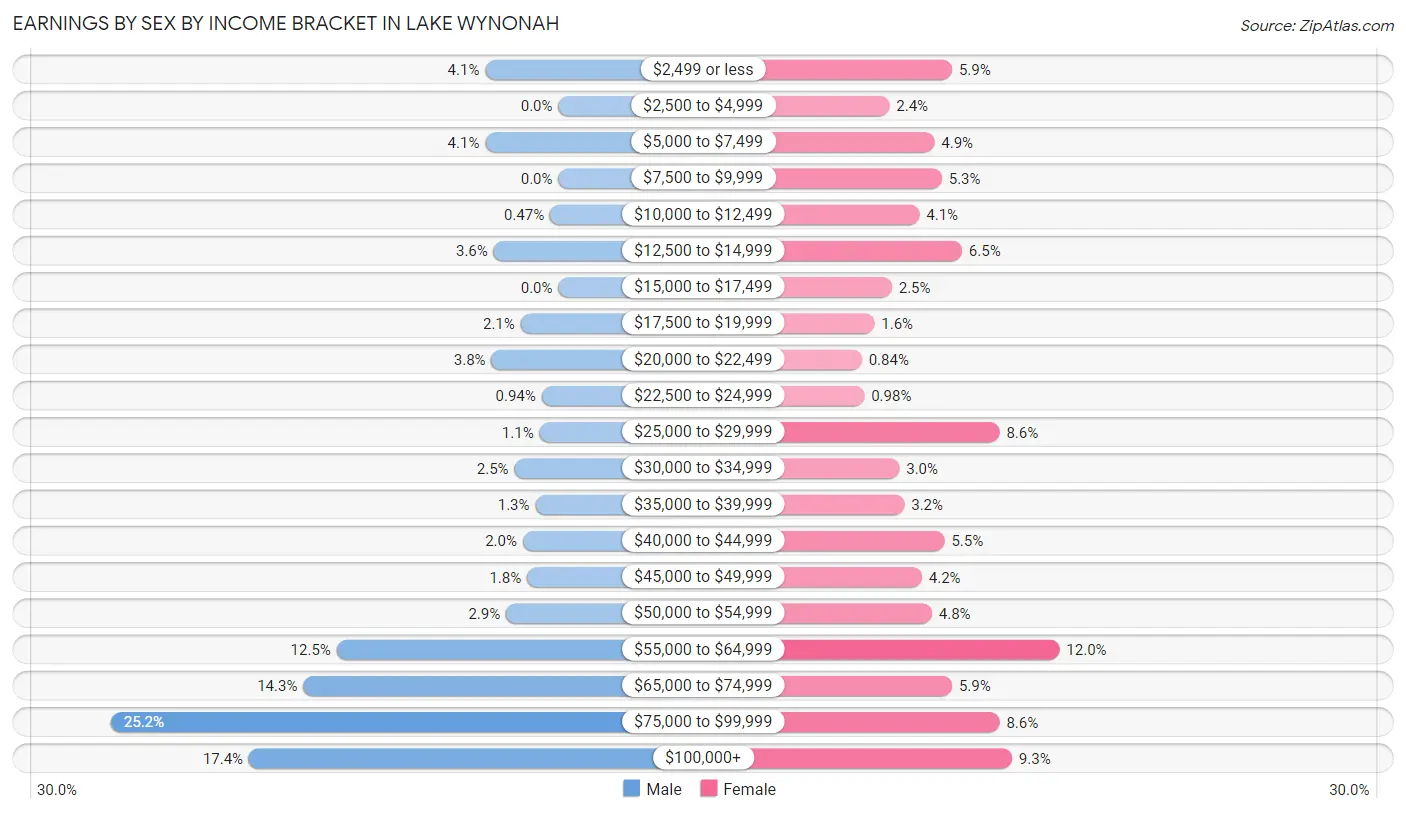
Earnings by Sex by Income Bracket in Lake Wynonah
The most common earnings brackets in Lake Wynonah are $75,000 to $99,999 for men (214 | 25.2%) and $55,000 to $64,999 for women (85 | 11.9%).
| Income | Male | Female |
| $2,499 or less | 35 (4.1%) | 42 (5.9%) |
| $2,500 to $4,999 | 0 (0.0%) | 17 (2.4%) |
| $5,000 to $7,499 | 35 (4.1%) | 35 (4.9%) |
| $7,500 to $9,999 | 0 (0.0%) | 38 (5.3%) |
| $10,000 to $12,499 | 4 (0.5%) | 29 (4.1%) |
| $12,500 to $14,999 | 31 (3.6%) | 46 (6.5%) |
| $15,000 to $17,499 | 0 (0.0%) | 18 (2.5%) |
| $17,500 to $19,999 | 18 (2.1%) | 11 (1.5%) |
| $20,000 to $22,499 | 32 (3.8%) | 6 (0.8%) |
| $22,500 to $24,999 | 8 (0.9%) | 7 (1.0%) |
| $25,000 to $29,999 | 9 (1.1%) | 61 (8.6%) |
| $30,000 to $34,999 | 21 (2.5%) | 21 (2.9%) |
| $35,000 to $39,999 | 11 (1.3%) | 23 (3.2%) |
| $40,000 to $44,999 | 17 (2.0%) | 39 (5.5%) |
| $45,000 to $49,999 | 15 (1.8%) | 30 (4.2%) |
| $50,000 to $54,999 | 25 (2.9%) | 34 (4.8%) |
| $55,000 to $64,999 | 106 (12.5%) | 85 (11.9%) |
| $65,000 to $74,999 | 122 (14.3%) | 42 (5.9%) |
| $75,000 to $99,999 | 214 (25.2%) | 61 (8.6%) |
| $100,000+ | 148 (17.4%) | 66 (9.3%) |
| Total | 851 (100.0%) | 711 (100.0%) |
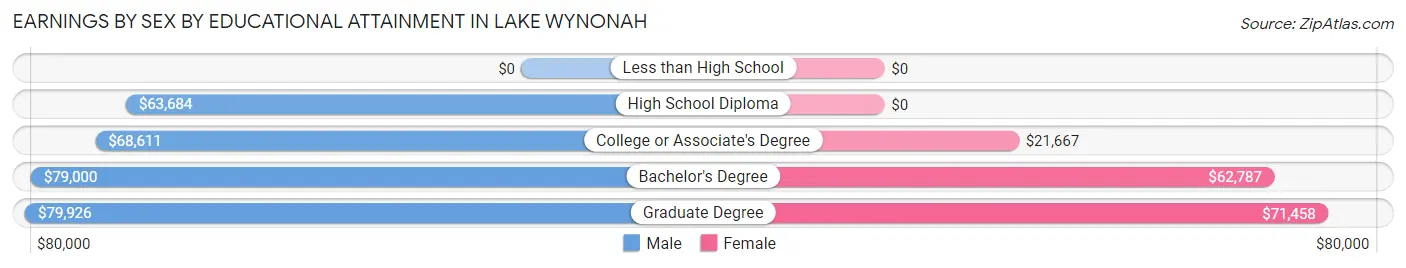
Earnings by Sex by Educational Attainment in Lake Wynonah
Average earnings in Lake Wynonah are $68,495 for men and $45,417 for women, a difference of 33.7%. Men with an educational attainment of graduate degree enjoy the highest average annual earnings of $79,926, while those with high school diploma education earn the least with $63,684. Women with an educational attainment of graduate degree earn the most with the average annual earnings of $71,458, while those with college or associate's degree education have the smallest earnings of $21,667.
| Educational Attainment | Male Income | Female Income |
| Less than High School | - | - |
| High School Diploma | $63,684 | $0 |
| College or Associate's Degree | $68,611 | $21,667 |
| Bachelor's Degree | $79,000 | $62,787 |
| Graduate Degree | $79,926 | $71,458 |
| Total | $68,495 | $45,417 |
Family Income in Lake Wynonah
Family Income Brackets in Lake Wynonah
According to the Lake Wynonah family income data, there are 242 families falling into the $100,000 to $149,999 income range, which is the most common income bracket and makes up 26.1% of all families.
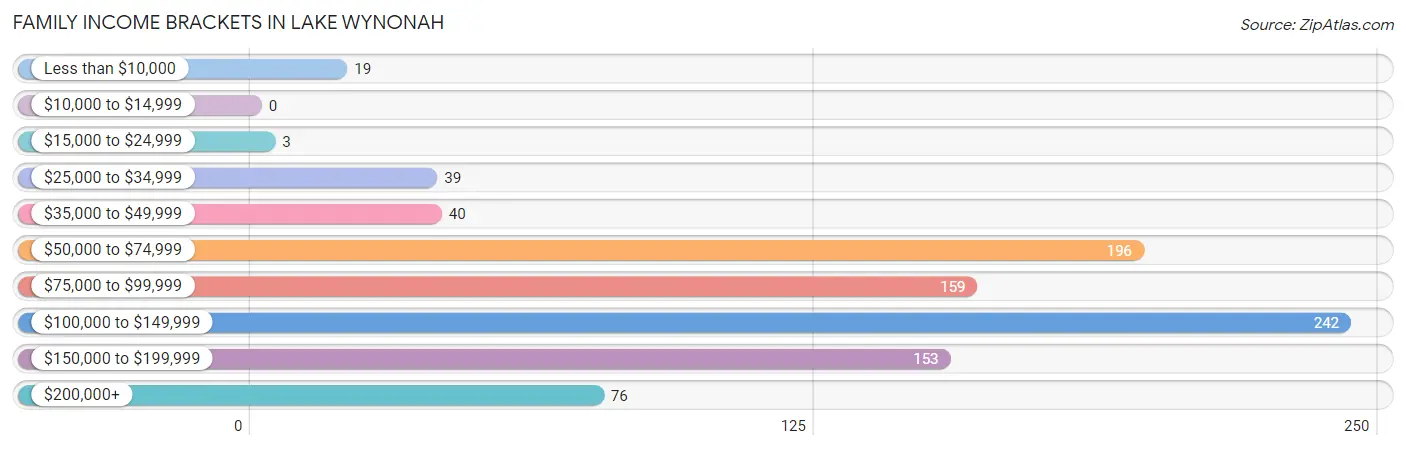
| Income Bracket | # Families | % Families |
| Less than $10,000 | 19 | 2.0% |
| $10,000 to $14,999 | 0 | 0.0% |
| $15,000 to $24,999 | 3 | 0.3% |
| $25,000 to $34,999 | 39 | 4.2% |
| $35,000 to $49,999 | 40 | 4.3% |
| $50,000 to $74,999 | 196 | 21.1% |
| $75,000 to $99,999 | 159 | 17.2% |
| $100,000 to $149,999 | 242 | 26.1% |
| $150,000 to $199,999 | 153 | 16.5% |
| $200,000+ | 76 | 8.2% |
Family Income by Famaliy Size in Lake Wynonah
5-person families (40 | 4.3%) account for the highest median family income in Lake Wynonah with $138,864 per family, while 2-person families (487 | 52.5%) have the highest median income of $45,720 per family member.
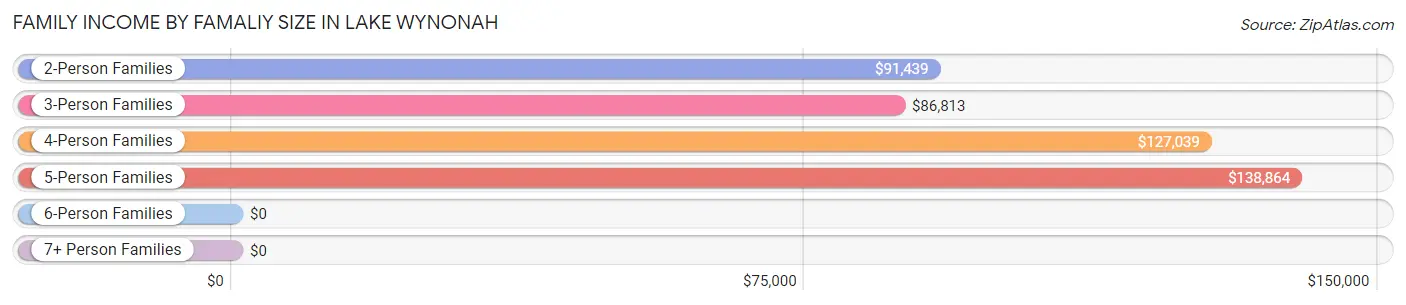
| Income Bracket | # Families | Median Income |
| 2-Person Families | 487 (52.5%) | $91,439 |
| 3-Person Families | 217 (23.4%) | $86,813 |
| 4-Person Families | 165 (17.8%) | $127,039 |
| 5-Person Families | 40 (4.3%) | $138,864 |
| 6-Person Families | 12 (1.3%) | $0 |
| 7+ Person Families | 6 (0.6%) | $0 |
| Total | 927 (100.0%) | $100,938 |
Family Income by Number of Earners in Lake Wynonah
The median family income in Lake Wynonah is $100,938, with families comprising 3+ earners (87) having the highest median family income of $126,607, while families with no earners (122) have the lowest median family income of $64,000, accounting for 9.4% and 13.2% of families, respectively.
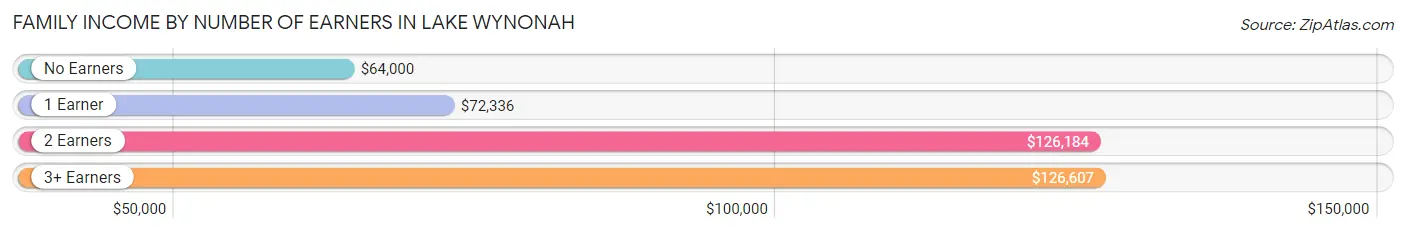
| Number of Earners | # Families | Median Income |
| No Earners | 122 (13.2%) | $64,000 |
| 1 Earner | 364 (39.3%) | $72,336 |
| 2 Earners | 354 (38.2%) | $126,184 |
| 3+ Earners | 87 (9.4%) | $126,607 |
| Total | 927 (100.0%) | $100,938 |
Household Income in Lake Wynonah
Household Income Brackets in Lake Wynonah
With 305 households falling in the category, the $100,000 to $149,999 income range is the most frequent in Lake Wynonah, accounting for 27.0% of all households. In contrast, only 14 households (1.2%) fall into the $10,000 to $14,999 income bracket, making it the least populous group.
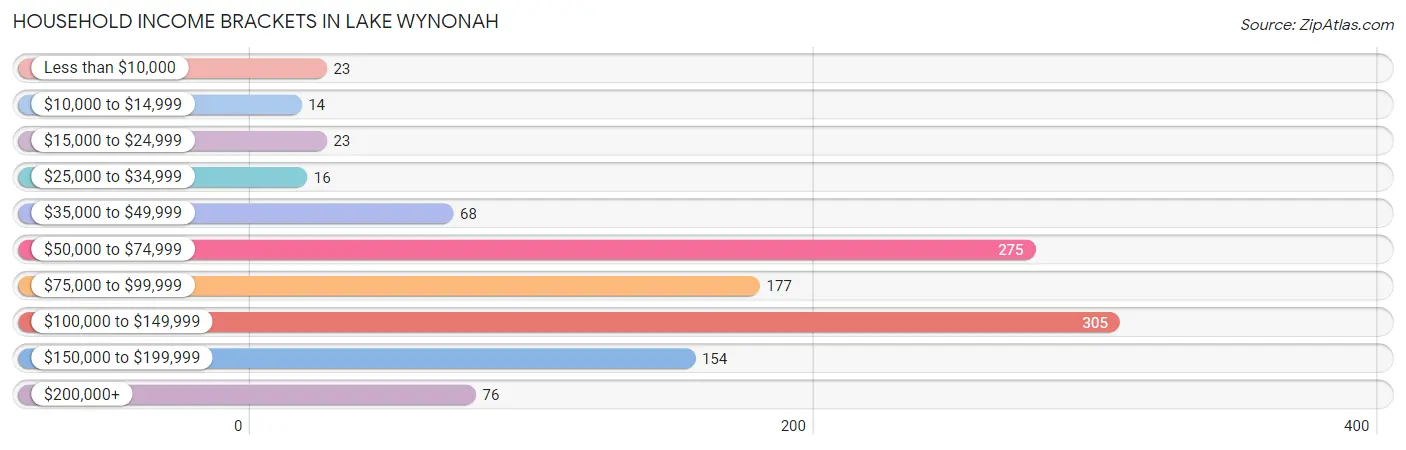
| Income Bracket | # Households | % Households |
| Less than $10,000 | 23 | 2.0% |
| $10,000 to $14,999 | 14 | 1.2% |
| $15,000 to $24,999 | 23 | 2.0% |
| $25,000 to $34,999 | 16 | 1.4% |
| $35,000 to $49,999 | 68 | 6.0% |
| $50,000 to $74,999 | 275 | 24.4% |
| $75,000 to $99,999 | 177 | 15.7% |
| $100,000 to $149,999 | 305 | 27.0% |
| $150,000 to $199,999 | 154 | 13.6% |
| $200,000+ | 76 | 6.7% |
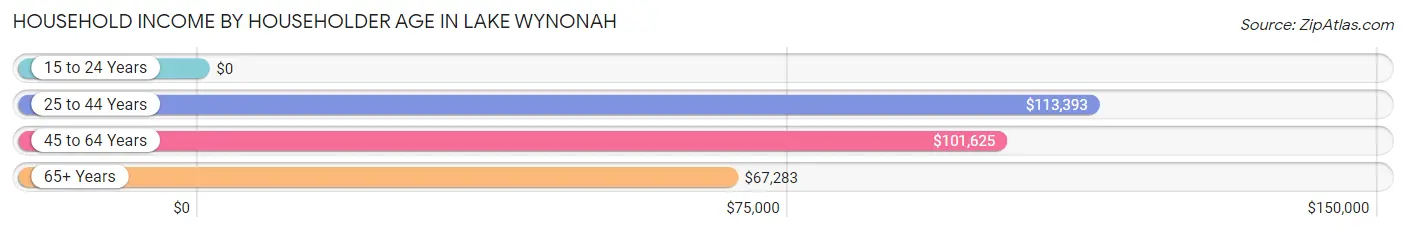
Household Income by Householder Age in Lake Wynonah
The median household income in Lake Wynonah is $91,816, with the highest median household income of $113,393 found in the 25 to 44 years age bracket for the primary householder. A total of 257 households (22.8%) fall into this category.
| Income Bracket | # Households | Median Income |
| 15 to 24 Years | 0 (0.0%) | $0 |
| 25 to 44 Years | 257 (22.8%) | $113,393 |
| 45 to 64 Years | 472 (41.8%) | $101,625 |
| 65+ Years | 400 (35.4%) | $67,283 |
| Total | 1,129 (100.0%) | $91,816 |
Poverty in Lake Wynonah
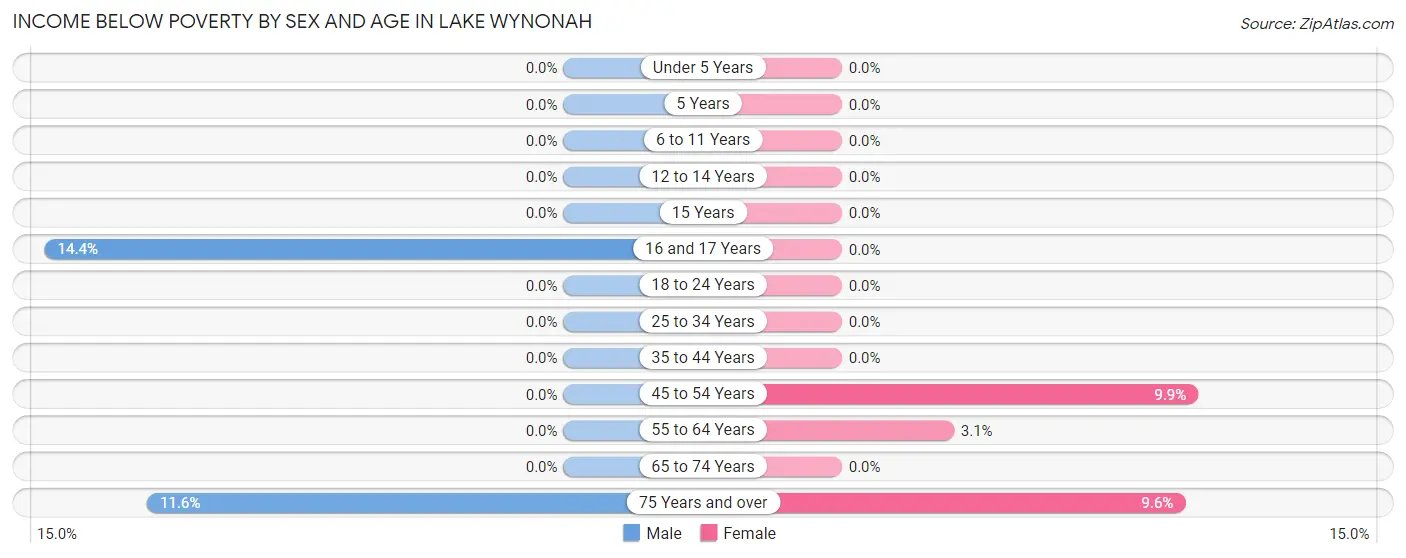
Income Below Poverty by Sex and Age in Lake Wynonah
With 1.5% poverty level for males and 2.9% for females among the residents of Lake Wynonah, 16 and 17 year old males and 45 to 54 year old females are the most vulnerable to poverty, with 13 males (14.4%) and 26 females (9.9%) in their respective age groups living below the poverty level.
| Age Bracket | Male | Female |
| Under 5 Years | 0 (0.0%) | 0 (0.0%) |
| 5 Years | 0 (0.0%) | 0 (0.0%) |
| 6 to 11 Years | 0 (0.0%) | 0 (0.0%) |
| 12 to 14 Years | 0 (0.0%) | 0 (0.0%) |
| 15 Years | 0 (0.0%) | 0 (0.0%) |
| 16 and 17 Years | 13 (14.4%) | 0 (0.0%) |
| 18 to 24 Years | 0 (0.0%) | 0 (0.0%) |
| 25 to 34 Years | 0 (0.0%) | 0 (0.0%) |
| 35 to 44 Years | 0 (0.0%) | 0 (0.0%) |
| 45 to 54 Years | 0 (0.0%) | 26 (9.9%) |
| 55 to 64 Years | 0 (0.0%) | 5 (3.1%) |
| 65 to 74 Years | 0 (0.0%) | 0 (0.0%) |
| 75 Years and over | 8 (11.6%) | 13 (9.6%) |
| Total | 21 (1.5%) | 44 (2.9%) |
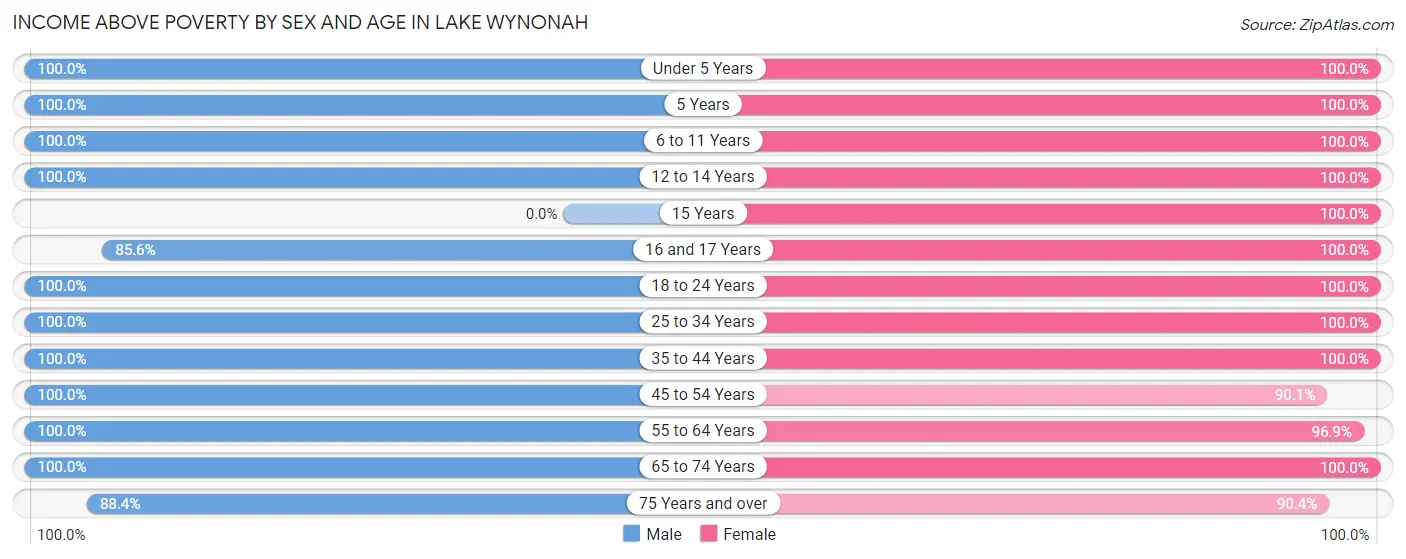
Income Above Poverty by Sex and Age in Lake Wynonah
According to the poverty statistics in Lake Wynonah, males aged under 5 years and females aged under 5 years are the age groups that are most secure financially, with 100.0% of males and 100.0% of females in these age groups living above the poverty line.
| Age Bracket | Male | Female |
| Under 5 Years | 30 (100.0%) | 52 (100.0%) |
| 5 Years | 21 (100.0%) | 5 (100.0%) |
| 6 to 11 Years | 118 (100.0%) | 92 (100.0%) |
| 12 to 14 Years | 80 (100.0%) | 63 (100.0%) |
| 15 Years | 0 (0.0%) | 8 (100.0%) |
| 16 and 17 Years | 77 (85.6%) | 79 (100.0%) |
| 18 to 24 Years | 42 (100.0%) | 151 (100.0%) |
| 25 to 34 Years | 122 (100.0%) | 95 (100.0%) |
| 35 to 44 Years | 149 (100.0%) | 173 (100.0%) |
| 45 to 54 Years | 275 (100.0%) | 236 (90.1%) |
| 55 to 64 Years | 184 (100.0%) | 155 (96.9%) |
| 65 to 74 Years | 265 (100.0%) | 254 (100.0%) |
| 75 Years and over | 61 (88.4%) | 123 (90.4%) |
| Total | 1,424 (98.6%) | 1,486 (97.1%) |
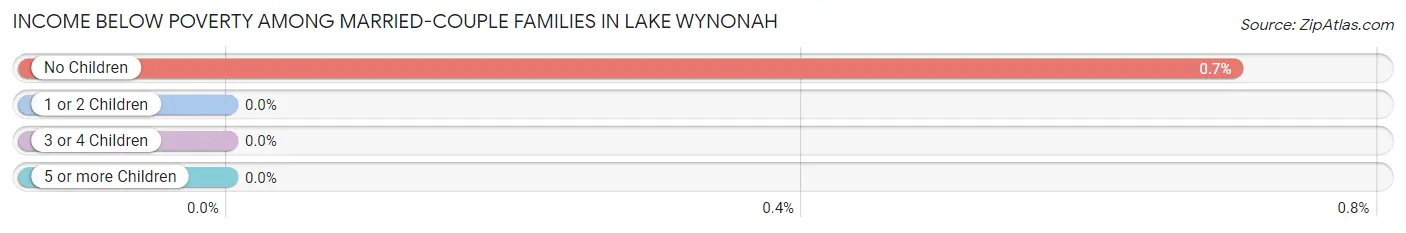
Income Below Poverty Among Married-Couple Families in Lake Wynonah
The poverty statistics for married-couple families in Lake Wynonah show that 0.5% or 4 of the total 764 families live below the poverty line. Families with no children have the highest poverty rate of 0.7%, comprising of 4 families. On the other hand, families with 1 or 2 children have the lowest poverty rate of 0.0%, which includes 0 families.
| Children | Above Poverty | Below Poverty |
| No Children | 569 (99.3%) | 4 (0.7%) |
| 1 or 2 Children | 167 (100.0%) | 0 (0.0%) |
| 3 or 4 Children | 24 (100.0%) | 0 (0.0%) |
| 5 or more Children | 0 (0.0%) | 0 (0.0%) |
| Total | 760 (99.5%) | 4 (0.5%) |
Income Below Poverty Among Single-Parent Households in Lake Wynonah
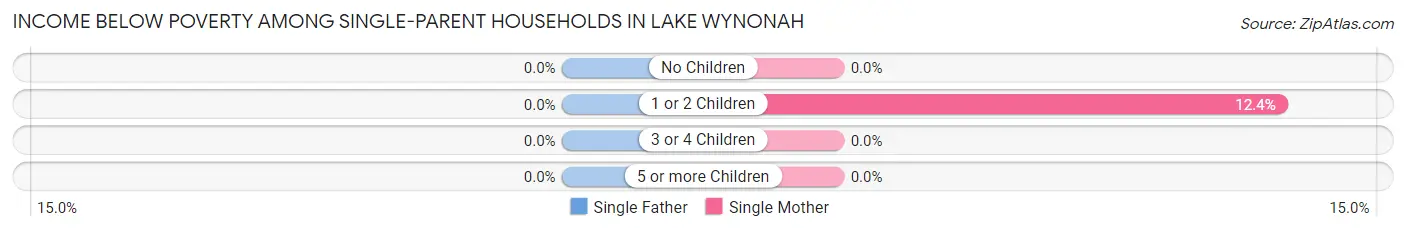
| Children | Single Father | Single Mother |
| No Children | 0 (0.0%) | 0 (0.0%) |
| 1 or 2 Children | 0 (0.0%) | 15 (12.4%) |
| 3 or 4 Children | 0 (0.0%) | 0 (0.0%) |
| 5 or more Children | 0 (0.0%) | 0 (0.0%) |
| Total | 0 (0.0%) | 15 (12.4%) |
Income Below Poverty Among Married-Couple vs Single-Parent Households in Lake Wynonah
The poverty data for Lake Wynonah shows that 4 of the married-couple family households (0.5%) and 15 of the single-parent households (9.2%) are living below the poverty level. Within the married-couple family households, those with no children have the highest poverty rate, with 4 households (0.7%) falling below the poverty line. Among the single-parent households, those with 1 or 2 children have the highest poverty rate, with 15 household (10.1%) living below poverty.
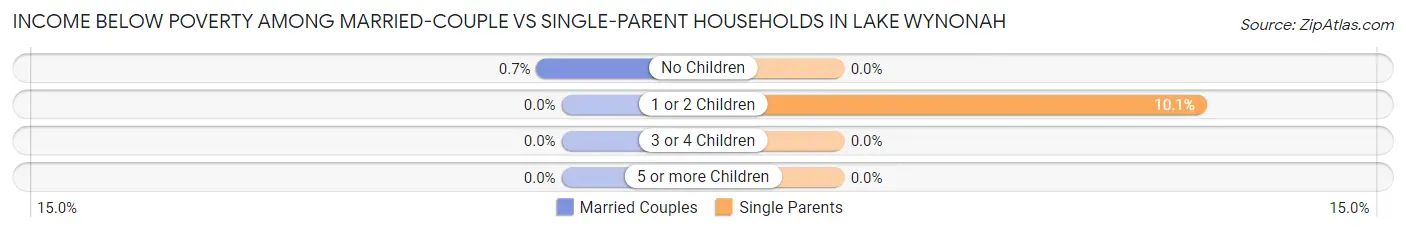
| Children | Married-Couple Families | Single-Parent Households |
| No Children | 4 (0.7%) | 0 (0.0%) |
| 1 or 2 Children | 0 (0.0%) | 15 (10.1%) |
| 3 or 4 Children | 0 (0.0%) | 0 (0.0%) |
| 5 or more Children | 0 (0.0%) | 0 (0.0%) |
| Total | 4 (0.5%) | 15 (9.2%) |
Race in Lake Wynonah
The most populous races in Lake Wynonah are White / Caucasian (2,932 | 98.6%), Hispanic or Latino (105 | 3.5%), and Two or more Races (43 | 1.5%).
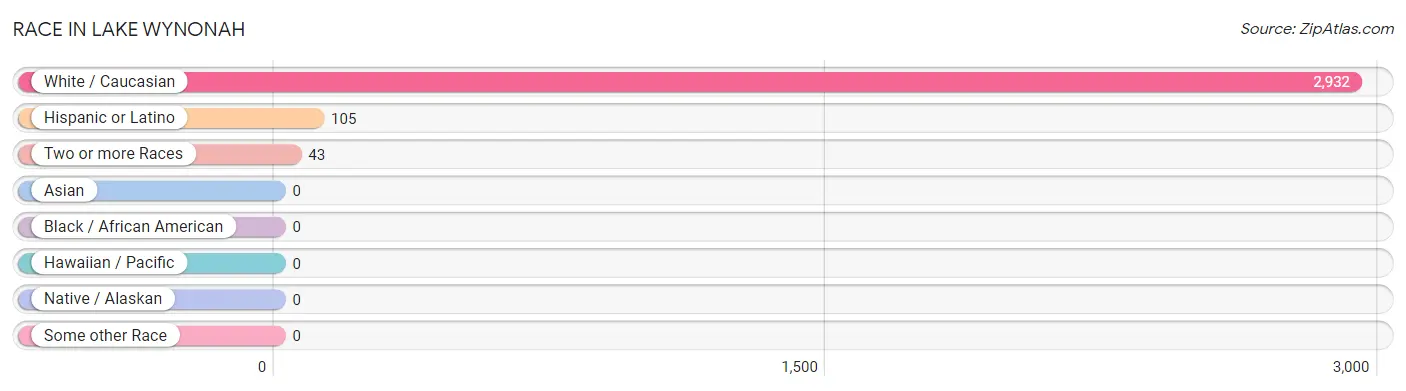
| Race | # Population | % Population |
| Asian | 0 | 0.0% |
| Black / African American | 0 | 0.0% |
| Hawaiian / Pacific | 0 | 0.0% |
| Hispanic or Latino | 105 | 3.5% |
| Native / Alaskan | 0 | 0.0% |
| White / Caucasian | 2,932 | 98.6% |
| Two or more Races | 43 | 1.5% |
| Some other Race | 0 | 0.0% |
| Total | 2,975 | 100.0% |
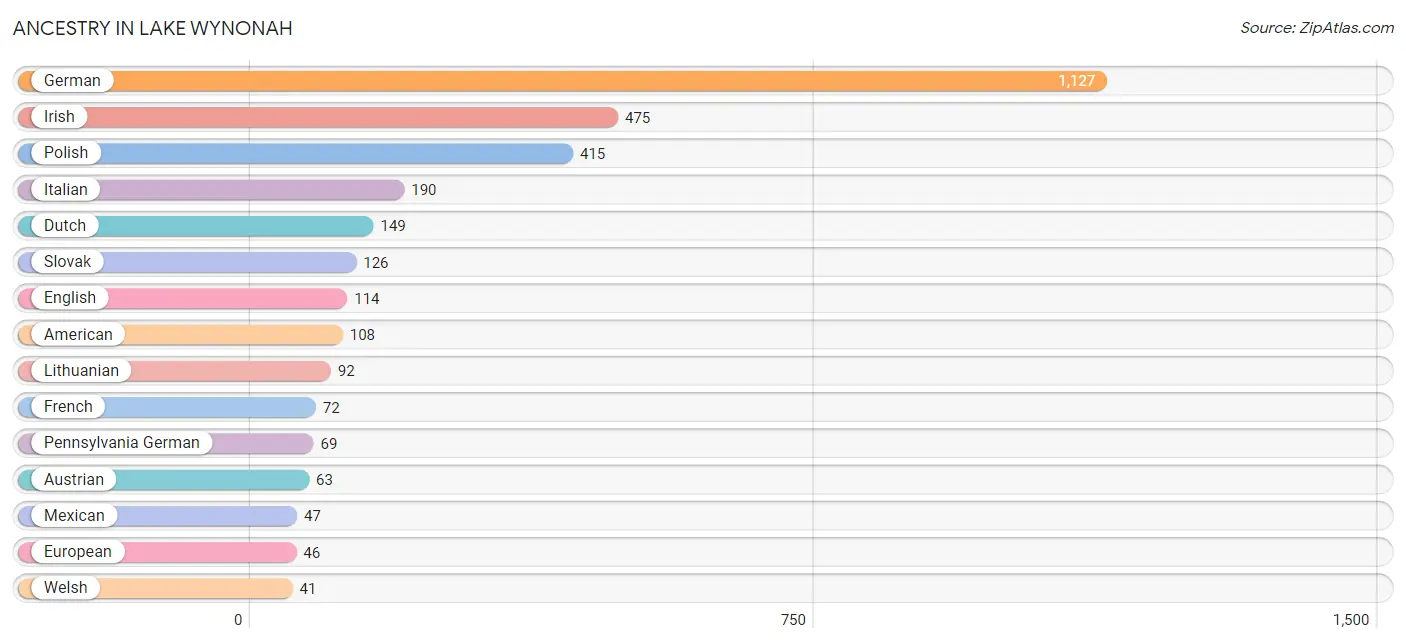
Ancestry in Lake Wynonah
The most populous ancestries reported in Lake Wynonah are German (1,127 | 37.9%), Irish (475 | 16.0%), Polish (415 | 14.0%), Italian (190 | 6.4%), and Dutch (149 | 5.0%), together accounting for 79.2% of all Lake Wynonah residents.
| Ancestry | # Population | % Population |
| American | 108 | 3.6% |
| Arab | 30 | 1.0% |
| Austrian | 63 | 2.1% |
| Bolivian | 5 | 0.2% |
| British | 21 | 0.7% |
| Canadian | 18 | 0.6% |
| Carpatho Rusyn | 5 | 0.2% |
| Cuban | 15 | 0.5% |
| Czechoslovakian | 5 | 0.2% |
| Dutch | 149 | 5.0% |
| Eastern European | 18 | 0.6% |
| English | 114 | 3.8% |
| European | 46 | 1.5% |
| French | 72 | 2.4% |
| French Canadian | 6 | 0.2% |
| German | 1,127 | 37.9% |
| Greek | 9 | 0.3% |
| Hungarian | 21 | 0.7% |
| Irish | 475 | 16.0% |
| Iroquois | 22 | 0.7% |
| Italian | 190 | 6.4% |
| Lebanese | 24 | 0.8% |
| Lithuanian | 92 | 3.1% |
| Mexican | 47 | 1.6% |
| Pennsylvania German | 69 | 2.3% |
| Polish | 415 | 14.0% |
| Puerto Rican | 38 | 1.3% |
| Romanian | 5 | 0.2% |
| Russian | 19 | 0.6% |
| Scotch-Irish | 22 | 0.7% |
| Scottish | 31 | 1.0% |
| Slavic | 5 | 0.2% |
| Slovak | 126 | 4.2% |
| South American | 5 | 0.2% |
| Swedish | 4 | 0.1% |
| Syrian | 6 | 0.2% |
| Ukrainian | 36 | 1.2% |
| Welsh | 41 | 1.4% |
| Yugoslavian | 5 | 0.2% | View All 39 Rows |
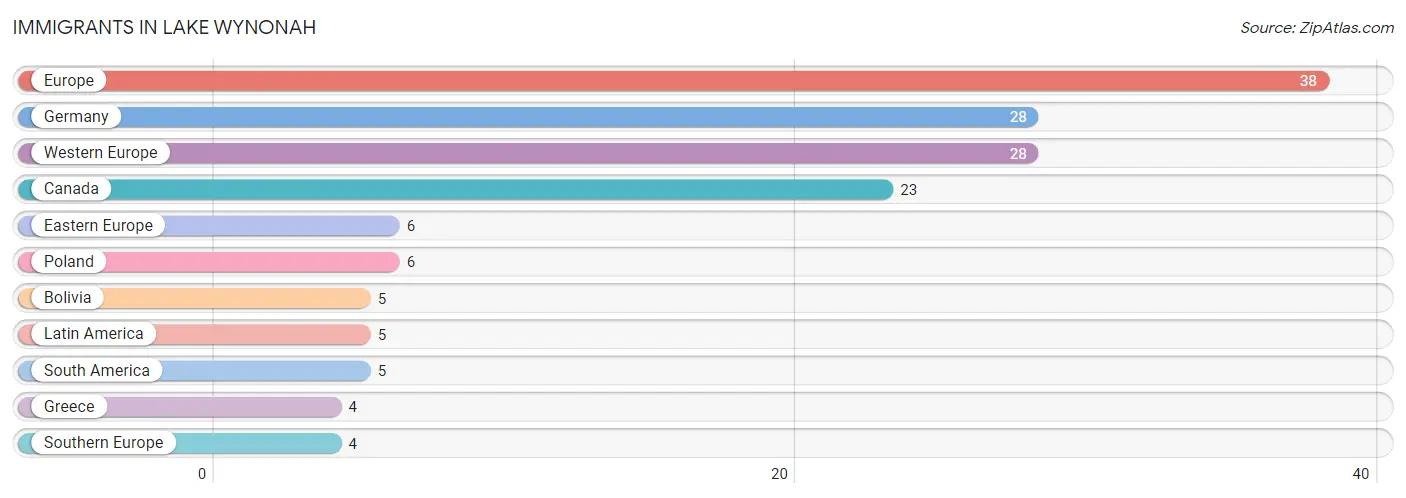
Immigrants in Lake Wynonah
The most numerous immigrant groups reported in Lake Wynonah came from Europe (38 | 1.3%), Germany (28 | 0.9%), Western Europe (28 | 0.9%), Canada (23 | 0.8%), and Eastern Europe (6 | 0.2%), together accounting for 4.1% of all Lake Wynonah residents.
| Immigration Origin | # Population | % Population |
| Bolivia | 5 | 0.2% |
| Canada | 23 | 0.8% |
| Eastern Europe | 6 | 0.2% |
| Europe | 38 | 1.3% |
| Germany | 28 | 0.9% |
| Greece | 4 | 0.1% |
| Latin America | 5 | 0.2% |
| Poland | 6 | 0.2% |
| South America | 5 | 0.2% |
| Southern Europe | 4 | 0.1% |
| Western Europe | 28 | 0.9% | View All 11 Rows |
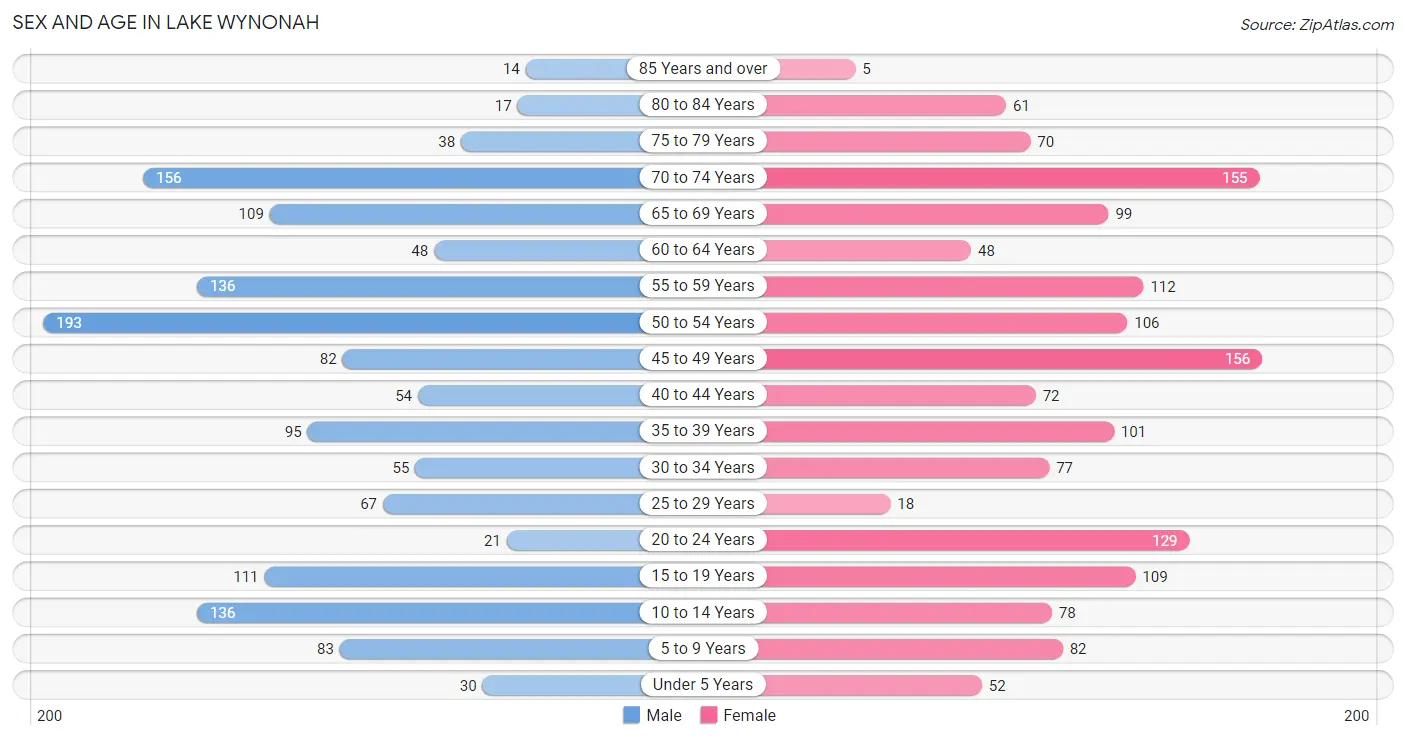
Sex and Age in Lake Wynonah
Sex and Age in Lake Wynonah
The most populous age groups in Lake Wynonah are 50 to 54 Years (193 | 13.4%) for men and 45 to 49 Years (156 | 10.2%) for women.
| Age Bracket | Male | Female |
| Under 5 Years | 30 (2.1%) | 52 (3.4%) |
| 5 to 9 Years | 83 (5.7%) | 82 (5.4%) |
| 10 to 14 Years | 136 (9.4%) | 78 (5.1%) |
| 15 to 19 Years | 111 (7.7%) | 109 (7.1%) |
| 20 to 24 Years | 21 (1.5%) | 129 (8.4%) |
| 25 to 29 Years | 67 (4.6%) | 18 (1.2%) |
| 30 to 34 Years | 55 (3.8%) | 77 (5.0%) |
| 35 to 39 Years | 95 (6.6%) | 101 (6.6%) |
| 40 to 44 Years | 54 (3.7%) | 72 (4.7%) |
| 45 to 49 Years | 82 (5.7%) | 156 (10.2%) |
| 50 to 54 Years | 193 (13.4%) | 106 (6.9%) |
| 55 to 59 Years | 136 (9.4%) | 112 (7.3%) |
| 60 to 64 Years | 48 (3.3%) | 48 (3.1%) |
| 65 to 69 Years | 109 (7.5%) | 99 (6.5%) |
| 70 to 74 Years | 156 (10.8%) | 155 (10.1%) |
| 75 to 79 Years | 38 (2.6%) | 70 (4.6%) |
| 80 to 84 Years | 17 (1.2%) | 61 (4.0%) |
| 85 Years and over | 14 (1.0%) | 5 (0.3%) |
| Total | 1,445 (100.0%) | 1,530 (100.0%) |
Families and Households in Lake Wynonah
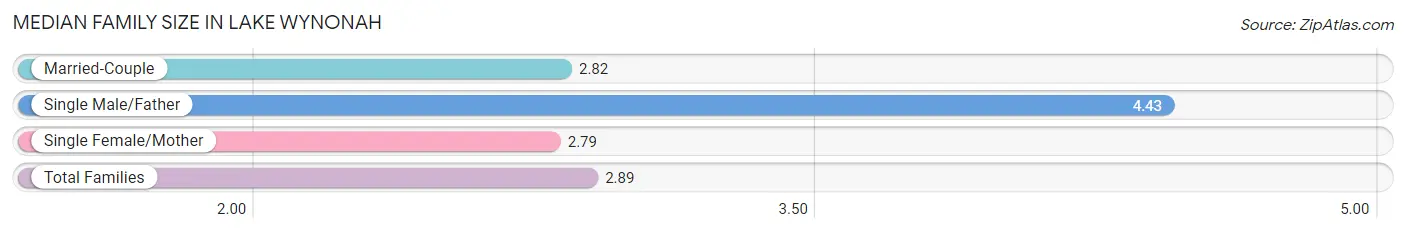
Median Family Size in Lake Wynonah
The median family size in Lake Wynonah is 2.89 persons per family, with single male/father families (42 | 4.5%) accounting for the largest median family size of 4.43 persons per family. On the other hand, single female/mother families (121 | 13.1%) represent the smallest median family size with 2.79 persons per family.
| Family Type | # Families | Family Size |
| Married-Couple | 764 (82.4%) | 2.82 |
| Single Male/Father | 42 (4.5%) | 4.43 |
| Single Female/Mother | 121 (13.1%) | 2.79 |
| Total Families | 927 (100.0%) | 2.89 |
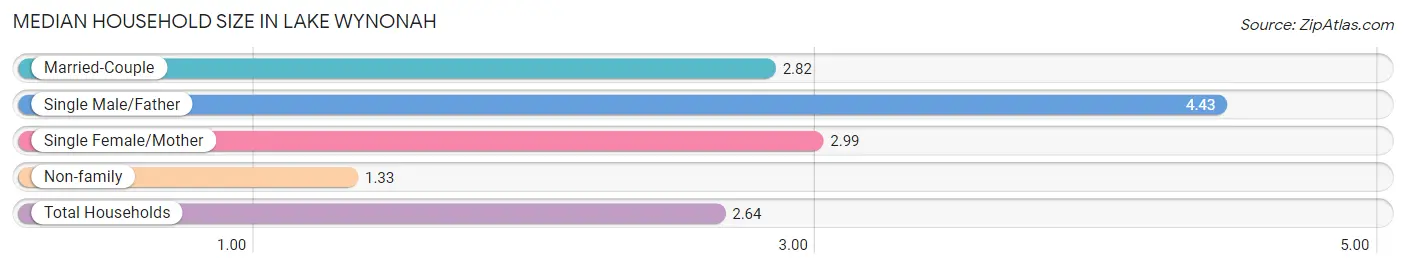
Median Household Size in Lake Wynonah
The median household size in Lake Wynonah is 2.64 persons per household, with single male/father households (42 | 3.7%) accounting for the largest median household size of 4.43 persons per household. non-family households (202 | 17.9%) represent the smallest median household size with 1.33 persons per household.
| Household Type | # Households | Household Size |
| Married-Couple | 764 (67.7%) | 2.82 |
| Single Male/Father | 42 (3.7%) | 4.43 |
| Single Female/Mother | 121 (10.7%) | 2.99 |
| Non-family | 202 (17.9%) | 1.33 |
| Total Households | 1,129 (100.0%) | 2.64 |
Household Size by Marriage Status in Lake Wynonah
Out of a total of 1,129 households in Lake Wynonah, 927 (82.1%) are family households, while 202 (17.9%) are nonfamily households. The most numerous type of family households are 2-person households, comprising 464, and the most common type of nonfamily households are 1-person households, comprising 148.
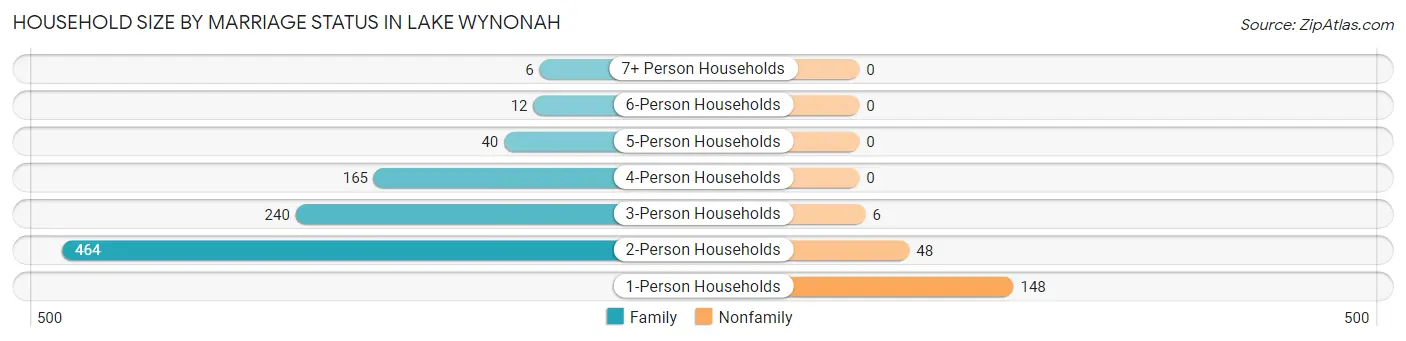
| Household Size | Family Households | Nonfamily Households |
| 1-Person Households | - | 148 (13.1%) |
| 2-Person Households | 464 (41.1%) | 48 (4.3%) |
| 3-Person Households | 240 (21.3%) | 6 (0.5%) |
| 4-Person Households | 165 (14.6%) | 0 (0.0%) |
| 5-Person Households | 40 (3.5%) | 0 (0.0%) |
| 6-Person Households | 12 (1.1%) | 0 (0.0%) |
| 7+ Person Households | 6 (0.5%) | 0 (0.0%) |
| Total | 927 (82.1%) | 202 (17.9%) |
Female Fertility in Lake Wynonah
Fertility by Age in Lake Wynonah
Average fertility rate in Lake Wynonah is 48.0 births per 1,000 women. Women in the age bracket of 20 to 34 years have the highest fertility rate with 143.0 births per 1,000 women. Women in the age bracket of 20 to 34 years acount for 100.0% of all women with births.
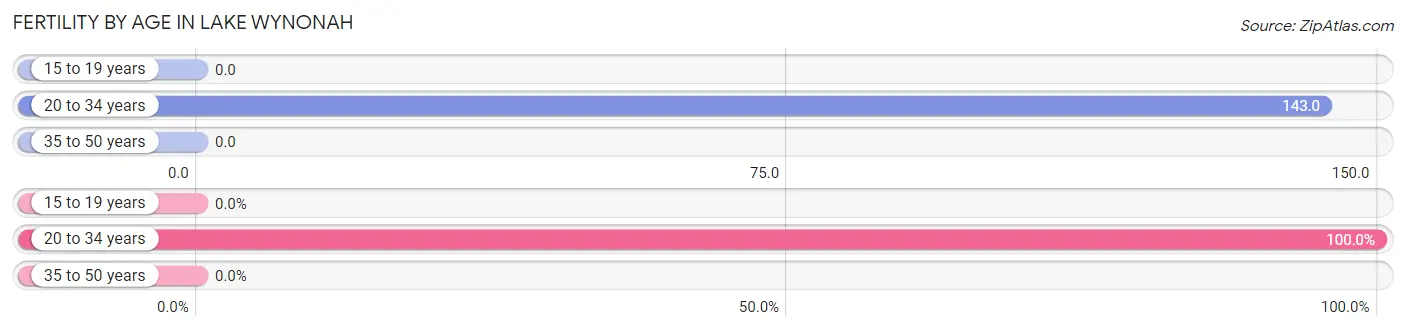
| Age Bracket | Women with Births | Births / 1,000 Women |
| 15 to 19 years | 0 (0.0%) | 0.0 |
| 20 to 34 years | 32 (100.0%) | 143.0 |
| 35 to 50 years | 0 (0.0%) | 0.0 |
| Total | 32 (100.0%) | 48.0 |
Fertility by Age by Marriage Status in Lake Wynonah
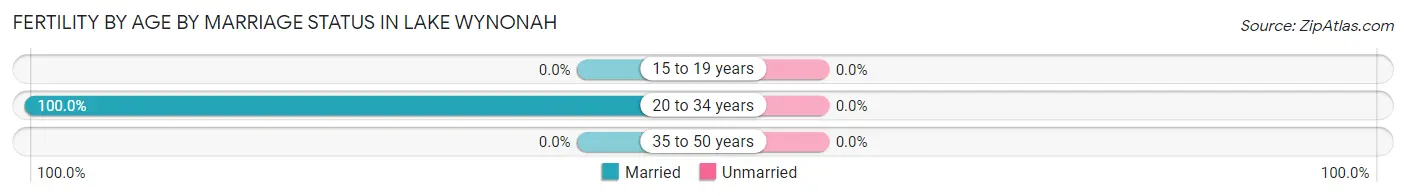
| Age Bracket | Married | Unmarried |
| 15 to 19 years | 0 (0.0%) | 0 (0.0%) |
| 20 to 34 years | 32 (100.0%) | 0 (0.0%) |
| 35 to 50 years | 0 (0.0%) | 0 (0.0%) |
| Total | 32 (100.0%) | 0 (0.0%) |
Fertility by Education in Lake Wynonah
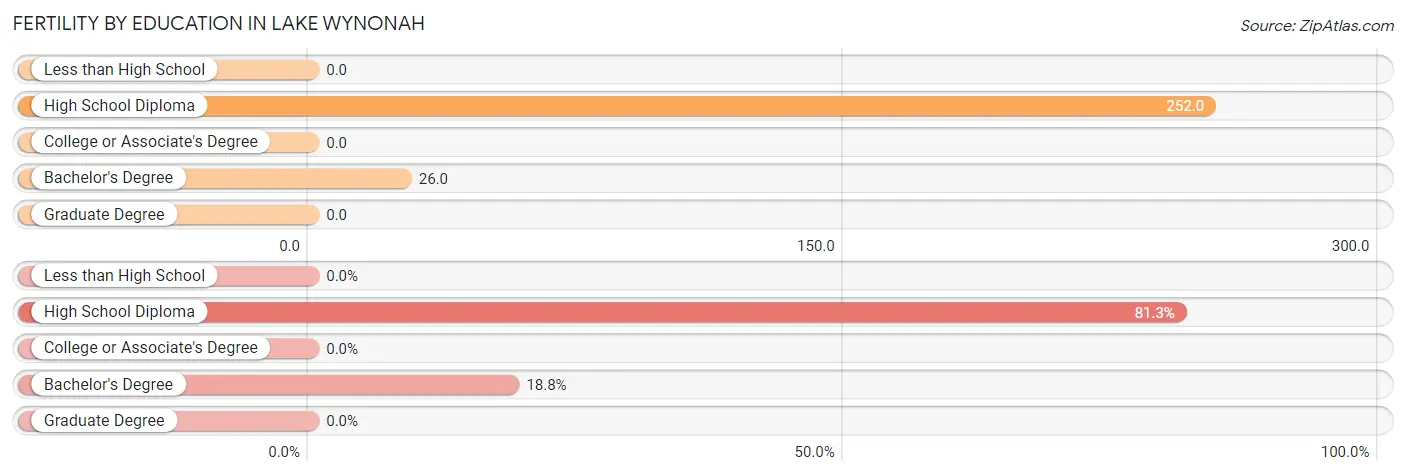
| Educational Attainment | Women with Births | Births / 1,000 Women |
| Less than High School | 0 (0.0%) | 0.0 |
| High School Diploma | 26 (81.2%) | 252.0 |
| College or Associate's Degree | 0 (0.0%) | 0.0 |
| Bachelor's Degree | 6 (18.8%) | 26.0 |
| Graduate Degree | 0 (0.0%) | 0.0 |
| Total | 32 (100.0%) | 48.0 |
Fertility by Education by Marriage Status in Lake Wynonah
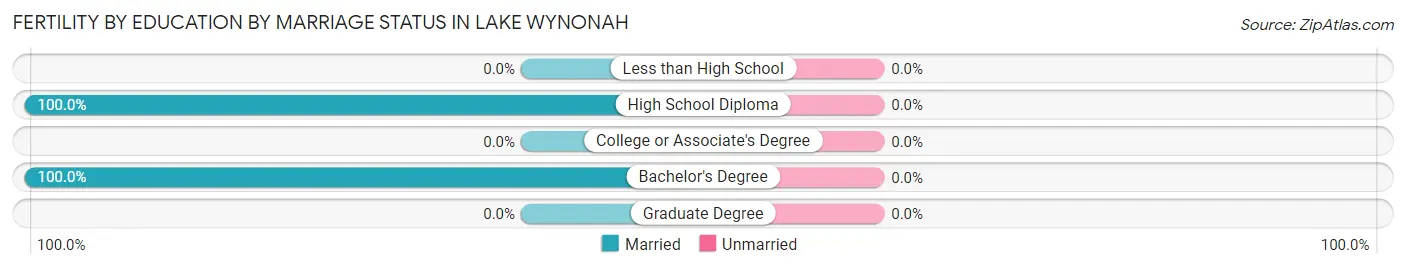
| Educational Attainment | Married | Unmarried |
| Less than High School | 0 (0.0%) | 0 (0.0%) |
| High School Diploma | 26 (100.0%) | 0 (0.0%) |
| College or Associate's Degree | 0 (0.0%) | 0 (0.0%) |
| Bachelor's Degree | 6 (100.0%) | 0 (0.0%) |
| Graduate Degree | 0 (0.0%) | 0 (0.0%) |
| Total | 32 (100.0%) | 0 (0.0%) |
Employment Characteristics in Lake Wynonah
Employment by Class of Employer in Lake Wynonah
Among the 1,490 employed individuals in Lake Wynonah, private company employees (1,048 | 70.3%), self-employed (not incorporated) (135 | 9.1%), and local government employees (116 | 7.8%) make up the most common classes of employment.
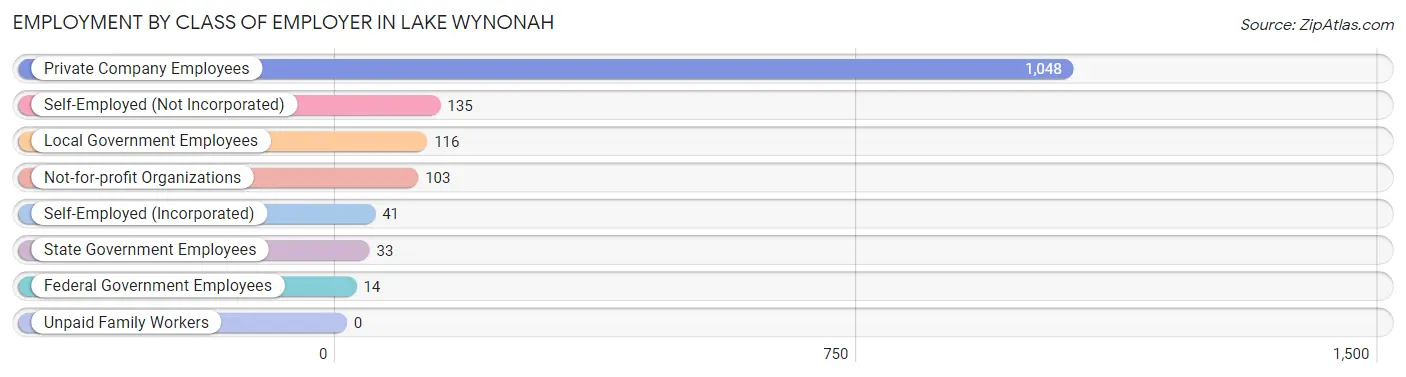
| Employer Class | # Employees | % Employees |
| Private Company Employees | 1,048 | 70.3% |
| Self-Employed (Incorporated) | 41 | 2.8% |
| Self-Employed (Not Incorporated) | 135 | 9.1% |
| Not-for-profit Organizations | 103 | 6.9% |
| Local Government Employees | 116 | 7.8% |
| State Government Employees | 33 | 2.2% |
| Federal Government Employees | 14 | 0.9% |
| Unpaid Family Workers | 0 | 0.0% |
| Total | 1,490 | 100.0% |
Employment Status by Age in Lake Wynonah
According to the labor force statistics for Lake Wynonah, out of the total population over 16 years of age (2,506), 61.2% or 1,534 individuals are in the labor force, with 2.1% or 32 of them unemployed. The age group with the highest labor force participation rate is 25 to 29 years, with 100.0% or 85 individuals in the labor force. Within the labor force, the 25 to 29 years age range has the highest percentage of unemployed individuals, with 8.2% or 7 of them being unemployed.
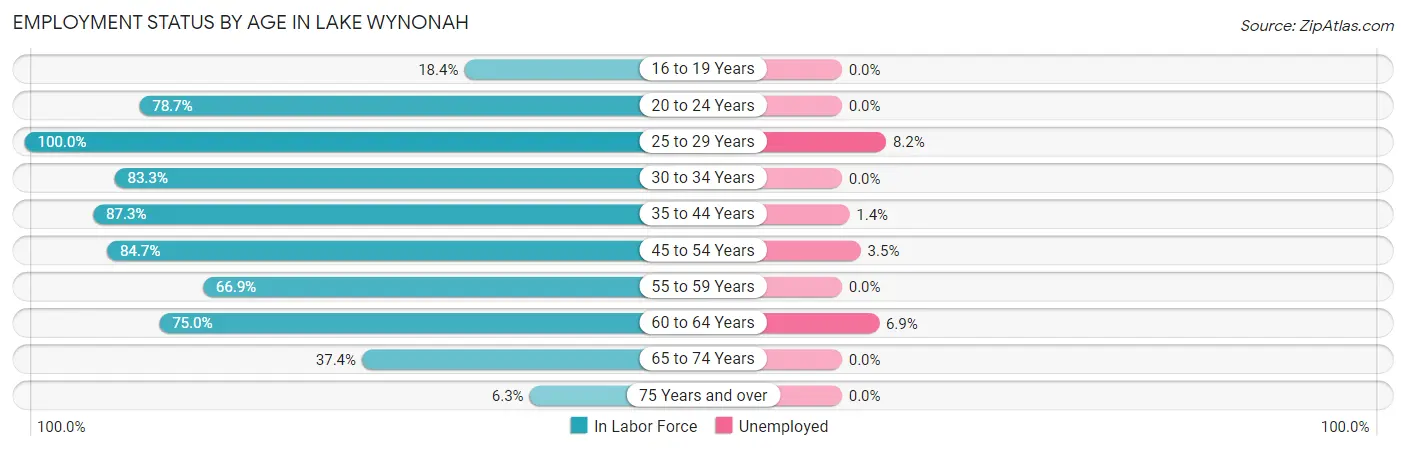
| Age Bracket | In Labor Force | Unemployed |
| 16 to 19 Years | 39 (18.4%) | 0 (0.0%) |
| 20 to 24 Years | 118 (78.7%) | 0 (0.0%) |
| 25 to 29 Years | 85 (100.0%) | 7 (8.2%) |
| 30 to 34 Years | 110 (83.3%) | 0 (0.0%) |
| 35 to 44 Years | 281 (87.3%) | 4 (1.4%) |
| 45 to 54 Years | 455 (84.7%) | 16 (3.5%) |
| 55 to 59 Years | 166 (66.9%) | 0 (0.0%) |
| 60 to 64 Years | 72 (75.0%) | 5 (6.9%) |
| 65 to 74 Years | 194 (37.4%) | 0 (0.0%) |
| 75 Years and over | 13 (6.3%) | 0 (0.0%) |
| Total | 1,534 (61.2%) | 32 (2.1%) |
Employment Status by Educational Attainment in Lake Wynonah
According to labor force statistics for Lake Wynonah, 82.3% of individuals (1,169) out of the total population between 25 and 64 years of age (1,420) are in the labor force, with 2.7% or 32 of them being unemployed. The group with the highest labor force participation rate are those with the educational attainment of high school diploma, with 88.7% or 307 individuals in the labor force. Within the labor force, individuals with high school diploma education have the highest percentage of unemployment, with 3.9% or 12 of them being unemployed.
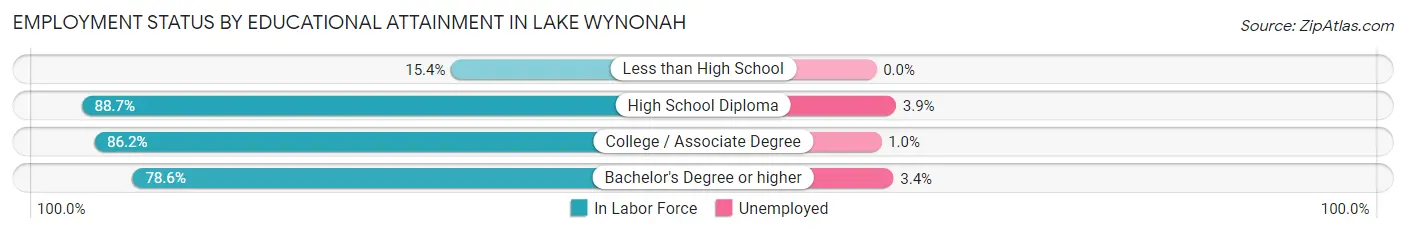
| Educational Attainment | In Labor Force | Unemployed |
| Less than High School | 4 (15.4%) | 0 (0.0%) |
| High School Diploma | 307 (88.7%) | 13 (3.9%) |
| College / Associate Degree | 387 (86.2%) | 4 (1.0%) |
| Bachelor's Degree or higher | 471 (78.6%) | 20 (3.4%) |
| Total | 1,169 (82.3%) | 38 (2.7%) |
Employment Occupations by Sex in Lake Wynonah
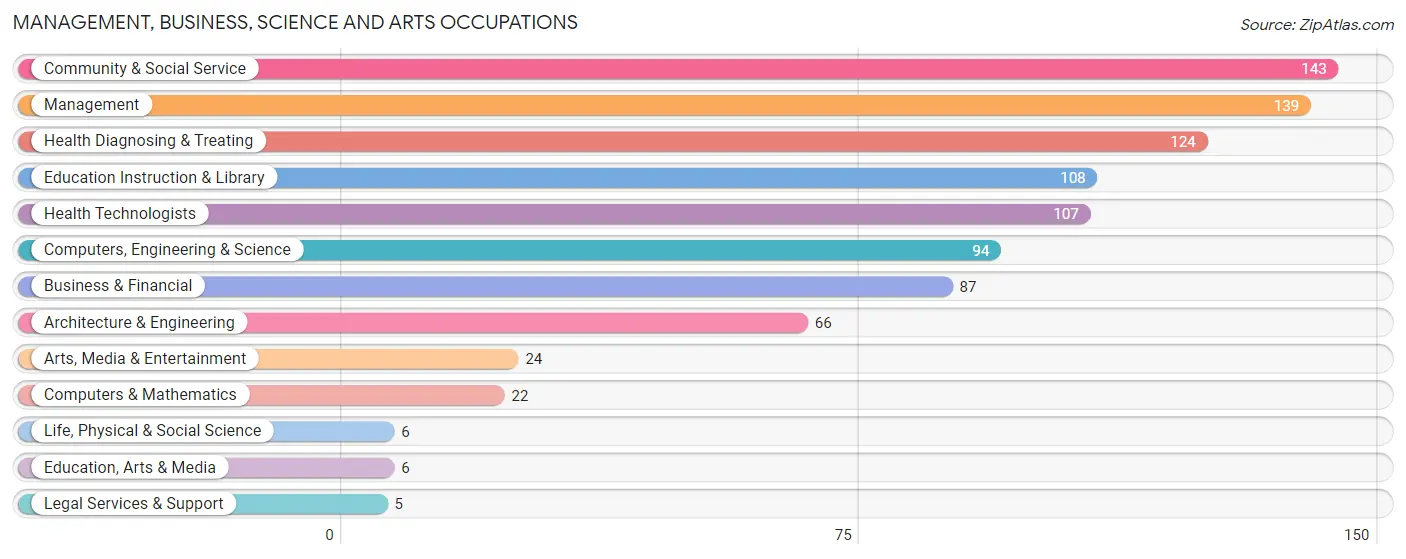
Management, Business, Science and Arts Occupations
The most common Management, Business, Science and Arts occupations in Lake Wynonah are Community & Social Service (143 | 9.5%), Management (139 | 9.3%), Health Diagnosing & Treating (124 | 8.3%), Education Instruction & Library (108 | 7.2%), and Health Technologists (107 | 7.1%).
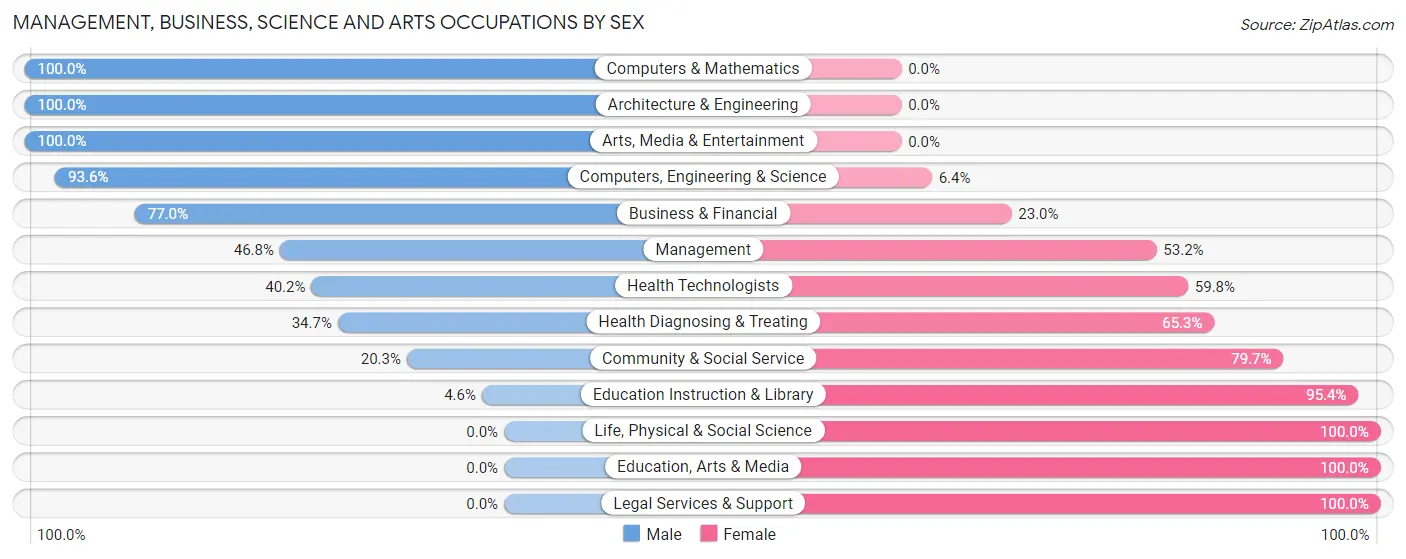
Management, Business, Science and Arts Occupations by Sex
Within the Management, Business, Science and Arts occupations in Lake Wynonah, the most male-oriented occupations are Computers & Mathematics (100.0%), Architecture & Engineering (100.0%), and Arts, Media & Entertainment (100.0%), while the most female-oriented occupations are Life, Physical & Social Science (100.0%), Education, Arts & Media (100.0%), and Legal Services & Support (100.0%).
| Occupation | Male | Female |
| Management | 65 (46.8%) | 74 (53.2%) |
| Business & Financial | 67 (77.0%) | 20 (23.0%) |
| Computers, Engineering & Science | 88 (93.6%) | 6 (6.4%) |
| Computers & Mathematics | 22 (100.0%) | 0 (0.0%) |
| Architecture & Engineering | 66 (100.0%) | 0 (0.0%) |
| Life, Physical & Social Science | 0 (0.0%) | 6 (100.0%) |
| Community & Social Service | 29 (20.3%) | 114 (79.7%) |
| Education, Arts & Media | 0 (0.0%) | 6 (100.0%) |
| Legal Services & Support | 0 (0.0%) | 5 (100.0%) |
| Education Instruction & Library | 5 (4.6%) | 103 (95.4%) |
| Arts, Media & Entertainment | 24 (100.0%) | 0 (0.0%) |
| Health Diagnosing & Treating | 43 (34.7%) | 81 (65.3%) |
| Health Technologists | 43 (40.2%) | 64 (59.8%) |
| Total (Category) | 292 (49.7%) | 295 (50.3%) |
| Total (Overall) | 812 (54.1%) | 689 (45.9%) |
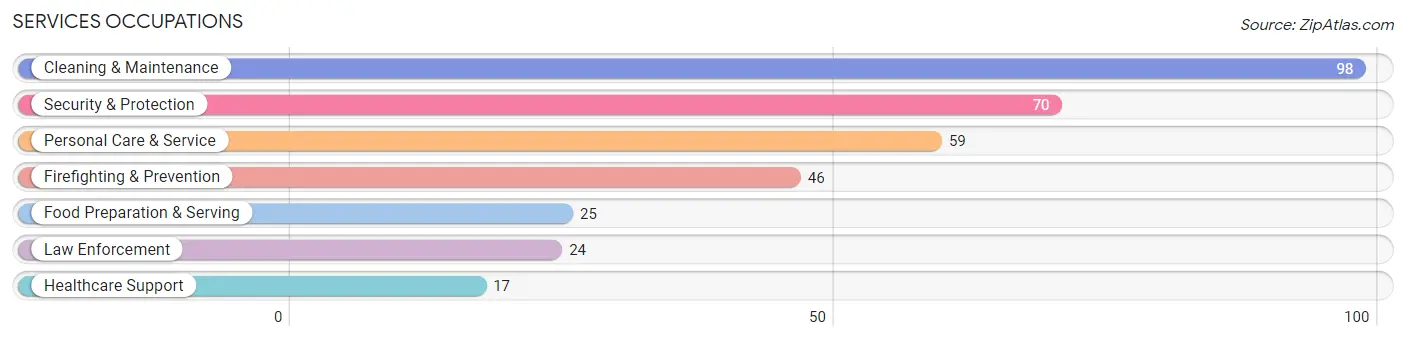
Services Occupations
The most common Services occupations in Lake Wynonah are Cleaning & Maintenance (98 | 6.5%), Security & Protection (70 | 4.7%), Personal Care & Service (59 | 3.9%), Firefighting & Prevention (46 | 3.1%), and Food Preparation & Serving (25 | 1.7%).
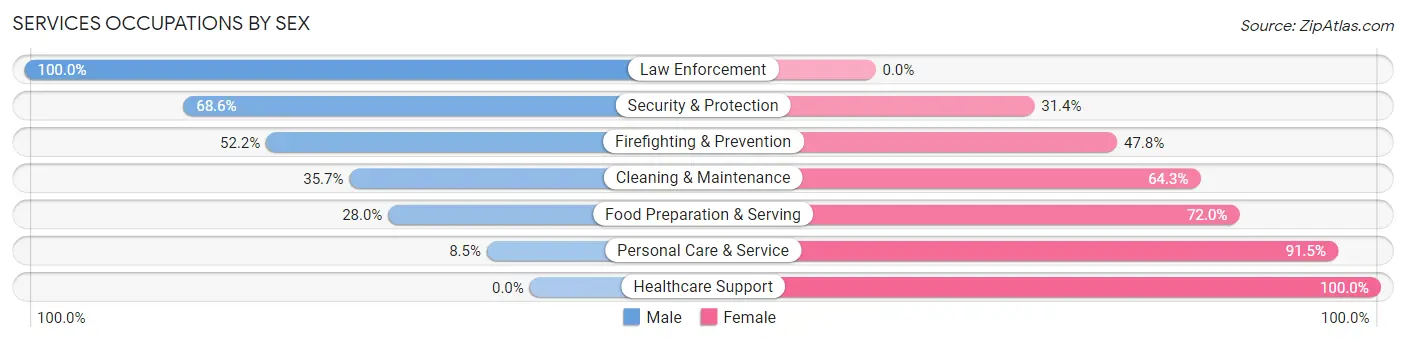
Services Occupations by Sex
Within the Services occupations in Lake Wynonah, the most male-oriented occupations are Law Enforcement (100.0%), Security & Protection (68.6%), and Firefighting & Prevention (52.2%), while the most female-oriented occupations are Healthcare Support (100.0%), Personal Care & Service (91.5%), and Food Preparation & Serving (72.0%).
| Occupation | Male | Female |
| Healthcare Support | 0 (0.0%) | 17 (100.0%) |
| Security & Protection | 48 (68.6%) | 22 (31.4%) |
| Firefighting & Prevention | 24 (52.2%) | 22 (47.8%) |
| Law Enforcement | 24 (100.0%) | 0 (0.0%) |
| Food Preparation & Serving | 7 (28.0%) | 18 (72.0%) |
| Cleaning & Maintenance | 35 (35.7%) | 63 (64.3%) |
| Personal Care & Service | 5 (8.5%) | 54 (91.5%) |
| Total (Category) | 95 (35.3%) | 174 (64.7%) |
| Total (Overall) | 812 (54.1%) | 689 (45.9%) |
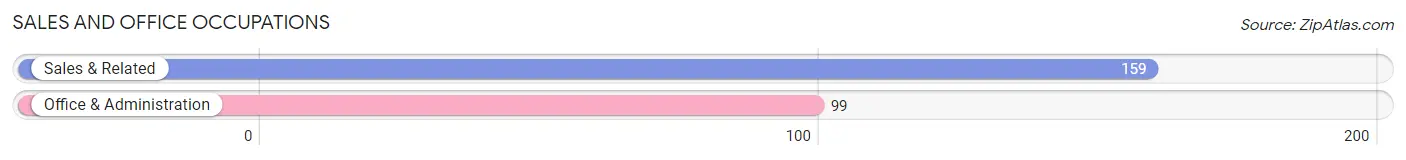
Sales and Office Occupations
The most common Sales and Office occupations in Lake Wynonah are Sales & Related (159 | 10.6%), and Office & Administration (99 | 6.6%).
Sales and Office Occupations by Sex
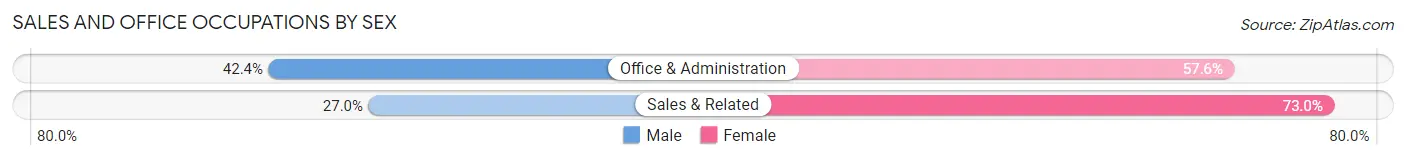
| Occupation | Male | Female |
| Sales & Related | 43 (27.0%) | 116 (73.0%) |
| Office & Administration | 42 (42.4%) | 57 (57.6%) |
| Total (Category) | 85 (33.0%) | 173 (67.0%) |
| Total (Overall) | 812 (54.1%) | 689 (45.9%) |
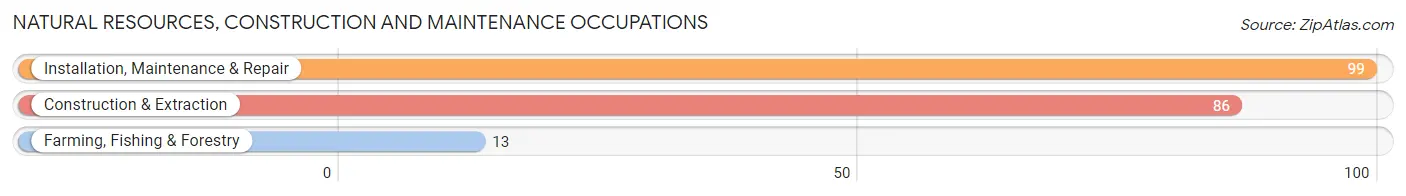
Natural Resources, Construction and Maintenance Occupations
The most common Natural Resources, Construction and Maintenance occupations in Lake Wynonah are Installation, Maintenance & Repair (99 | 6.6%), Construction & Extraction (86 | 5.7%), and Farming, Fishing & Forestry (13 | 0.9%).
Natural Resources, Construction and Maintenance Occupations by Sex
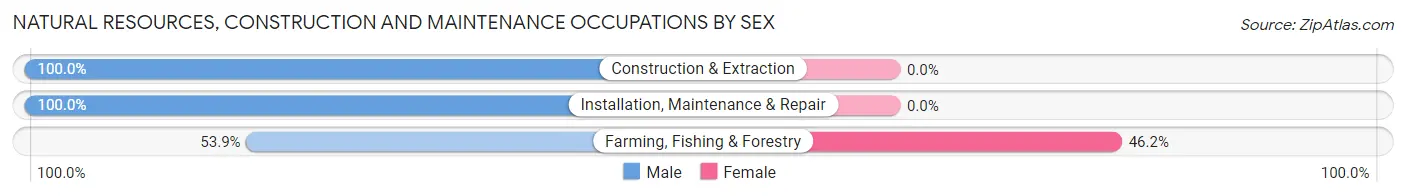
| Occupation | Male | Female |
| Farming, Fishing & Forestry | 7 (53.8%) | 6 (46.2%) |
| Construction & Extraction | 86 (100.0%) | 0 (0.0%) |
| Installation, Maintenance & Repair | 99 (100.0%) | 0 (0.0%) |
| Total (Category) | 192 (97.0%) | 6 (3.0%) |
| Total (Overall) | 812 (54.1%) | 689 (45.9%) |
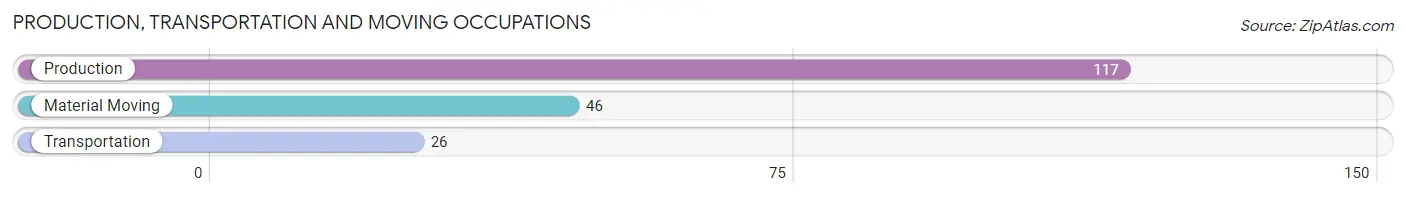
Production, Transportation and Moving Occupations
The most common Production, Transportation and Moving occupations in Lake Wynonah are Production (117 | 7.8%), Material Moving (46 | 3.1%), and Transportation (26 | 1.7%).
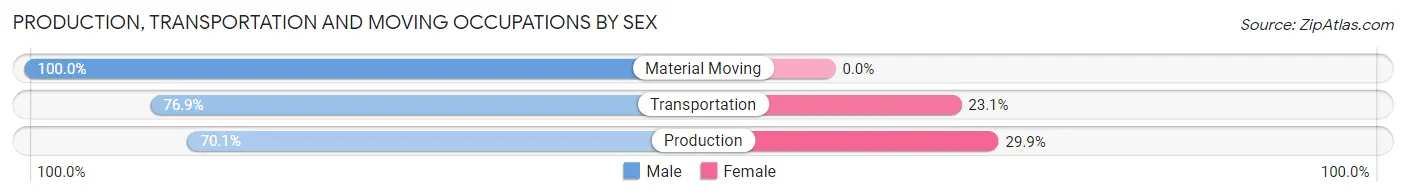
Production, Transportation and Moving Occupations by Sex
| Occupation | Male | Female |
| Production | 82 (70.1%) | 35 (29.9%) |
| Transportation | 20 (76.9%) | 6 (23.1%) |
| Material Moving | 46 (100.0%) | 0 (0.0%) |
| Total (Category) | 148 (78.3%) | 41 (21.7%) |
| Total (Overall) | 812 (54.1%) | 689 (45.9%) |
Employment Industries by Sex in Lake Wynonah
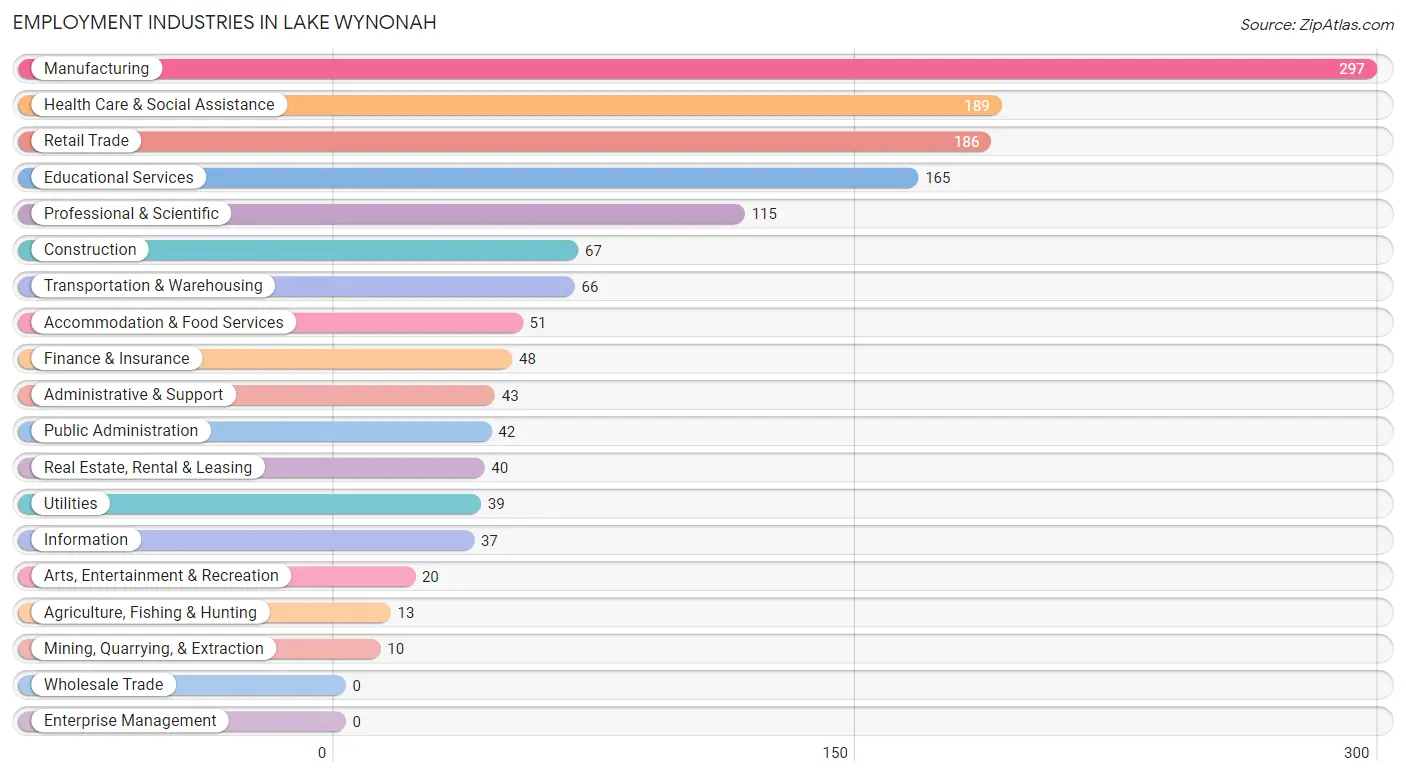
Employment Industries in Lake Wynonah
The major employment industries in Lake Wynonah include Manufacturing (297 | 19.8%), Health Care & Social Assistance (189 | 12.6%), Retail Trade (186 | 12.4%), Educational Services (165 | 11.0%), and Professional & Scientific (115 | 7.7%).
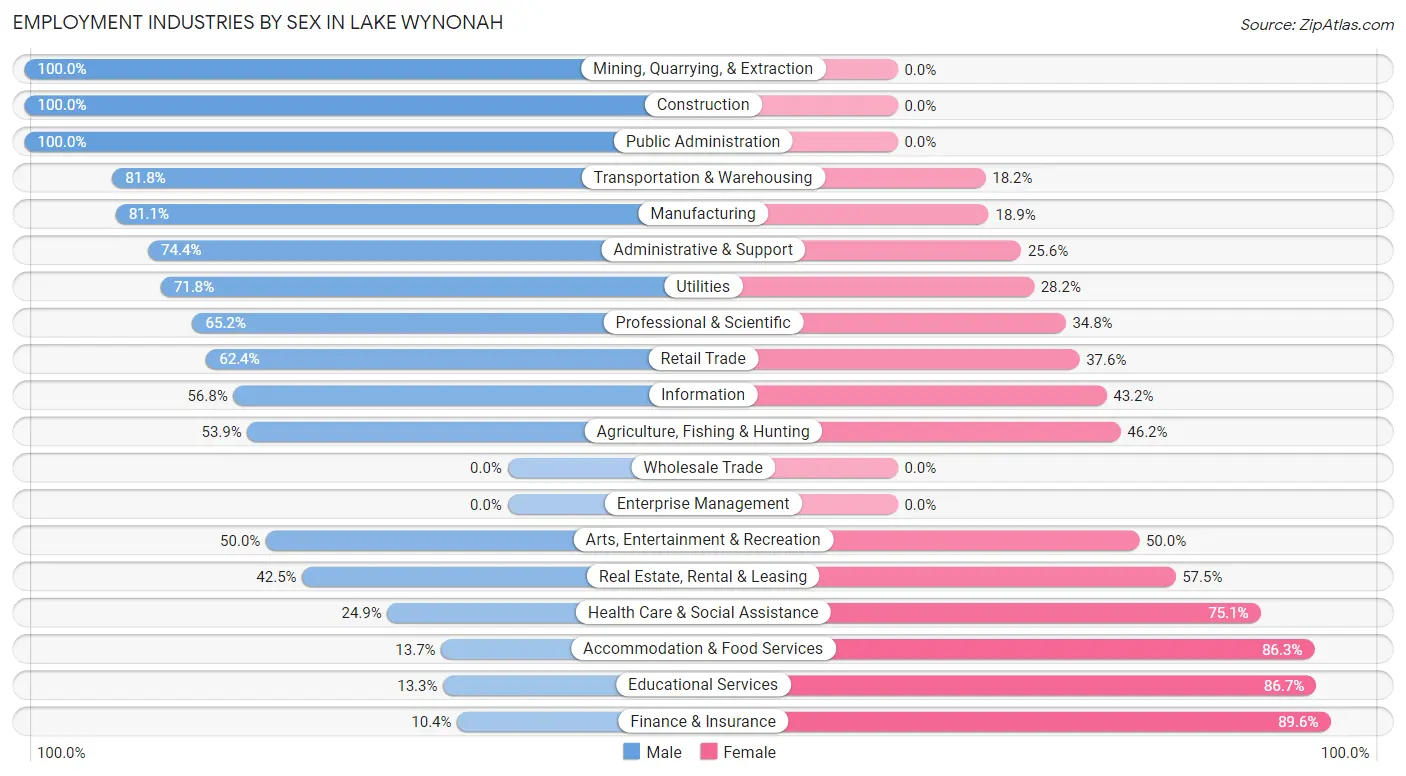
Employment Industries by Sex in Lake Wynonah
The Lake Wynonah industries that see more men than women are Mining, Quarrying, & Extraction (100.0%), Construction (100.0%), and Public Administration (100.0%), whereas the industries that tend to have a higher number of women are Finance & Insurance (89.6%), Educational Services (86.7%), and Accommodation & Food Services (86.3%).
| Industry | Male | Female |
| Agriculture, Fishing & Hunting | 7 (53.8%) | 6 (46.2%) |
| Mining, Quarrying, & Extraction | 10 (100.0%) | 0 (0.0%) |
| Construction | 67 (100.0%) | 0 (0.0%) |
| Manufacturing | 241 (81.1%) | 56 (18.9%) |
| Wholesale Trade | 0 (0.0%) | 0 (0.0%) |
| Retail Trade | 116 (62.4%) | 70 (37.6%) |
| Transportation & Warehousing | 54 (81.8%) | 12 (18.2%) |
| Utilities | 28 (71.8%) | 11 (28.2%) |
| Information | 21 (56.8%) | 16 (43.2%) |
| Finance & Insurance | 5 (10.4%) | 43 (89.6%) |
| Real Estate, Rental & Leasing | 17 (42.5%) | 23 (57.5%) |
| Professional & Scientific | 75 (65.2%) | 40 (34.8%) |
| Enterprise Management | 0 (0.0%) | 0 (0.0%) |
| Administrative & Support | 32 (74.4%) | 11 (25.6%) |
| Educational Services | 22 (13.3%) | 143 (86.7%) |
| Health Care & Social Assistance | 47 (24.9%) | 142 (75.1%) |
| Arts, Entertainment & Recreation | 10 (50.0%) | 10 (50.0%) |
| Accommodation & Food Services | 7 (13.7%) | 44 (86.3%) |
| Public Administration | 42 (100.0%) | 0 (0.0%) |
| Total | 812 (54.1%) | 689 (45.9%) |
Education in Lake Wynonah
School Enrollment in Lake Wynonah
The most common levels of schooling among the 730 students in Lake Wynonah are high school (242 | 33.2%), middle school (149 | 20.4%), and elementary school (144 | 19.7%).
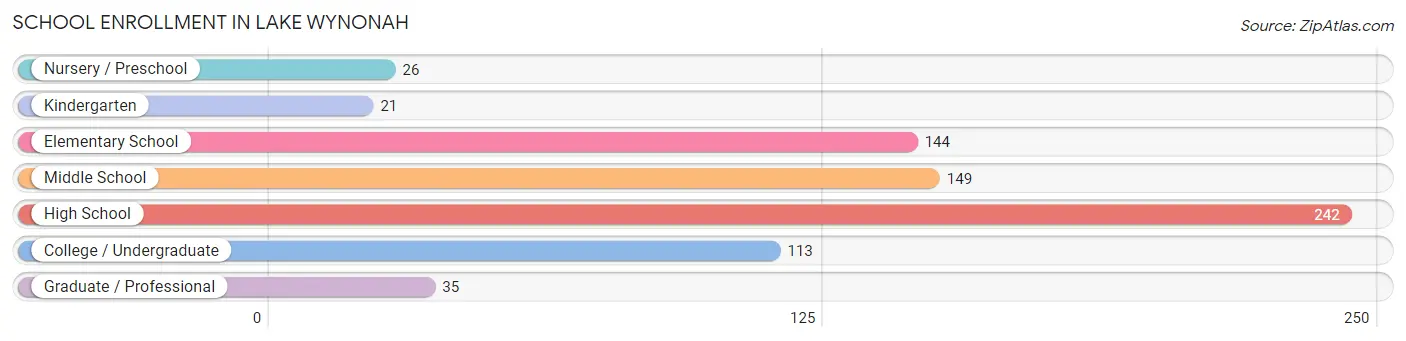
| School Level | # Students | % Students |
| Nursery / Preschool | 26 | 3.6% |
| Kindergarten | 21 | 2.9% |
| Elementary School | 144 | 19.7% |
| Middle School | 149 | 20.4% |
| High School | 242 | 33.2% |
| College / Undergraduate | 113 | 15.5% |
| Graduate / Professional | 35 | 4.8% |
| Total | 730 | 100.0% |
School Enrollment by Age by Funding Source in Lake Wynonah
Out of a total of 730 students who are enrolled in schools in Lake Wynonah, 126 (17.3%) attend a private institution, while the remaining 604 (82.7%) are enrolled in public schools. The age group of 35 years and over has the highest likelihood of being enrolled in private schools, with 35 (64.8% in the age bracket) enrolled. Conversely, the age group of 3 to 4 year olds has the lowest likelihood of being enrolled in a private school, with 5 (100.0% in the age bracket) attending a public institution.
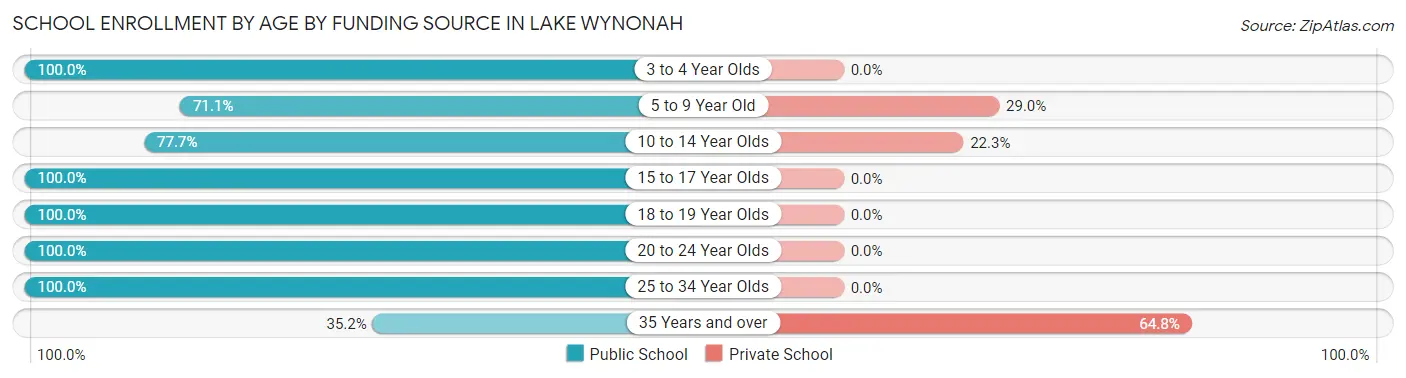
| Age Bracket | Public School | Private School |
| 3 to 4 Year Olds | 5 (100.0%) | 0 (0.0%) |
| 5 to 9 Year Old | 108 (71.1%) | 44 (28.9%) |
| 10 to 14 Year Olds | 164 (77.7%) | 47 (22.3%) |
| 15 to 17 Year Olds | 177 (100.0%) | 0 (0.0%) |
| 18 to 19 Year Olds | 43 (100.0%) | 0 (0.0%) |
| 20 to 24 Year Olds | 61 (100.0%) | 0 (0.0%) |
| 25 to 34 Year Olds | 27 (100.0%) | 0 (0.0%) |
| 35 Years and over | 19 (35.2%) | 35 (64.8%) |
| Total | 604 (82.7%) | 126 (17.3%) |
Educational Attainment by Field of Study in Lake Wynonah
Business (203 | 22.1%), education (186 | 20.2%), science & technology (83 | 9.0%), physical & health sciences (76 | 8.3%), and engineering (75 | 8.2%) are the most common fields of study among 920 individuals in Lake Wynonah who have obtained a bachelor's degree or higher.
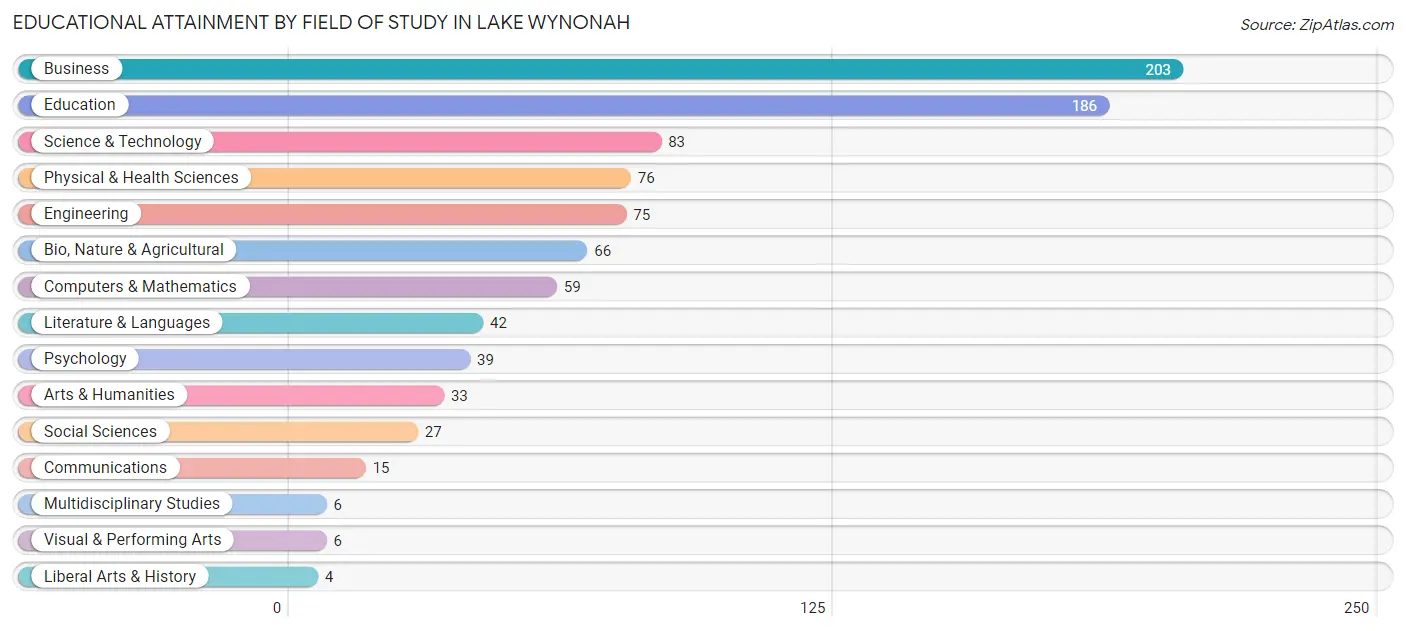
| Field of Study | # Graduates | % Graduates |
| Computers & Mathematics | 59 | 6.4% |
| Bio, Nature & Agricultural | 66 | 7.2% |
| Physical & Health Sciences | 76 | 8.3% |
| Psychology | 39 | 4.2% |
| Social Sciences | 27 | 2.9% |
| Engineering | 75 | 8.2% |
| Multidisciplinary Studies | 6 | 0.6% |
| Science & Technology | 83 | 9.0% |
| Business | 203 | 22.1% |
| Education | 186 | 20.2% |
| Literature & Languages | 42 | 4.6% |
| Liberal Arts & History | 4 | 0.4% |
| Visual & Performing Arts | 6 | 0.6% |
| Communications | 15 | 1.6% |
| Arts & Humanities | 33 | 3.6% |
| Total | 920 | 100.0% |
Transportation & Commute in Lake Wynonah
Vehicle Availability by Sex in Lake Wynonah
The most prevalent vehicle ownership categories in Lake Wynonah are males with 3 vehicles (345, accounting for 42.7%) and females with 3 vehicles (282, making up 50.5%).
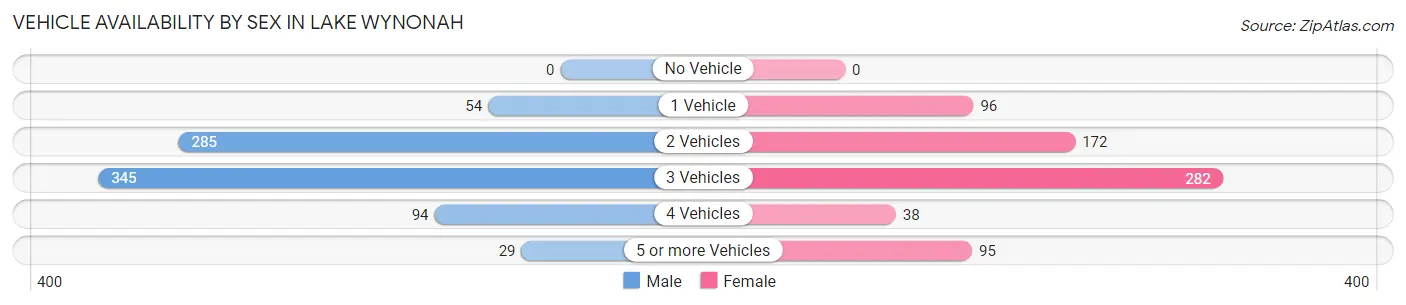
| Vehicles Available | Male | Female |
| No Vehicle | 0 (0.0%) | 0 (0.0%) |
| 1 Vehicle | 54 (6.7%) | 96 (14.1%) |
| 2 Vehicles | 285 (35.3%) | 172 (25.2%) |
| 3 Vehicles | 345 (42.7%) | 282 (41.3%) |
| 4 Vehicles | 94 (11.7%) | 38 (5.6%) |
| 5 or more Vehicles | 29 (3.6%) | 95 (13.9%) |
| Total | 807 (100.0%) | 683 (100.0%) |
Commute Time in Lake Wynonah
The most frequently occuring commute durations in Lake Wynonah are 15 to 19 minutes (222 commuters, 16.8%), 45 to 59 minutes (192 commuters, 14.5%), and 25 to 29 minutes (191 commuters, 14.4%).
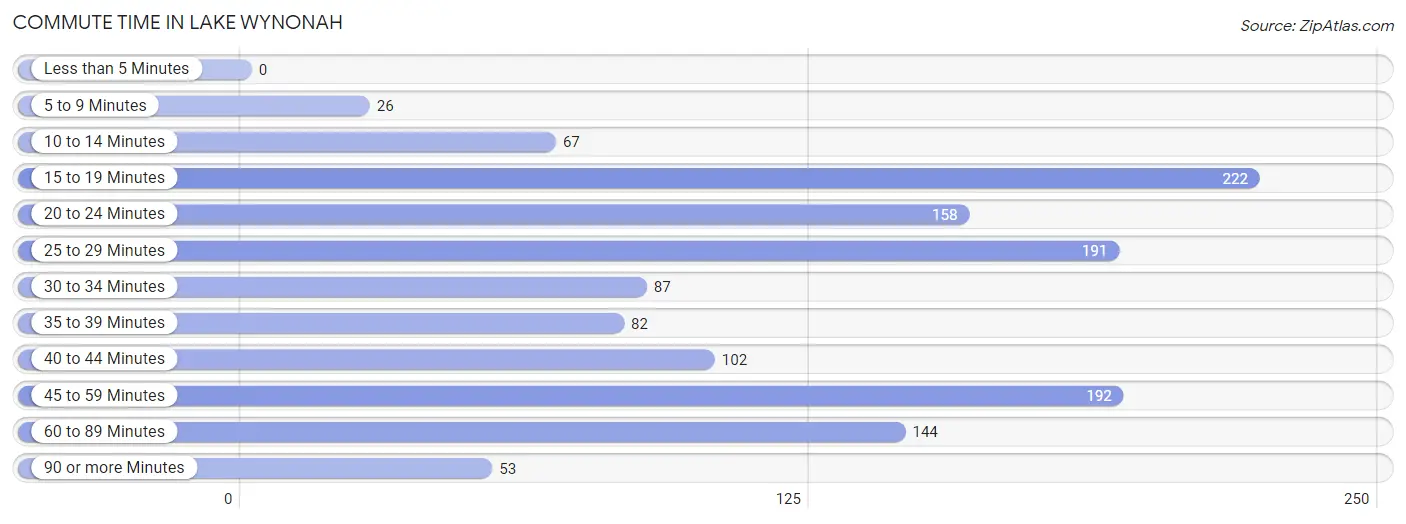
| Commute Time | # Commuters | % Commuters |
| Less than 5 Minutes | 0 | 0.0% |
| 5 to 9 Minutes | 26 | 2.0% |
| 10 to 14 Minutes | 67 | 5.1% |
| 15 to 19 Minutes | 222 | 16.8% |
| 20 to 24 Minutes | 158 | 11.9% |
| 25 to 29 Minutes | 191 | 14.4% |
| 30 to 34 Minutes | 87 | 6.6% |
| 35 to 39 Minutes | 82 | 6.2% |
| 40 to 44 Minutes | 102 | 7.7% |
| 45 to 59 Minutes | 192 | 14.5% |
| 60 to 89 Minutes | 144 | 10.9% |
| 90 or more Minutes | 53 | 4.0% |
Commute Time by Sex in Lake Wynonah
The most common commute times in Lake Wynonah are 15 to 19 minutes (166 commuters, 23.2%) for males and 25 to 29 minutes (139 commuters, 22.9%) for females.
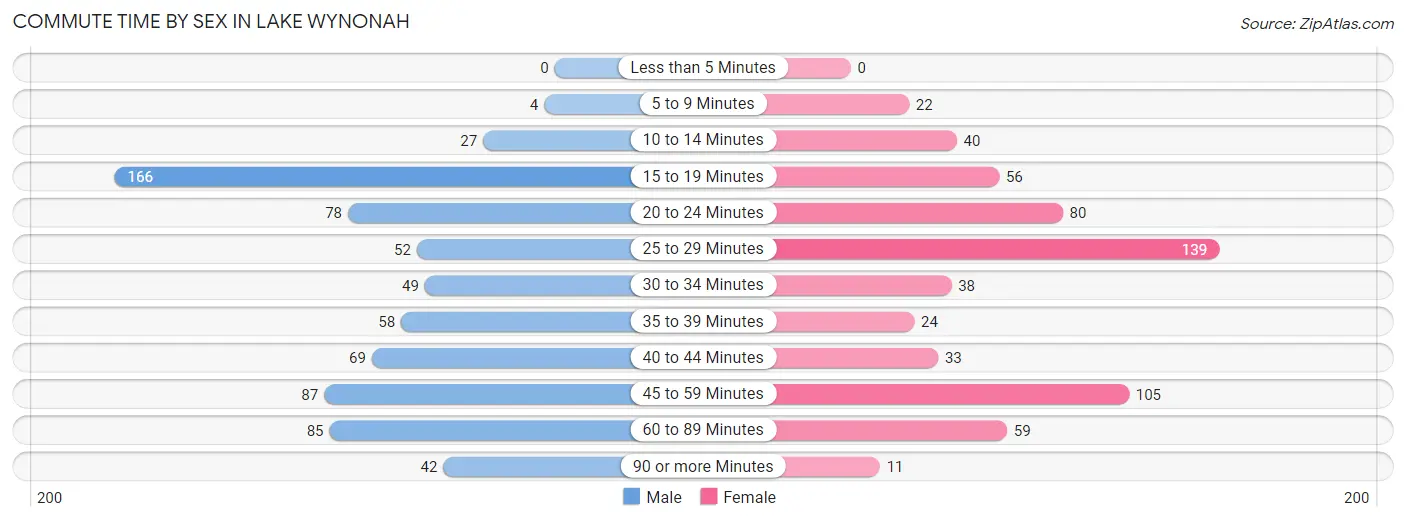
| Commute Time | Male | Female |
| Less than 5 Minutes | 0 (0.0%) | 0 (0.0%) |
| 5 to 9 Minutes | 4 (0.6%) | 22 (3.6%) |
| 10 to 14 Minutes | 27 (3.8%) | 40 (6.6%) |
| 15 to 19 Minutes | 166 (23.2%) | 56 (9.2%) |
| 20 to 24 Minutes | 78 (10.9%) | 80 (13.2%) |
| 25 to 29 Minutes | 52 (7.2%) | 139 (22.9%) |
| 30 to 34 Minutes | 49 (6.8%) | 38 (6.3%) |
| 35 to 39 Minutes | 58 (8.1%) | 24 (4.0%) |
| 40 to 44 Minutes | 69 (9.6%) | 33 (5.4%) |
| 45 to 59 Minutes | 87 (12.1%) | 105 (17.3%) |
| 60 to 89 Minutes | 85 (11.8%) | 59 (9.7%) |
| 90 or more Minutes | 42 (5.9%) | 11 (1.8%) |
Time of Departure to Work by Sex in Lake Wynonah
The most frequent times of departure to work in Lake Wynonah are 12:00 AM to 4:59 AM (198, 27.6%) for males and 7:00 AM to 7:29 AM (204, 33.6%) for females.
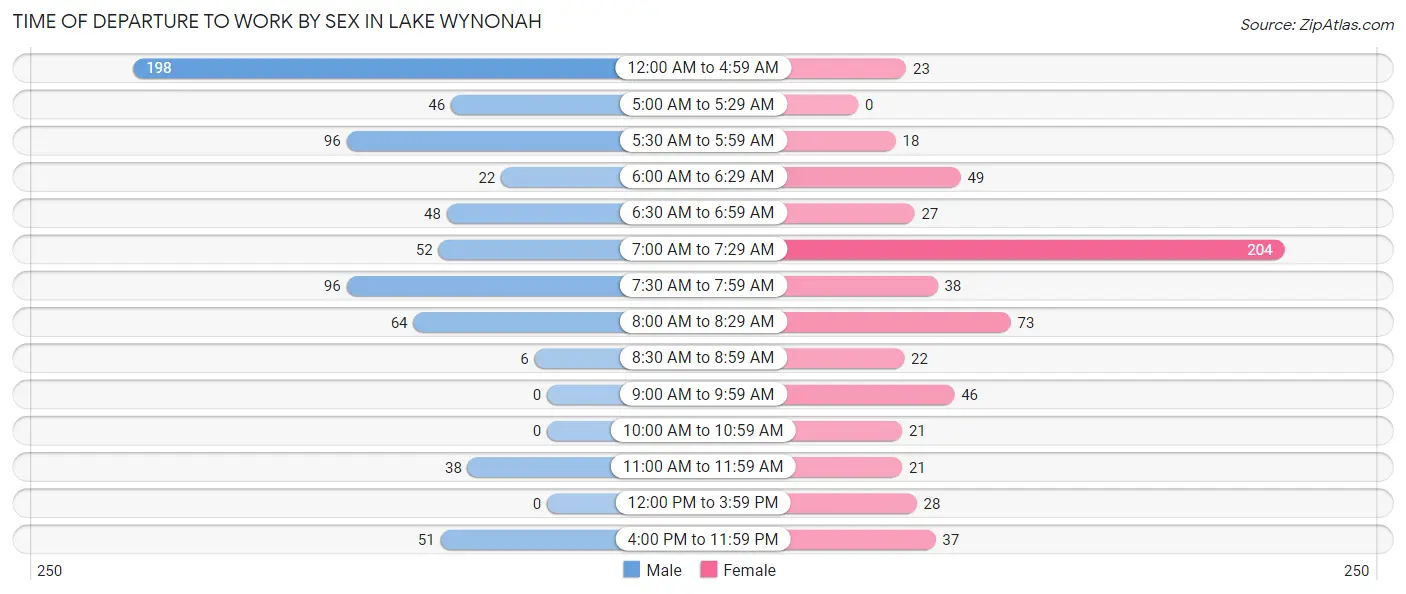
| Time of Departure | Male | Female |
| 12:00 AM to 4:59 AM | 198 (27.6%) | 23 (3.8%) |
| 5:00 AM to 5:29 AM | 46 (6.4%) | 0 (0.0%) |
| 5:30 AM to 5:59 AM | 96 (13.4%) | 18 (3.0%) |
| 6:00 AM to 6:29 AM | 22 (3.1%) | 49 (8.1%) |
| 6:30 AM to 6:59 AM | 48 (6.7%) | 27 (4.4%) |
| 7:00 AM to 7:29 AM | 52 (7.2%) | 204 (33.6%) |
| 7:30 AM to 7:59 AM | 96 (13.4%) | 38 (6.3%) |
| 8:00 AM to 8:29 AM | 64 (8.9%) | 73 (12.0%) |
| 8:30 AM to 8:59 AM | 6 (0.8%) | 22 (3.6%) |
| 9:00 AM to 9:59 AM | 0 (0.0%) | 46 (7.6%) |
| 10:00 AM to 10:59 AM | 0 (0.0%) | 21 (3.5%) |
| 11:00 AM to 11:59 AM | 38 (5.3%) | 21 (3.5%) |
| 12:00 PM to 3:59 PM | 0 (0.0%) | 28 (4.6%) |
| 4:00 PM to 11:59 PM | 51 (7.1%) | 37 (6.1%) |
| Total | 717 (100.0%) | 607 (100.0%) |
Housing Occupancy in Lake Wynonah
Occupancy by Ownership in Lake Wynonah
Of the total 1,129 dwellings in Lake Wynonah, owner-occupied units account for 1,118 (99.0%), while renter-occupied units make up 11 (1.0%).
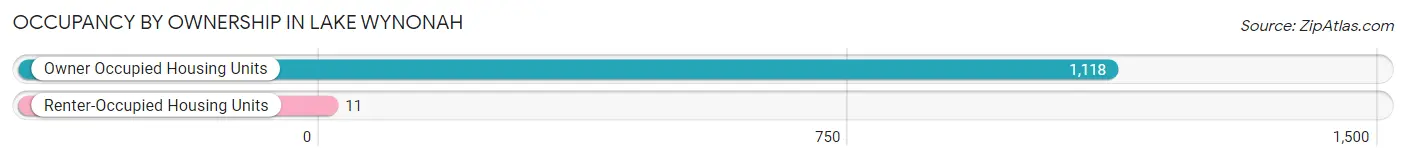
| Occupancy | # Housing Units | % Housing Units |
| Owner Occupied Housing Units | 1,118 | 99.0% |
| Renter-Occupied Housing Units | 11 | 1.0% |
| Total Occupied Housing Units | 1,129 | 100.0% |
Occupancy by Household Size in Lake Wynonah
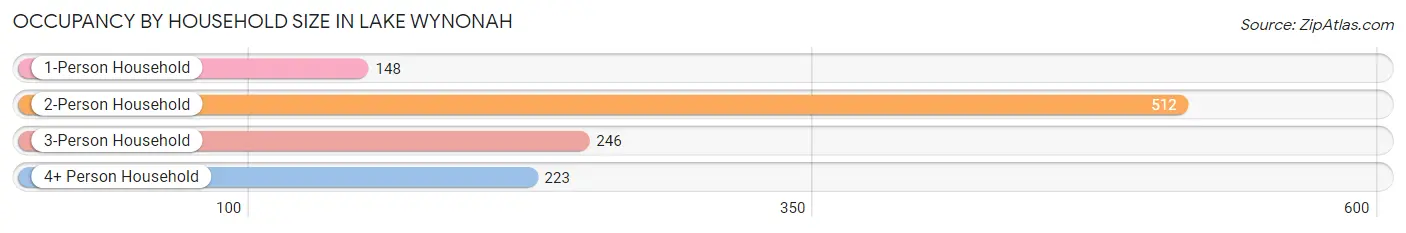
| Household Size | # Housing Units | % Housing Units |
| 1-Person Household | 148 | 13.1% |
| 2-Person Household | 512 | 45.4% |
| 3-Person Household | 246 | 21.8% |
| 4+ Person Household | 223 | 19.8% |
| Total Housing Units | 1,129 | 100.0% |
Occupancy by Ownership by Household Size in Lake Wynonah
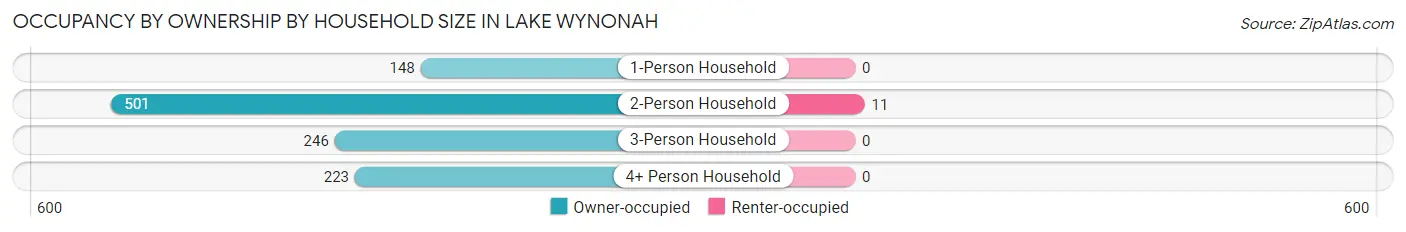
| Household Size | Owner-occupied | Renter-occupied |
| 1-Person Household | 148 (100.0%) | 0 (0.0%) |
| 2-Person Household | 501 (97.9%) | 11 (2.1%) |
| 3-Person Household | 246 (100.0%) | 0 (0.0%) |
| 4+ Person Household | 223 (100.0%) | 0 (0.0%) |
| Total Housing Units | 1,118 (99.0%) | 11 (1.0%) |
Occupancy by Educational Attainment in Lake Wynonah
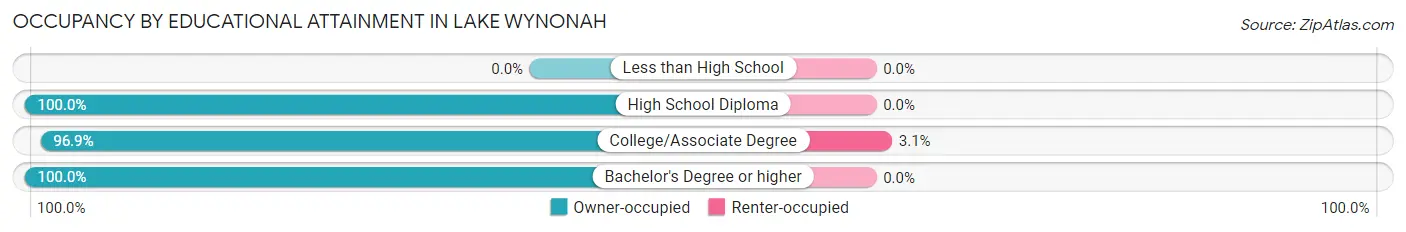
| Household Size | Owner-occupied | Renter-occupied |
| Less than High School | 0 (0.0%) | 0 (0.0%) |
| High School Diploma | 270 (100.0%) | 0 (0.0%) |
| College/Associate Degree | 343 (96.9%) | 11 (3.1%) |
| Bachelor's Degree or higher | 505 (100.0%) | 0 (0.0%) |
Occupancy by Age of Householder in Lake Wynonah
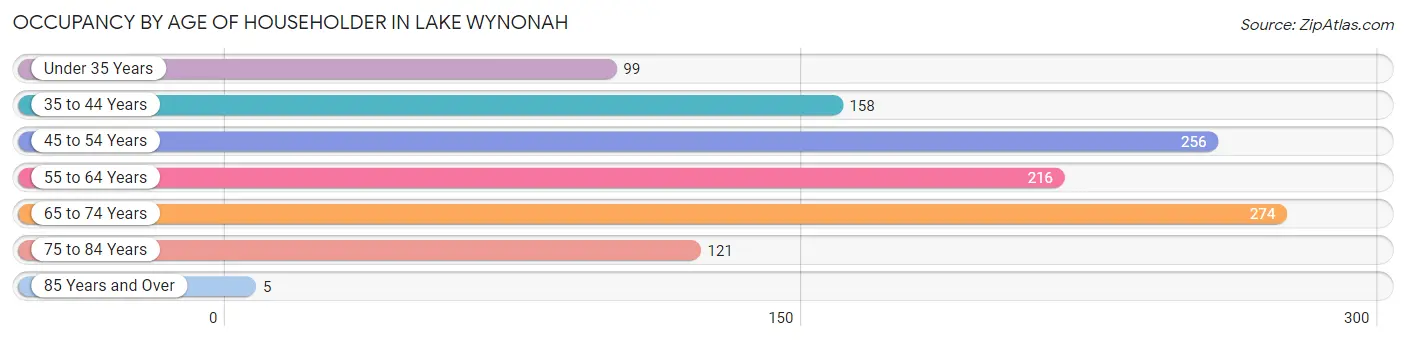
| Age Bracket | # Households | % Households |
| Under 35 Years | 99 | 8.8% |
| 35 to 44 Years | 158 | 14.0% |
| 45 to 54 Years | 256 | 22.7% |
| 55 to 64 Years | 216 | 19.1% |
| 65 to 74 Years | 274 | 24.3% |
| 75 to 84 Years | 121 | 10.7% |
| 85 Years and Over | 5 | 0.4% |
| Total | 1,129 | 100.0% |
Housing Finances in Lake Wynonah
Median Income by Occupancy in Lake Wynonah
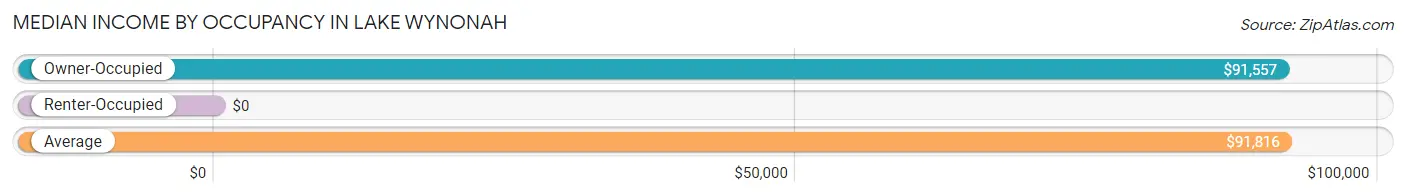
| Occupancy Type | # Households | Median Income |
| Owner-Occupied | 1,118 (99.0%) | $91,557 |
| Renter-Occupied | 11 (1.0%) | $0 |
| Average | 1,129 (100.0%) | $91,816 |
Occupancy by Householder Income Bracket in Lake Wynonah
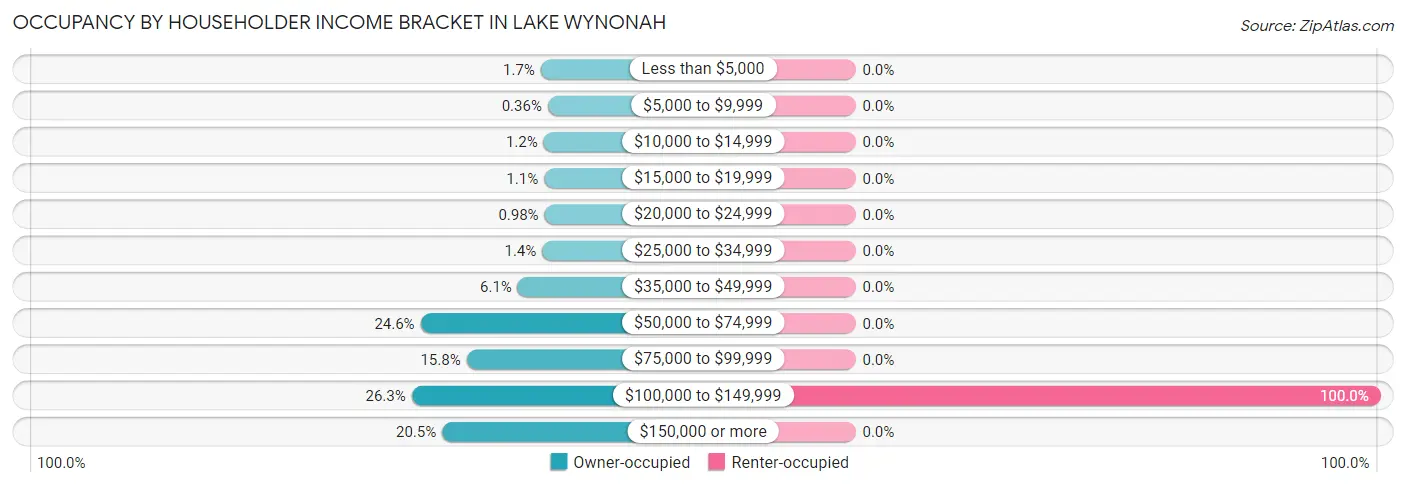
| Income Bracket | Owner-occupied | Renter-occupied |
| Less than $5,000 | 19 (1.7%) | 0 (0.0%) |
| $5,000 to $9,999 | 4 (0.4%) | 0 (0.0%) |
| $10,000 to $14,999 | 13 (1.2%) | 0 (0.0%) |
| $15,000 to $19,999 | 12 (1.1%) | 0 (0.0%) |
| $20,000 to $24,999 | 11 (1.0%) | 0 (0.0%) |
| $25,000 to $34,999 | 16 (1.4%) | 0 (0.0%) |
| $35,000 to $49,999 | 68 (6.1%) | 0 (0.0%) |
| $50,000 to $74,999 | 275 (24.6%) | 0 (0.0%) |
| $75,000 to $99,999 | 177 (15.8%) | 0 (0.0%) |
| $100,000 to $149,999 | 294 (26.3%) | 11 (100.0%) |
| $150,000 or more | 229 (20.5%) | 0 (0.0%) |
| Total | 1,118 (100.0%) | 11 (100.0%) |
Monthly Housing Cost Tiers in Lake Wynonah
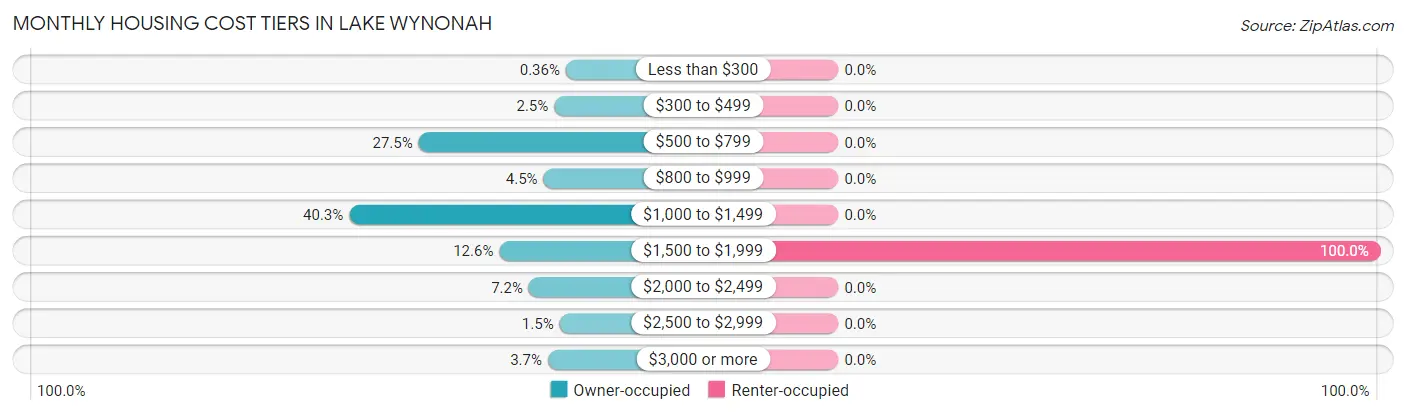
| Monthly Cost | Owner-occupied | Renter-occupied |
| Less than $300 | 4 (0.4%) | 0 (0.0%) |
| $300 to $499 | 28 (2.5%) | 0 (0.0%) |
| $500 to $799 | 307 (27.5%) | 0 (0.0%) |
| $800 to $999 | 50 (4.5%) | 0 (0.0%) |
| $1,000 to $1,499 | 450 (40.3%) | 0 (0.0%) |
| $1,500 to $1,999 | 141 (12.6%) | 11 (100.0%) |
| $2,000 to $2,499 | 80 (7.2%) | 0 (0.0%) |
| $2,500 to $2,999 | 17 (1.5%) | 0 (0.0%) |
| $3,000 or more | 41 (3.7%) | 0 (0.0%) |
| Total | 1,118 (100.0%) | 11 (100.0%) |
Physical Housing Characteristics in Lake Wynonah
Housing Structures in Lake Wynonah
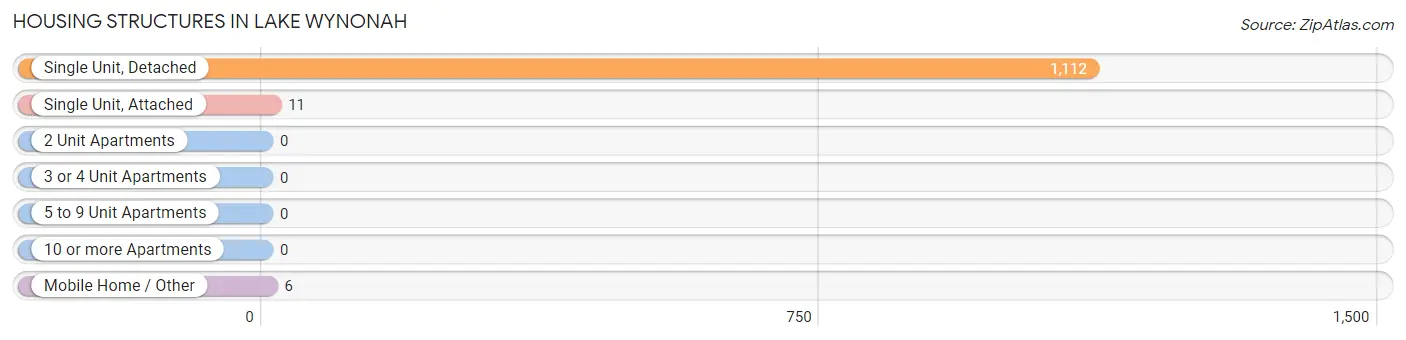
| Structure Type | # Housing Units | % Housing Units |
| Single Unit, Detached | 1,112 | 98.5% |
| Single Unit, Attached | 11 | 1.0% |
| 2 Unit Apartments | 0 | 0.0% |
| 3 or 4 Unit Apartments | 0 | 0.0% |
| 5 to 9 Unit Apartments | 0 | 0.0% |
| 10 or more Apartments | 0 | 0.0% |
| Mobile Home / Other | 6 | 0.5% |
| Total | 1,129 | 100.0% |
Housing Structures by Occupancy in Lake Wynonah
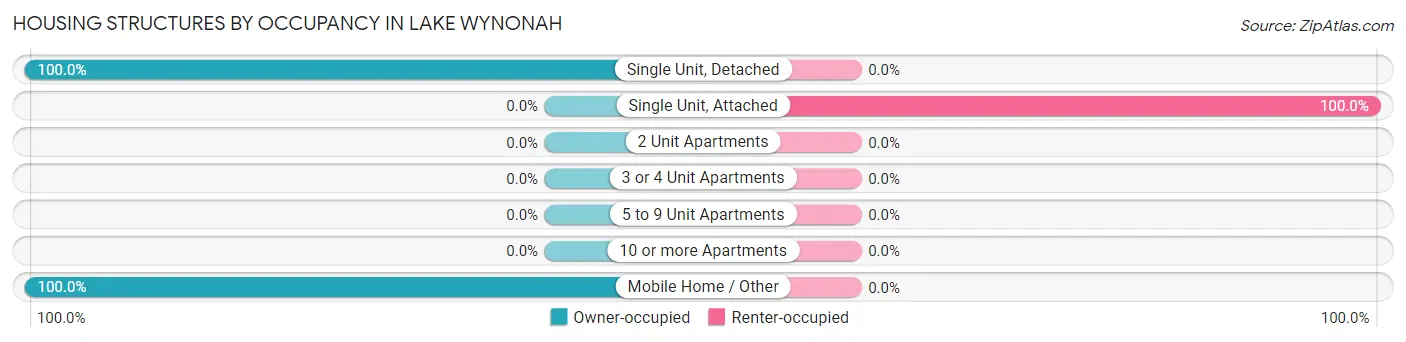
| Structure Type | Owner-occupied | Renter-occupied |
| Single Unit, Detached | 1,112 (100.0%) | 0 (0.0%) |
| Single Unit, Attached | 0 (0.0%) | 11 (100.0%) |
| 2 Unit Apartments | 0 (0.0%) | 0 (0.0%) |
| 3 or 4 Unit Apartments | 0 (0.0%) | 0 (0.0%) |
| 5 to 9 Unit Apartments | 0 (0.0%) | 0 (0.0%) |
| 10 or more Apartments | 0 (0.0%) | 0 (0.0%) |
| Mobile Home / Other | 6 (100.0%) | 0 (0.0%) |
| Total | 1,118 (99.0%) | 11 (1.0%) |
Housing Structures by Number of Rooms in Lake Wynonah
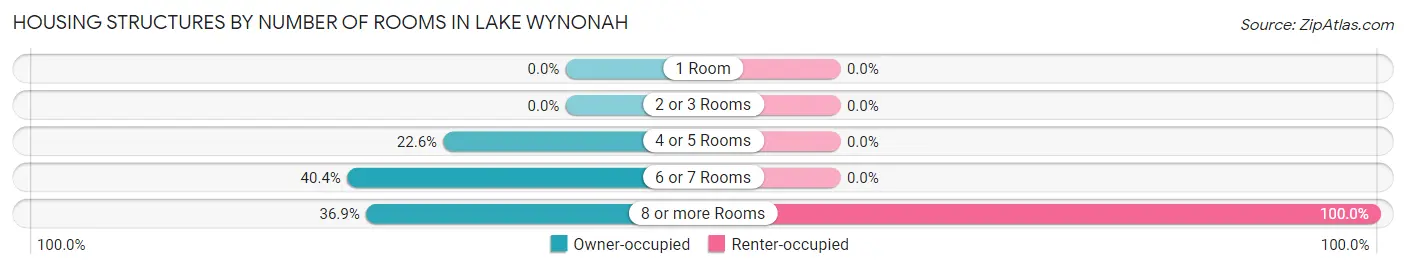
| Number of Rooms | Owner-occupied | Renter-occupied |
| 1 Room | 0 (0.0%) | 0 (0.0%) |
| 2 or 3 Rooms | 0 (0.0%) | 0 (0.0%) |
| 4 or 5 Rooms | 253 (22.6%) | 0 (0.0%) |
| 6 or 7 Rooms | 452 (40.4%) | 0 (0.0%) |
| 8 or more Rooms | 413 (36.9%) | 11 (100.0%) |
| Total | 1,118 (100.0%) | 11 (100.0%) |
Housing Structure by Heating Type in Lake Wynonah
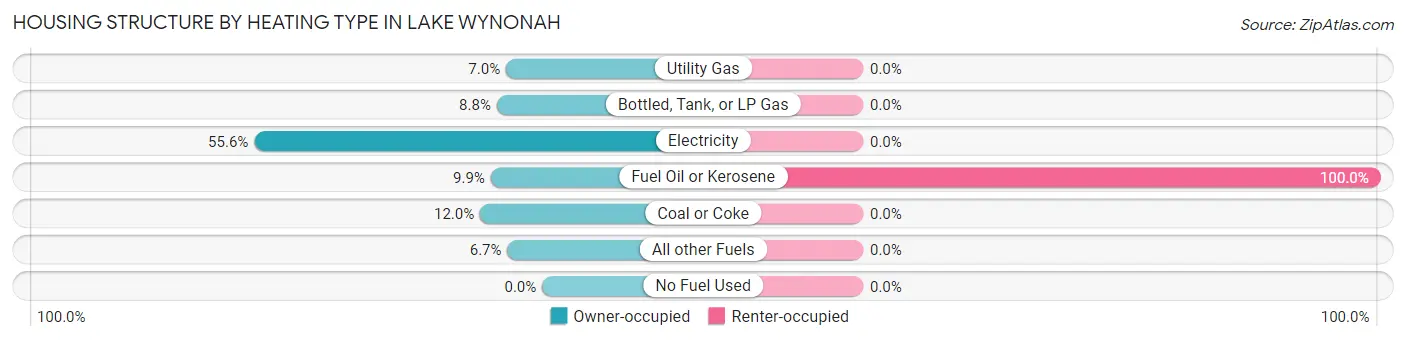
| Heating Type | Owner-occupied | Renter-occupied |
| Utility Gas | 78 (7.0%) | 0 (0.0%) |
| Bottled, Tank, or LP Gas | 98 (8.8%) | 0 (0.0%) |
| Electricity | 622 (55.6%) | 0 (0.0%) |
| Fuel Oil or Kerosene | 111 (9.9%) | 11 (100.0%) |
| Coal or Coke | 134 (12.0%) | 0 (0.0%) |
| All other Fuels | 75 (6.7%) | 0 (0.0%) |
| No Fuel Used | 0 (0.0%) | 0 (0.0%) |
| Total | 1,118 (100.0%) | 11 (100.0%) |
Household Vehicle Usage in Lake Wynonah
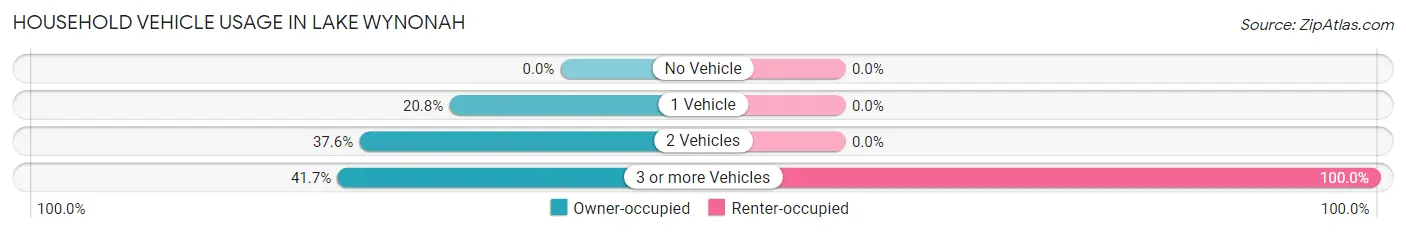
| Vehicles per Household | Owner-occupied | Renter-occupied |
| No Vehicle | 0 (0.0%) | 0 (0.0%) |
| 1 Vehicle | 232 (20.7%) | 0 (0.0%) |
| 2 Vehicles | 420 (37.6%) | 0 (0.0%) |
| 3 or more Vehicles | 466 (41.7%) | 11 (100.0%) |
| Total | 1,118 (100.0%) | 11 (100.0%) |
Real Estate & Mortgages in Lake Wynonah
Real Estate and Mortgage Overview in Lake Wynonah
| Characteristic | Without Mortgage | With Mortgage |
| Housing Units | 384 | 734 |
| Median Property Value | $238,200 | $193,900 |
| Median Household Income | $81,500 | $127 |
| Monthly Housing Costs | $672 | $29 |
| Real Estate Taxes | $4,149 | $4 |
Property Value by Mortgage Status in Lake Wynonah
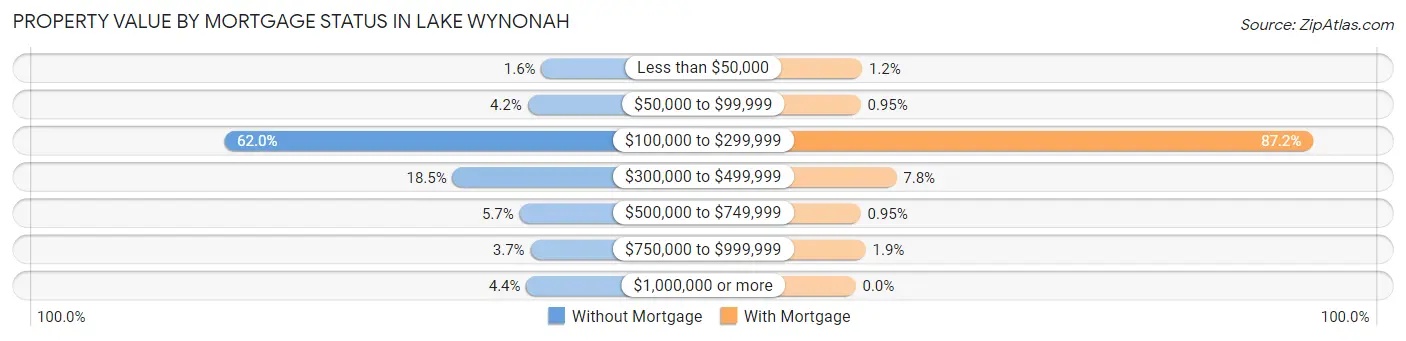
| Property Value | Without Mortgage | With Mortgage |
| Less than $50,000 | 6 (1.6%) | 9 (1.2%) |
| $50,000 to $99,999 | 16 (4.2%) | 7 (0.9%) |
| $100,000 to $299,999 | 238 (62.0%) | 640 (87.2%) |
| $300,000 to $499,999 | 71 (18.5%) | 57 (7.8%) |
| $500,000 to $749,999 | 22 (5.7%) | 7 (0.9%) |
| $750,000 to $999,999 | 14 (3.6%) | 14 (1.9%) |
| $1,000,000 or more | 17 (4.4%) | 0 (0.0%) |
| Total | 384 (100.0%) | 734 (100.0%) |
Household Income by Mortgage Status in Lake Wynonah
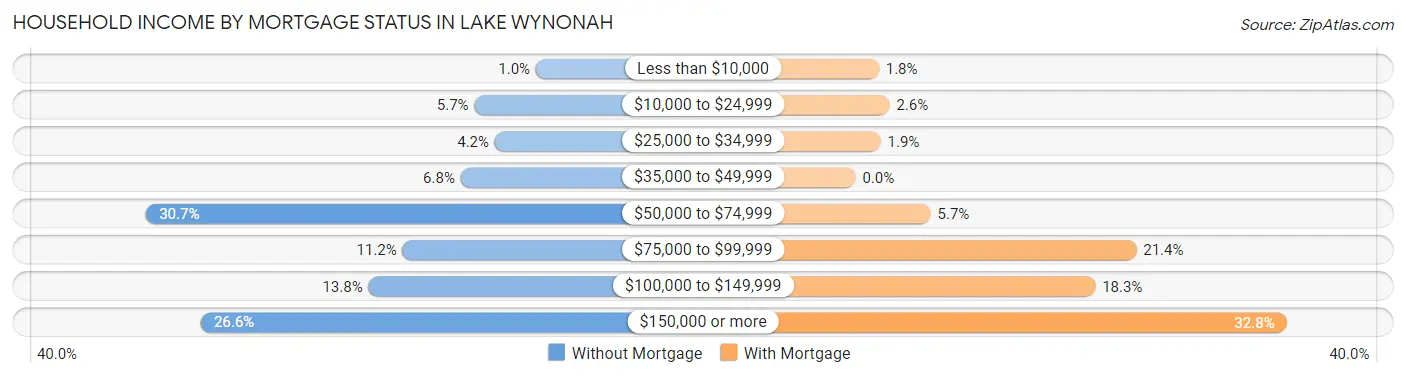
| Household Income | Without Mortgage | With Mortgage |
| Less than $10,000 | 4 (1.0%) | 13 (1.8%) |
| $10,000 to $24,999 | 22 (5.7%) | 19 (2.6%) |
| $25,000 to $34,999 | 16 (4.2%) | 14 (1.9%) |
| $35,000 to $49,999 | 26 (6.8%) | 0 (0.0%) |
| $50,000 to $74,999 | 118 (30.7%) | 42 (5.7%) |
| $75,000 to $99,999 | 43 (11.2%) | 157 (21.4%) |
| $100,000 to $149,999 | 53 (13.8%) | 134 (18.3%) |
| $150,000 or more | 102 (26.6%) | 241 (32.8%) |
| Total | 384 (100.0%) | 734 (100.0%) |
Property Value to Household Income Ratio in Lake Wynonah
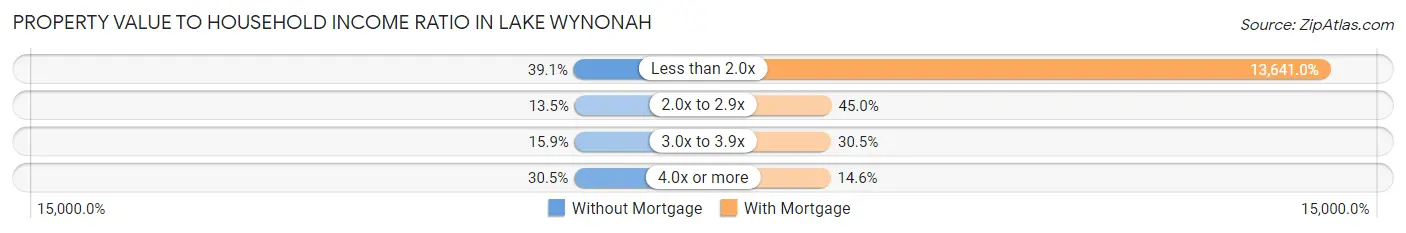
| Value-to-Income Ratio | Without Mortgage | With Mortgage |
| Less than 2.0x | 150 (39.1%) | 100,125 (13,641.0%) |
| 2.0x to 2.9x | 52 (13.5%) | 330 (45.0%) |
| 3.0x to 3.9x | 61 (15.9%) | 224 (30.5%) |
| 4.0x or more | 117 (30.5%) | 107 (14.6%) |
| Total | 384 (100.0%) | 734 (100.0%) |
Real Estate Taxes by Mortgage Status in Lake Wynonah
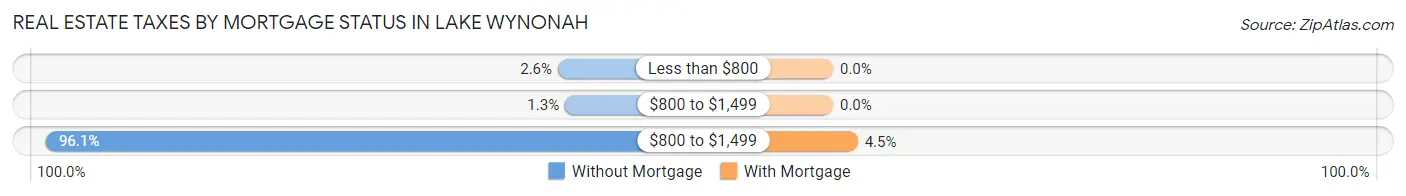
| Property Taxes | Without Mortgage | With Mortgage |
| Less than $800 | 10 (2.6%) | 0 (0.0%) |
| $800 to $1,499 | 5 (1.3%) | 0 (0.0%) |
| $800 to $1,499 | 369 (96.1%) | 33 (4.5%) |
| Total | 384 (100.0%) | 734 (100.0%) |
Health & Disability in Lake Wynonah
Health Insurance Coverage by Age in Lake Wynonah
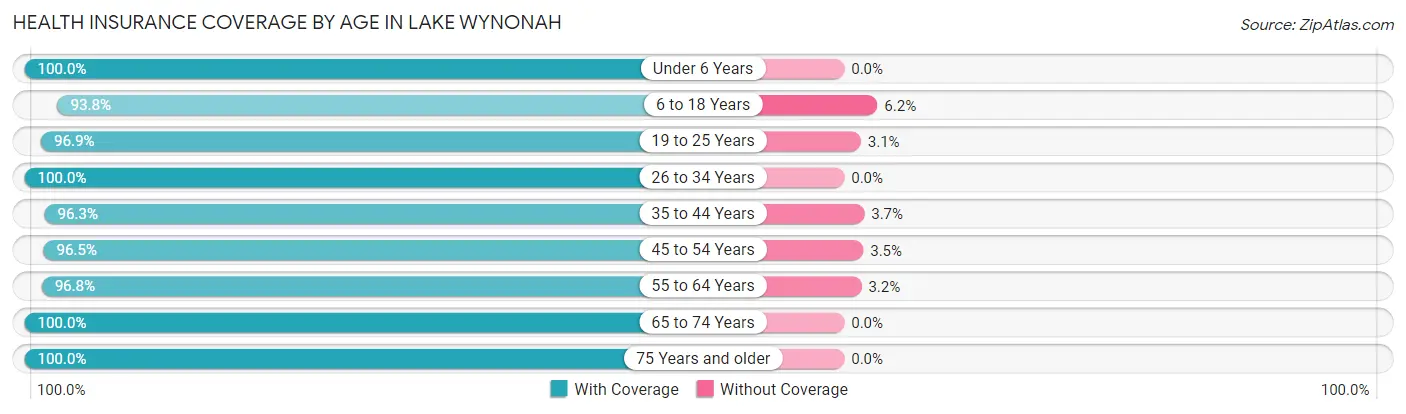
| Age Bracket | With Coverage | Without Coverage |
| Under 6 Years | 108 (100.0%) | 0 (0.0%) |
| 6 to 18 Years | 517 (93.8%) | 34 (6.2%) |
| 19 to 25 Years | 188 (96.9%) | 6 (3.1%) |
| 26 to 34 Years | 195 (100.0%) | 0 (0.0%) |
| 35 to 44 Years | 310 (96.3%) | 12 (3.7%) |
| 45 to 54 Years | 518 (96.5%) | 19 (3.5%) |
| 55 to 64 Years | 333 (96.8%) | 11 (3.2%) |
| 65 to 74 Years | 519 (100.0%) | 0 (0.0%) |
| 75 Years and older | 205 (100.0%) | 0 (0.0%) |
| Total | 2,893 (97.2%) | 82 (2.8%) |
Health Insurance Coverage by Citizenship Status in Lake Wynonah
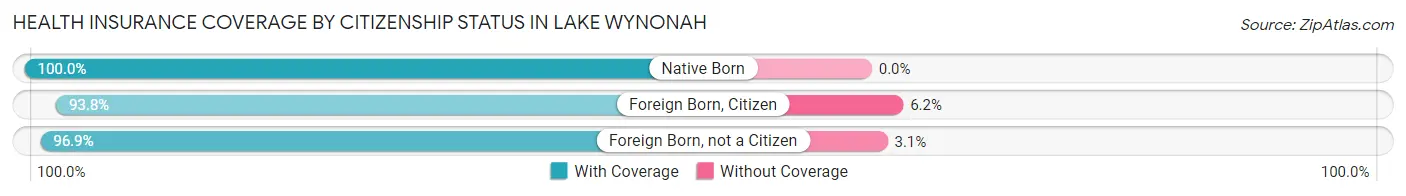
| Citizenship Status | With Coverage | Without Coverage |
| Native Born | 108 (100.0%) | 0 (0.0%) |
| Foreign Born, Citizen | 517 (93.8%) | 34 (6.2%) |
| Foreign Born, not a Citizen | 188 (96.9%) | 6 (3.1%) |
Health Insurance Coverage by Household Income in Lake Wynonah
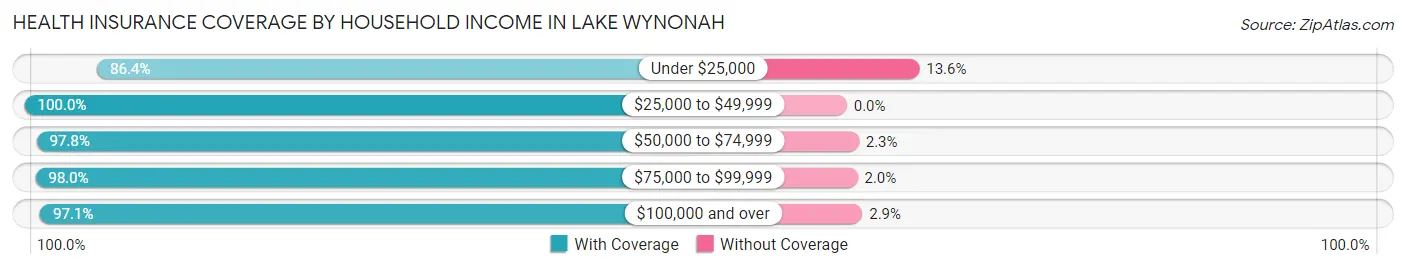
| Household Income | With Coverage | Without Coverage |
| Under $25,000 | 70 (86.4%) | 11 (13.6%) |
| $25,000 to $49,999 | 164 (100.0%) | 0 (0.0%) |
| $50,000 to $74,999 | 566 (97.8%) | 13 (2.2%) |
| $75,000 to $99,999 | 488 (98.0%) | 10 (2.0%) |
| $100,000 and over | 1,605 (97.1%) | 48 (2.9%) |
Public vs Private Health Insurance Coverage by Age in Lake Wynonah
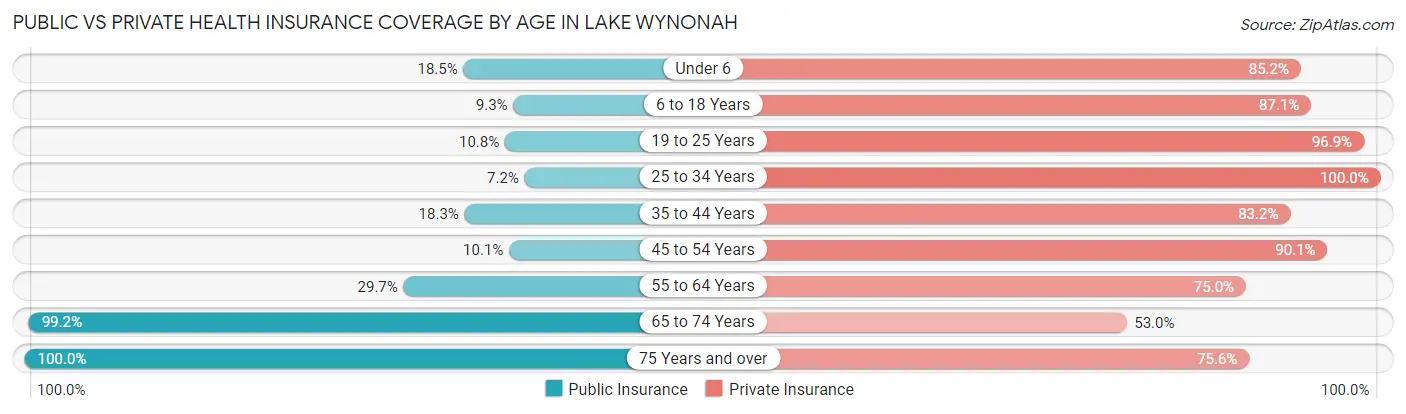
| Age Bracket | Public Insurance | Private Insurance |
| Under 6 | 20 (18.5%) | 92 (85.2%) |
| 6 to 18 Years | 51 (9.3%) | 480 (87.1%) |
| 19 to 25 Years | 21 (10.8%) | 188 (96.9%) |
| 25 to 34 Years | 14 (7.2%) | 195 (100.0%) |
| 35 to 44 Years | 59 (18.3%) | 268 (83.2%) |
| 45 to 54 Years | 54 (10.1%) | 484 (90.1%) |
| 55 to 64 Years | 102 (29.6%) | 258 (75.0%) |
| 65 to 74 Years | 515 (99.2%) | 275 (53.0%) |
| 75 Years and over | 205 (100.0%) | 155 (75.6%) |
| Total | 1,041 (35.0%) | 2,395 (80.5%) |
Disability Status by Sex by Age in Lake Wynonah
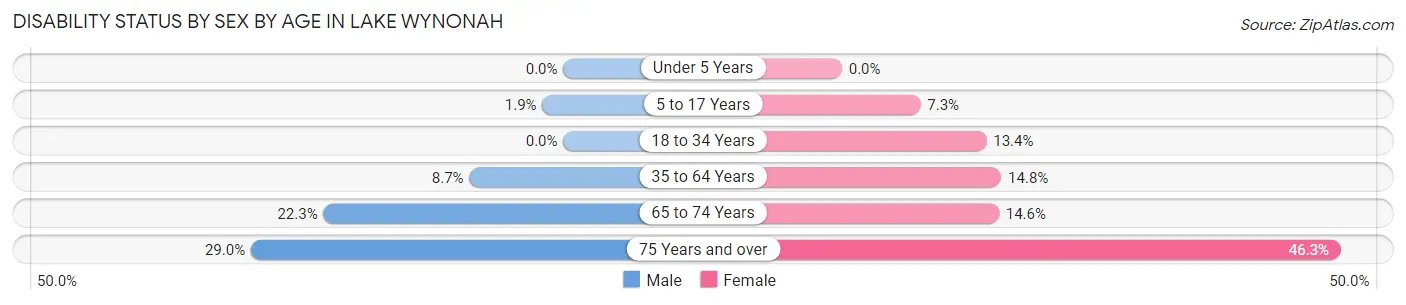
| Age Bracket | Male | Female |
| Under 5 Years | 0 (0.0%) | 0 (0.0%) |
| 5 to 17 Years | 6 (1.9%) | 18 (7.3%) |
| 18 to 34 Years | 0 (0.0%) | 33 (13.4%) |
| 35 to 64 Years | 53 (8.7%) | 88 (14.8%) |
| 65 to 74 Years | 59 (22.3%) | 37 (14.6%) |
| 75 Years and over | 20 (29.0%) | 63 (46.3%) |
Disability Class by Sex by Age in Lake Wynonah
Disability Class: Hearing Difficulty
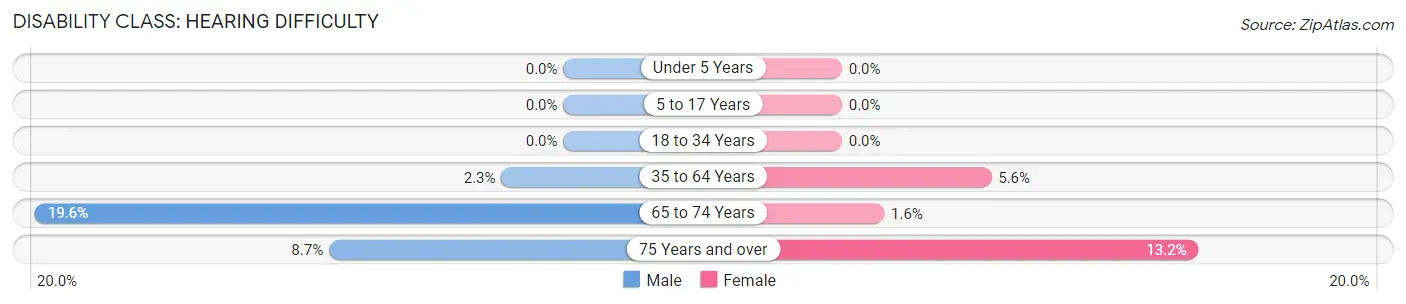
| Age Bracket | Male | Female |
| Under 5 Years | 0 (0.0%) | 0 (0.0%) |
| 5 to 17 Years | 0 (0.0%) | 0 (0.0%) |
| 18 to 34 Years | 0 (0.0%) | 0 (0.0%) |
| 35 to 64 Years | 14 (2.3%) | 33 (5.6%) |
| 65 to 74 Years | 52 (19.6%) | 4 (1.6%) |
| 75 Years and over | 6 (8.7%) | 18 (13.2%) |
Disability Class: Vision Difficulty
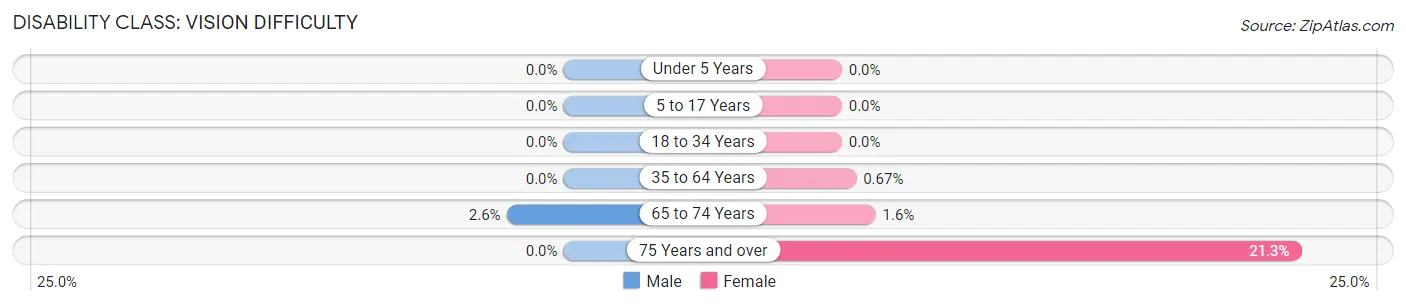
| Age Bracket | Male | Female |
| Under 5 Years | 0 (0.0%) | 0 (0.0%) |
| 5 to 17 Years | 0 (0.0%) | 0 (0.0%) |
| 18 to 34 Years | 0 (0.0%) | 0 (0.0%) |
| 35 to 64 Years | 0 (0.0%) | 4 (0.7%) |
| 65 to 74 Years | 7 (2.6%) | 4 (1.6%) |
| 75 Years and over | 0 (0.0%) | 29 (21.3%) |
Disability Class: Cognitive Difficulty
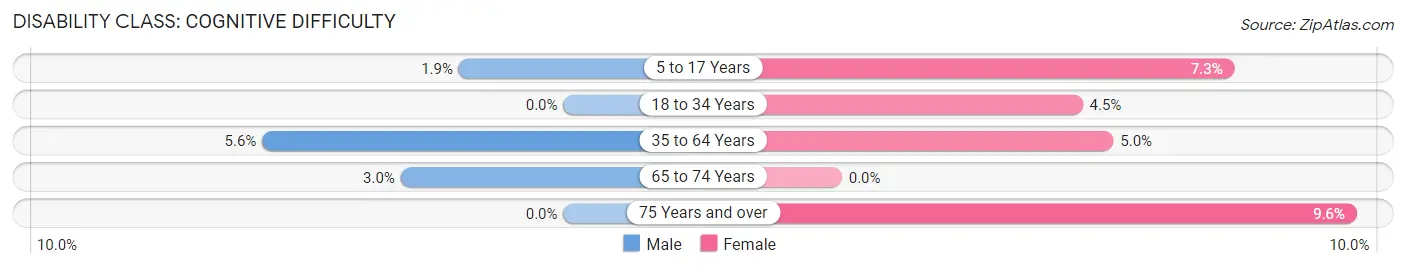
| Age Bracket | Male | Female |
| 5 to 17 Years | 6 (1.9%) | 18 (7.3%) |
| 18 to 34 Years | 0 (0.0%) | 11 (4.5%) |
| 35 to 64 Years | 34 (5.6%) | 30 (5.0%) |
| 65 to 74 Years | 8 (3.0%) | 0 (0.0%) |
| 75 Years and over | 0 (0.0%) | 13 (9.6%) |
Disability Class: Ambulatory Difficulty
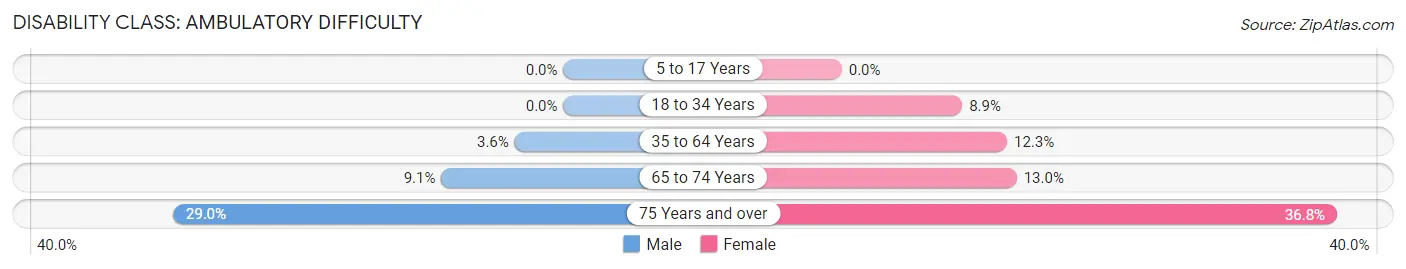
| Age Bracket | Male | Female |
| 5 to 17 Years | 0 (0.0%) | 0 (0.0%) |
| 18 to 34 Years | 0 (0.0%) | 22 (8.9%) |
| 35 to 64 Years | 22 (3.6%) | 73 (12.3%) |
| 65 to 74 Years | 24 (9.1%) | 33 (13.0%) |
| 75 Years and over | 20 (29.0%) | 50 (36.8%) |
Disability Class: Self-Care Difficulty
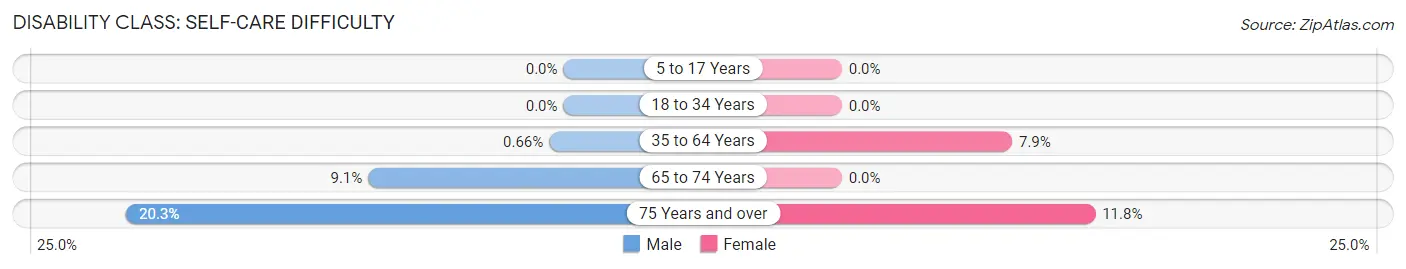
| Age Bracket | Male | Female |
| 5 to 17 Years | 0 (0.0%) | 0 (0.0%) |
| 18 to 34 Years | 0 (0.0%) | 0 (0.0%) |
| 35 to 64 Years | 4 (0.7%) | 47 (7.9%) |
| 65 to 74 Years | 24 (9.1%) | 0 (0.0%) |
| 75 Years and over | 14 (20.3%) | 16 (11.8%) |
Technology Access in Lake Wynonah
Computing Device Access in Lake Wynonah
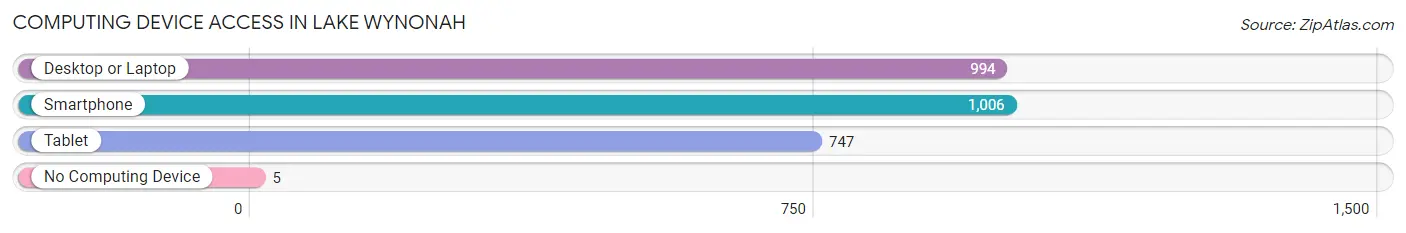
| Device Type | # Households | % Households |
| Desktop or Laptop | 994 | 88.0% |
| Smartphone | 1,006 | 89.1% |
| Tablet | 747 | 66.2% |
| No Computing Device | 5 | 0.4% |
| Total | 1,129 | 100.0% |
Internet Access in Lake Wynonah
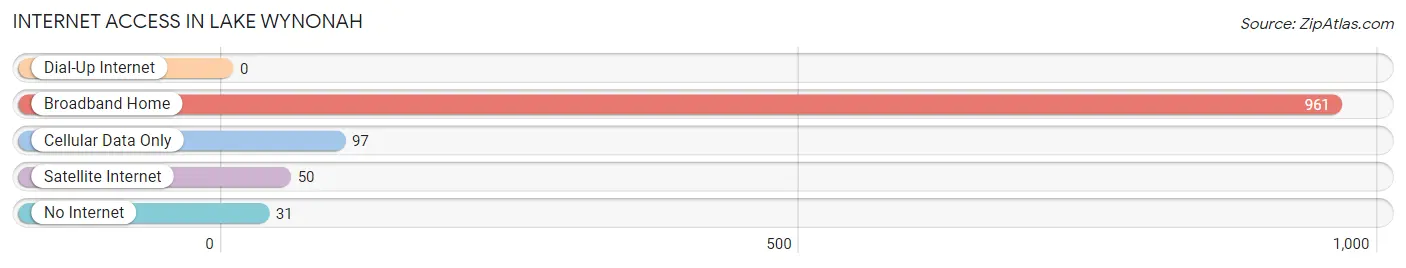
| Internet Type | # Households | % Households |
| Dial-Up Internet | 0 | 0.0% |
| Broadband Home | 961 | 85.1% |
| Cellular Data Only | 97 | 8.6% |
| Satellite Internet | 50 | 4.4% |
| No Internet | 31 | 2.8% |
| Total | 1,129 | 100.0% |
Lake Wynonah Summary
History
Lake Wynonah is a private residential community located in Schuylkill County, Pennsylvania. It is situated in the foothills of the Blue Mountain range, approximately 10 miles south of Pottsville. The community was founded in the early 1960s by the late Robert L. “Bob” Miller, a local businessman and entrepreneur. Miller purchased the land from the Pennsylvania Power and Light Company and began developing the area into a residential community.
The community was originally named “Lake Wynonah Estates” and was designed to be a private, gated community with a lake at its center. The lake was created by damming a small stream and was named after Miller’s daughter, Wynonah. The community was designed to be a self-contained community with its own roads, utilities, and recreational facilities.
The community was officially incorporated in 1965 and has since grown to include over 1,000 homes. The community is governed by a Board of Directors and is managed by a professional staff. The community is also home to a variety of businesses, including a golf course, a marina, a restaurant, and a convenience store.
Geography
Lake Wynonah is located in Schuylkill County, Pennsylvania. It is situated in the foothills of the Blue Mountain range, approximately 10 miles south of Pottsville. The community is located on the western shore of the lake, which is approximately 1,000 acres in size. The lake is surrounded by wooded hills and is fed by several small streams.
The community is located in a rural area and is surrounded by farmland. The nearest major city is Reading, which is approximately 40 miles away. The community is accessible by several major highways, including Interstate 81 and the Pennsylvania Turnpike.
Economy
The economy of Lake Wynonah is largely driven by tourism and recreation. The community is home to a variety of businesses, including a golf course, a marina, a restaurant, and a convenience store. The community also hosts several annual events, such as the Lake Wynonah Fishing Derby and the Lake Wynonah Regatta.
The community is also home to several manufacturing and industrial businesses, including a paper mill and a plastics factory. The community is also home to several small businesses, such as a bakery, a florist, and a hardware store.
Demographics
As of the 2010 census, the population of Lake Wynonah was 1,845. The population is predominantly white (97.2%) and the median age is 44. The median household income is $60,000 and the median home value is $200,000. The community is largely composed of married couples (63.2%) and families (77.2%).
The community is served by the Blue Mountain School District. The district operates two elementary schools, one middle school, and one high school. The community is also home to a variety of churches, including Baptist, Methodist, and Catholic.
Common Questions
What is Per Capita Income in Lake Wynonah?
Per Capita income in Lake Wynonah is $43,816.
What is the Median Family Income in Lake Wynonah?
Median Family Income in Lake Wynonah is $100,938.
What is the Median Household income in Lake Wynonah?
Median Household Income in Lake Wynonah is $91,816.
What is Income or Wage Gap in Lake Wynonah?
Income or Wage Gap in Lake Wynonah is 40.6%.
Women in Lake Wynonah earn 59.4 cents for every dollar earned by a man.
What is Inequality or Gini Index in Lake Wynonah?
Inequality or Gini Index in Lake Wynonah is 0.34.
What is the Total Population of Lake Wynonah?
Total Population of Lake Wynonah is 2,975.
What is the Total Male Population of Lake Wynonah?
Total Male Population of Lake Wynonah is 1,445.
What is the Total Female Population of Lake Wynonah?
Total Female Population of Lake Wynonah is 1,530.
What is the Ratio of Males per 100 Females in Lake Wynonah?
There are 94.44 Males per 100 Females in Lake Wynonah.
What is the Ratio of Females per 100 Males in Lake Wynonah?
There are 105.88 Females per 100 Males in Lake Wynonah.
What is the Median Population Age in Lake Wynonah?
Median Population Age in Lake Wynonah is 47.4 Years.
What is the Average Family Size in Lake Wynonah
Average Family Size in Lake Wynonah is 2.9 People.
What is the Average Household Size in Lake Wynonah
Average Household Size in Lake Wynonah is 2.6 People.
How Large is the Labor Force in Lake Wynonah?
There are 1,534 People in the Labor Forcein in Lake Wynonah.
What is the Percentage of People in the Labor Force in Lake Wynonah?
61.2% of People are in the Labor Force in Lake Wynonah.
What is the Unemployment Rate in Lake Wynonah?
Unemployment Rate in Lake Wynonah is 2.1%.